Western Asset Mortgage Capital
Western Asset Mortgage Capital — Q4 2020 Earnings Presentation
26 slides from Western Asset Mortgage Capital's earnings presentation, Mar 3, 2021
Slide 1: Fourth Quarter 2020 Investor Presentation
Fourth Quarter 2020 Investor Presentation March 3, 2021
Slide 2: Forward-looking statements
We make forward-looking statements in this presentation that are subject to risks and uncertainties, many of which are difficult to predict and are generally beyond the Company's control. In particular, it is difficult to fully assess the impact of COVID-19 at this time due to, among other factors,
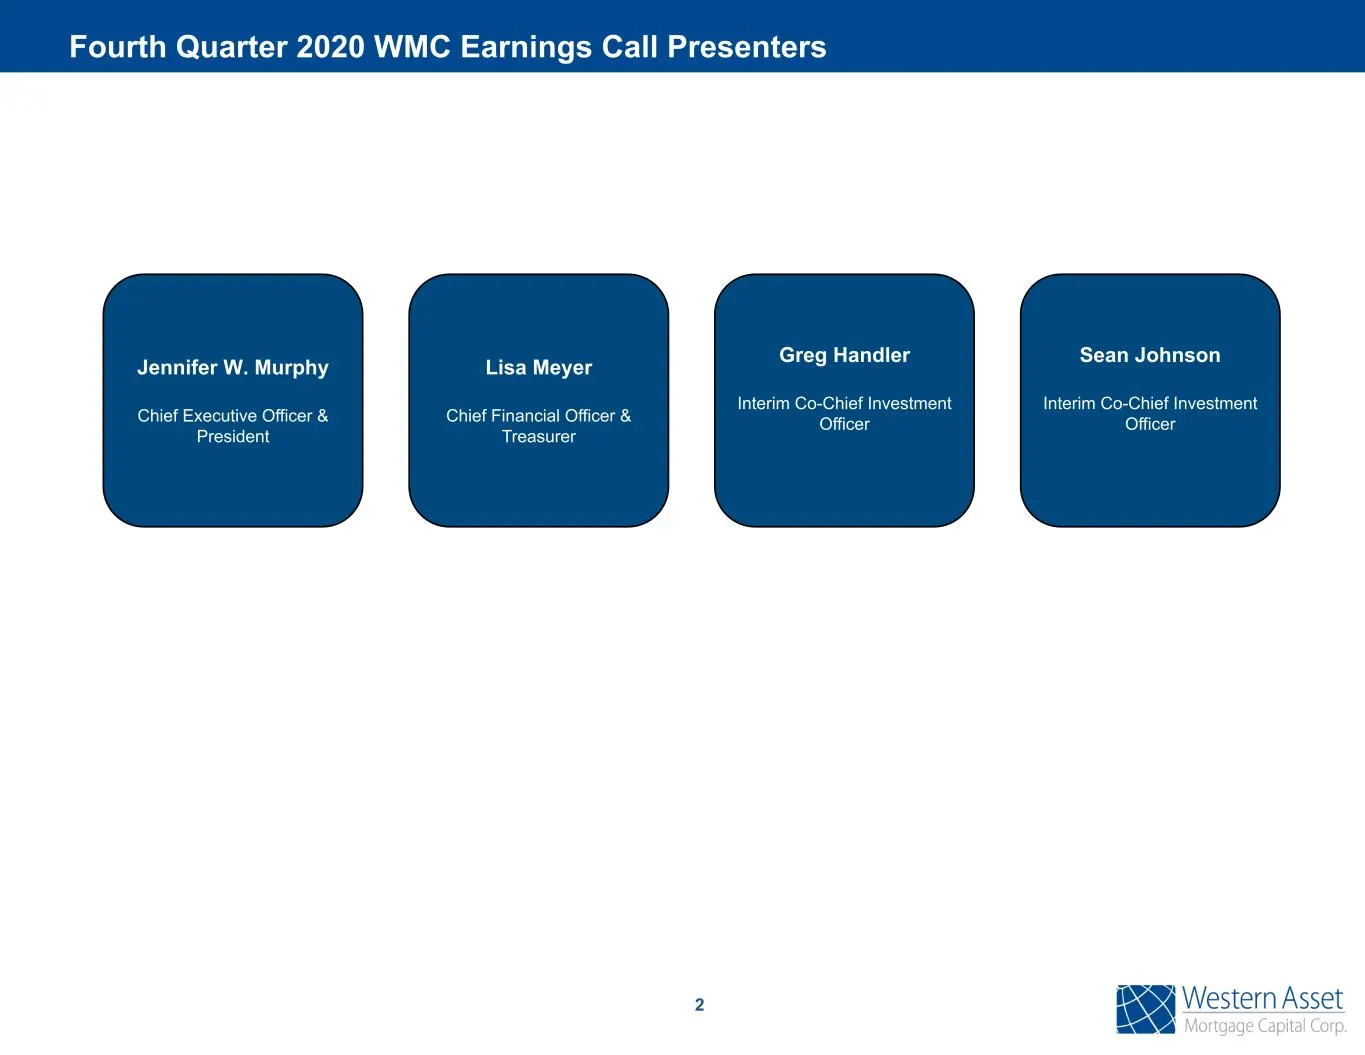
Slide 3: Fourth Quarter 2020 WMC Earnings Call Presenters
Lisa Meyer Chief Financial Officer & Treasurer Jennifer W. Murphy Chief Executive Officer & President Greg Handler Interim Co-Chief Investment Officer 2 Sean Johnson Interim Co-Chief Investment Officer Fourth Quarter 2020 WMC Earnings Call Presenters
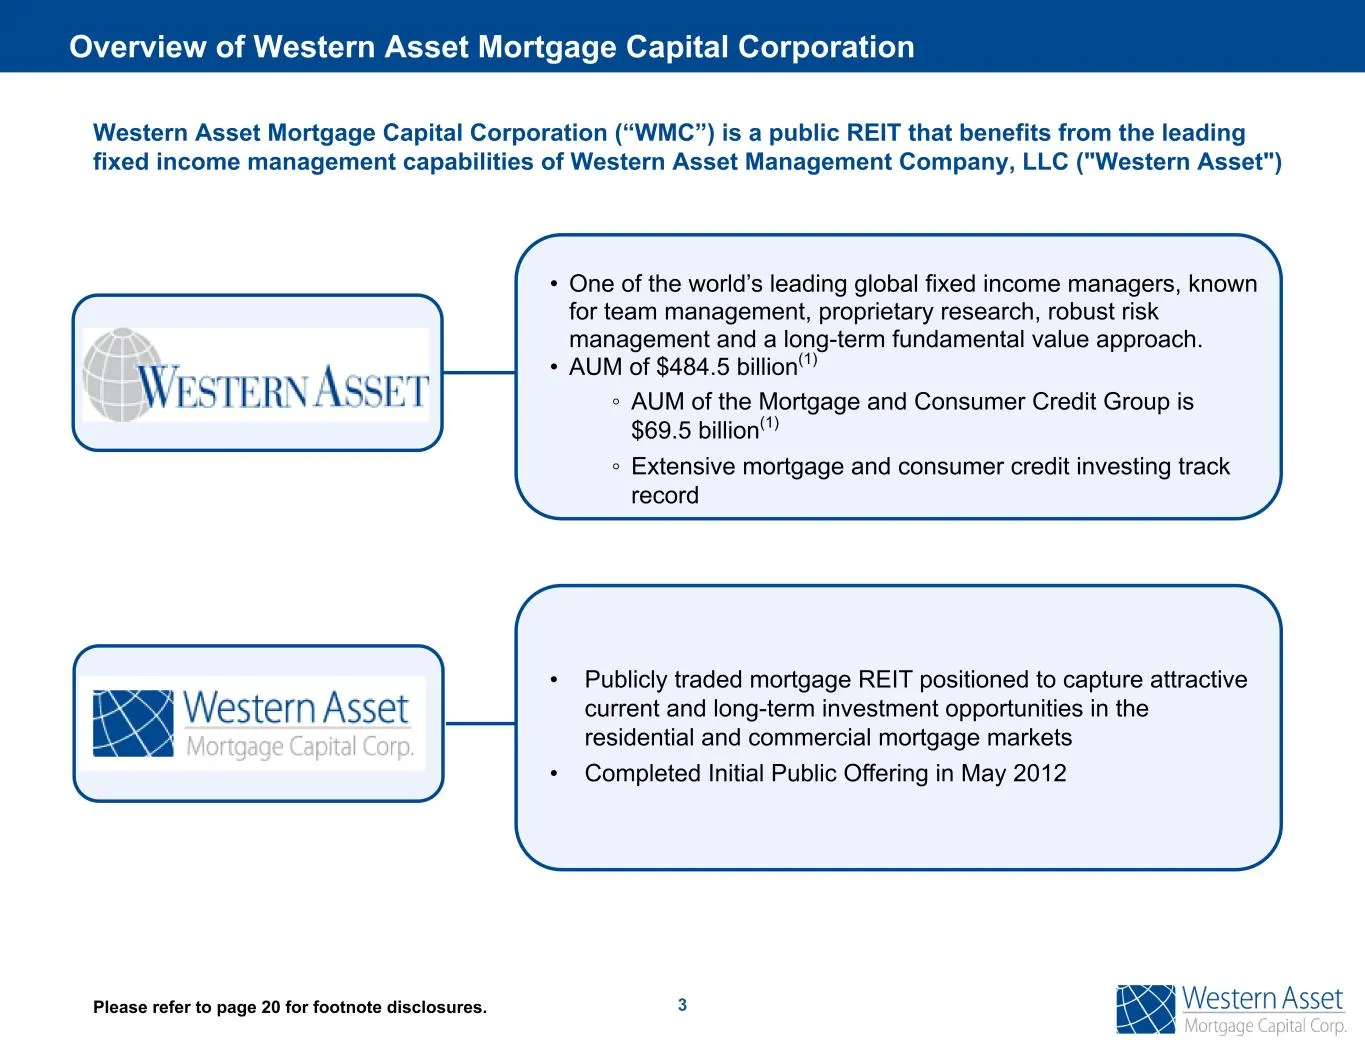
Slide 4: Overview of Western Asset Mortgage Capital Corporation
3 Western Asset Mortgage Capital Corporation (“WMC”) is a public REIT that benefits from the leading fixed income management capabilities of Western Asset Management Company, LLC ("Western Asset") • One of the world’s leading global fixed income managers, known for team management, proprietary resea
Slide 5: Fourth quarter highlights and balance sheet focus
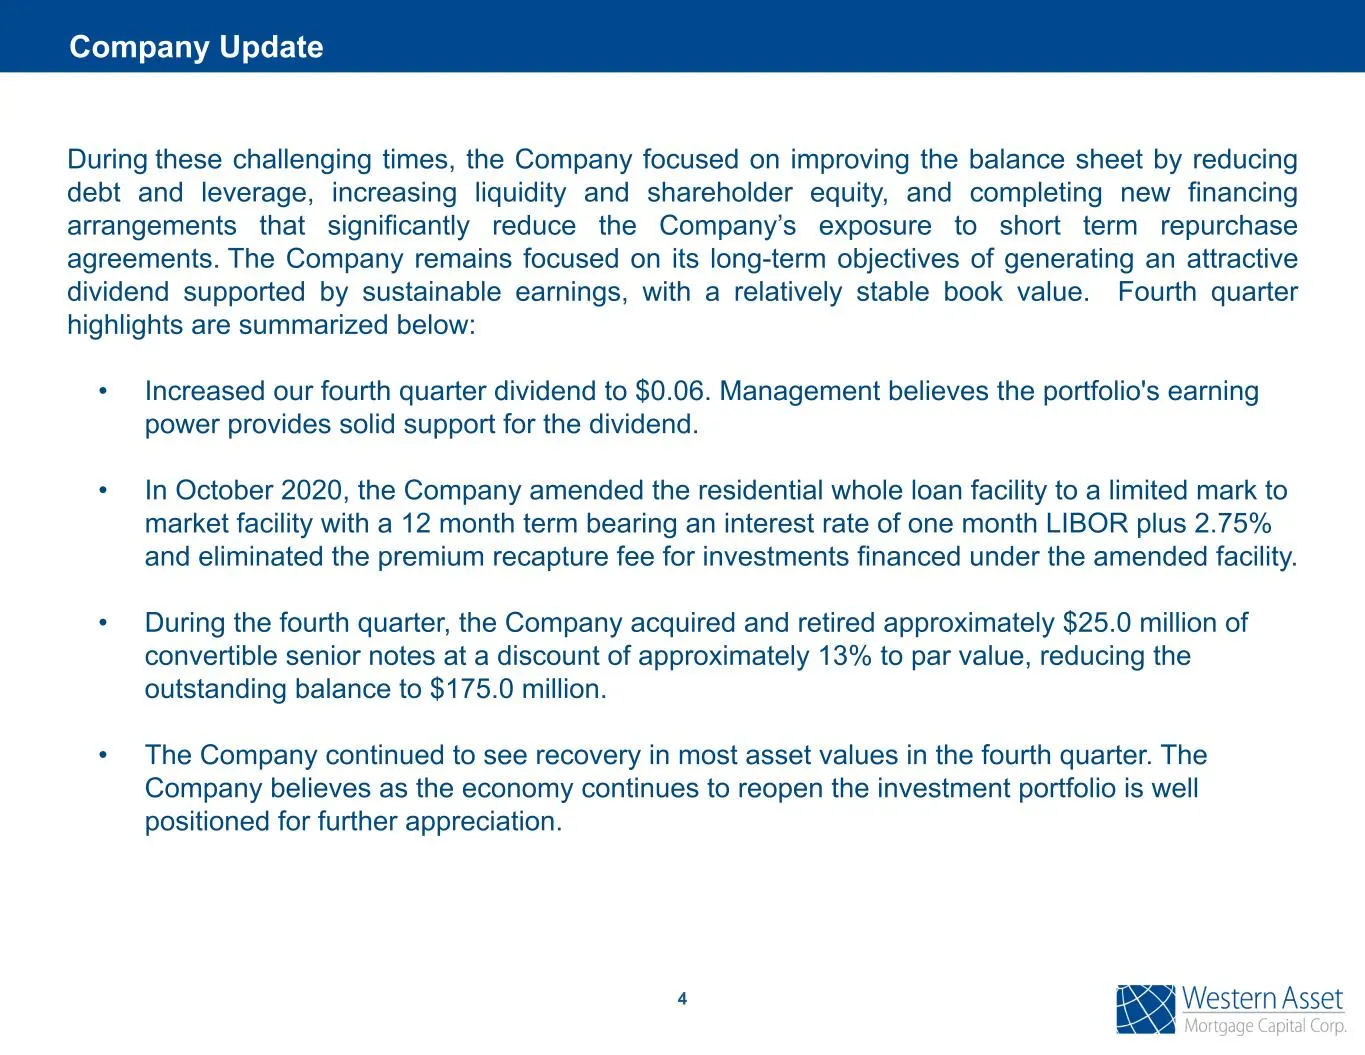
Company Update During these challenging times, the Company focused on improving the balance sheet by reducing debt and leverage, increasing liquidity and shareholder equity, and completing new financing arrangements that significantly reduce the Company’s exposure to short term repurchase agreements
Slide 6: Fourth Quarter Financial Highlights
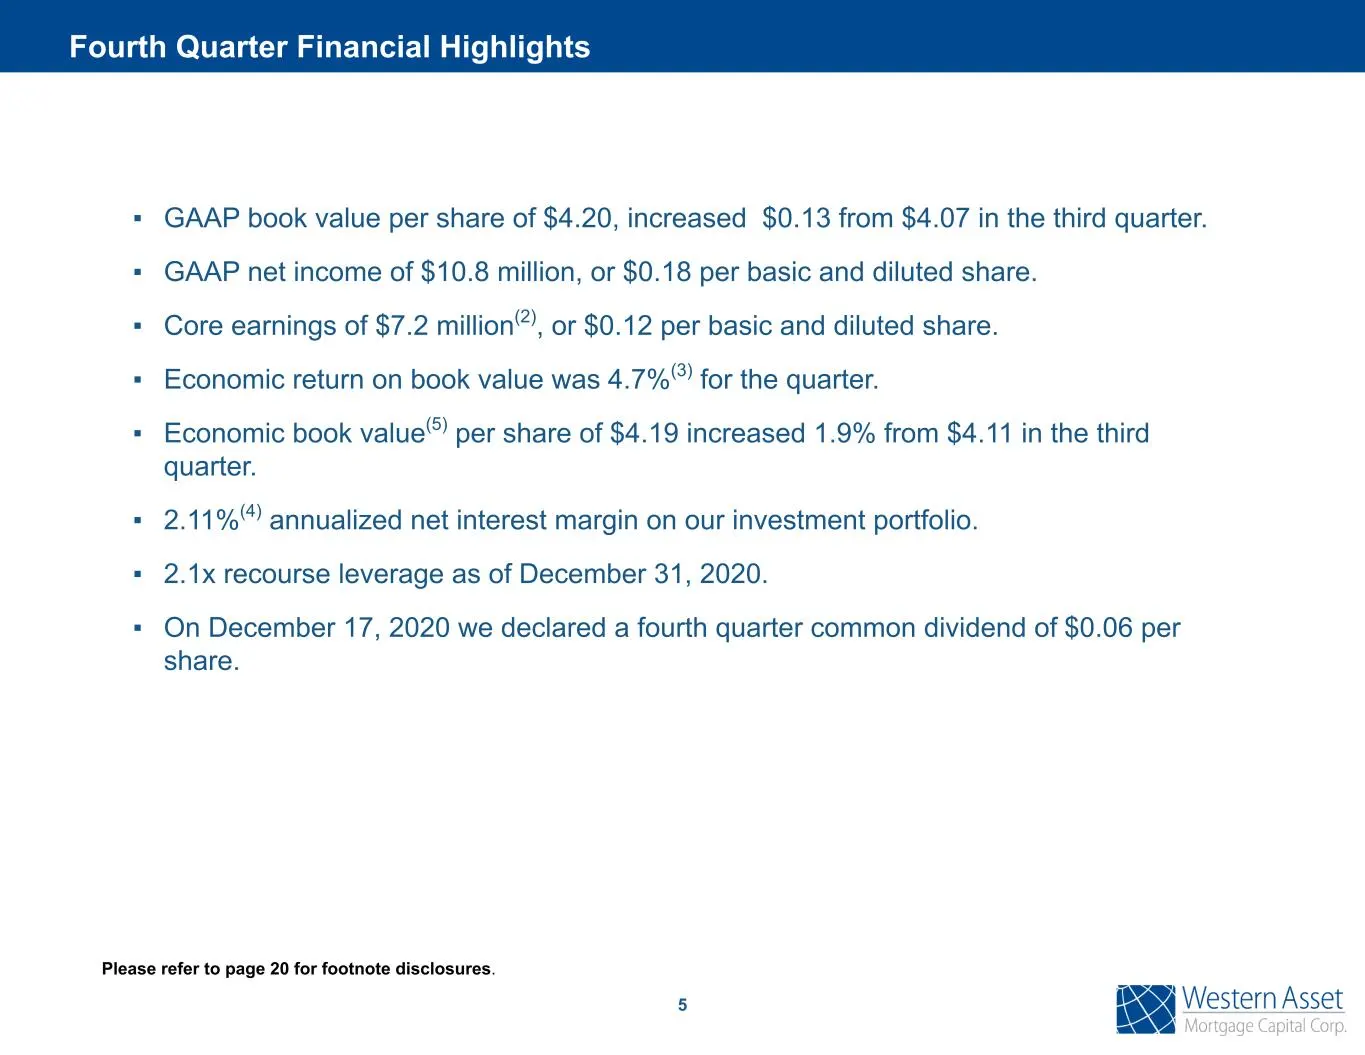
5 Please refer to page 20 for footnote disclosures. ▪ GAAP book value per share of $4.20, increased $0.13 from $4.07 in the third quarter. ▪ GAAP net income of $10.8 million, or $0.18 per basic and diluted share. ▪ Core earnings of $7.2 million(2), or $0.12 per basic and diluted share. ▪ Economic re
Slide 7: WMC Key Metrics
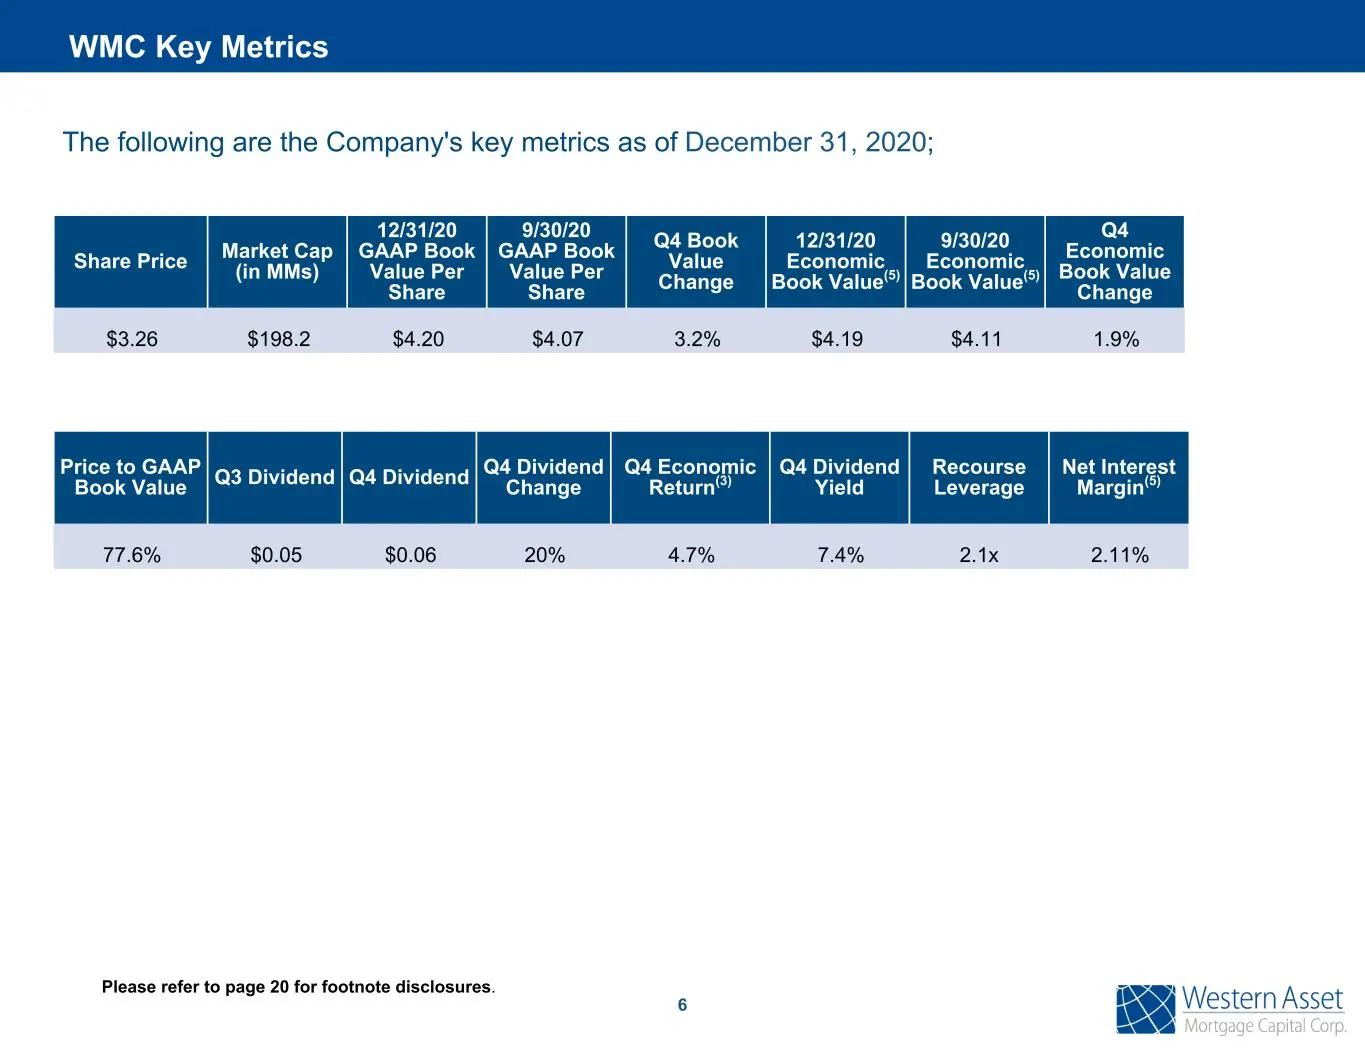
6 The following are the Company's key metrics as of December 31, 2020; Share Price Market Cap (in MMs) 12/31/20 GAAP Book Value Per Share 9/30/20 GAAP Book Value Per Share Q4 Book Value Change 12/31/20 Economic Book Value(5) 9/30/20 Economic Book Value(5) Q4 Economic Book Value Change $3.26 $198.2 $
Slide 8: Investment Portfolio Overview
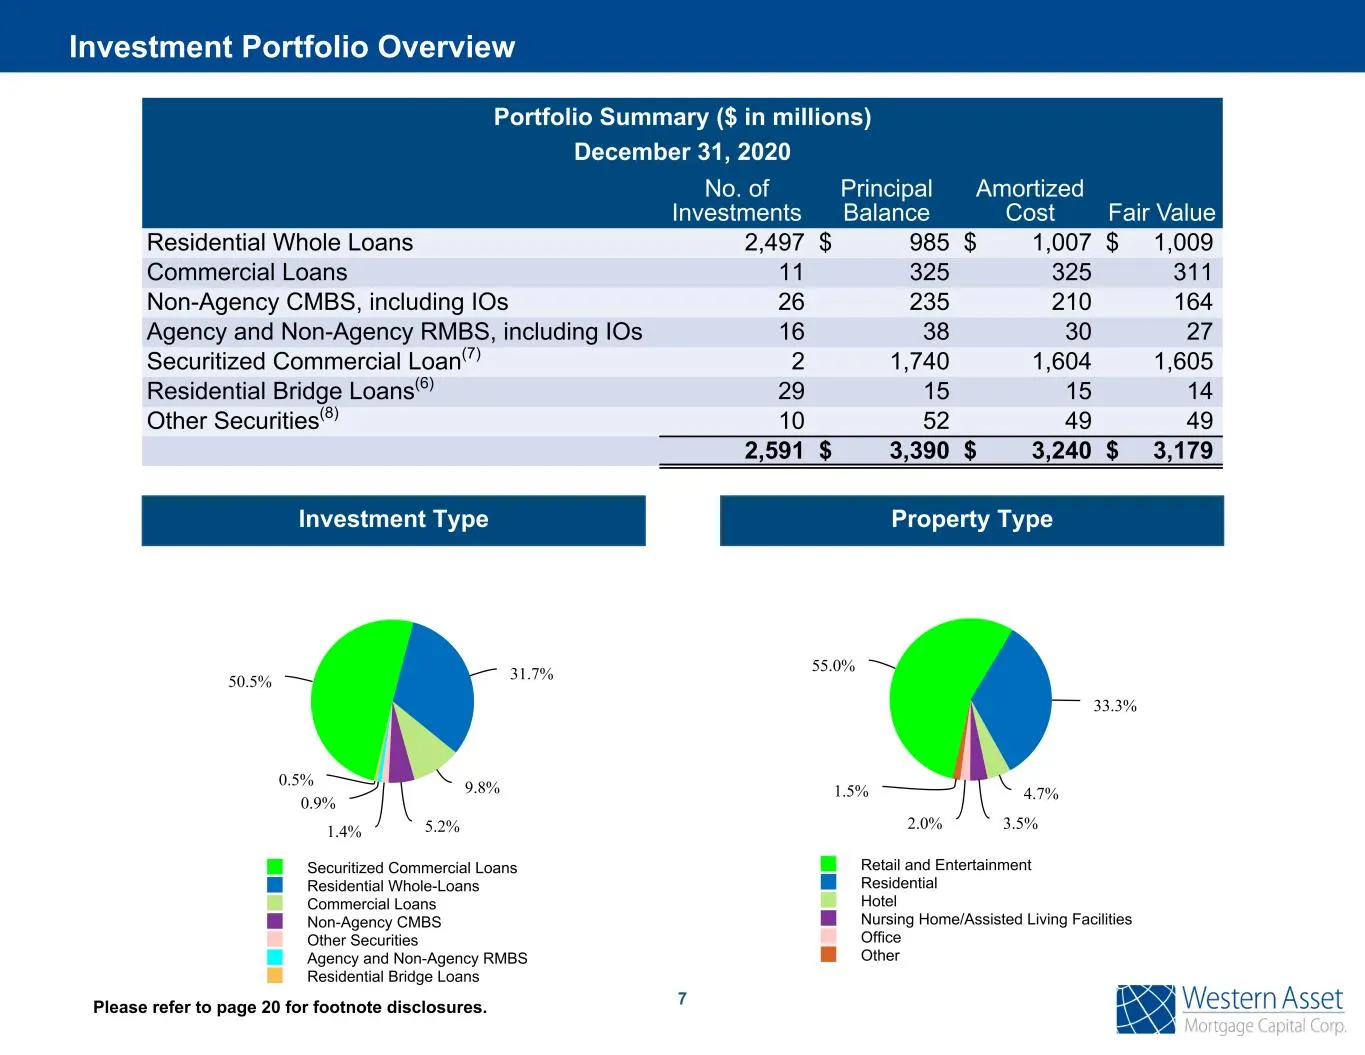
Investment Type Portfolio Summary ($ in millions) December 31, 2020 No. of Investments Principal Balance Amortized Cost Fair Value Residential Whole Loans 2,497 $ 985 $ 1,007 $ 1,009 Commercial Loans 11 325 325 311 Non-Agency CMBS, including IOs 26 235 210 164 Agency and Non-Agency RMBS, including I
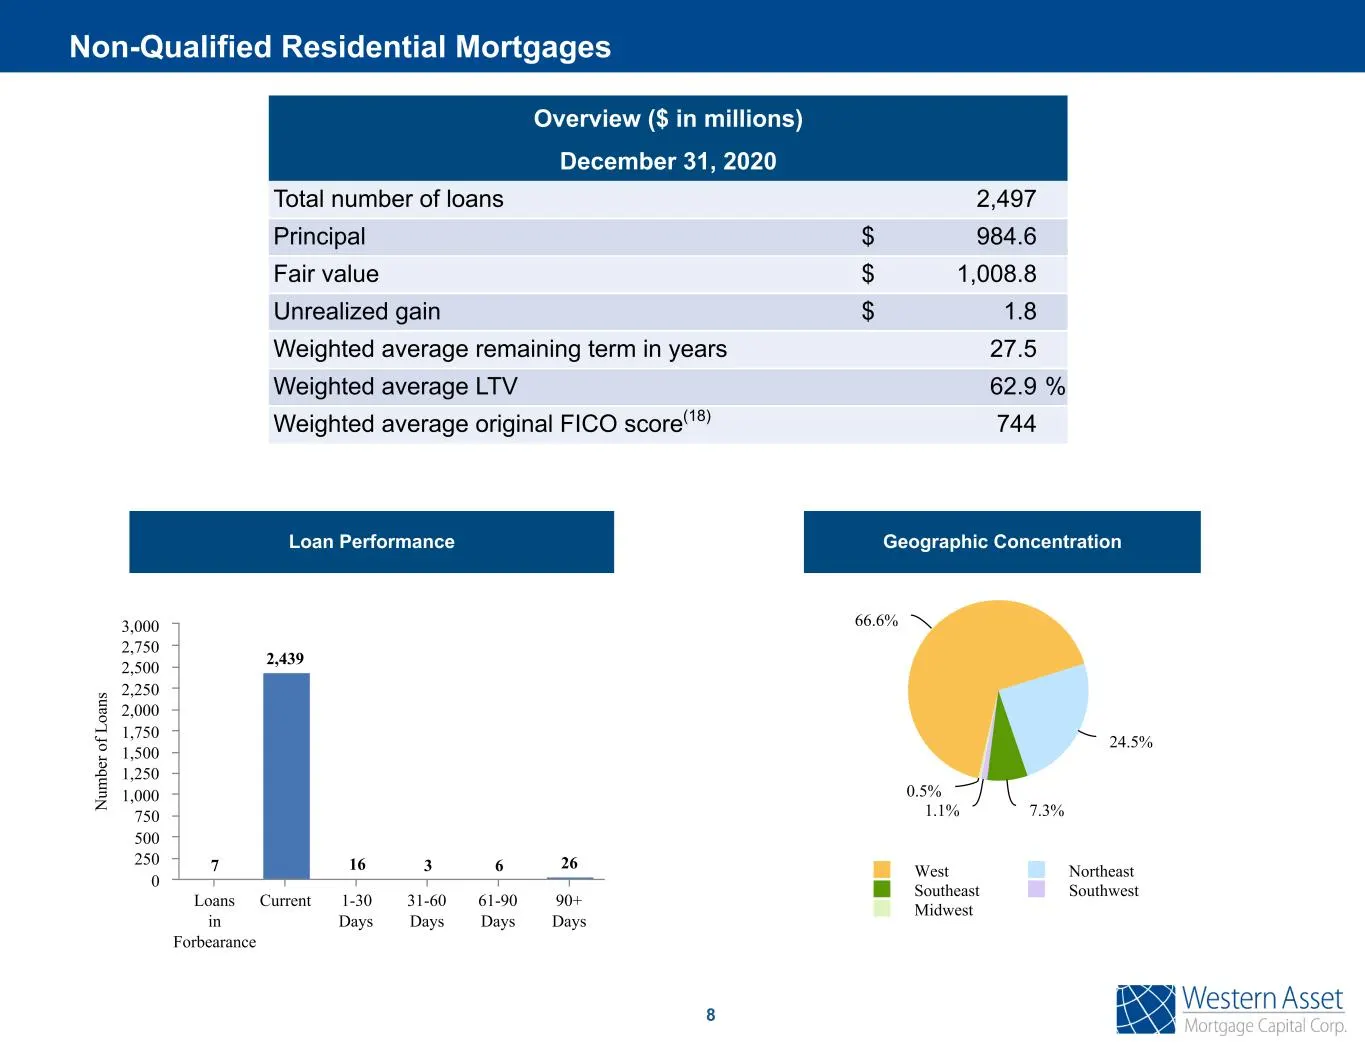
Slide 9: Non-Qualified Residential Mortgages
8 Overview ($ in millions) December 31, 2020 Total number of loans 2,497 Principal $ 984.6 Fair value $ 1,008.8 Unrealized gain $ 1.8 Weighted average remaining term in years 27.5 Weighted average LTV 62.9 % Weighted average original FICO score(18) 744 Loan Performance Geographic Concentration 66.6%
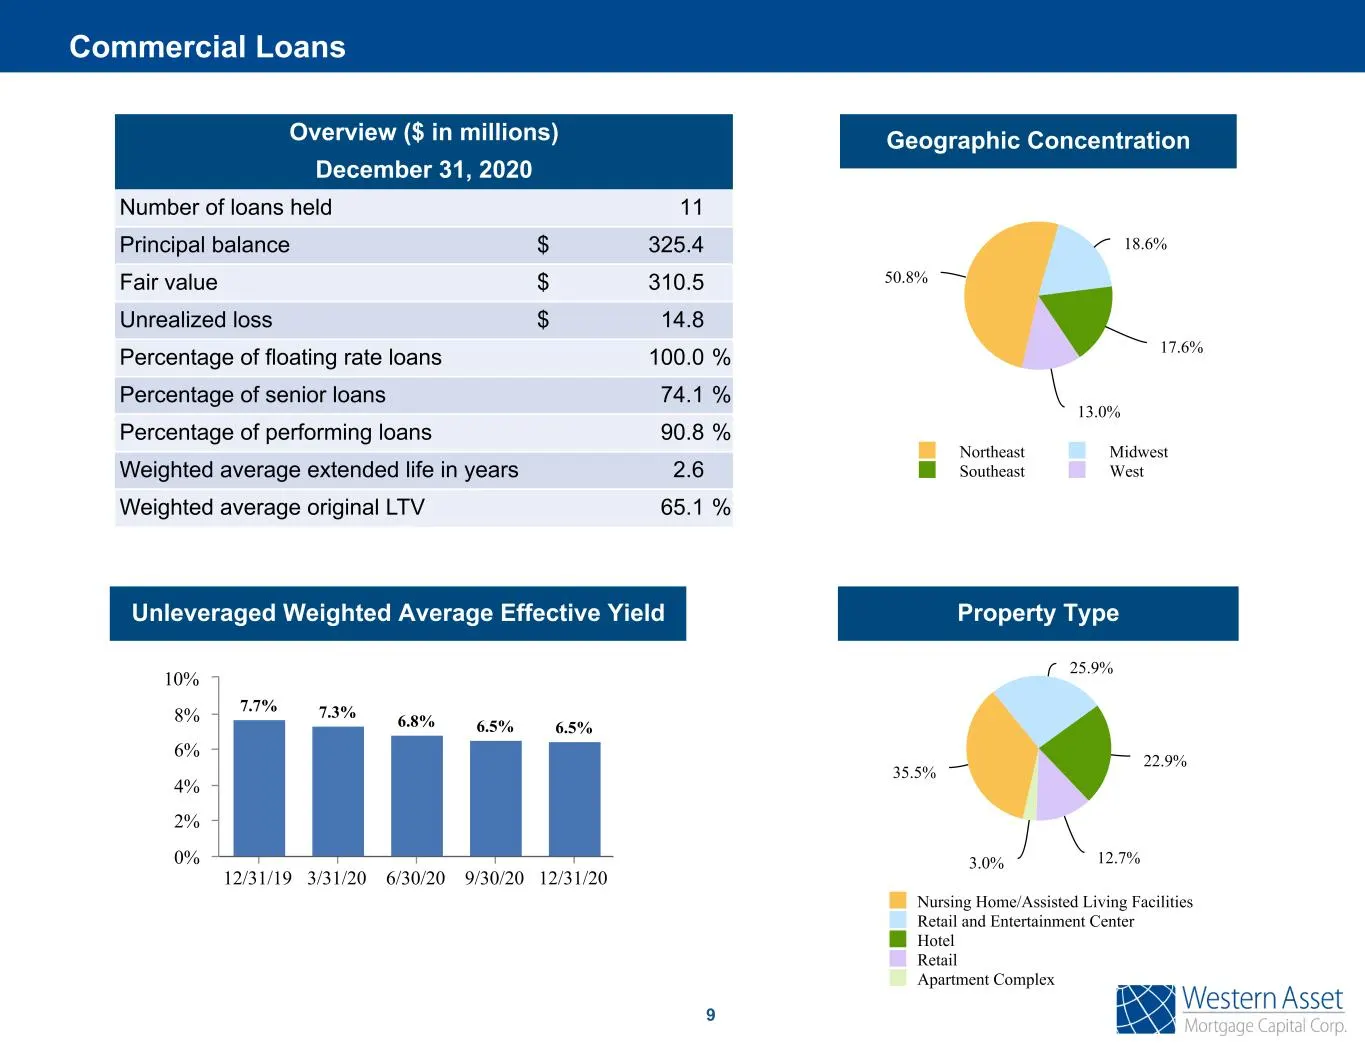
Slide 10: Commercial Loans
9 Overview ($ in millions) December 31, 2020 Number of loans held 11 Principal balance $ 325.4 Fair value $ 310.5 Unrealized loss $ 14.8 Percentage of floating rate loans 100.0 % Percentage of senior loans 74.1 % Percentage of performing loans 90.8 % Weighted average extended life in years 2.6 Weigh
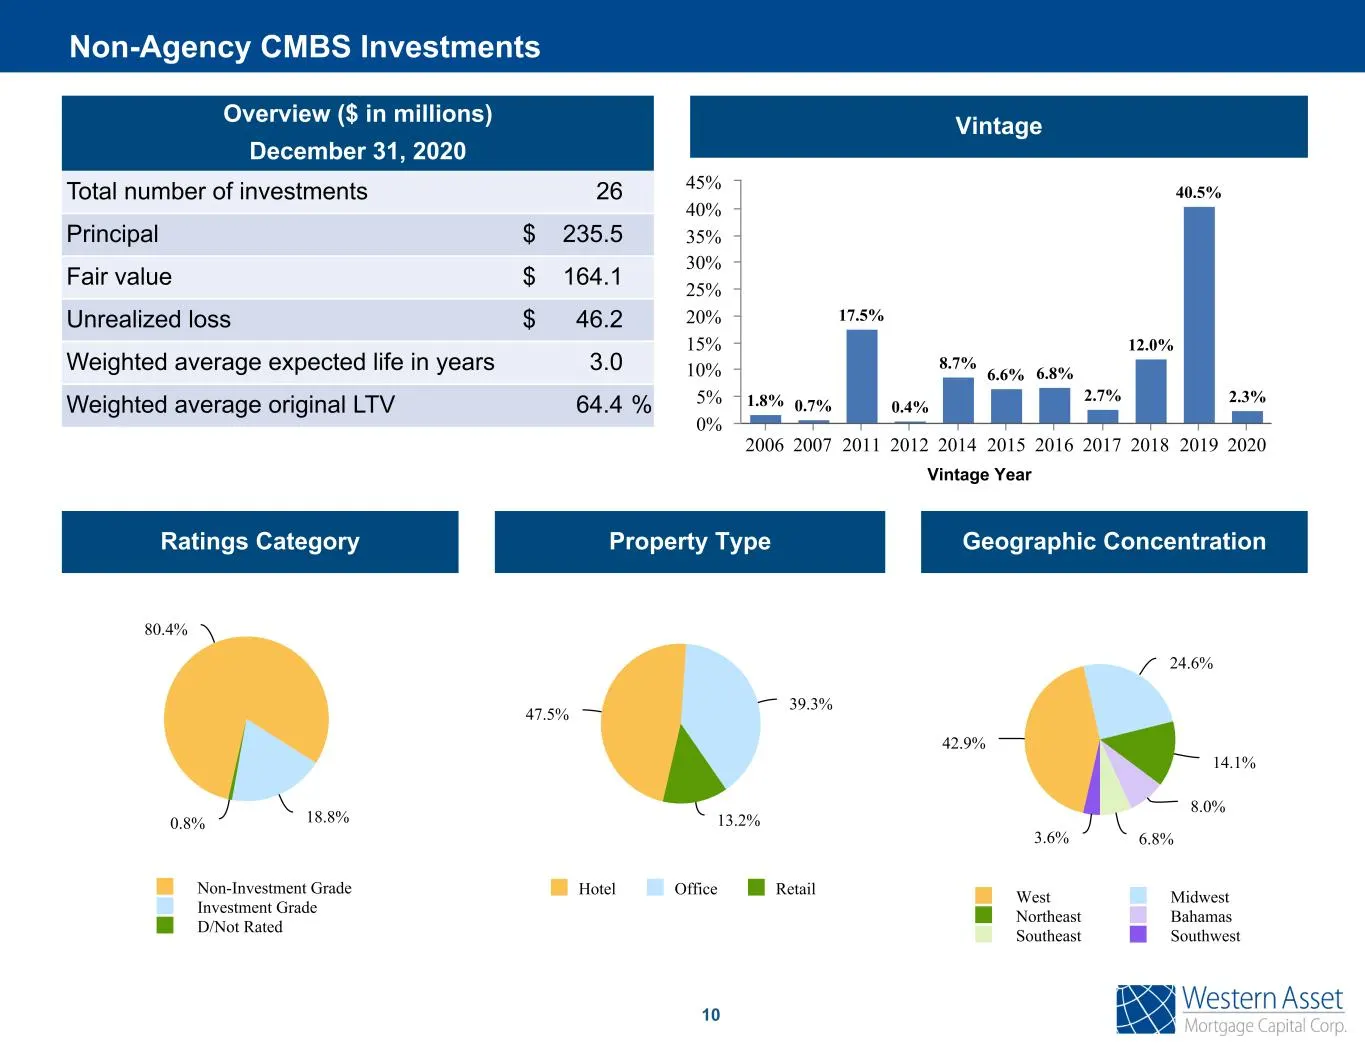
Slide 11: Non-Agency CMBS Investments
10 Overview ($ in millions) December 31, 2020 Total number of investments 26 Principal $ 235.5 Fair value $ 164.1 Unrealized loss $ 46.2 Weighted average expected life in years 3.0 Weighted average original LTV 64.4 % 80.4% 18.8%0.8% Non-Investment Grade Investment Grade D/Not Rated 1.8% 0.7% 17.5%
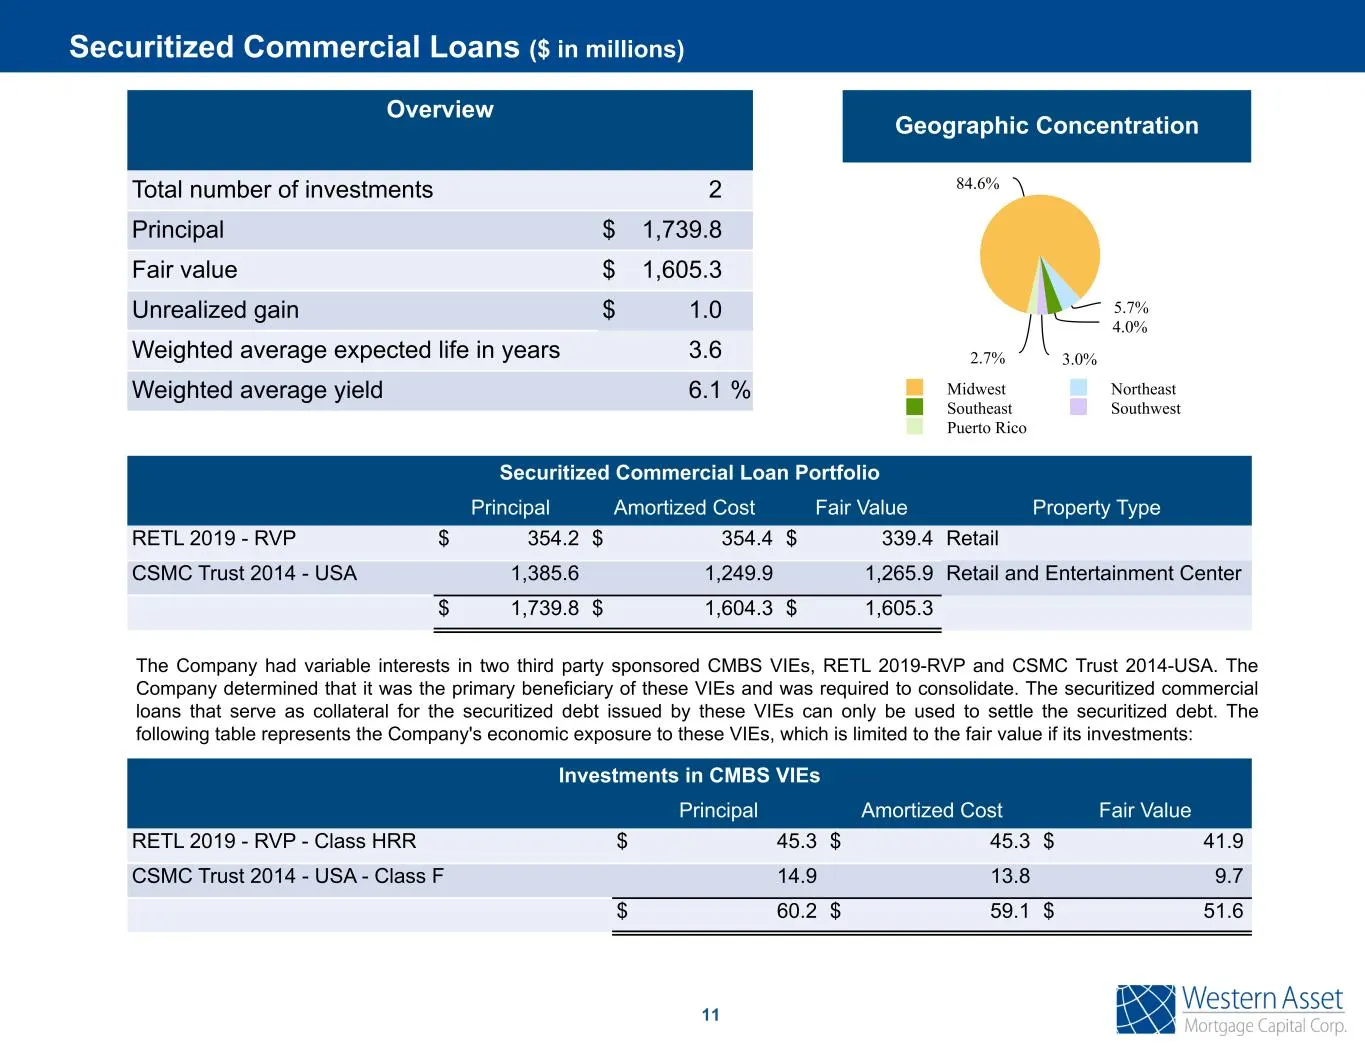
Slide 12: Securitized Commercial Loan Portfolio
11 Overview Total number of investments 2 Principal $ 1,739.8 Fair value $ 1,605.3 Unrealized gain $ 1.0 Weighted average expected life in years 3.6 Weighted average yield 6.1 % Geographic Concentration 84.6% 5.7% 4.0% 3.0%2.7% Midwest Northeast Southeast Southwest Puerto Rico Securitized Commercial
Slide 13: Portfolio income by investment type for three months ended
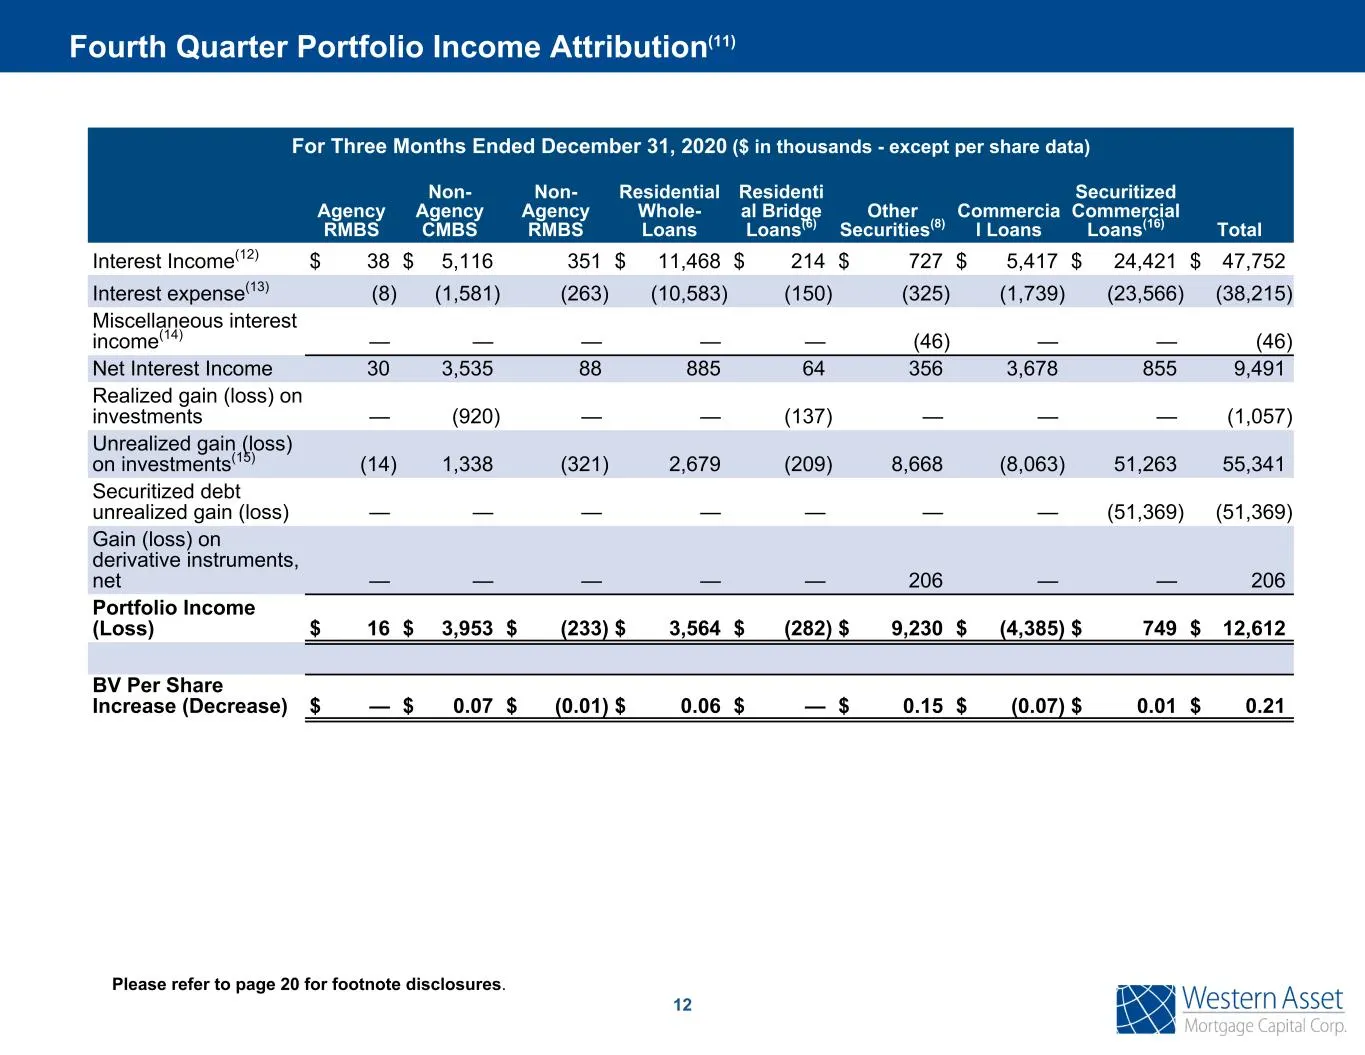
12 Please refer to page 20 for footnote disclosures. For Three Months Ended December 31, 2020 ($ in thousands - except per share data) Agency RMBS Non- Agency CMBS Non- Agency RMBS Residential Whole- Loans Residenti al Bridge Loans(6) Other Securities(8) Commercia l Loans Securitized Commercial Loan
Slide 14: Investment Type
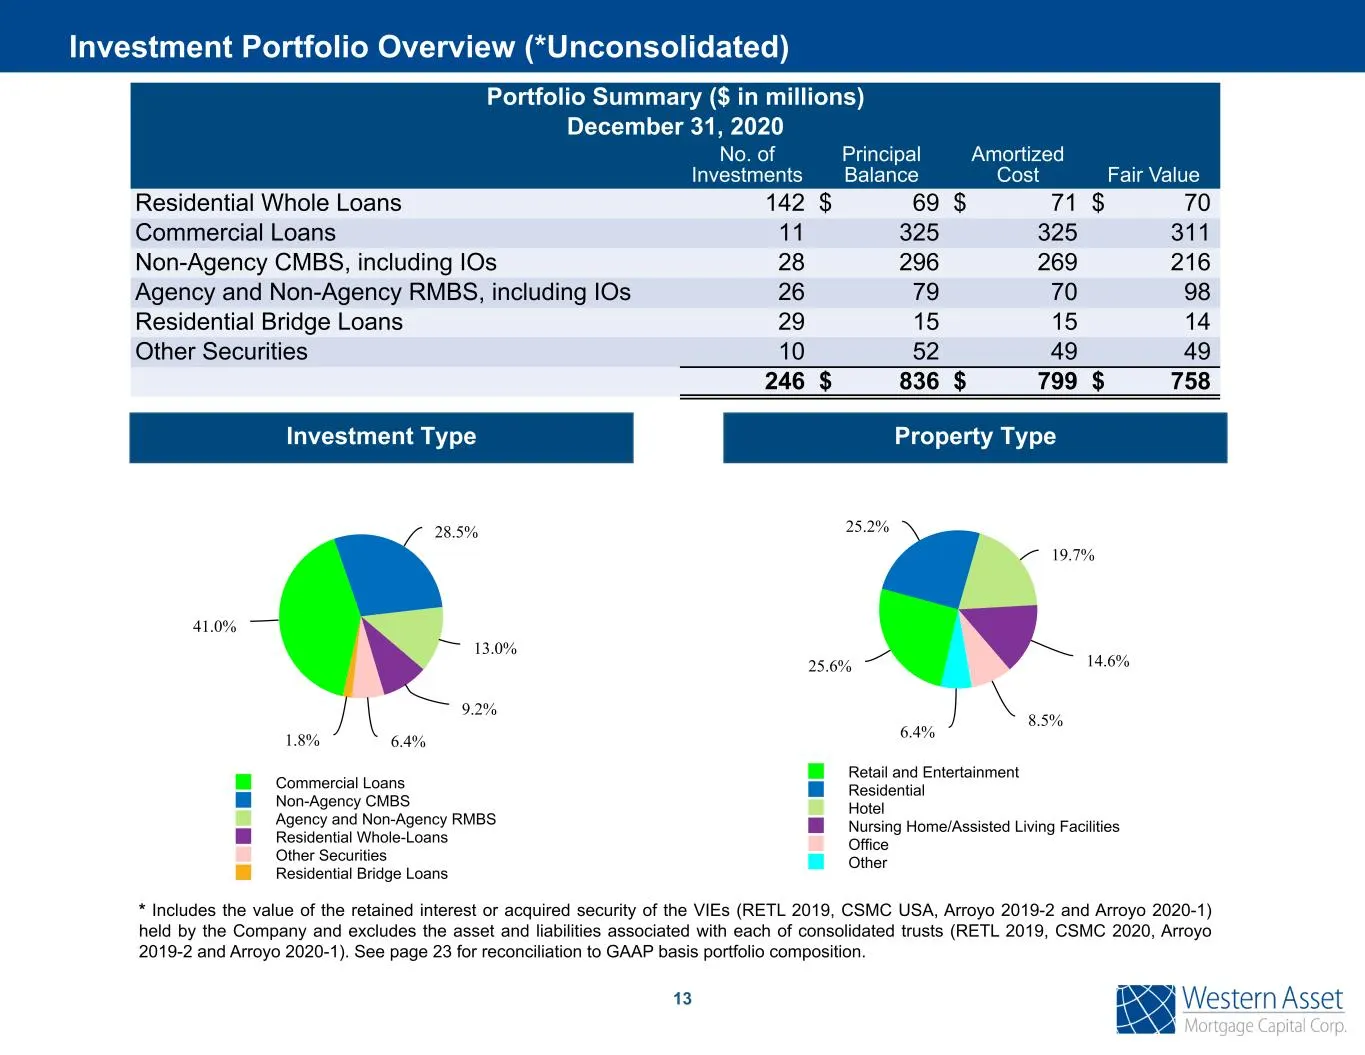
Investment Type 41.0% 28.5% 13.0% 9.2% 6.4%1.8% Commercial Loans Non-Agency CMBS Agency and Non-Agency RMBS Residential Whole-Loans Other Securities Residential Bridge Loans Portfolio Summary ($ in millions) December 31, 2020 No. of Investments Principal Balance Amortized Cost Fair Value Residential
Slide 15: Repurchase Agreement Financing
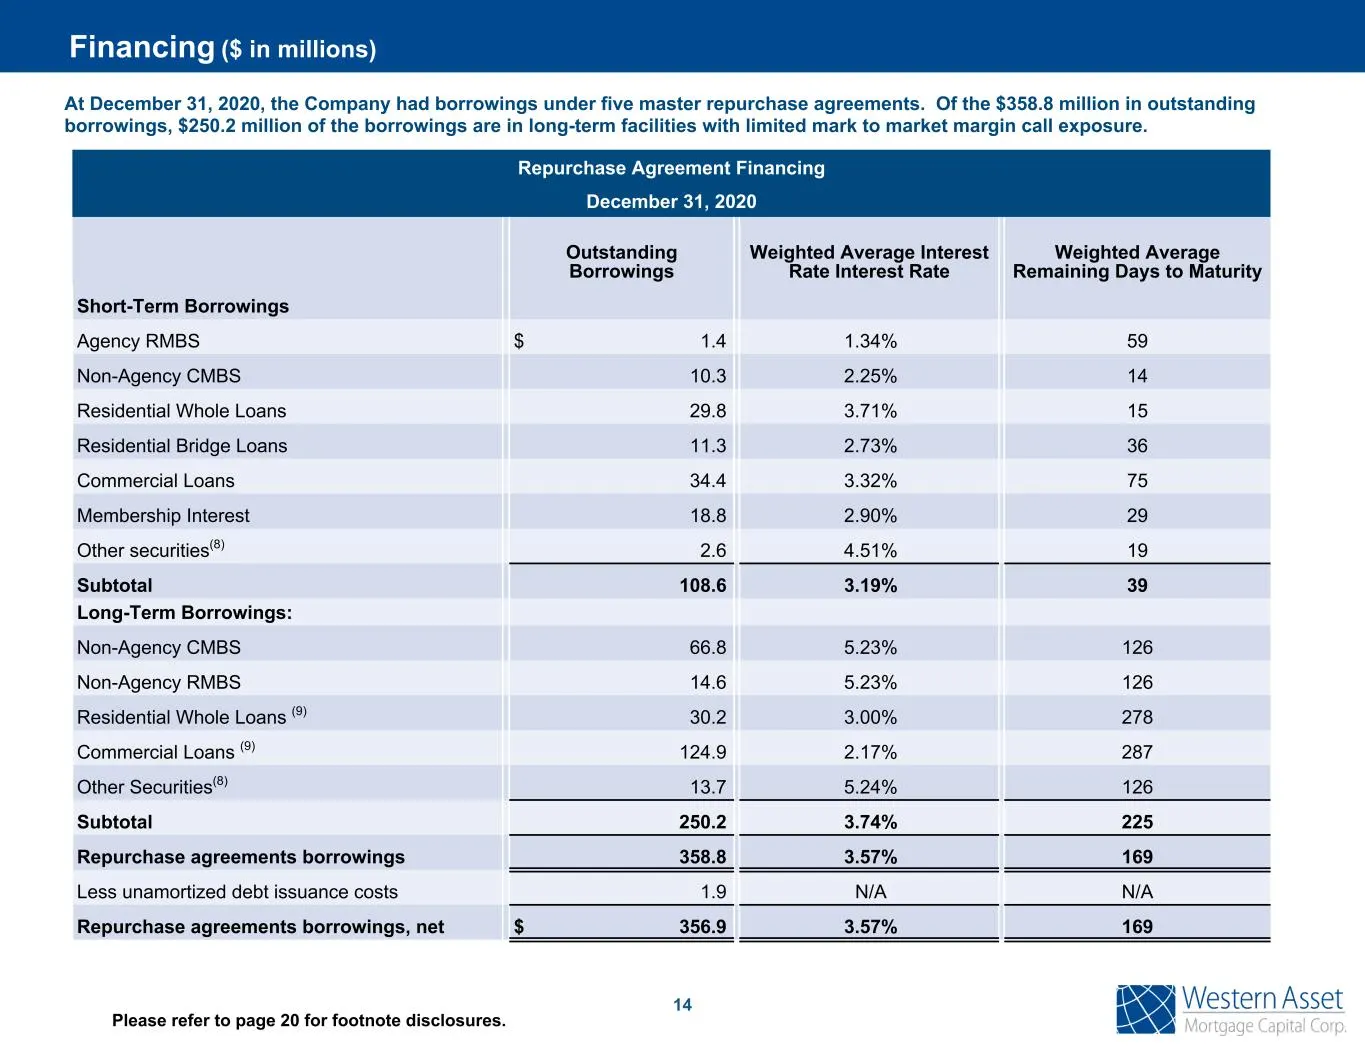
Repurchase Agreement Financing December 31, 2020 Outstanding Borrowings Weighted Average Interest Rate Interest Rate Weighted Average Remaining Days to Maturity Short-Term Borrowings Agency RMBS $ 1.4 1.34% 59 Non-Agency CMBS 10.3 2.25% 14 Residential Whole Loans 29.8 3.71% 15 Residential Bridge Loa
Slide 16: Long-Term Financing Facilities
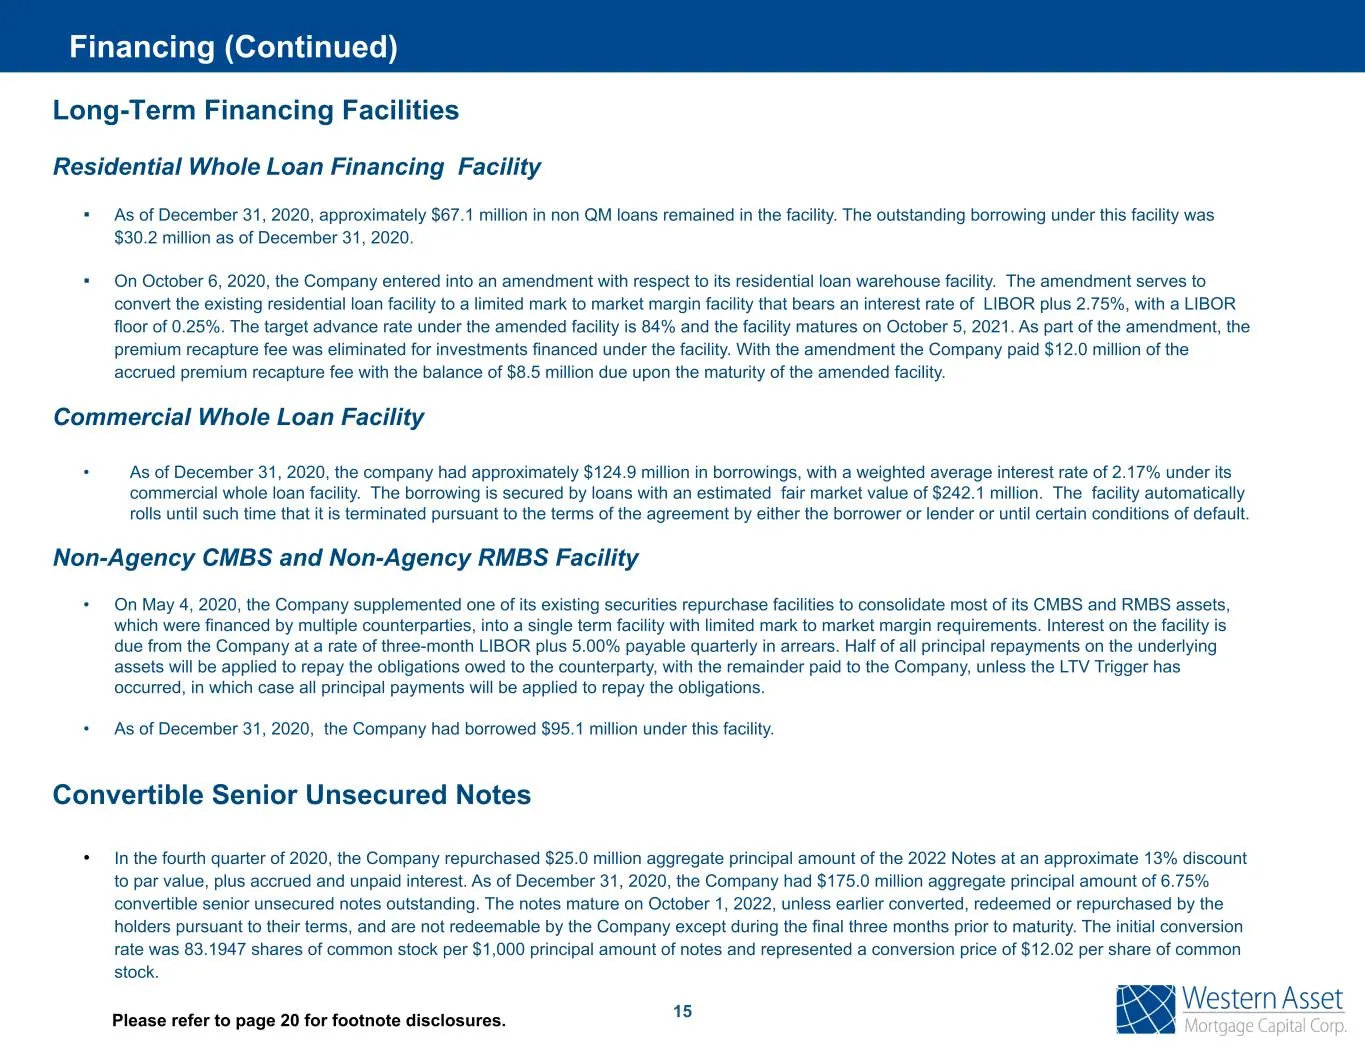
Long-Term Financing Facilities Residential Whole Loan Financing Facility ▪ As of December 31, 2020, approximately $67.1 million in non QM loans remained in the facility. The outstanding borrowing under this facility was $30.2 million as of December 31, 2020. ▪ On October 6, 2020, the Company entered
Slide 17: Non-Recourse Financings: Mortgage-Backed Notes
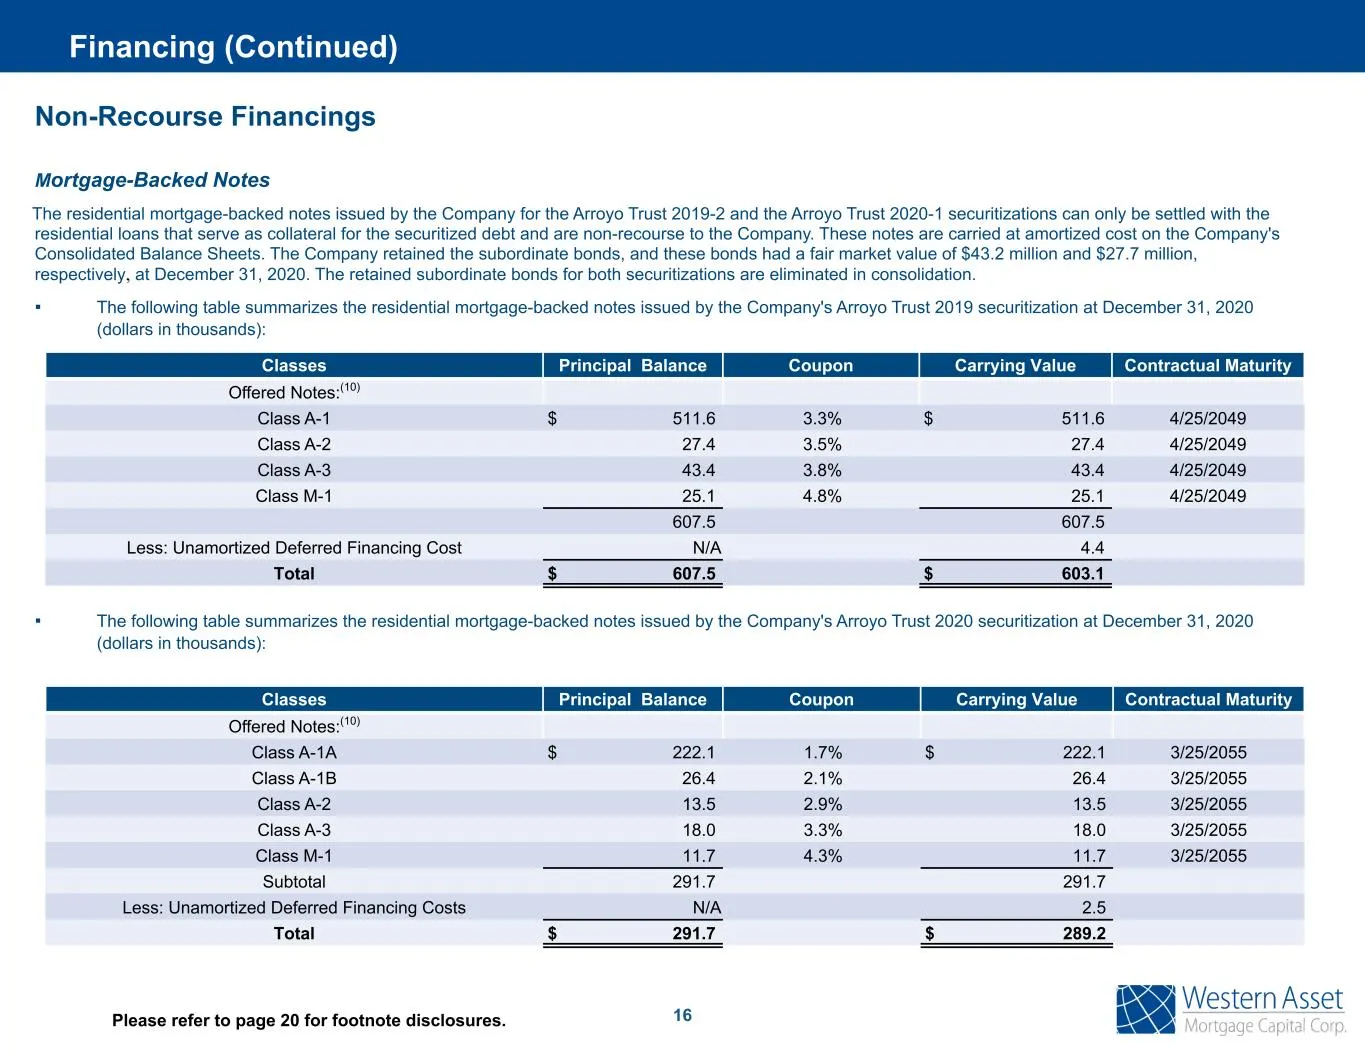
Non-Recourse Financings Mortgage-Backed Notes The residential mortgage-backed notes issued by the Company for the Arroyo Trust 2019-2 and the Arroyo Trust 2020-1 securitizations can only be settled with the residential loans that serve as collateral for the securitized debt and are non-recourse to t
Slide 18: Consolidated commercial mortgage-backed variable interest entities
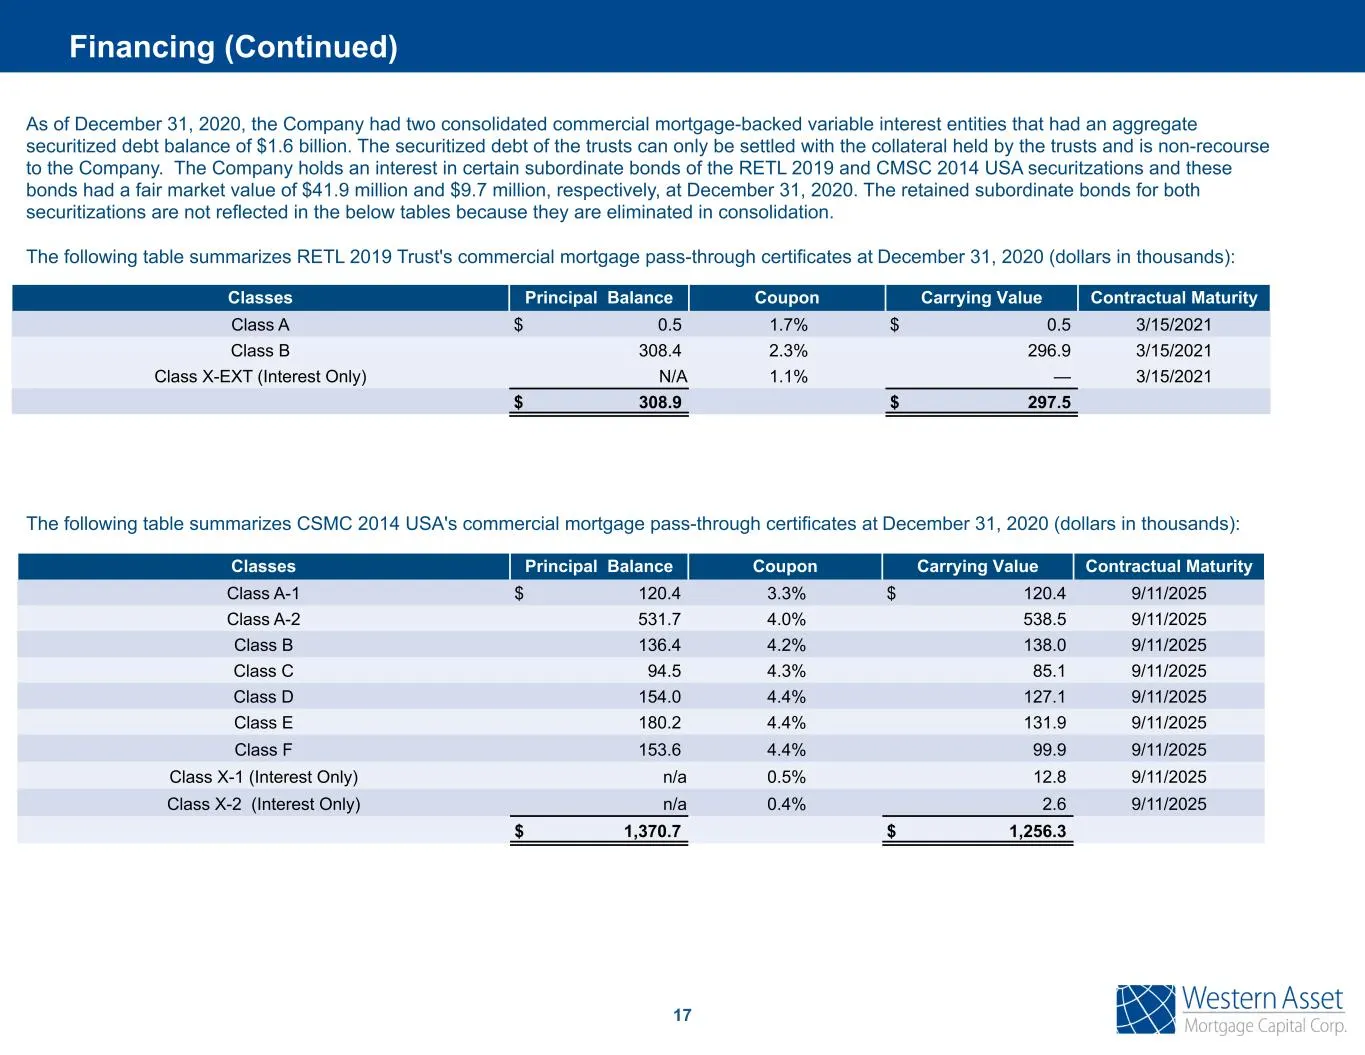
17 As of December 31, 2020, the Company had two consolidated commercial mortgage-backed variable interest entities that had an aggregate securitized debt balance of $1.6 billion. The securitized debt of the trusts can only be settled with the collateral held by the trusts and is non-recourse to the
Slide 19: 2021 Outlook
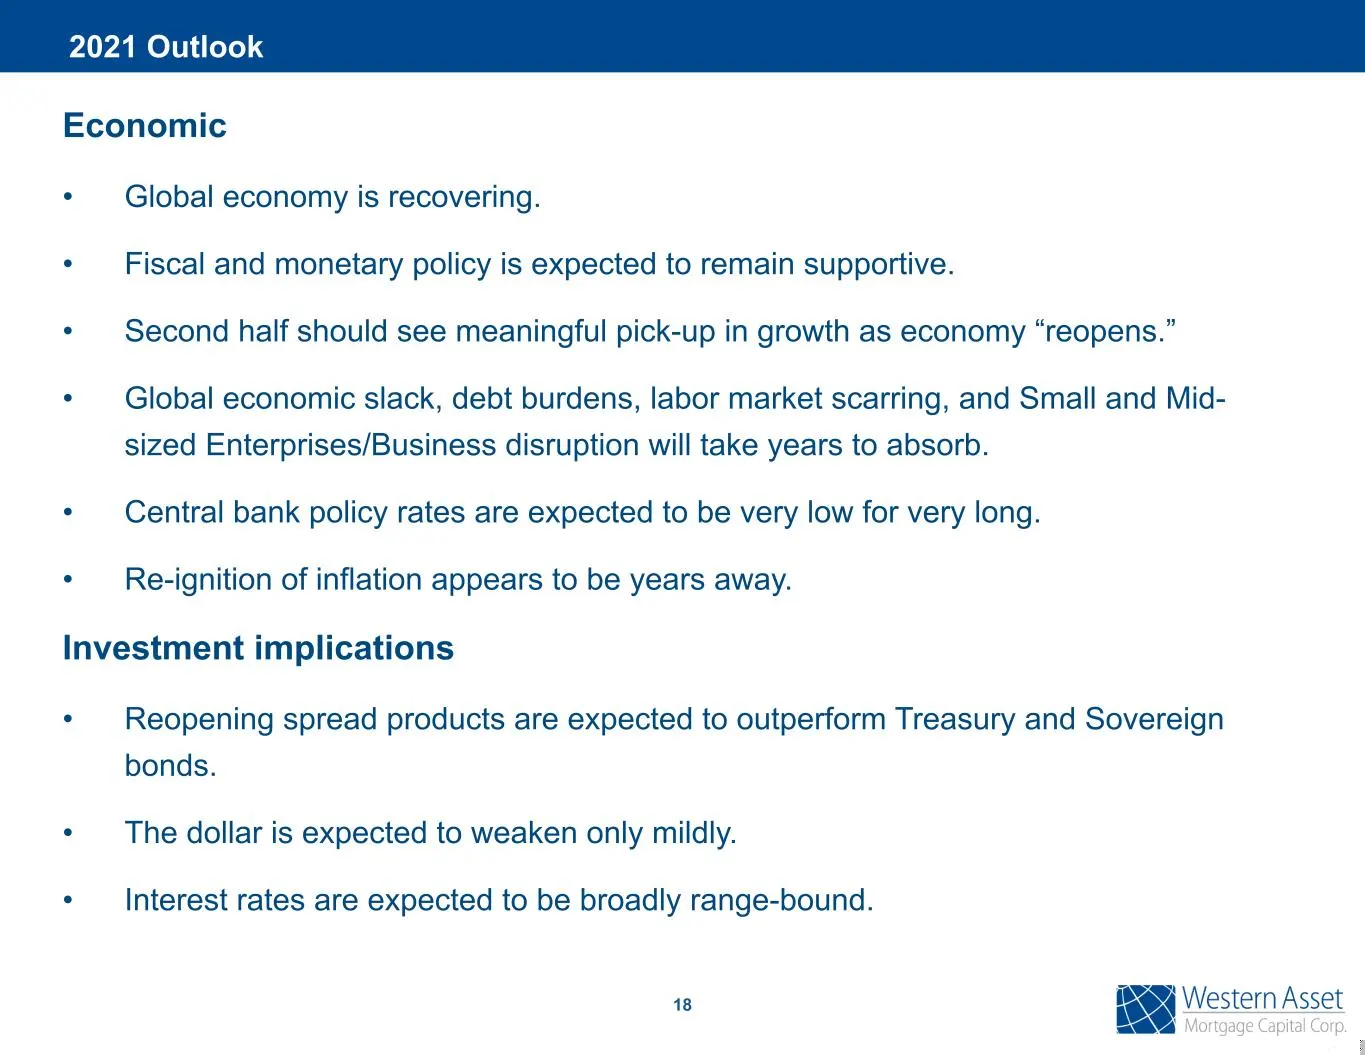
18 Economic • Global economy is recovering. • Fiscal and monetary policy is expected to remain supportive. • Second half should see meaningful pick-up in growth as economy “reopens.” • Global economic slack, debt burdens, labor market scarring, and Small and Mid- sized Enterprises/Business disruptio
Slide 20: Mortgage Spreads Recovery Path
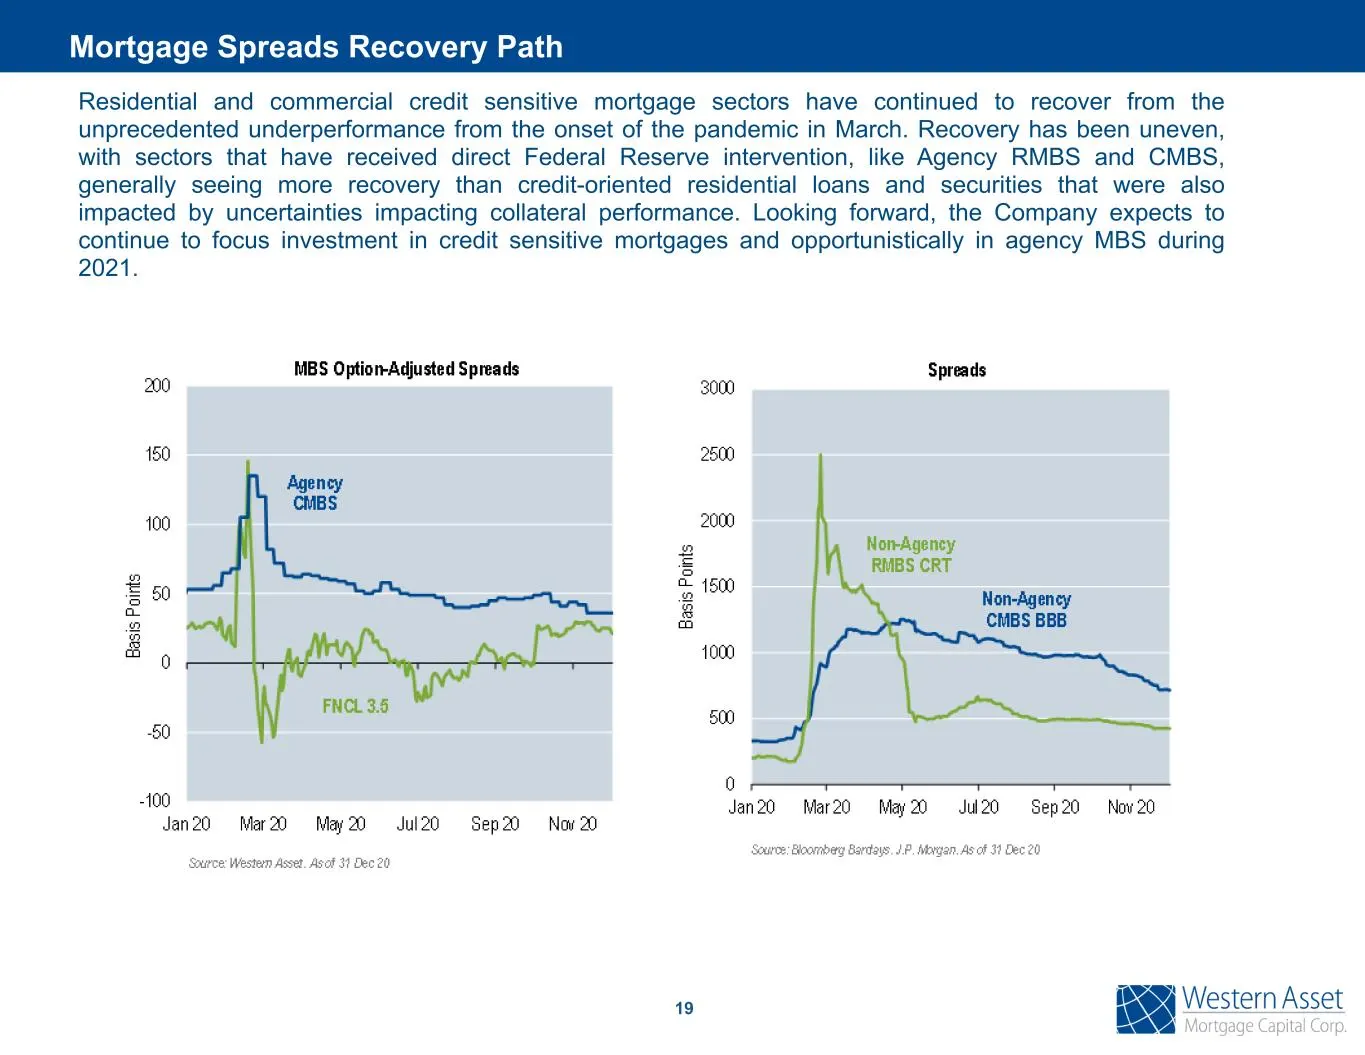
19 Residential and commercial credit sensitive mortgage sectors have continued to recover from the unprecedented underperformance from the onset of the pandemic in March. Recovery has been uneven, with sectors that have received direct Federal Reserve intervention, like Agency RMBS and CMBS, general
Slide 21: Footnotes
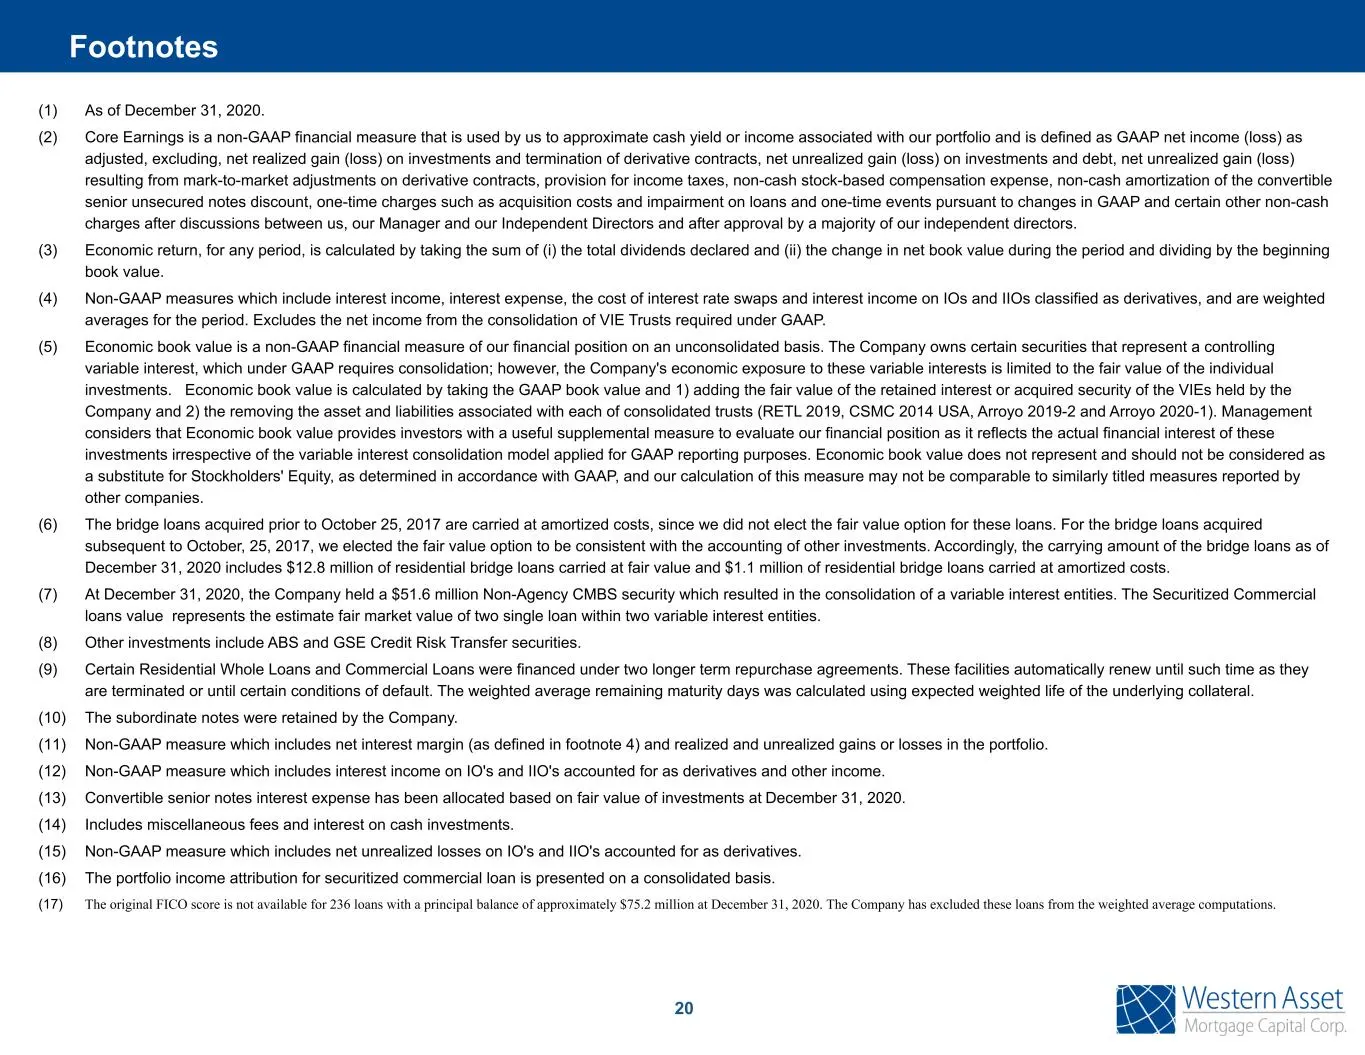
20 (1) As of December 31, 2020. (2) Core Earnings is a non-GAAP financial measure that is used by us to approximate cash yield or income associated with our portfolio and is defined as GAAP net income (loss) as adjusted, excluding, net realized gain (loss) on investments and termination of derivativ
Slide 22: Supplemental Information
21 Supplemental Information
Slide 23: Book Value Roll Forward
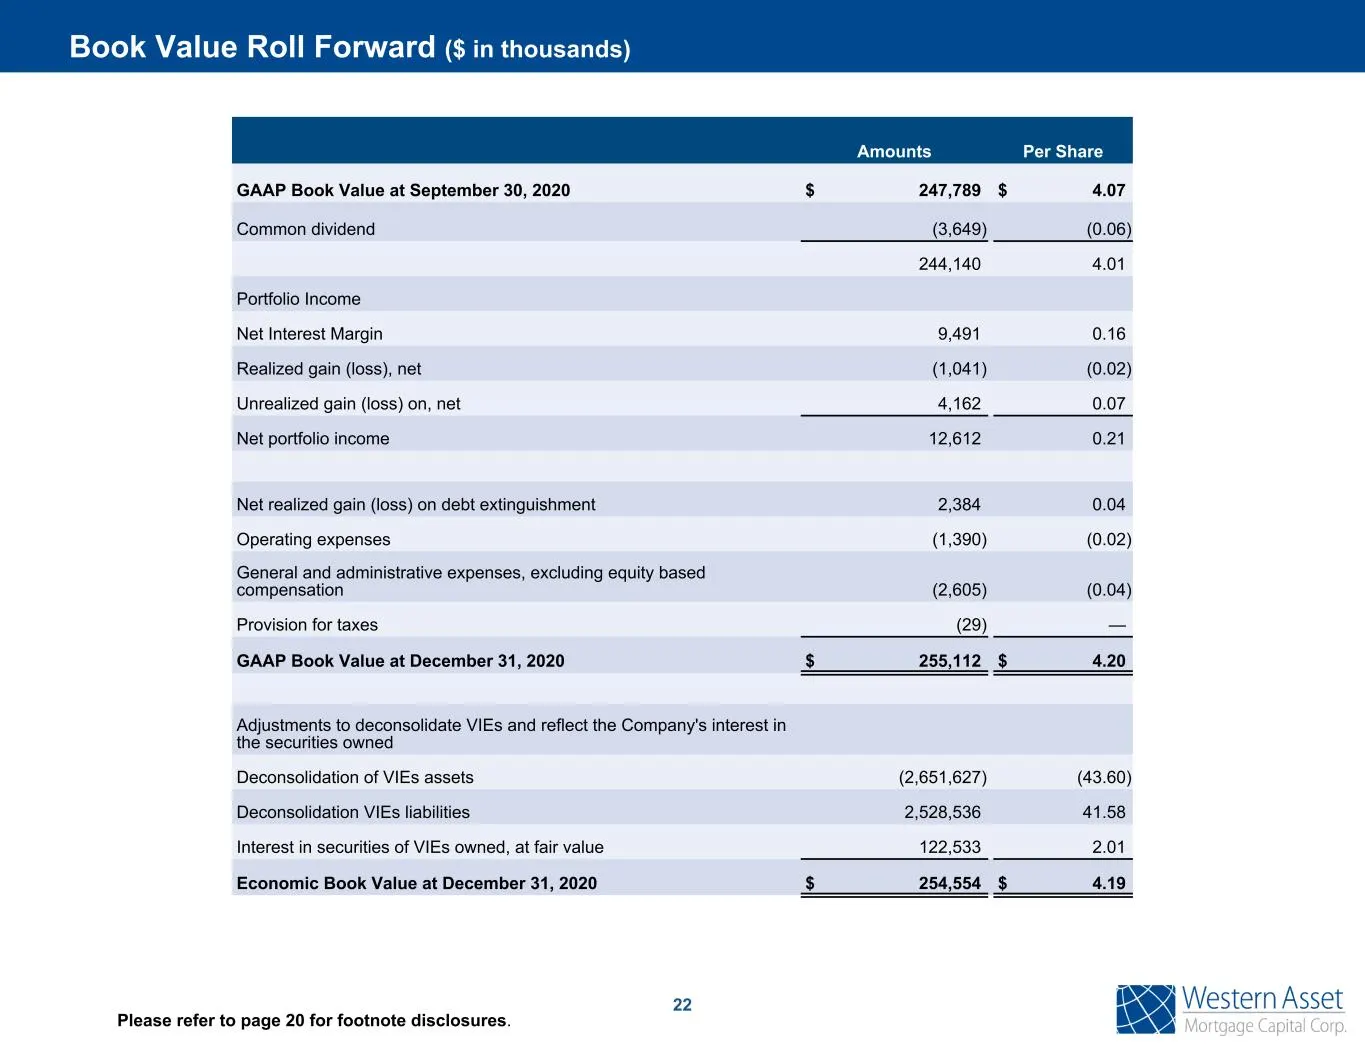
22 Please refer to page 20 for footnote disclosures. Amounts Per Share GAAP Book Value at September 30, 2020 $ 247,789 $ 4.07 Common dividend (3,649) (0.06) 244,140 4.01 Portfolio Income Net Interest Margin 9,491 0.16 Realized gain (loss), net (1,041) (0.02) Unrealized gain (loss) on, net 4,162 0.07
Slide 24: Adjusted Portfolio Composition
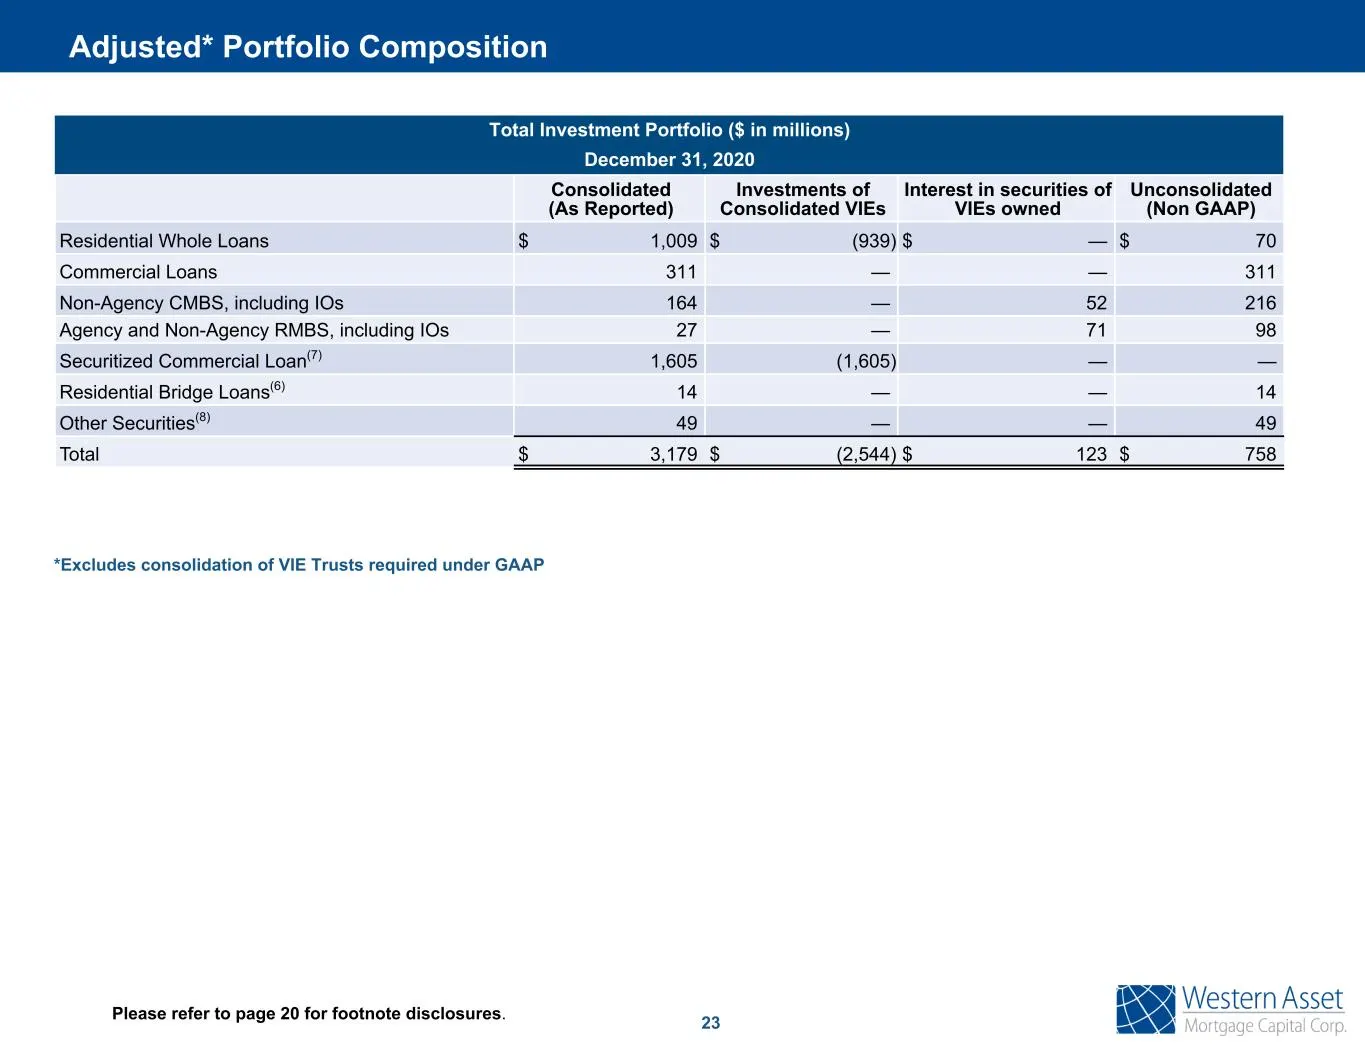
23 *Excludes consolidation of VIE Trusts required under GAAP Please refer to page 20 for footnote disclosures. Total Investment Portfolio ($ in millions) December 31, 2020 Consolidated (As Reported) Investments of Consolidated VIEs Interest in securities of VIEs owned Unconsolidated (Non GAAP) Resid
Slide 25: Commercial loan details
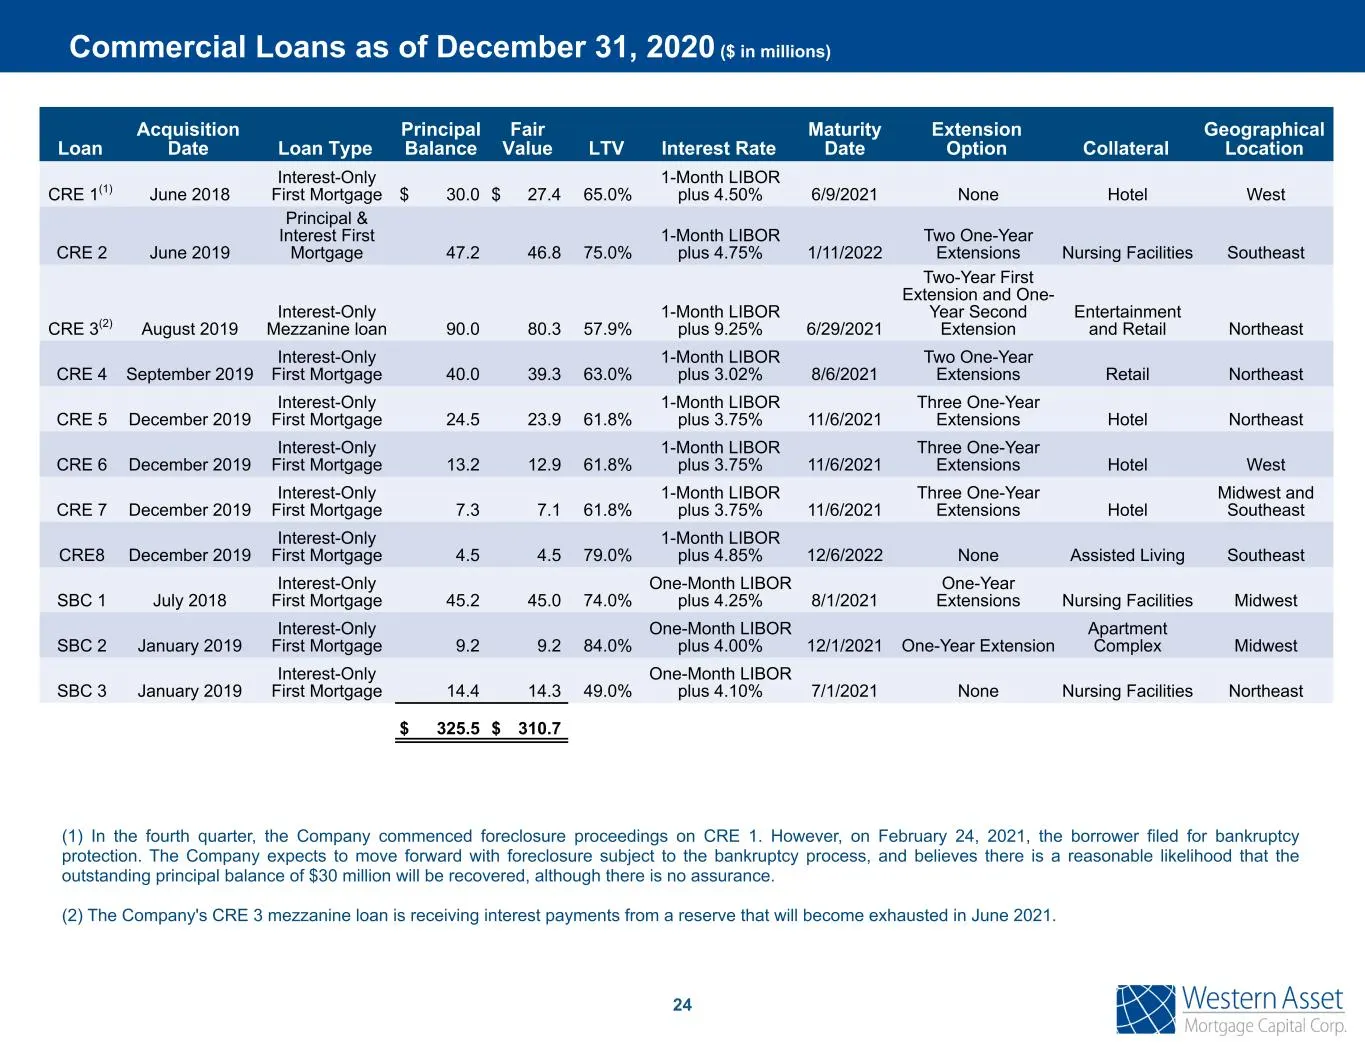
24 Loan Acquisition Date Loan Type Principal Balance Fair Value LTV Interest Rate Maturity Date Extension Option Collateral Geographical Location CRE 1(1) June 2018 Interest-Only First Mortgage $ 30.0 $ 27.4 65.0% 1-Month LIBOR plus 4.50% 6/9/2021 None Hotel West CRE 2 June 2019 Principal & Interest
Slide 26: Contact Information
Western Asset Mortgage Capital Corporation c/o Financial Profiles, Inc. 11601 Wilshire Blvd., Suite 1920 Los Angeles, CA 90025 www.westernassetmcc.com Investor Relations Contact: Larry Clark Tel: (310) 622-8223 lclark@finprofiles.com Contact Information
Source: SEC EDGAR · 8-K filed Mar 3, 2021
More decks from Western Asset Mortgage Capital
 Merger or Acquisition (August 2023)9 slides · Aug 9, 2023
 Q2 2023 Earnings Presentation32 slides · Aug 8, 2023
 Merger or Acquisition (July 2023)9 slides · Jul 13, 2023
 Merger or Acquisition (June 2023)16 slides · Jun 28, 2023
 Q1 2023 Earnings Presentation33 slides · May 4, 2023
 Q4 2022 Earnings Presentation34 slides · Mar 2, 2023