Tabcorp Holdings Limited · ASX:TAH
Tabcorp — FY2021 Earnings Presentation
38 slides from Tabcorp's earnings presentation, Aug 18, 2021

Slide 1: Full Year Results Presentation, Year Ended 30 June 2021
2020-21 FULL YEAR RESULTS PRESENTATION YEAR ENDED 30 JUNE 2021 18 AUGUST 2021 ABN 66 063 780 709

Slide 2: Table of Contents
TA B L E O F CONTENTS 03 - 07 Group Overview 09 - 19 Business Results 21 - 22 Capital 24 - 26 Conclusion 28 - 36 Appendices
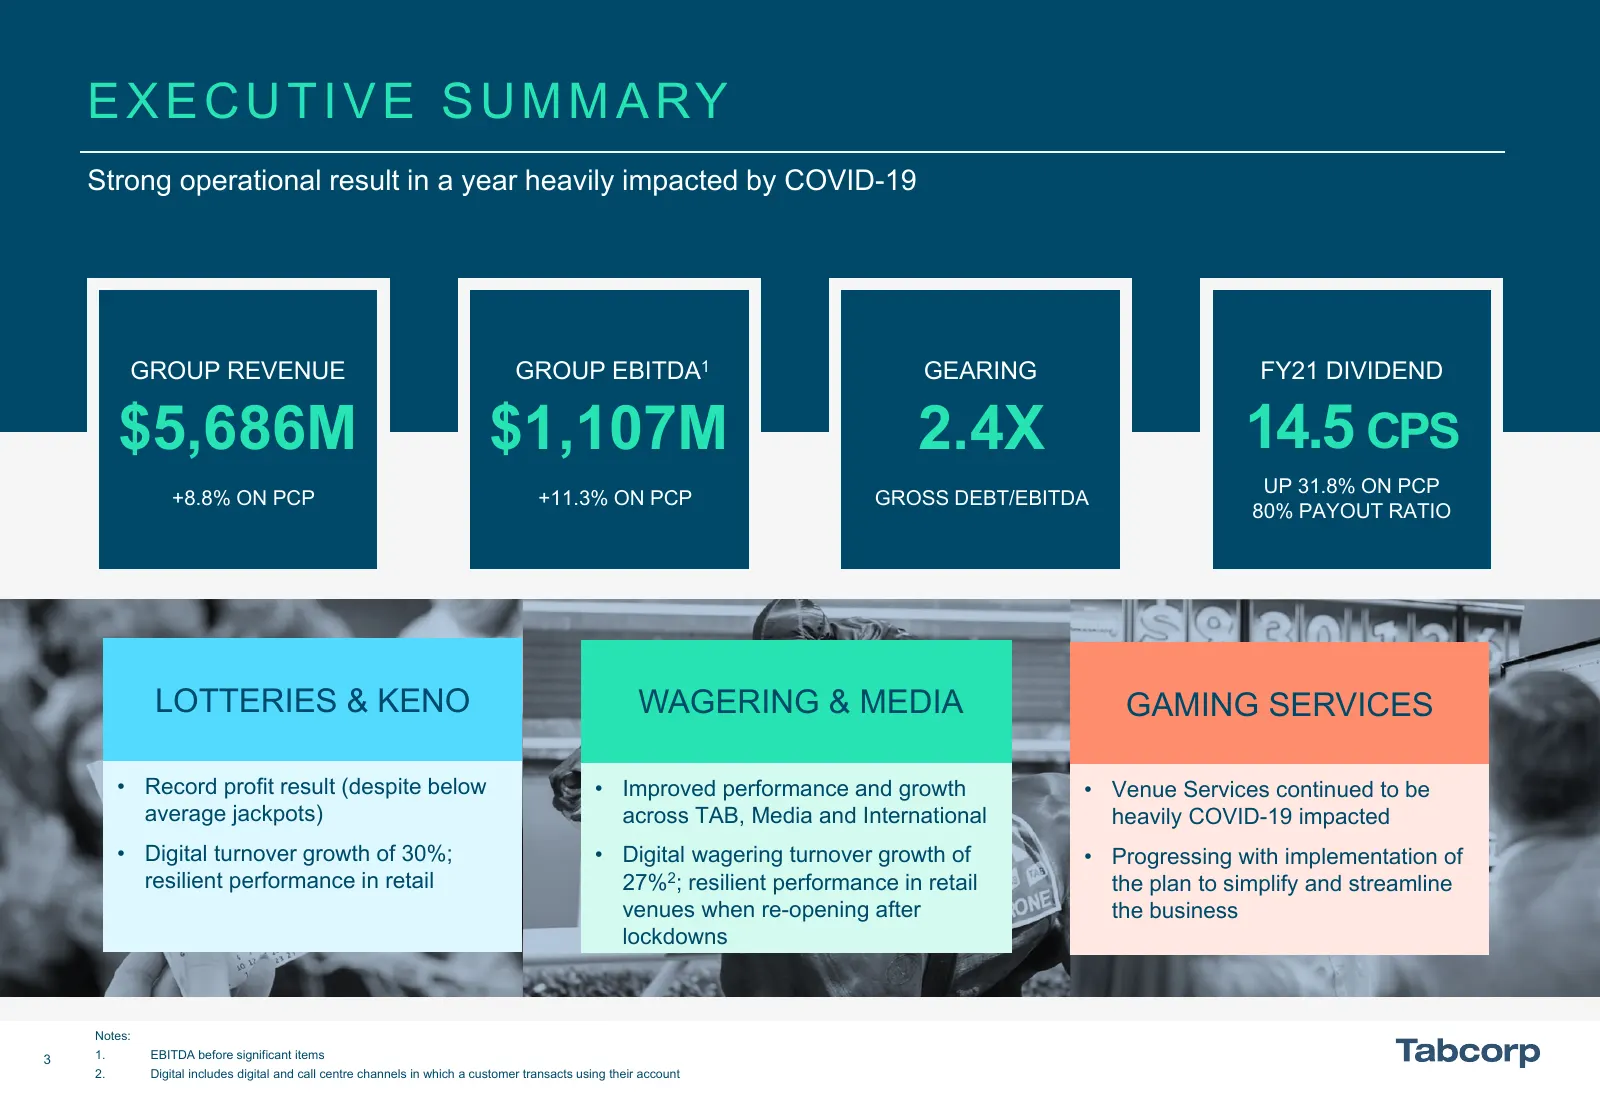
Slide 3: Executive Summary
EXECUTIVE SUMMARY Strong operational result in a year heavily impacted by COVID-19 GROUP REVENUE GROUP EBITDA1 GEARING FY21 DIVIDEND $5,686M $1,107M 2.4X 14.5 CPS UP 31.8% ON PCP +8.8% ON PCP +11.3% ON PCP GROSS DEBT/EBITDA 80% PAYOUT RATIO LOTTERIES & KENO WAGERING & MEDIA GAMING SERVICES • Record
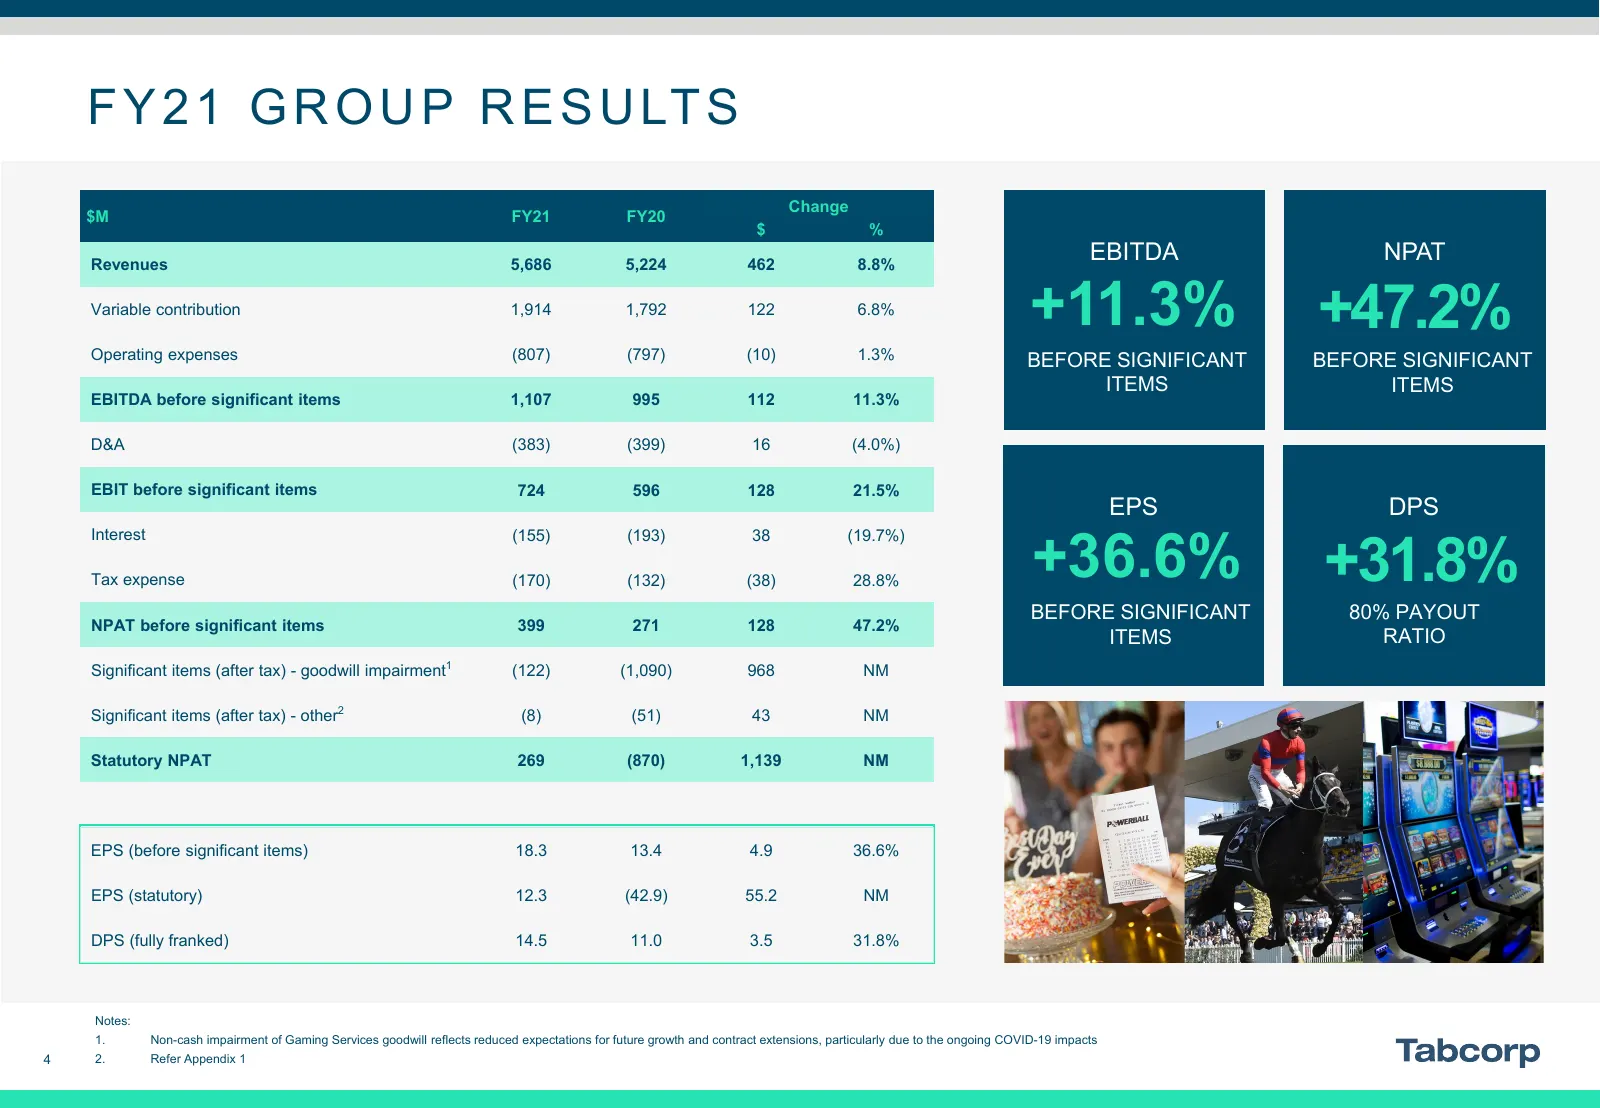
Slide 4: FY21 Group Results
F Y 2 1 G R O U P R E S U LT S Change $M FY21 FY20 $ % Revenues 5,686 5,224 462 8.8% EBITDA NPAT Variable contribution 1,914 1,792 122 6.8% +11.3% +47.2% Operating expenses (807) (797) (10) 1.3% BEFORE SIGNIFICANT BEFORE SIGNIFICANT ITEMS items) (before significant ITEMS EBITDA before significant it
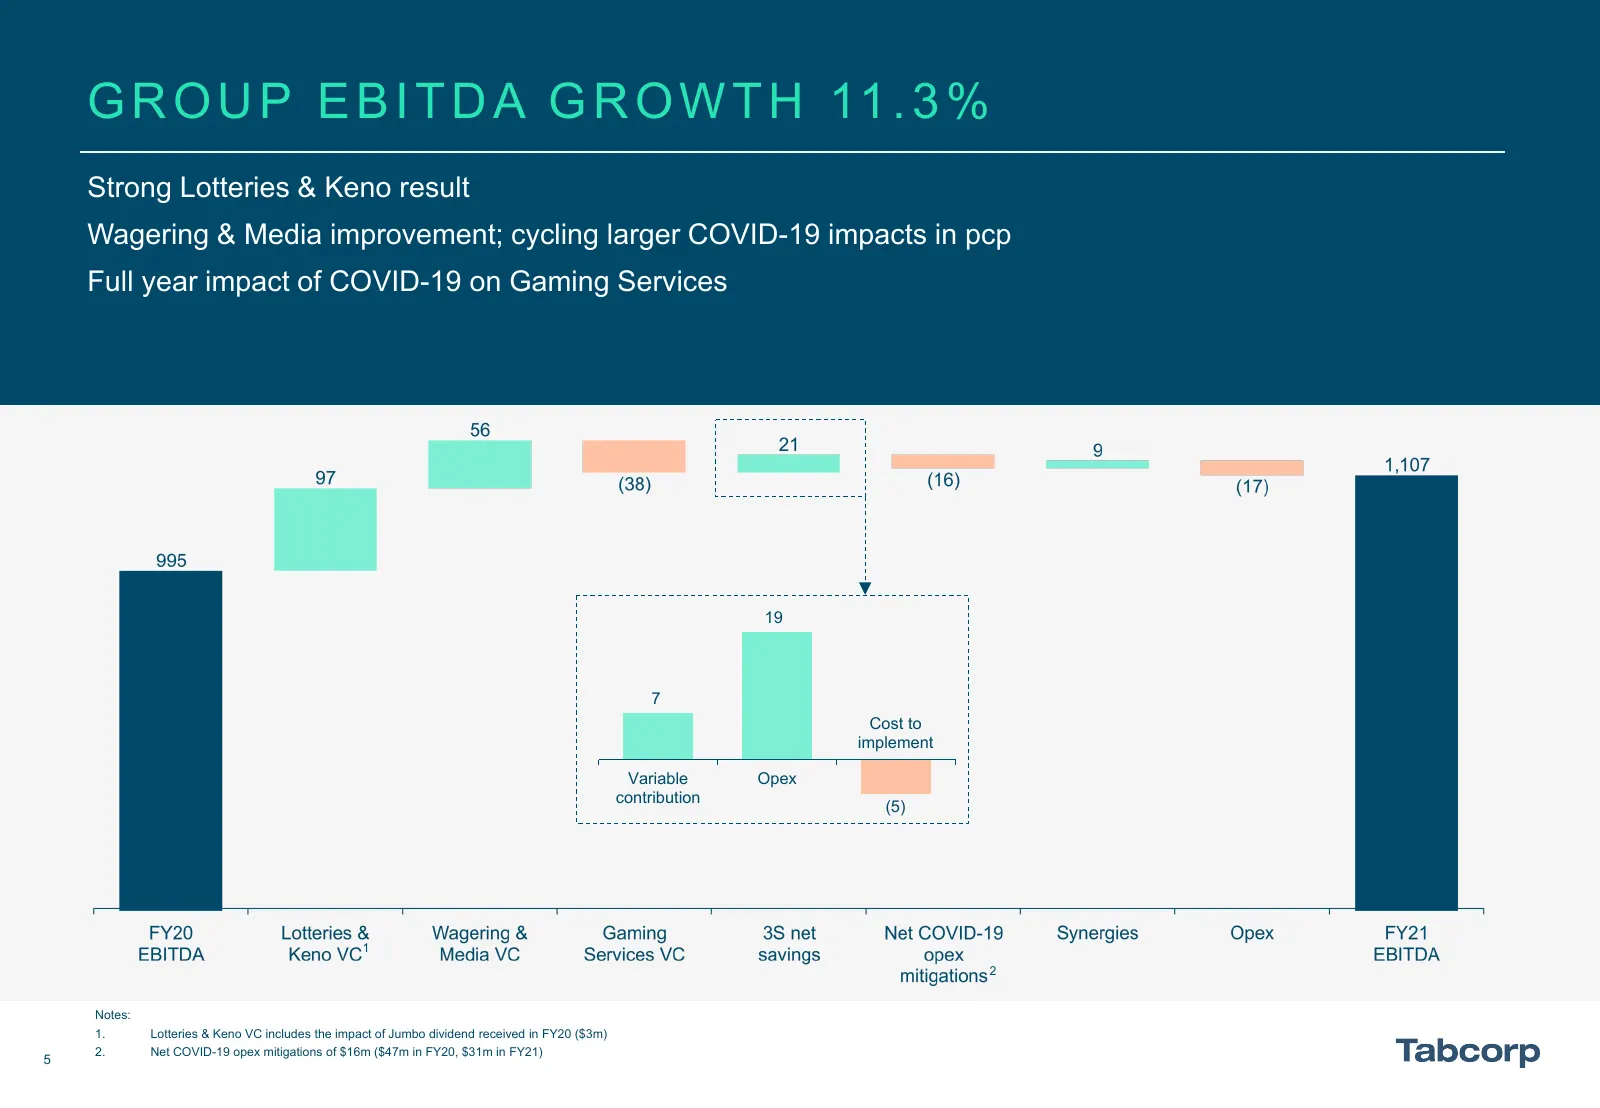
Slide 5: Group EBITDA Growth
G R O U P E B I T D A G R O W T H 11 . 3 % Strong Lotteries & Keno result Wagering & Media improvement; cycling larger COVID-19 impacts in pcp Full year impact of COVID-19 on Gaming Services 19 7 Cost to implement Variable Opex contribution (5) 1 2 Notes: 1. Lotteries & Keno VC includes the impact o
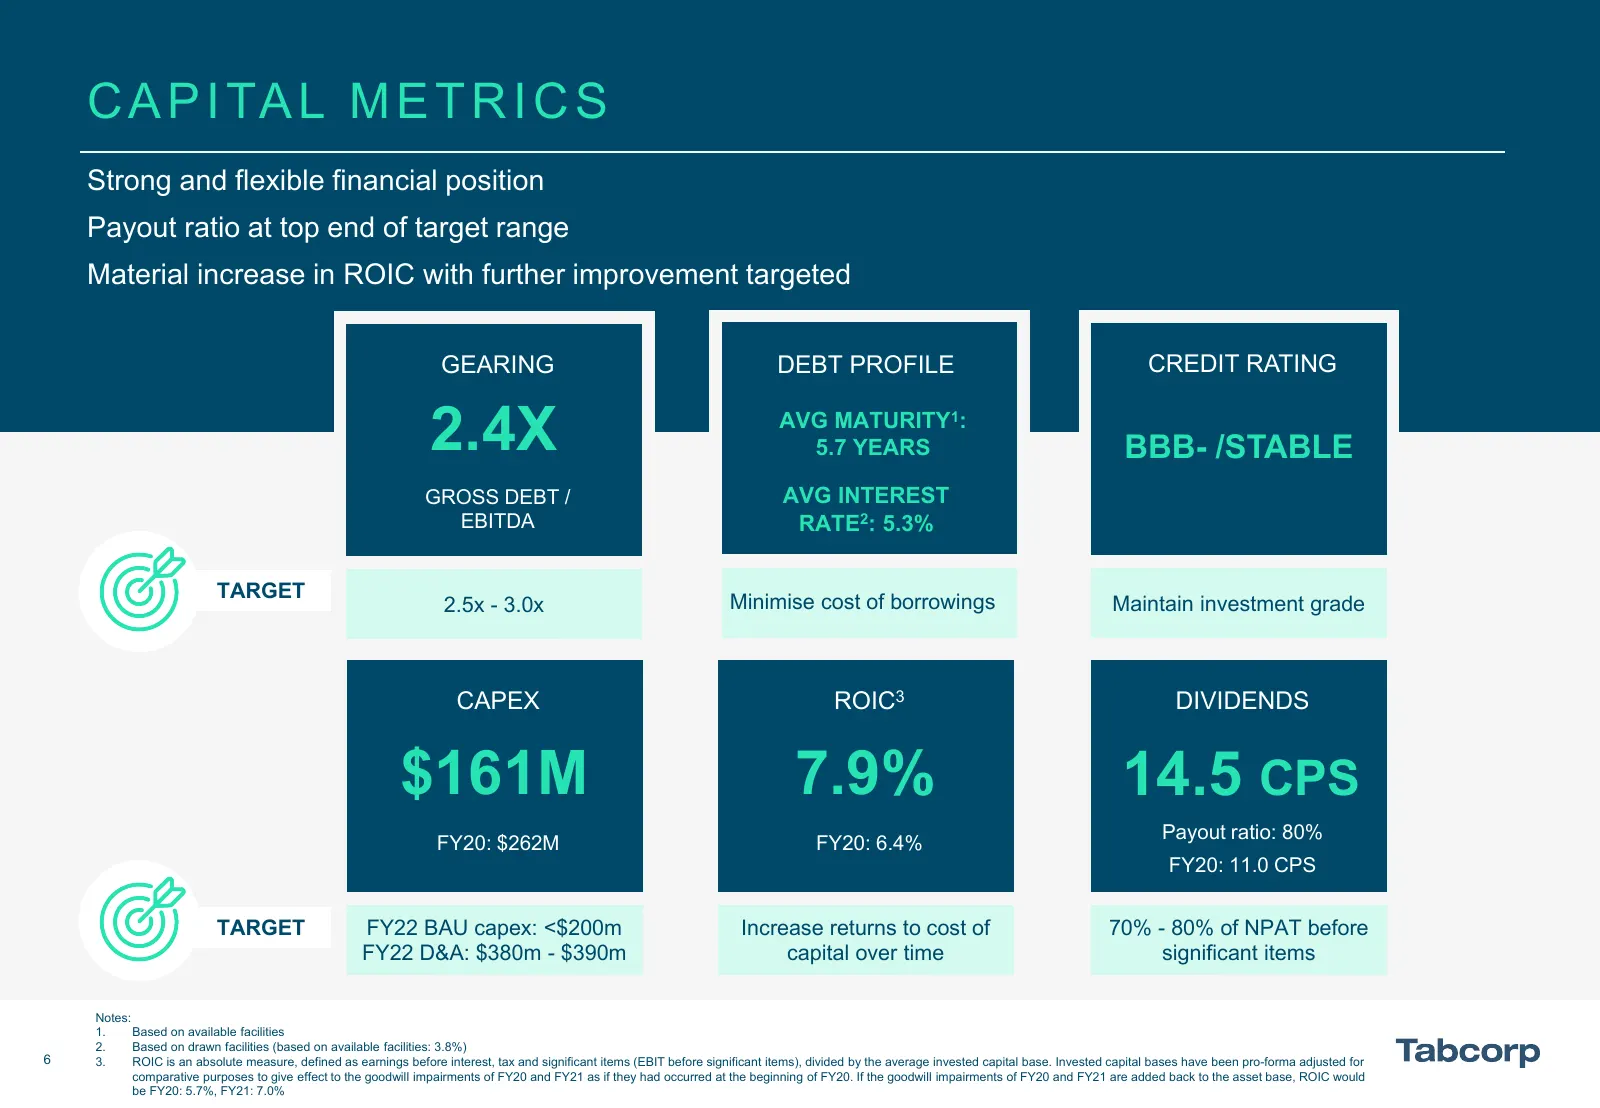
Slide 6: Capital Metrics
C A P I TA L M E T R I C S Strong and flexible financial position Payout ratio at top end of target range Material increase in ROIC with further improvement targeted GEARING DEBT PROFILE CREDIT RATING 2.4X AVG MATURITY1: 5.7 YEARS BBB- /STABLE GROSS DEBT / AVG INTEREST EBITDA RATE2: 5.3% TARGET 2.5x
Slide 7: Optimisation Program
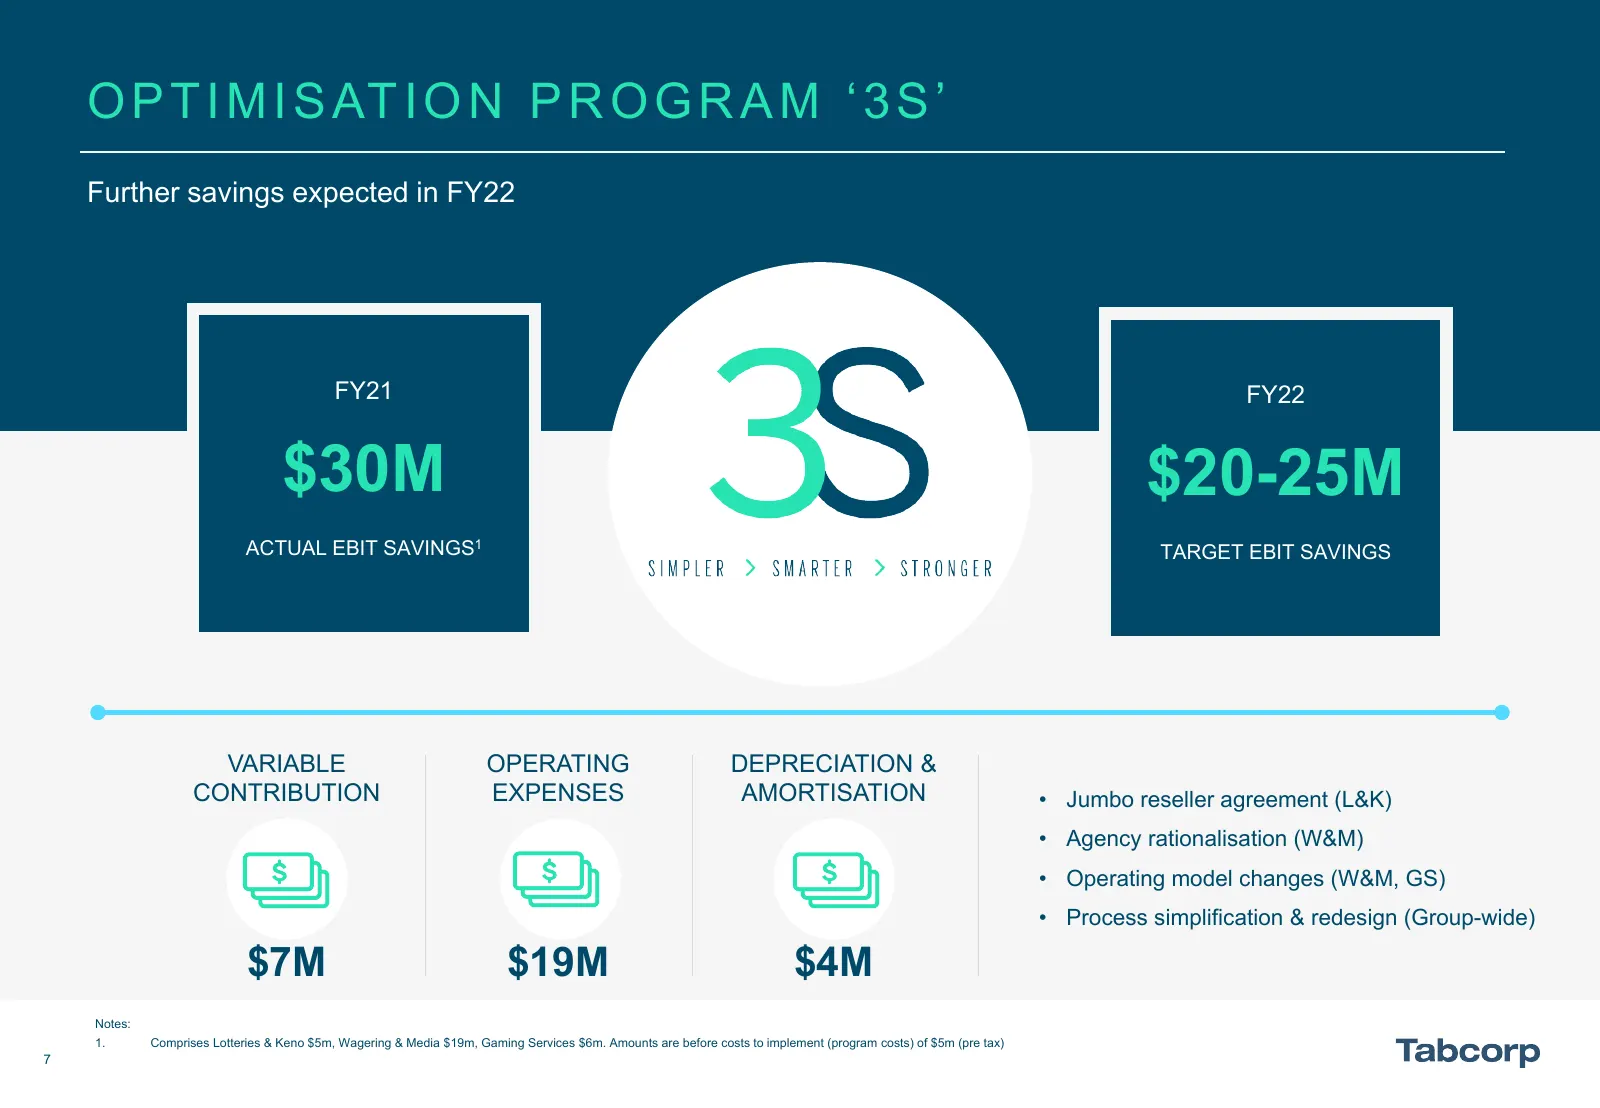
O P T I M I S AT I O N P R O G R A M ‘ 3 S ’ Further savings expected in FY22 FY21 FY22 $30M $20-25M ACTUAL EBIT SAVINGS1 TARGET EBIT SAVINGS VARIABLE OPERATING DEPRECIATION & CONTRIBUTION EXPENSES AMORTISATION • Jumbo reseller agreement (L&K) • Agency rationalisation (W&M) • Operating model changes
Slide 8: Table of Contents
TA B L E O F CONTENTS 03 - 07 Group Overview 09 - 19 Business Results 21 - 22 Capital 24 - 26 Conclusion 28 - 36 Appendices
Slide 9: Group & Business Results
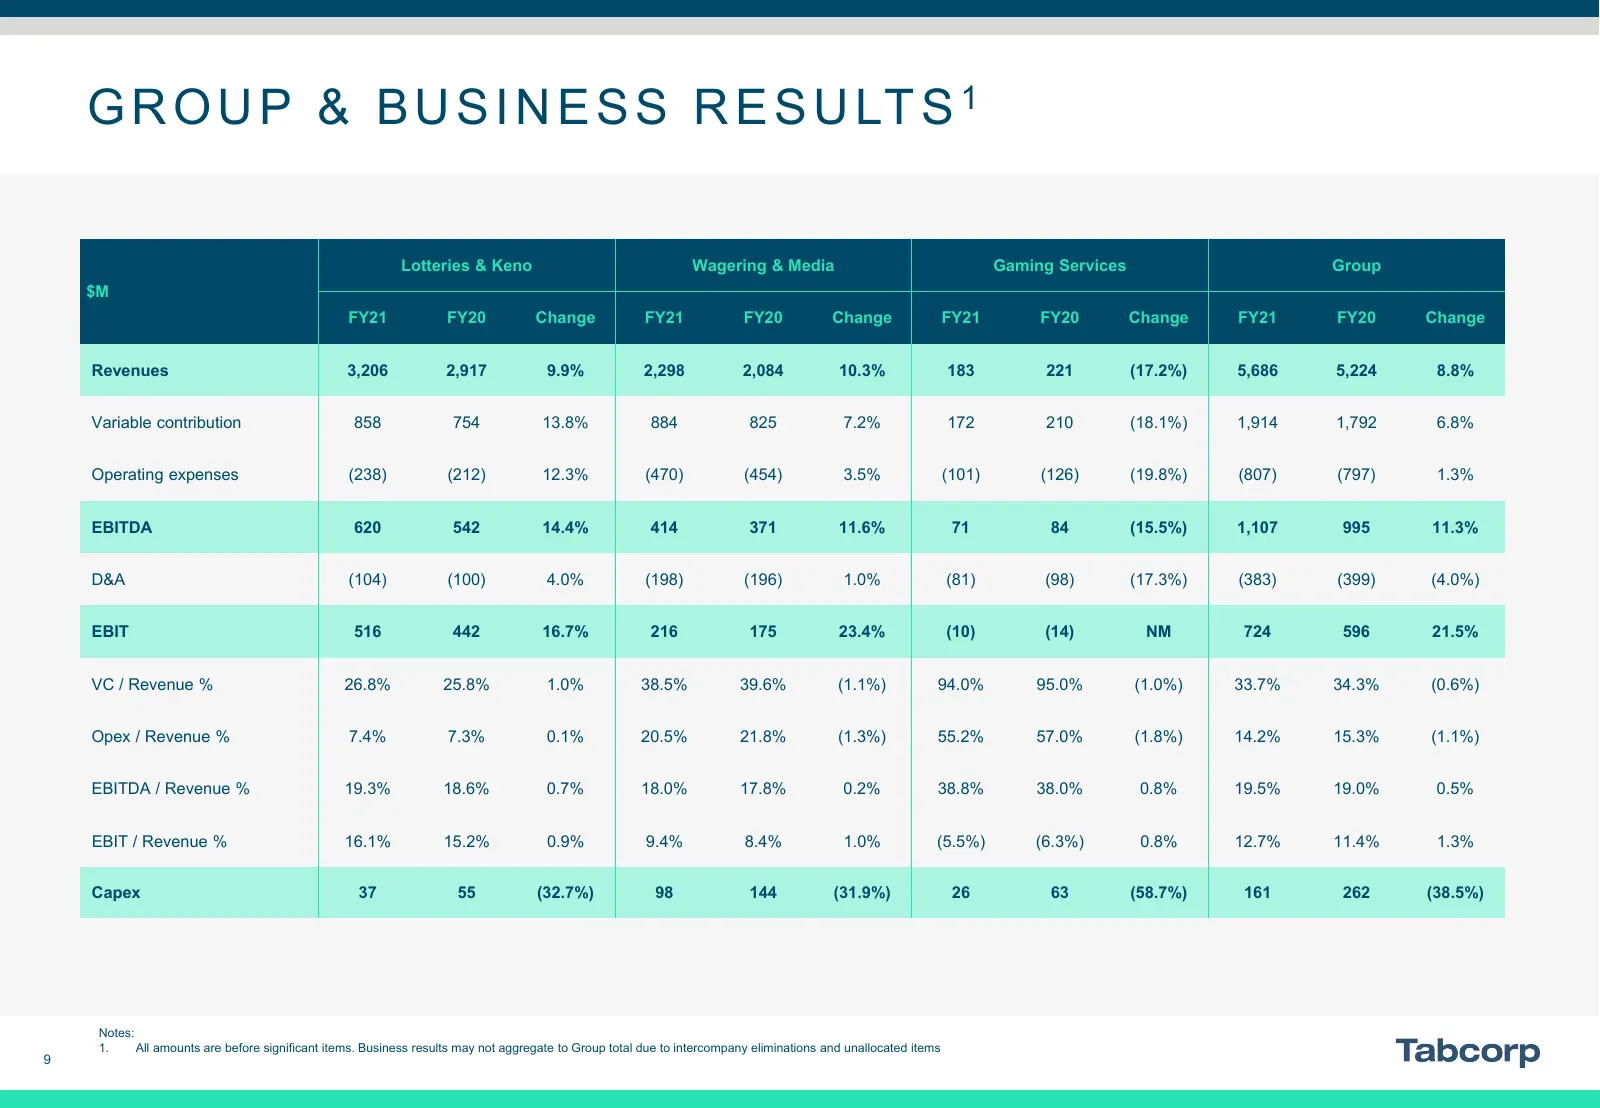
G R O U P & B U S I N E S S R E S U LT S 1 Lotteries & Keno Wagering & Media Gaming Services Group $M FY21 FY20 Change FY21 FY20 Change FY21 FY20 Change FY21 FY20 Change Revenues 3,206 2,917 9.9% 2,298 2,084 10.3% 183 221 (17.2%) 5,686 5,224 8.8% Variable contribution 858 754 13.8% 884 825 7.2% 172
Slide 10: Lotteries & Keno
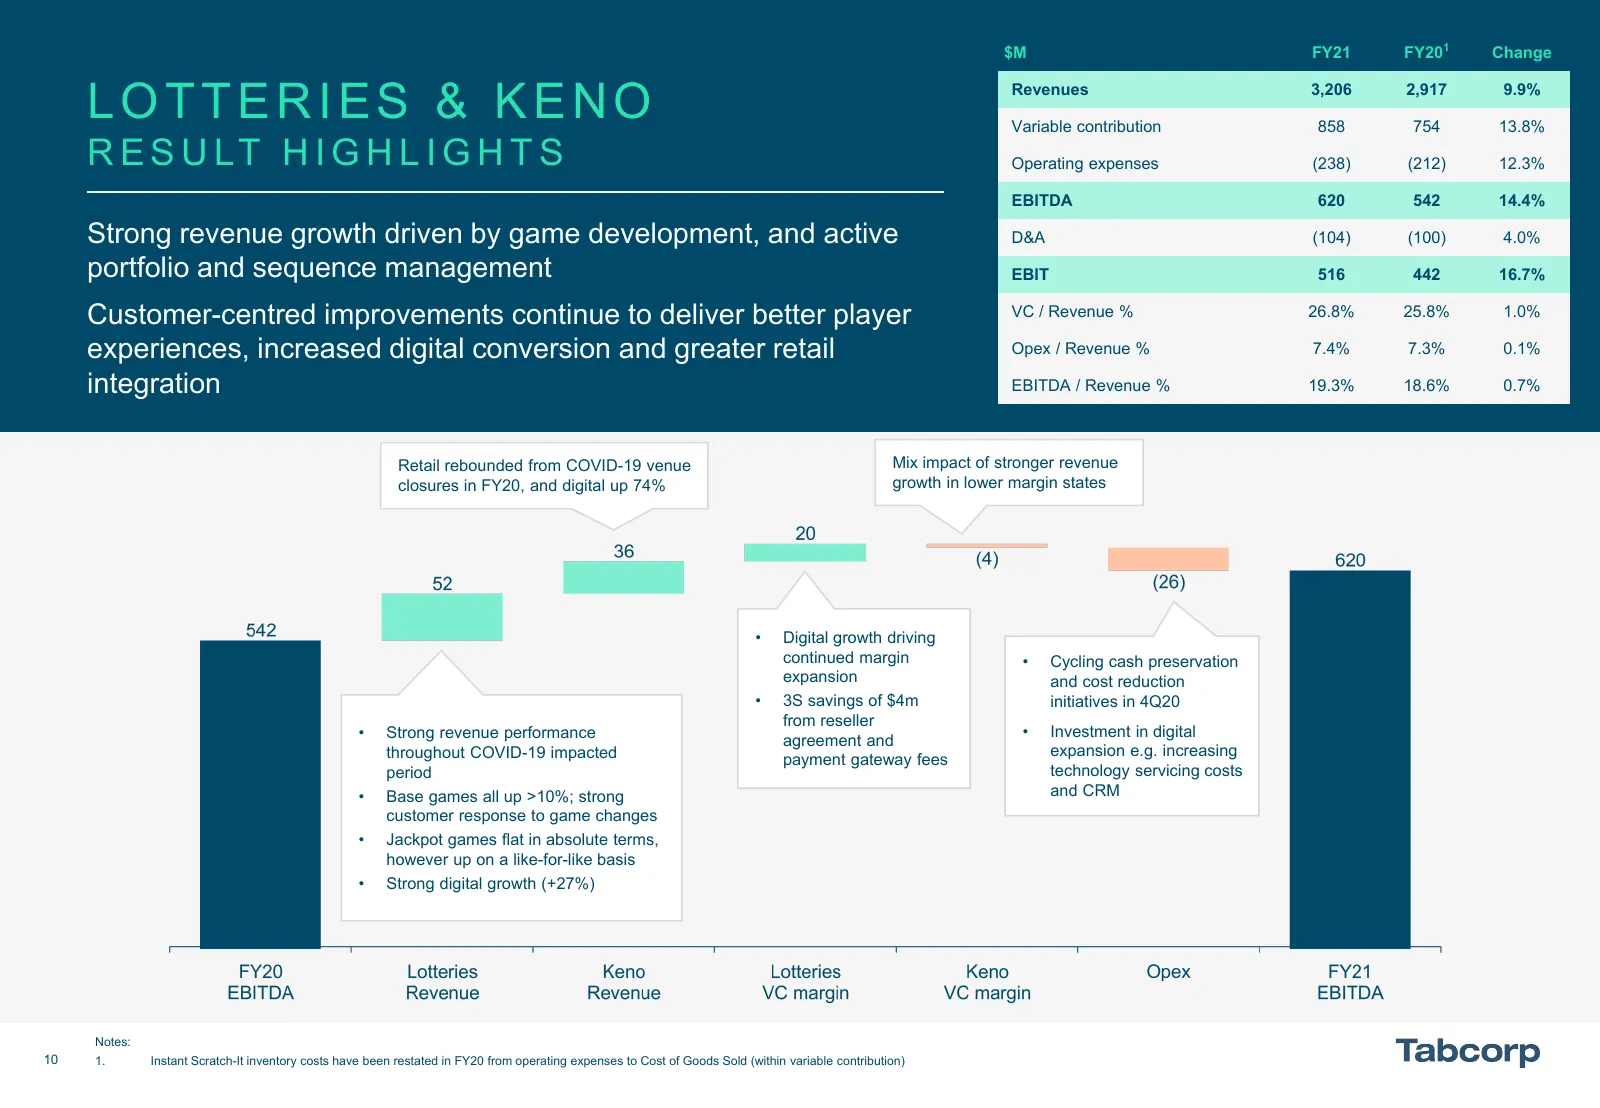
$M FY21 FY201 Change LOTTERIES & KENO Revenues Variable contribution 3,206 858 2,917 754 9.9% 13.8% R E S U LT H I G H L I G H T S Operating expenses (238) (212) 12.3% EBITDA 620 542 14.4% Strong revenue growth driven by game development, and active D&A (104) (100) 4.0% portfolio and sequence manage
Slide 11: Lotteries & Keno Key Performance Indicators
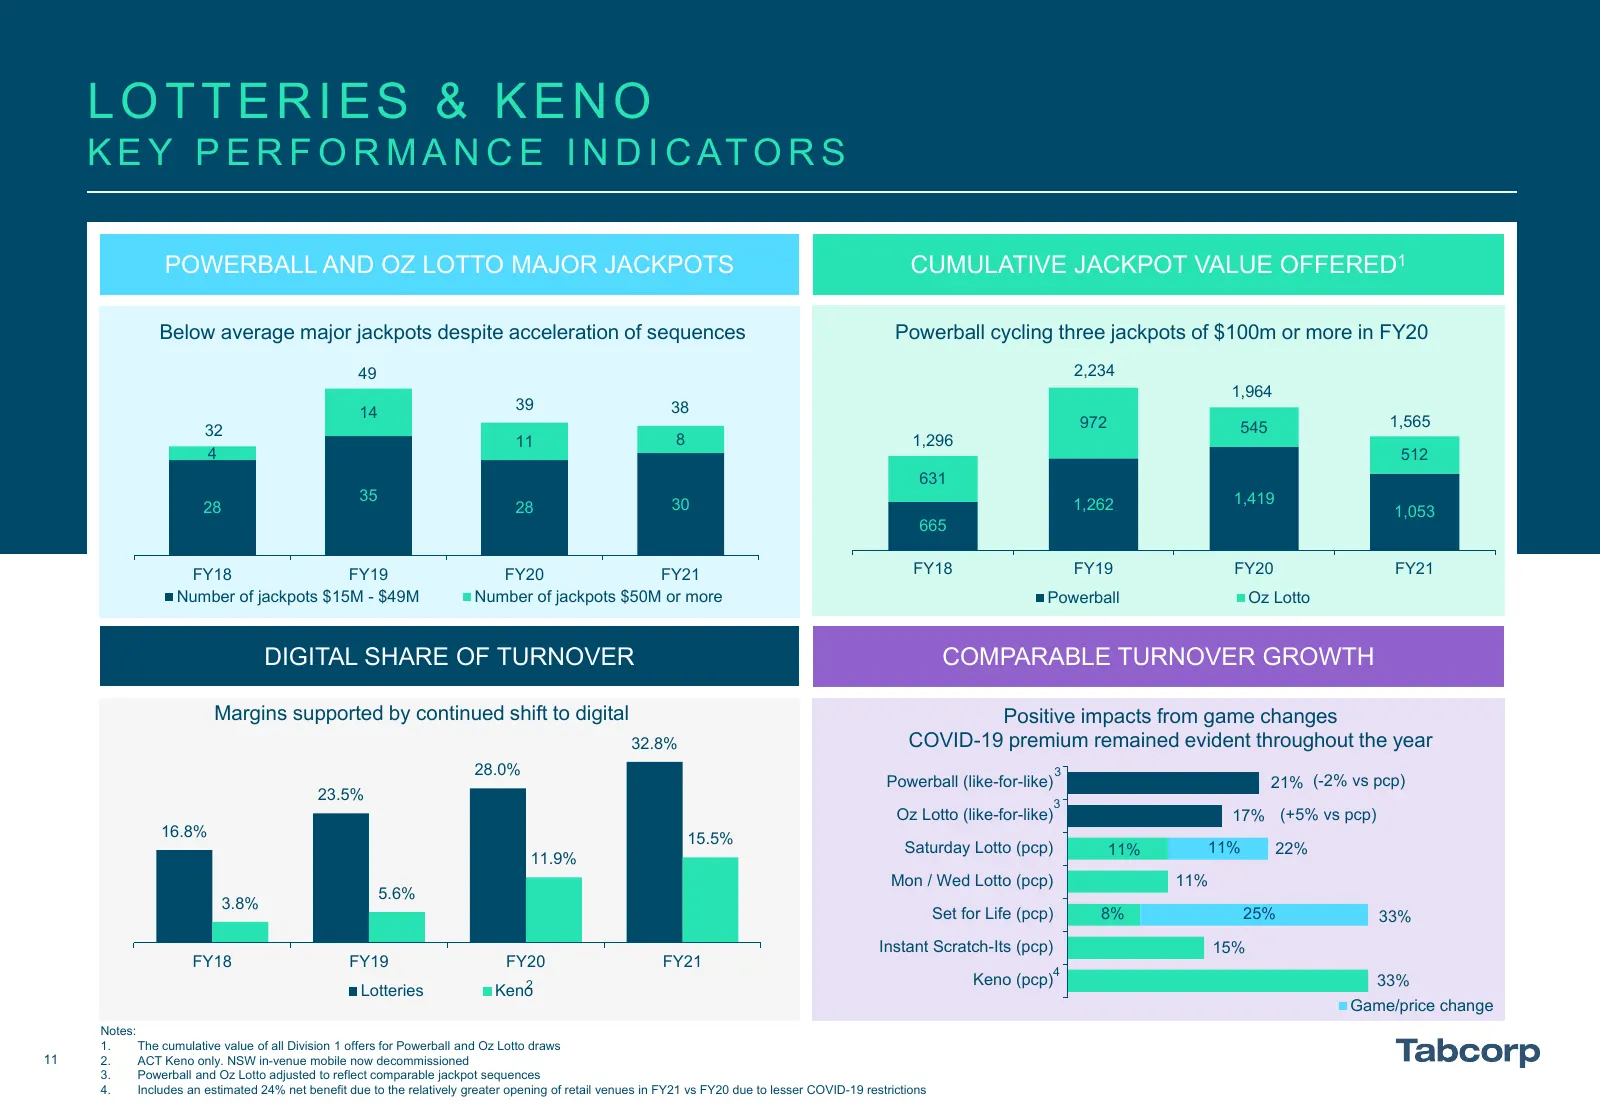
LOTTERIES & KENO K E Y P E R F O R M A N C E I N D I C AT O R S POWERBALL AND OZ LOTTO MAJOR JACKPOTS CUMULATIVE JACKPOT VALUE OFFERED1 634 Below average major jackpots despite acceleration of sequences Powerball cycling three jackpots of $100m or more in FY20 547 49 2,234 1,964 39 38 14 484 470 972
Slide 12: Lotteries & Keno: Customer-Focused Investments Driving Growth
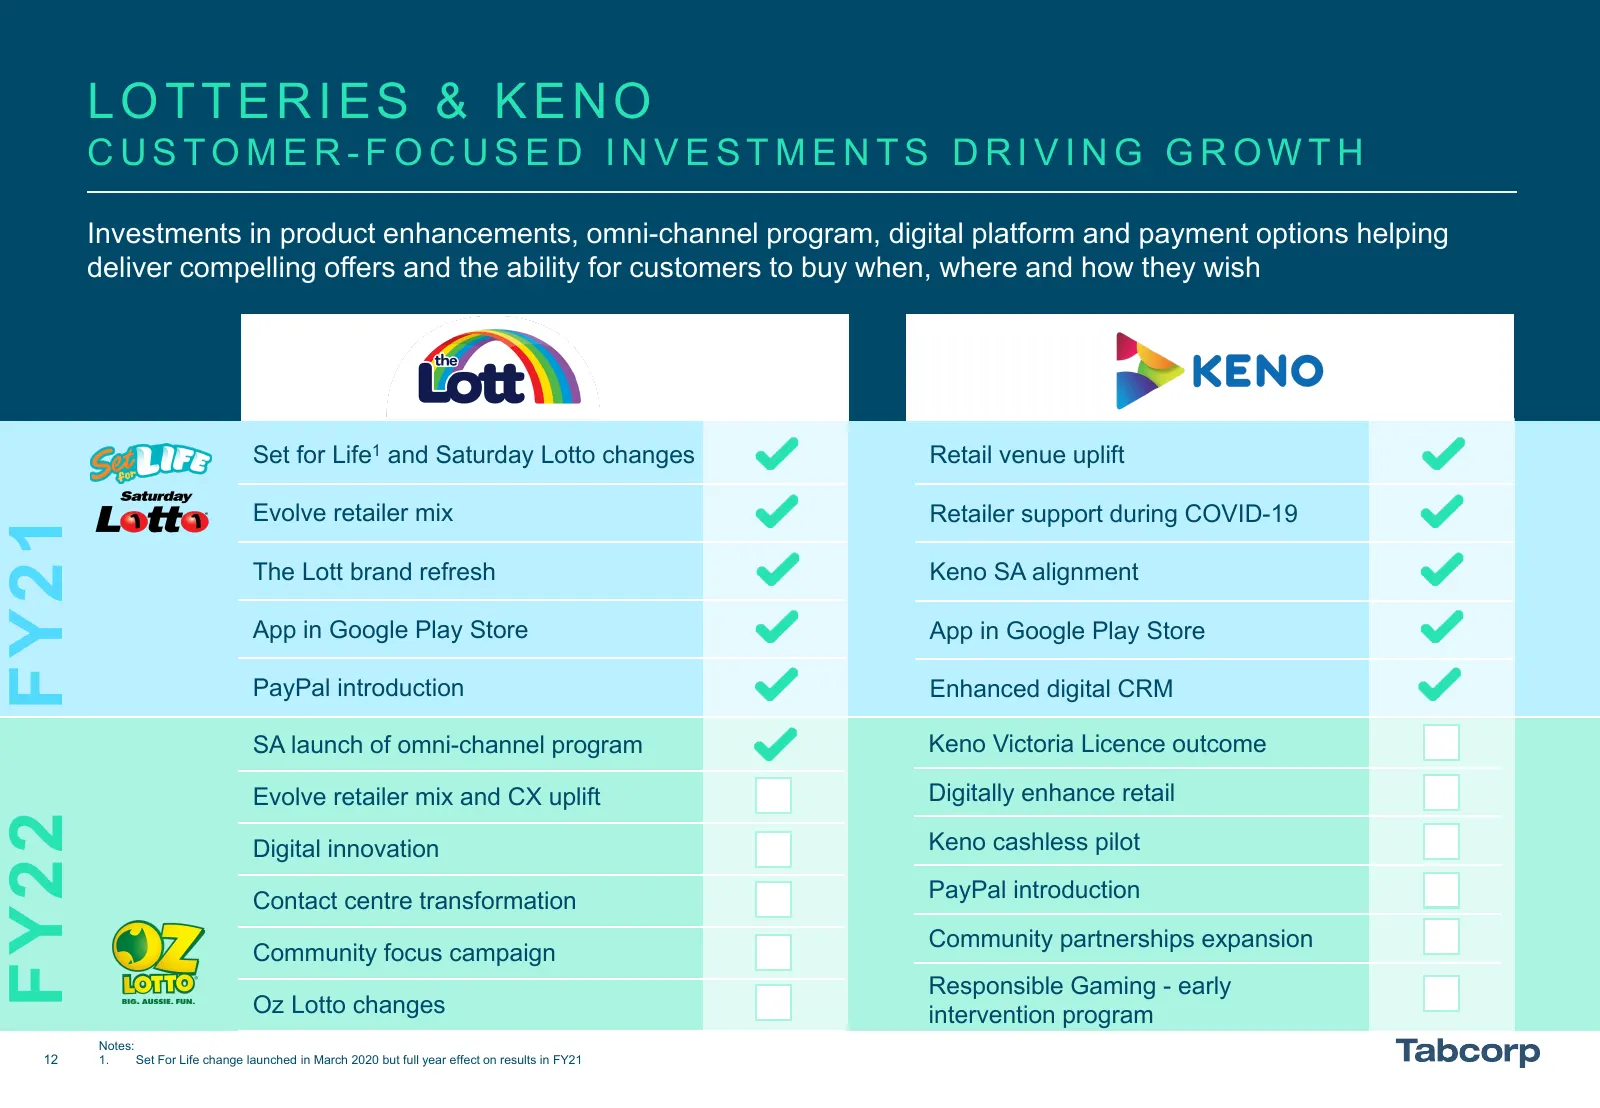
LOTTERIES & KENO CUSTOMER-FOCUSED INVESTMENTS DRIVING GROWTH Investments in product enhancements, omni-channel program, digital platform and payment options helping deliver compelling offers and the ability for customers to buy when, where and how they wish Set for Life1 and Saturday Lotto changes R
Slide 13: Lotteries & Keno Key Growth Strategies
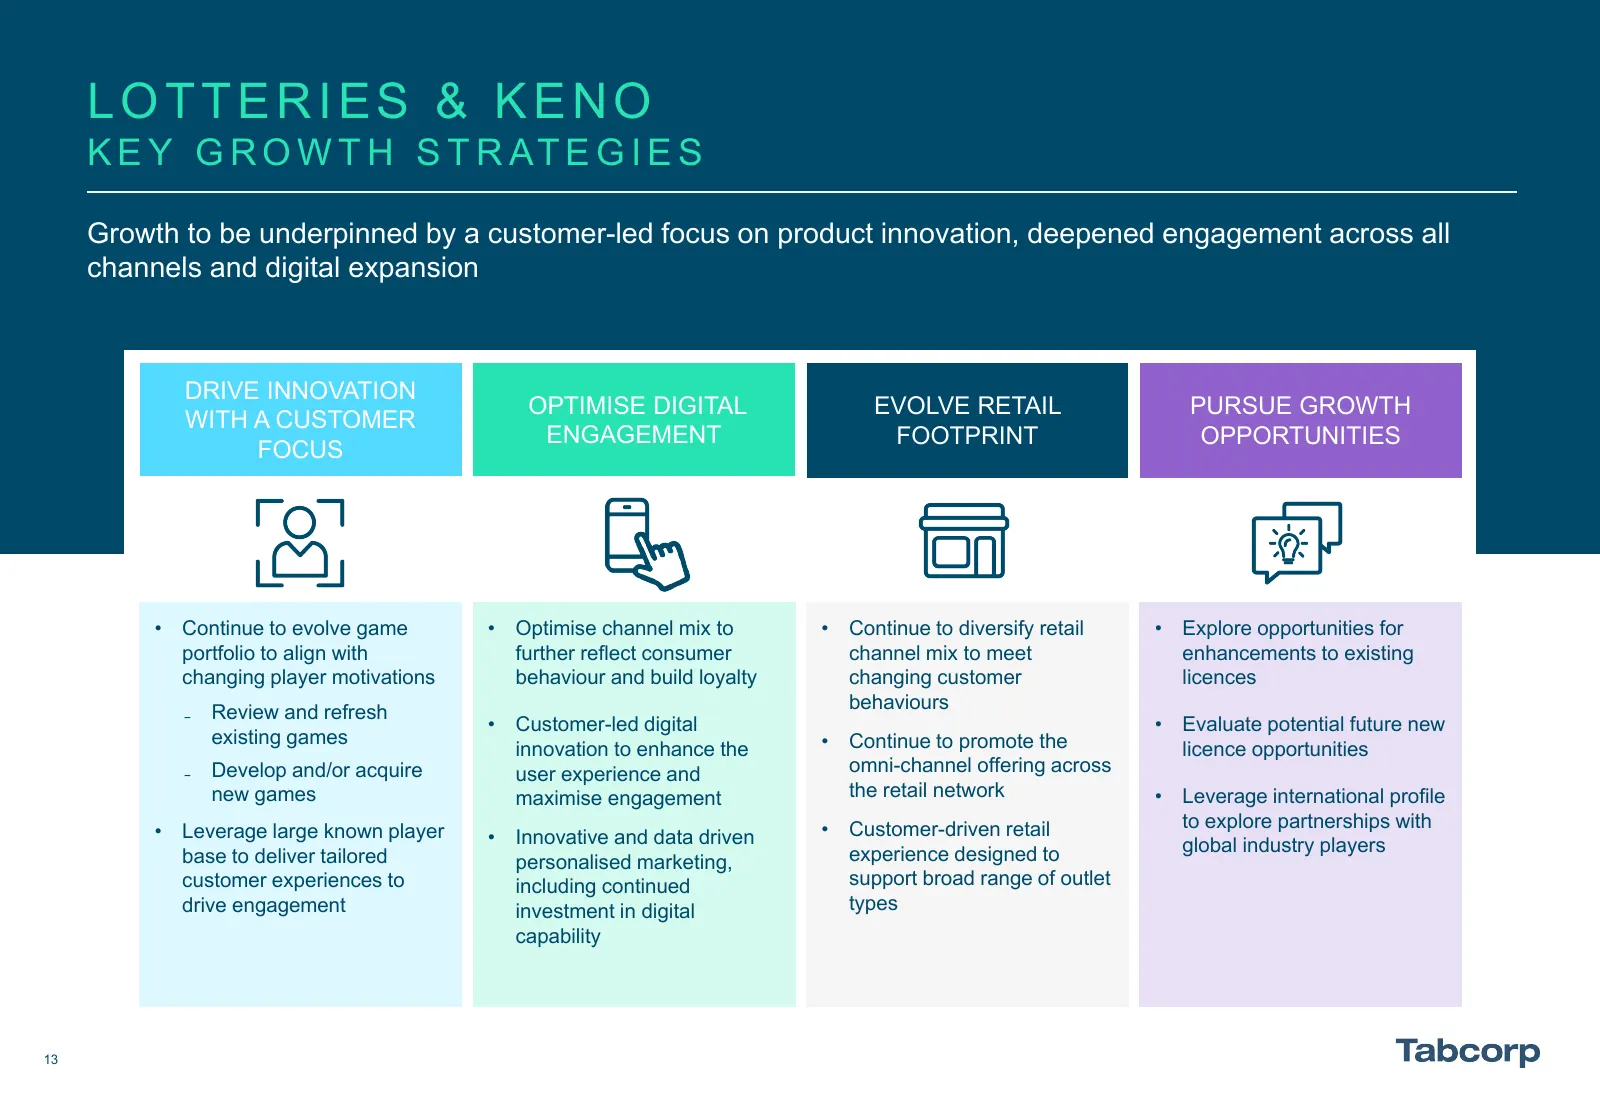
LOTTERIES & KENO K E Y G R O W T H S T R AT E G I E S Growth to be underpinned by a customer-led focus on product innovation, deepened engagement across all channels and digital expansion DRIVE INNOVATION OPTIMISE DIGITAL EVOLVE RETAIL PURSUE GROWTH WITH A CUSTOMER ENGAGEMENT FOOTPRINT OPPORTUNITIES
Slide 14: Wagering & Media
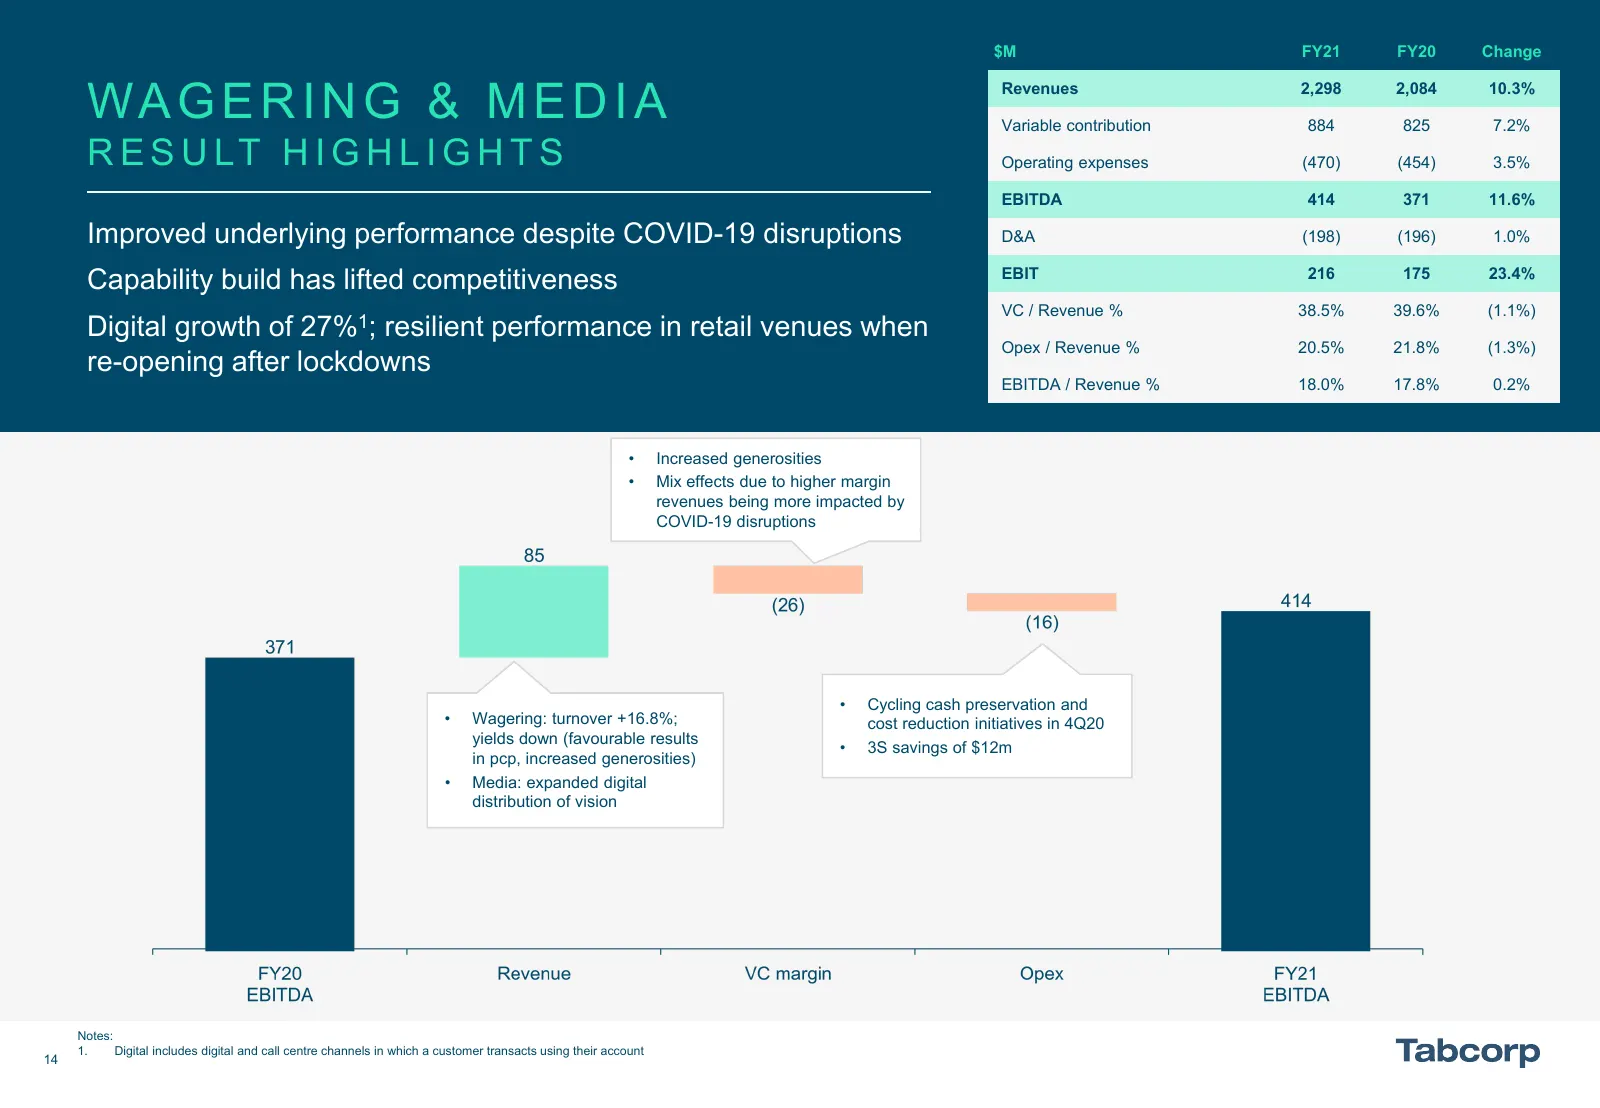
$M FY21 FY20 Change WA G E R I N G & M E D I A Revenues Variable contribution 2,298 884 2,084 825 10.3% 7.2% R E S U LT H I G H L I G H T S Operating expenses (470) (454) 3.5% EBITDA 414 371 11.6% Improved underlying performance despite COVID-19 disruptions D&A (198) (196) 1.0% Capability build has
Slide 15: Wagering & Media Key Performance Indicators
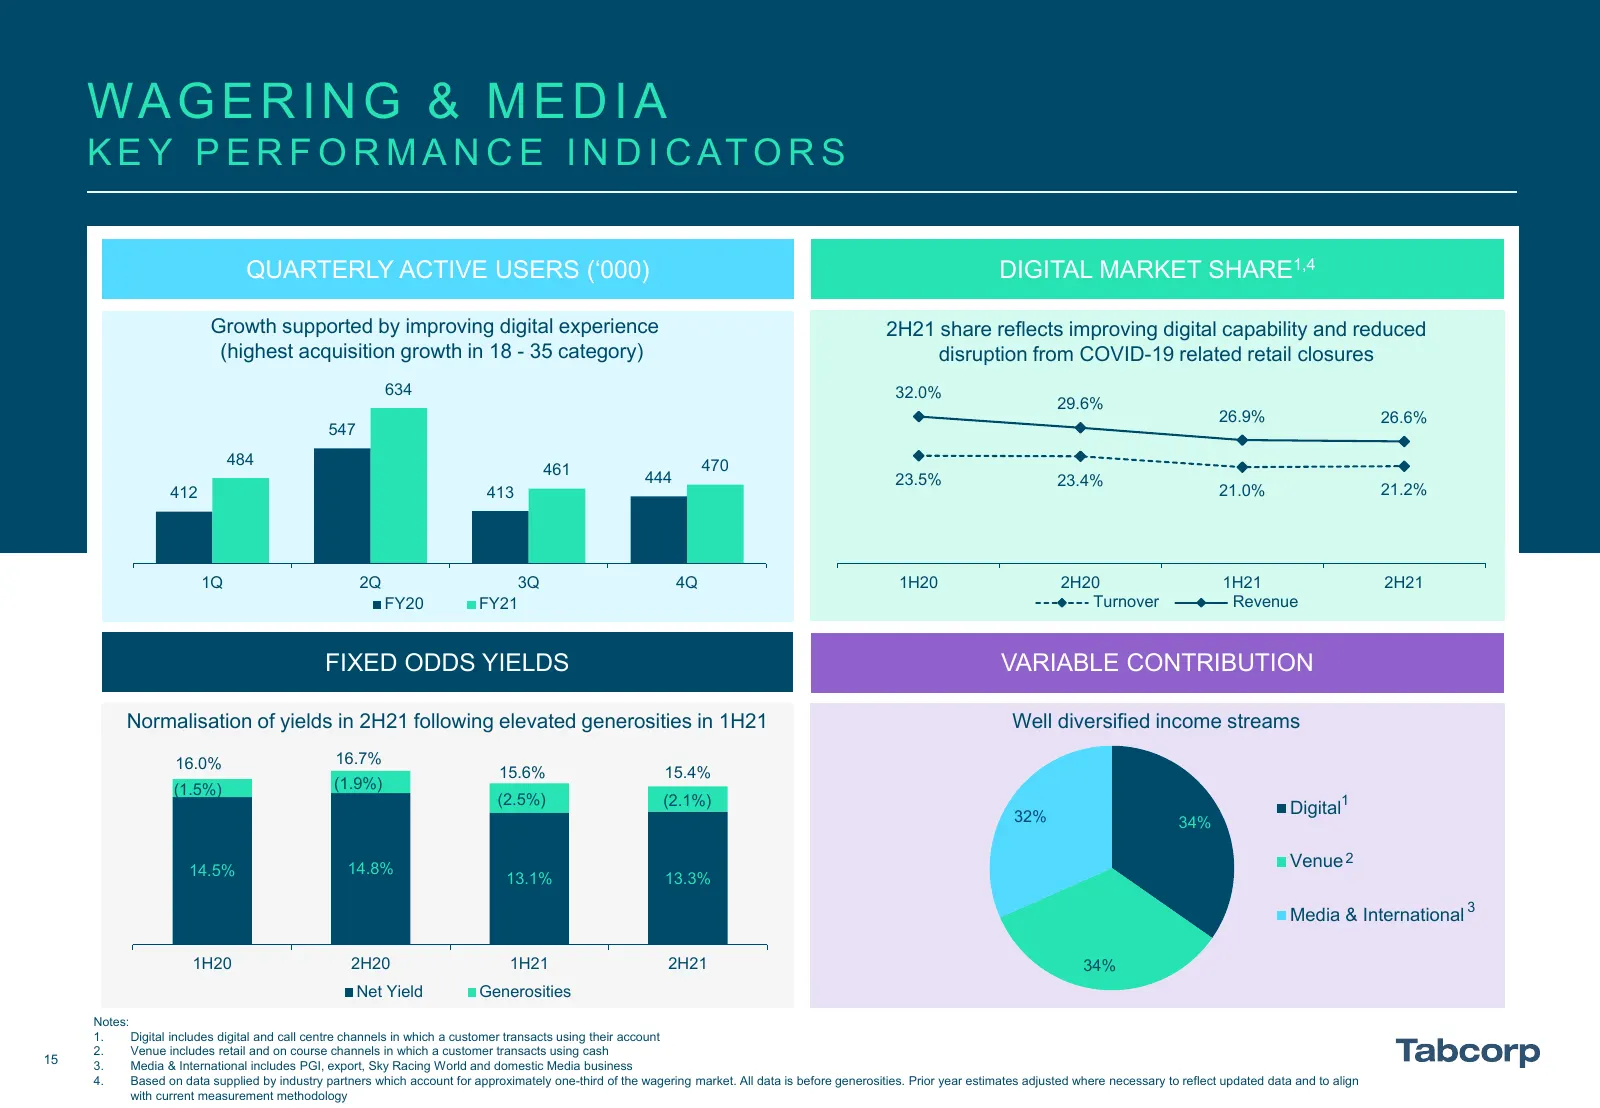
WA G E R I N G & M E D I A K E Y P E R F O R M A N C E I N D I C AT O R S QUARTERLY ACTIVE USERS (‘000) DIGITAL MARKET SHARE1,4 Growth supported by improving digital634experience 2H21 share reflects improving digital capability and reduced (highest acquisition growth in 18 - 35 category) disruption
Slide 16: Wagering & Media: Foundations Built and Capability Invested
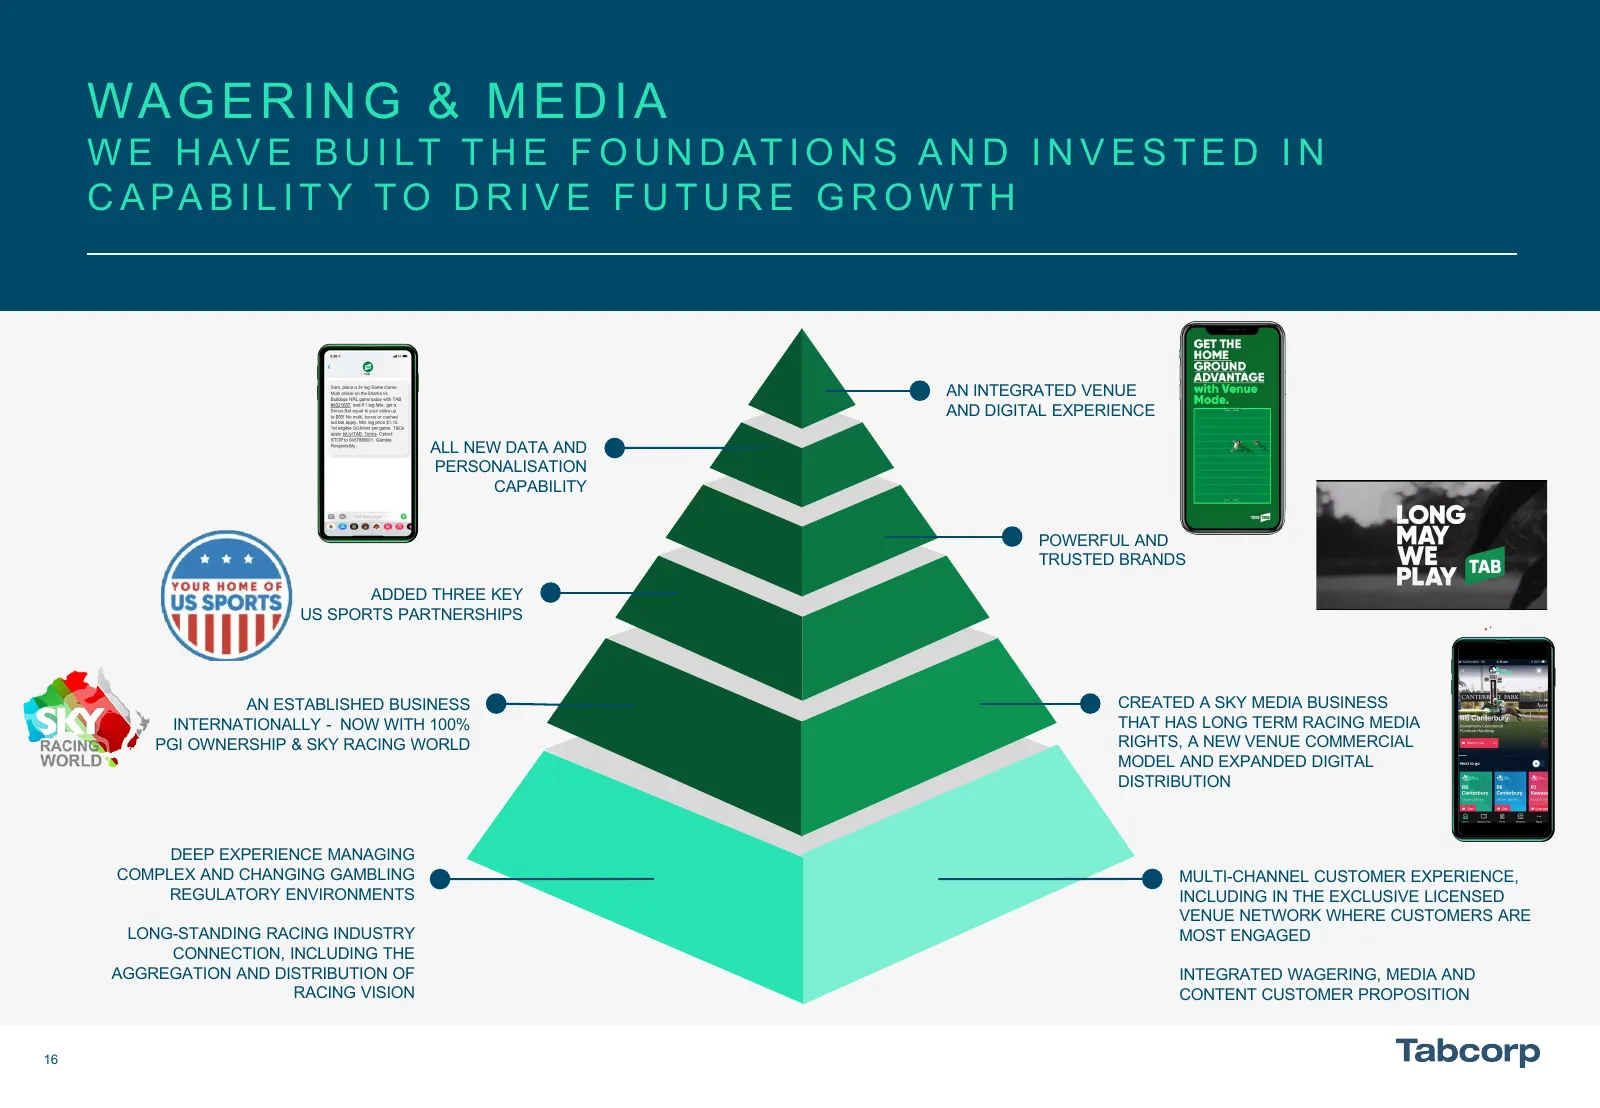
WA G E R I N G & M E D I A W E H AV E B U I LT T H E F O U N D AT I O N S A N D I N V E S T E D I N C A PA B I L I T Y T O D R I V E F U T U R E G R O W T H AN INTEGRATED VENUE AND DIGITAL EXPERIENCE ALL NEW DATA AND PERSONALISATION CAPABILITY POWERFUL AND TRUSTED BRANDS ADDED THREE KEY US SPORTS PA
Slide 17: Wagering & Media Key Growth Strategies
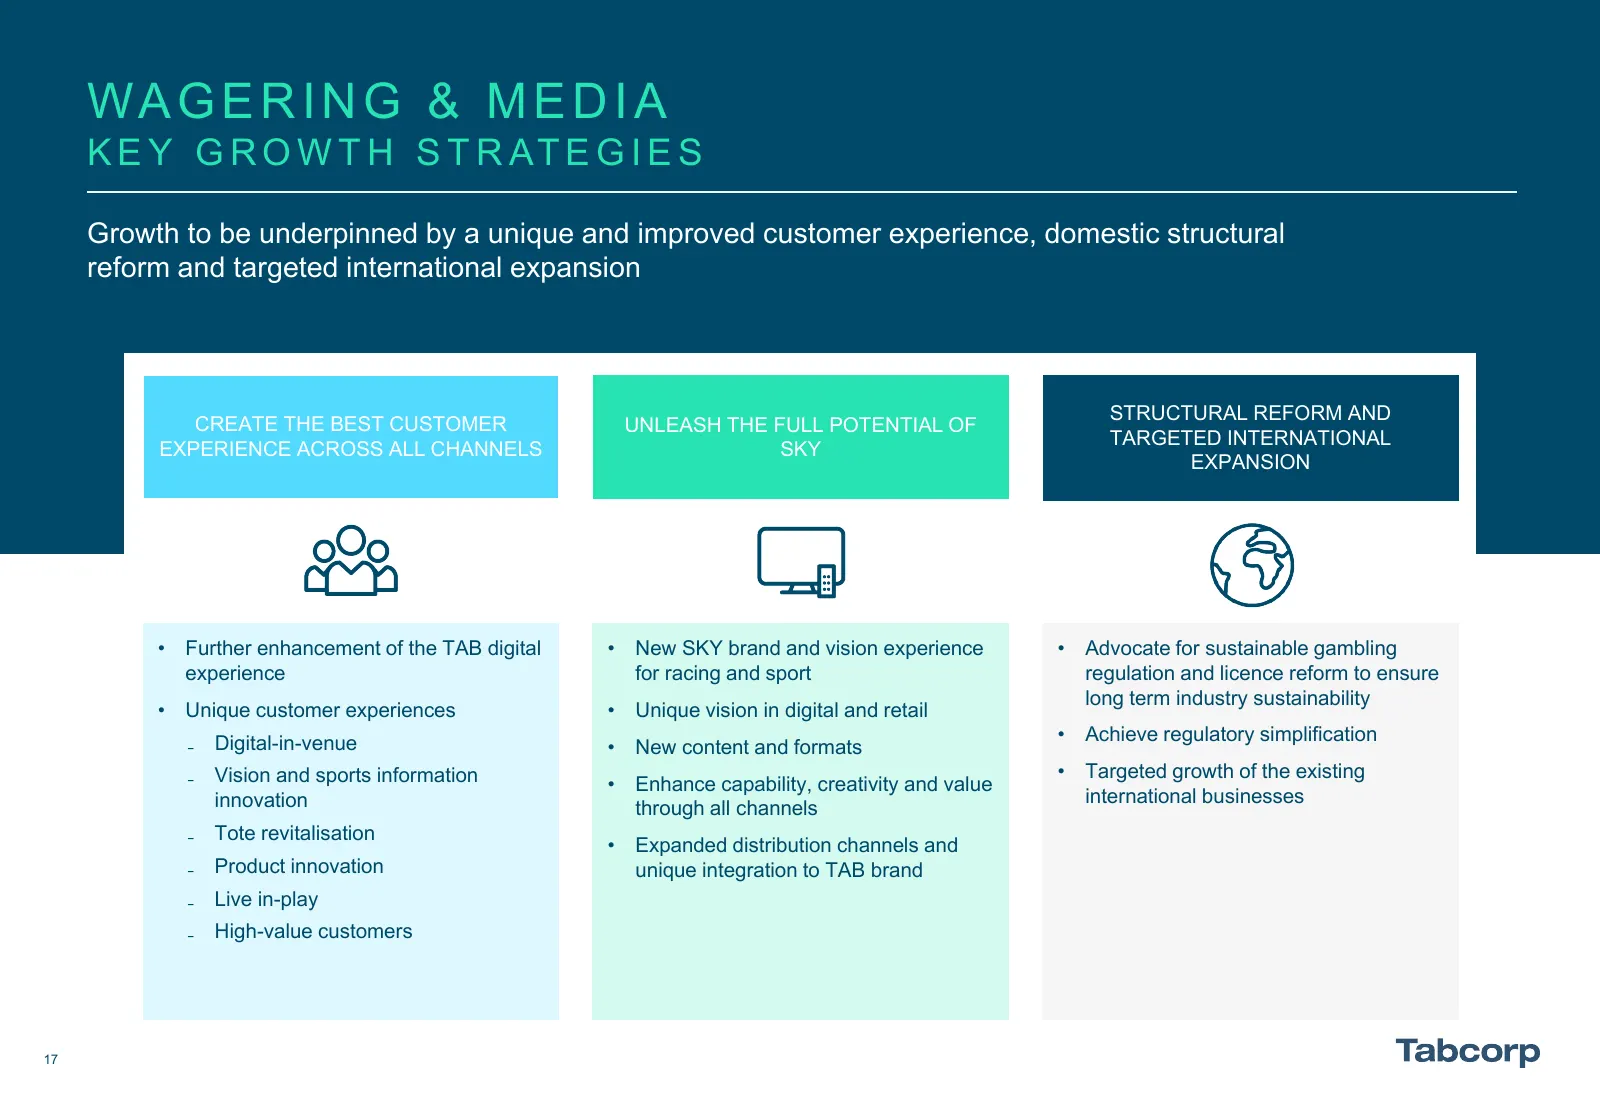
WA G E R I N G & M E D I A K E Y G R O W T H S T R AT E G I E S Growth to be underpinned by a unique and improved customer experience, domestic structural reform and targeted international expansion STRUCTURAL REFORM AND CREATE THE BEST CUSTOMER UNLEASH THE FULL POTENTIAL OF TARGETED INTERNATIONAL E
Slide 18: Gaming Services
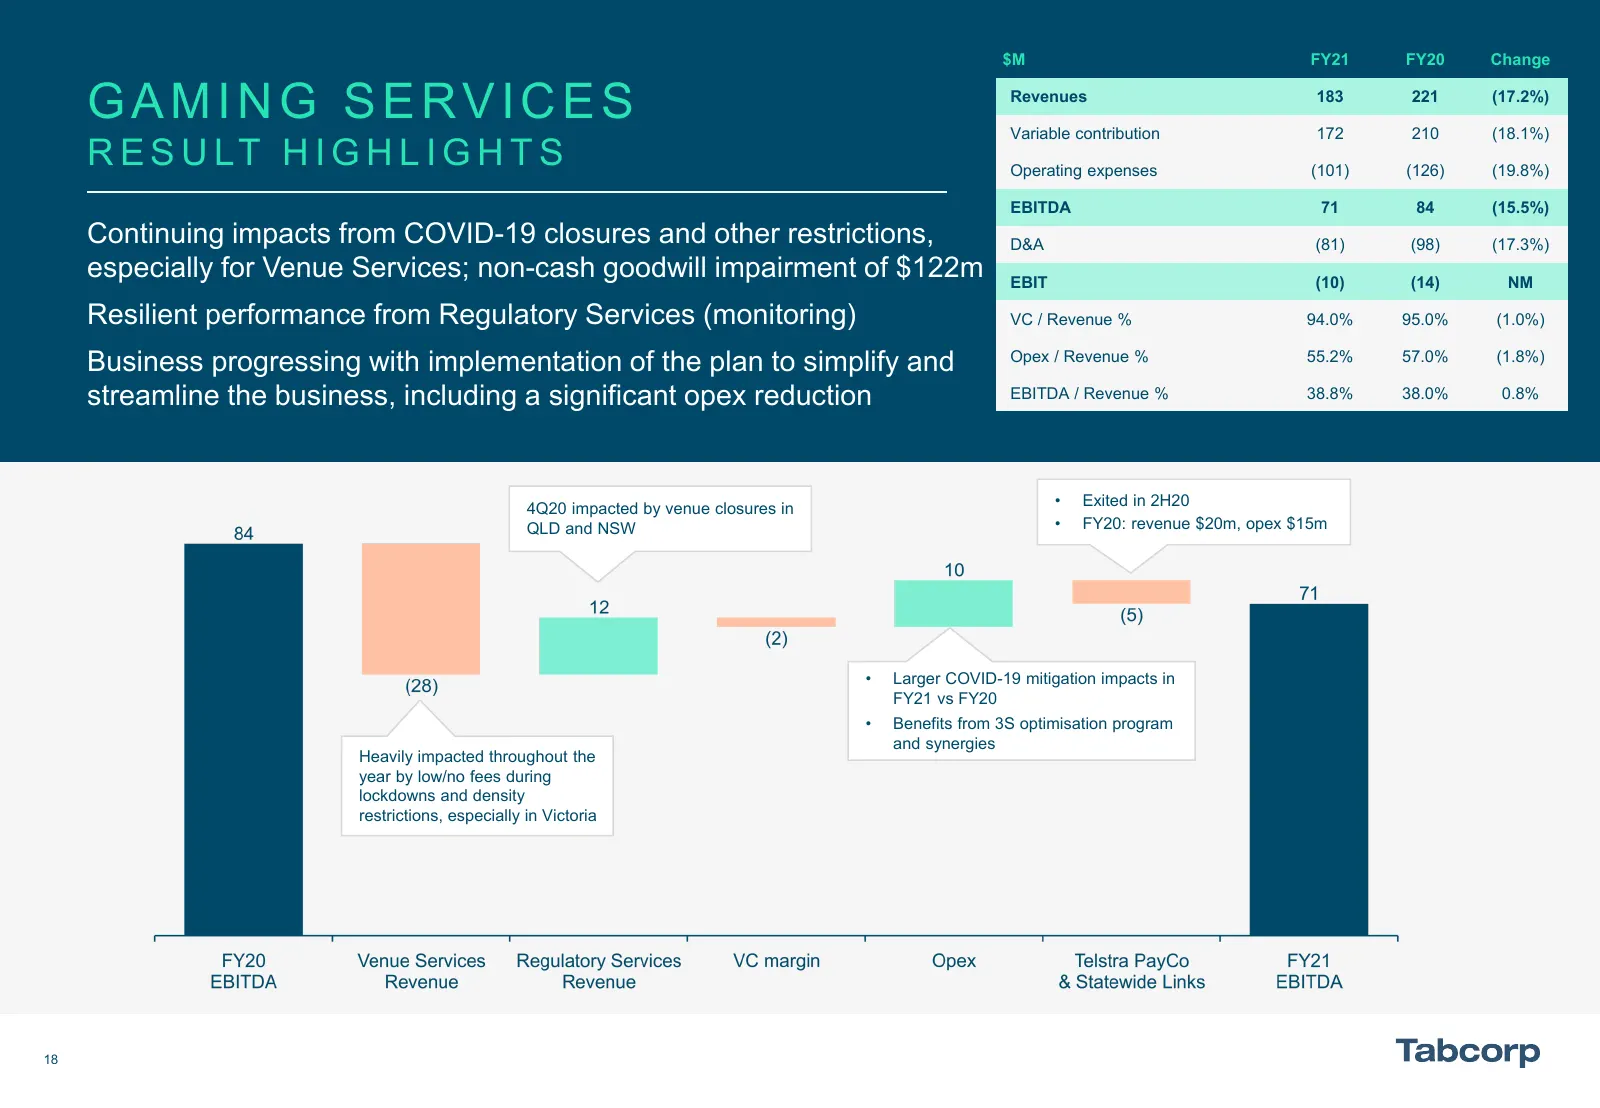
$M FY21 FY20 Change GAMING SERVICES Revenues Variable contribution 183 172 221 210 (17.2%) (18.1%) R E S U LT H I G H L I G H T S Operating expenses (101) (126) (19.8%) EBITDA 71 84 (15.5%) Continuing impacts from COVID-19 closures and other restrictions, D&A (81) (98) (17.3%) especially for Venue S
Slide 19: Gaming Services Key Strategies
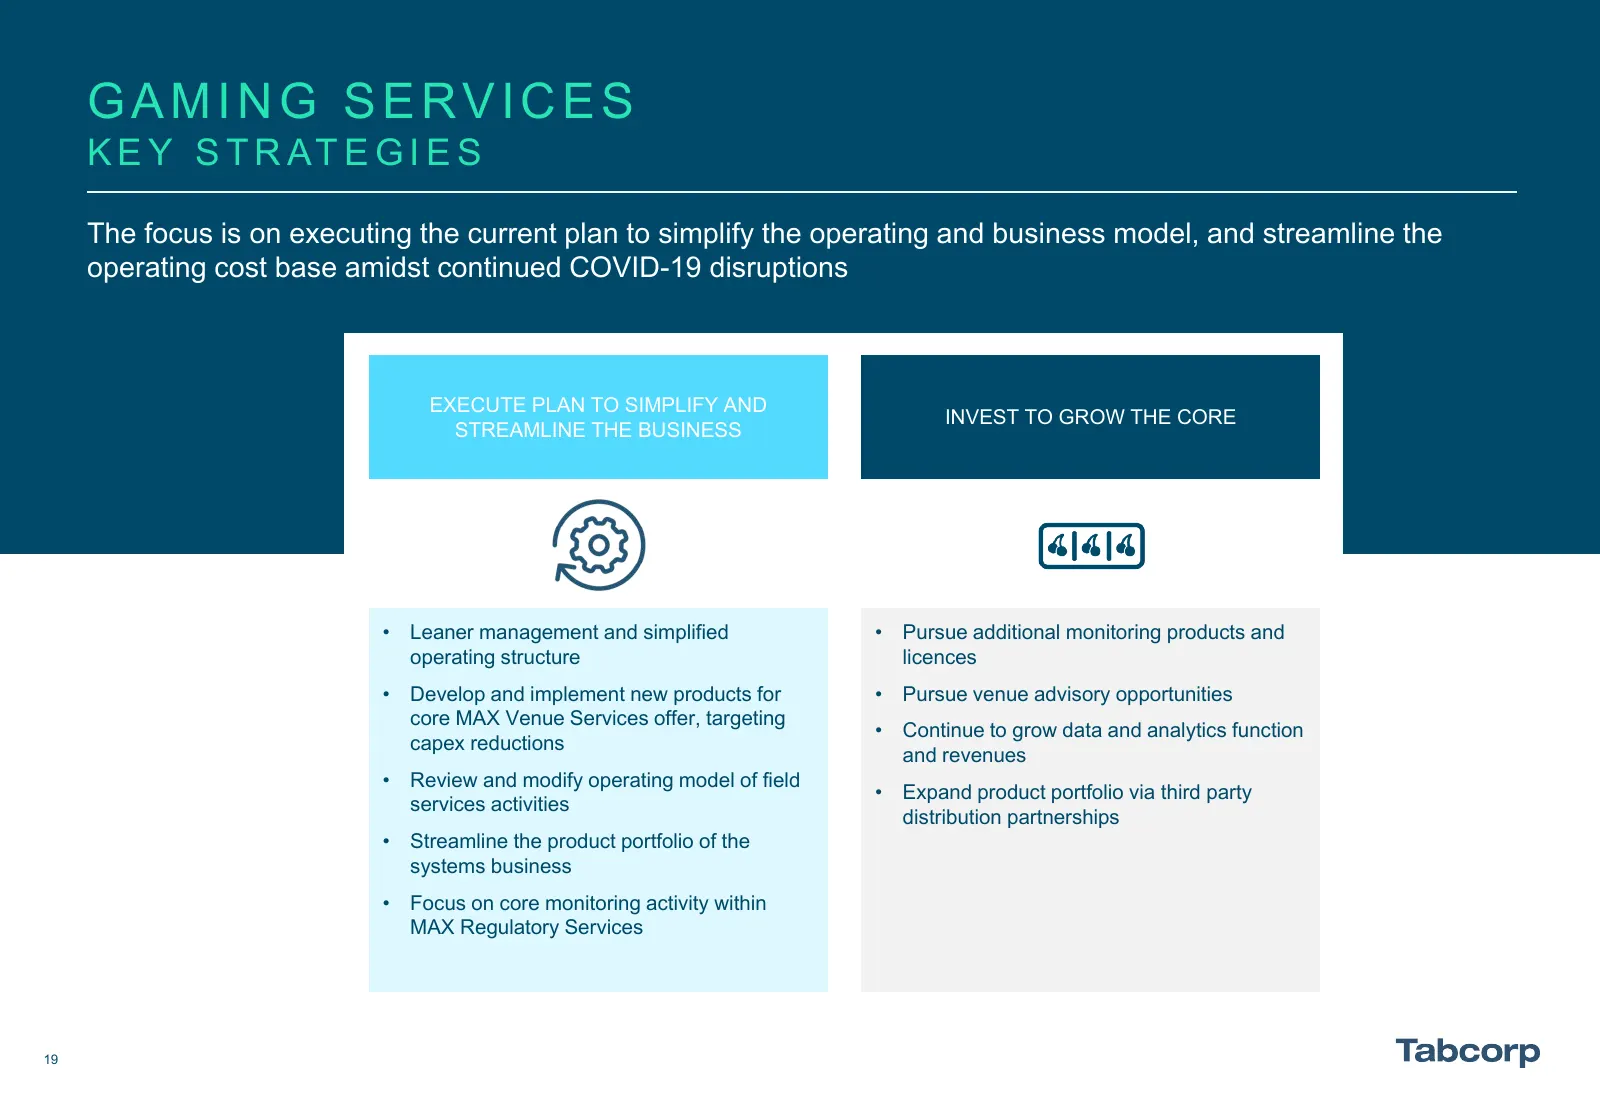
GAMING SERVICES K E Y S T R AT E G I E S The focus is on executing the current plan to simplify the operating and business model, and streamline the operating cost base amidst continued COVID-19 disruptions EXECUTE PLAN TO SIMPLIFY AND INVEST TO GROW THE CORE STREAMLINE THE BUSINESS • Leaner managem
Slide 20: Table of Contents
TA B L E O F CONTENTS 03 - 07 Group Overview 09 - 19 Business Results 21 - 22 Capital 24 - 26 Conclusion 28 - 36 Appendices
Slide 21: Cash Flow and Debt
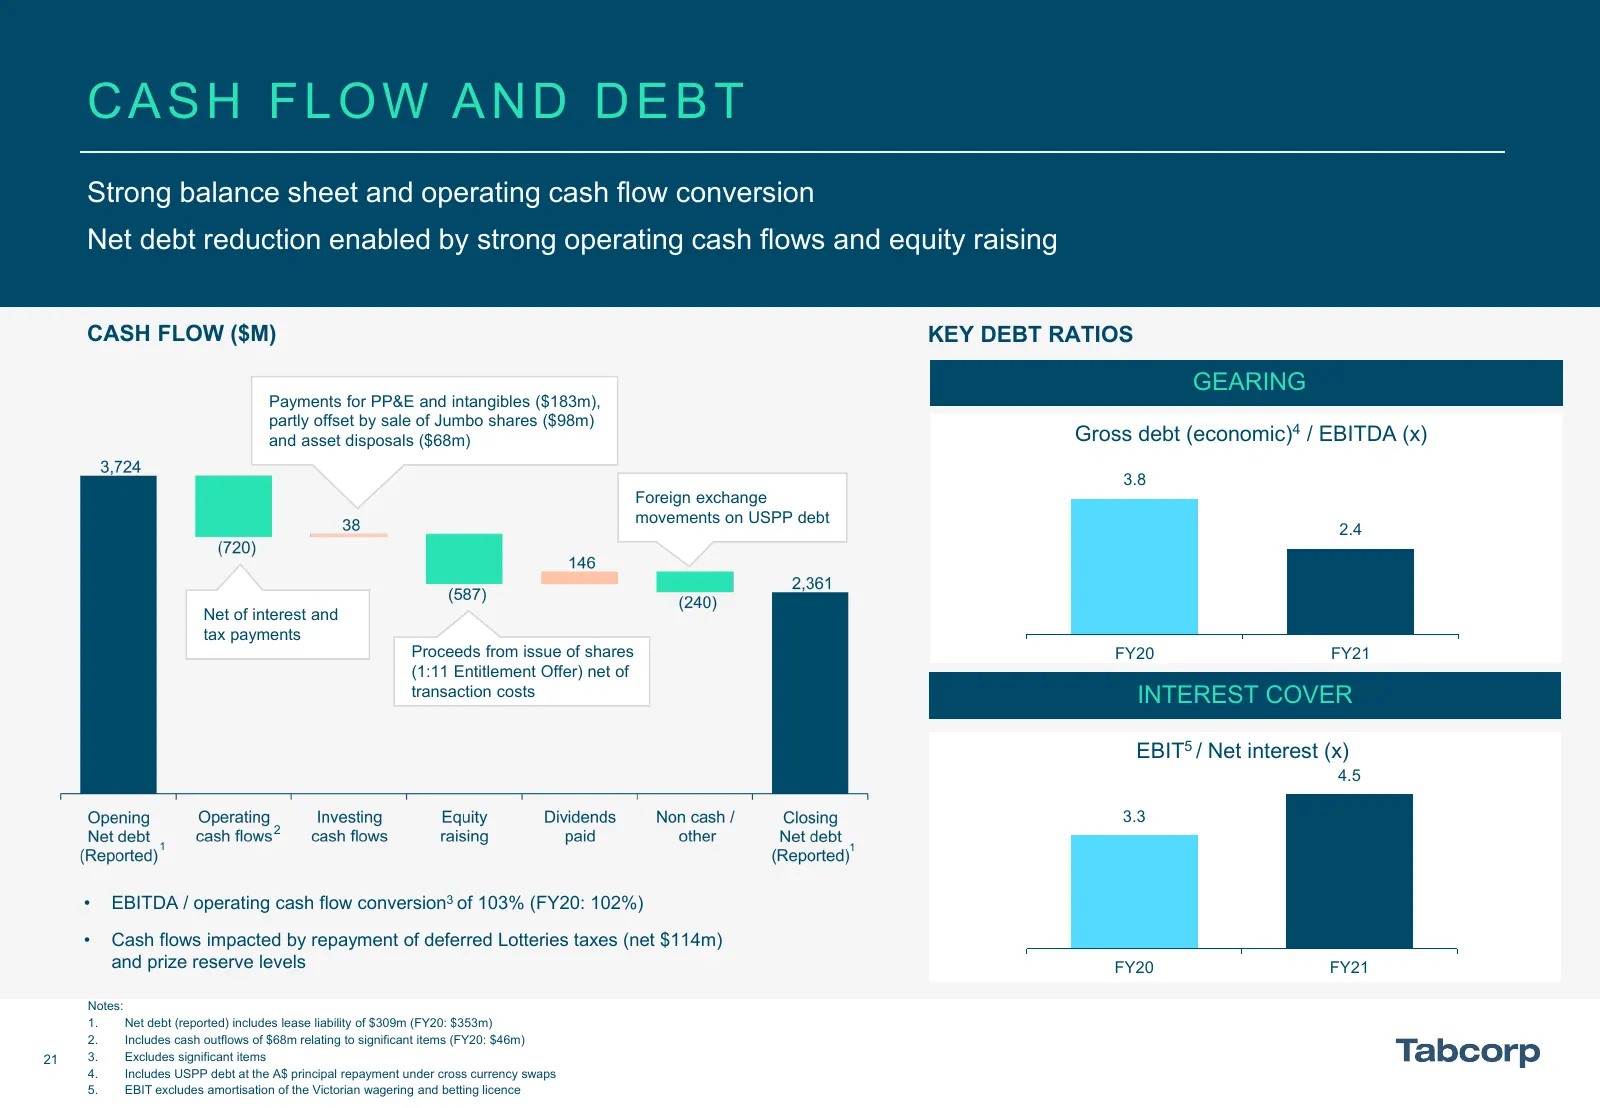
CASH FLOW AND DEBT Strong balance sheet and operating cash flow conversion Net debt reduction enabled by strong operating cash flows and equity raising CASH FLOW ($M) KEY DEBT RATIOS GEARING Payments for PP&E and intangibles ($183m), partly offset by sale of Jumbo shares ($98m) and asset disposals (
Slide 22: Debt Structure and Capital Expenditure
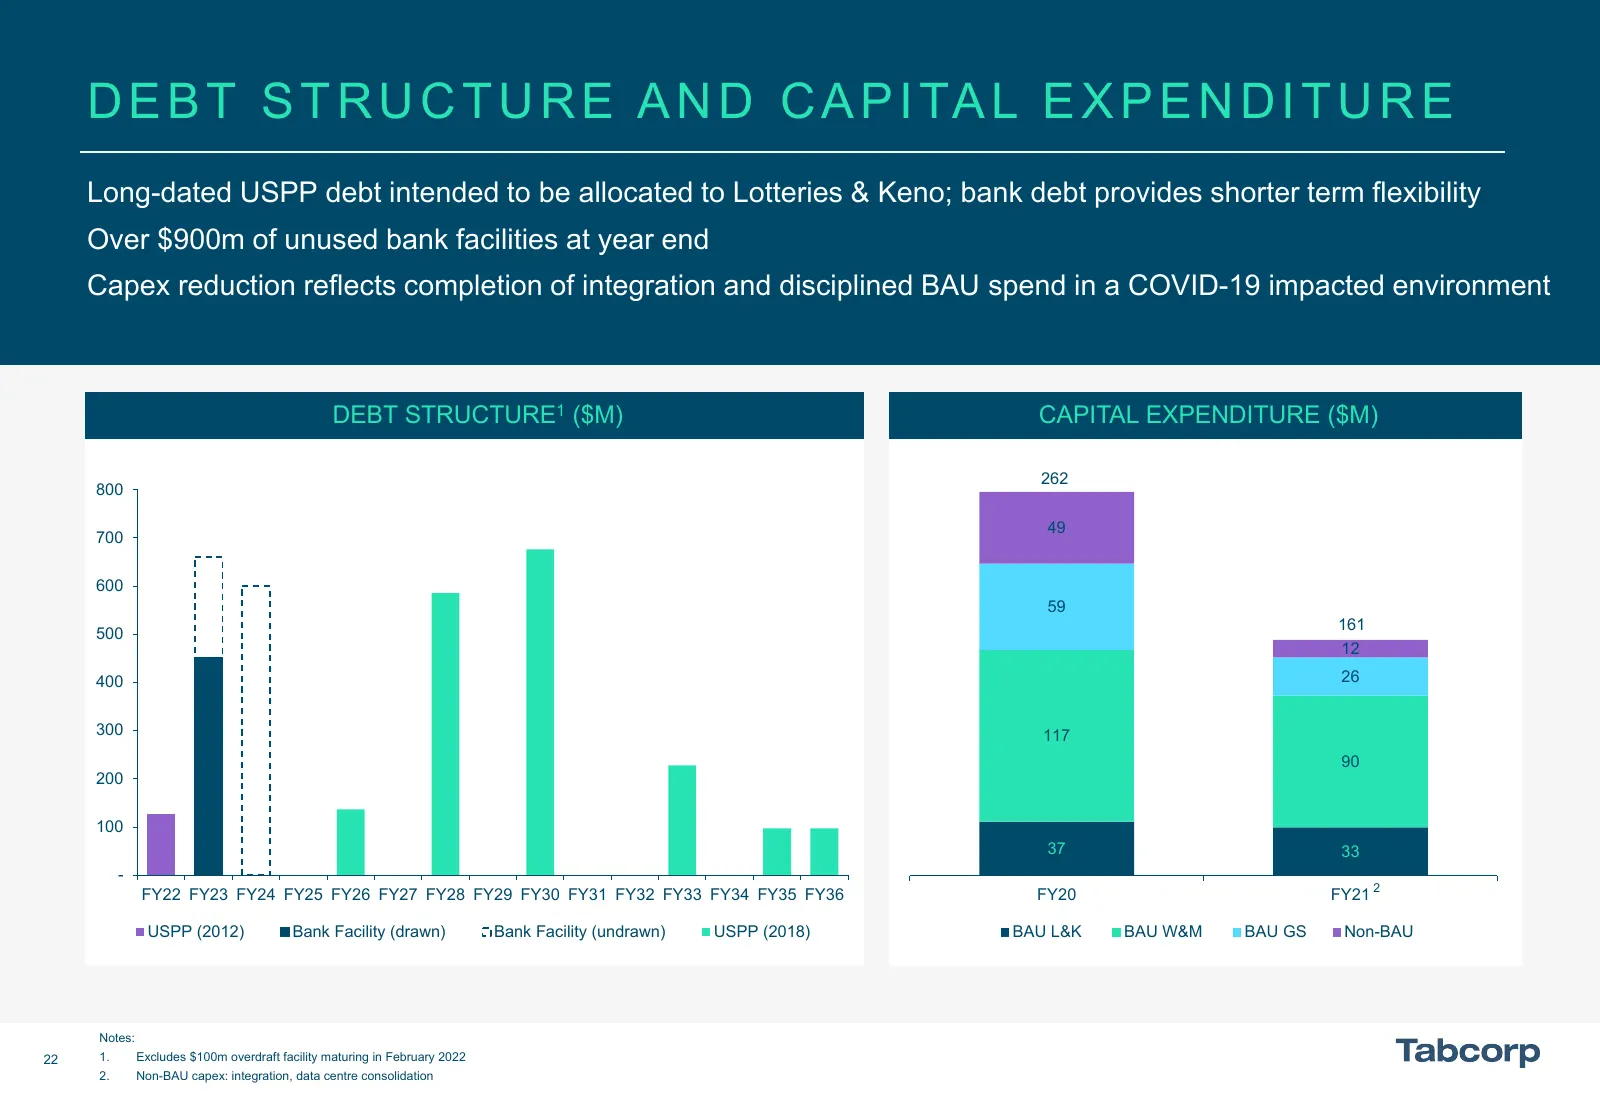
D E B T S T R U C T U R E A N D C A P I TA L E X P E N D I T U R E Long-dated USPP debt intended to be allocated to Lotteries & Keno; bank debt provides shorter term flexibility Over $900m of unused bank facilities at year end Capex reduction reflects completion of integration and disciplined BAU sp

Slide 23: Table of Contents
TA B L E O F CONTENTS 03 - 07 Group Overview 09 - 19 Business Results 21 - 22 Capital 24 - 26 Conclusion 28 - 36 Appendices
Slide 24: Trading Update: COVID-19 Impact on July 2021 Result
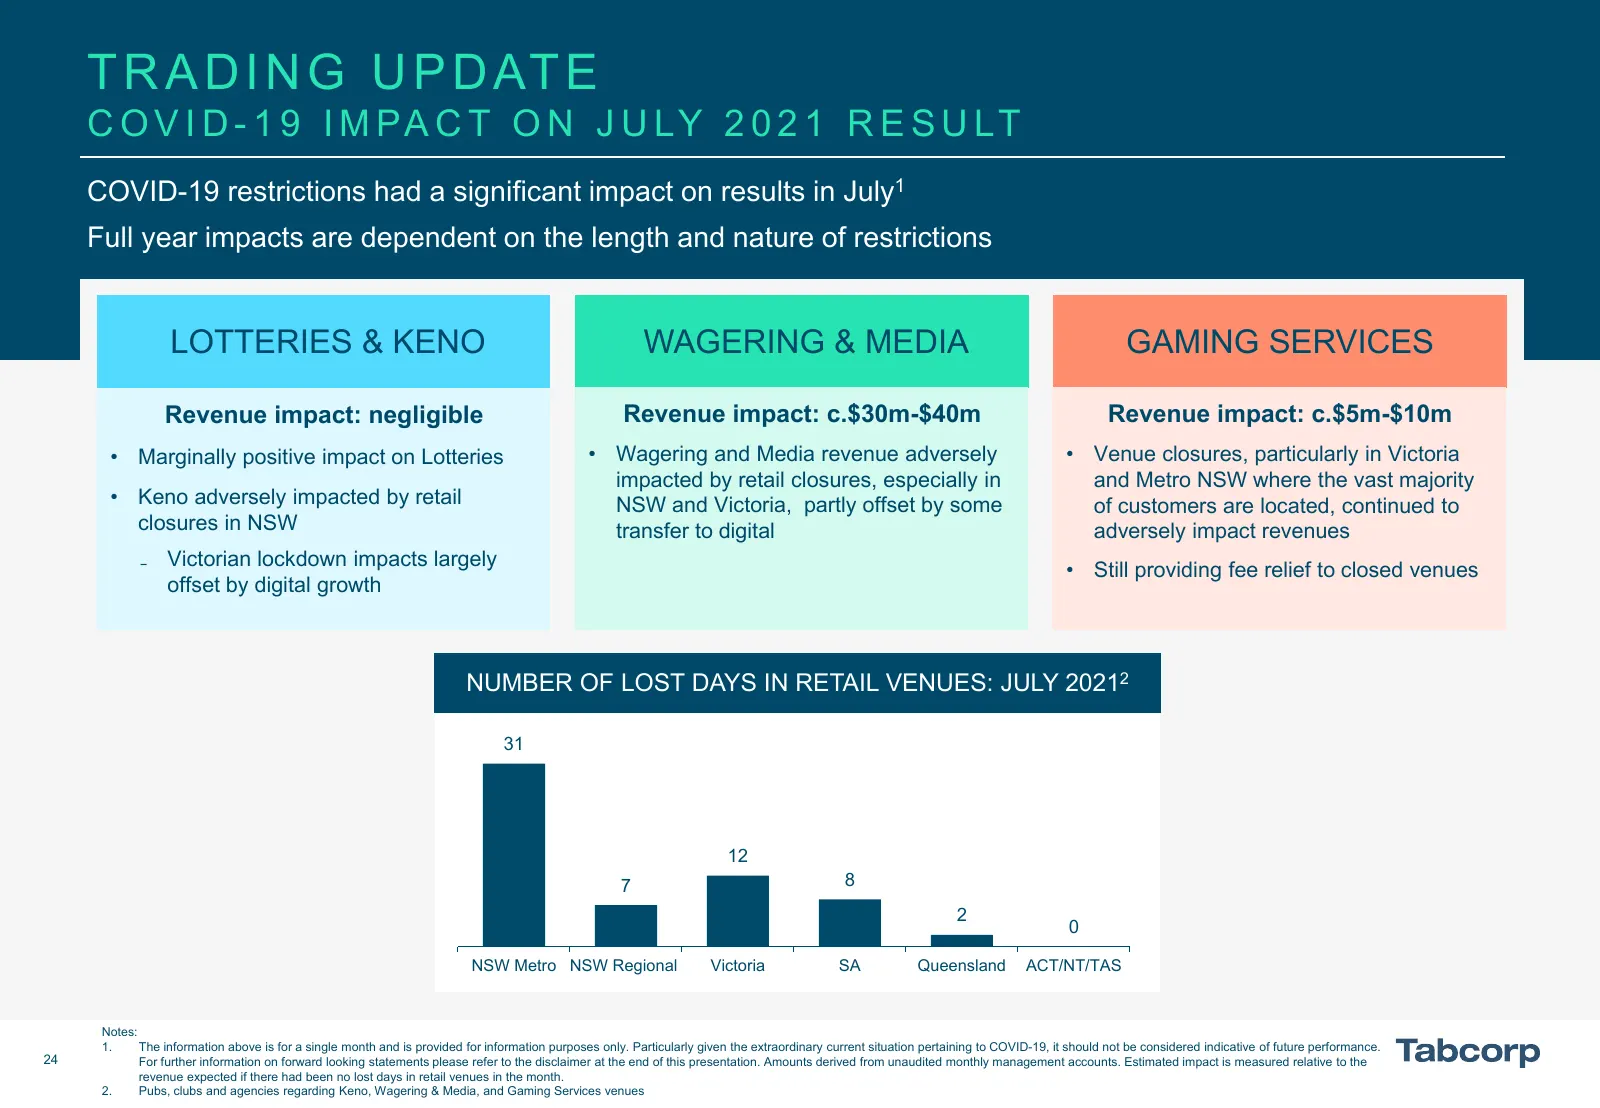
T R A D I N G U P D AT E C O V I D - 1 9 I M PA C T O N J U LY 2 0 2 1 R E S U LT COVID-19 restrictions had a significant impact on results in July1 Full year impacts are dependent on the length and nature of restrictions LOTTERIES & KENO WAGERING & MEDIA GAMING SERVICES Revenue impact: negligible R
Slide 25: Demerger Update
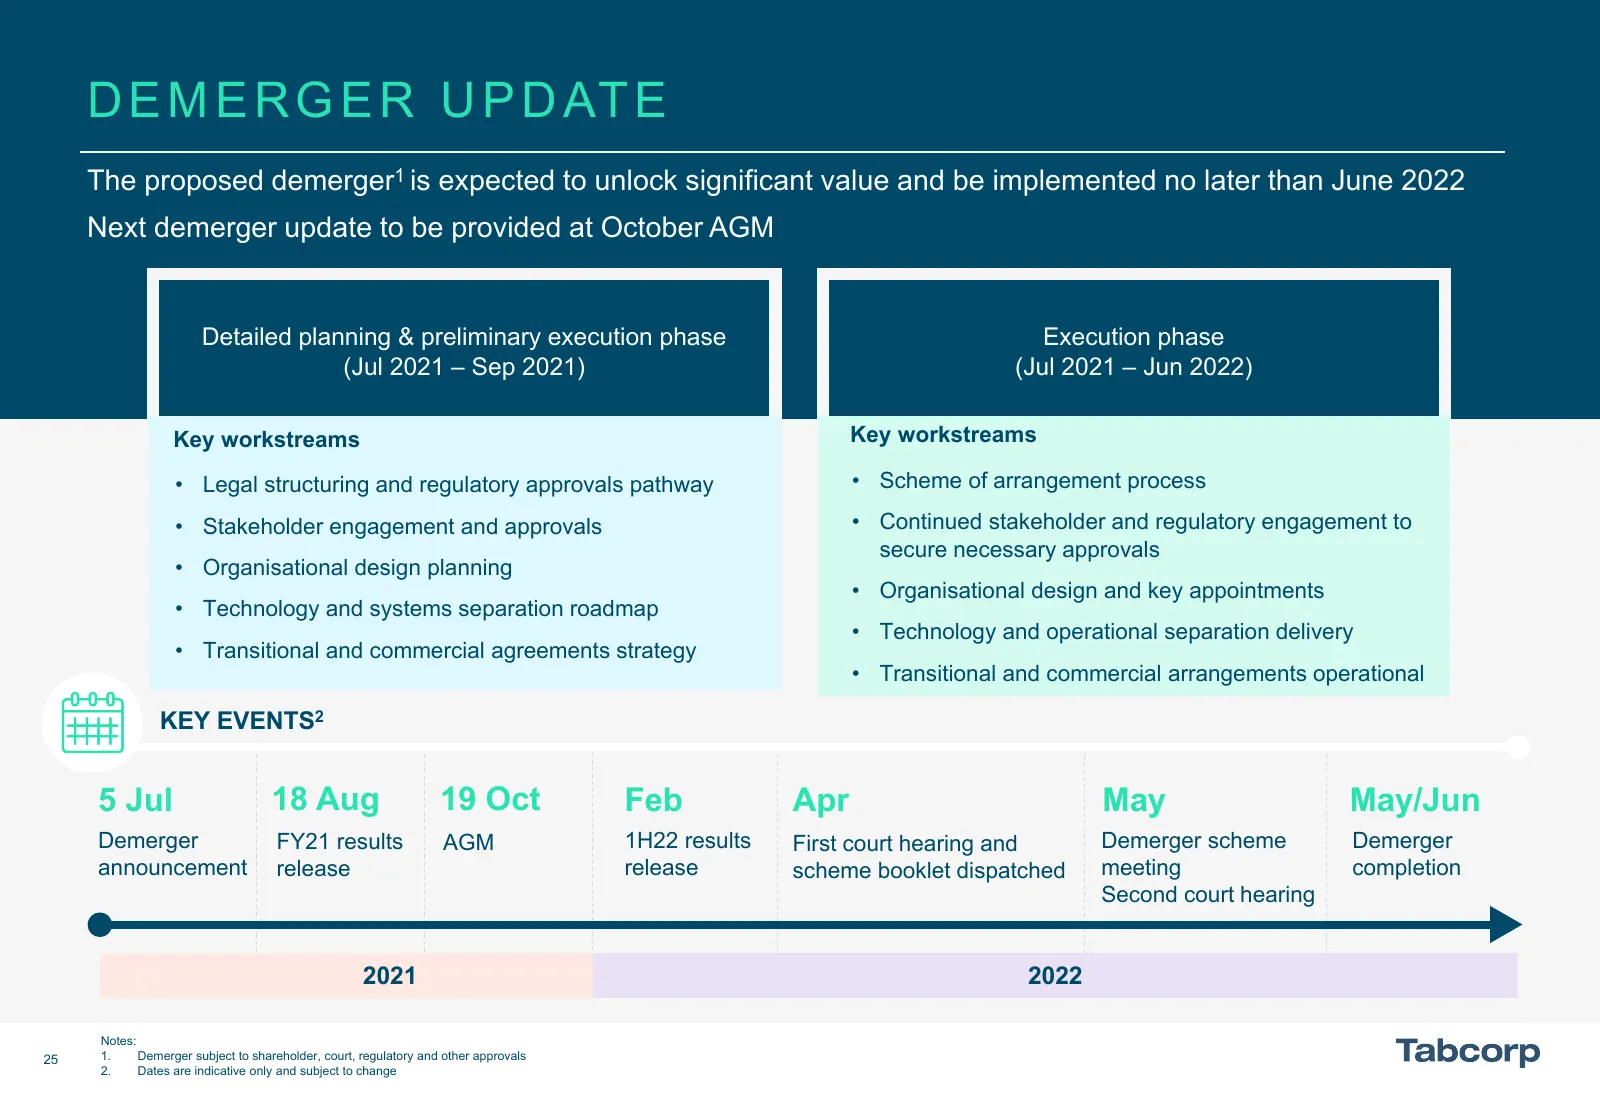
D E M E R G E R U P D AT E The proposed demerger1 is expected to unlock significant value and be implemented no later than June 2022 Next demerger update to be provided at October AGM Detailed planning & preliminary execution phase Execution phase (Jul 2021 – Sep 2021) (Jul 2021 – Jun 2022) Key work
Slide 26: Conclusion
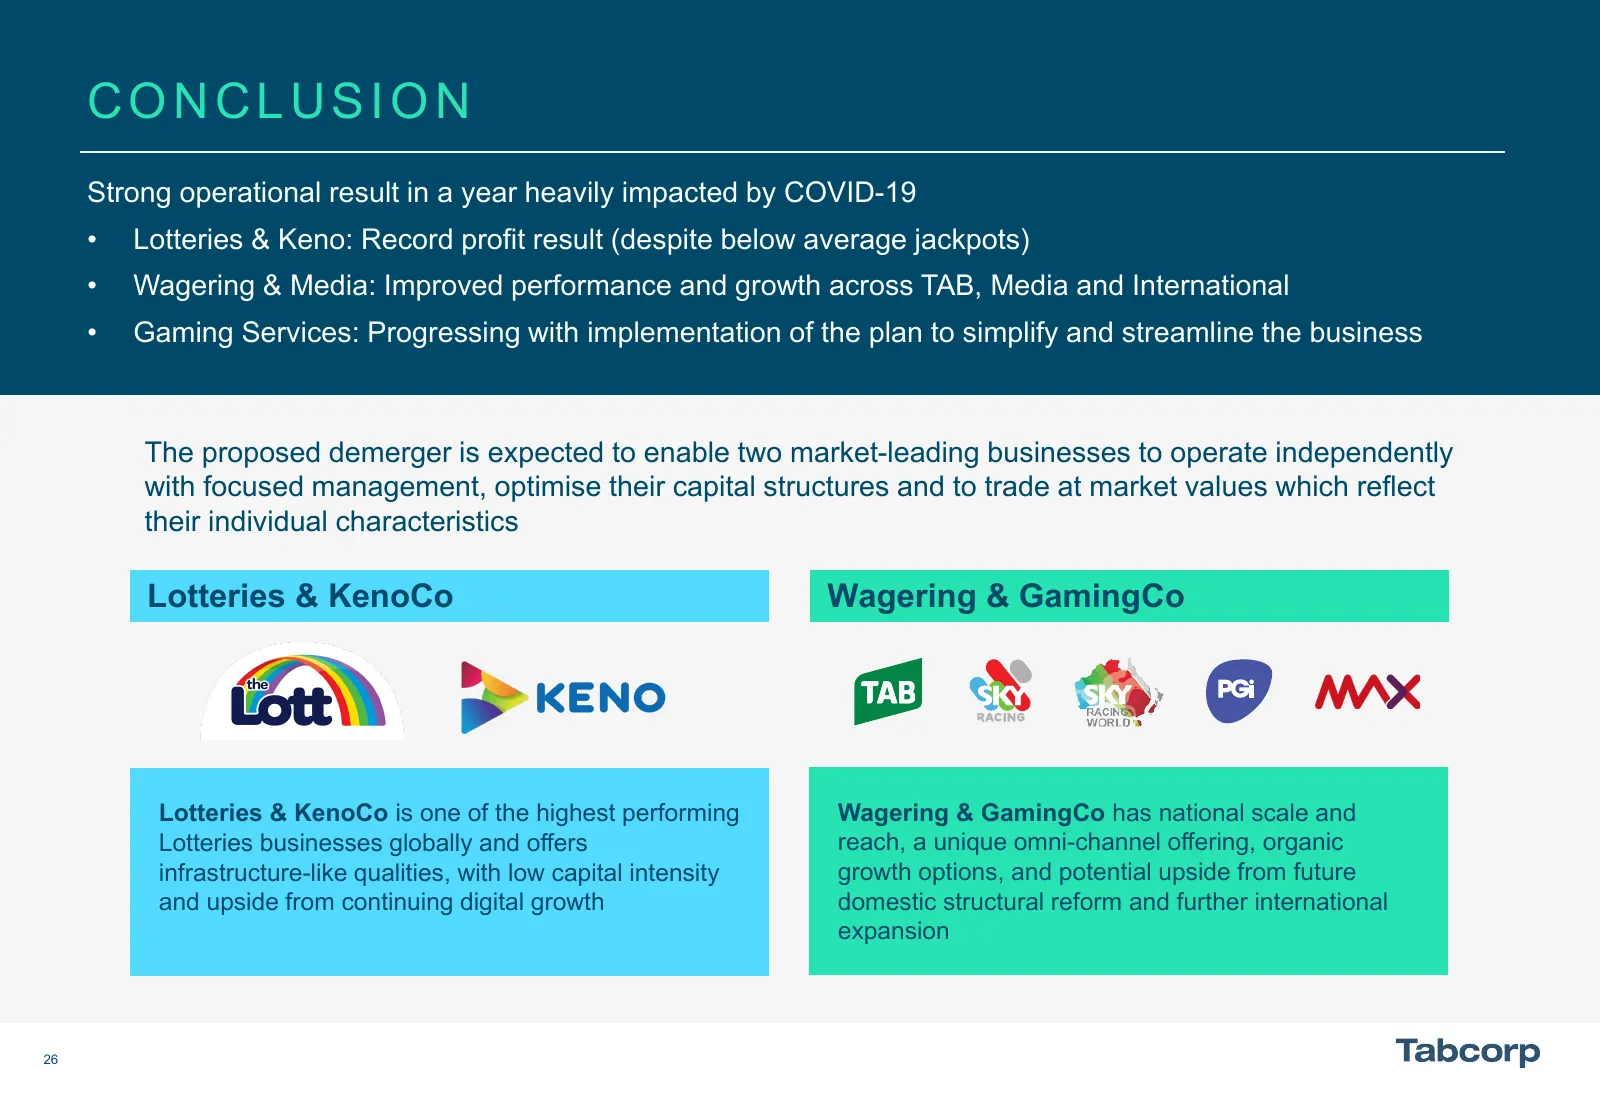
CONCLUSION Strong operational result in a year heavily impacted by COVID-19 • Lotteries & Keno: Record profit result (despite below average jackpots) • Wagering & Media: Improved performance and growth across TAB, Media and International • Gaming Services: Progressing with implementation of the plan
Slide 27: Table of Contents
TA B L E O F CONTENTS 03 - 07 Group Overview 09 - 19 Business Results 21 - 22 Capital 24 - 26 Conclusion 28 - 36 Appendices
Slide 28: Significant Items
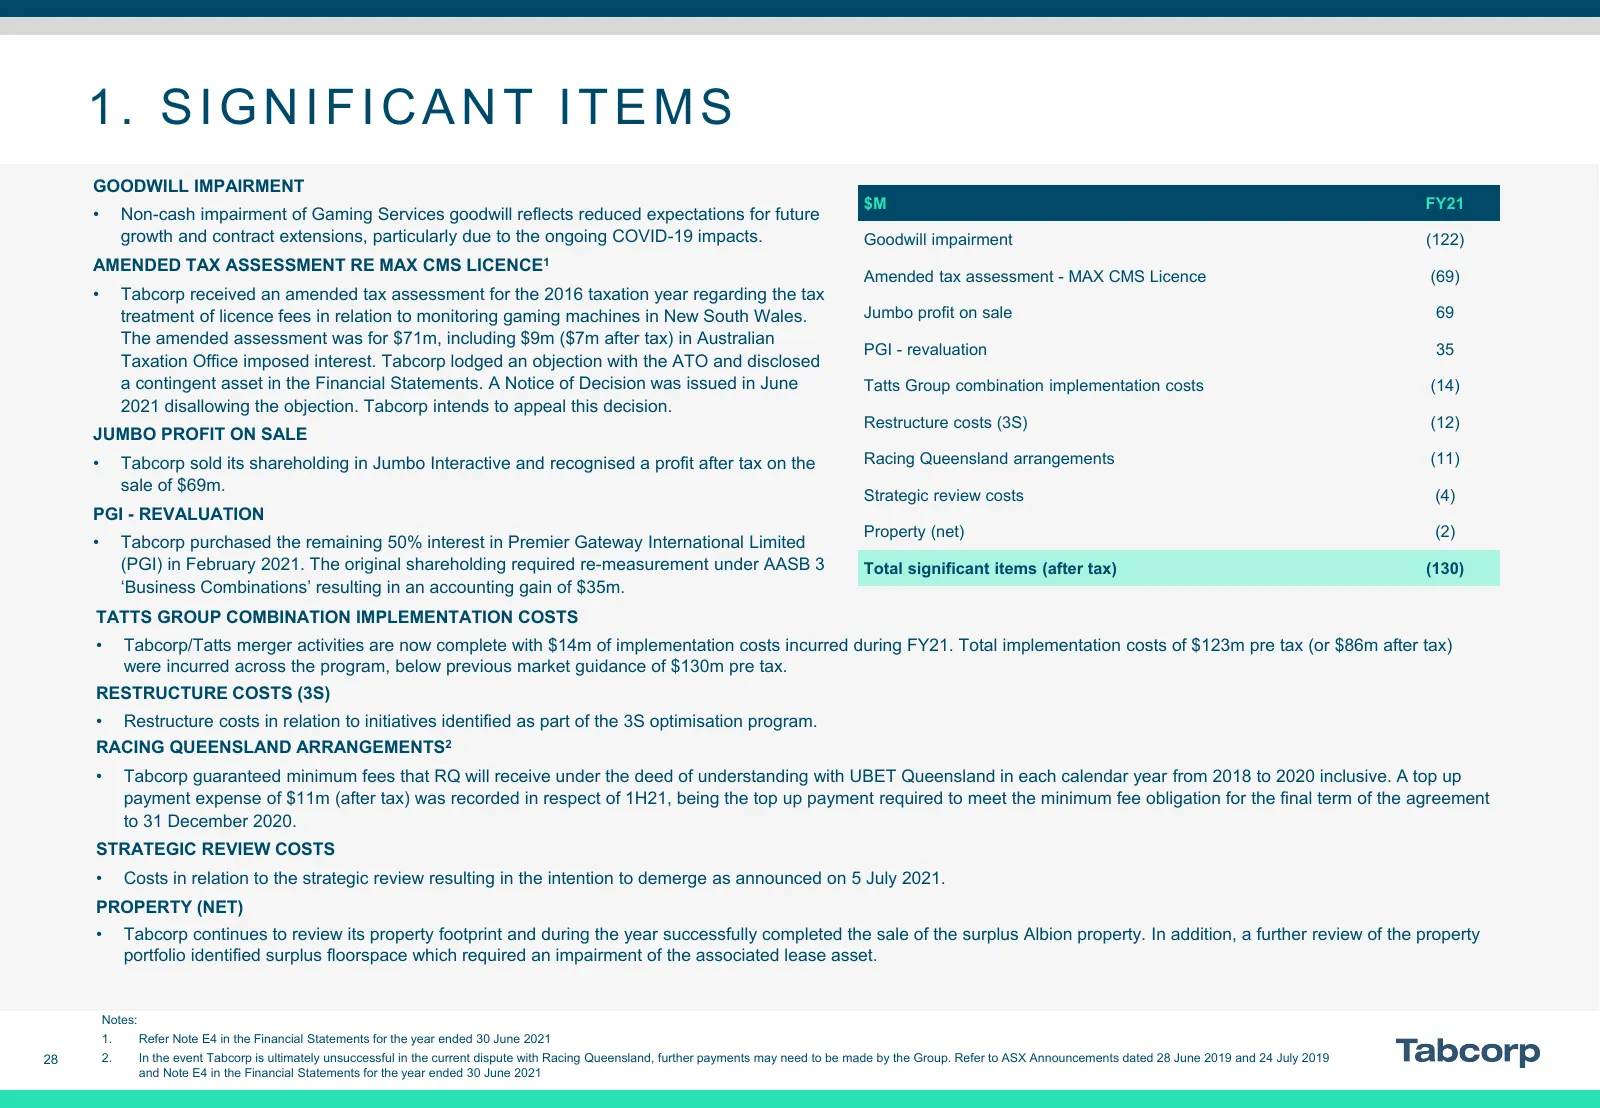
1. SIGNIFICANT ITEMS GOODWILL IMPAIRMENT $M FY21 • Non-cash impairment of Gaming Services goodwill reflects reduced expectations for future growth and contract extensions, particularly due to the ongoing COVID-19 impacts. Goodwill impairment (122) AMENDED TAX ASSESSMENT RE MAX CMS LICENCE1 Amended t
Slide 29: Group Operating Expenses
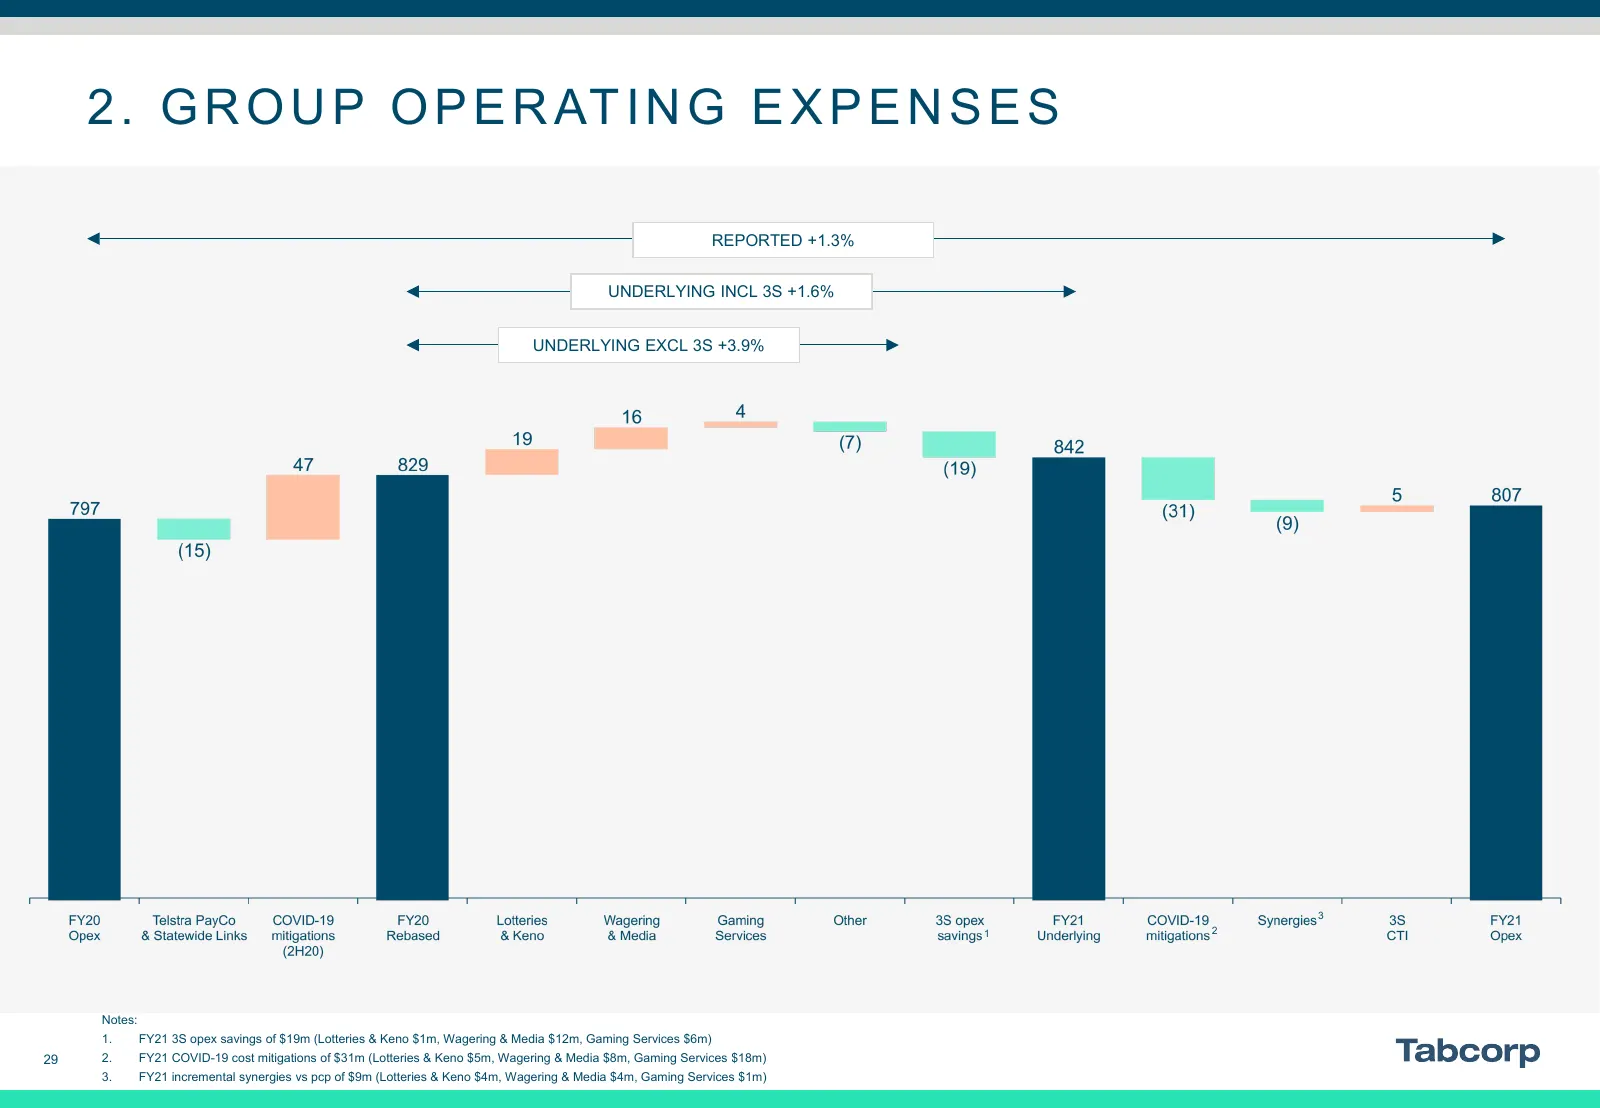
2 . G R O U P O P E R AT I N G E X P E N S E S REPORTED +1.3% UNDERLYING INCL 3S +1.6% UNDERLYING EXCL 3S +3.9% 3 1 2 Notes: 1. FY21 3S opex savings of $19m (Lotteries & Keno $1m, Wagering & Media $12m, Gaming Services $6m) 29 2. FY21 COVID-19 cost mitigations of $31m (Lotteries & Keno $5m, Wagering
Slide 30: Group Results
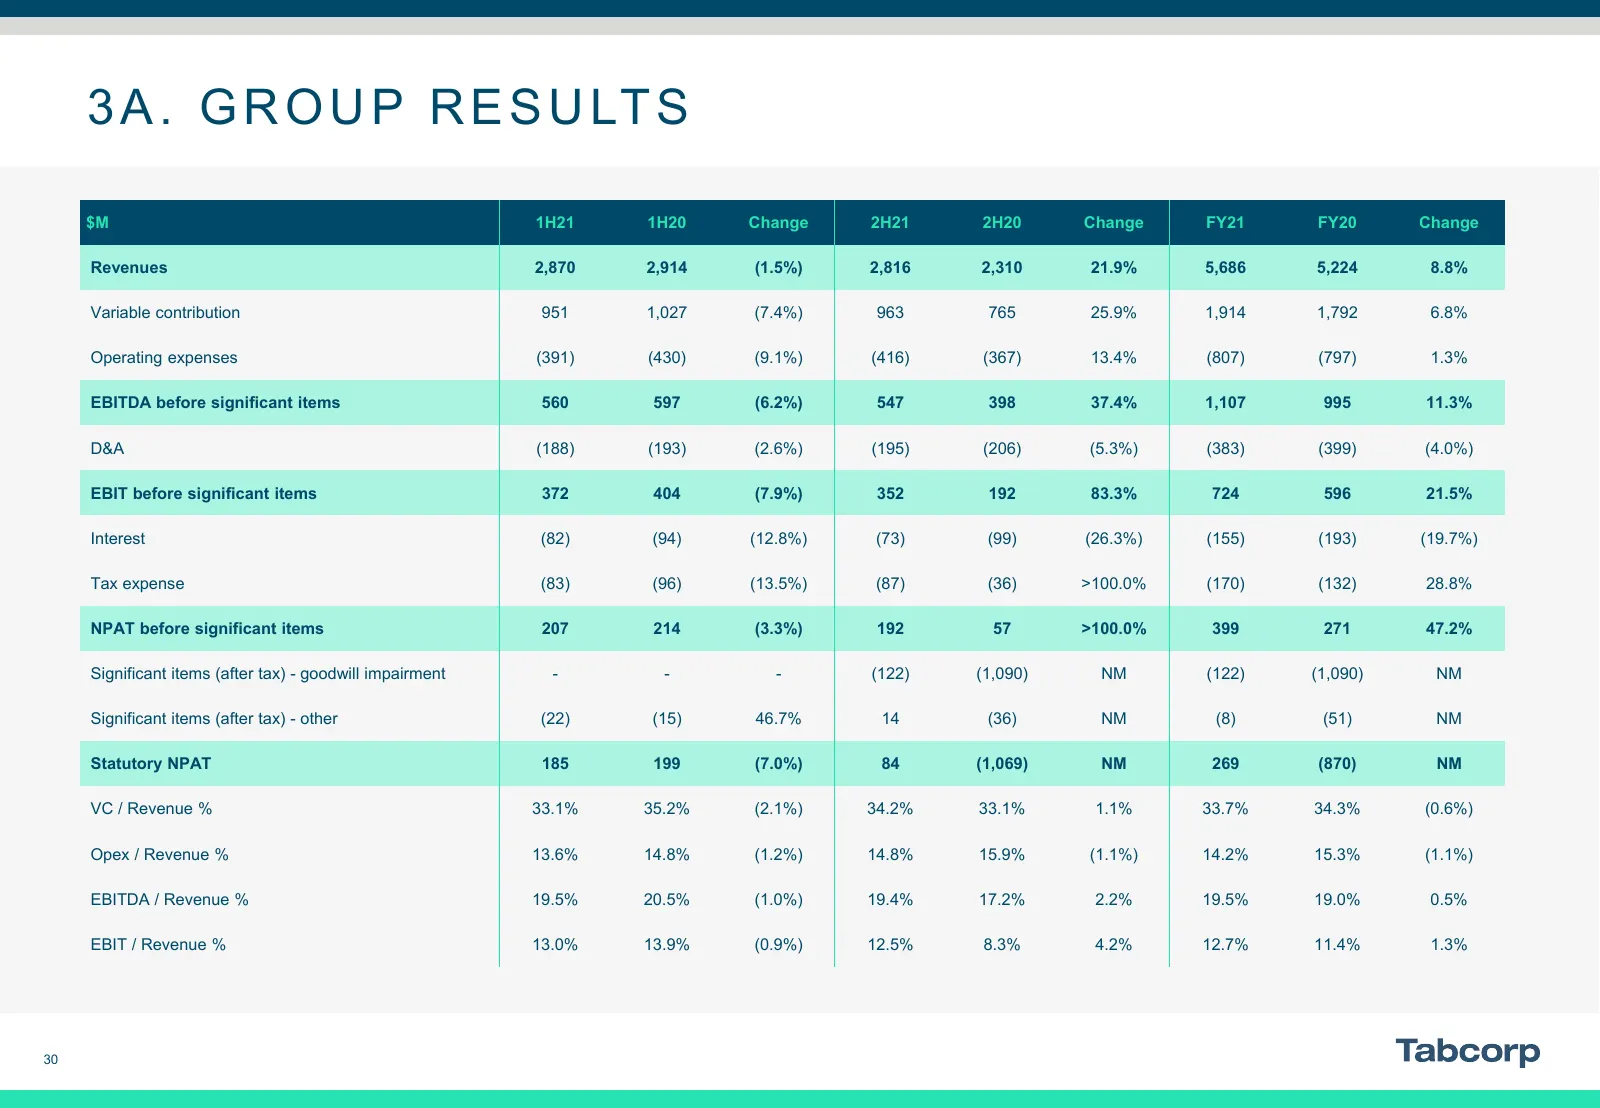
3 A . G R O U P R E S U LT S $M 1H21 1H20 Change 2H21 2H20 Change FY21 FY20 Change Revenues 2,870 2,914 (1.5%) 2,816 2,310 21.9% 5,686 5,224 8.8% Variable contribution 951 1,027 (7.4%) 963 765 25.9% 1,914 1,792 6.8% Operating expenses (391) (430) (9.1%) (416) (367) 13.4% (807) (797) 1.3% EBITDA befo
Slide 31: Lotteries & Keno Results
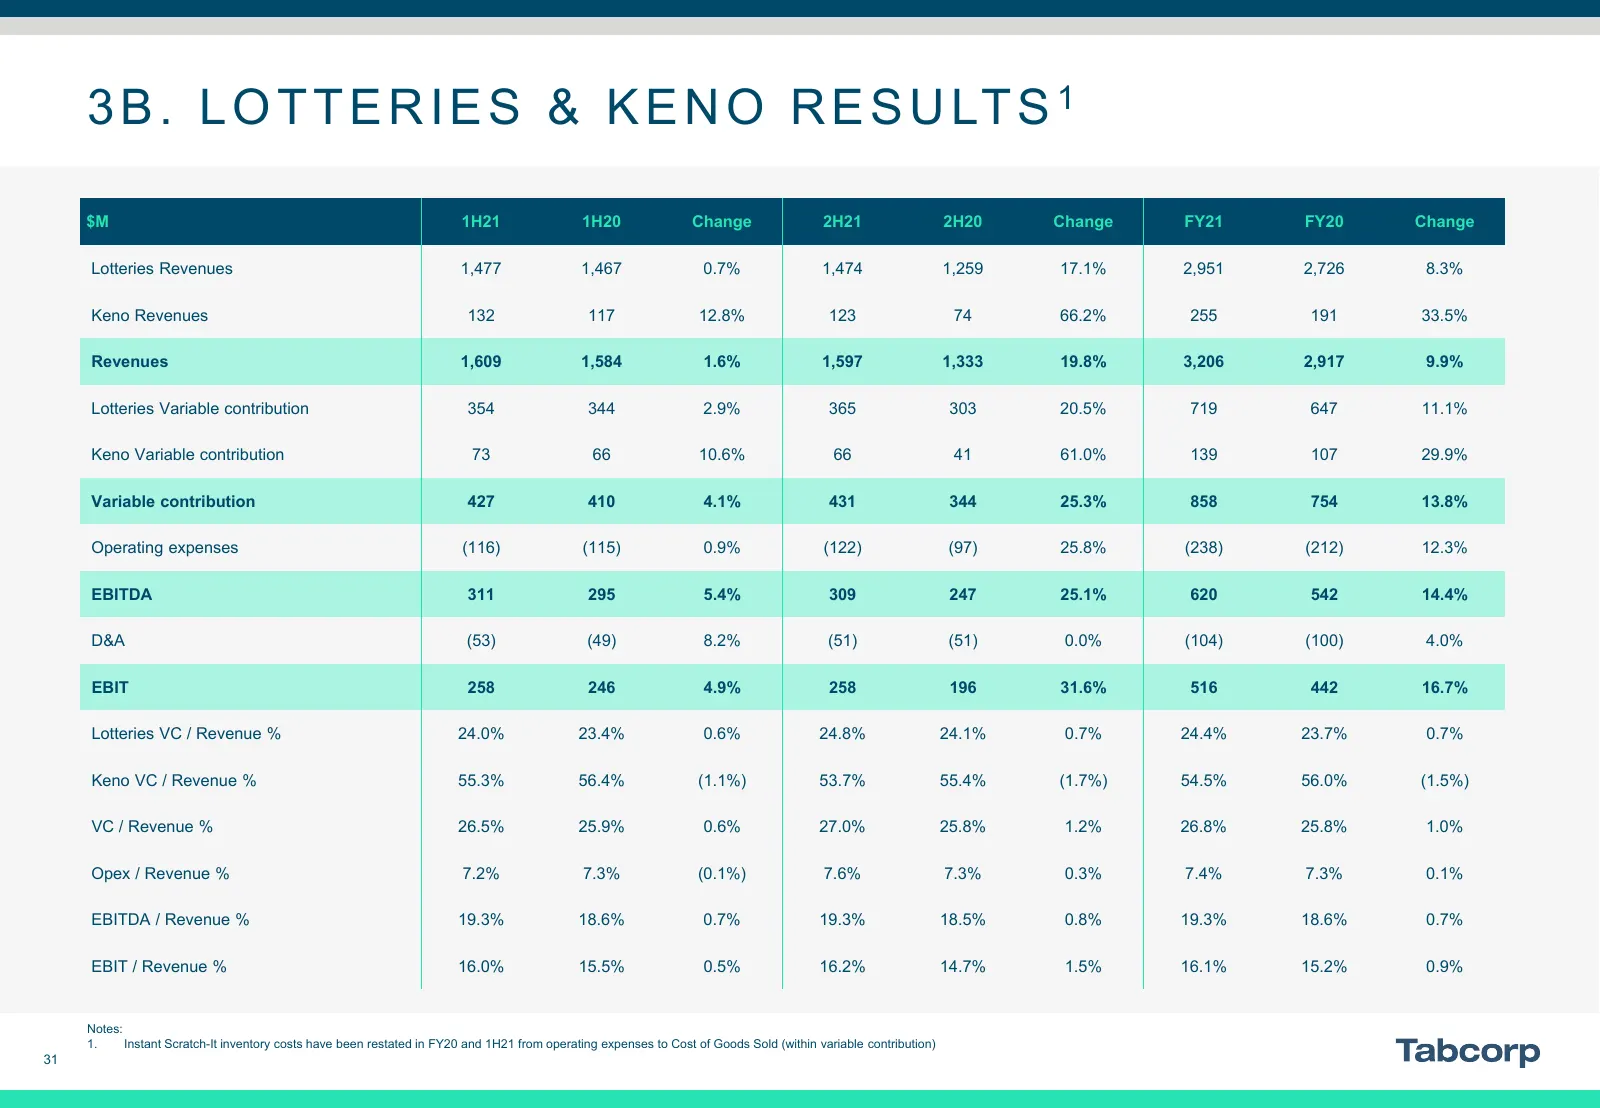
3 B . L O T T E R I E S & K E N O R E S U LT S 1 $M 1H21 1H20 Change 2H21 2H20 Change FY21 FY20 Change Lotteries Revenues 1,477 1,467 0.7% 1,474 1,259 17.1% 2,951 2,726 8.3% Keno Revenues 132 117 12.8% 123 74 66.2% 255 191 33.5% Revenues 1,609 1,584 1.6% 1,597 1,333 19.8% 3,206 2,917 9.9% Lotteries
Slide 32: Wagering & Media Results
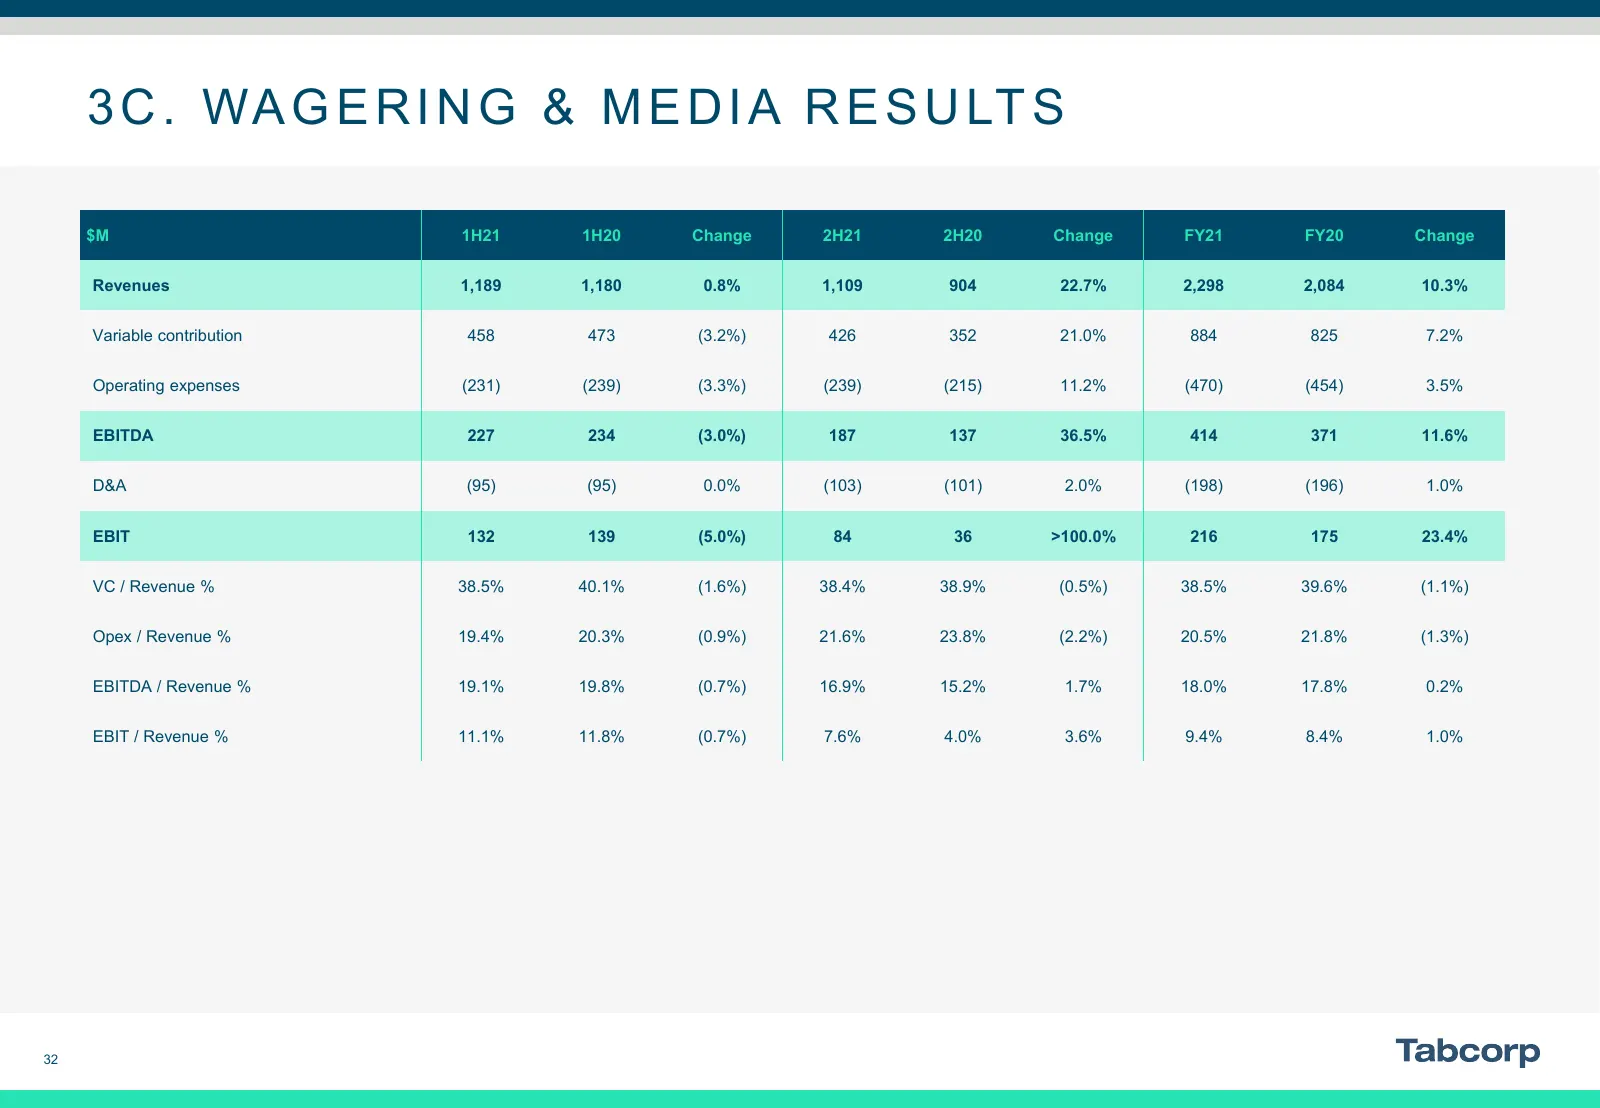
3 C . WA G E R I N G & M E D I A R E S U LT S $M 1H21 1H20 Change 2H21 2H20 Change FY21 FY20 Change Revenues 1,189 1,180 0.8% 1,109 904 22.7% 2,298 2,084 10.3% Variable contribution 458 473 (3.2%) 426 352 21.0% 884 825 7.2% Operating expenses (231) (239) (3.3%) (239) (215) 11.2% (470) (454) 3.5% EBI
Slide 33: Gaming Services Results
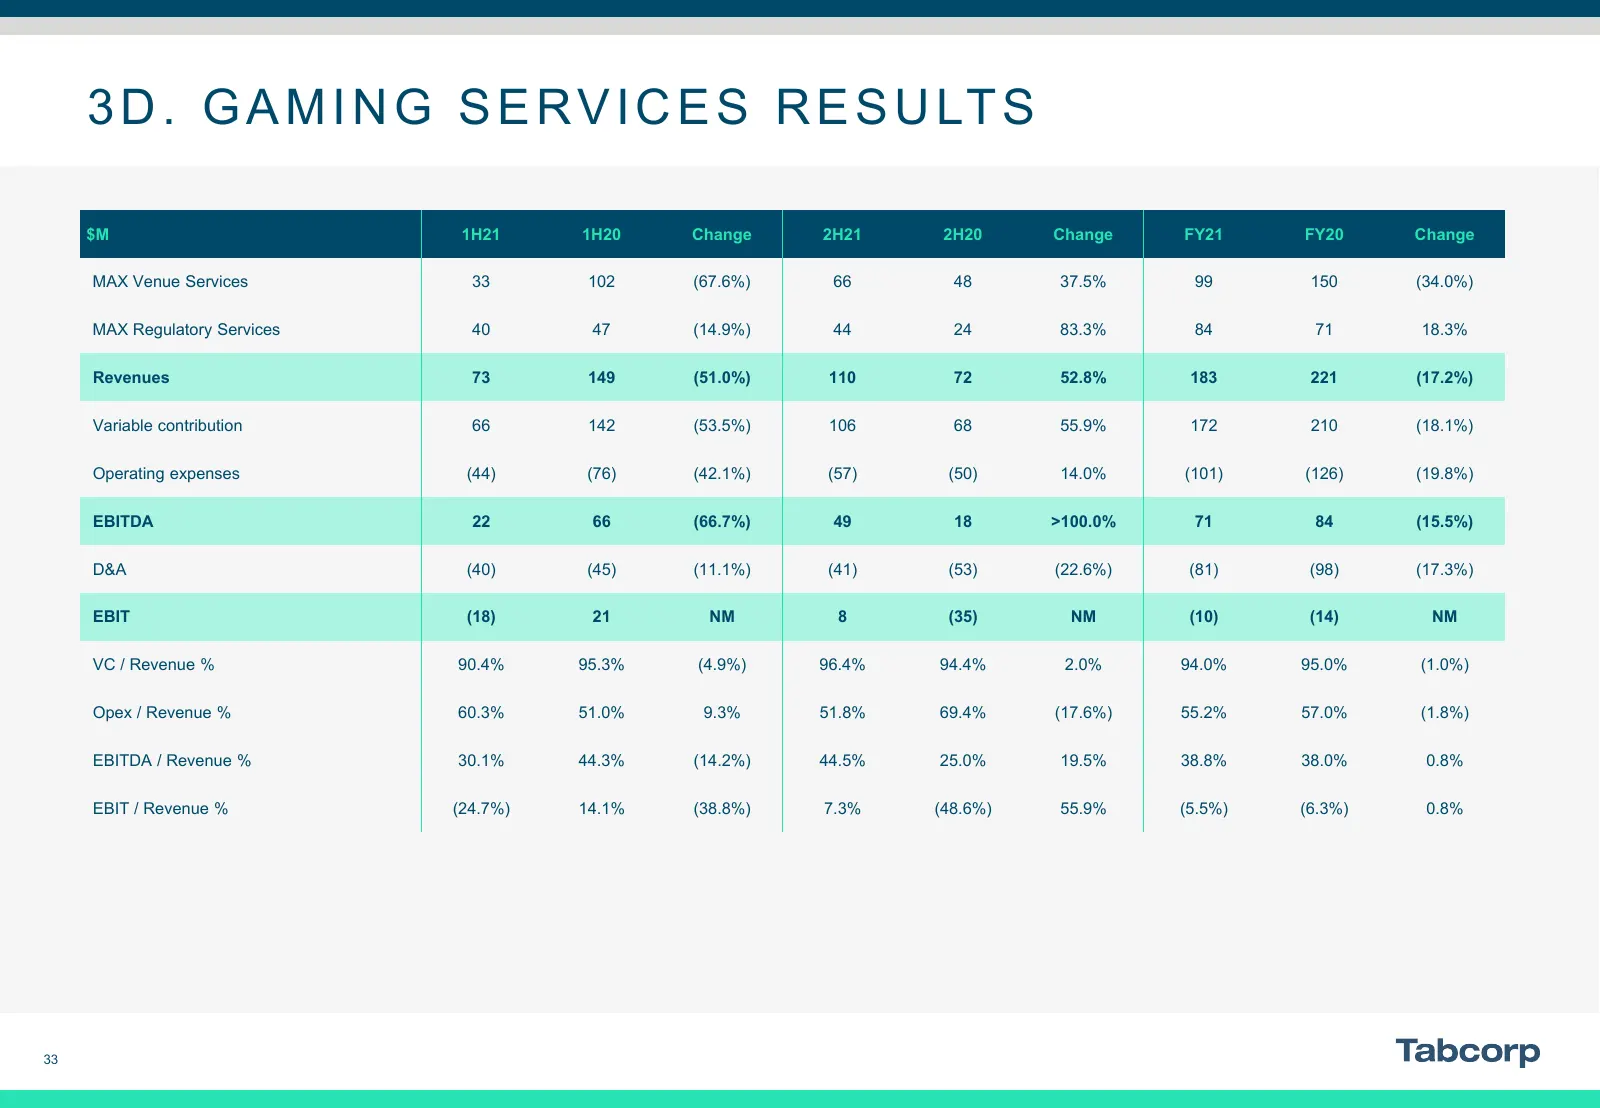
3 D . G A M I N G S E R V I C E S R E S U LT S $M 1H21 1H20 Change 2H21 2H20 Change FY21 FY20 Change MAX Venue Services 33 102 (67.6%) 66 48 37.5% 99 150 (34.0%) MAX Regulatory Services 40 47 (14.9%) 44 24 83.3% 84 71 18.3% Revenues 73 149 (51.0%) 110 72 52.8% 183 221 (17.2%) Variable contribution 6
Slide 34: Balance Sheet
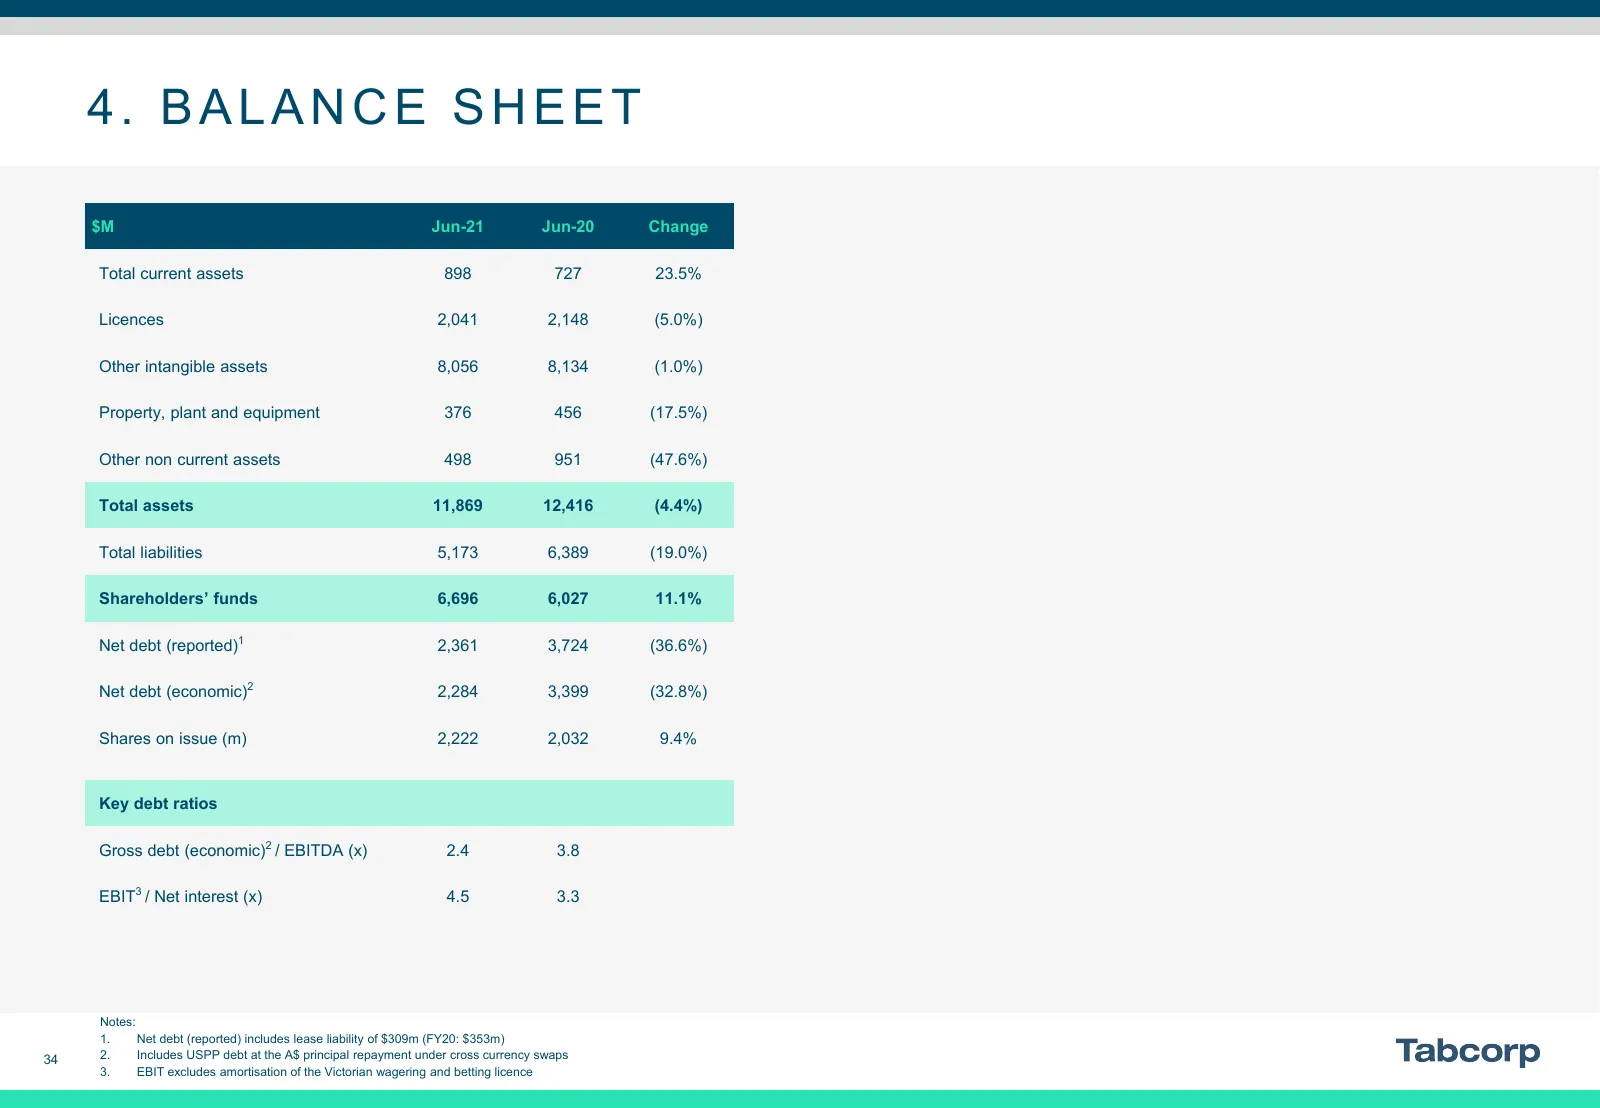
4. BALANCE SHEET $M Jun-21 Jun-20 Change Total current assets 898 727 23.5% Licences 2,041 2,148 (5.0%) Other intangible assets 8,056 8,134 (1.0%) Property, plant and equipment 376 456 (17.5%) Other non current assets 498 951 (47.6%) Total assets 11,869 12,416 (4.4%) Total liabilities 5,173 6,389 (1
Slide 35: Additional KPIs
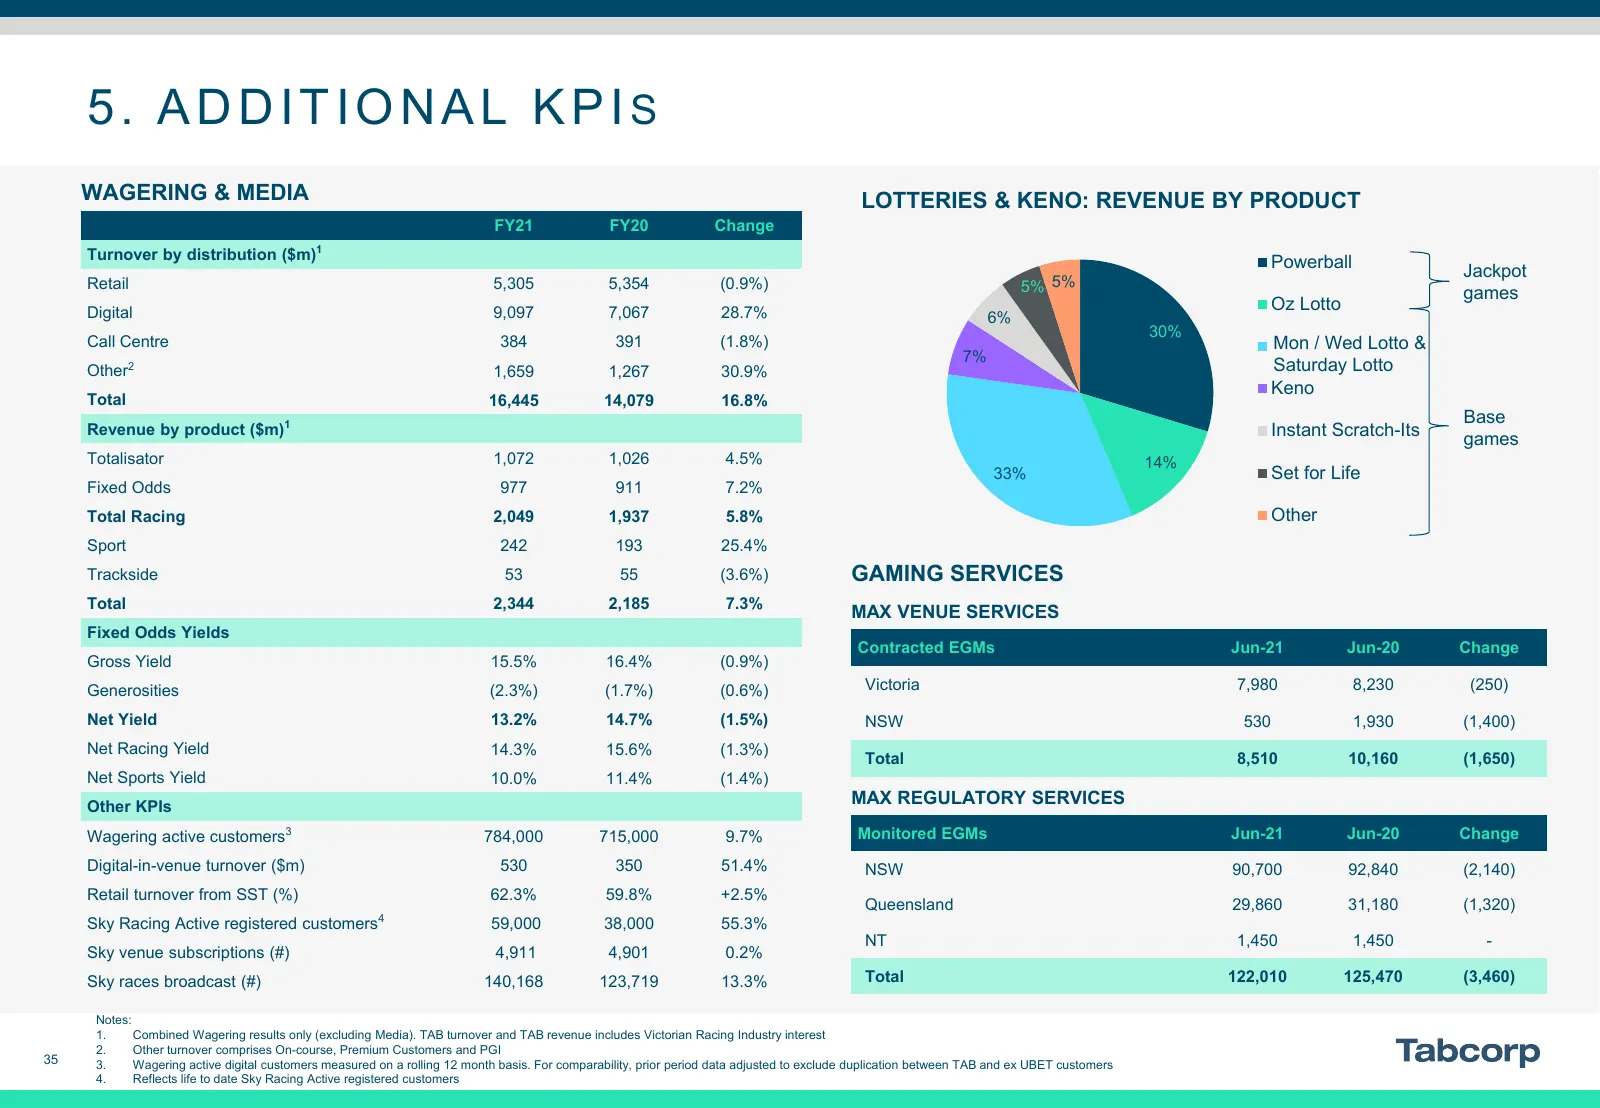
5. ADDITIONAL KPIS WAGERING & MEDIA LOTTERIES & KENO: REVENUE BY PRODUCT FY21 FY20 Change Turnover by distribution ($m)1 Powerball Jackpot Retail 5,305 5,354 (0.9%) 5% 5% games Digital 9,097 7,067 28.7% Oz Lotto 6% 30% Call Centre 384 391 (1.8%) Mon // Wed Mon Wed Lotto Lotto & & 7% Other2 1,659 1,2
Slide 36: Glossary
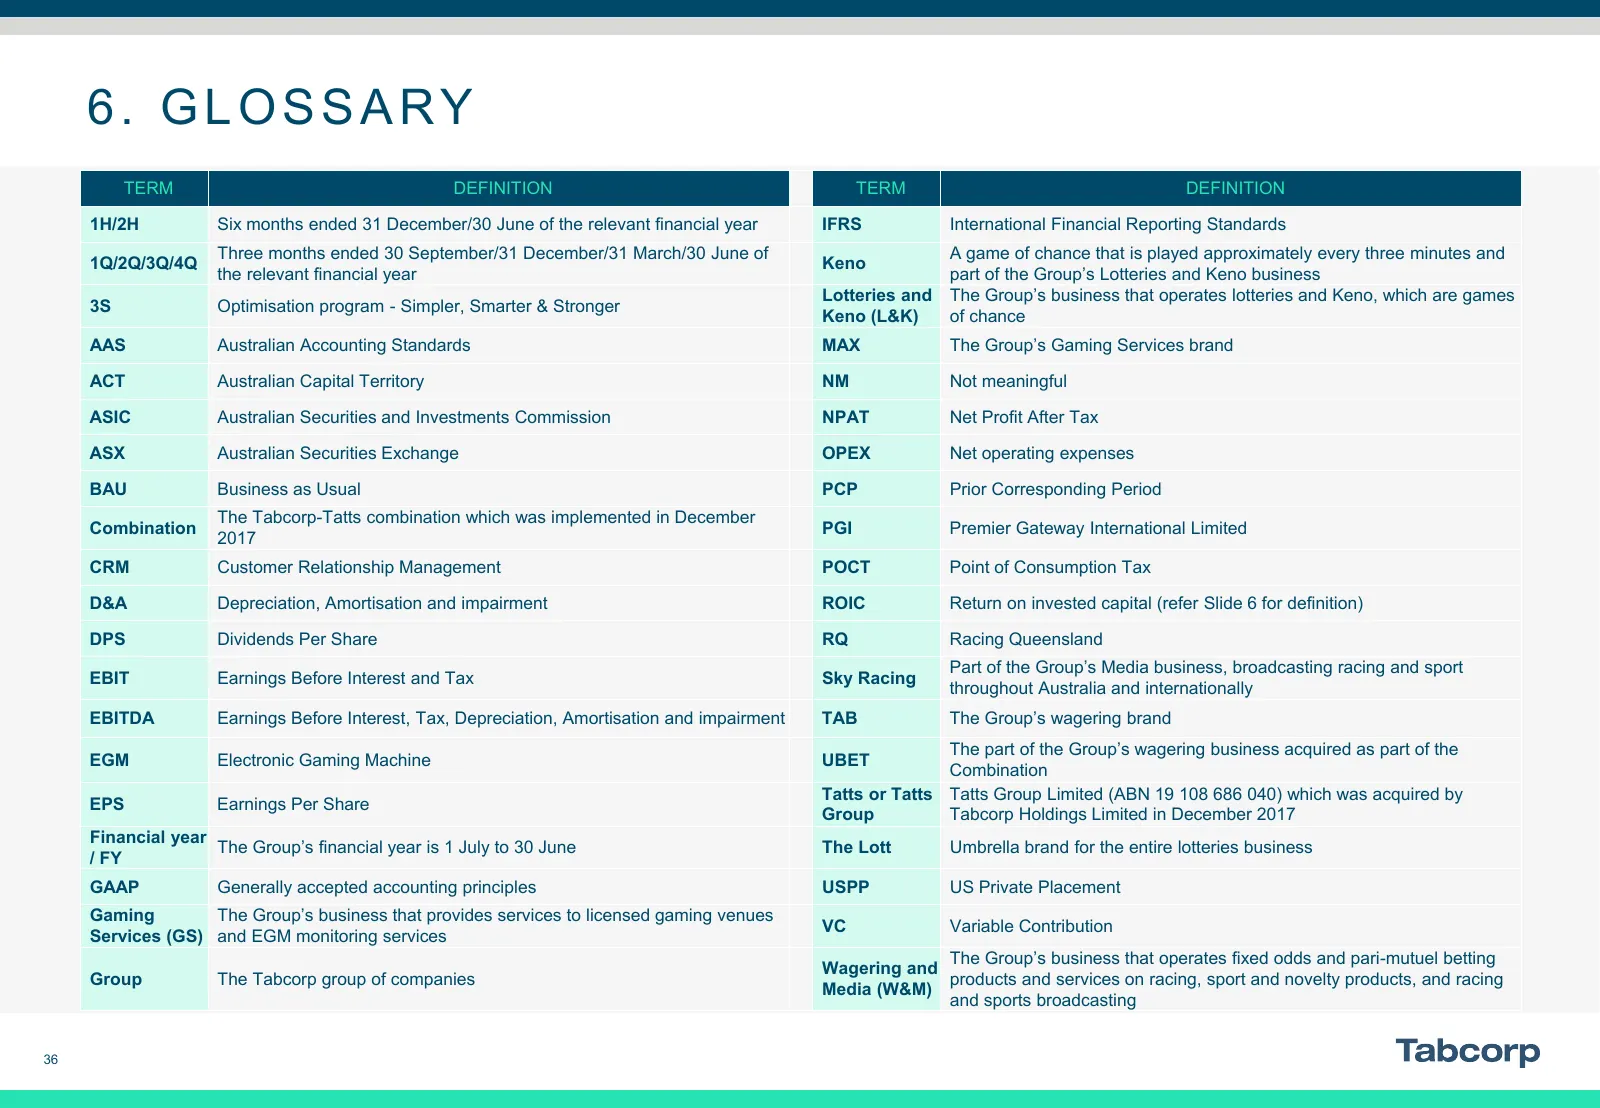
6. GLOSSARY TERM DEFINITION TERM DEFINITION 1H/2H Six months ended 31 December/30 June of the relevant financial year IFRS International Financial Reporting Standards Three months ended 30 September/31 December/31 March/30 June of A game of chance that is played approximately every three minutes and
Slide 37: Disclaimer
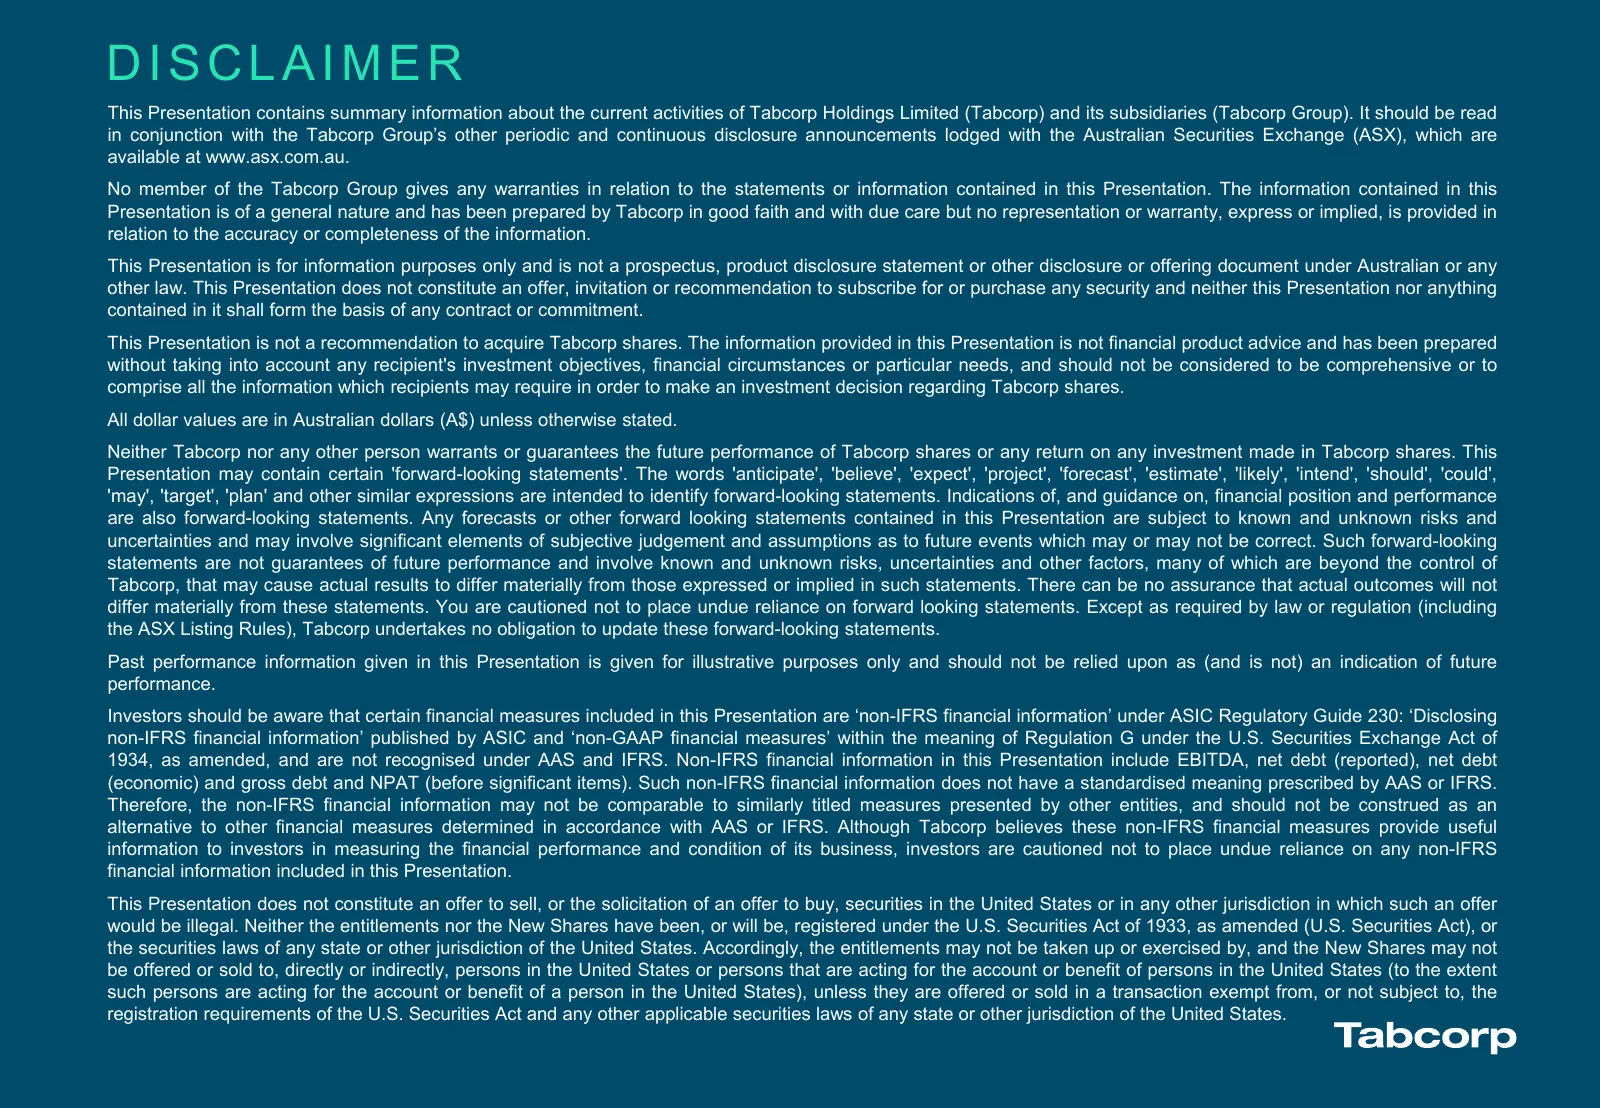
DISCLAIMER This Presentation contains summary information about the current activities of Tabcorp Holdings Limited (Tabcorp) and its subsidiaries (Tabcorp Group). It should be read in conjunction with the Tabcorp Group’s other periodic and continuous disclosure announcements lodged with the Australi
Slide 38: Tabcorp
Tabcorp
Source: Internet Archive copy of tabcorp.com.au
More decks from Tabcorp Holdings Limited
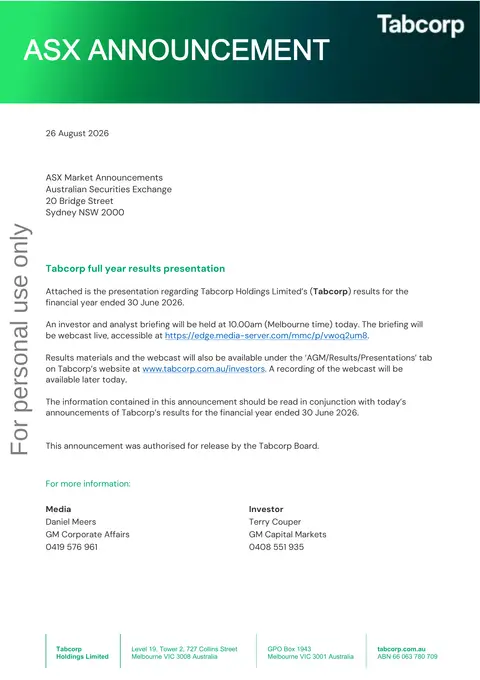 FY2026 Earnings Presentation40 slides · Aug 26, 2026
 FY2026 Earnings Presentation39 slides · Aug 25, 2026
 Investor Presentation (August 2026)16 slides · Aug 10, 2026
 Macquarie Australia Conference 202614 slides · May 5, 2026
 1H26 Earnings Presentation39 slides · Feb 25, 2026
 Shareholder Meeting (October 2025)17 slides · Oct 20, 2025