Florida East Coast Industries Inc
Florida East Coast Industries — Q2 2006 Earnings Presentation
36 slides from Florida East Coast Industries's earnings presentation, Aug 3, 2006
Slide 1: Second Quarter 2006 Earnings Review
August 2, 2006 Florida East Coast Industries, Inc. Second Quarter 2006 Earnings Review Exhibit 99.1 August 3, 2006
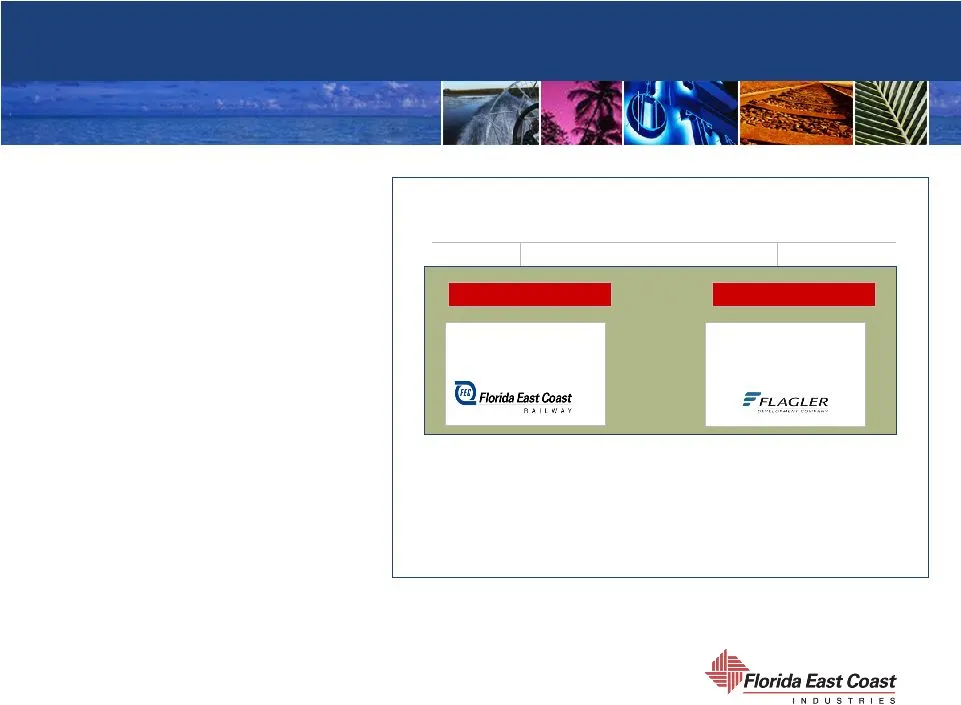
Slide 2: Company Snapshot
RAILROAD REAL ESTATE Company Snapshot Florida East Coast Industries A Florida Railroad and Real Estate Company > Regional freight railroad that operates 351 miles of main line track with the most direct route from Jacksonville to Miami and provides intermodal drayage services in the Southeast U.S. >
Slide 3: Forward-Looking Statements
Florida East Coast Industries, Inc. Forward-Looking Statements This news release contains forward-looking statements within the meaning of Section 27A of the Securities Act of 1933, as amended, and Section 21E of the Securities Exchange Act of 1934, as amended. These forward-looking statements inclu
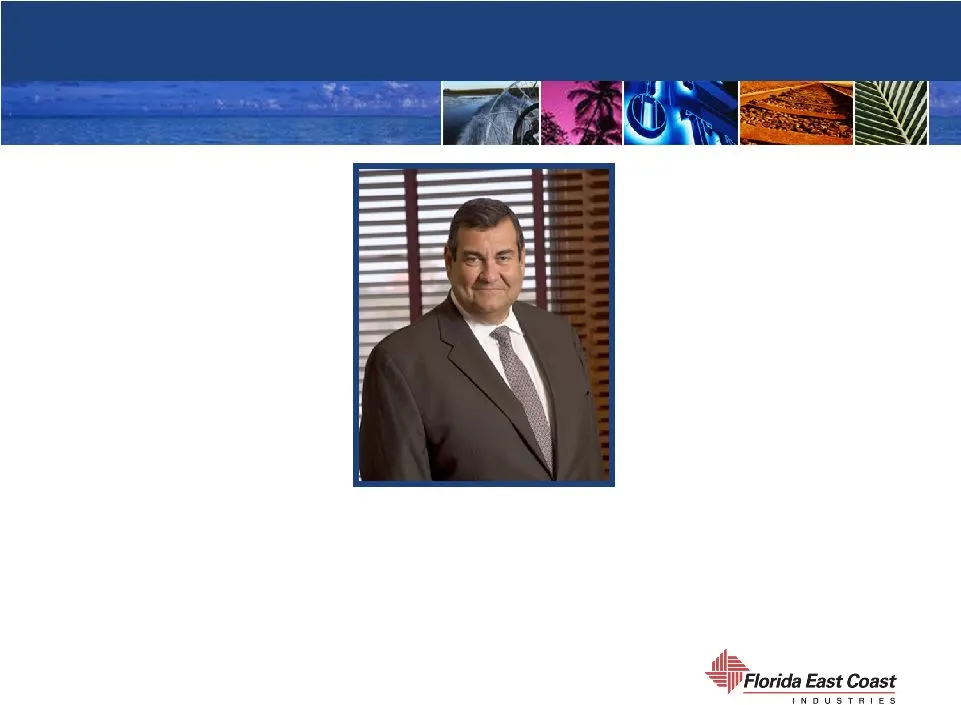
Slide 4: Adolfo Henriques, Chairman, President & CEO
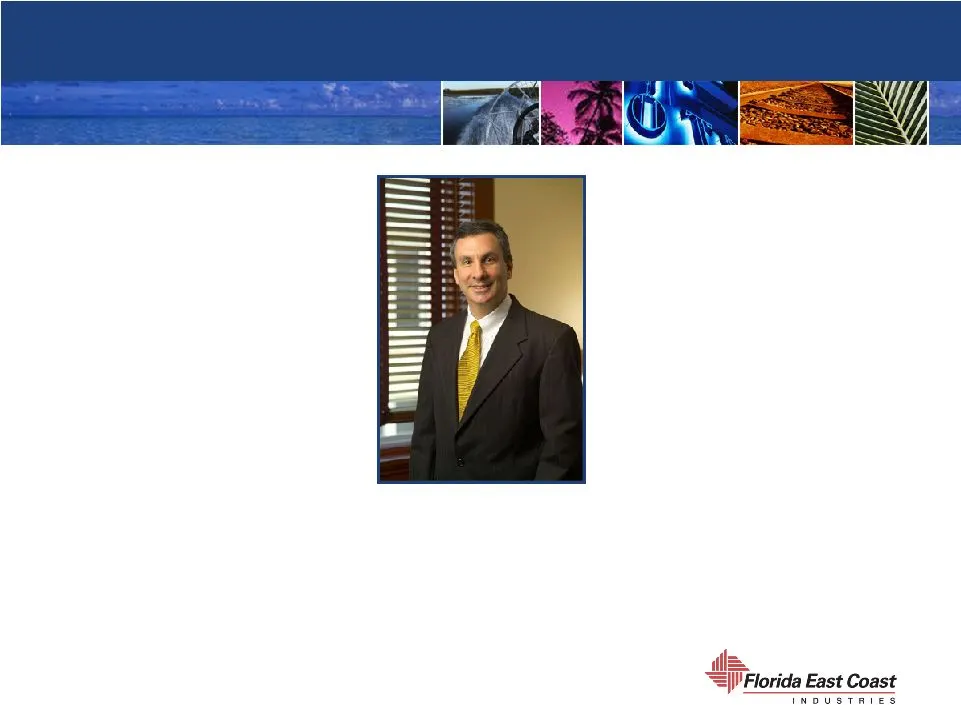
FLORIDA EAST COAST INDUSTRIES, INC. Adolfo Henriques Chairman, President & CEO
Slide 5: Second Quarter Overview
Second Quarter Overview • Railway • Revenues increased 19% to $70 million • Operating profit increased 27% to $20.2 million • Operating ratio improved to 71.2% • Solid volume growth • Pricing environment remains strong
Slide 6: Second Quarter Overview
Second Quarter Overview • Real Estate • Completed Codina acquisition on April 27, 2006 • $10.6 million of Codina Group realty services revenues included in second quarter 2006 results • Realty rental revenues increased 10% to $23.1 million • Realty rental operating profit before depreciation & amort
Slide 7: Railway – Increased Aggregate Volumes and Revenues
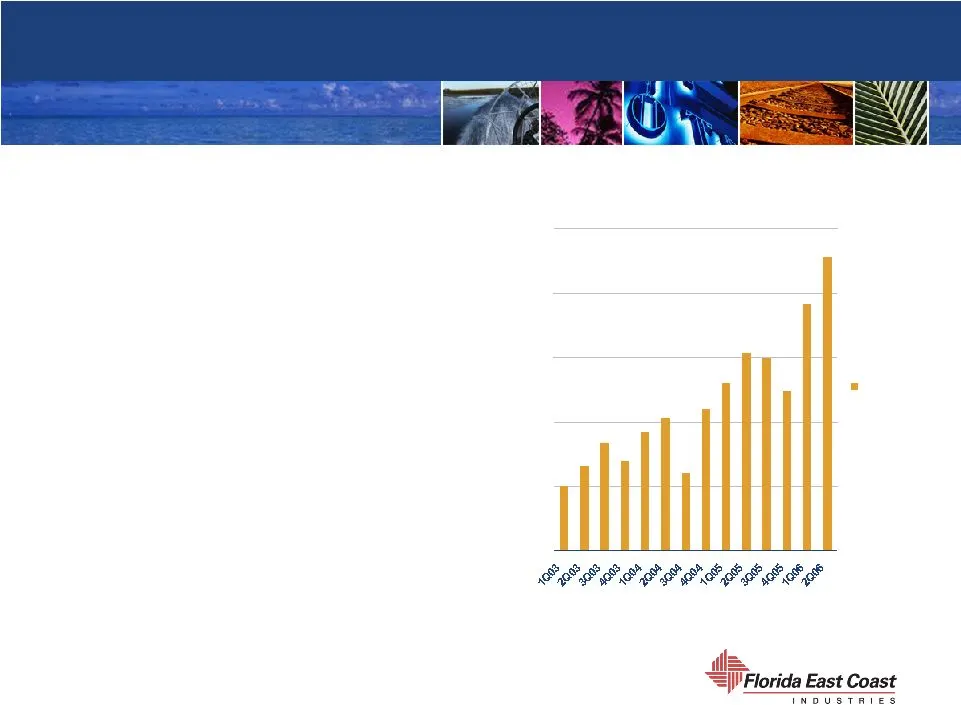
Railway – Increased Aggregate Volumes and Revenues • Aggregate volume up 10% and revenue up 18% • Shifting demand from residential to infrastructure and commercial sectors • Significant increases in State funding for infrastructure • Florida produces 60% of its annual aggregate needs • Recent ruling
Slide 8: Railway – Continued Intermodal Growth
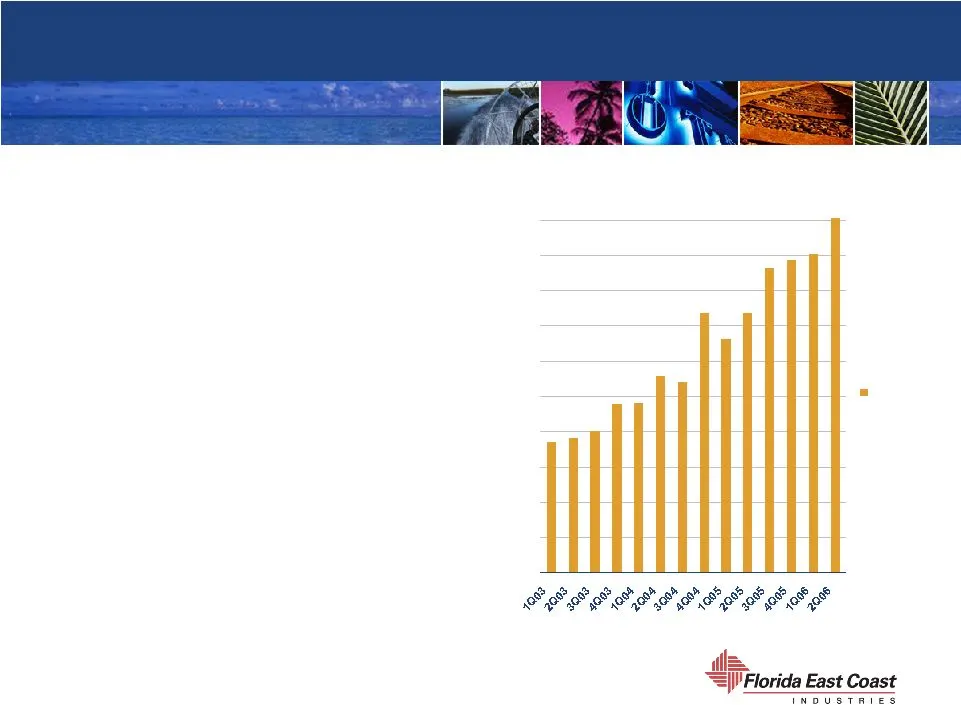
Railway – Continued Intermodal Growth • Intermodal volume up 9% and revenue up 24% • Florida’s shape and growth supports the value proposition of rail transportation • Rail provides a direct, more cost-effective transportation solution • Florida is an international hub • Exclusive access to ports pr
Slide 9: Railway Accomplishments
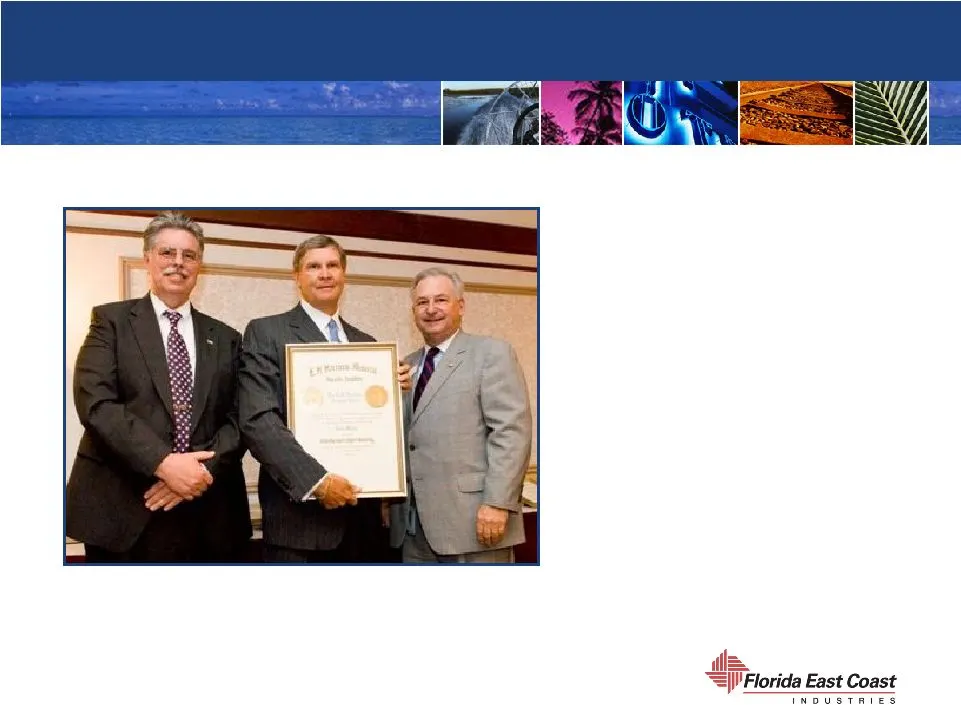
Railway Accomplishments John McPherson, FECR President & COO (center) accepting Harriman Award from Joseph Boardman, FRA Administrator (left) and Mark Rosenker, NTSB Acting Chairman (right). • Received 2005 Gold Harriman Award for Outstanding Safety • Zero reportable injuries in second quarter of •
Slide 10: Florida East Coast Railway
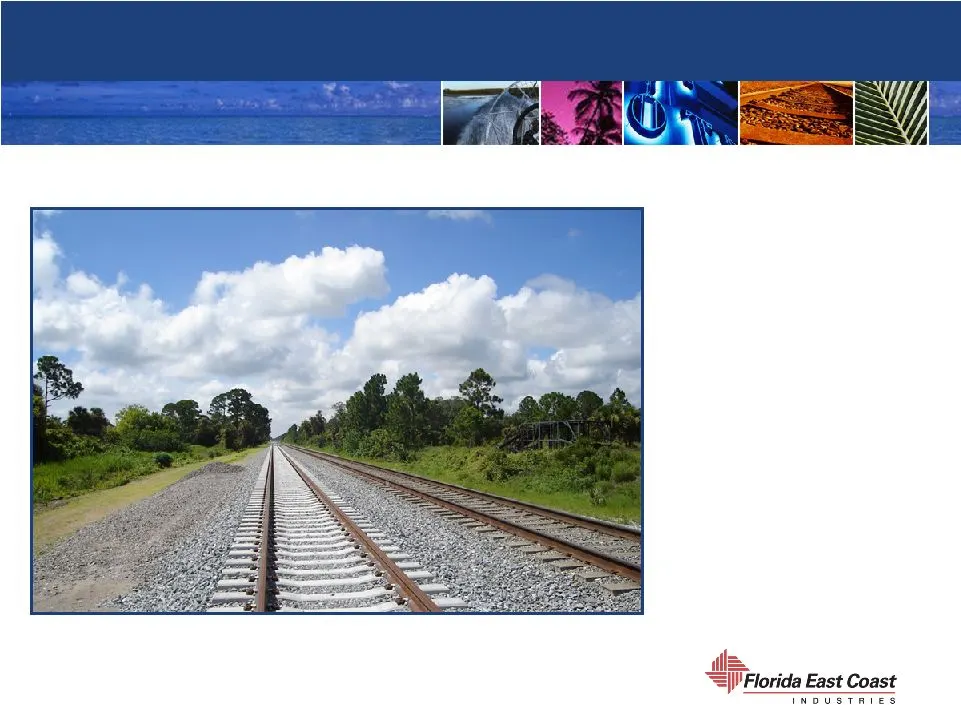
Florida East Coast Railway • Began installa- tion of 12 miles of double-track siding from Indian River City to Frontenac • State of Florida reimbursing 50% of project costs
Slide 11: Flagler Development Group
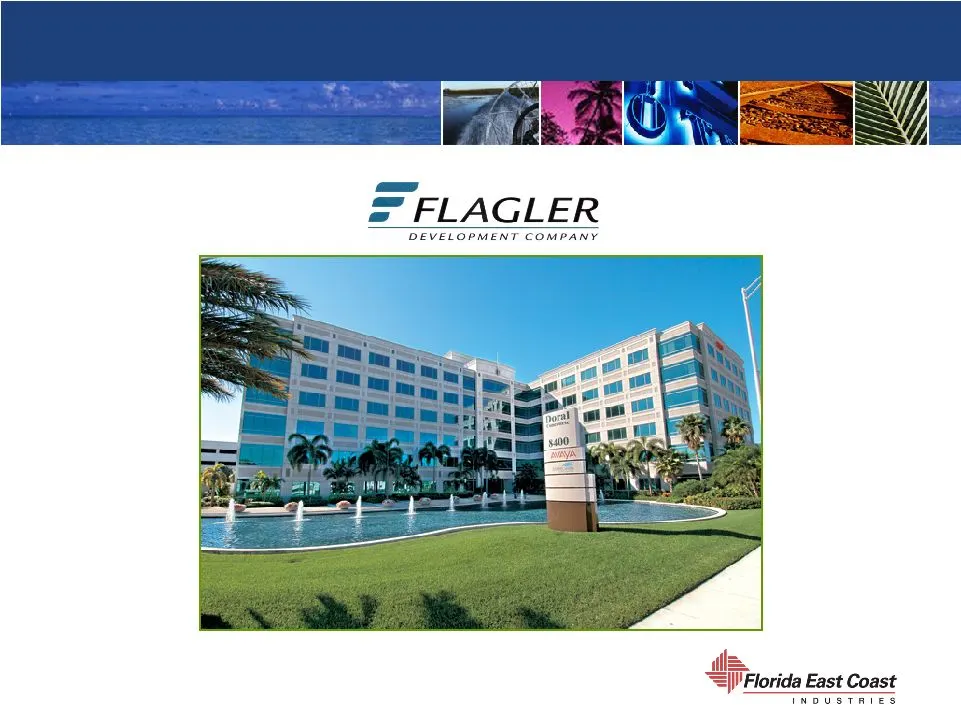
Flagler Development Group Doral Concourse, Doral, FL
Slide 12: Flagler Development Pipeline
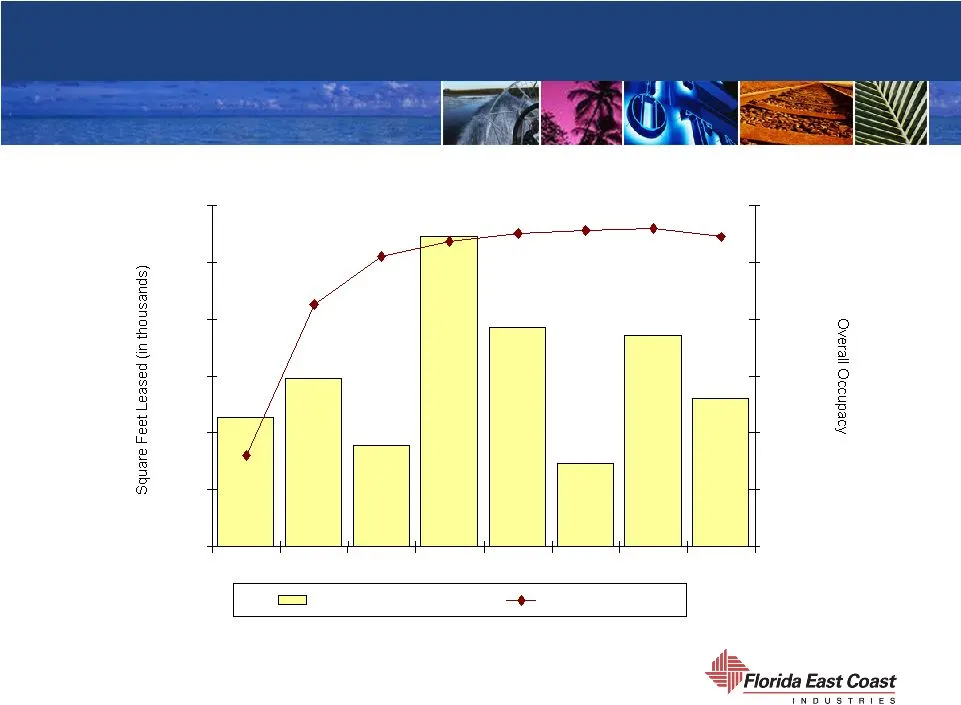
Flagler Development Pipeline • Overall Occupancy: 95% • 961,000 square feet in lease-up • 67% leased • 753,000 square feet under construction • 1,897,000 square feet in pre-development
Slide 13: Flagler Development Activity – Central Florida
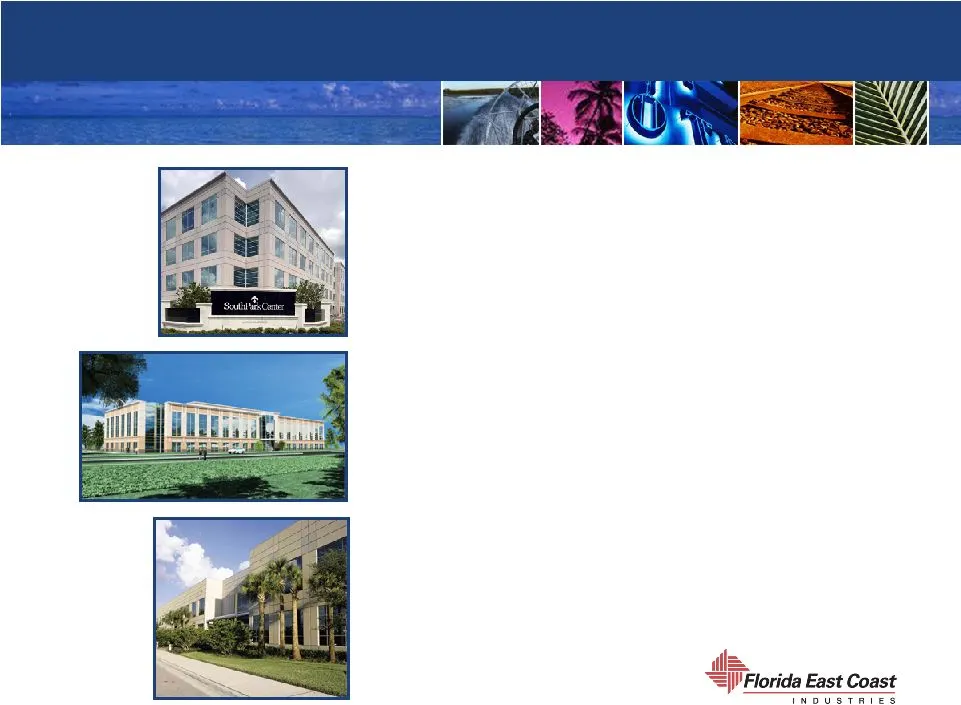
Flagler Development Activity – Central Florida • Starwood Vacation Ownership leased remaining space in SouthPark • Construction commenced on SouthPark • 83,000 square feet • 34% pre-leased to University of Phoenix • Construction commencing on SouthPark • 112,000 square feet
Slide 14: Flagler Development Activity – South Florida
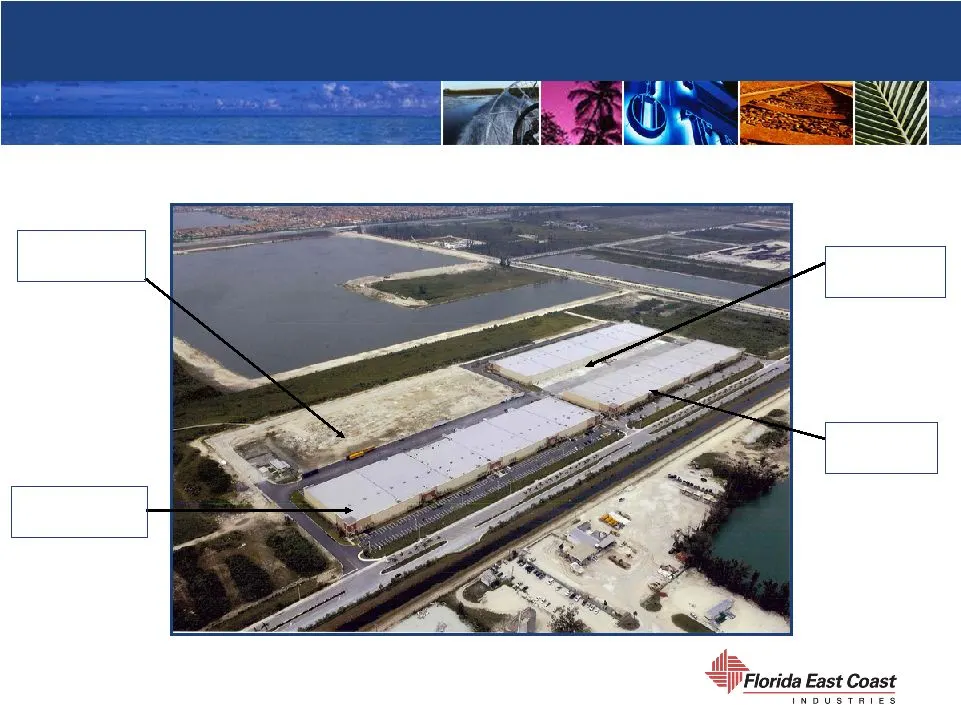
Flagler Development Activity – South Florida Future Site of Bldg. 7 Bldg. 6 Multi-Tenant Bldg. #10 Panalpina Bldg. #9 DHL Beacon Lakes
Slide 15: Flagler Development Activity – South Florida
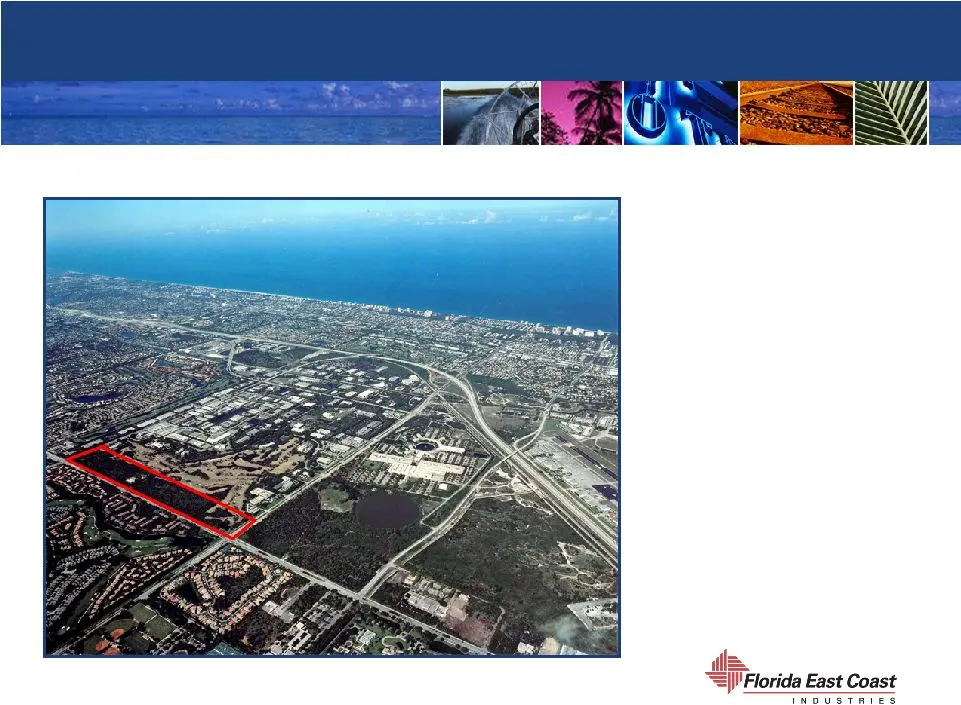
Flagler Development Activity – South Florida Boca 54 • 20% interest in joint venture with a subsidiary of TIAA- CREF • Future development plans include 941,000 square feet of office space • Extends our presence into Palm Beach County
Slide 16: Daniel H. Popky, Chief Financial Officer
FLORIDA EAST COAST INDUSTRIES, INC . Daniel H. Popky Chief Financial Officer
Slide 17: Florida East Coast Railway
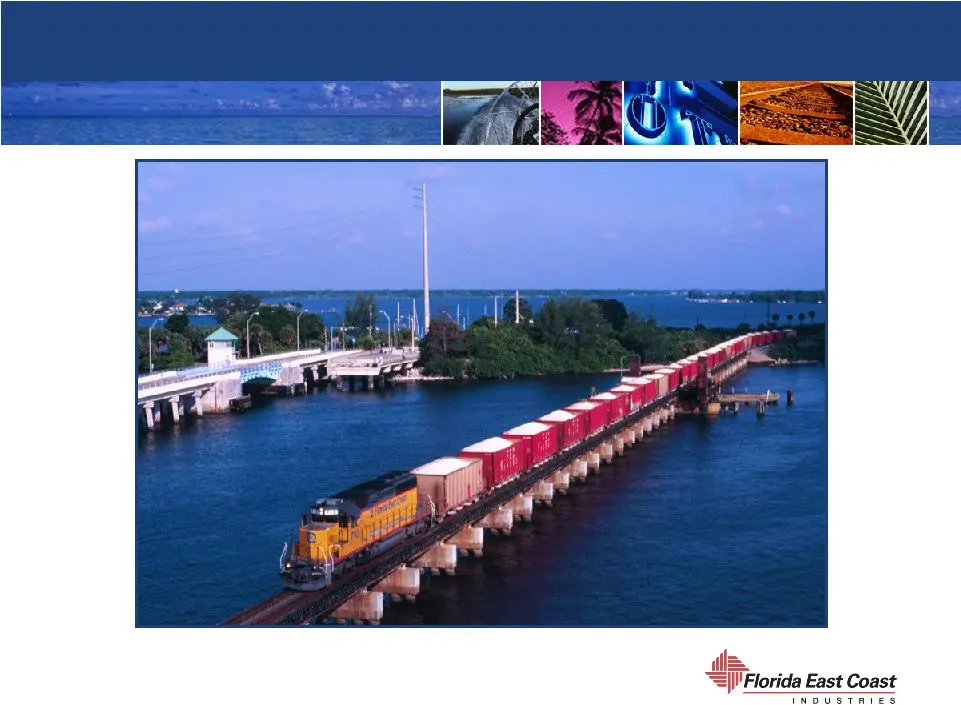
FLORIDA EAST COAST RAILWAY
Slide 18: Railway Revenue Growth
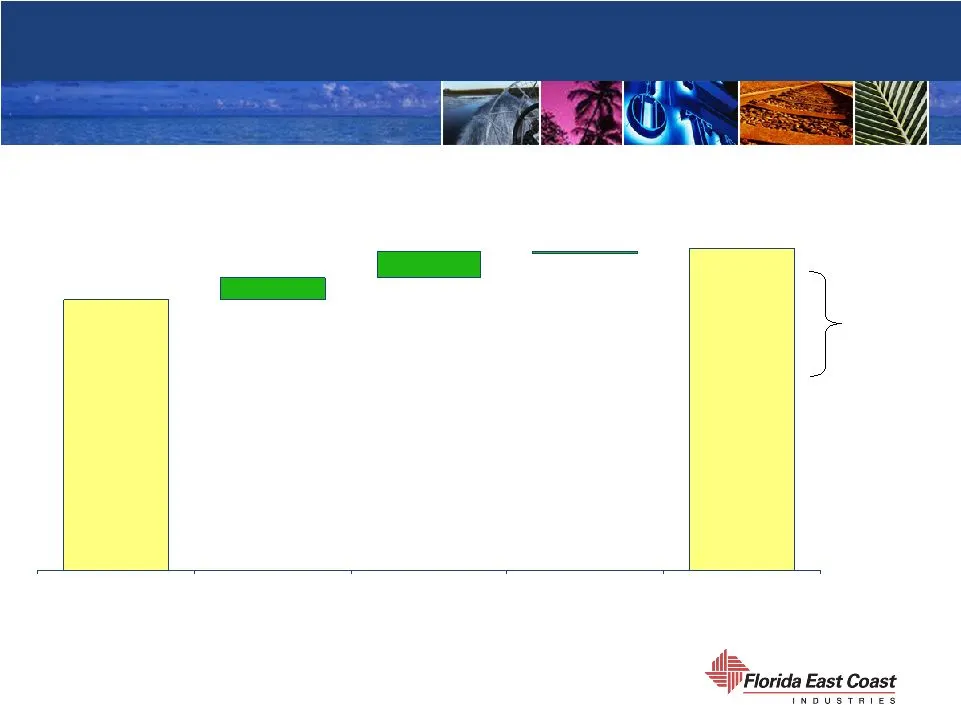
Railway Revenue Growth $58.9 $70.0 $4.7 $0.6 $5.8 Q2 Carload Intermodal All Other Q2 Second Quarter - in Millions +14.2% +23.5% +62.4% +18.9%
Slide 19: Railway Revenue Growth Detail
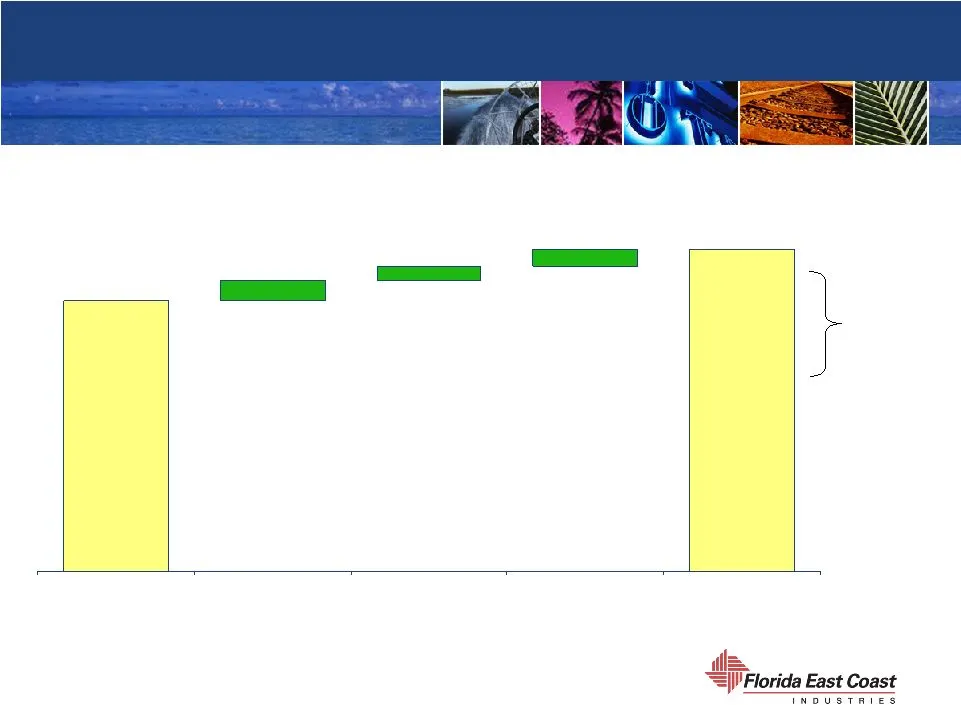
Railway Revenue Growth Detail $58.9 $70.0 $4.4 $3.0 $3.7 Q2 Volume Rate & Mix Fuel Recovery Q2 Second Quarter - in Millions +7.5% +5.1% +6.3% +18.9%
Slide 20: Commodity Revenue Growth
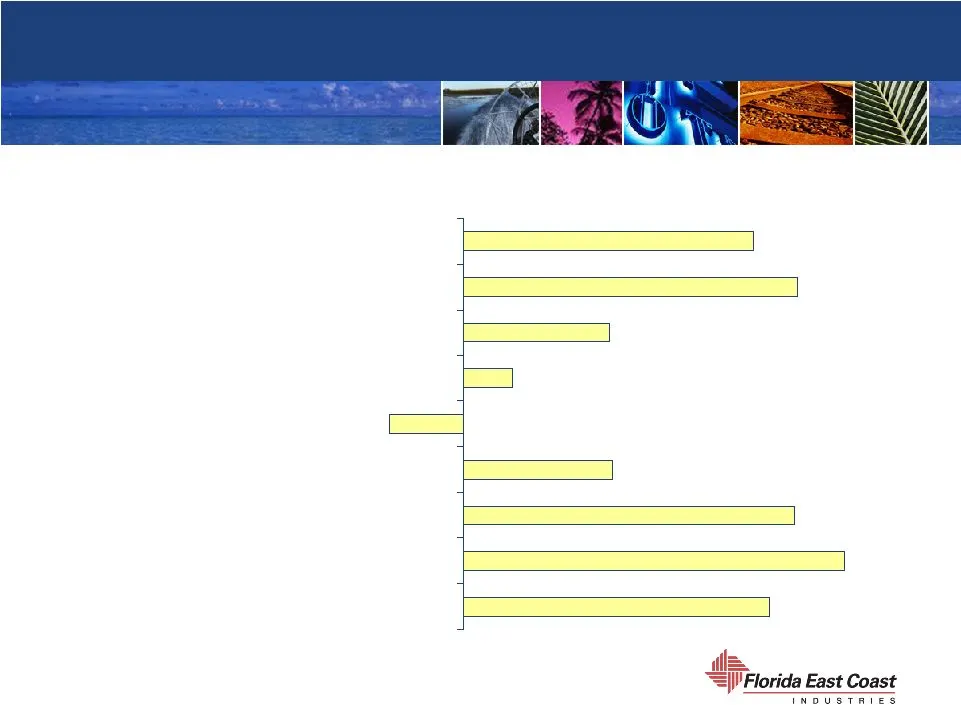
Commodity Revenue Growth Q2 2006 vs Q2 2005 Variance 18.9% 9.0% 17.9% -4.6% 20.6% 3.0% 9.2% 20.4% Railway Segment Revenue Growth Intermodal Other Carload Paper & Lumber Chemicals & Distillants Foodstuffs & Kindred Vehicles Construction Materials Aggregate 23.5%
Slide 21: Railway Profit Growth
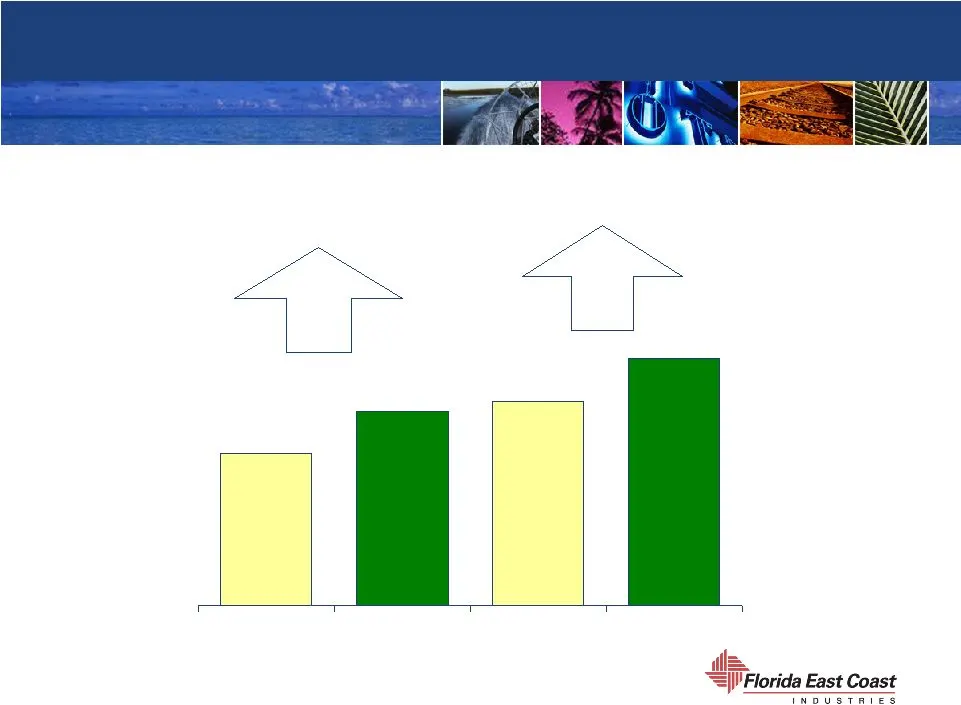
Railway Profit Growth $15.9 $20.2 $21.3 $25.7 Operating Profit Operating Profit before Depreciation* *See page 36 for reconciliation of non-GAAP measures 26.5% 20.7% Second Quarter – In Millions
Slide 22: Railway Operating Ratio Second Quarter
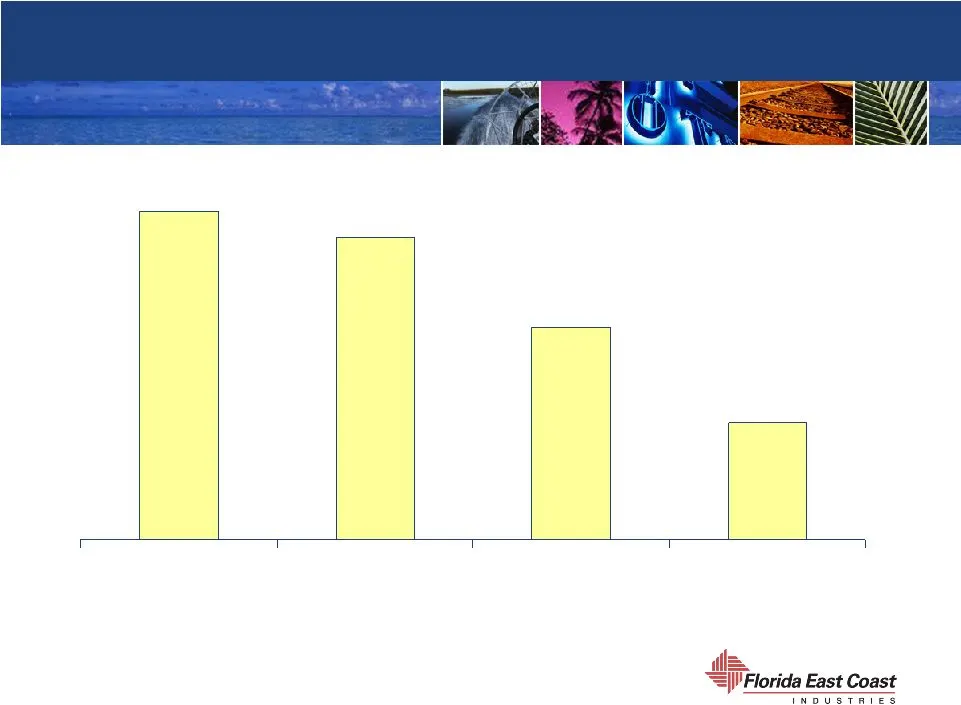
Railway Operating Ratio Second Quarter 75.2% 74.7% 73.0% 71.2%
Slide 23: Railway 2006 Outlook
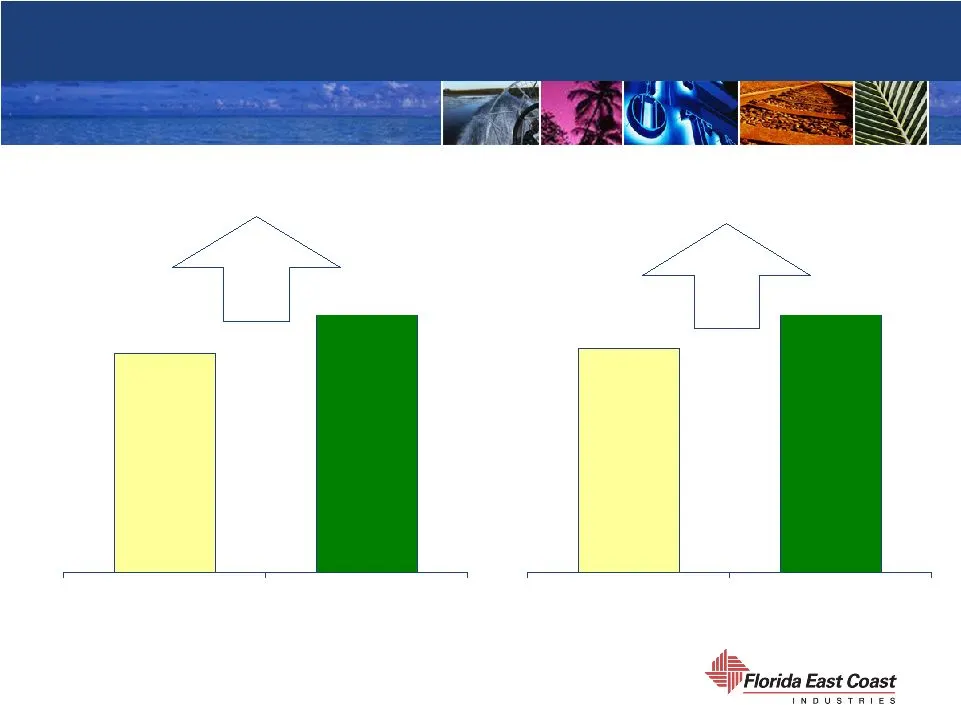
Railway 2006 Outlook Revenues Operating Profit (1) Excludes insurance recoveries related to Hurricane Wilma Full Year – In Millions 11-16% 16-21% $237.9 $265-$275 $63.7 $74-$77 (1)
Slide 24: Railway Capital Expenditures
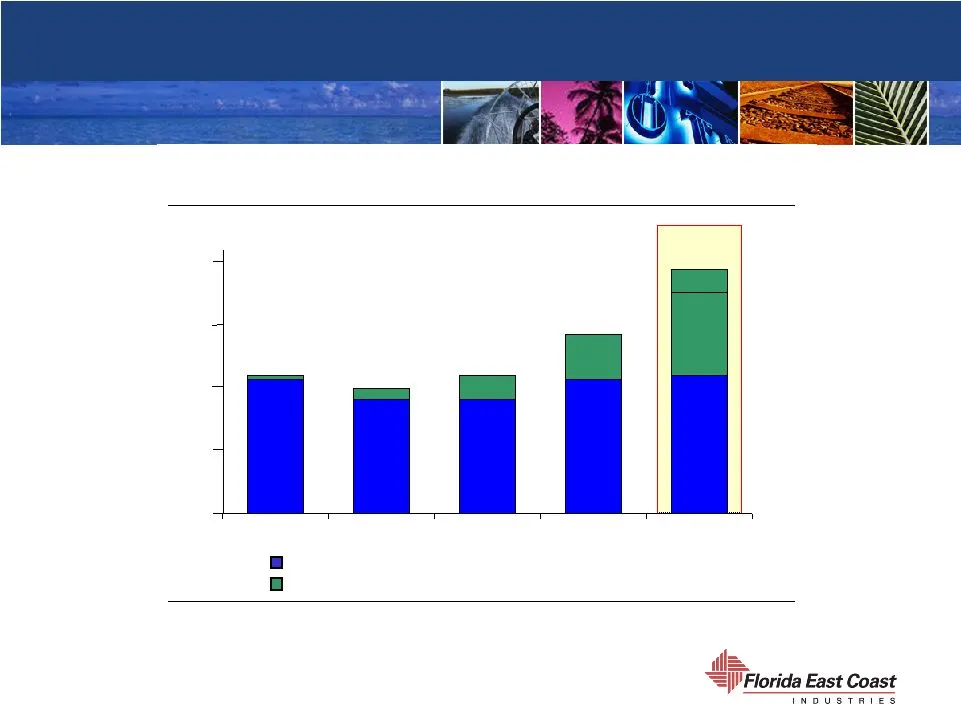
Railway Capital Expenditures 2006 Outlook* $30 $27 $30 $39 (1) $48-$53 Maintenance capital Productivity & growth capital *Before the purchase of any strategic land parcels to be used fo r industrial development (1)Productivity and growth capital includes $5.1 of land purchas ed for future developmen
Slide 25: Flagler Development Group
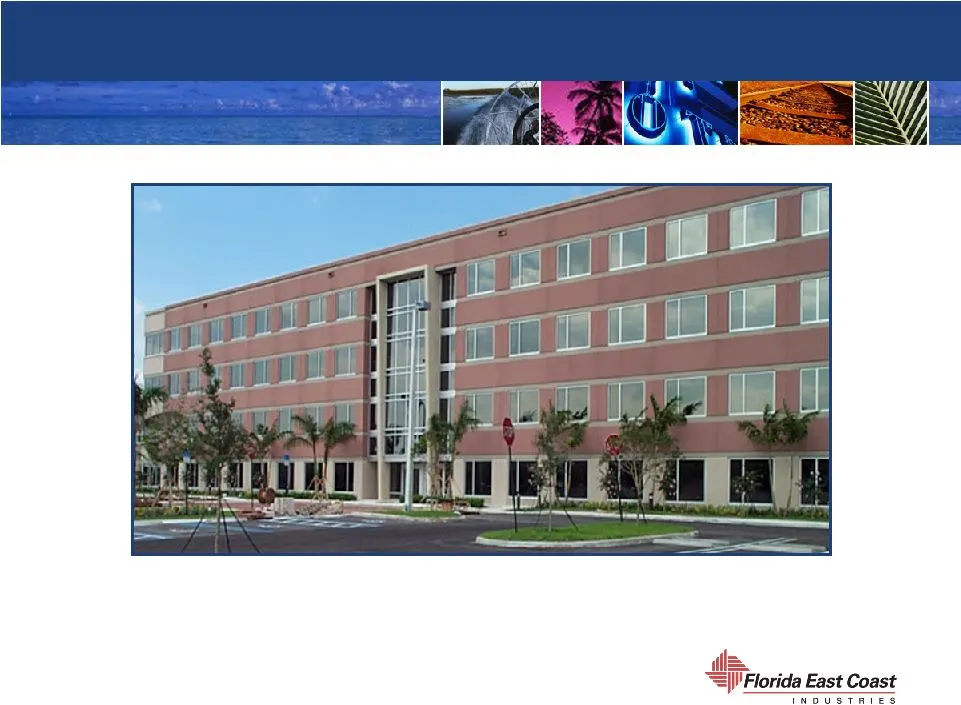
FLAGLER DEVELOPMENT GROUP Office Building 1100 At Flagler Station Miami, FL
Slide 26: Flagler Rental & Services Revenue Growth
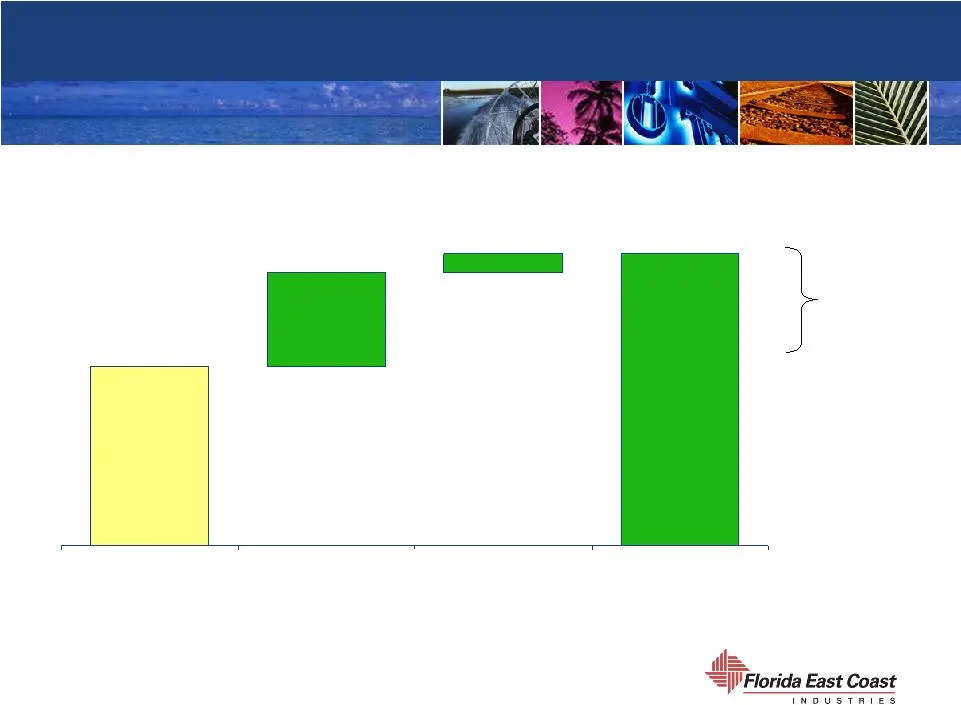
Flagler Rental & Services Revenue Growth Q2 Operating Properties Q2 Second Quarter - in Millions $34.3 +60.3% $2.1 $21.4 Realty Services (1) $10.7 (1) Includes construction, brokerage, property management and development revenues from Codina Group of $10.6 million.
Slide 27: Flagler Realty Rental Revenue Growth
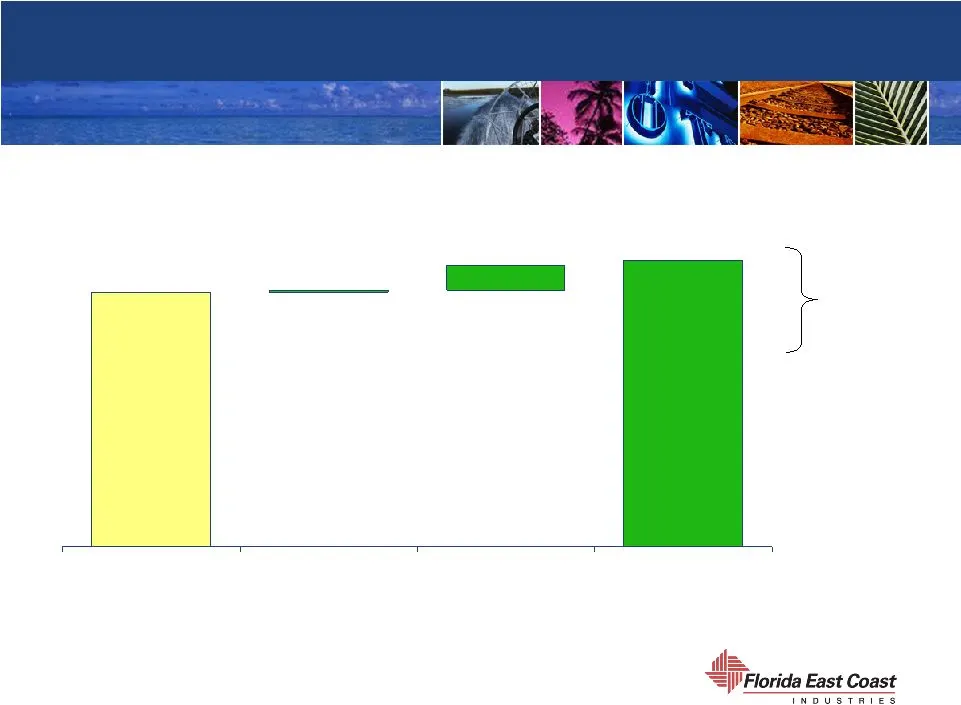
Flagler Realty Rental Revenue Revenue Growth Q2 New in ‘05 Q2 Second Quarter - in Millions $23.1 +10% $1.9 $21.0 Same Store $0.2
Slide 28: Flagler Realty Rental Operating Profit Before D&A Growth
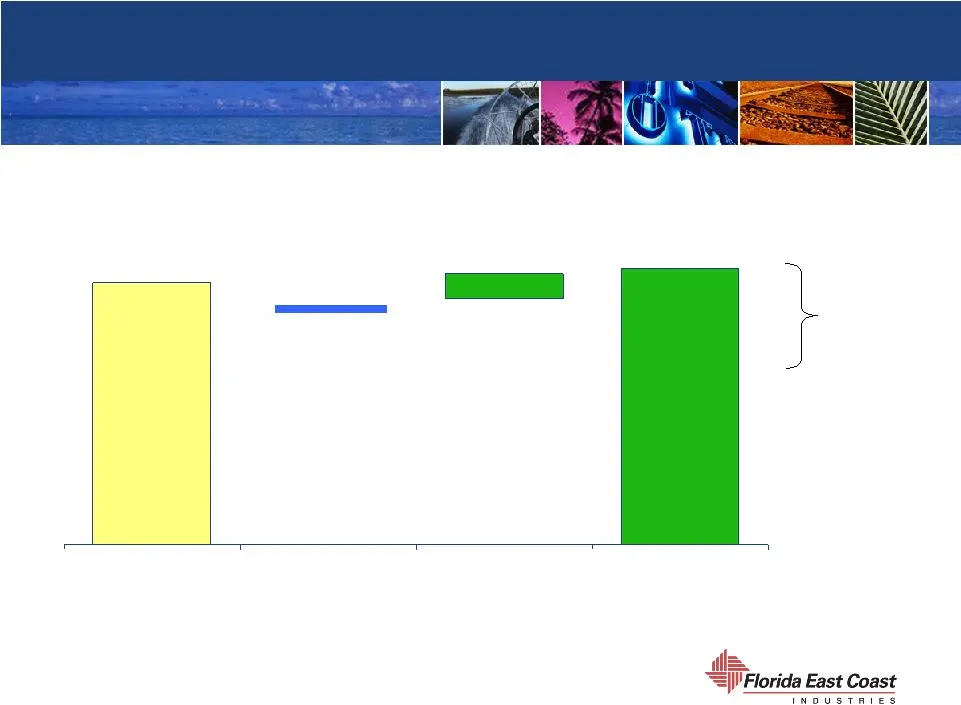
Flagler Realty Rental Operating Profit Before Depreciation & Amortization* Growth Q2 Same Store New in ‘05 Q2 Second Quarter - in Millions $14.3 +5.4% $1.3 ($0.5) (1) $13.5 * See page 36 for reconciliation of non-GAAP measures. (1) Includes $0.2 million of Hurricane Wilma related expense.
Slide 29: Realty Segment Operating Profit
Realty Segment Operating Profit $5.0 $3.0 Realty Operating Profit (3.2) (5.4) (2) Land and Overhead 0.2 0.5 Other Realty Rental 1.5 0.5 Realty Sales 0.1 0.5 Realty Services $6.4 $6.9 (1) Realty Rental Operating Profit: Second Quarter Second Quarter - in Millions (1) Includes $0.5 million of Hurrican
Slide 30: Flagler Occupancy and Leasing Activity
Flagler Occupancy and Leasing Activity (1) 2003 and 2004 leasing activity represents quarterly averages. 92.5% 94.2% 95.0% 95.1% 95.2% 94.9% 94.7% 87.2% 2003(1) 2004(1) 1Q05 2Q05 3Q05 4Q05 1Q06 2Q06 84.0% 86.0% 88.0% 90.0% 92.0% 94.0% 96.0% Square Feet Leased Overall Occupancy
Slide 31: Flagler Lease Expirations
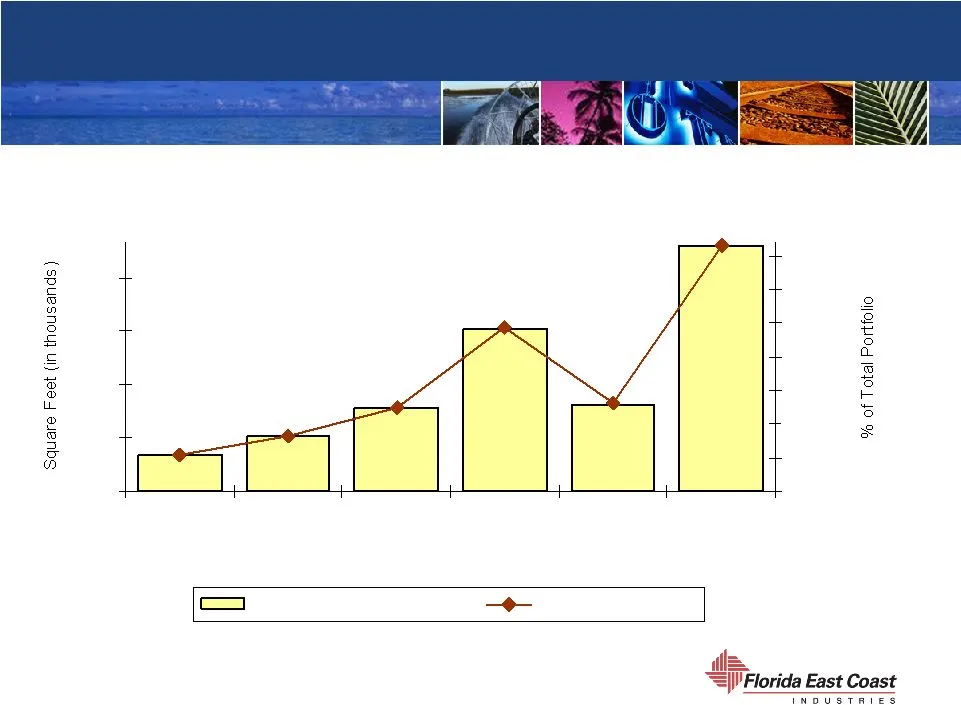
Flagler Lease Expirations 2,756 1,832 8.2% 12.5% 24.3% 36.5% 5.5% 13.0% Remainder 2011and Beyond 0.0% 5.0% 10.0% 15.0% 20.0% 25.0% 30.0% 35.0% Total Square Feet Expiring % of Total Portfolio
Slide 32: Flagler 2006 Outlook
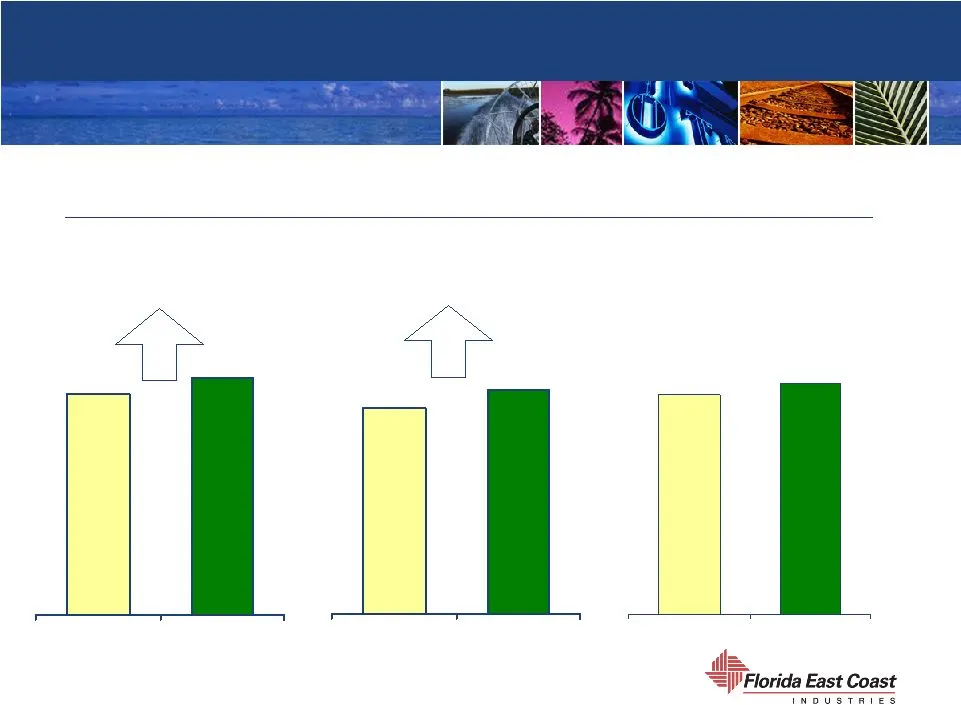
Flagler 2006 Outlook ¹ Full Year – In Millions Realty Rental Revenues Realty Rental Operating Profit before Depreciation & Amortization* (1) Excludes impact to be recorded in 2006 related to Hurricane Wilma * See page 36 for reconciliation of non-GAAP measures 5 - 11% $87.4 $92-$97 Realty Rental Ope
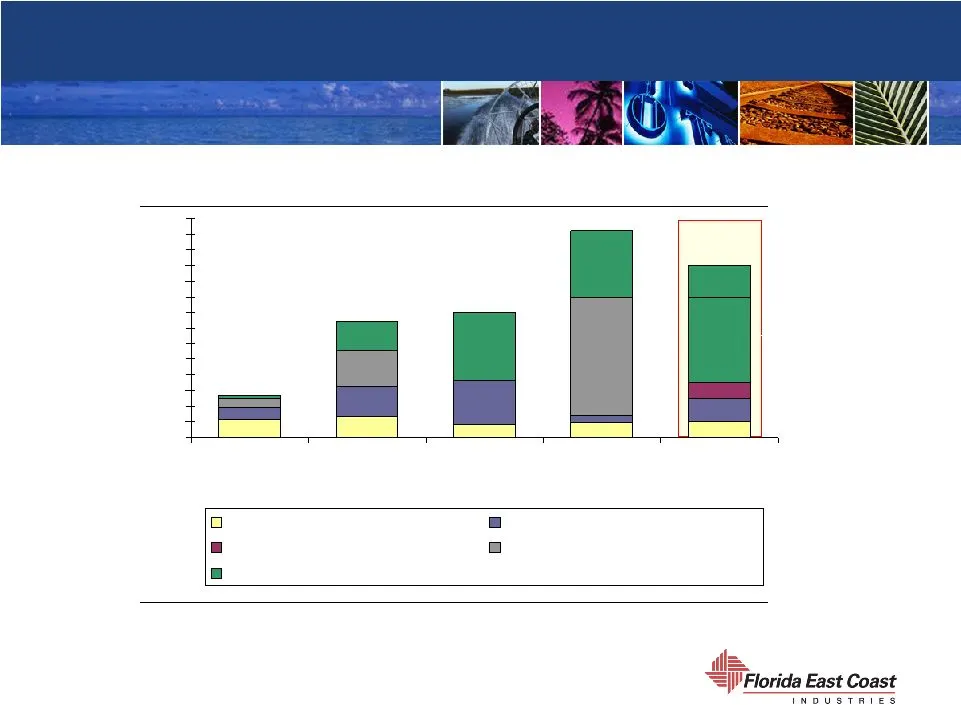
Slide 33: Flagler Capital Investments
Flagler Capital Investments Outlook* Existing Operating Properties Infrastructure Investments in Joint Ventures Acquisition New Building Construction $27.0 $75.0 $80.0 $132.7 $100-$120 (in millions) * Excludes land acquisition capex
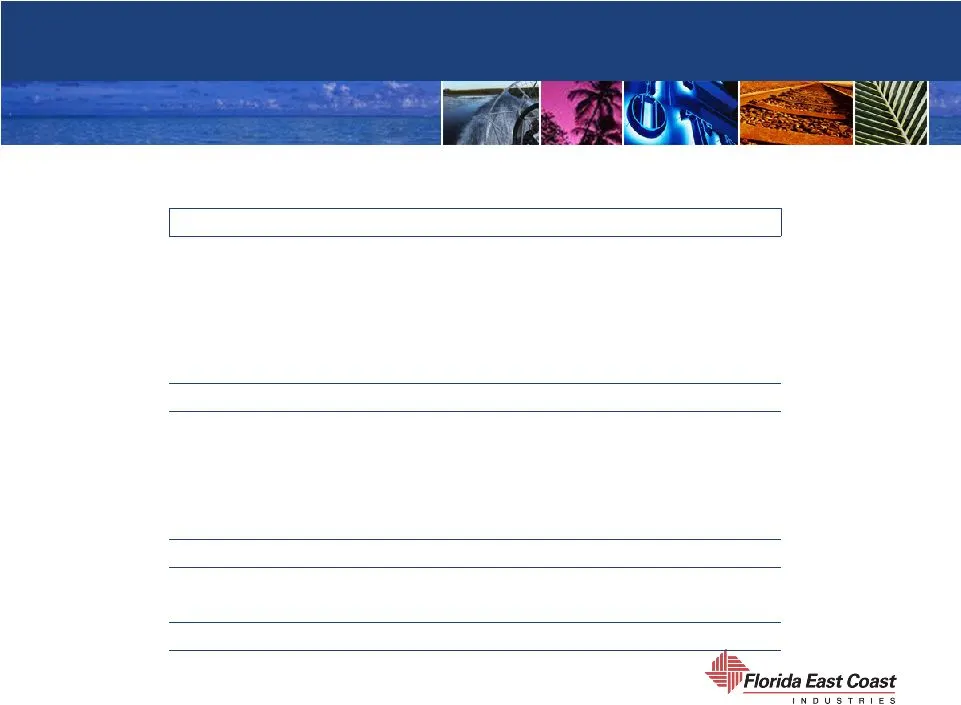
Slide 34: Condensed Consolidated Statements of Cash Flows
Condensed Consolidated Statements of Cash Flows (0.1) Other 0.2 Investment by minority interest (6.3) Investments in joint ventures (65.5) Acquisition of Codina Group $49.7 $ 9.0 Cash and cash equivalents at end of period 126.1 76.0 Cash and cash equivalents at beginning of period (76.4) (67.0) Net
Slide 35: Looking Forward
Looking Forward . • Florida economy remains strong • Strategic position provides strong competitive advantage • Expect record results for Railway and rental properties • Railway management team focused on a safe, profitable railway • Real estate team focused on capturing demand and maximizing proper
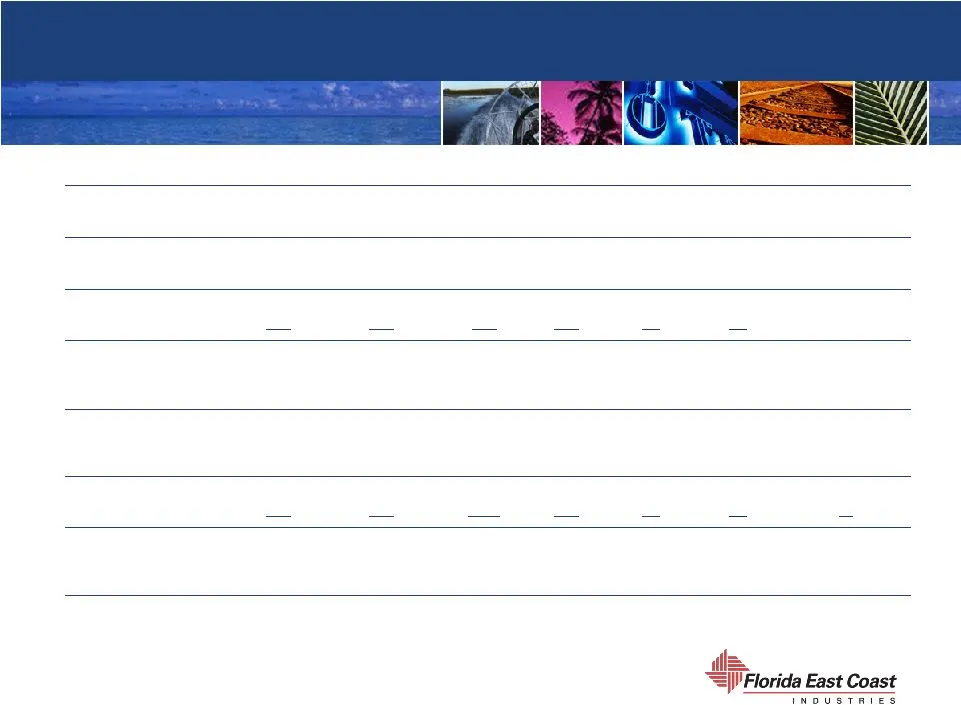
Slide 36: Reconciliation of Non-GAAP to GAAP Measures
Reconciliation of Non-GAAP to GAAP Measures $13.5 7.2 6.3 $21.3 5.4 $15.9 Q205 $14.3 7.4 6.9 $25.7 5.5 $20.2 Q206 $85.5 $67.5 $62.6 $59.9 Railway Segment ’ s operating profit before depreciation $58-$61 $55.8 $44.8 $40.1 $38.8 Rental properties ’ operating profit before D&A expense 28.2 $23.1 22.3 2
Source: SEC EDGAR · 8-K filed Aug 3, 2006
More decks from Florida East Coast Industries Inc
 Merger or Acquisition (May 2007)15 slides · May 31, 2007
 Q1 2007 Earnings Presentation26 slides · May 9, 2007
 Q4 2006 Earnings Presentation39 slides · Feb 15, 2007
 Q3 2006 Earnings Presentation36 slides · Nov 2, 2006
 Ryan Beck Investor Event (September 2006)80 slides · Sep 13, 2006
 Morgan Keegan 2006 Equity Conference30 slides · Sep 7, 2006