Verasun Energy — Q4 2007 Earnings Presentation
21 slides from Verasun Energy's earnings presentation, Mar 12, 2008
Slide 1: America Through Renewable Fuels: Fourth Quarter and Year End 2007 Results
AMERICA THROUGH RENEWABLE FUELS Fourth Quarter and Year End 2007 Results March 12, 2008

Slide 2: Additional Information
Additional Information In connection with the proposed transaction between VeraSun and US BioEnergy, VeraSun has filed with the SEC a registration statement on Form S-4 containing a definitive joint proxy statement of VeraSun and US BioEnergy that also constitutes a prospectus of VeraSun, which was
Slide 3: Revenues Exceeded $848 Million
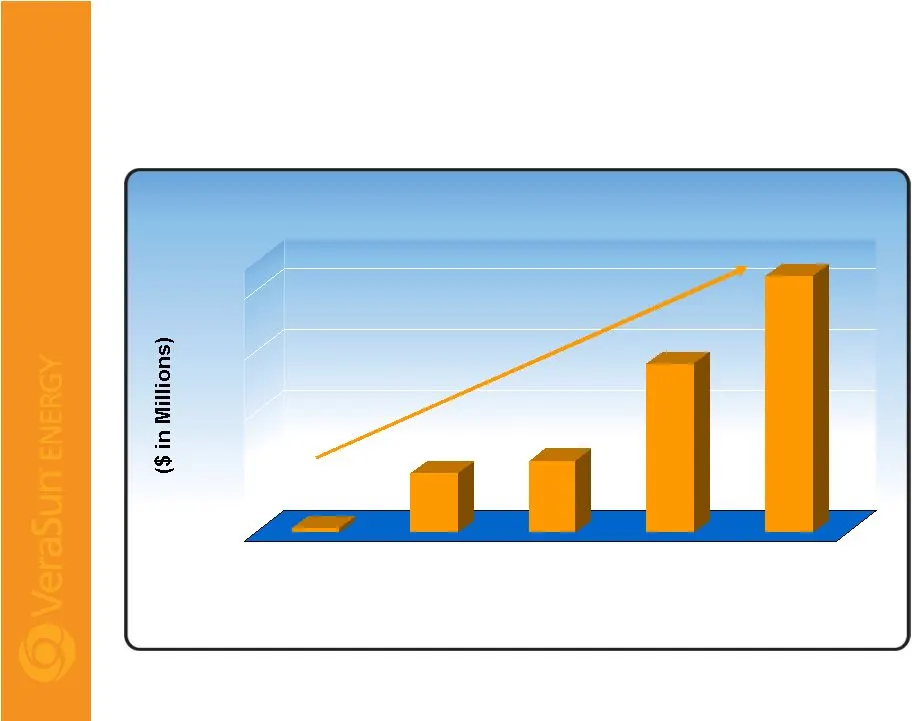
Revenues Exceeded $848 Million Four-Year CAGR of 186% $12.7 $193.5 $236.4 $557.8 $848.3 $0 $200 $400 $600 $800 186% CAGR 2004 2005 2006
Slide 4: Gallons Sold Increased Over Four Years
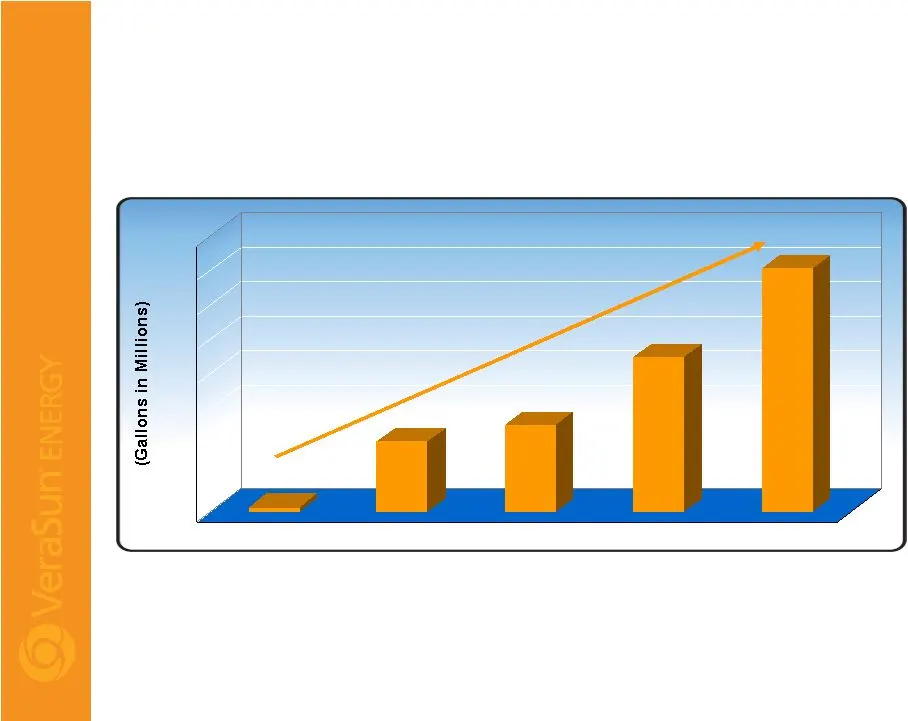
Gallons Sold Increased Over 128 Million Gallons Four-Year CAGR of 172% 6.5 101.4 126.3 224.5 353.1 172% CAGR 2004 2005 2006

Slide 5: Quarterly Financial Results
Quarterly Financial Results ($ in Millions Except EPS Data) Q4 2007 $154.1 Cash and short term investments $0.04 EPS - Diluted 1% % of Revenues $4.0 Net Income 10% % of Revenues $31.1 EBITDA $312.4 Revenues
Slide 6: Q4 Revenues Improved 113%
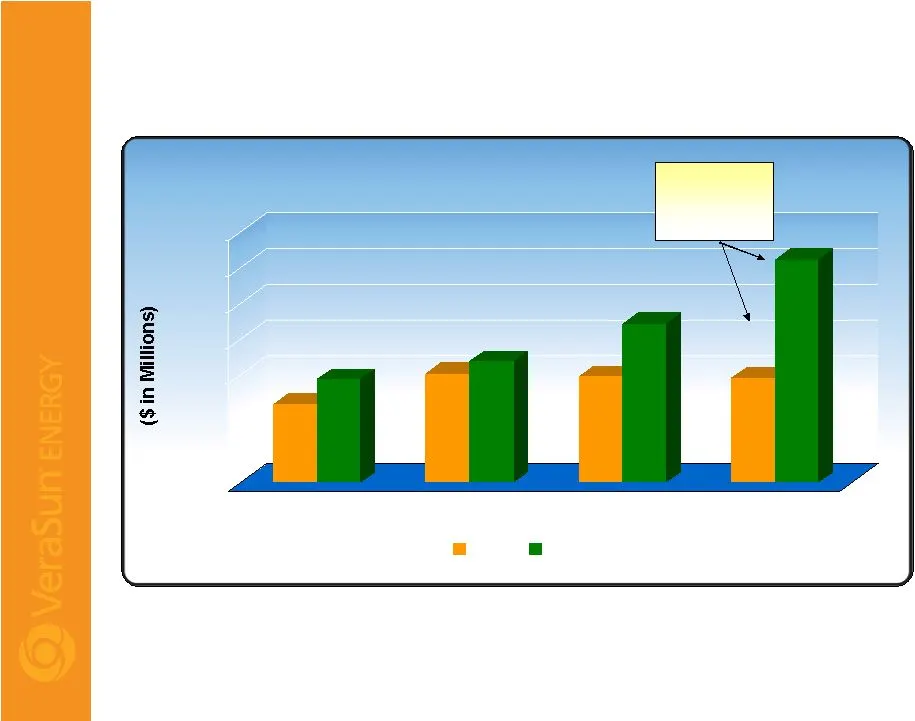
Q4 Revenues Improved 113% $109.9 $144.5 $153.1 $169.6 $148.3 $221.8 $146.5 $312.4 $0 $50 $100 $150 $200 $250 $300 $350 Q1 Q2 Q3 Q4 $165.9 MM +113.2%
Slide 7: Ethanol Gallons Sold
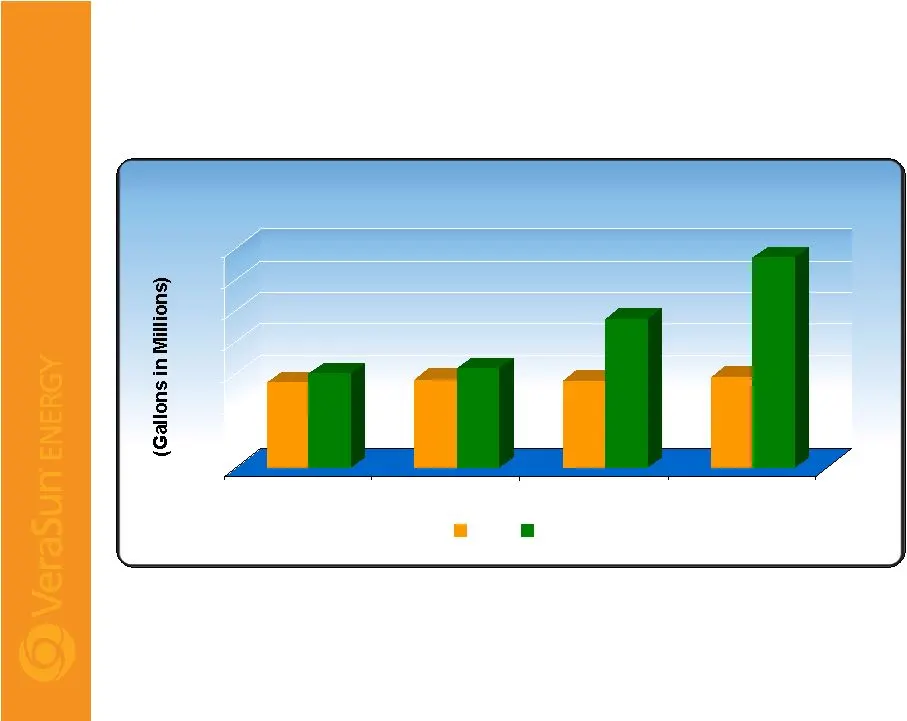
Ethanol Gallons Sold Significant Q4 Volume Growth 54.5 60.2 56.5 63.4 55.4 95.1 58.1 134.4 Q1 Q2 Q3 Q4
Slide 8: Operating Metrics
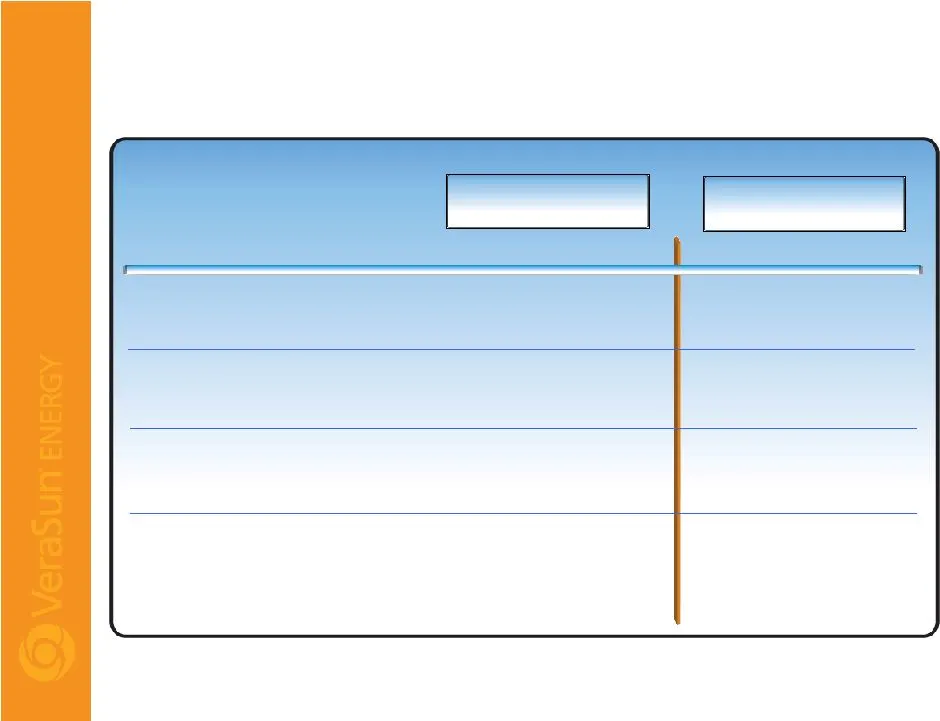
Operating Metrics (15%) (16%) % Change ($1.23) $8.39 $7.16 ($1.39) $8.51 $7.12 Natural Gas ($/MMBTU) 67% 43% % Change $1.44 $2.16 $3.60 $1.09 $2.52 $3.61 Corn Cost ($/Bushel) (9%) (14%) % Change ($0.19) $2.18 $1.99 ($0.30) $2.17 $1.87 Ethanol Prices ($/Gallon) 57% 131% % Change 128.6 224.5 353.1 76.
Slide 9: Financial Performance
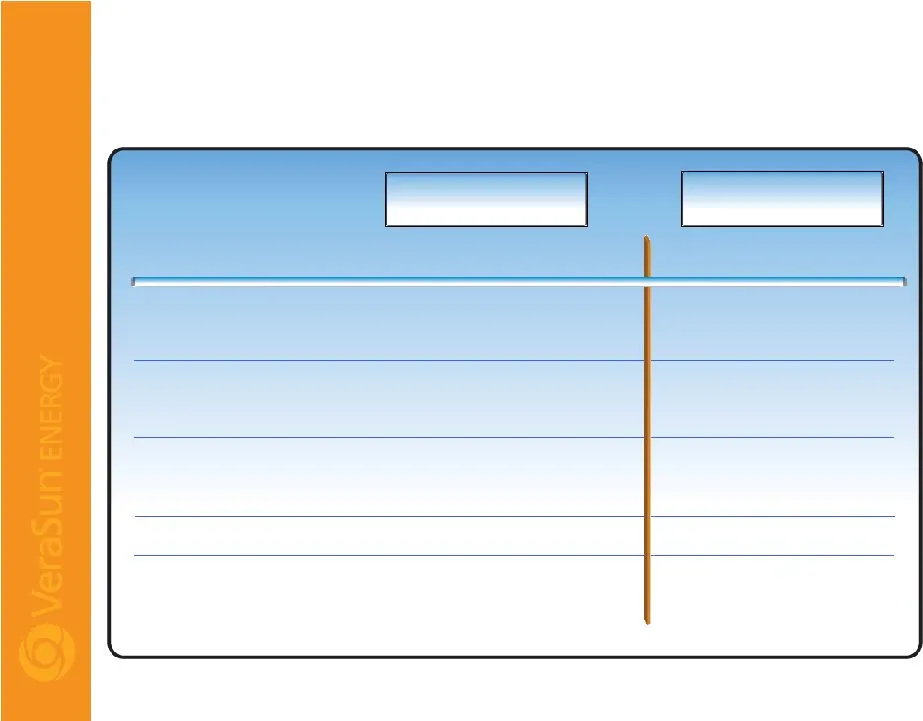
Financial Performance ($ in Millions) Quarter Ended December 31 Twelve Months Ended December 31 $1.03 $0.31 $0.27 $0.04 EPS - Diluted ($58.2) $97.3 $39.1 ($14.5) ($20.1) ($34.6) Operating Cash Flow 32% 11% 28% 10% % of Revenues ($87.2) $177.6 $90.4 ($9.4) $40.5 $31.1 EBITDA 14% 3% 15% 1% % of Revenu
Slide 10: Financial Metrics
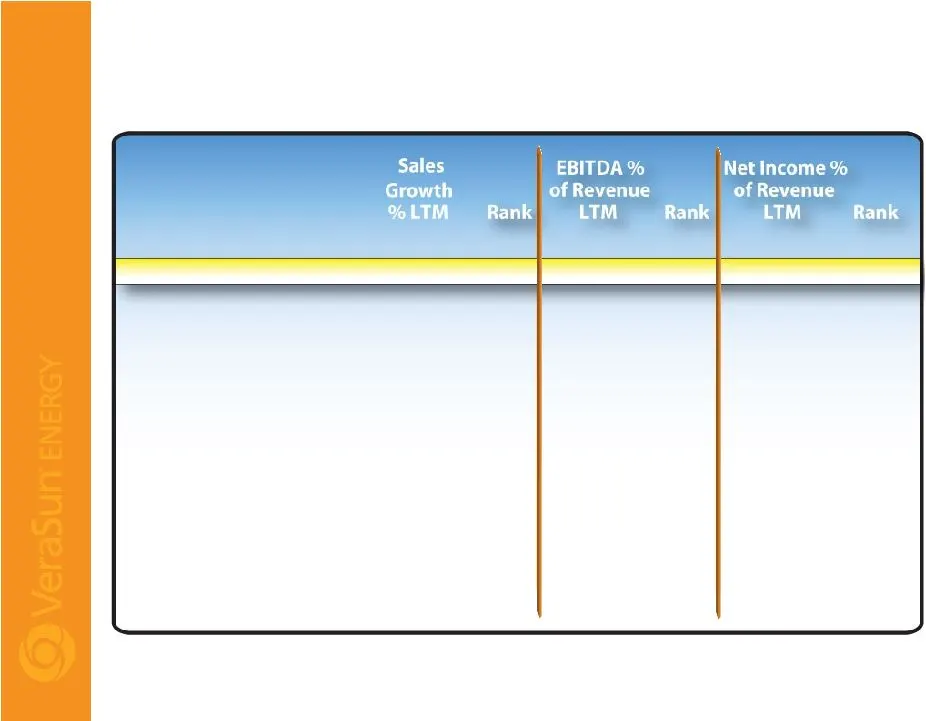
Financial Metrics * * Source: Data included in Q4 2007 public earnings releases and SEC filings. 2.1% 4.8% 16.2% Sunoco (SUN) 2.6% 6.3% 21.1% Tesoro (TSO) 4.9% 9.0% 4.8% Valero (VLO) REFINING/MARKETING 5.8% 13.9% 29.4% Corn Products (CPO) 1.7% 4.2% 70.8% Bunge Ltd (BG) 4.2% 7.6% 35.4% Archer Daniels
Slide 11: Ethanol Prices Continue to Rise
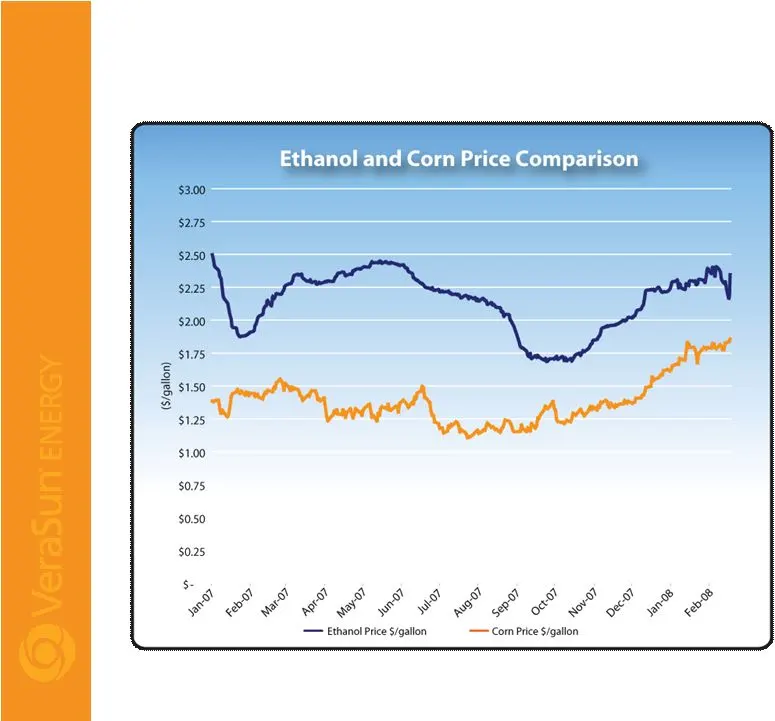
Ethanol Prices Continue to Rise Source: Bloomberg & CBOT
Slide 12: Projected Growth Followed by a Plateau
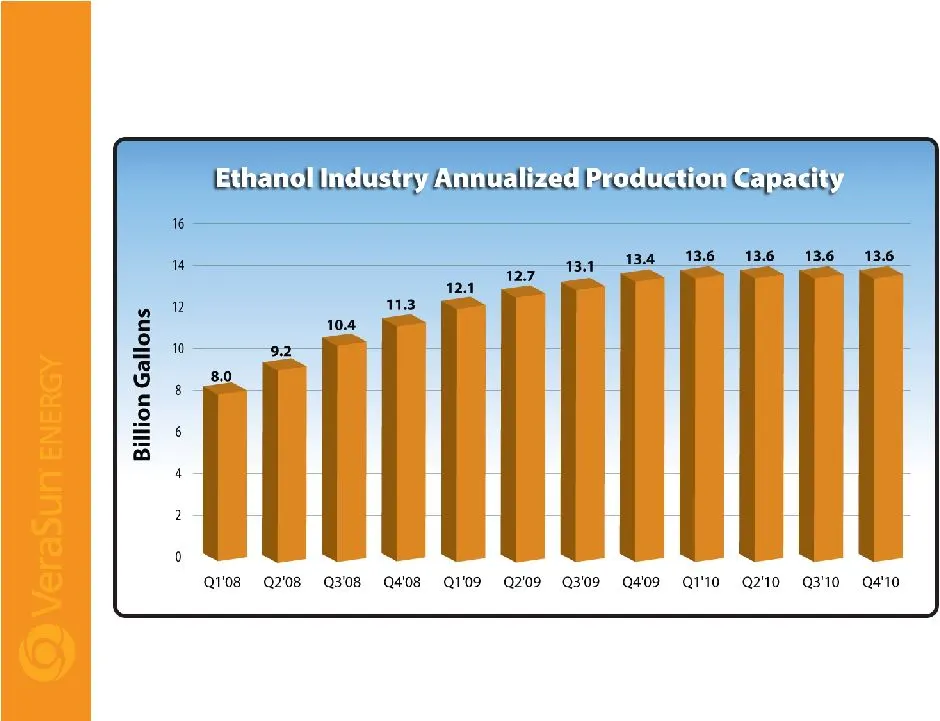
Projected Growth Followed by a Plateau Gallons are assumed to be 50% of nameplate during the first quarter of start-up, approximating a midpoint average start-up during the quarter; Start-up schedule derived from information provided through BBI and Ethanol Producer Magazine; Actual start-ups could
Slide 13: Significant Ethanol Demand
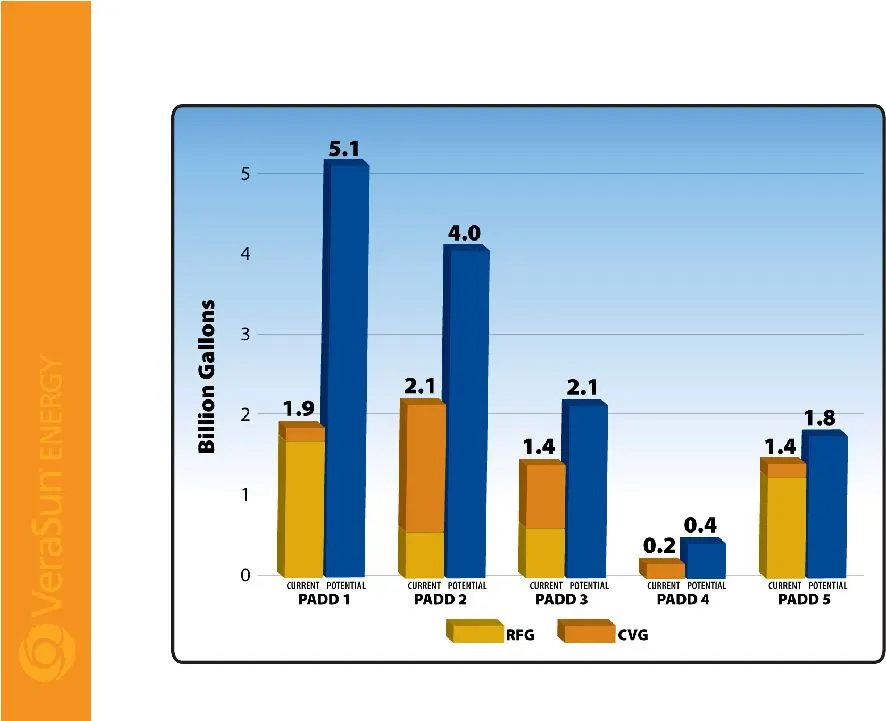
Significant Ethanol Demand Demand calculated by taking 10% of RFG and CVG gasoline volumes for each PADD, except PADD V which was calculated using 7% of total volume based on California’s 5.6% blend requirement. Source: EIA, PIRA
Slide 14: Product Distribution by Unit Trains
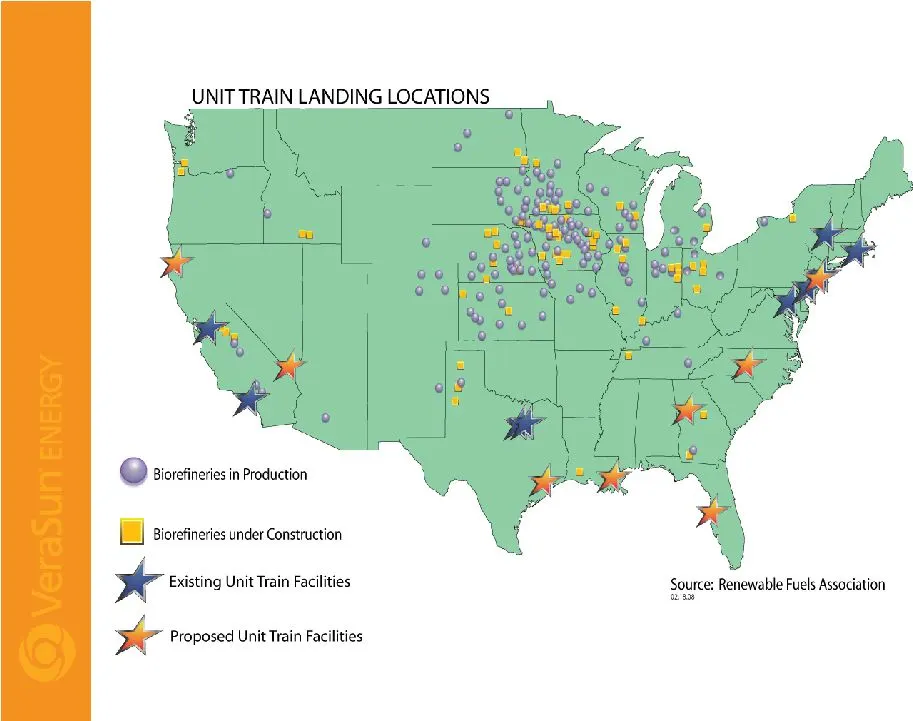
Product Distribution by Unit Trains
Slide 15: 1.5 Billion Additional Bushels Over 2006
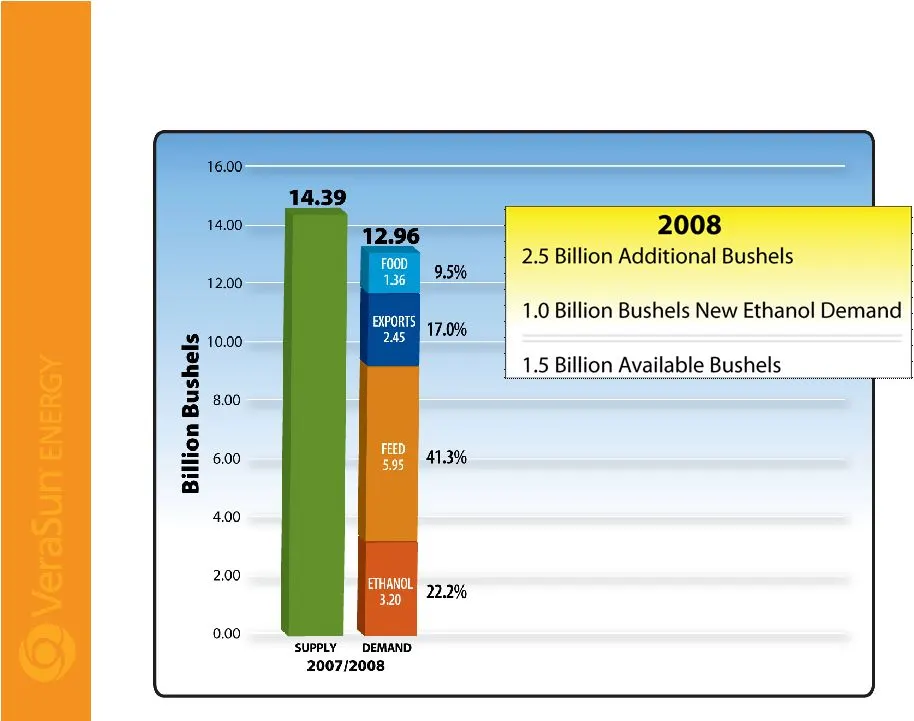
1.5 Billion Additional Bushels Over 2006 More Corn For Feed, Food and Exports Source: USDA, NCGA
Slide 16: Minor Impact on Retail Food Price
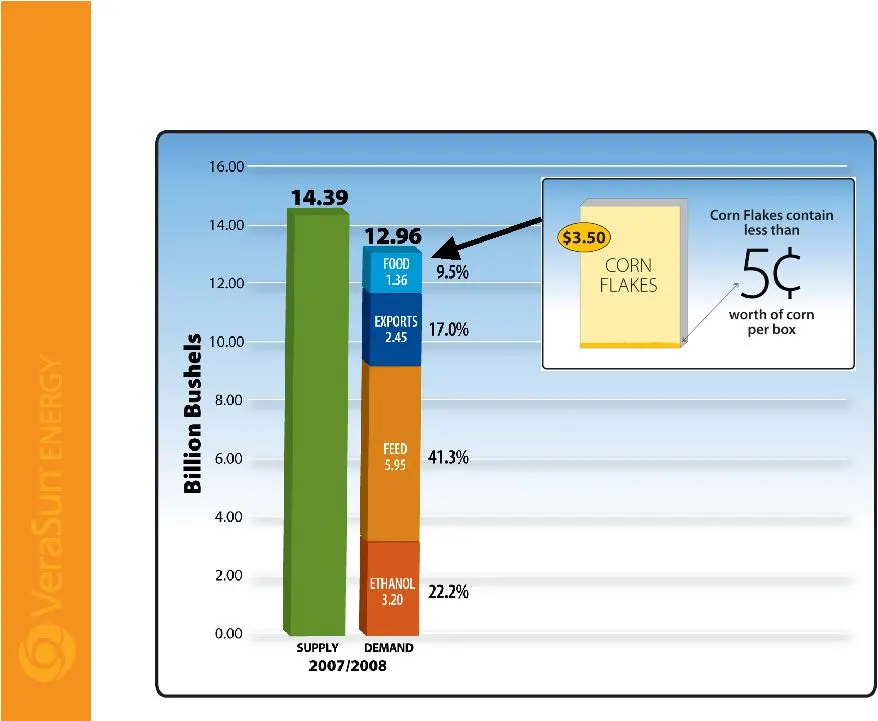
Minor Impact on Retail Food Price Less Than 10% of Corn Used for Food Source: USDA, NCGA
Slide 17: Corn Yields Accelerating
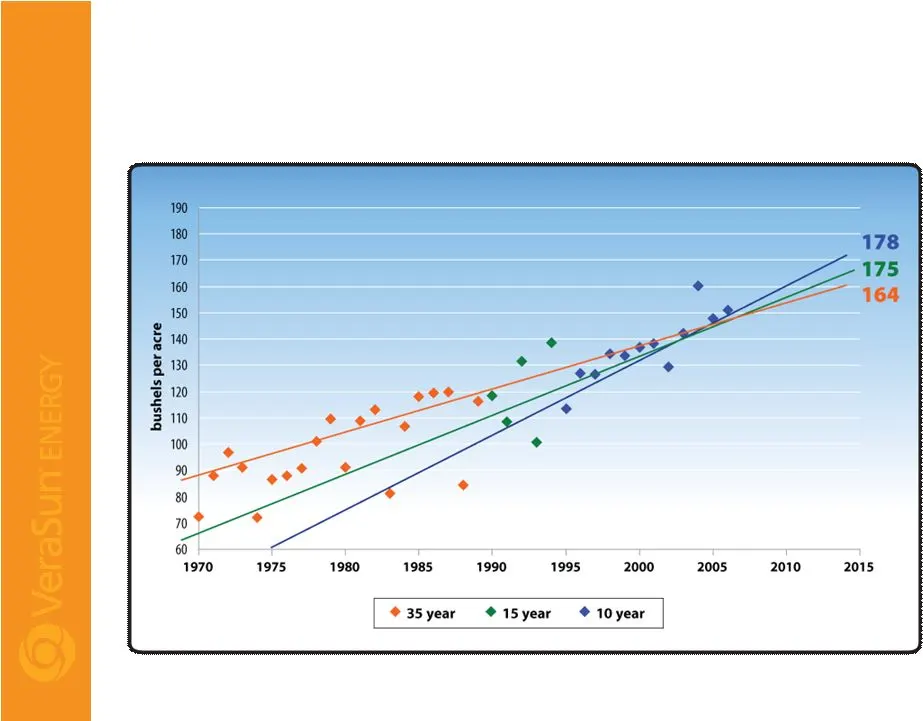
Corn Yields Accelerating USDA Predicts 178 Bushels Per Acre by 2015 Source: USDA
Slide 18: Corn Yields Accelerating
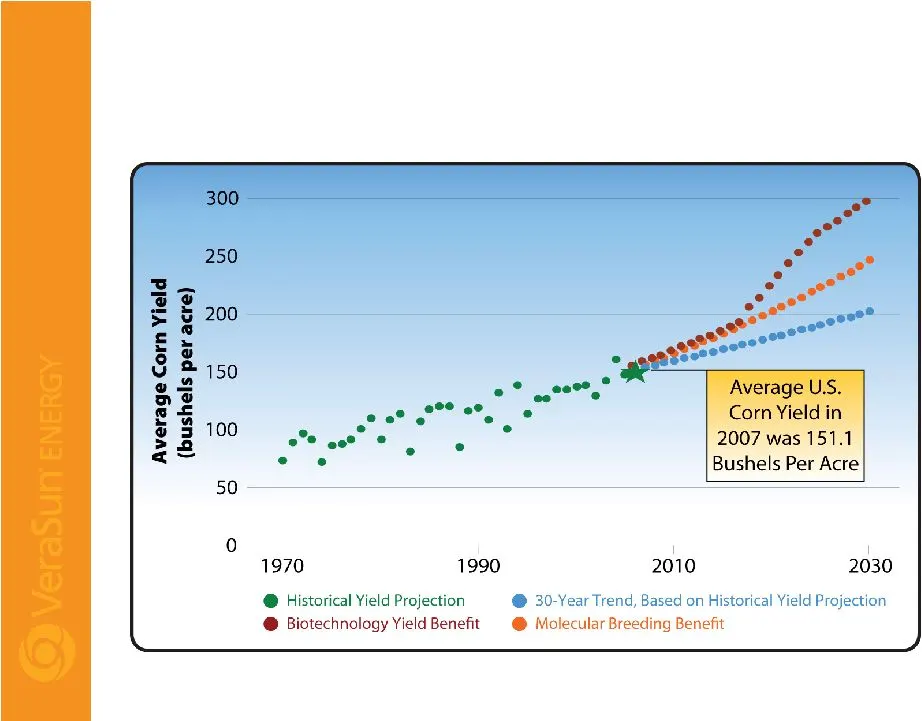
Corn Yields Accelerating Monsanto Predicts 300 Bushels Per Acre by 2030 Source: National Corn Growers Presentation by Rick Tolman at the National Renewable Fuels Conference on Monsanto Yield Projection
Slide 19: Corn Ethanol Production Potential
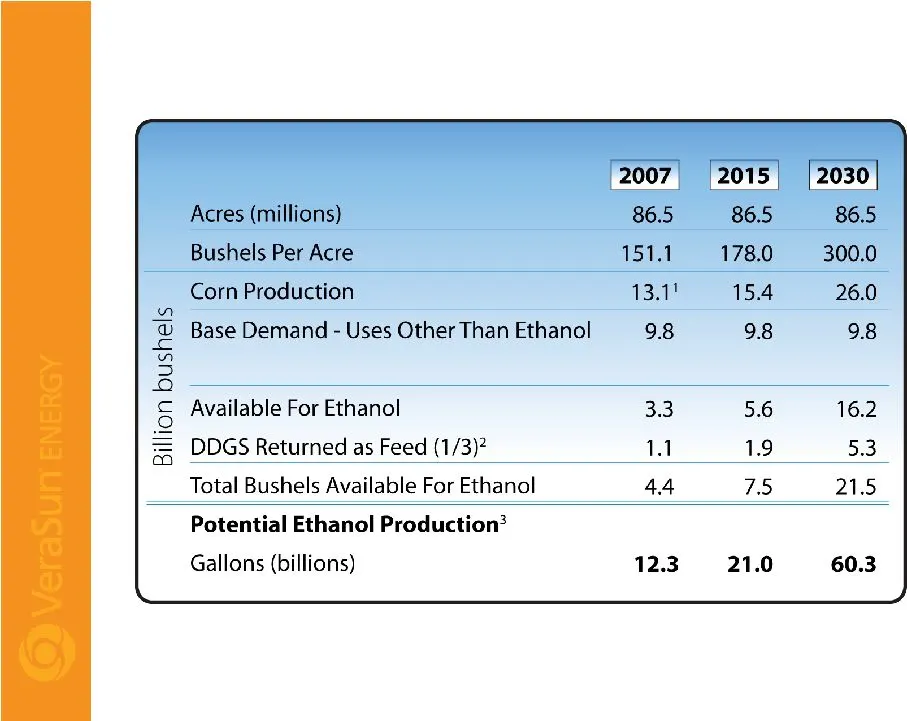
Corn Ethanol Production Potential Source: USDA, FC Stone Research, VeraSun projections (1) Does not include 1.3 billion bushel carry-in (2) DDGS will displace corn and/or soybean meal. Soybean displacement will reduce acres needed for soybeans and provide for more corn production. Results could vary
Slide 20: America Through Renewable Fuels: Fourth Quarter and Year End 2007 Results
AMERICA THROUGH RENEWABLE FUELS Fourth Quarter and Year End 2007 Results March 12, 2008
Slide 21: Net Income to EBITDA Reconciliation
Net Income to EBITDA Reconciliation ($ in Millions) Quarter Ended December 31 Twelve Months Ended December 31 $177.6 $90.4 $40.5 $31.1 EBITDA 54.3 10.4 13.2 4.8 Income Tax Expense (Benefit) 37.9 33.4 3.4 13.4 Interest Expense 9.7 20.0 2.5 8.9 Depreciation $75.7 $26.6 $21.4 $4.0 Net Income P RELIMINA
Source: SEC EDGAR · 425 filed Mar 12, 2008