Bridge Investment Group Holdings Inc
Bridge Investment — FY2021 Earnings Presentation
37 slides from Bridge Investment's earnings presentation, Mar 2, 2022
Slide 1: 4th Quarter and Full Year 2021 Earnings Presentation
th 4 Quarter and Full Year 2021 Earnings Presentation MARCH 3, 2022
Slide 2: Disclaimer
DISCLAIMER The information contained herein does not constitute or form part of, and should not be construed as, an offer or invitation to subscribe for, underwrite or otherwise acquire, any securities of Bridge Investment Group Holdings Inc. (“Bridge” or the “Company”) or any affiliate of Bridge, o
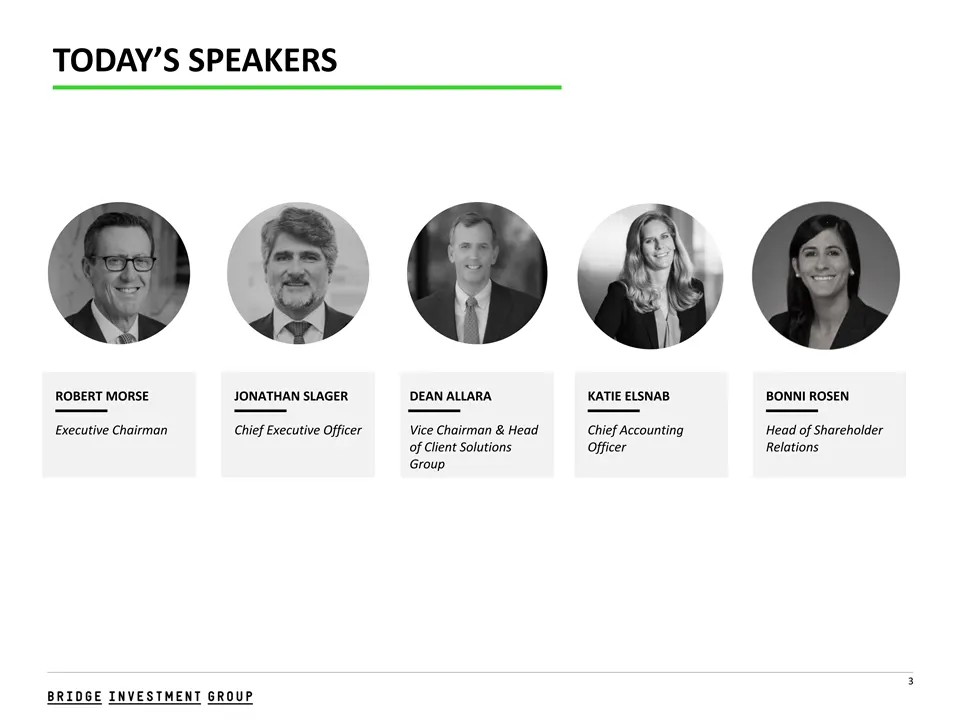
Slide 3: Today's Speakers
TODAY’S SPEAKERS ROBERT MORSE JONATHAN SLAGER DEAN ALLARA KATIE ELSNAB BONNI ROSEN Executive Chairman Chief Executive Officer Vice Chairman & Head Chief Accounting Head of Shareholder of Client Solutions Officer Relations Group 3
Slide 4: Chairman Commentary
CHAIRMAN COMMENTARY RID GE ROU STMENT p
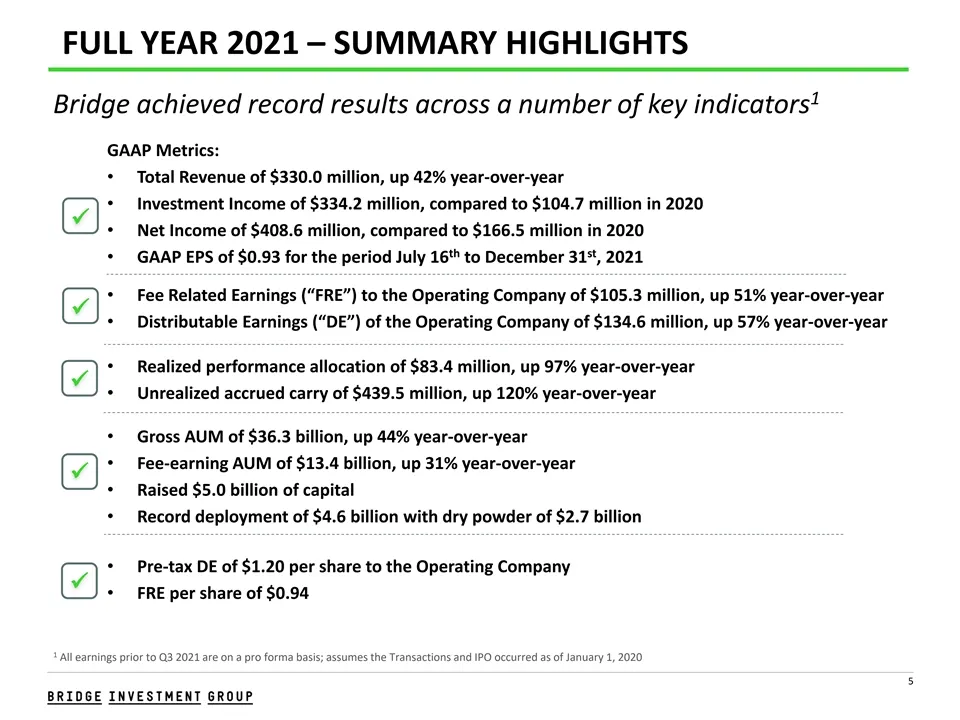
Slide 5: Full Year 2021 – Summary Highlights
FULL YEAR 2021 – SUMMARY HIGHLIGHTS 1 Bridge achieved record results across a number of key indicators GAAP Metrics: • Total Revenue of $330.0 million, up 42% year-over-year • Investment Income of $334.2 million, compared to $104.7 million in 2020 ✓ • Net Income of $408.6 million, compared to $166.5
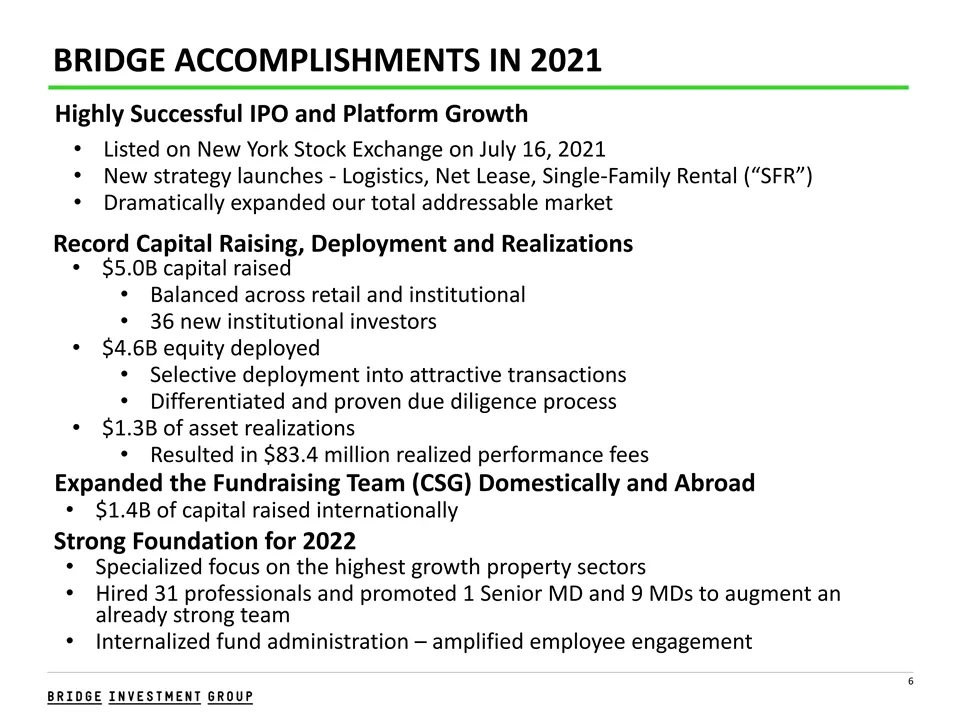
Slide 6: Bridge Accomplishments in 2021
BRIDGE ACCOMPLISHMENTS IN 2021 Highly Successful IPO and Platform Growth • Listed on New York Stock Exchange on July 16, 2021 • New strategy launches - Logistics, Net Lease, Single-Family Rental (“SFR”) • Dramatically expanded our total addressable market Record Capital Raising, Deployment and Reali
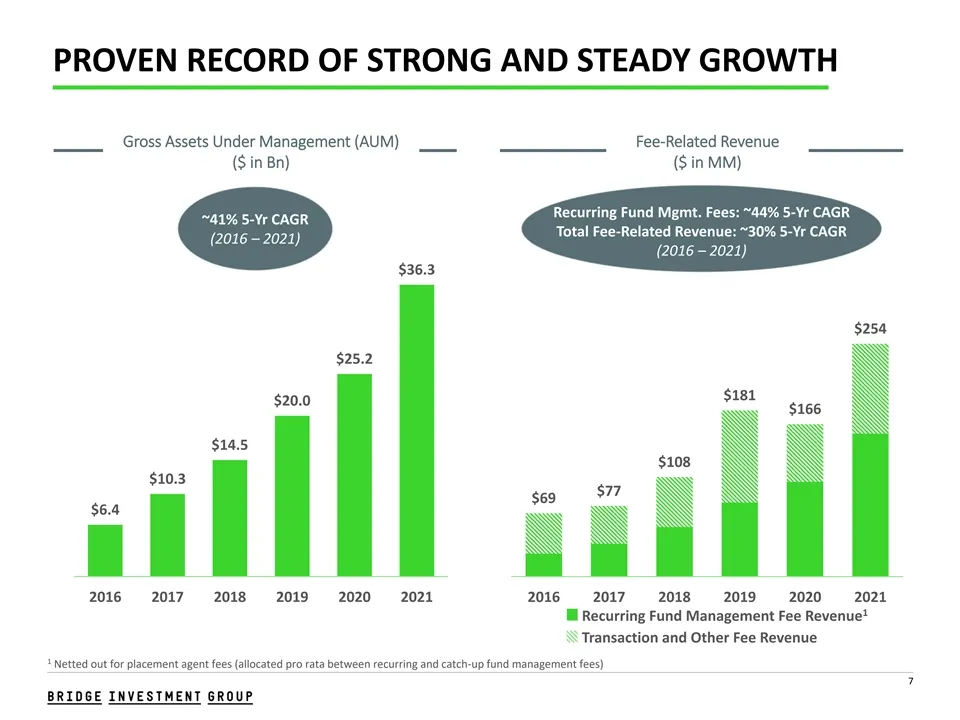
Slide 7: Proven Record of Strong and Steady Growth
PROVEN RECORD OF STRONG AND STEADY GROWTH Gross Assets Under Management (AUM) Fee-Related Revenue ($ in Bn) ($ in MM) Recurring Fund Mgmt. Fees: ~44% 5-Yr CAGR ~41% 5-Yr CAGR Total Fee-Related Revenue: ~30% 5-Yr CAGR (2016 – 2021) (2016 – 2021) $36.3 $254 $25.2 $181 $20.0 $166 $14.5 $108 $10.3 $77 $
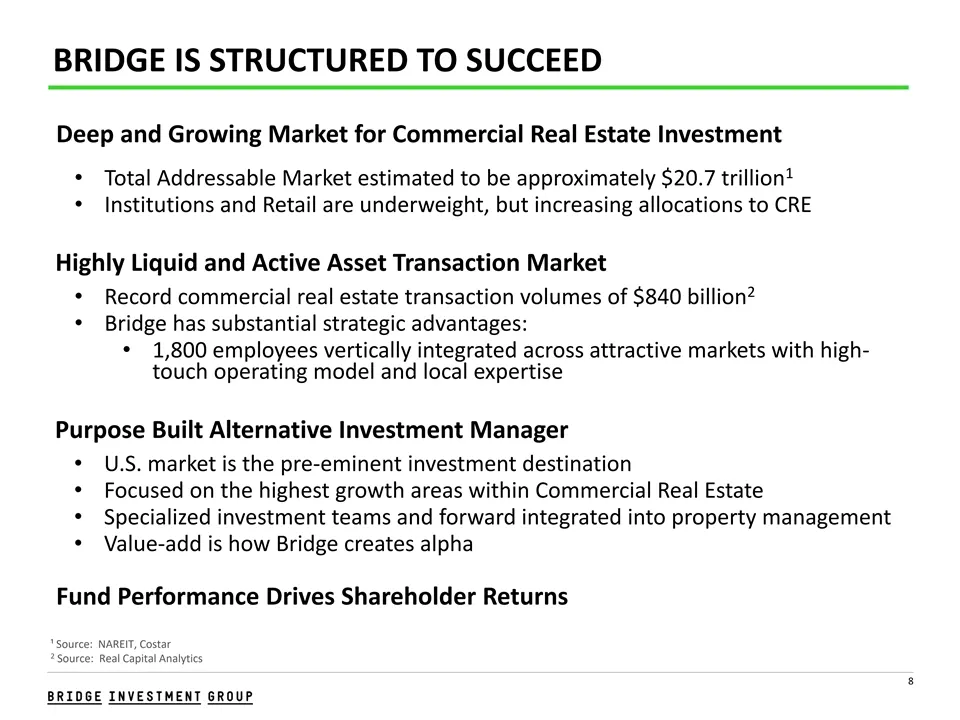
Slide 8: Bridge Is Structured to Succeed
BRIDGE IS STRUCTURED TO SUCCEED Deep and Growing Market for Commercial Real Estate Investment 1 • Total Addressable Market estimated to be approximately $20.7 trillion • Institutions and Retail are underweight, but increasing allocations to CRE Highly Liquid and Active Asset Transaction Market 2 • R
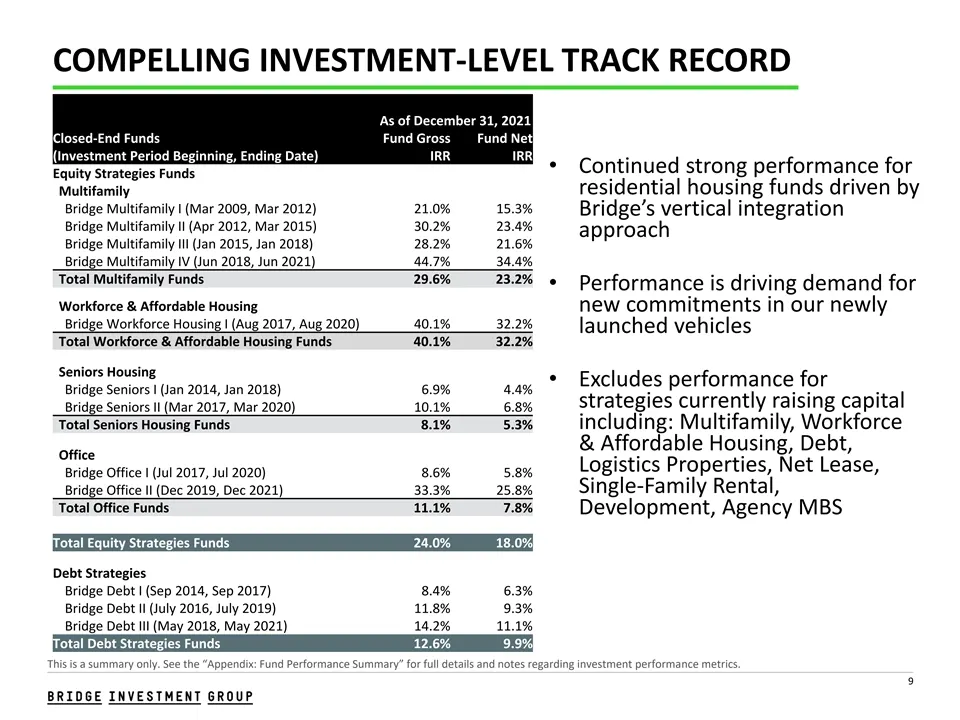
Slide 9: Investment-Level Track Record
COMPELLING INVESTMENT-LEVEL TRACK RECORD As of December 31, 2021 Closed-End Funds Fund Gross Fund Net (Investment Period Beginning, Ending Date) IRR IRR • Continued strong performance for Equity Strategies Funds residential housing funds driven by Multifamily Bridge Multifamily I (Mar 2009, Mar 2012
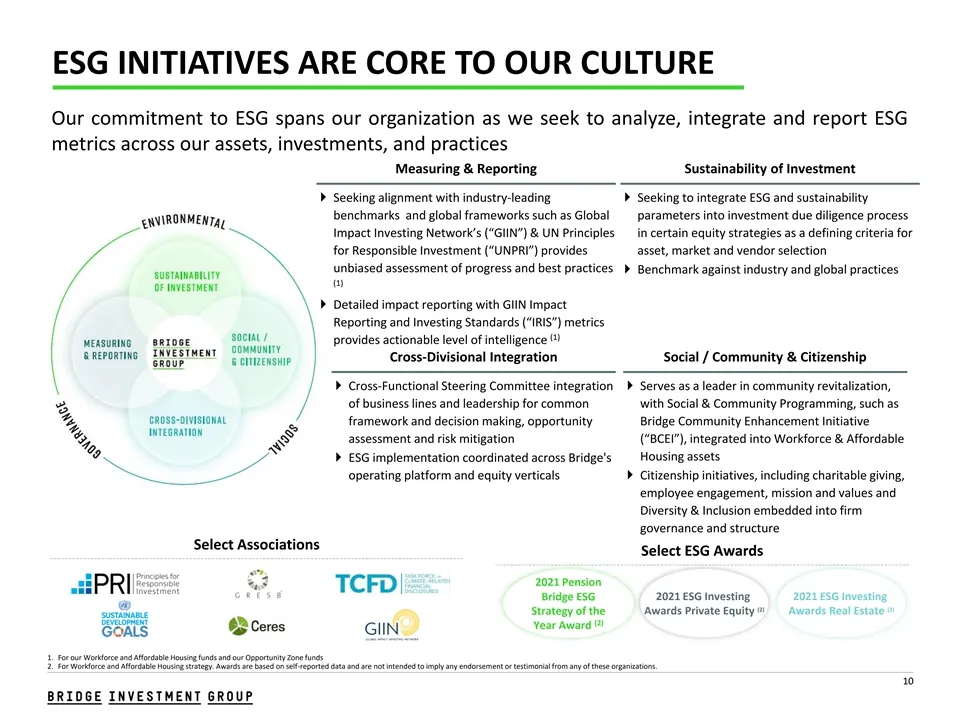
Slide 10: ESG Initiatives Are Core to Our Culture
ESG INITIATIVES ARE CORE TO OUR CULTURE Our commitment to ESG spans our organization as we seek to analyze, integrate and report ESG metrics across our assets, investments, and practices Measuring & Reporting Sustainability of Investment 4 Seeking alignment with industry-leading 4 Seeking to integra
Slide 11: 4th Quarter Summary Highlights
TH 4 QUARTER SUMMARY HIGHLIGHTS
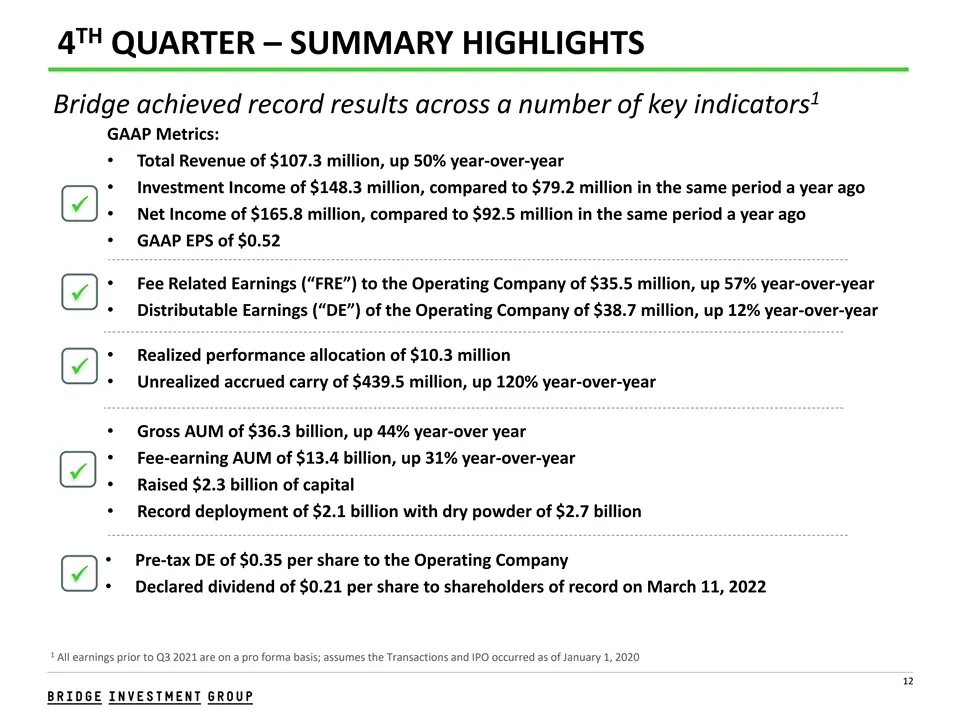
Slide 12: 4th Quarter – Summary Highlights
TH 4 QUARTER – SUMMARY HIGHLIGHTS 1 Bridge achieved record results across a number of key indicators GAAP Metrics: • Total Revenue of $107.3 million, up 50% year-over-year • Investment Income of $148.3 million, compared to $79.2 million in the same period a year ago ✓ • Net Income of $165.8 million,
Slide 13: 4th Quarter – Summary Results
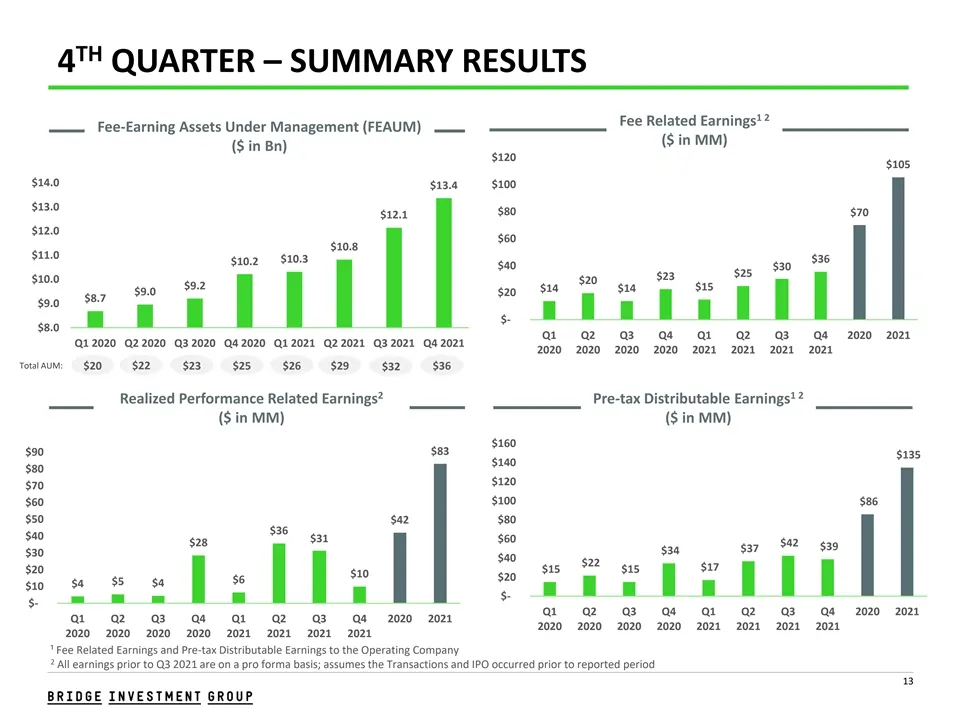
TH 4 QUARTER – SUMMARY RESULTS 1 2 Fee Related Earnings Fee-Earning Assets Under Management (FEAUM) ($ in MM) ($ in Bn) $120 $105 $14.0 $100 $13.4 $13.0 $80 $70 $12.1 $12.0 $60 $10.8 $11.0 $10.3 $36 $10.2 $40 $30 $25 $23 $10.0 $20 $9.2 $15 $14 $14 $9.0 $20 $8.7 $9.0 $- $8.0 Q1 Q2 Q3 Q4 Q1 Q2 Q3 Q4 2
Slide 14: Long Duration Capital Drives Fee Visibility
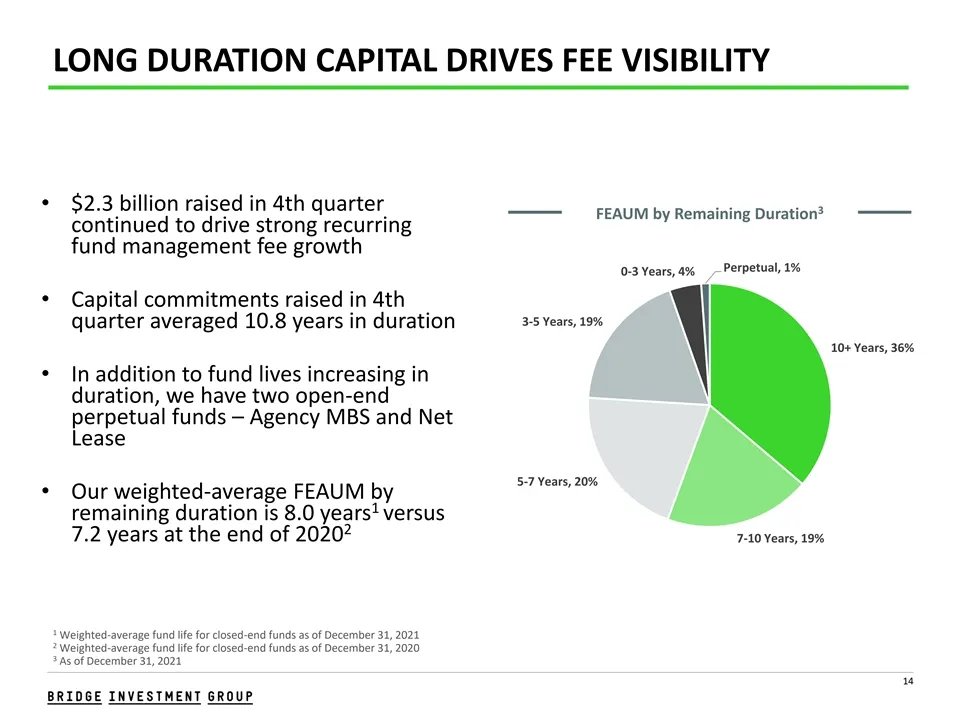
LONG DURATION CAPITAL DRIVES FEE VISIBILITY • $2.3 billion raised in 4th quarter 3 FEAUM by Remaining Duration continued to drive strong recurring fund management fee growth Perpetual, 1% 0-3 Years, 4% • Capital commitments raised in 4th 3-5 Years, 19% quarter averaged 10.8 years in duration 10+ Yea
Slide 15: Performance Fees
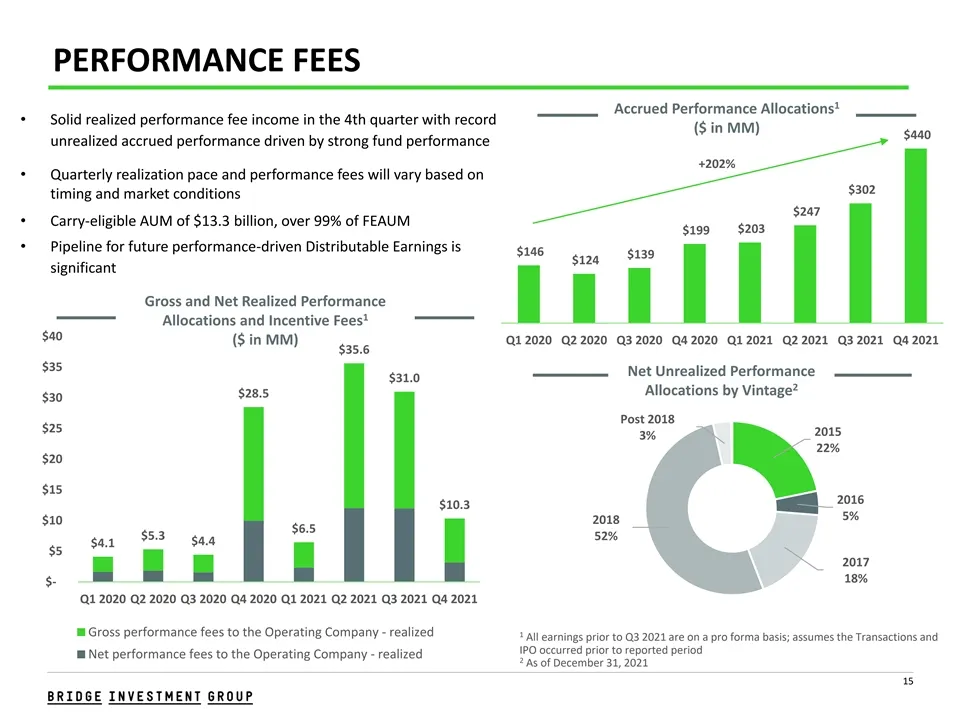
PERFORMANCE FEES 1 Accrued Performance Allocations Accrued Performance Allocations ($MM) • Solid realized performance fee income in the 4th quarter with record ($ in MM) $440 unrealized accrued performance driven by strong fund performance +202% • Quarterly realization pace and performance fees will
Slide 16: Single Family Rental Strategy: Bridge Homes
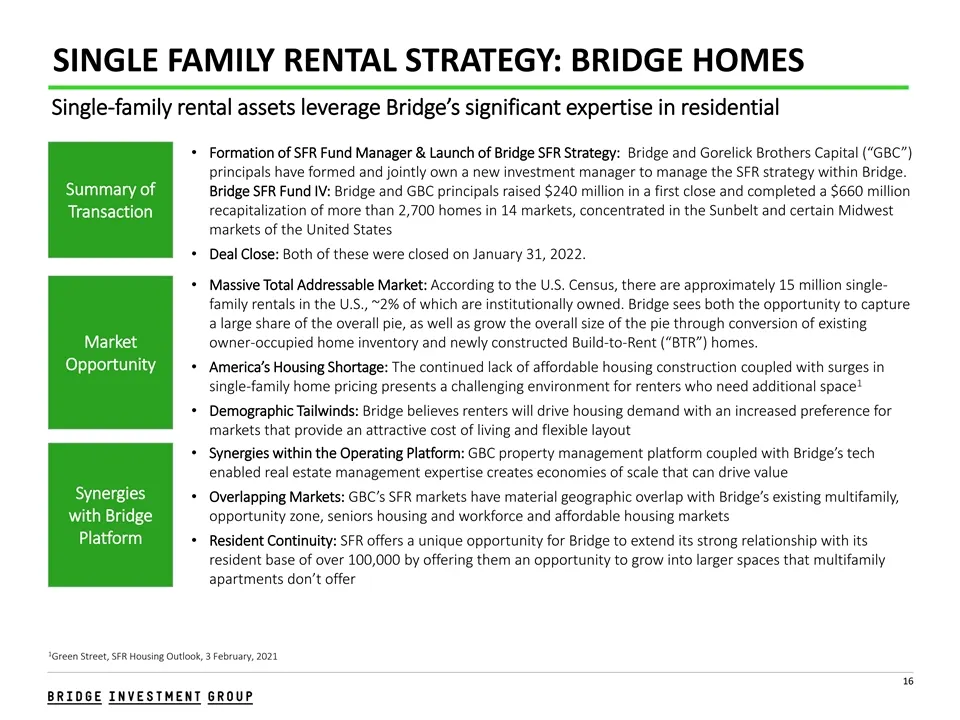
SINGLE FAMILY RENTAL STRATEGY: BRIDGE HOMES Single-family rental assets leverage Bridge’s significant expertise in residential • Formation of SFR Fund Manager & Launch of Bridge SFR Strategy: Bridge and Gorelick Brothers Capital (“GBC”) principals have formed and jointly own a new investment manager
Slide 17: Leveraging Expertise in Residential Real Estate
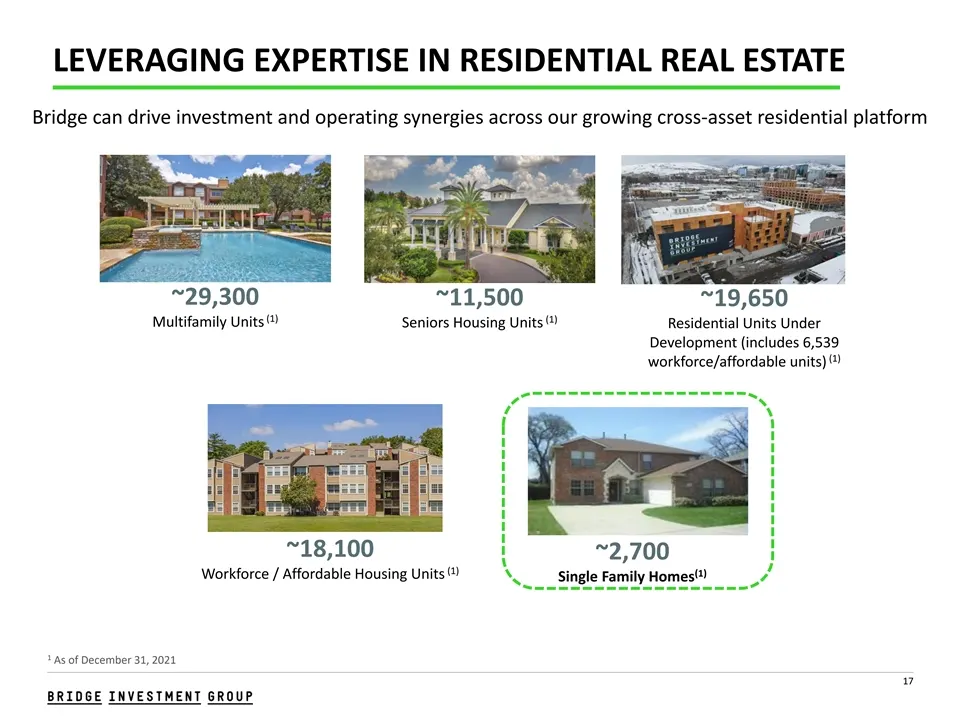
LEVERAGING EXPERTISE IN RESIDENTIAL REAL ESTATE Bridge can drive investment and operating synergies across our growing cross-asset residential platform ~29,300 ~11,500 ~19,650 (1) (1) Multifamily Units Seniors Housing Units Residential Units Under Development (includes 6,539 (1) workforce/affordable
Slide 18: Fundraising Highlights
FUNDRAISING HIGHLIGHTS RID GE ROU STMENT p
Slide 19: 2021 in Review – Fundraising Highlights
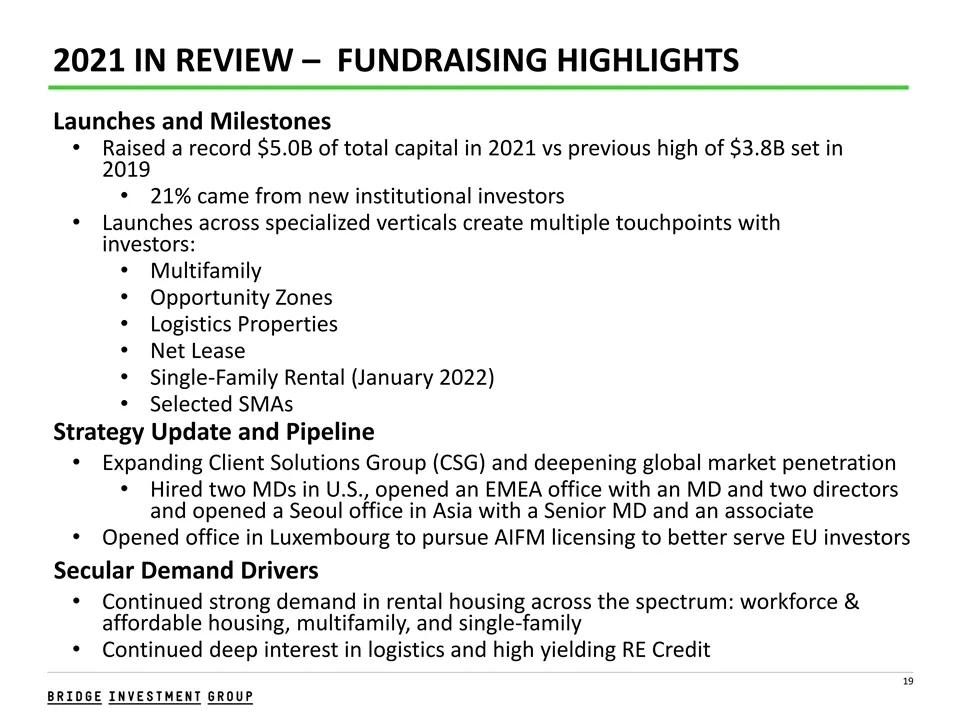
2021 IN REVIEW – FUNDRAISING HIGHLIGHTS Launches and Milestones • Raised a record $5.0B of total capital in 2021 vs previous high of $3.8B set in 2019 • 21% came from new institutional investors • Launches across specialized verticals create multiple touchpoints with investors: • Multifamily • Oppor
Slide 20: Fundraising Is a Key Growth Driver
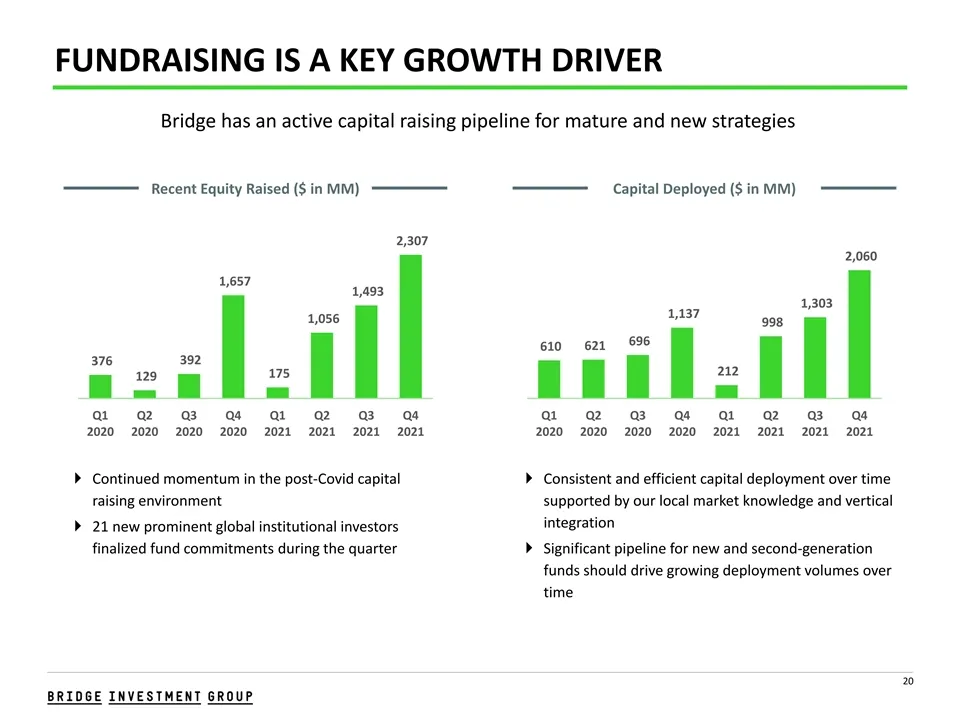
FUNDRAISING IS A KEY GROWTH DRIVER Bridge has an active capital raising pipeline for mature and new strategies Recent Equity Raised ($ in MM) Capital Deployed ($ in MM) 2,307 2,060 1,657 1,493 1,303 1,137 1,056 998 696 610 621 392 376 212 175 129 Q1 Q2 Q3 Q4 Q1 Q2 Q3 Q4 Q1 Q2 Q3 Q4 Q1 Q2 Q3 Q4 2020
Slide 21: 4th Quarter and Year End Financial Review
TH 4 QUARTER AND YEAR END FINANCIAL REVIEW
Slide 22: GAAP Income Statement
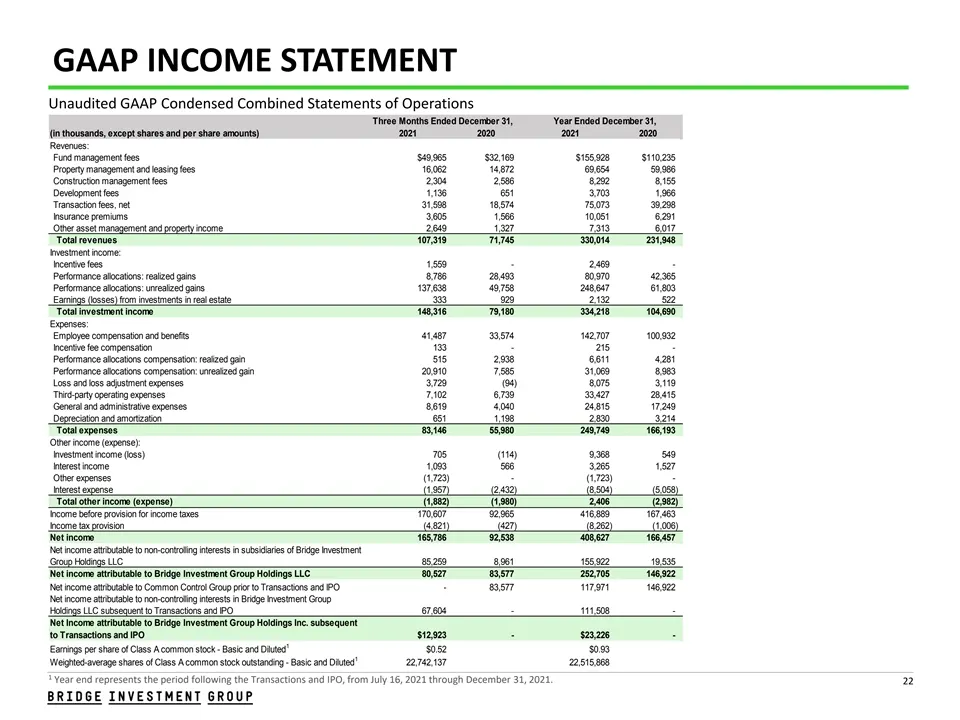
GAAP INCOME STATEMENT Unaudited GAAP Condensed Combined Statements of Operations Three Months Ended December 31, Year Ended December 31, (in thousands, except shares and per share amounts) 2021 2020 2021 2020 Revenues: Fund management fees $49,965 $32,169 $155,928 $110,235 Property management and le
Slide 23: Non-GAAP Income Statement Summary
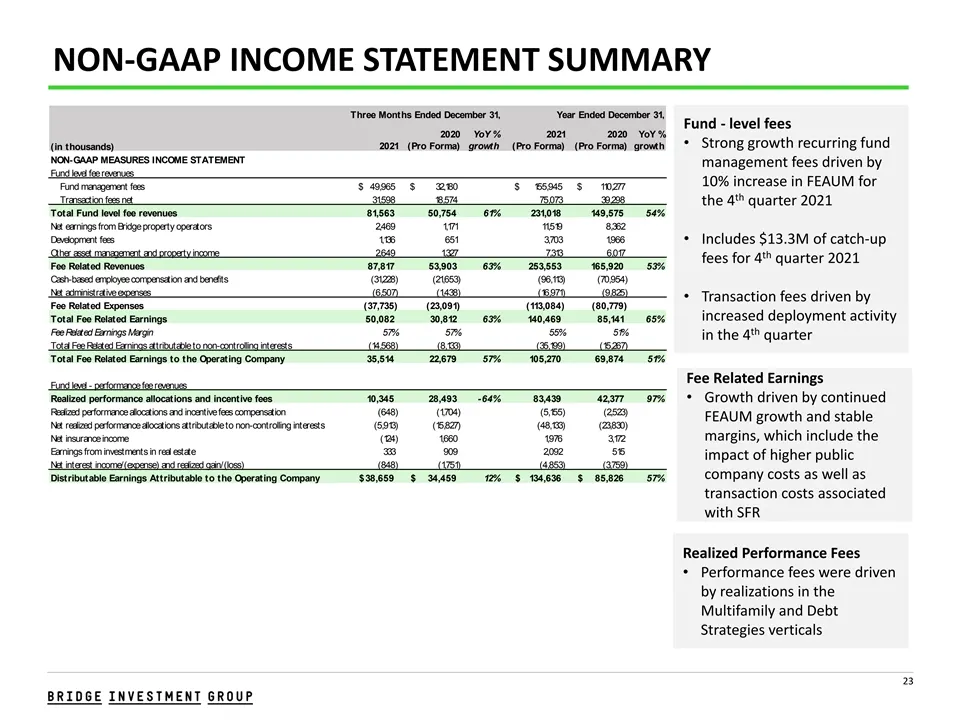
NON-GAAP INCOME STATEMENT SUMMARY Three Months Ended December 31, Year Ended December 31, Fund - level fees 2020 YoY % 2021 2020 YoY % • Strong growth recurring fund 2021 (Pro Forma) growth (Pro Forma) (Pro Forma) growth (in thousands) NON-GAAP MEASURES INCOME STATEMENT management fees driven by Fun
Slide 24: Distributable Earnings and Capitalization
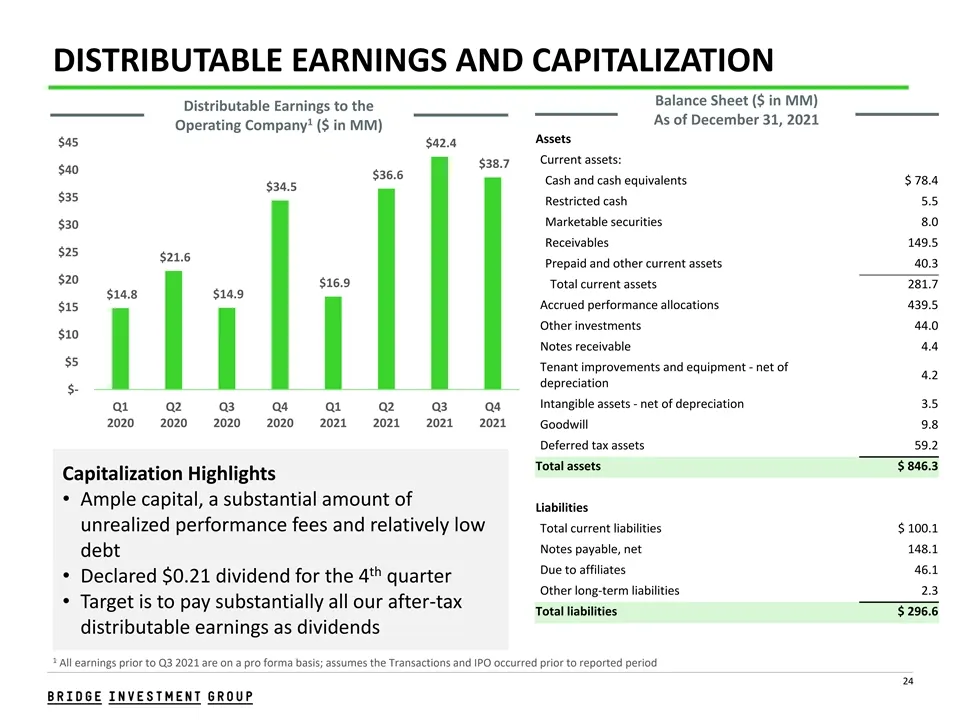
DISTRIBUTABLE EARNINGS AND CAPITALIZATION Balance Sheet ($ in MM) Distributable Earnings to the 1 As of December 31, 2021 Operating Company ($ in MM) Assets $45 $42.4 Current assets: $38.7 $40 $36.6 Cash and cash equivalents $ 78.4 $34.5 $35 Restricted cash 5.5 Marketable securities 8.0 $30 Receivab
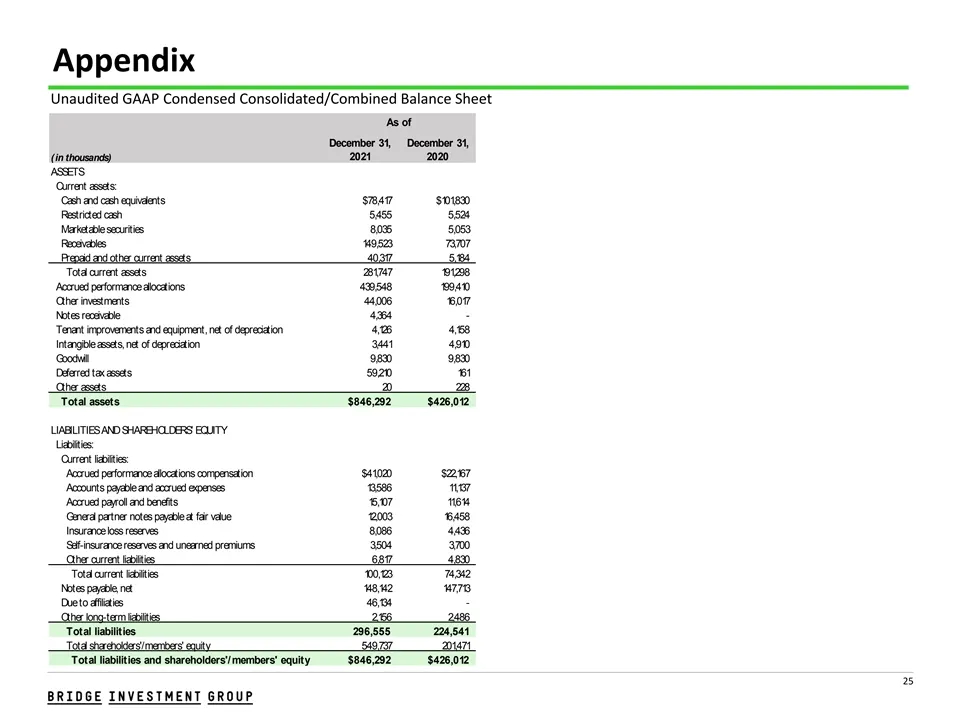
Slide 25: Unaudited GAAP Condensed Consolidated/Combined Balance Sheet
Appendix Unaudited GAAP Condensed Consolidated/Combined Balance Sheet As of December 31, December 31, 2021 2020 (in thousands) ASSETS Current assets: Cash and cash equivalents $78,417 $101,830 Restricted cash 5,455 5,524 Marketable securities 8,035 5,053 Receivables 149,523 73,707 Prepaid and other
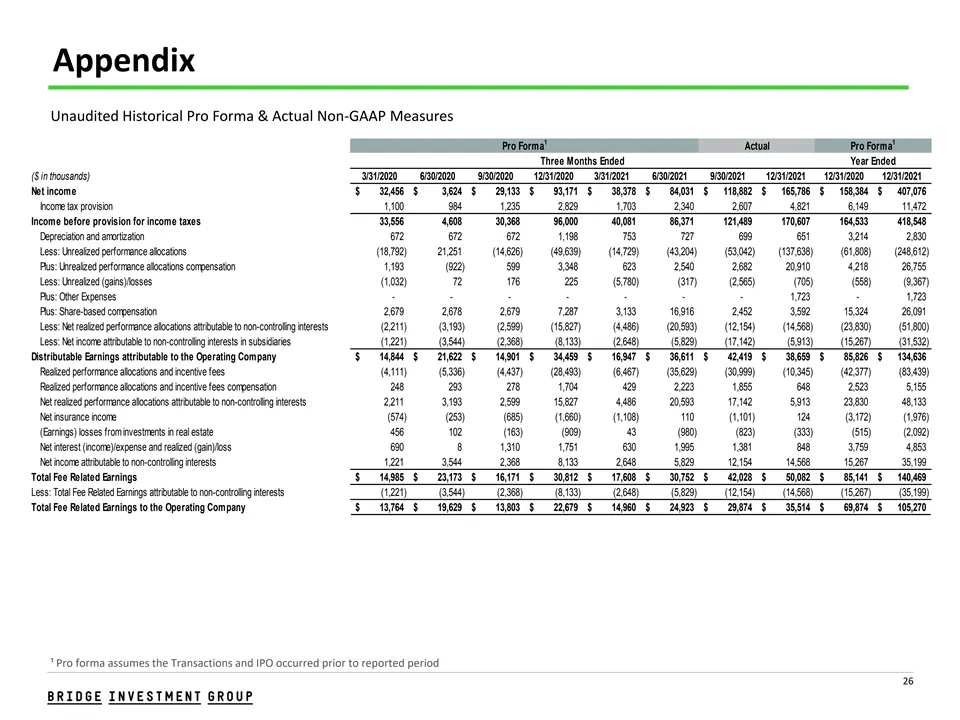
Slide 26: Historical Pro Forma & Actual Non-GAAP Measures
Appendix Unaudited Historical Pro Forma & Actual Non-GAAP Measures 1 1 Pro Forma Actual Pro Forma Three Months Ended Year Ended ($ in thousands) 3/31/2020 6/30/2020 9/30/2020 12/31/2020 3/31/2021 6/30/2021 9/30/2021 12/31/2021 12/31/2020 12/31/2021 Net income $ 32,456 $ 3,624 $ 29,133 $ 9 3,171 $ 3
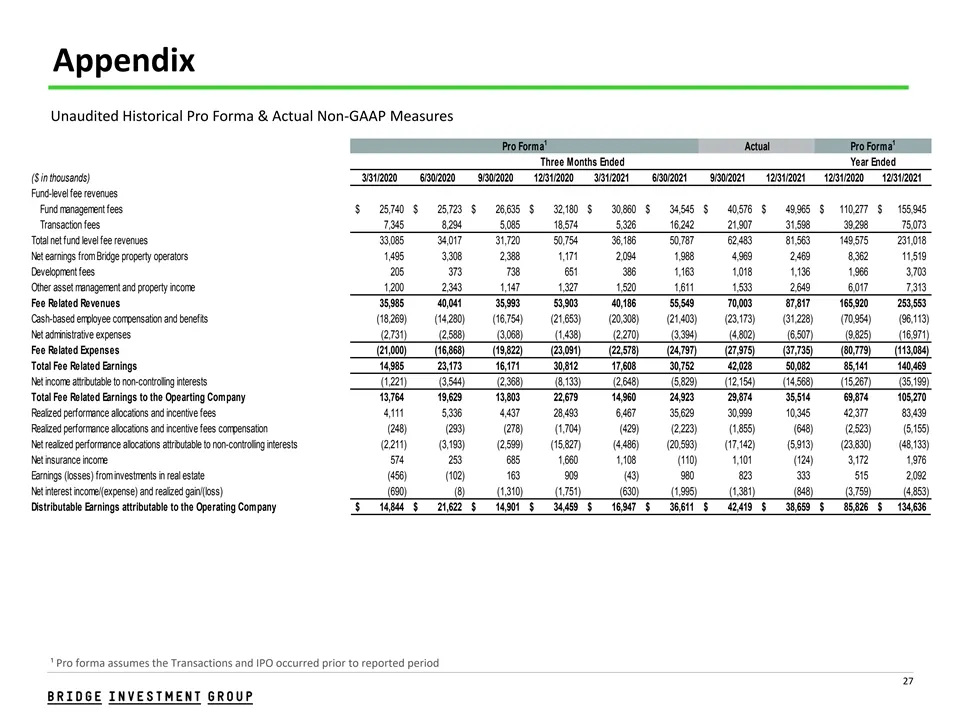
Slide 27: Historical Pro Forma & Actual Non-GAAP Measures
Appendix Unaudited Historical Pro Forma & Actual Non-GAAP Measures 1 1 Pro Forma Actual Pro Forma Three Months Ended Year Ended ($ in thousands) 3/31/2020 6/30/2020 9/30/2020 12/31/2020 3/31/2021 6/30/2021 9/30/2021 12/31/2021 12/31/2020 12/31/2021 Fund-level fee revenues Fund management fees $ 25,7
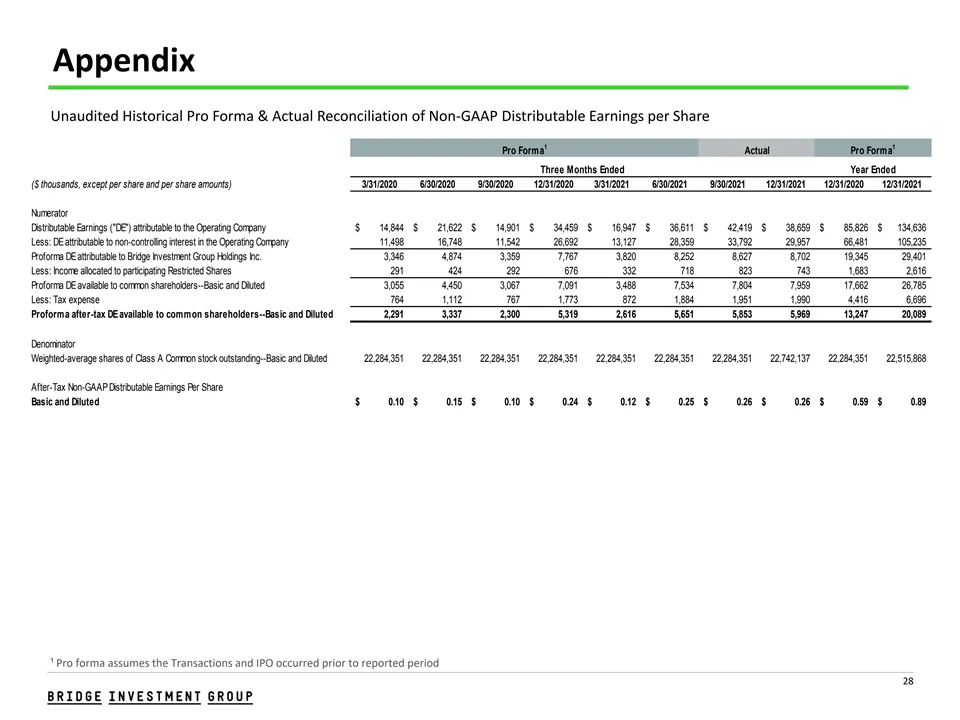
Slide 28: Reconciliation of Non-GAAP Distributable Earnings per Share
Appendix Unaudited Historical Pro Forma & Actual Reconciliation of Non-GAAP Distributable Earnings per Share 1 1 Pro Forma Actual Pro Forma Three Months Ended Year Ended ($ thousands, except per share and per share amounts) 3/31/2020 6/30/2020 9/30/2020 12/31/2020 3/31/2021 6/30/2021 9/30/2021 12/31
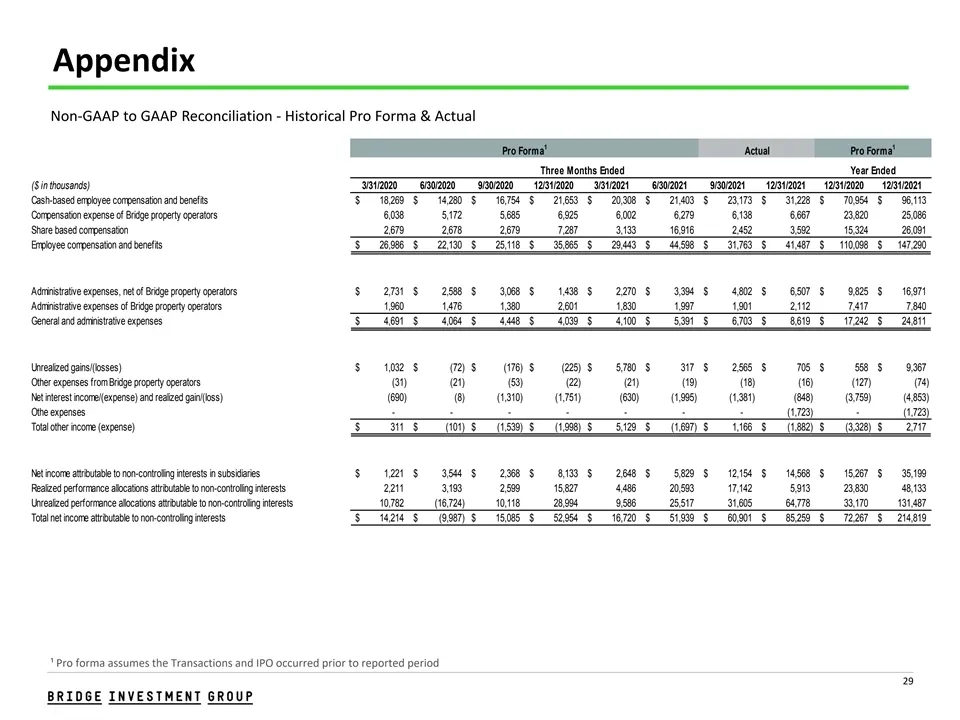
Slide 29: Non-GAAP to GAAP Reconciliation - Historical Pro Forma & Actual
Appendix Non-GAAP to GAAP Reconciliation - Historical Pro Forma & Actual 1 1 Pro Forma Actual Pro Forma Three Months Ended Year Ended ($ in thousands) 3/31/2020 6/30/2020 9/30/2020 12/31/2020 3/31/2021 6/30/2021 9/30/2021 12/31/2021 12/31/2020 12/31/2021 Cash-based employee compensation and benefits
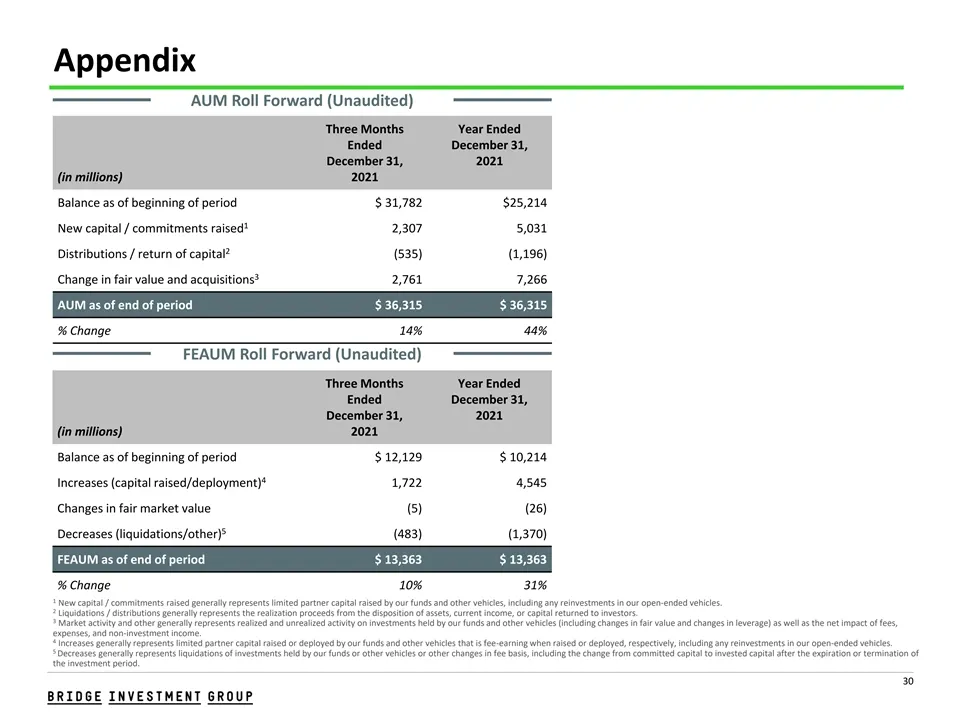
Slide 30: AUM Roll Forward
Appendix AUM Roll Forward (Unaudited) Three Months Year Ended Ended December 31, December 31, 2021 (in millions) 2021 Balance as of beginning of period $ 31,782 $25,214 1 New capital / commitments raised 2,307 5,031 2 Distributions / return of capital (535) (1,196) 3 Change in fair value and acquisi
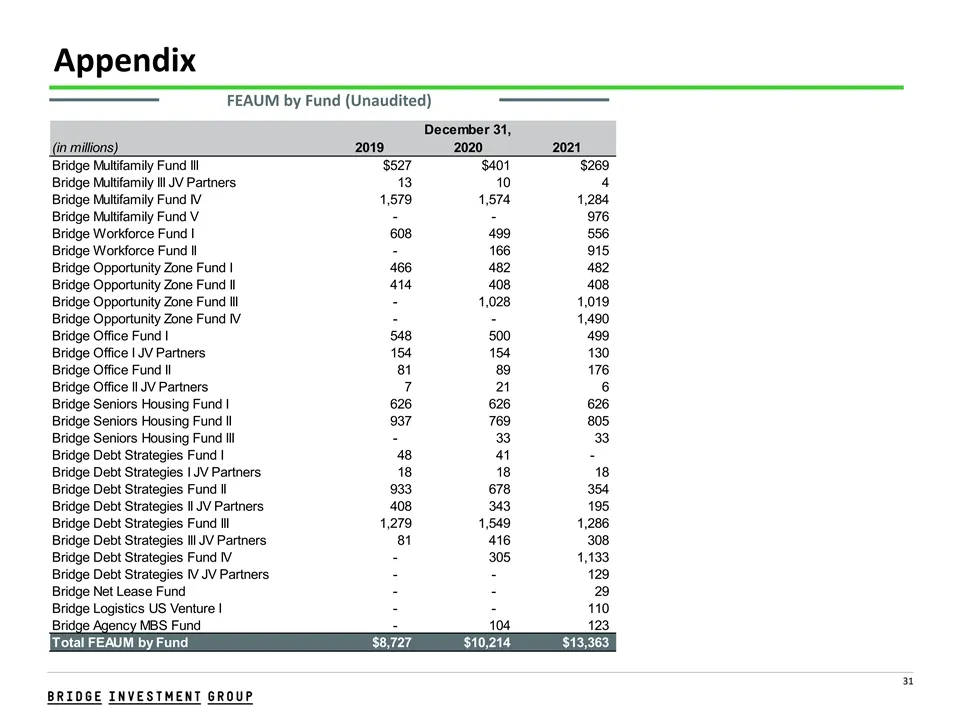
Slide 31: FEAUM by Fund
Appendix FEAUM by Fund (Unaudited) December 31, (in millions) 2019 2020 2021 Bridge Multifamily Fund III $527 $401 $269 Bridge Multifamily III JV Partners 13 10 4 Bridge Multifamily Fund IV 1,579 1,574 1,284 Bridge Multifamily Fund V - - 976 Bridge Workforce Fund I 608 499 556 Bridge Workforce Fund
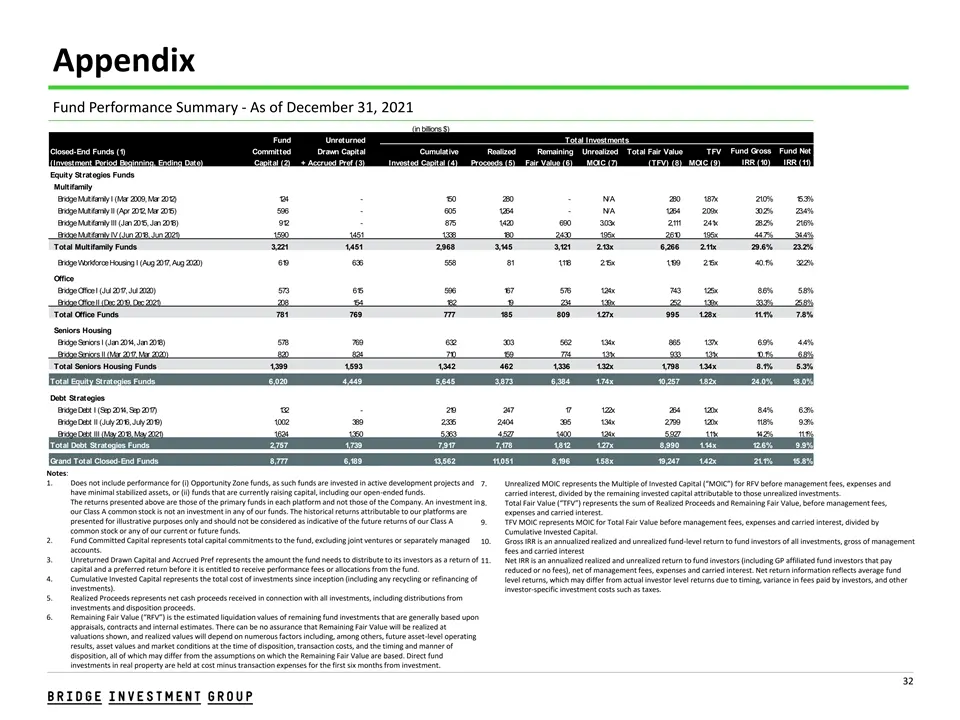
Slide 32: Fund Performance Summary
Appendix Fund Performance Summary - As of December 31, 2021 (in billions $) Fund Unreturned Total Investments Fund Gross Fund Net Closed-End Funds (1) Committed Drawn Capital Cumulative Realized Remaining Unrealized Total Fair Value TFV (Investment Period Beginning, Ending Date) Capital (2) + Accrue
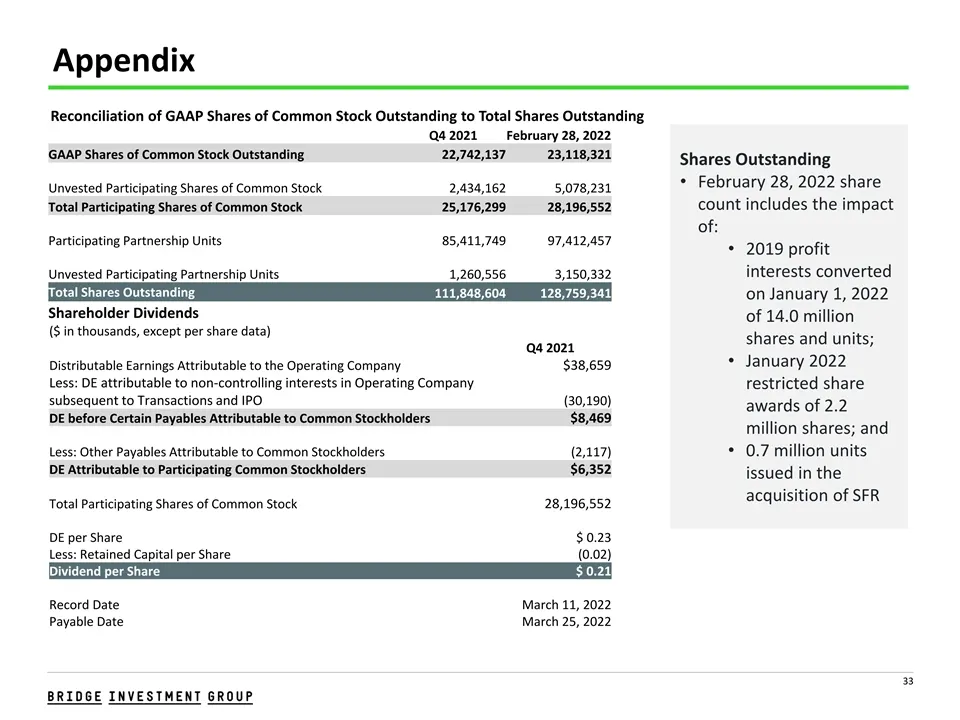
Slide 33: Reconciliation of GAAP Shares Outstanding to Total Shares Outstanding
Appendix Reconciliation of GAAP Shares of Common Stock Outstanding to Total Shares Outstanding Q4 2021 February 28, 2022 GAAP Shares of Common Stock Outstanding 22,742,137 23,118,321 Shares Outstanding • February 28, 2022 share Unvested Participating Shares of Common Stock 2,434,162 5,078,231 count
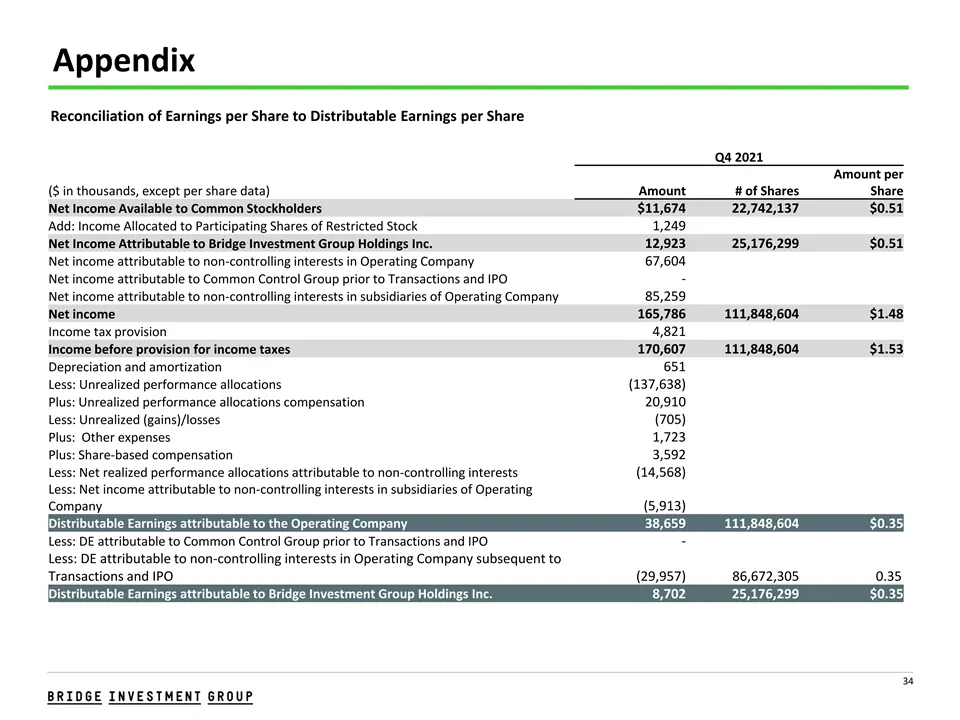
Slide 34: Reconciliation of Earnings per Share to Distributable Earnings per Share
Appendix Reconciliation of Earnings per Share to Distributable Earnings per Share Q4 2021 Amount per ($ in thousands, except per share data) Amount # of Shares Share Net Income Available to Common Stockholders $11,674 22,742,137 $0.51 Add: Income Allocated to Participating Shares of Restricted Stock
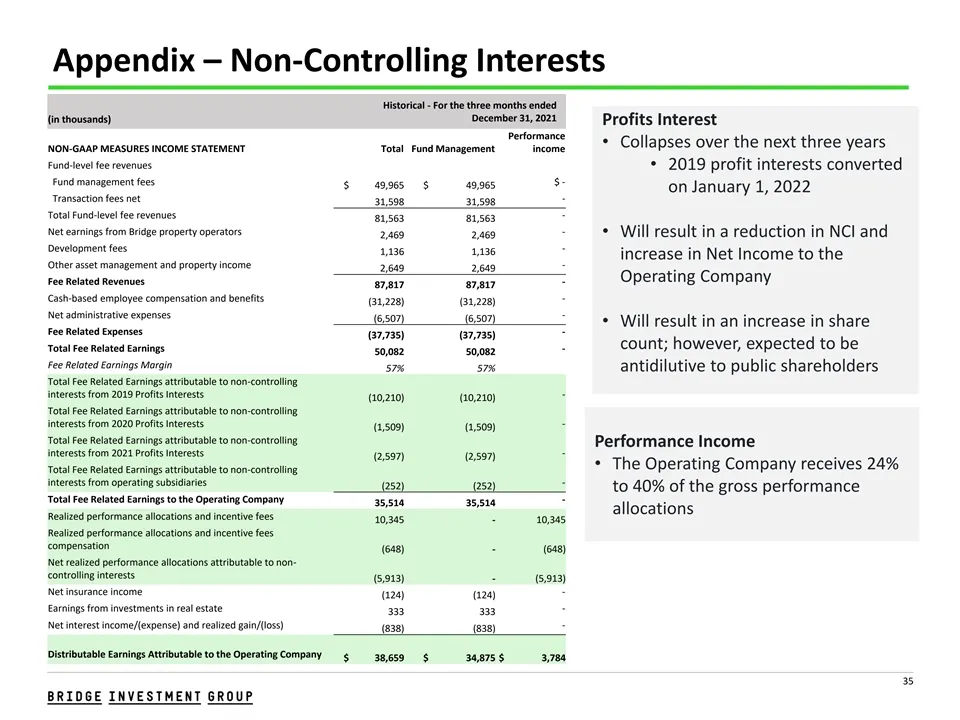
Slide 35: Non-Controlling Interests Historical
Appendix – Non-Controlling Interests Historical - For the three months ended December 31, 2021 (in thousands) Profits Interest Performance • Collapses over the next three years NON-GAAP MEASURES INCOME STATEMENT Total Fund Management income Fund-level fee revenues • 2019 profit interests converted F
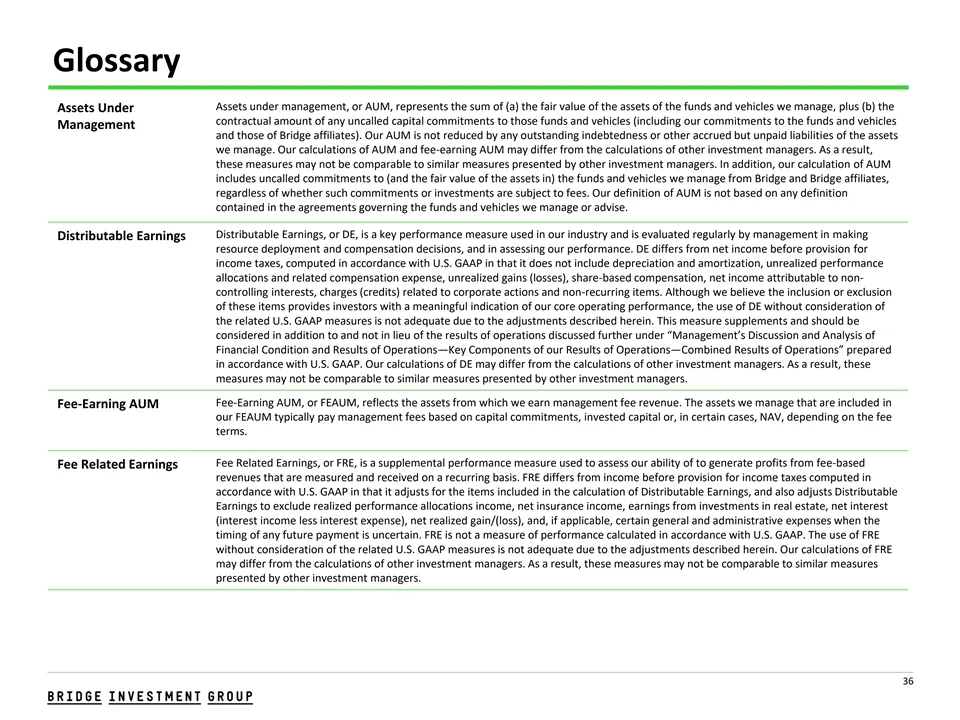
Slide 36: Glossary
Glossary Assets under management, or AUM, represents the sum of (a) the fair value of the assets of the funds and vehicles we manage, plus (b) the Assets Under contractual amount of any uncalled capital commitments to those funds and vehicles (including our commitments to the funds and vehicles Mana
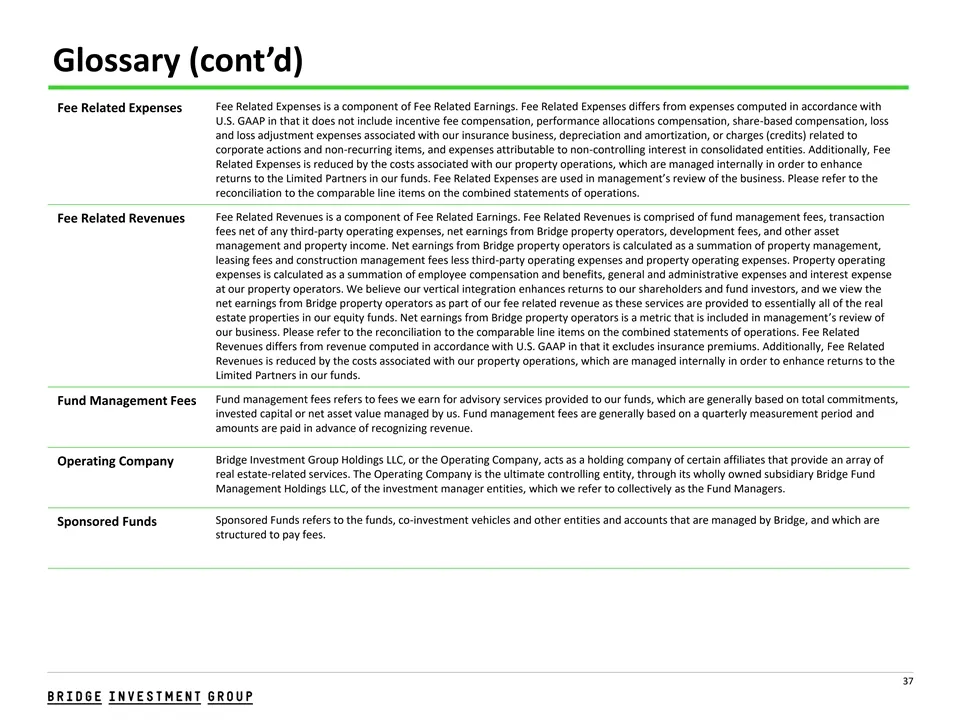
Slide 37: Glossary (cont'd)
Glossary (cont’d) Fee Related Expenses is a component of Fee Related Earnings. Fee Related Expenses differs from expenses computed in accordance with Fee Related Expenses U.S. GAAP in that it does not include incentive fee compensation, performance allocations compensation, share-based compensation,
Source: SEC EDGAR · 8-K filed Mar 2, 2022
More decks from Bridge Investment Group Holdings Inc
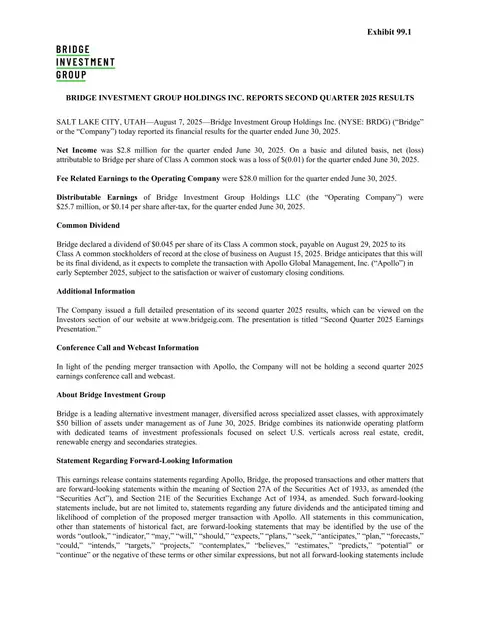 Q2 2025 Earnings Presentation40 slides · Aug 7, 2025
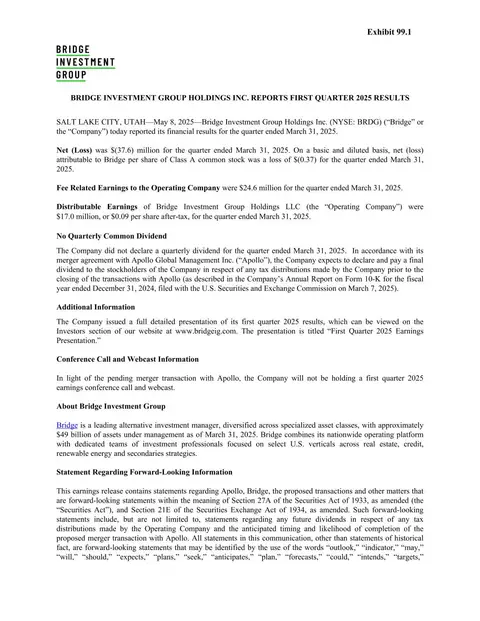 Q1 2025 Earnings Presentation41 slides · May 8, 2025
 Q4 2024 Earnings Presentation34 slides · Feb 24, 2025
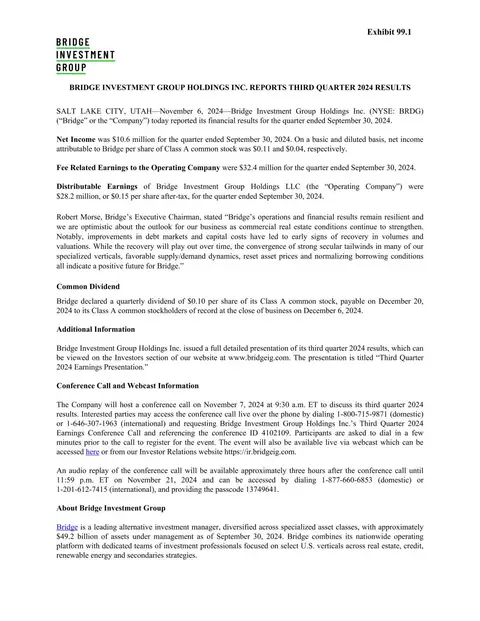 Q3 2024 Earnings Presentation36 slides · Nov 6, 2024
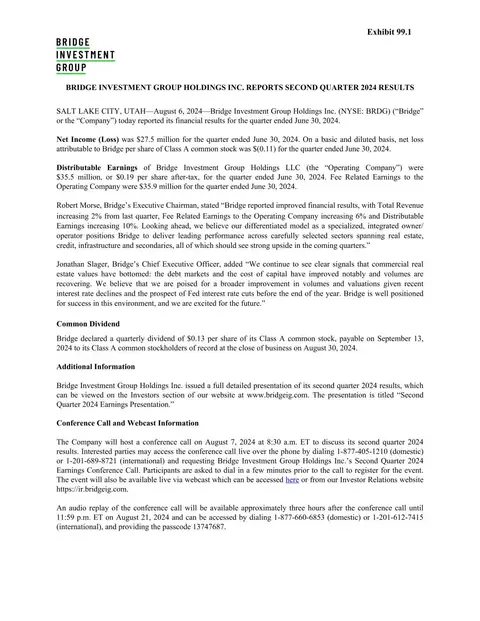 Q2 2024 Earnings Presentation38 slides · Aug 6, 2024
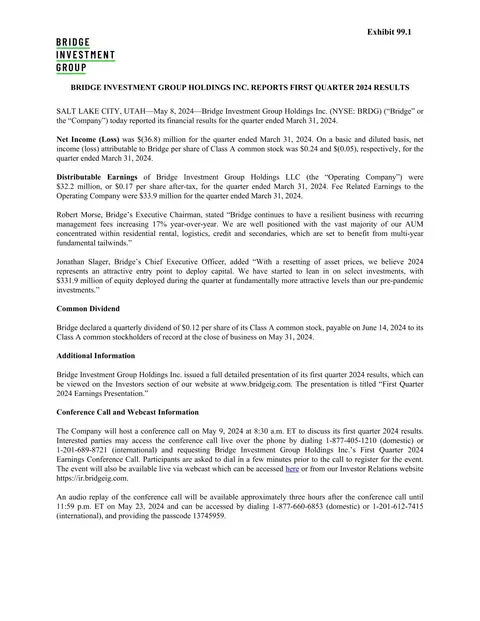 Q1 2024 Earnings Presentation38 slides · May 8, 2024