Componenta Oyj · OMXHEX:CTH1V
Componenta Oyj — 9M 2002 Earnings Presentation
21 slides from Componenta Oyj's earnings presentation, Sep 30, 2002
Slide 1: Componenta Corporation Interim report 1 January - 30 September 2002
Componenta Corporation Interim report 1 January - 30 September 2002
Slide 2: Income statement
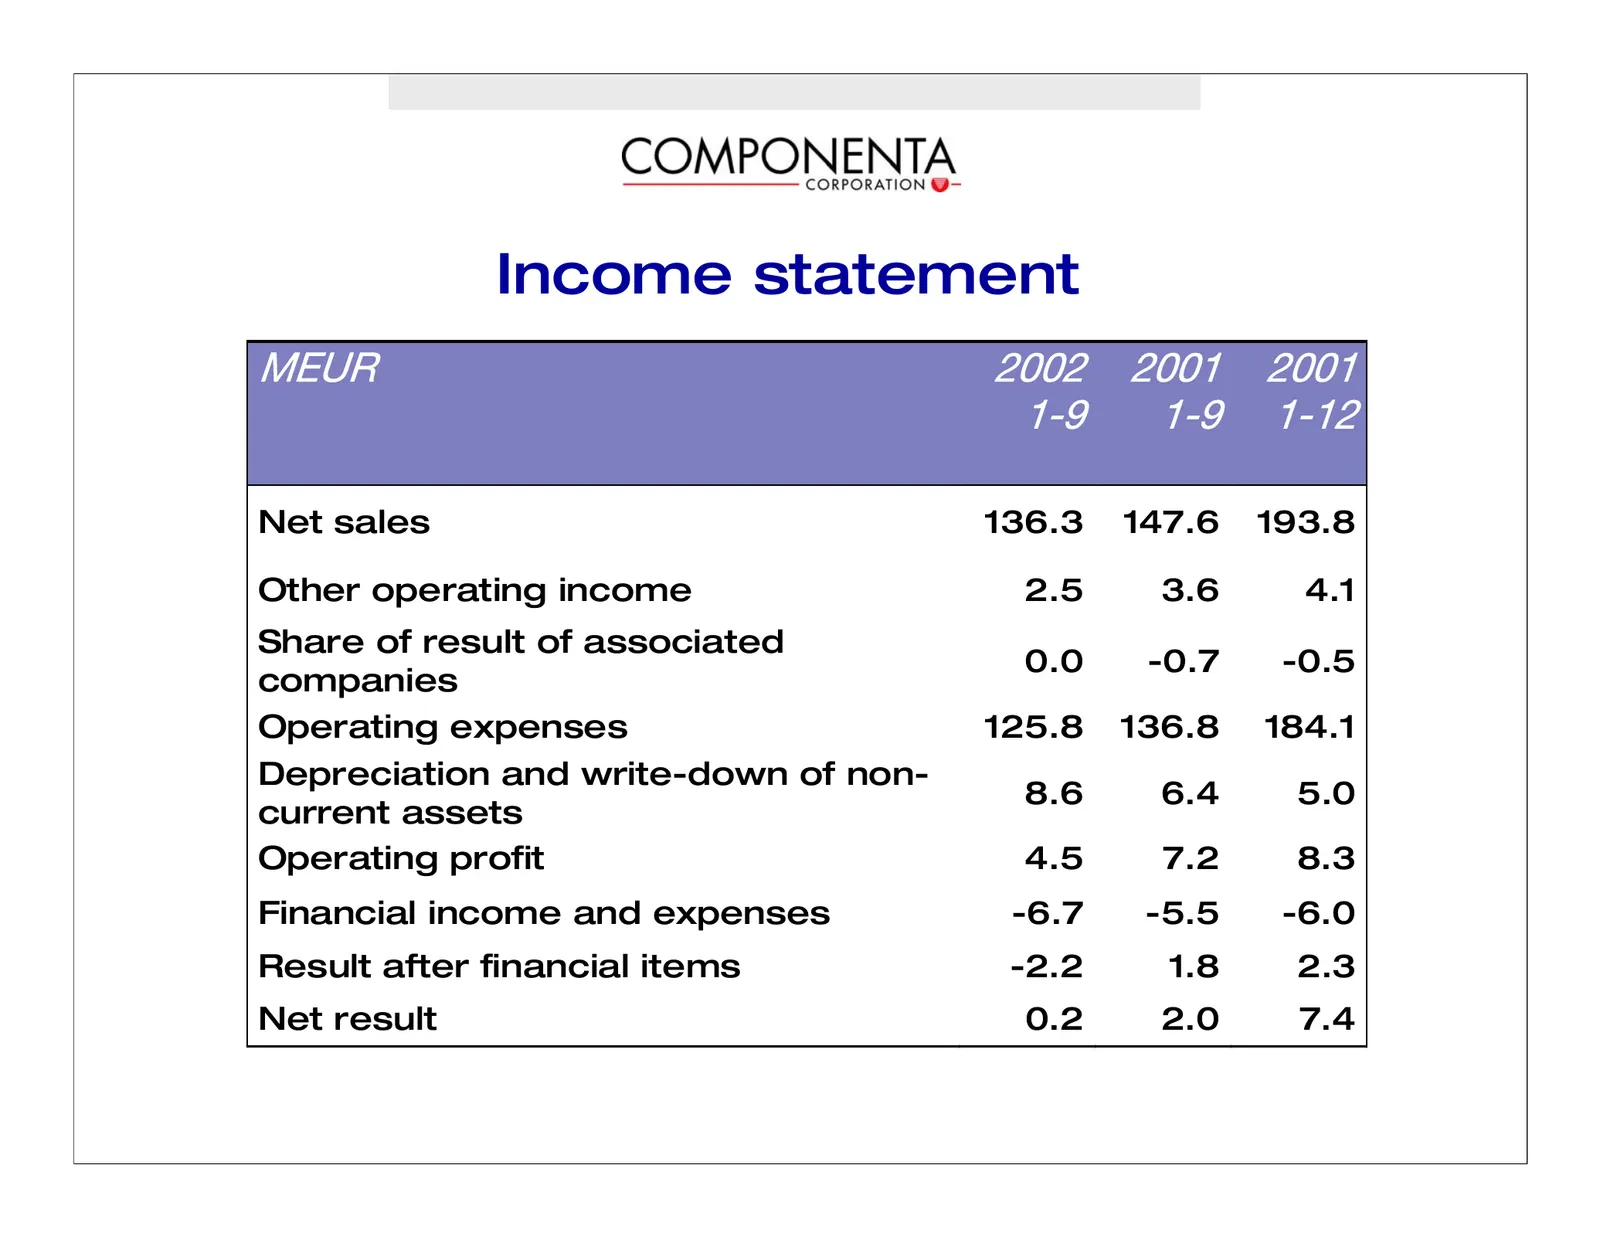
Income statement jbro OMMO OMMN OMMN NJV NJV NJNO Net sales 136.3 147.6 193.8 Other operating income 2.5 3.6 4.1 Share of result of associated 0.0 -0.7 -0.5 companies Operating expenses 125.8 136.8 184.1 Depreciation and write-down of non- 8.6 6.4 5.0 current assets Operating profit 4.5 7.2 8.3 Fina
Slide 3: Operating profit
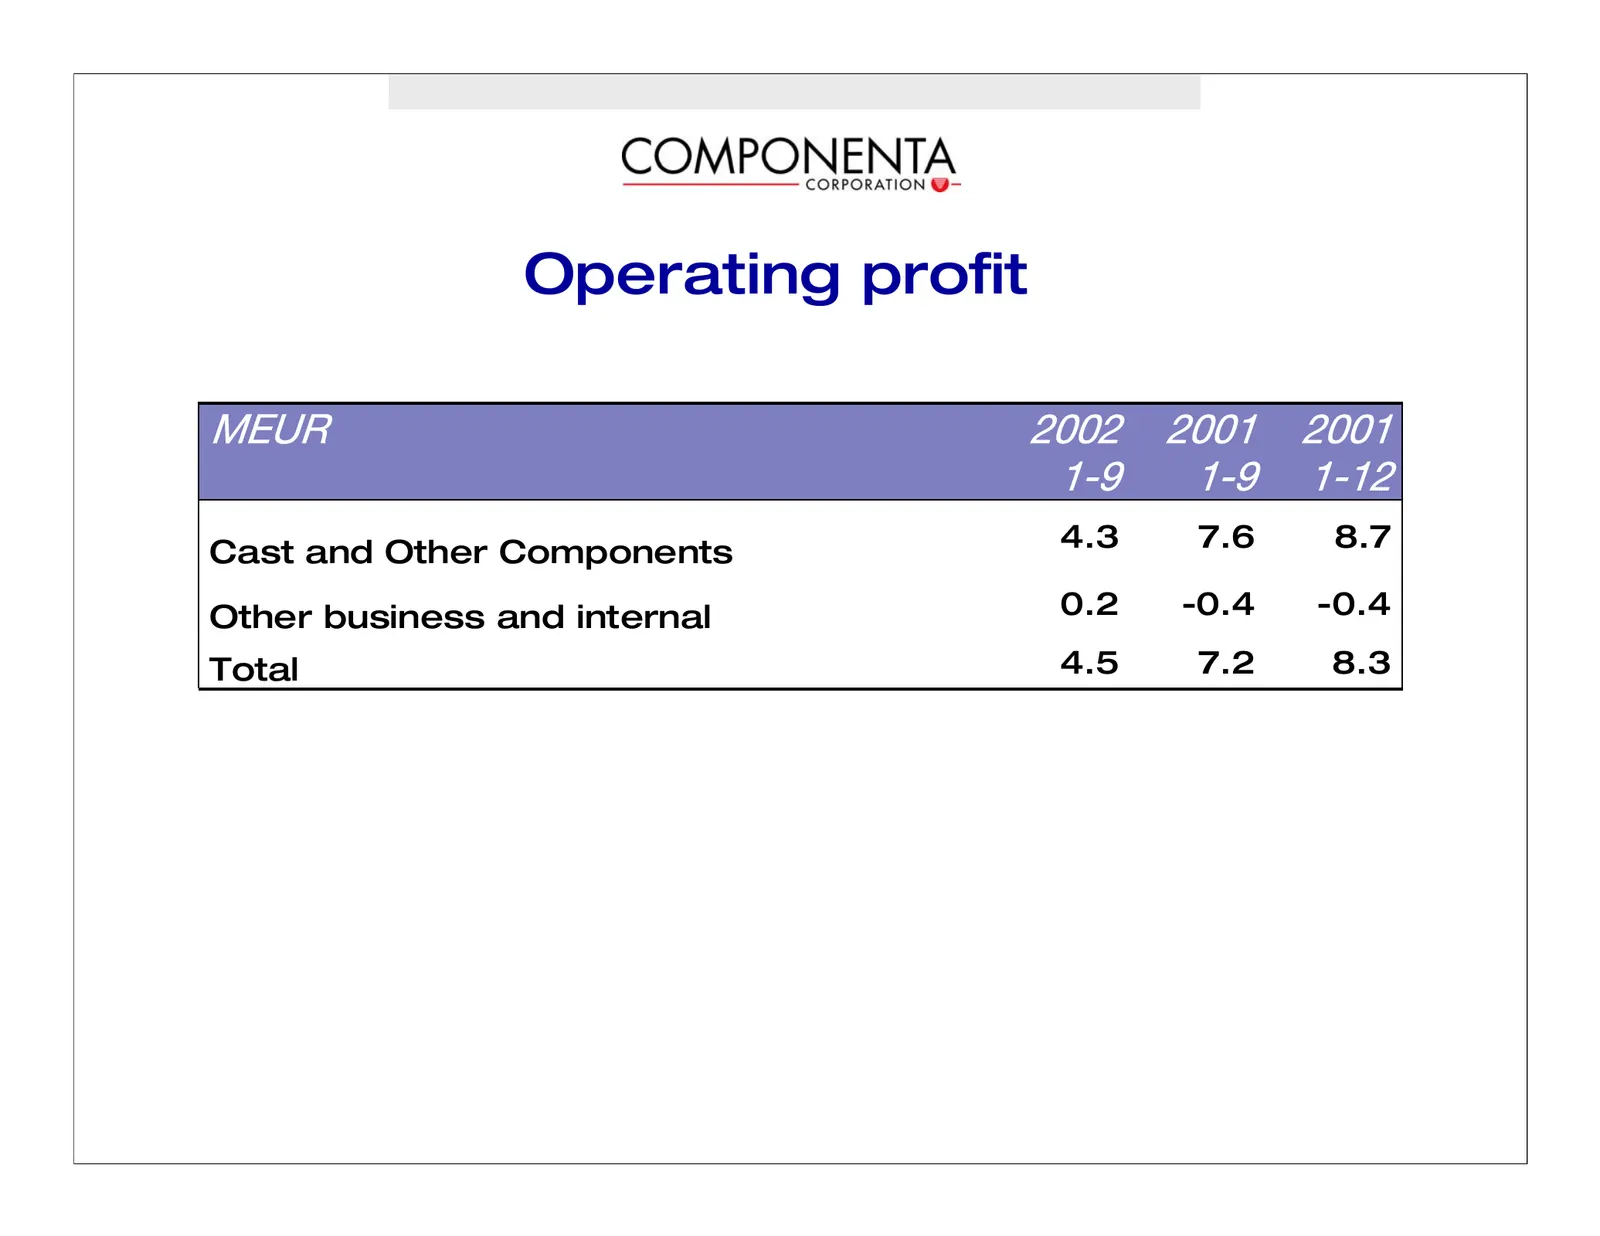
Operating profit jbro OMMO OMMN OMMN NJV NJV NJNO Cast and Other Components 4.3 7.6 8.7 Other business and internal 0.2 -0.4 -0.4 Total 4.5 7.2 8.3
Slide 4: Q3 development
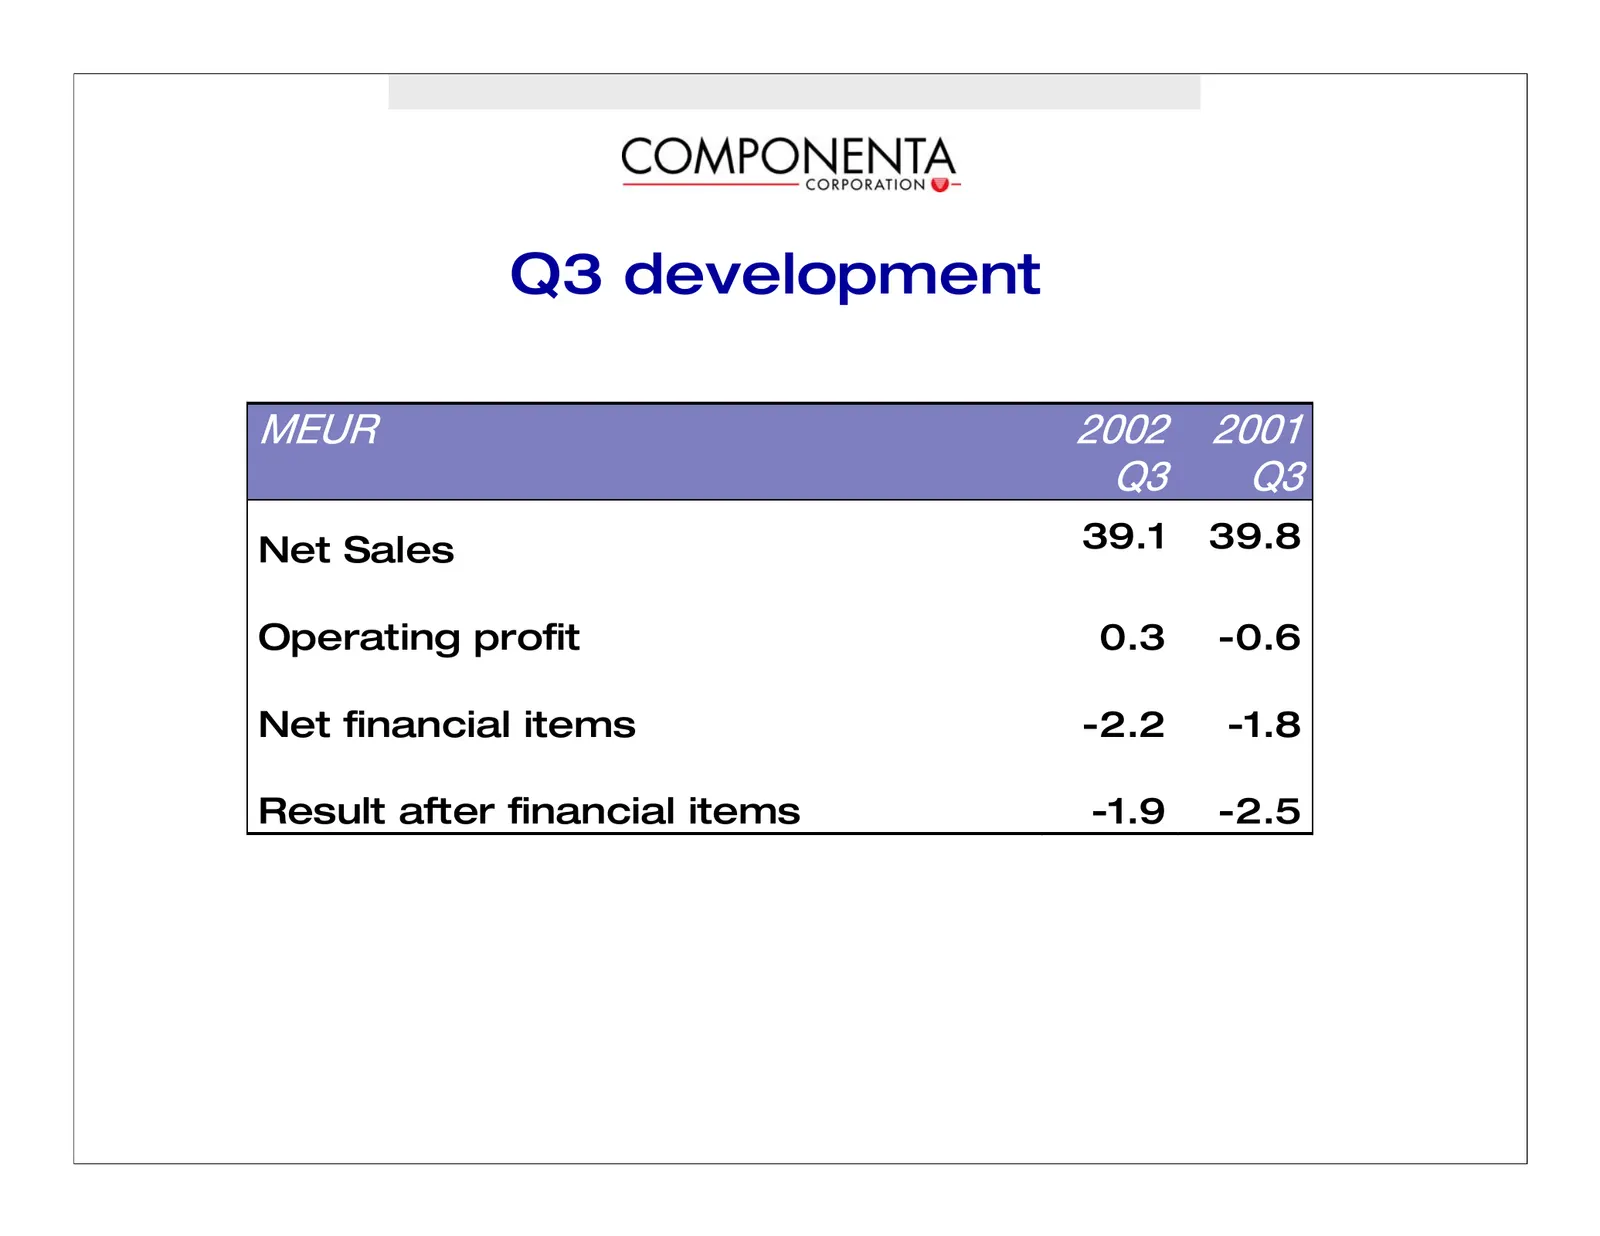
Q3 development jbro OMMO OMMN nP nP Net Sales 39.1 39.8 Operating profit 0.3 -0.6 Net financial items -2.2 -1.8 Result after financial items -1.9 -2.5
Slide 5: Operating profit Q3
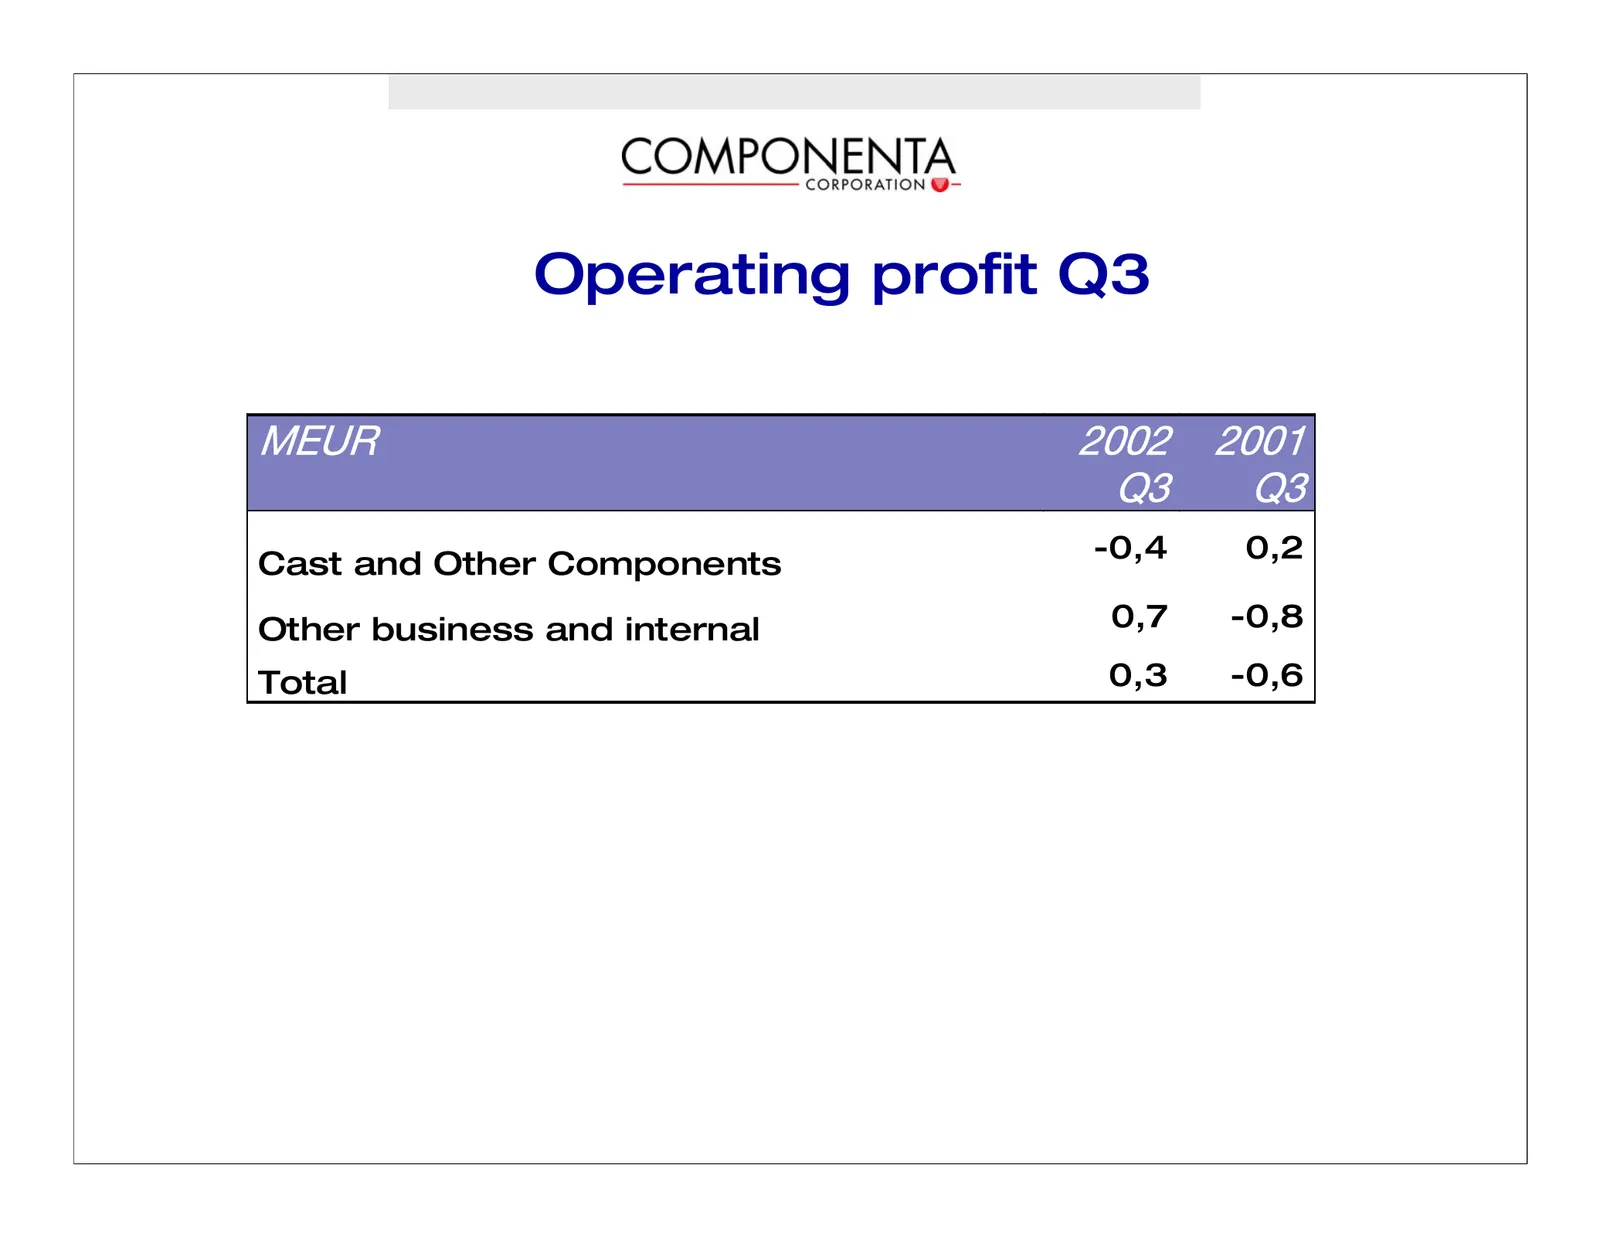
Operating profit Q3 jbro OMMO OMMN nP nP Cast and Other Components -0,4 0,2 Other business and internal 0,7 -0,8 Total 0,3 -0,6
Slide 6: Review period in brief
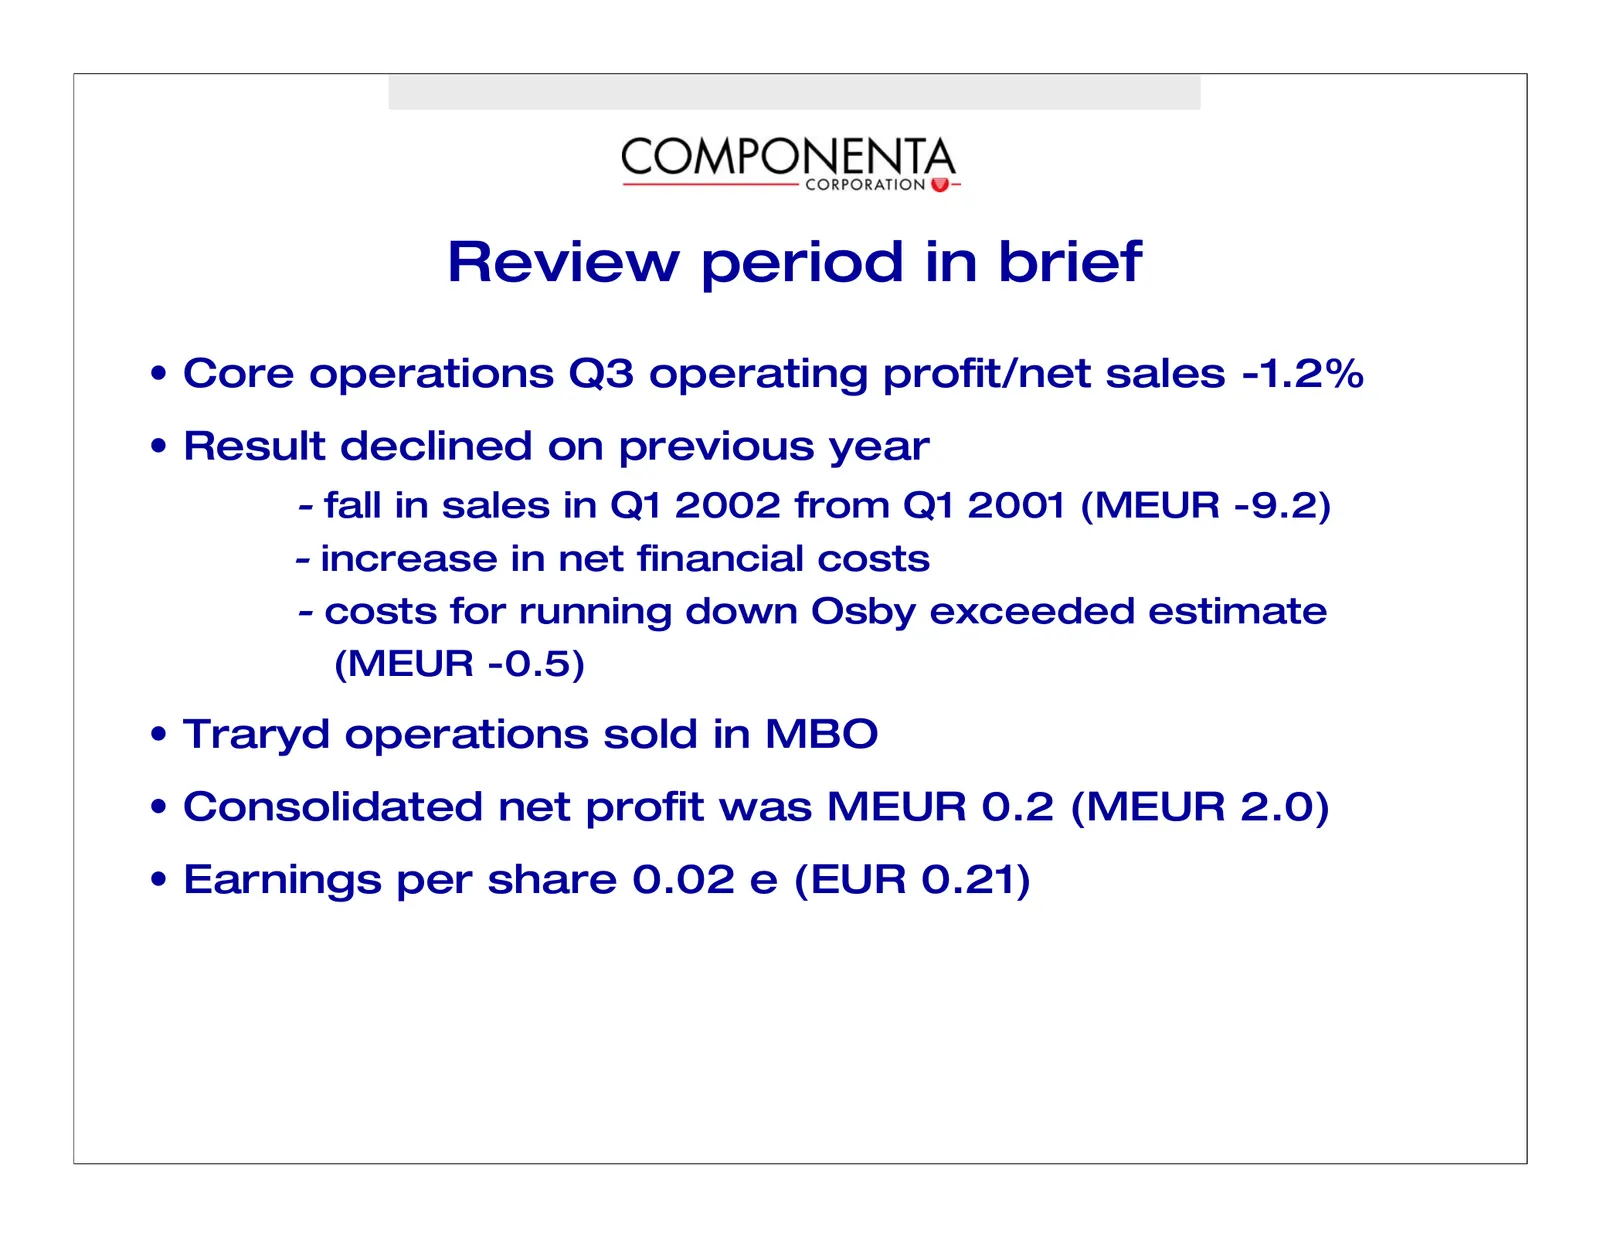
Review period in brief • Core operations Q3 operating profit/net sales -1.2% • Result declined on previous year - fall in sales in Q1 2002 from Q1 2001 (MEUR -9.2) - increase in net financial costs - costs for running down Osby exceeded estimate (MEUR -0.5) • Traryd operations sold in MBO • Consolid
Slide 7: Review period in brief
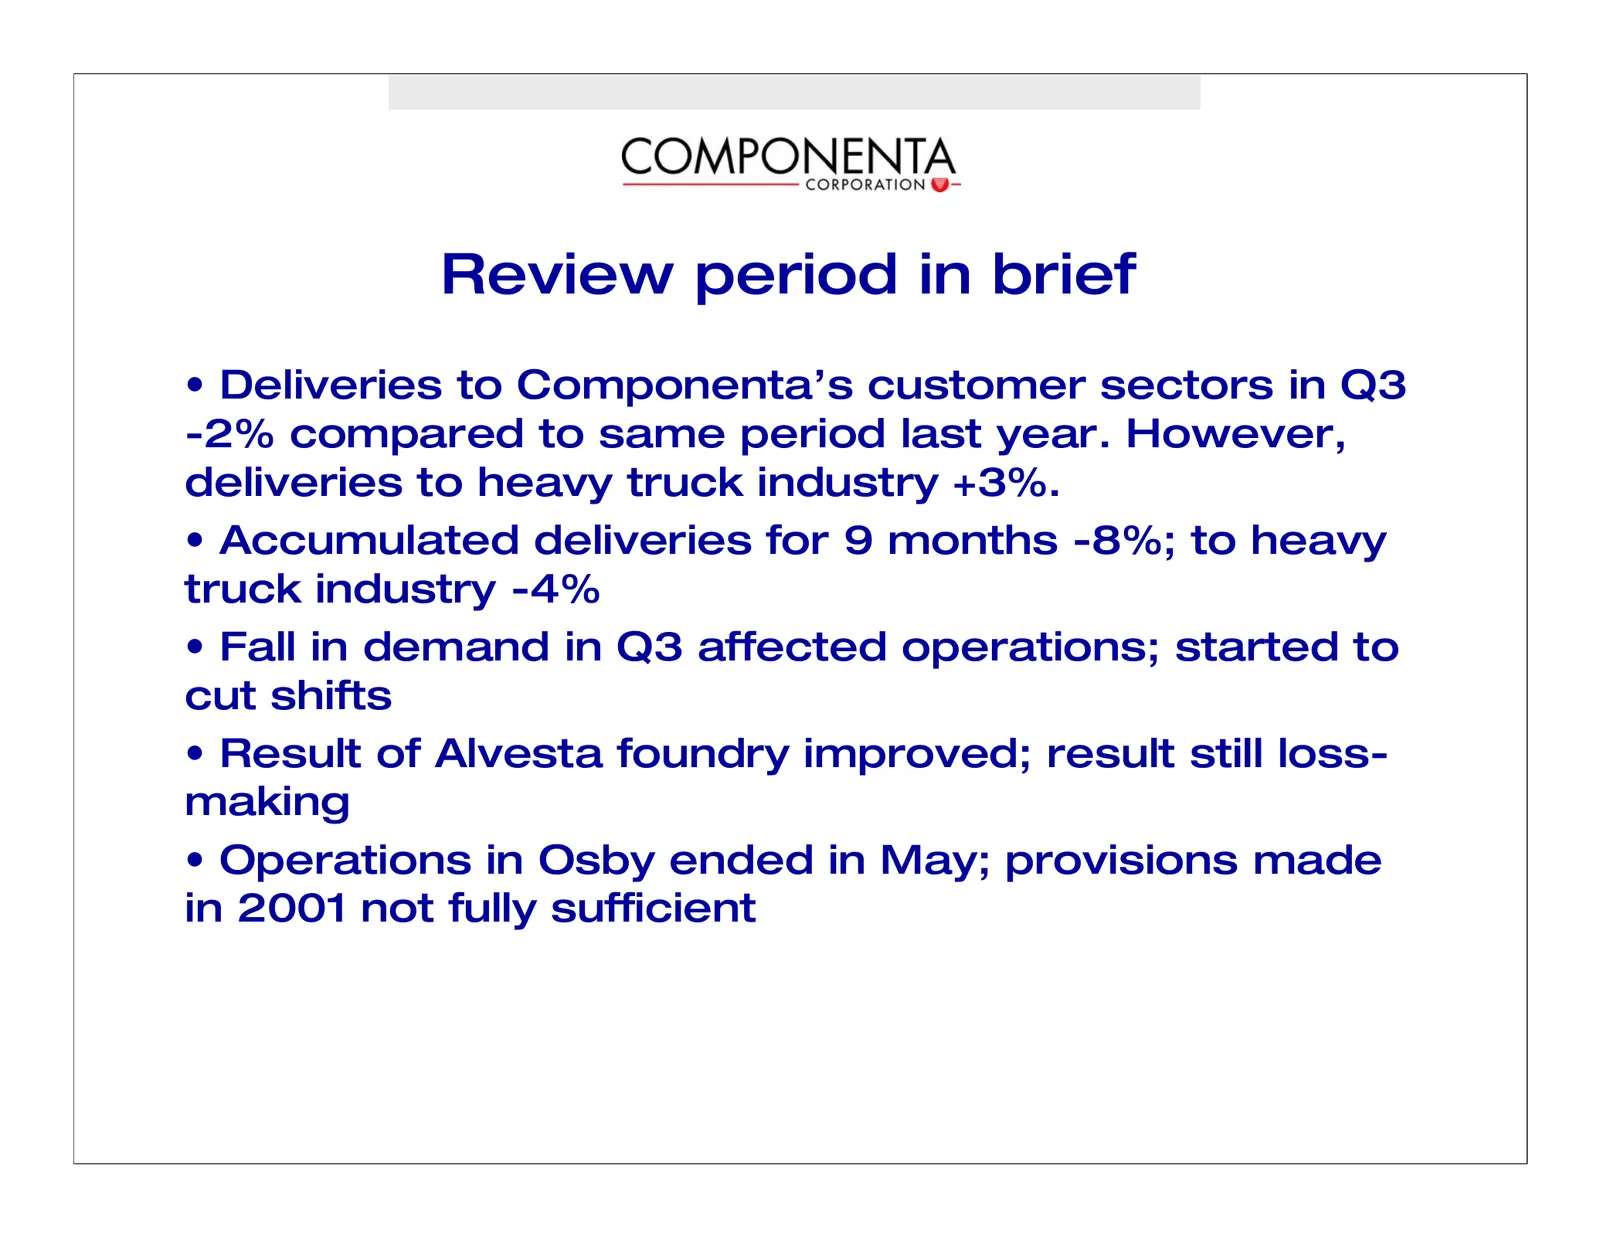
Review period in brief • Deliveries to Componenta’s customer sectors in Q3 -2% compared to same period last year. However, deliveries to heavy truck industry +3%. • Accumulated deliveries for 9 months -8%; to heavy truck industry -4% • Fall in demand in Q3 affected operations; started to cut shifts
Slide 8: Net sales and order book
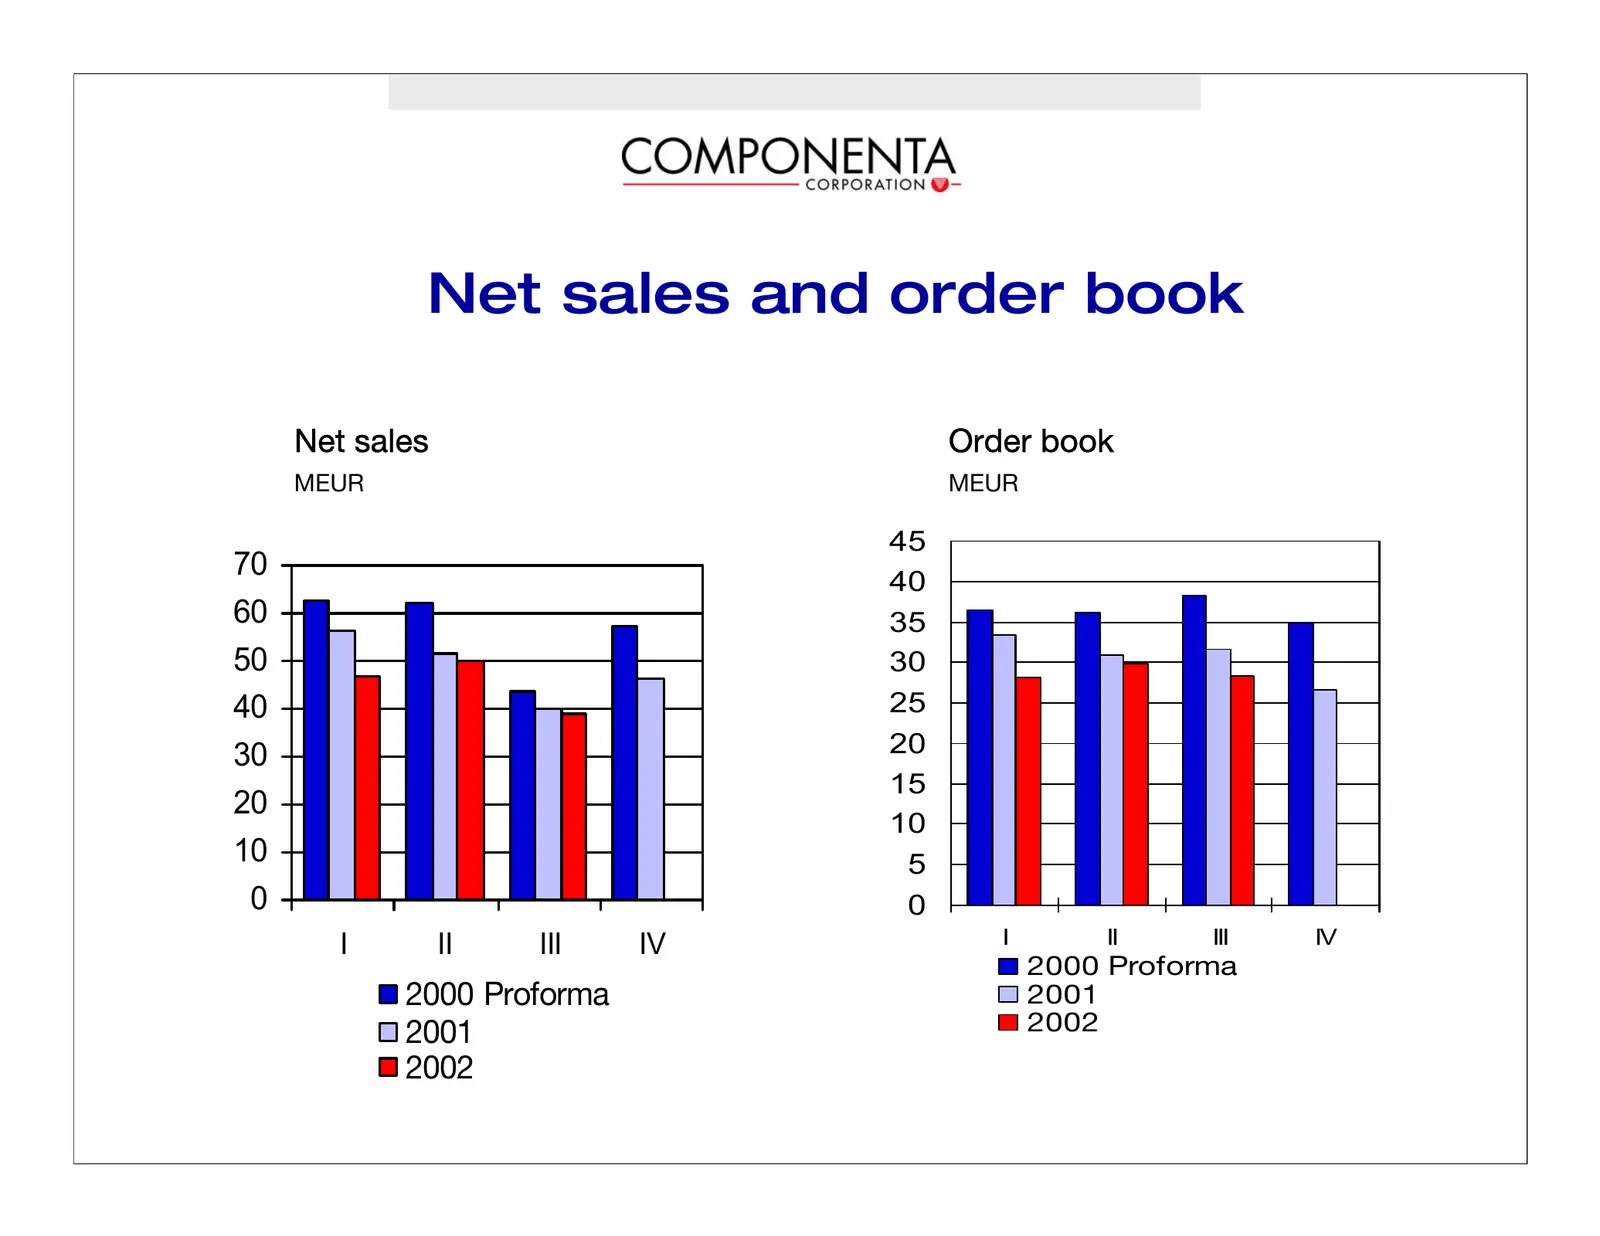
Net sales and order book kÉí=ë~äÉë lêÇÉê=Äççâ jbro jbro 45 70 40 60 35 50 30 40 25 30 20 15 20 10 10 5 0 0 I II III IV I II III IV OMMM=mêçÑçêã~== OMMM=mêçÑçêã~ OMMN OMMN OMMO OMMO
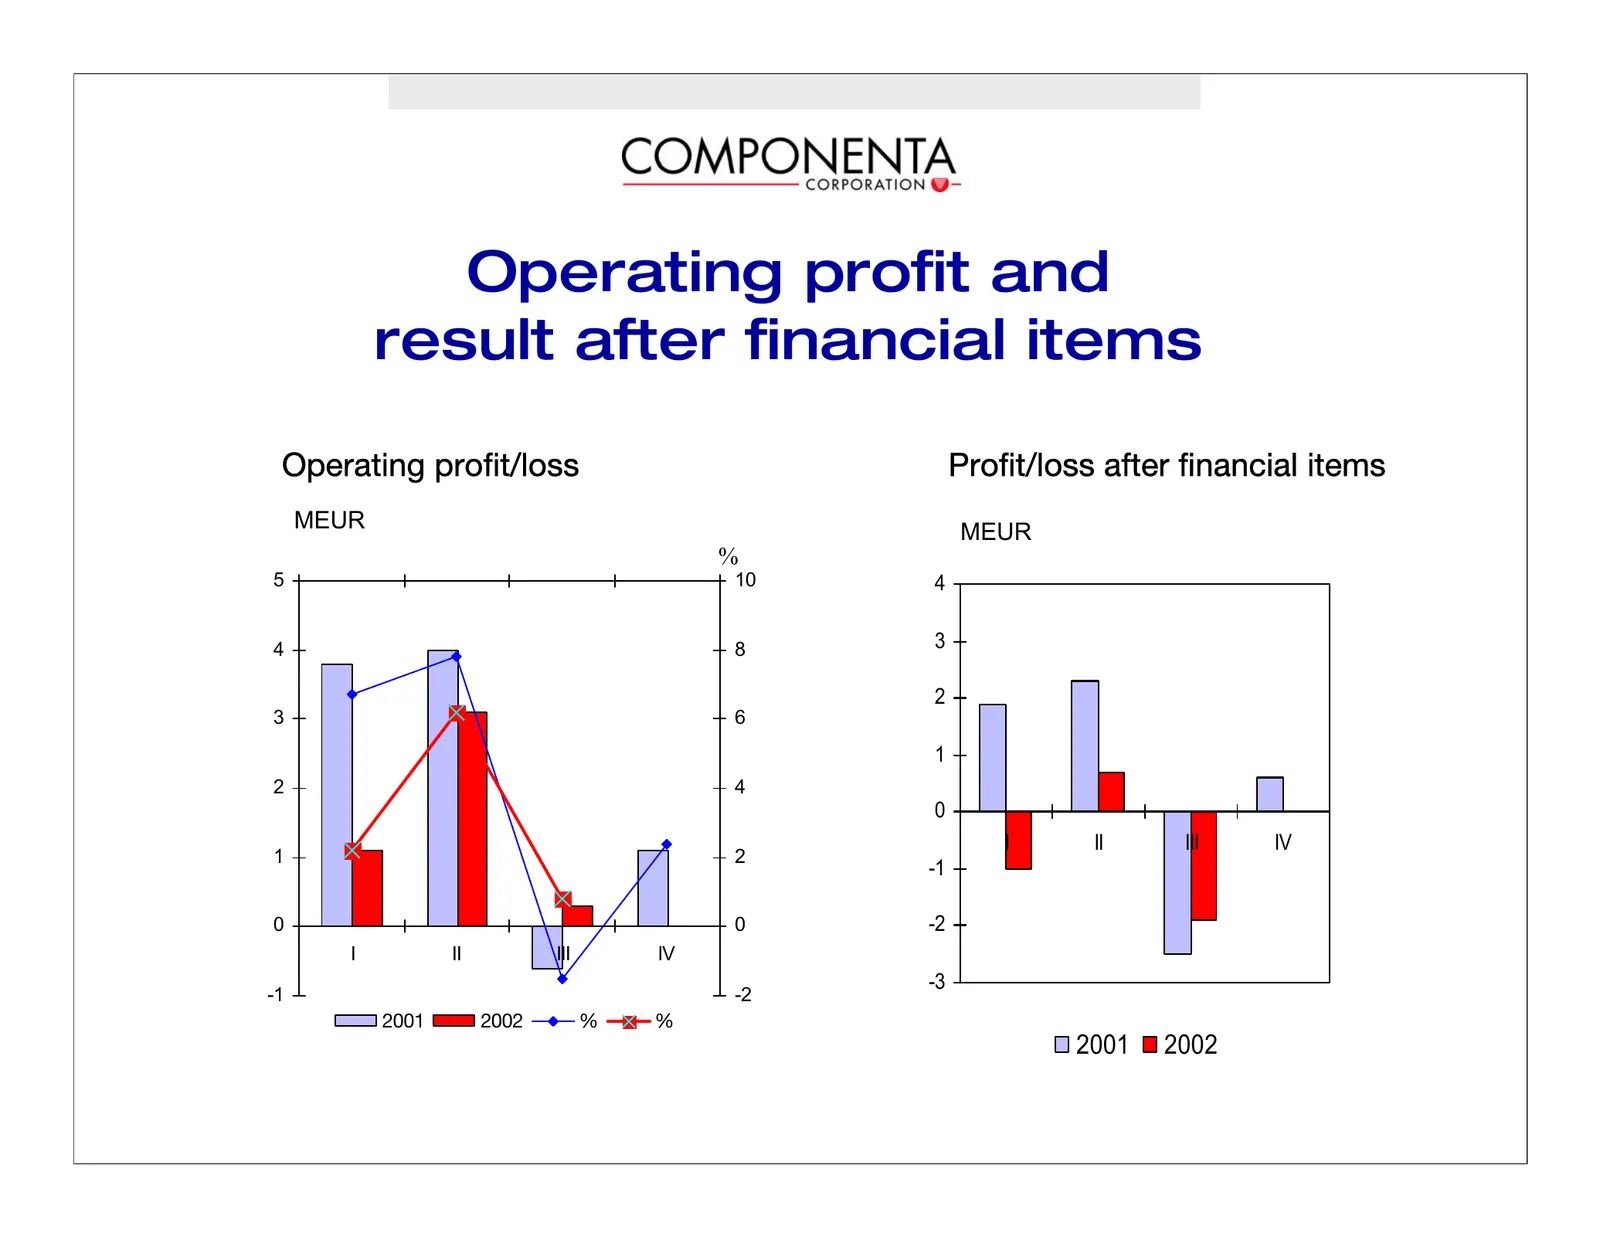
Slide 9: Operating profit and result after financial items
Operating profit and result after financial items léÉê~íáåÖ=éêçÑáíLäçëë mêçÑáíLäçëë=~ÑíÉê=Ñáå~åÅá~ä=áíÉãë MEUR MEUR I II III IV % 5 10 4 4 8 3 2 3 6 1 2 4 0 I II III IV 1 2 -1 0 0 -2 I II III IV -3 -1 -2 OMMN OMMO B B 2001 2002
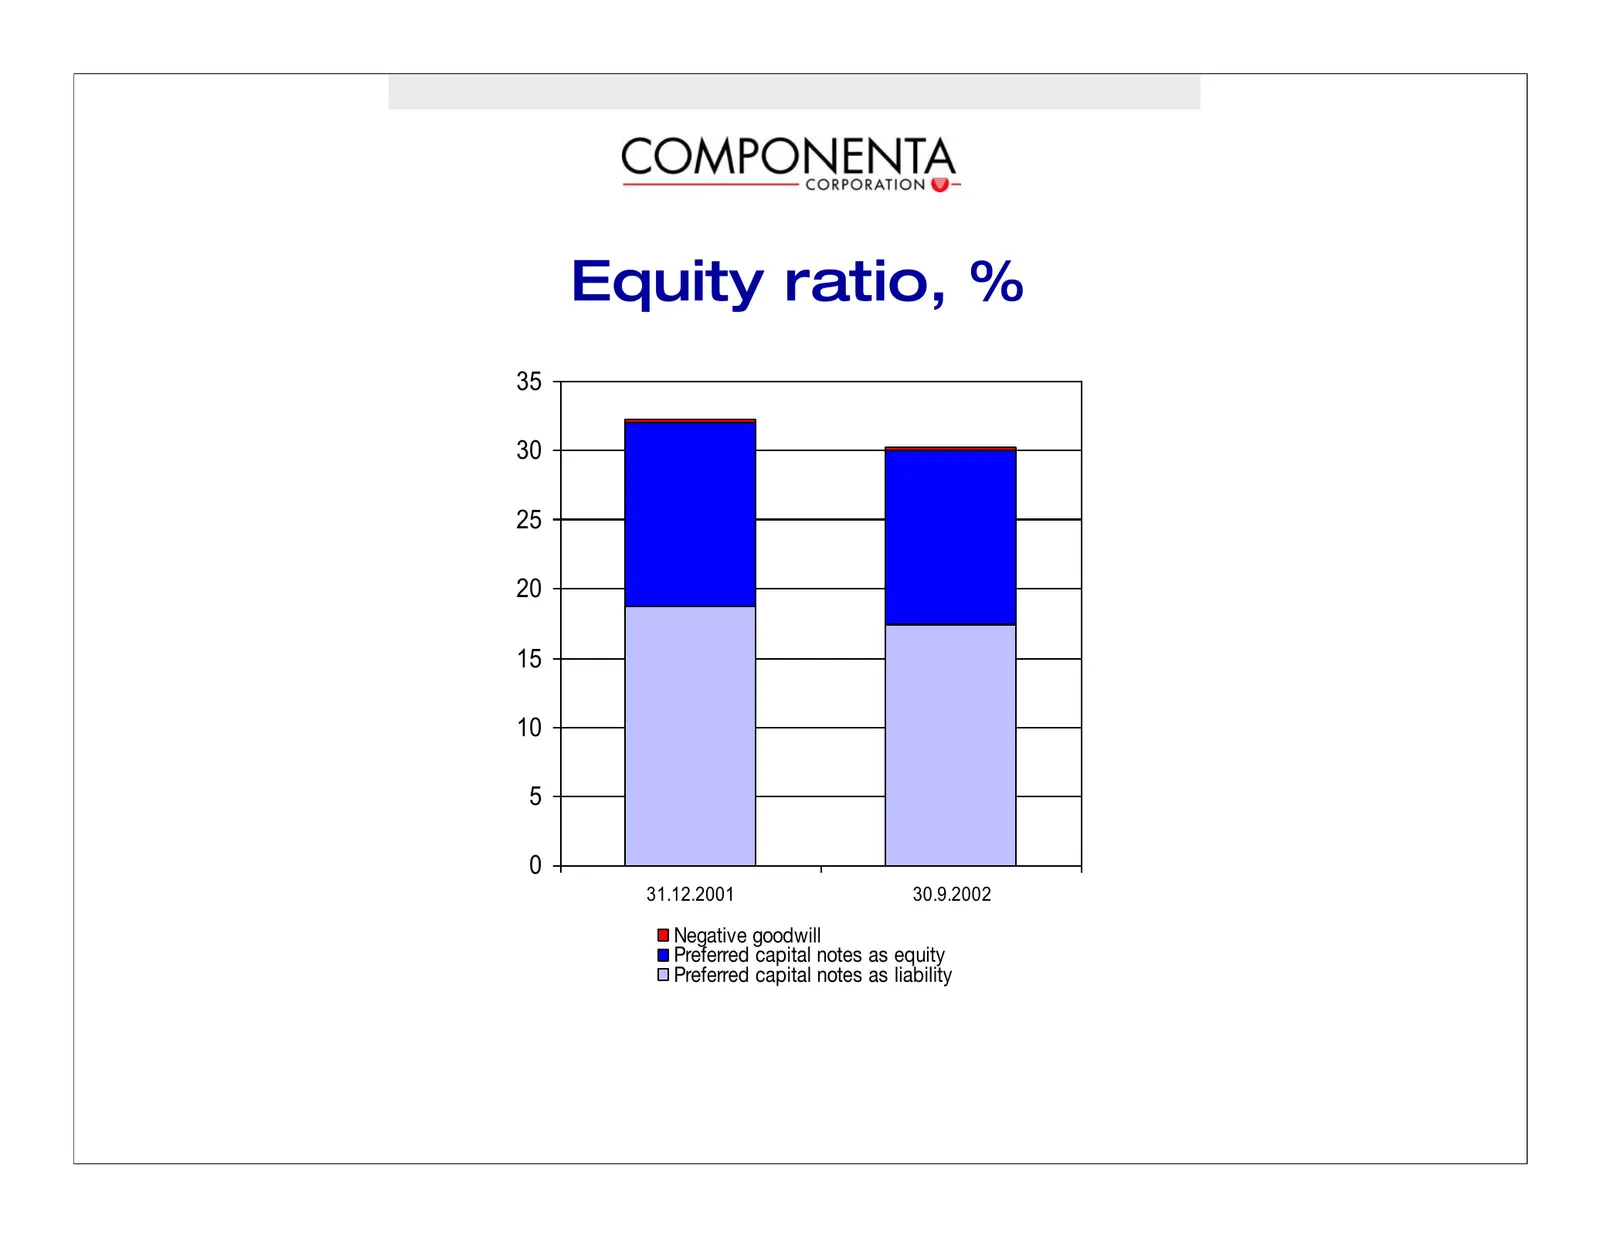
Slide 10: Equity ratio, %
Equity ratio, % 35 30 25 20 15 10 5 0 31.12.2001 30.9.2002 kÉÖ~íáîÉ=ÖççÇïáää mêÉÑÉêêÉÇ=Å~éáí~ä=åçíÉë=~ë=Éèìáíó mêÉÑÉêêÉÇ=Å~éáí~ä=åçíÉë=~ë=äá~Äáäáíó
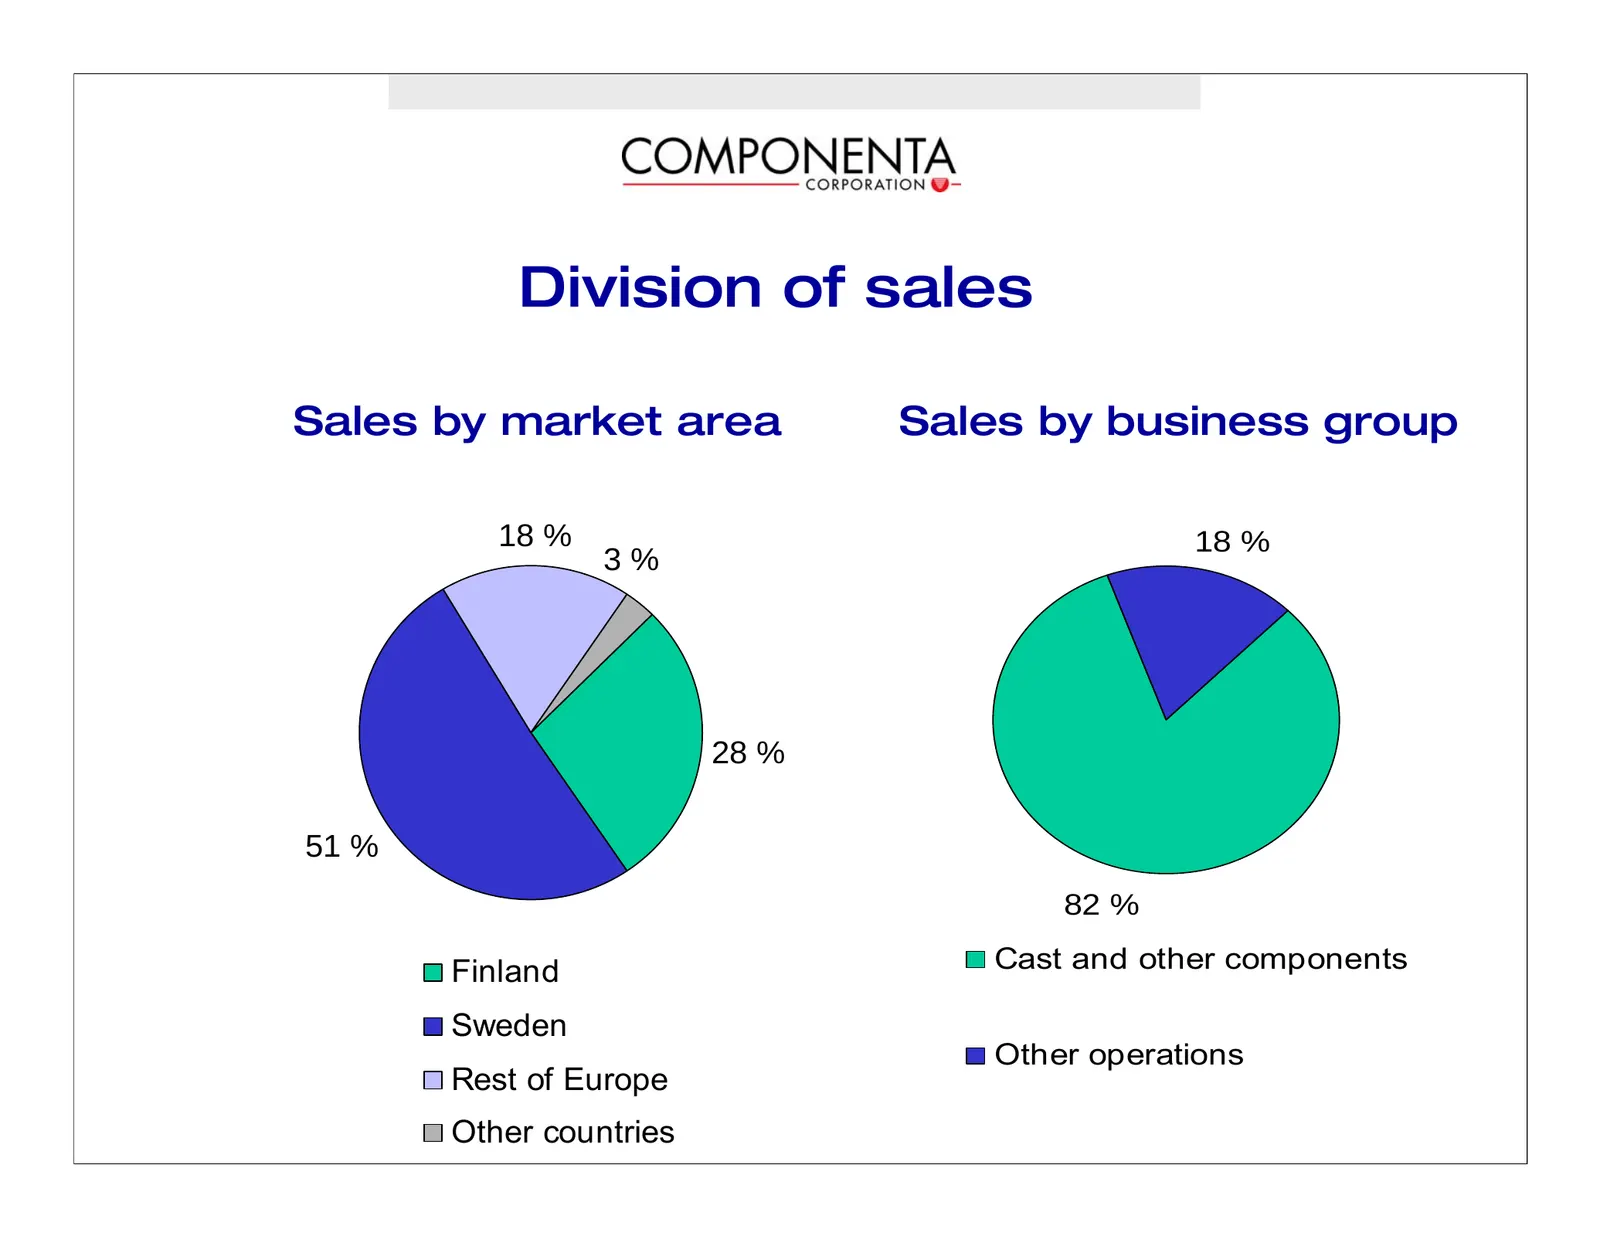
Slide 11: Division of sales
Division of sales Sales by market area Sales by business group 18 % 18 % 3% 28 % 51 % 82 % Finland Cast and other components Sweden Other operations Rest of Europe Other countries
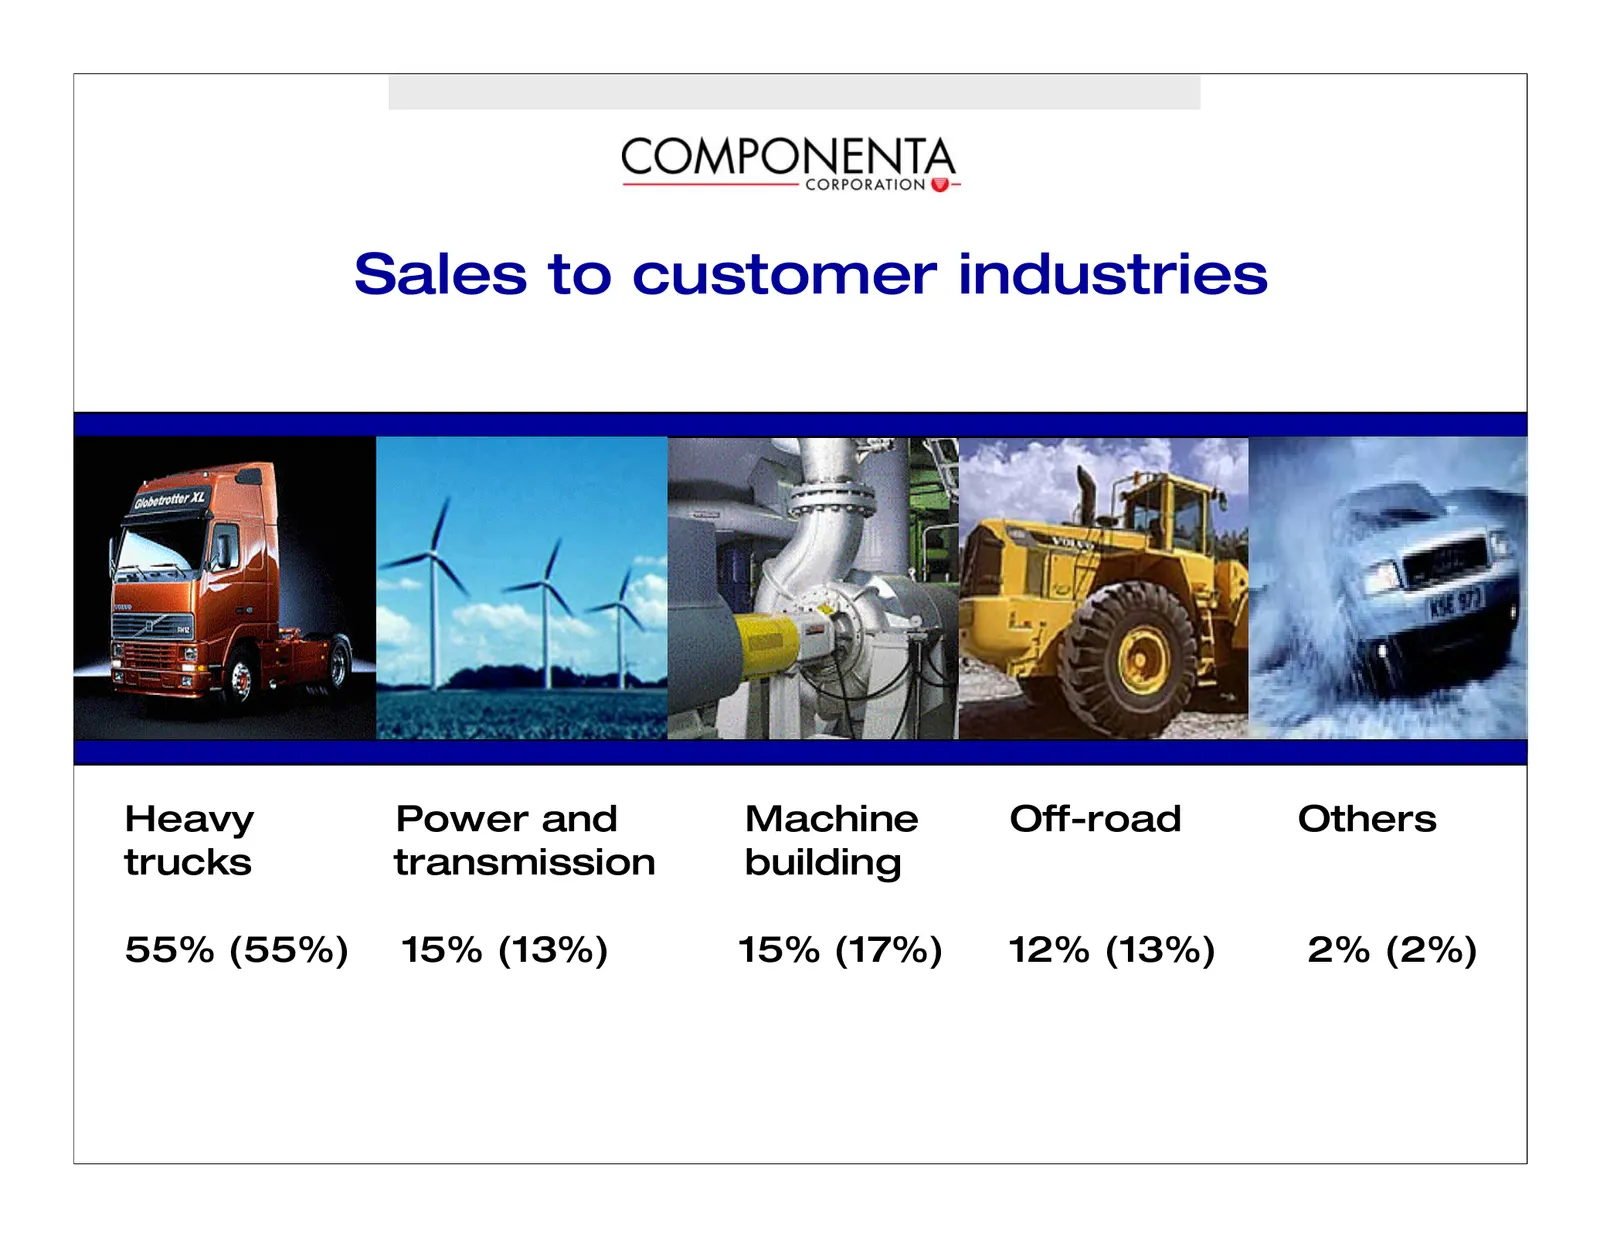
Slide 12: Sales to customer industries
Sales to customer industries Heavy Power and Machine Off-road Others trucks transmission building 55% (55%) 15% (13%) 15% (17%) 12% (13%) 2% (2%)
Slide 13: Cast and Other Components
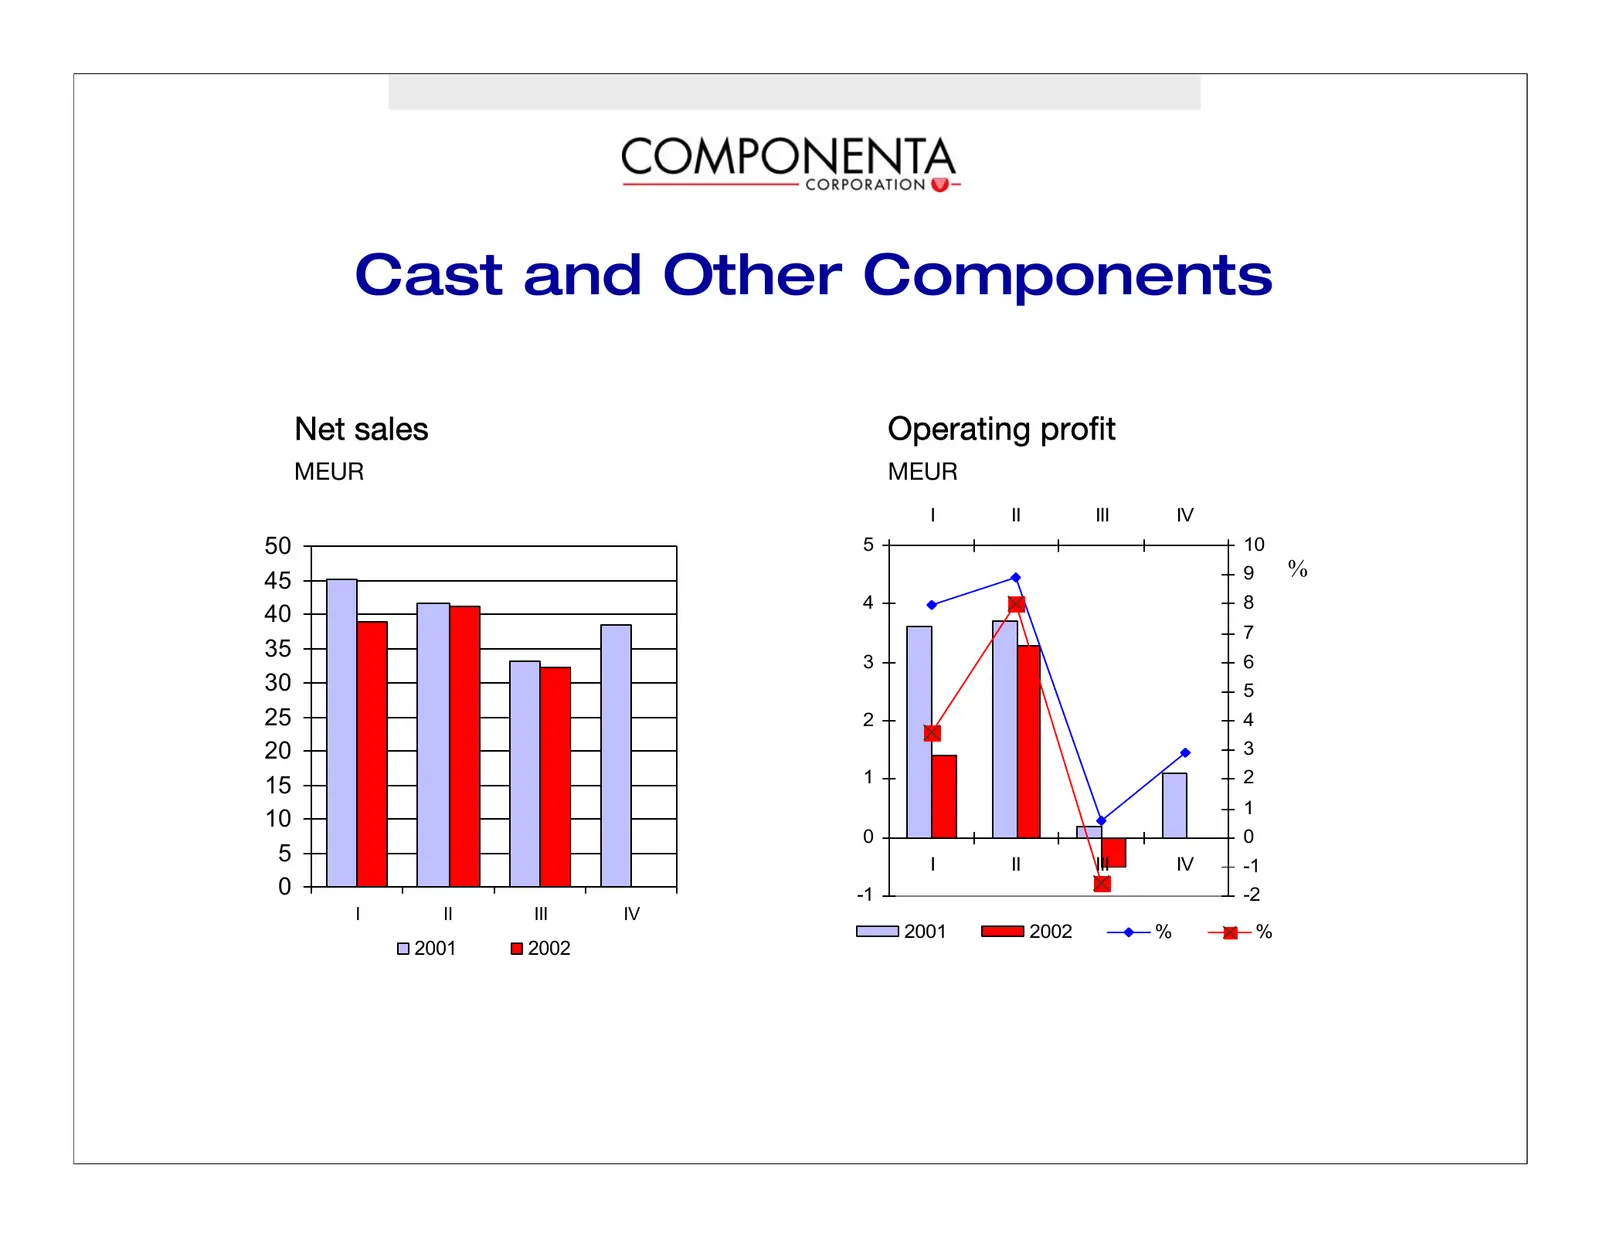
Cast and Other Components kÉí=ë~äÉë léÉê~íáåÖ=éêçÑáí jbro jbro I II III IV 50 5 10 9 % 45 4 8 40 7 35 3 6 30 5 25 2 4 20 3 1 2 15 1 10 0 0 5 I II III IV -1 0 -1 -2 I II III IV 2001 2002 % % 2001 2002
Slide 14: Cast and Other Components
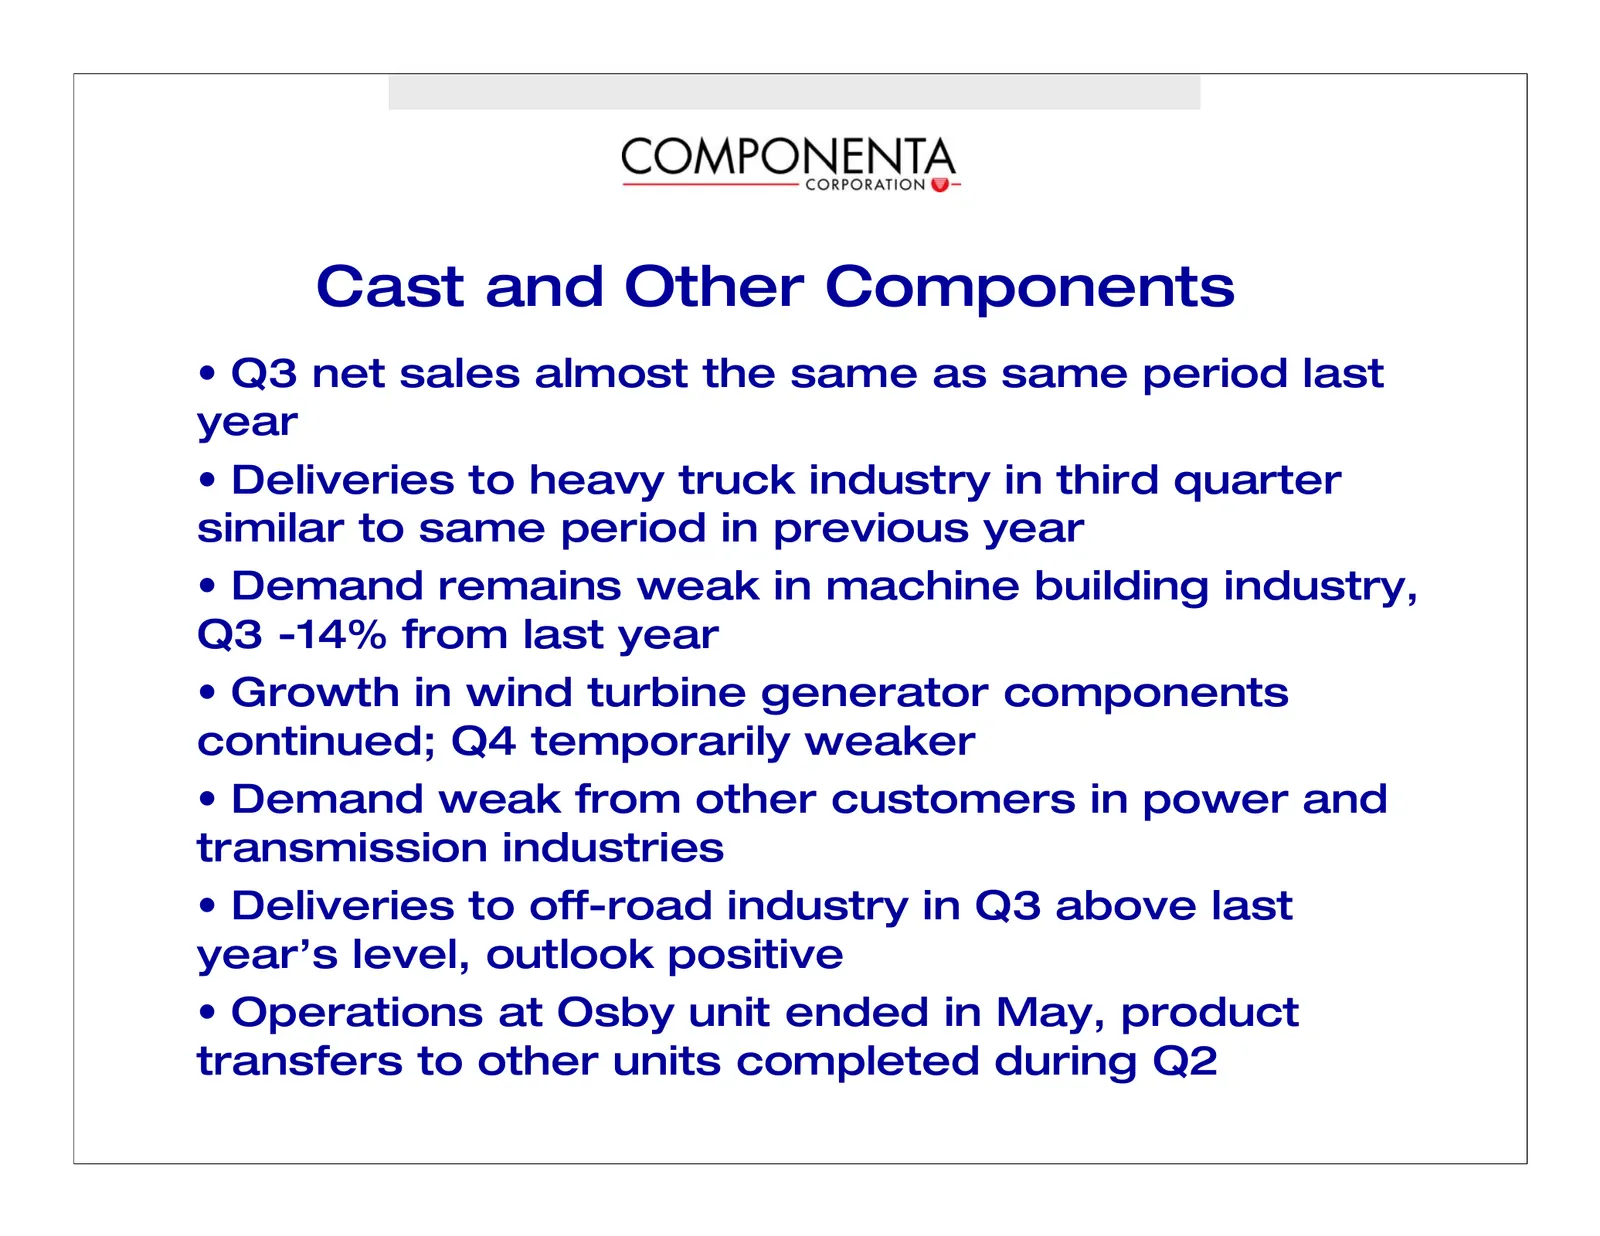
Cast and Other Components • Q3 net sales almost the same as same period last year • Deliveries to heavy truck industry in third quarter similar to same period in previous year • Demand remains weak in machine building industry, Q3 -14% from last year • Growth in wind turbine generator components con
Slide 15: Cast and Other components, sales to heavy truck industry
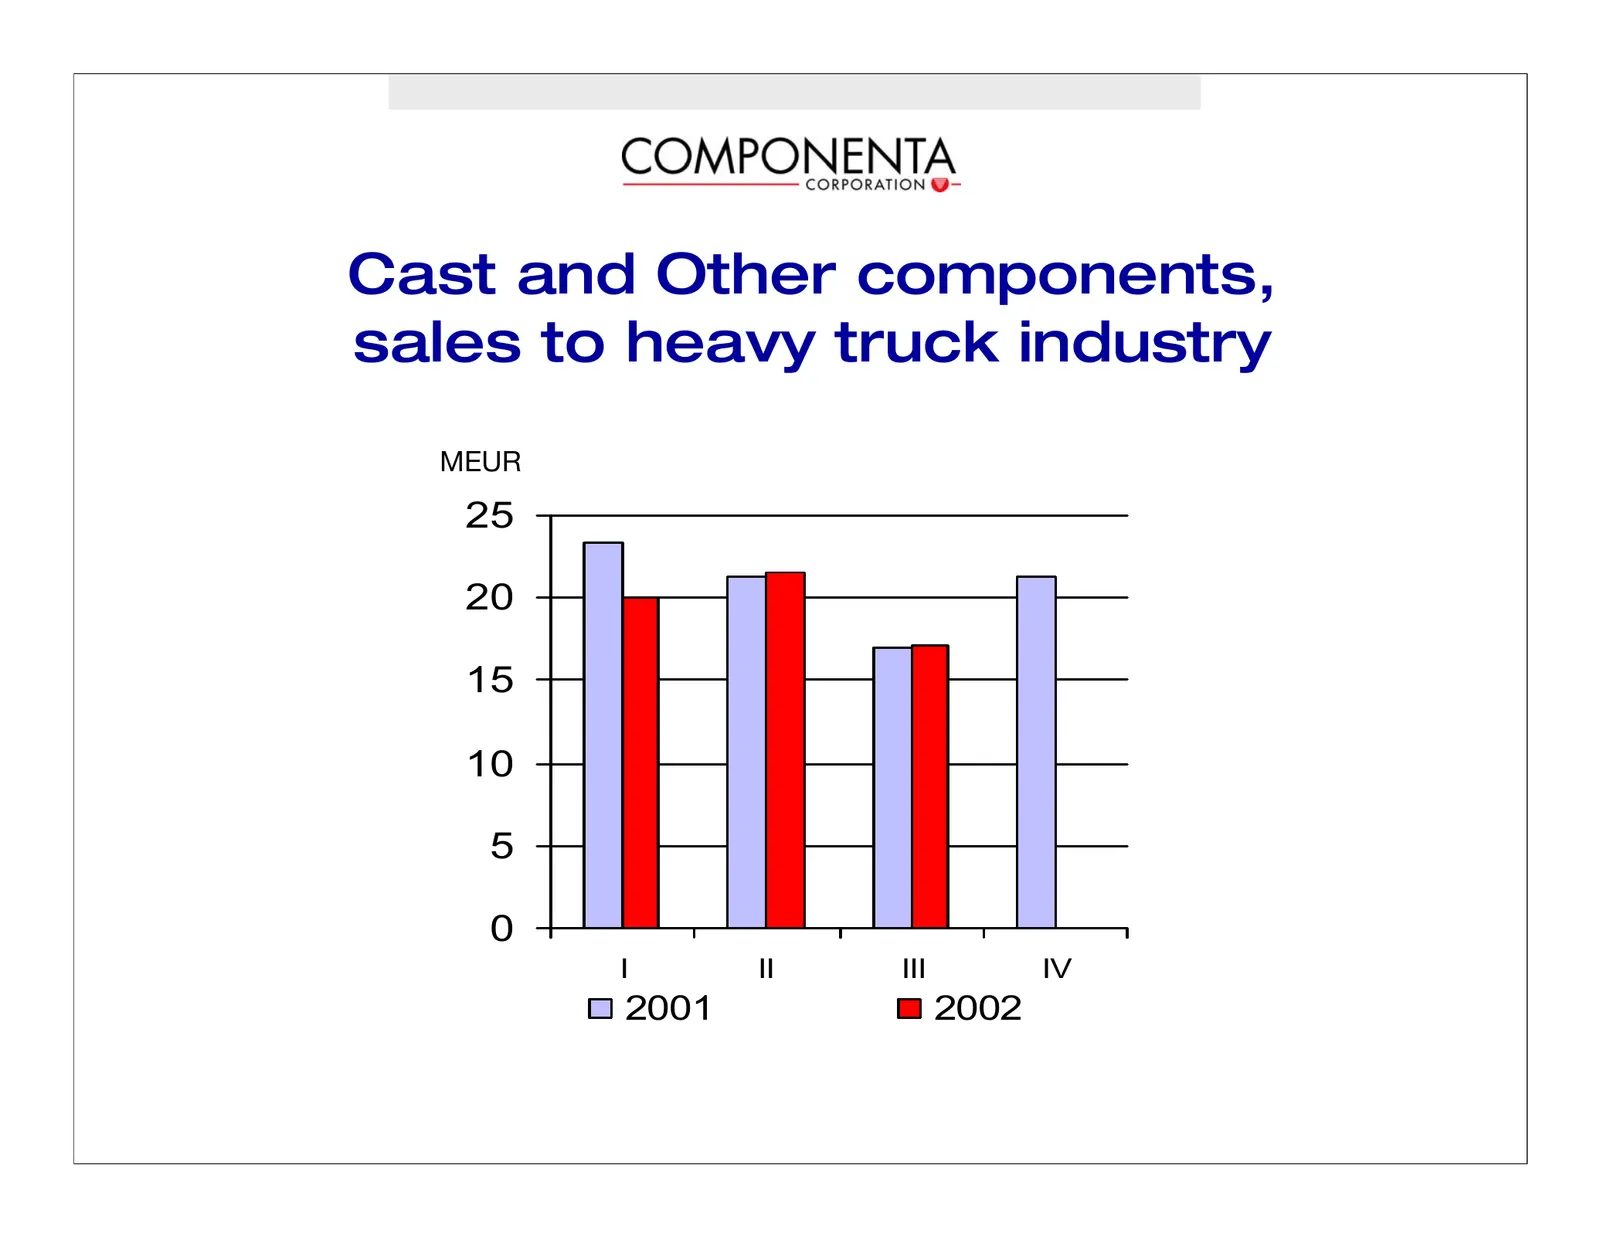
Cast and Other components, sales to heavy truck industry jbro 25 20 15 10 5 0 I II III IV 2001 2002
Slide 16: Cast and Other Components, sales to power and transmission industries
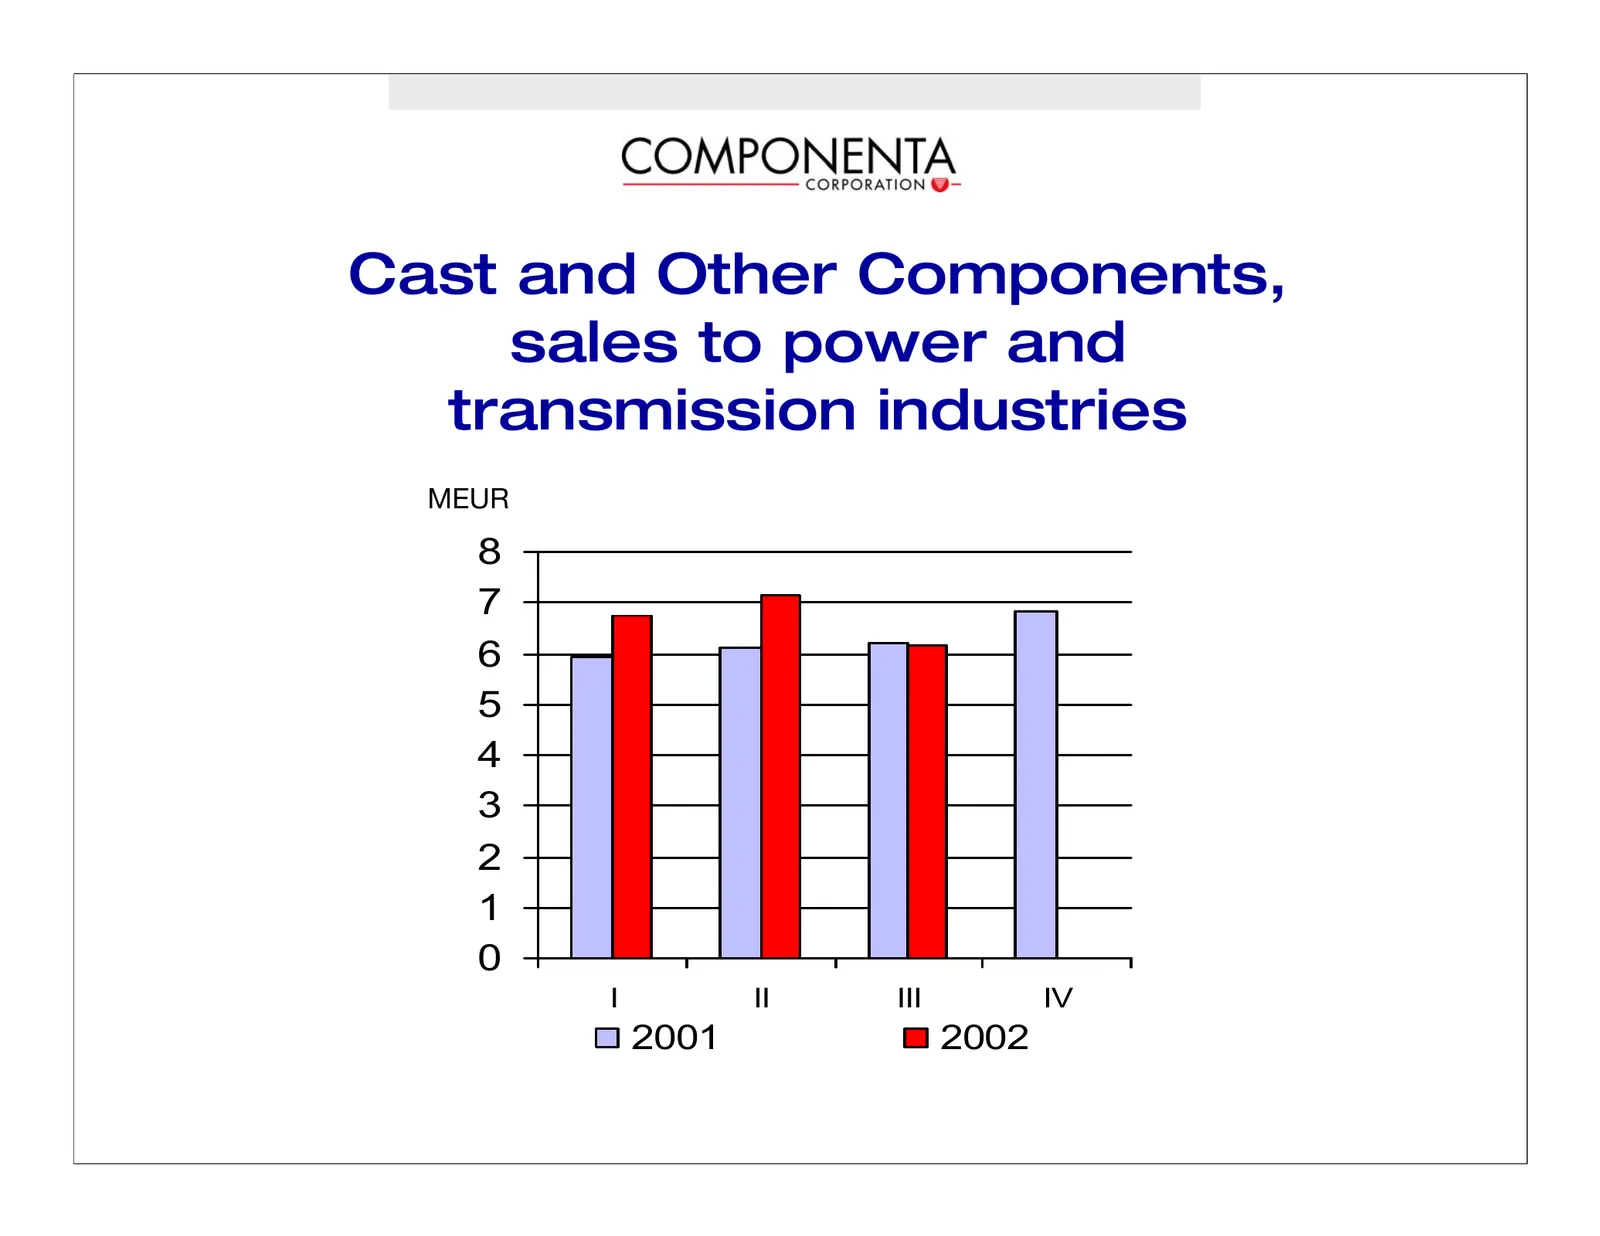
Cast and Other Components, sales to power and transmission industries jbro= 8 7 6 5 4 3 2 1 0 I II III IV 2001 2002
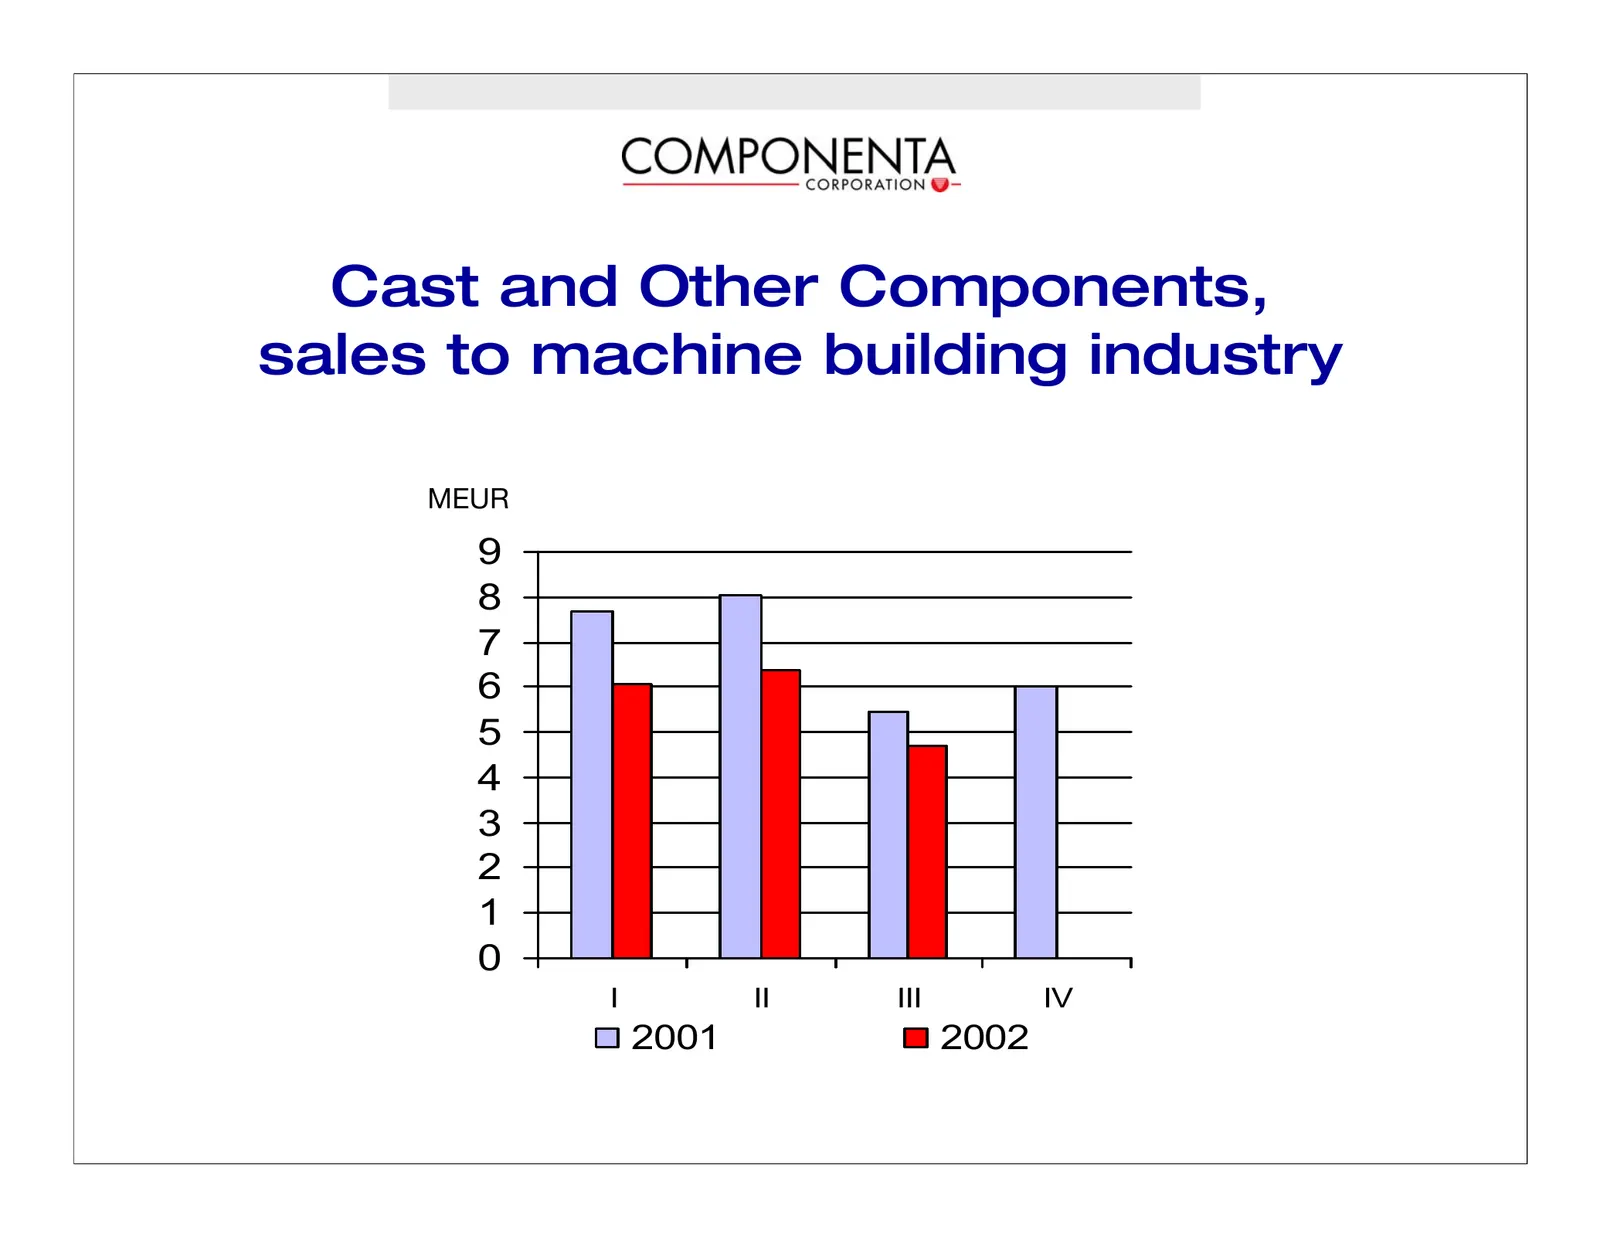
Slide 17: Cast and Other Components, sales to machine building industry
Cast and Other Components, sales to machine building industry jbro= 9 8 7 6 5 4 3 2 1 0 I II III IV 2001 2002
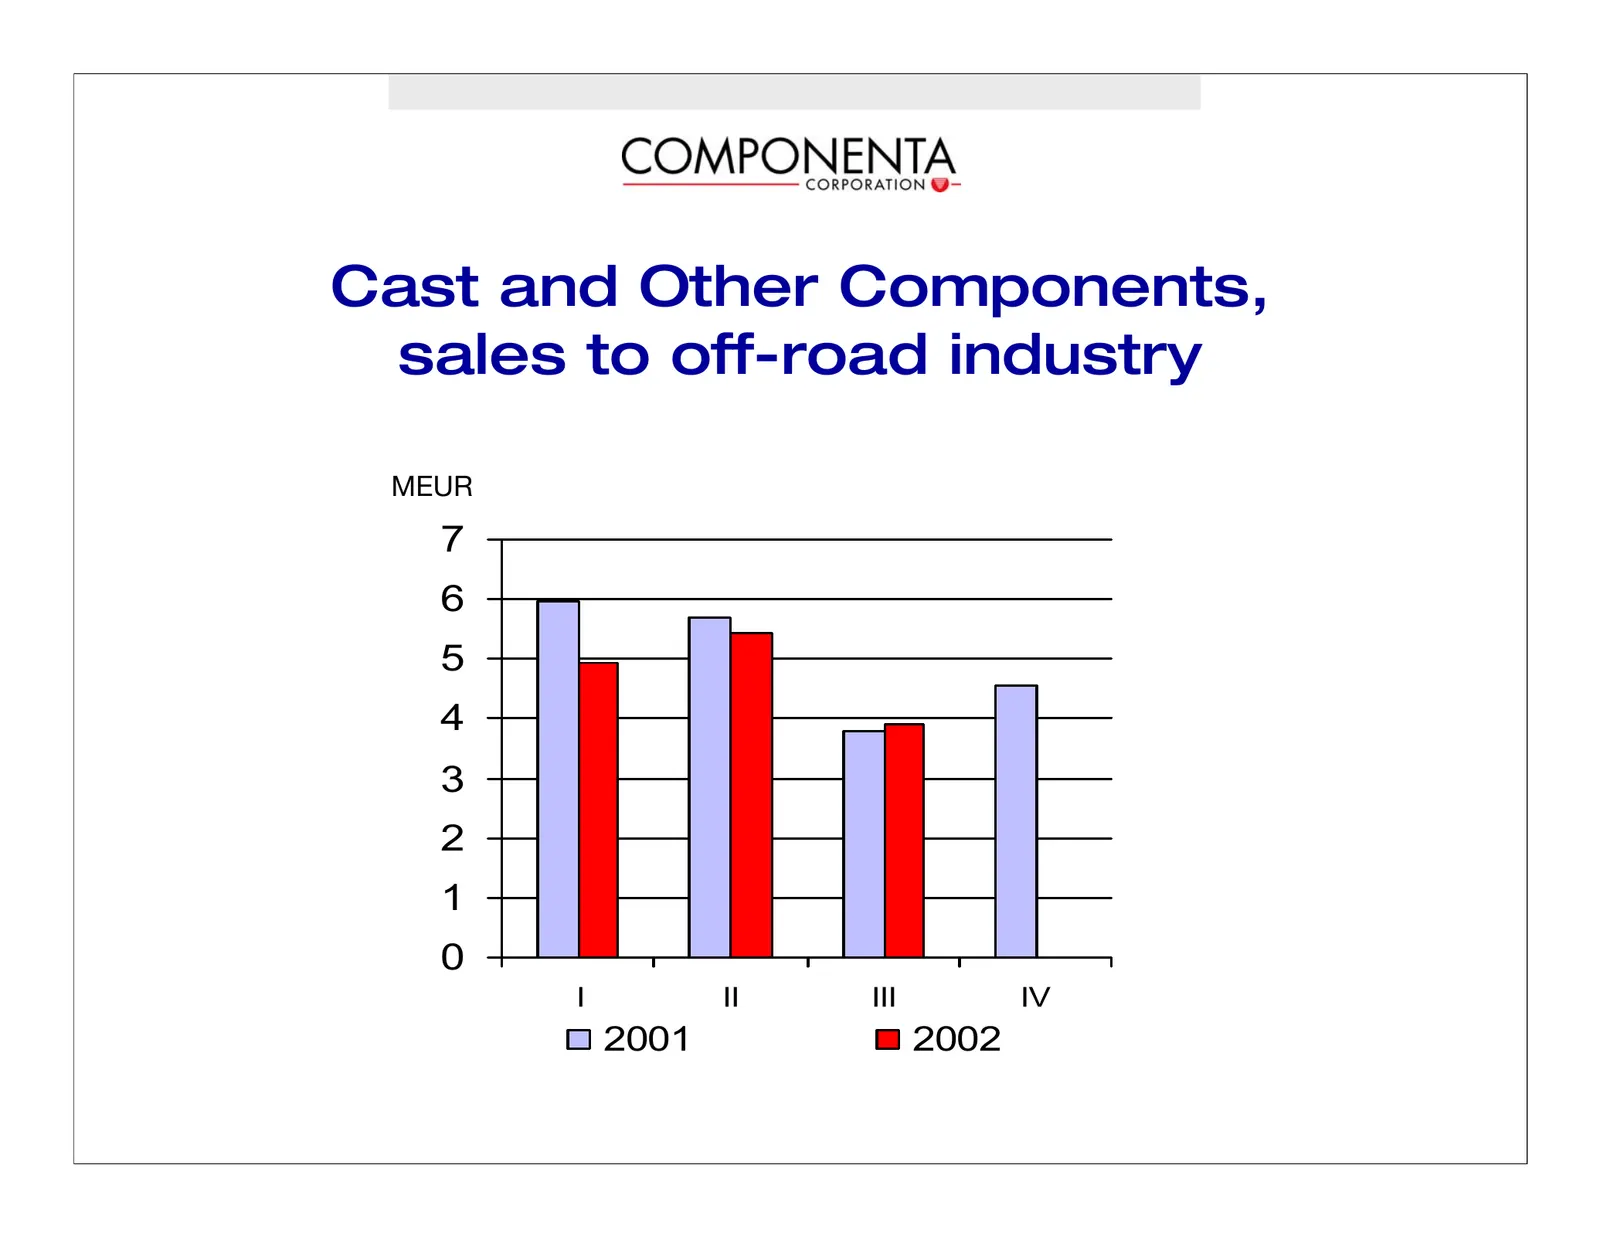
Slide 18: Cast and Other Components, sales to off-road industry
Cast and Other Components, sales to off-road industry jbro= 7 6 5 4 3 2 1 0 I II III IV 2001 2002
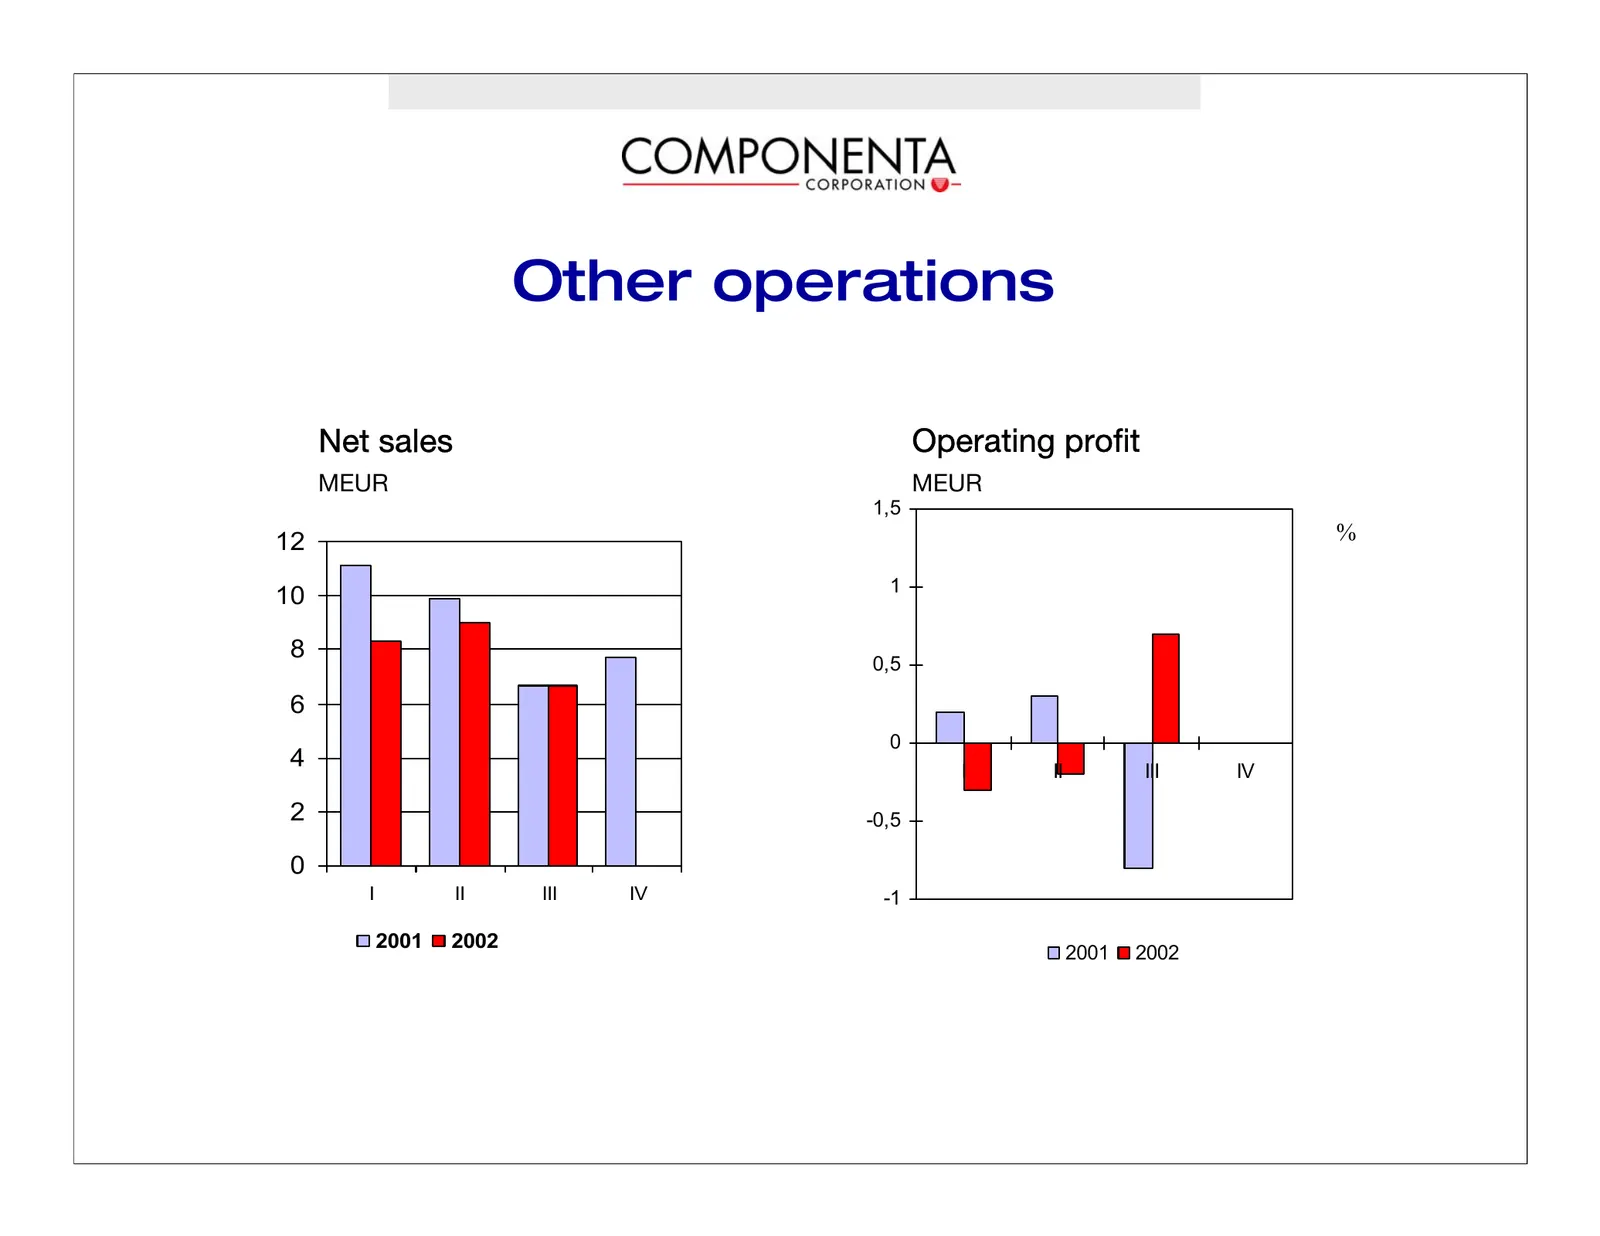
Slide 19: Other operations
Other operations kÉí=ë~äÉë léÉê~íáåÖ=éêçÑáí jbro jbro 1,5 12 % 1 10 8 0,5 6 0 4 I II III IV 2 -0,5 0 I II III IV -1 2001 2002 2001 2002
Slide 20: Other operations and associated companies
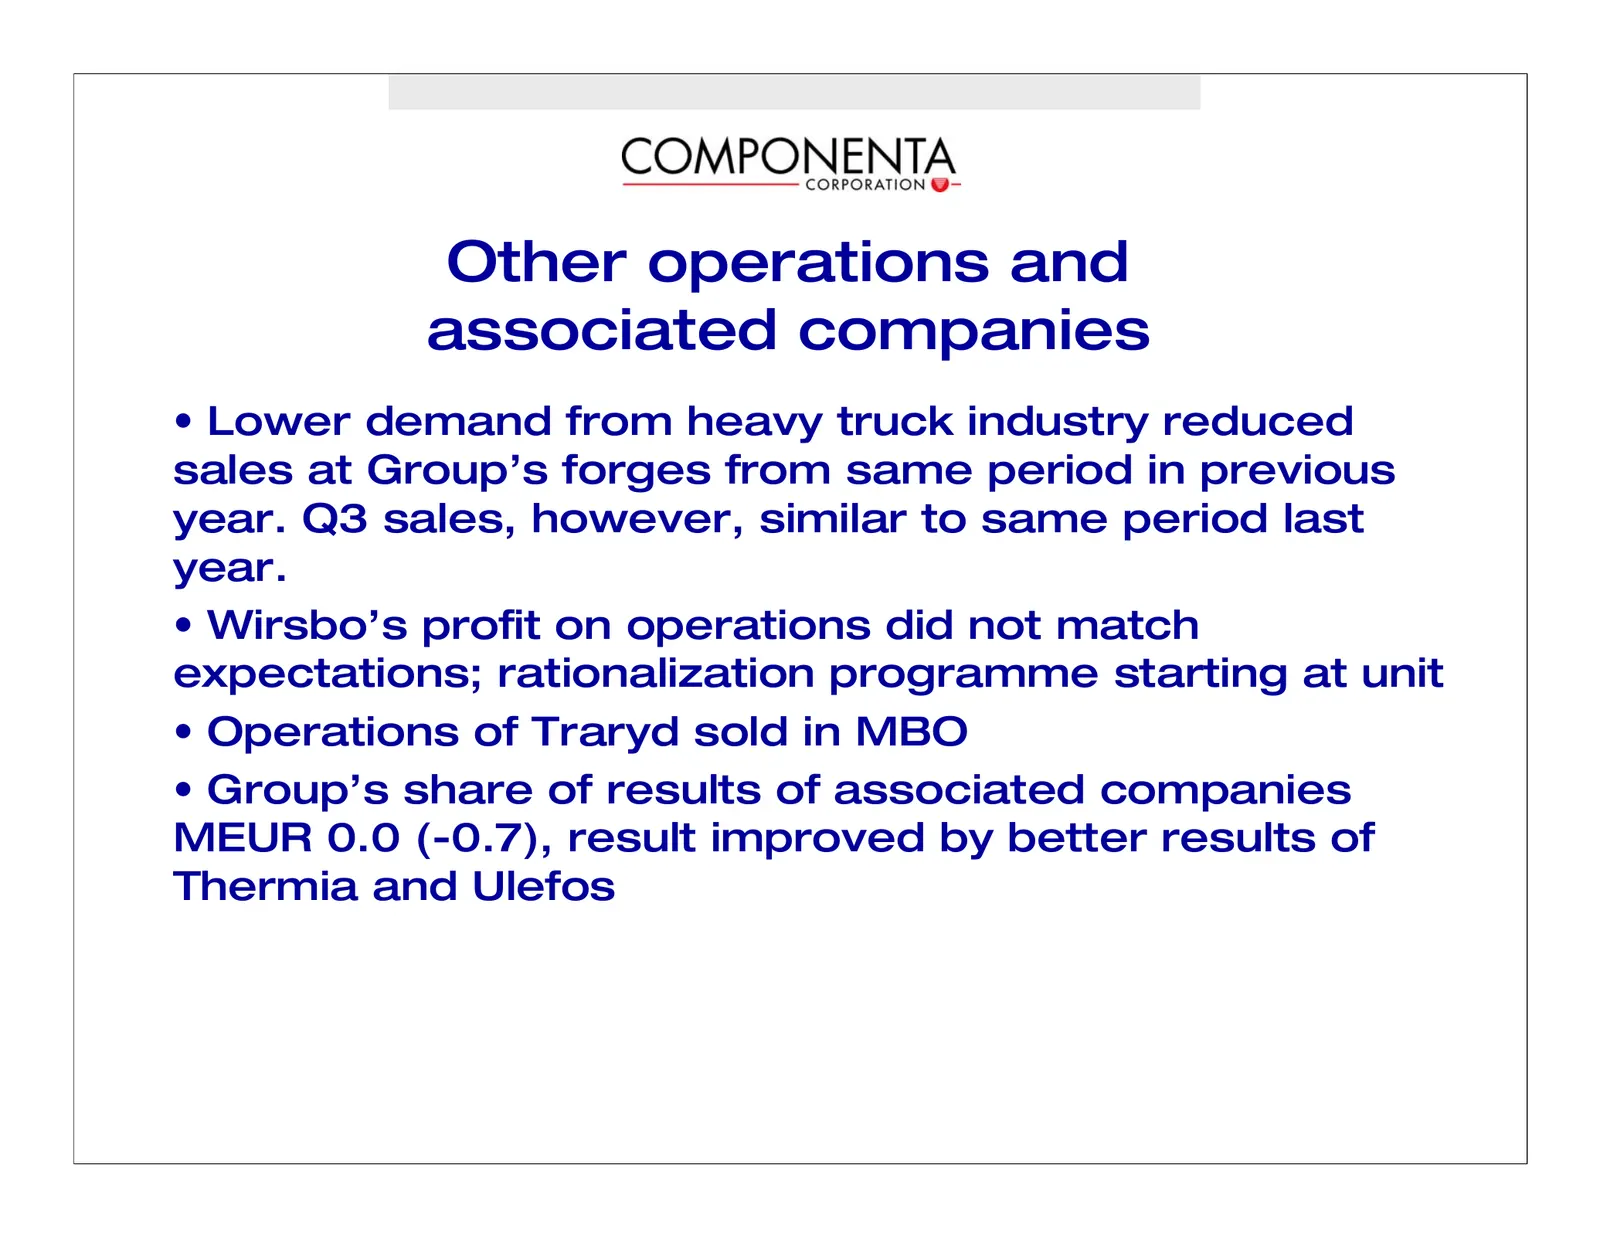
Other operations and associated companies • Lower demand from heavy truck industry reduced sales at Group’s forges from same period in previous year. Q3 sales, however, similar to same period last year. • Wirsbo’s profit on operations did not match expectations; rationalization programme starting at
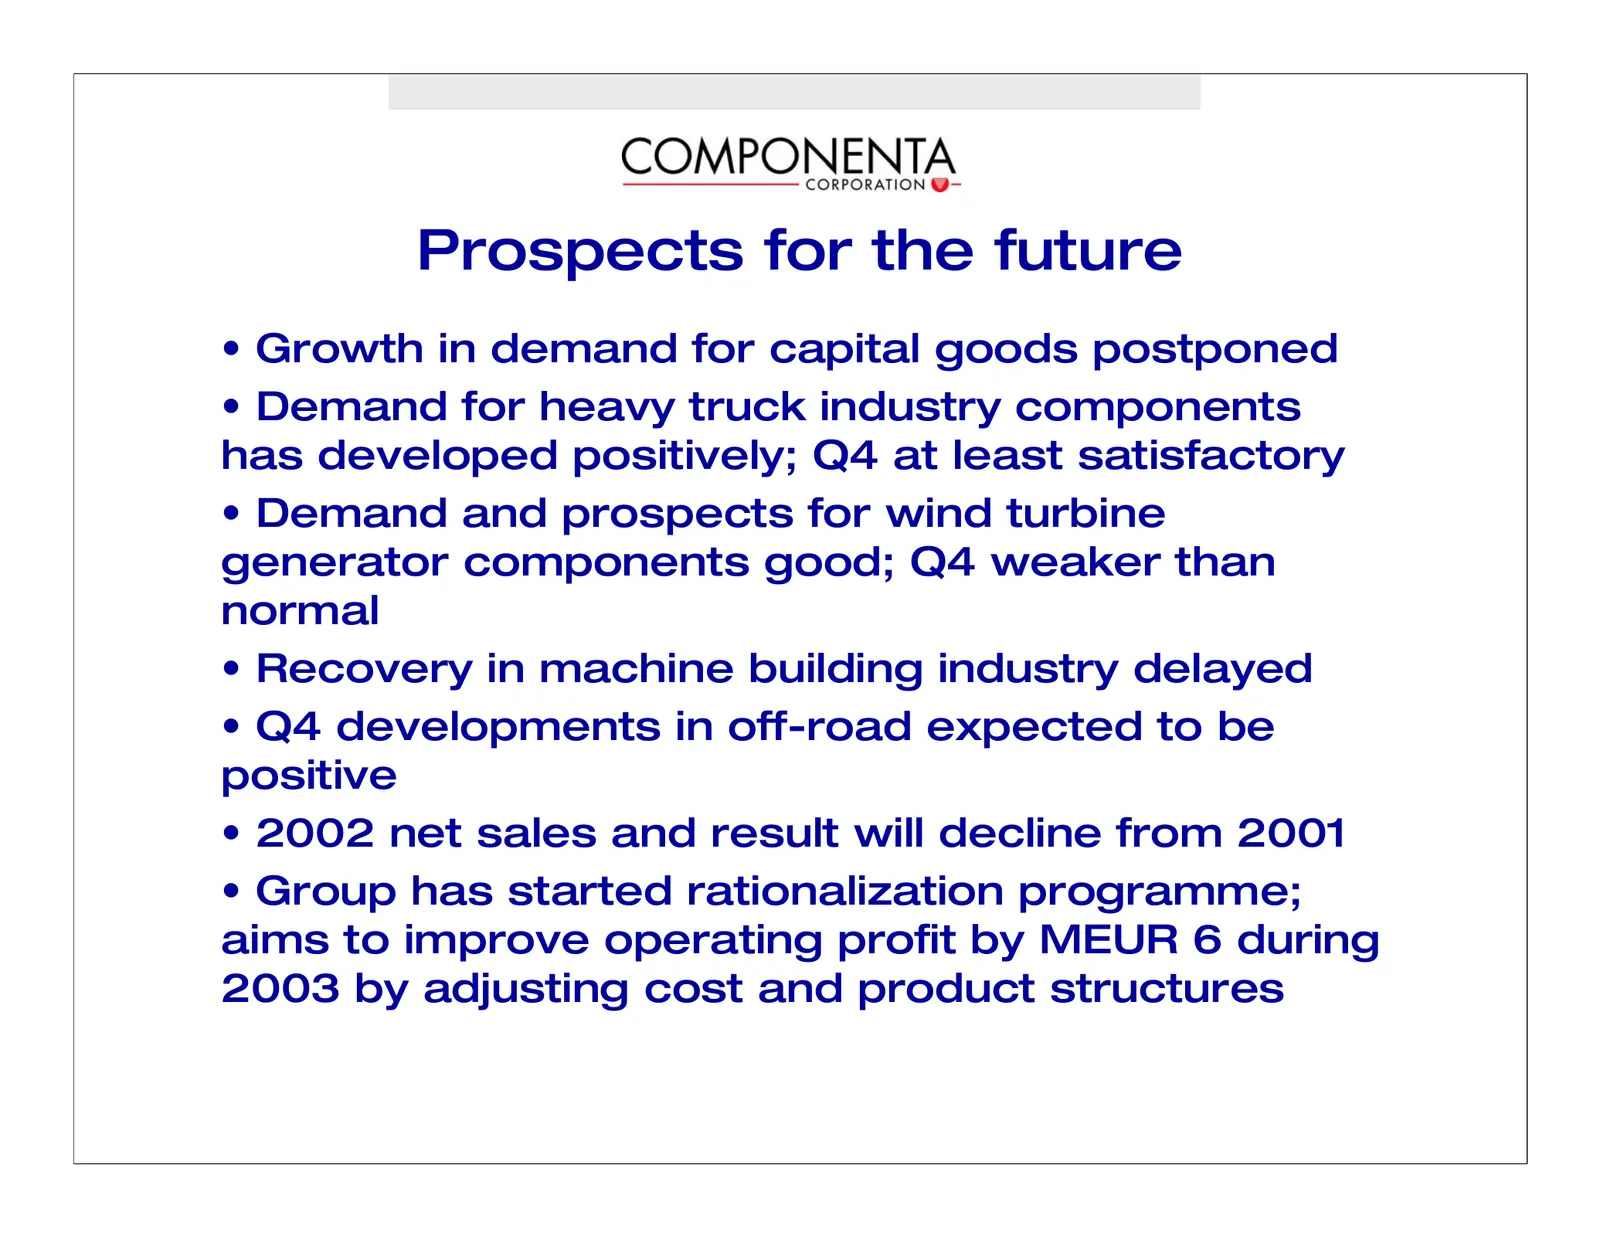
Slide 21: Prospects for the future
Prospects for the future • Growth in demand for capital goods postponed • Demand for heavy truck industry components has developed positively; Q4 at least satisfactory • Demand and prospects for wind turbine generator components good; Q4 weaker than normal • Recovery in machine building industry del
Source: Internet Archive copy of componenta.com
More decks from Componenta Oyj
 H1 2026 Earnings Presentation11 slides · Jul 23, 2026
 Q1 2026 Earnings Presentation10 slides · May 8, 2026
 FY2025 Earnings Presentation11 slides · Mar 6, 2026
 Q3 2025 Earnings Presentation12 slides · Oct 30, 2025
 H1 2025 Earnings Presentation12 slides · Jul 23, 2025
 Q1 2025 Earnings Presentation11 slides · May 9, 2025