Forestar Group Inc · NYSE:FOR
Forestar — Investor Presentation (June 2022)
30 slides from Forestar's investor presentation, Jun 30, 2022
Slide 1: Investor Presentation Q3|22
ae x) FORES’ Investor Presentation Q3|22
Slide 2: Forward-Looking Statements
FORWARD-LOOKING STATEMENTS This presentation may include “forward-looking statements” as defined by the Private Securities Litigation Reform Act of 1995. Although Forestar believes any such statements are based on reasonable assumptions, there is no assurance that actual outcomes will not be materia
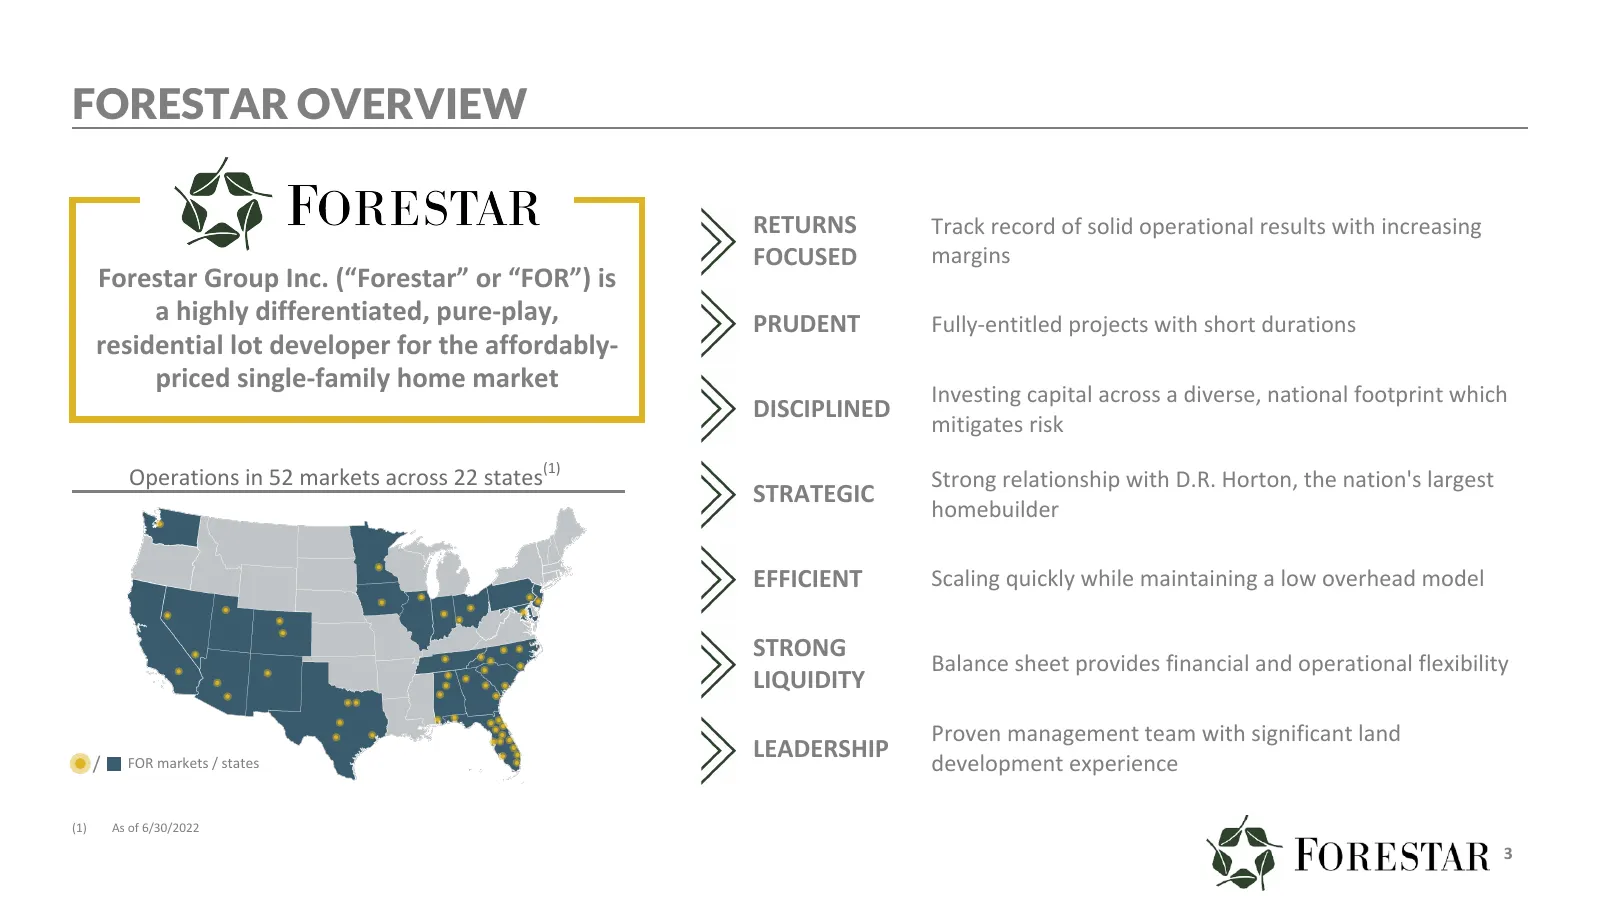
Slide 3: Forestar Overview
FORESTAR OVERVIEW RETURNS Track record of solid operational results with increasing FOCUSED margins Forestar Group Inc. (“Forestar” or “FOR”) is a highly differentiated, pure-play, PRUDENT Fully-entitled projects with short durations residential lot developer for the affordably- priced single-family
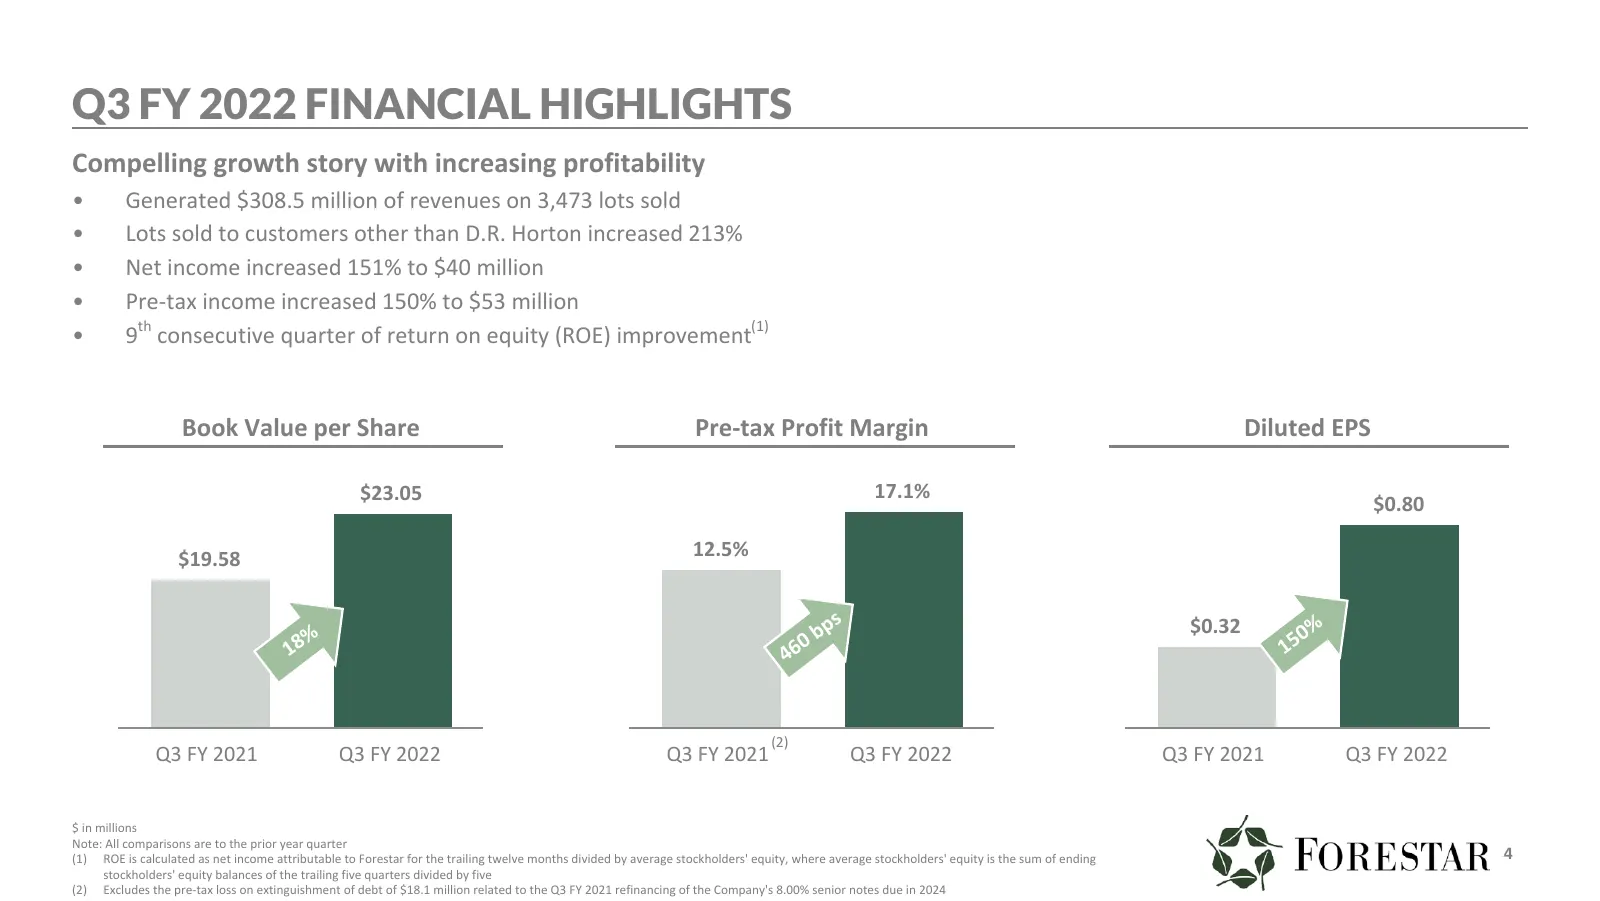
Slide 4: Q3 FY 2022 Financial Highlights
Q3 FY 2022 FINANCIAL HIGHLIGHTS Compelling growth story with increasing profitability • Generated $308.5 million of revenues on 3,473 lots sold • Lots sold to customers other than D.R. Horton increased 213% • Net income increased 151% to $40 million • Pre-tax income increased 150% to $53 million • 9
Slide 5: Track Record of Profitability and Growth
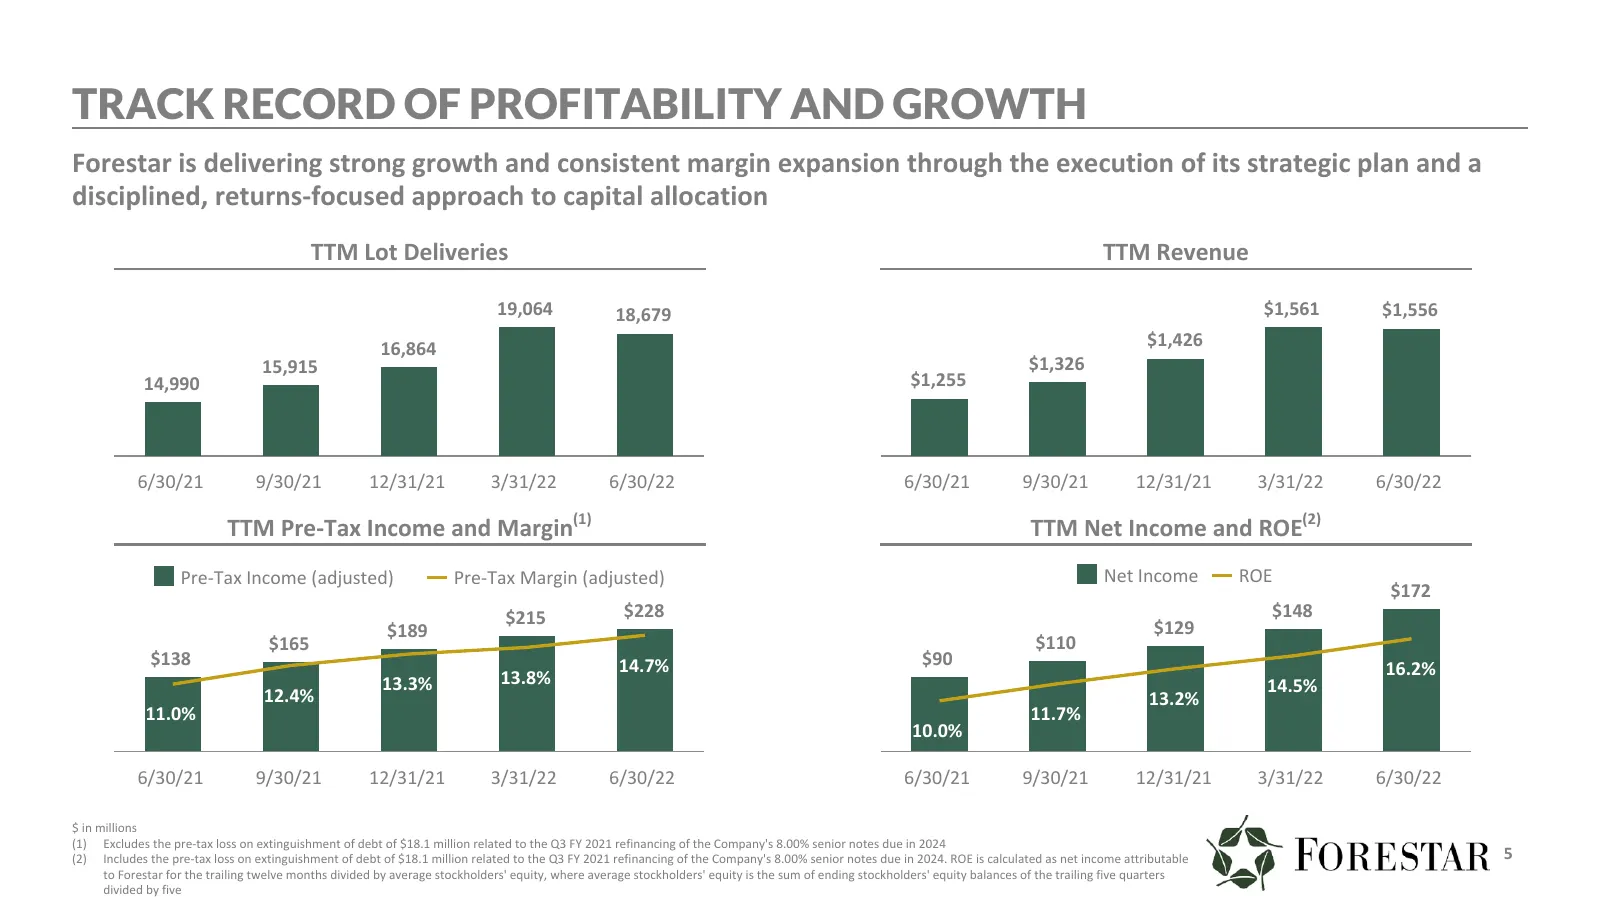
TRACK RECORD OF PROFITABILITY AND GROWTH Forestar is delivering strong growth and consistent margin expansion through the execution of its strategic plan and a disciplined, returns-focused approach to capital allocation TTM Lot Deliveries TTM Revenue 19,064 18,679 $1,561 $1,556 16,864 $1,426 15,915
Slide 6: Compelling Growth Story
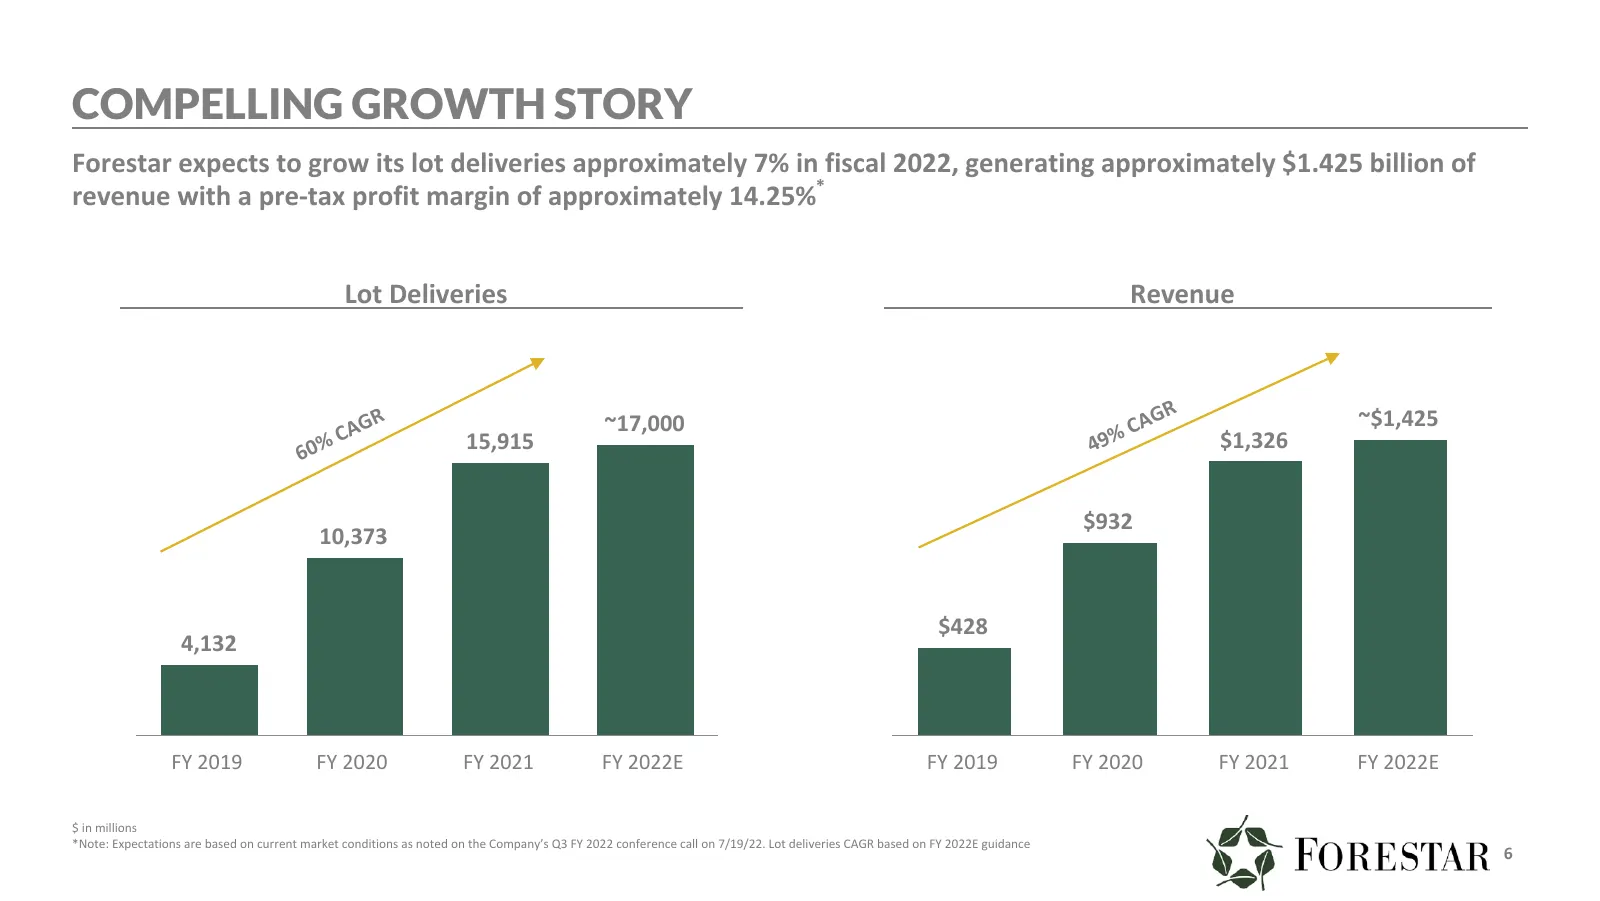
COMPELLING GROWTH STORY Forestar expects to grow its lot deliveries approximately 7% in fiscal 2022, generating approximately $1.425 billion of revenue with a pre-tax profit margin of approximately 14.25%* Lot Deliveries Revenue R R ~17,000 AG ~$1,425 % CAG 15,915 49% C $1,326 60 $932 10,373 $428 4,
Slide 7: The Market Opportunity
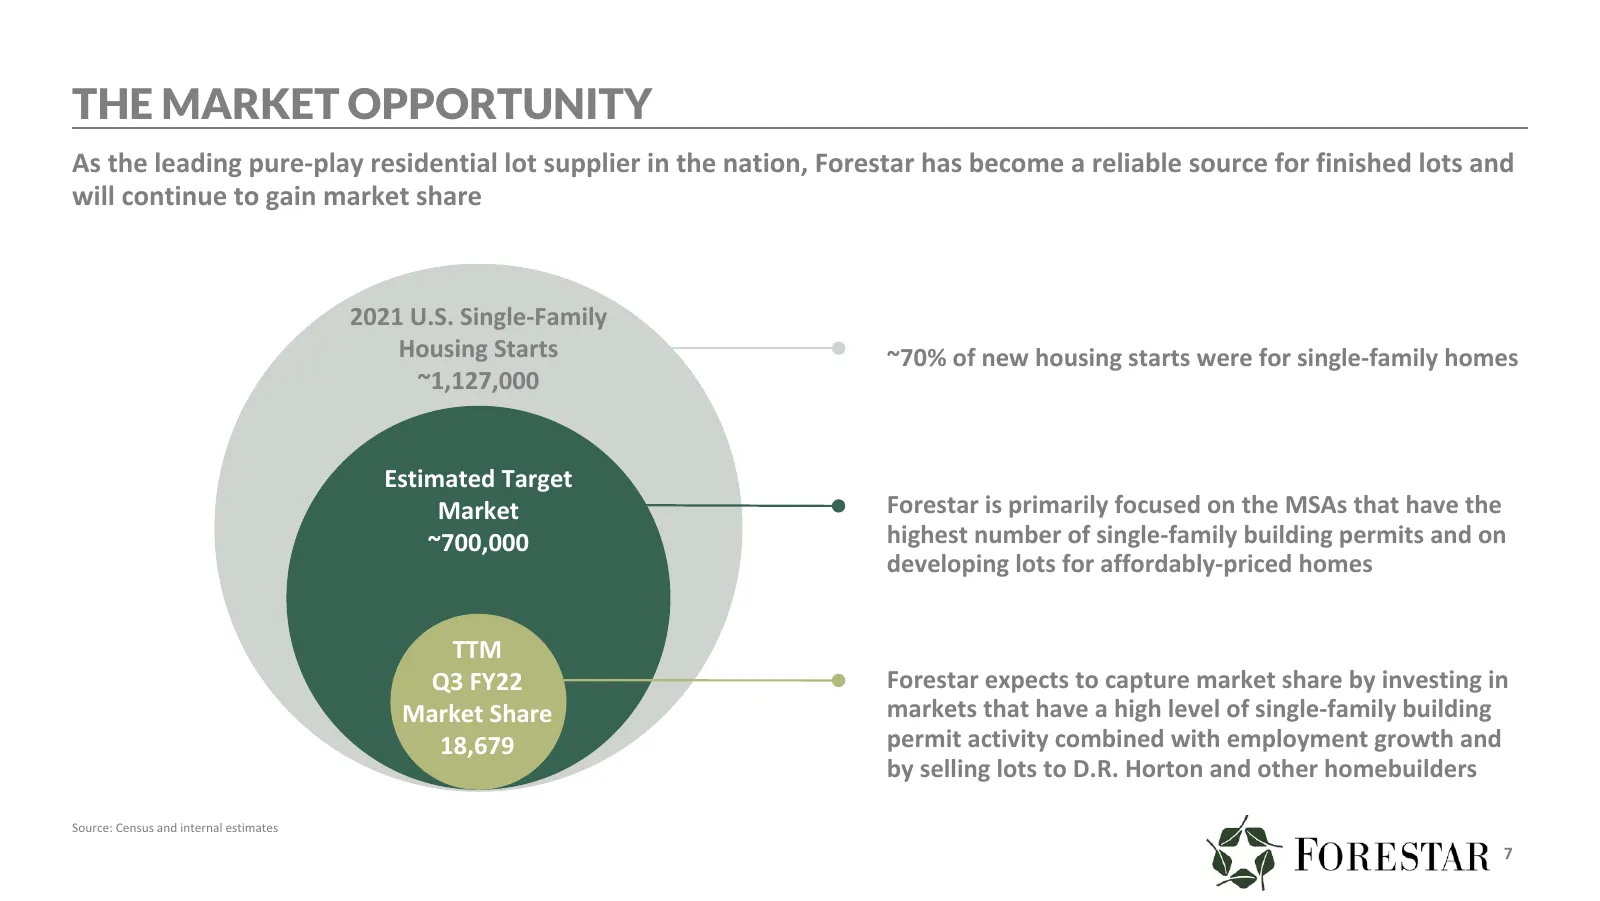
THE MARKET OPPORTUNITY As the leading pure-play residential lot supplier in the nation, Forestar has become a reliable source for finished lots and will continue to gain market share 2021 U.S. Single-Family Housing Starts ~70% of new housing starts were for single-family homes ~1,127,000 Estimated T
Slide 8: Intermediate Term Growth Goals
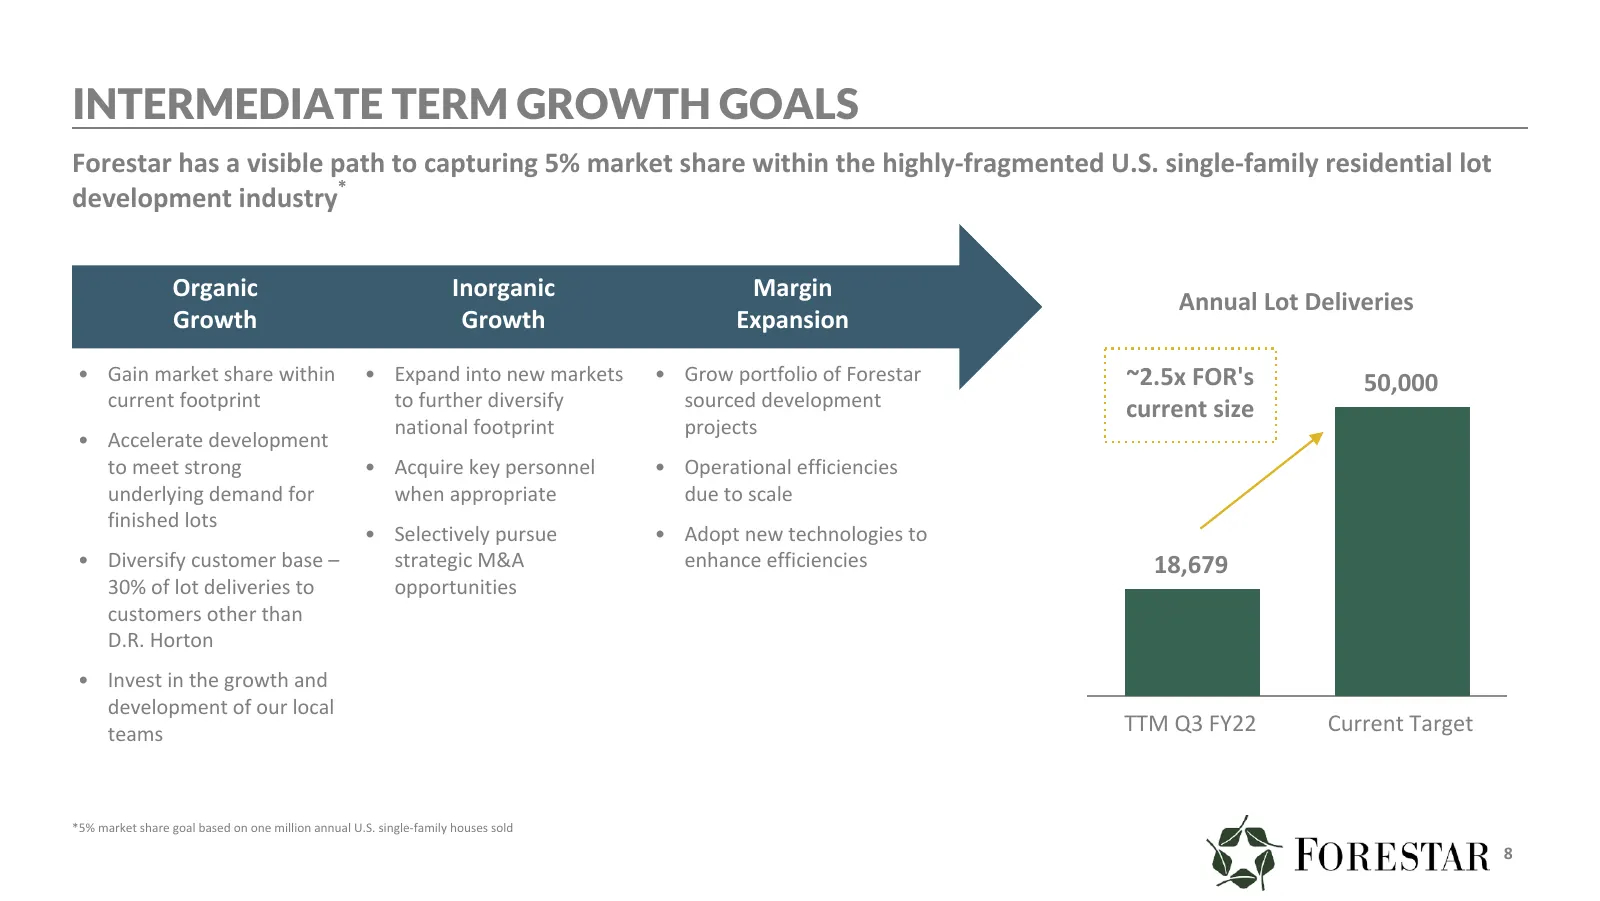
INTERMEDIATE TERM GROWTH GOALS Forestar has a visible path to capturing 5% market share within the highly-fragmented U.S. single-family residential lot development industry* Organic Inorganic Margin Annual Lot Deliveries Growth Growth Expansion • Gain market share within • Expand into new markets •
Slide 9: Manufacturing Approach to Land Development
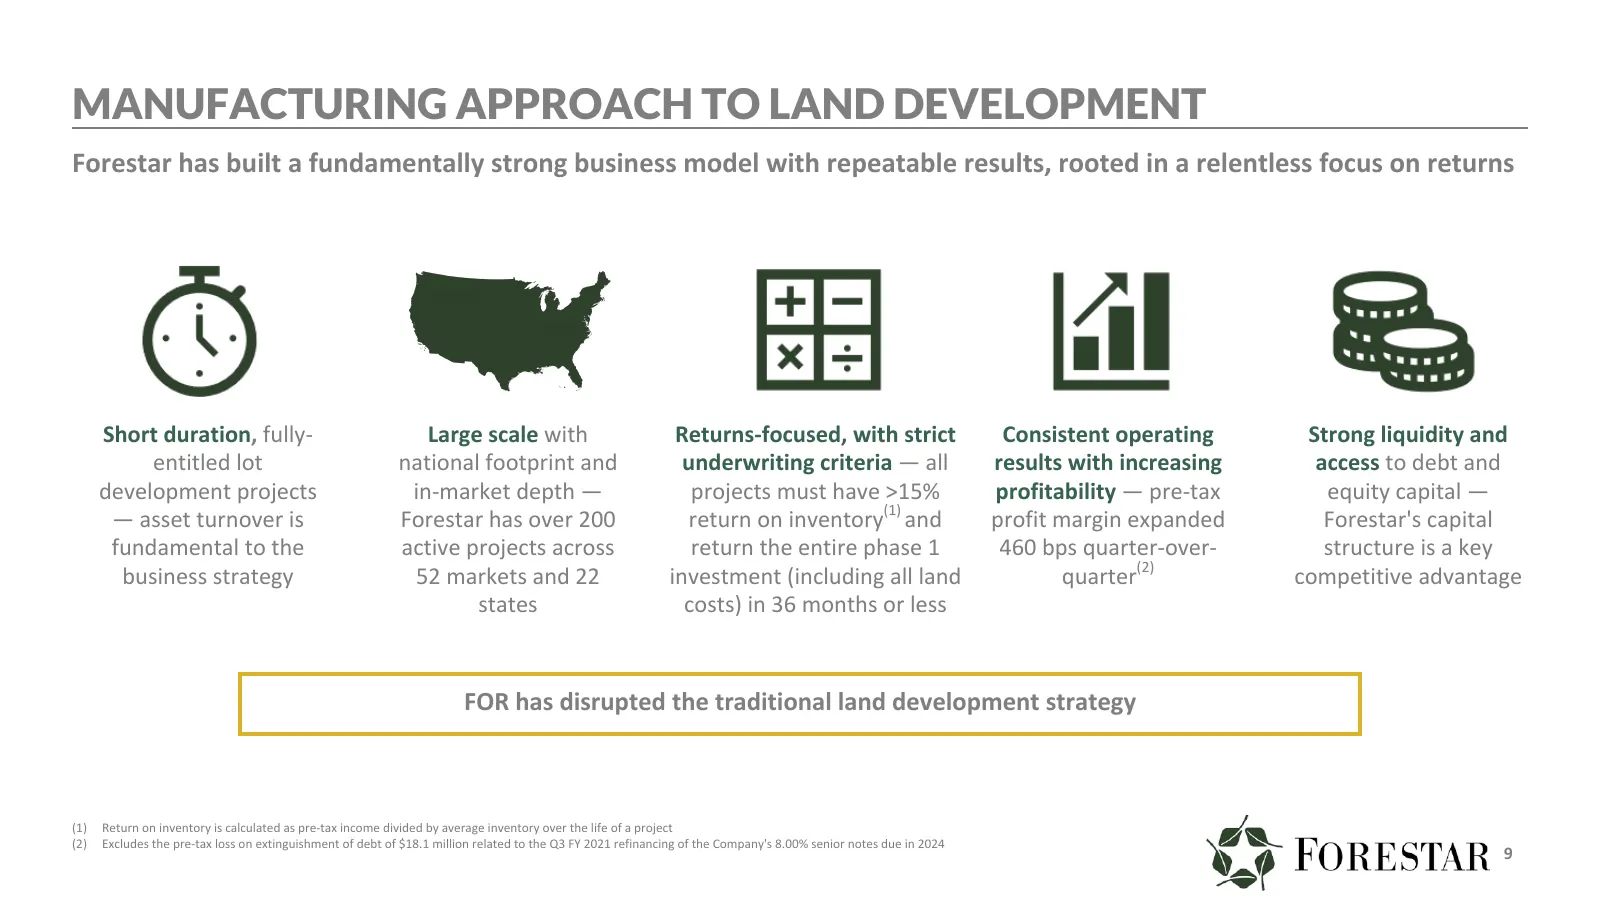
MANUFACTURING APPROACH TO LAND DEVELOPMENT Forestar has built a fundamentally strong business model with repeatable results, rooted in a relentless focus on returns Short duration, fully- Large scale with Returns-focused, with strict Consistent operating Strong liquidity and entitled lot national fo
Slide 10: Forestar Supplies the First Input to Building a Home
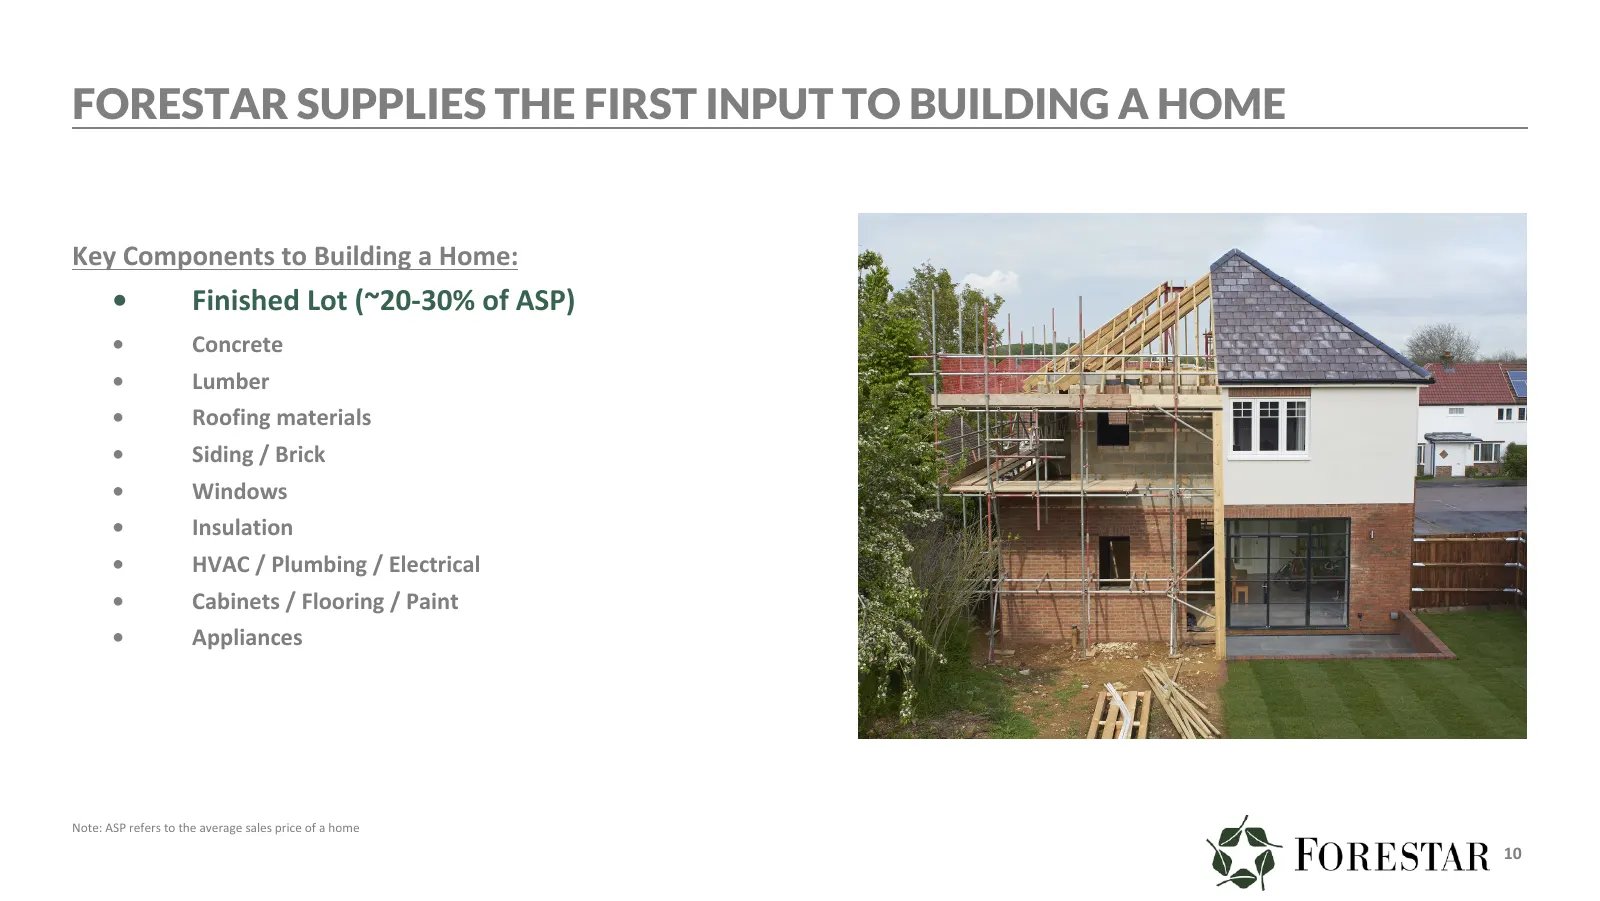
FORESTAR SUPPLIES THE FIRST INPUT TO BUILDING A HOME Key Components to Building a Home: • Finished Lot (~20-30% of ASP) • Concrete • Lumber • Roofing materials • Siding / Brick • Windows • Insulation • HVAC / Plumbing / Electrical • Cabinets / Flooring / Paint • Appliances Note: ASP refers to the av
Slide 11: Unique Approach to Lot Development — DuPont Analysis
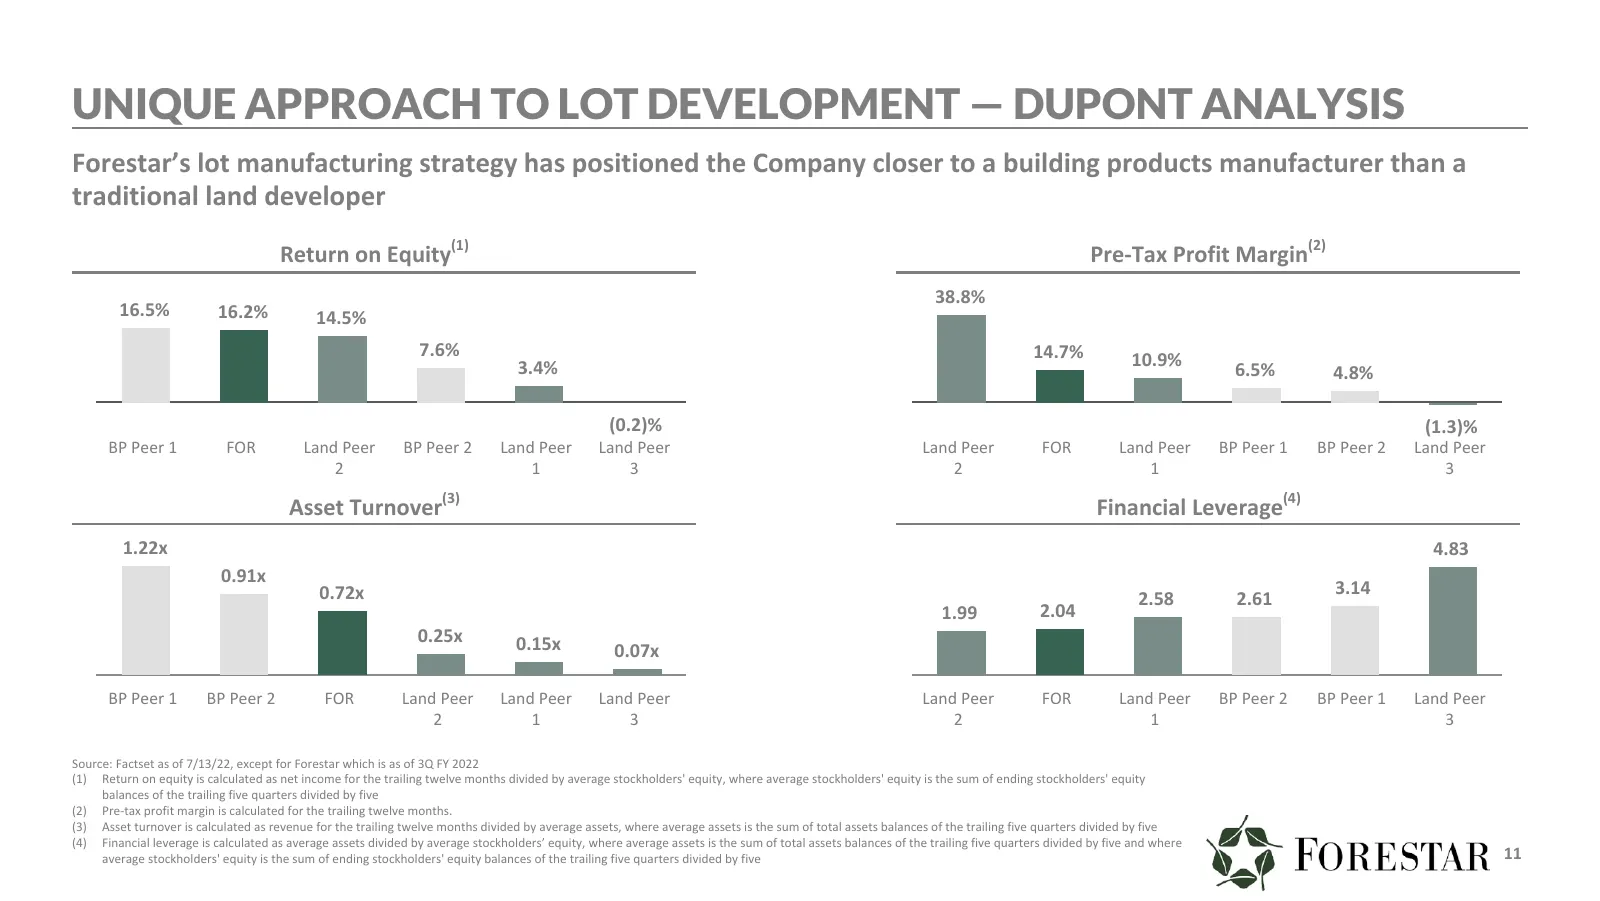
UNIQUE APPROACH TO LOT DEVELOPMENT — DUPONT ANALYSIS Forestar’s lot manufacturing strategy has positioned the Company closer to a building products manufacturer than a traditional land developer Return on Equity(1) Pre-Tax Profit Margin(2) 38.8% 16.5% 16.2% 14.5% 7.6% 14.7% 10.9% 3.4% 6.5% 4.8% (0.2
Slide 12: Highly Strategic Alignment with DHI
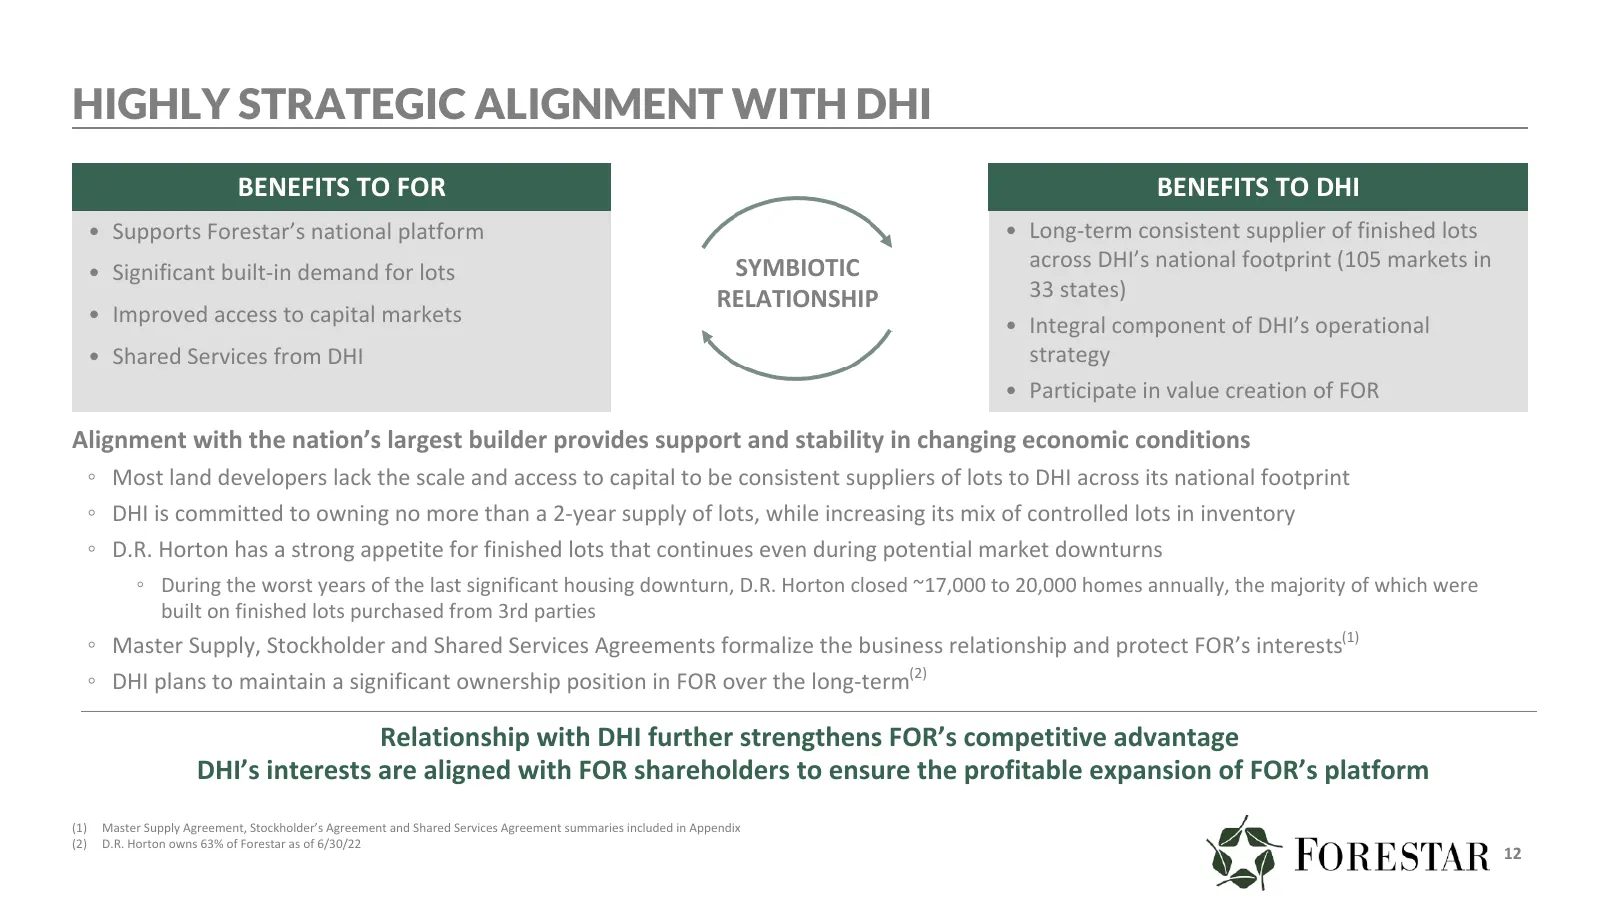
HIGHLY STRATEGIC ALIGNMENT WITH DHI BENEFITS TO FOR BENEFITS TO DHI • Supports Forestar’s national platform • Long-term consistent supplier of finished lots SYMBIOTIC across DHI’s national footprint (105 markets in • Significant built-in demand for lots RELATIONSHIP 33 states) • Improved access to c
Slide 13: DHI Track Record Provides Roadmap to FOR
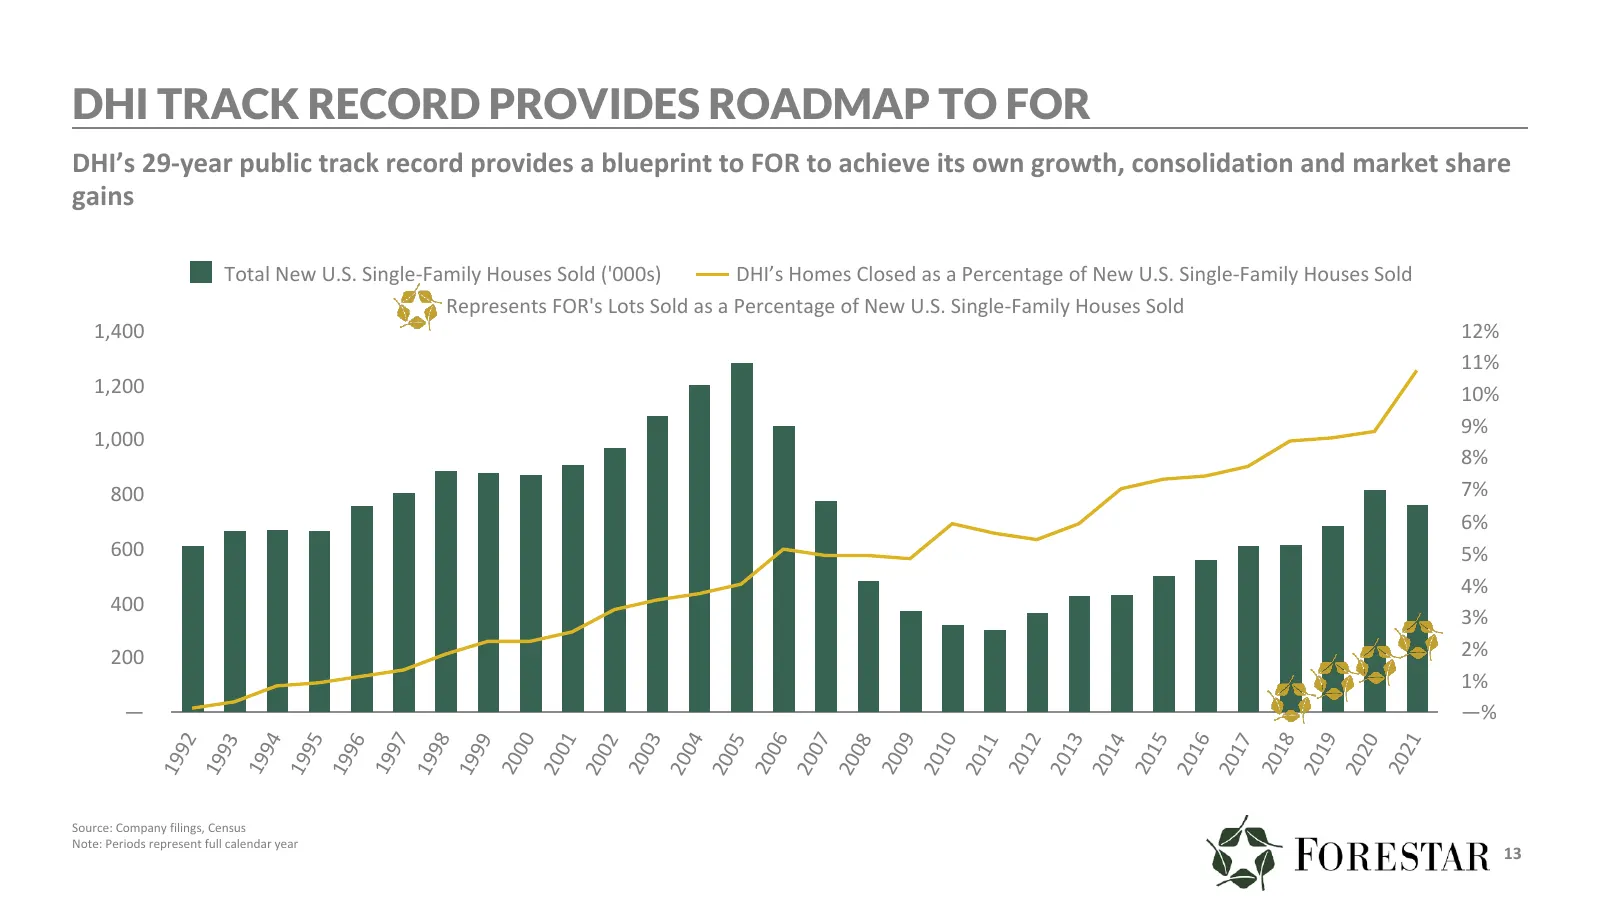
DHI TRACK RECORD PROVIDES ROADMAP TO FOR DHI’s 29-year public track record provides a blueprint to FOR to achieve its own growth, consolidation and market share gains Total New U.S. Single-Family Houses Sold ('000s) DHI’s Homes Closed as a Percentage of New U.S. Single-Family Houses Sold Represents
Slide 14: FOR Is an Essential Lot Supplier to DHI
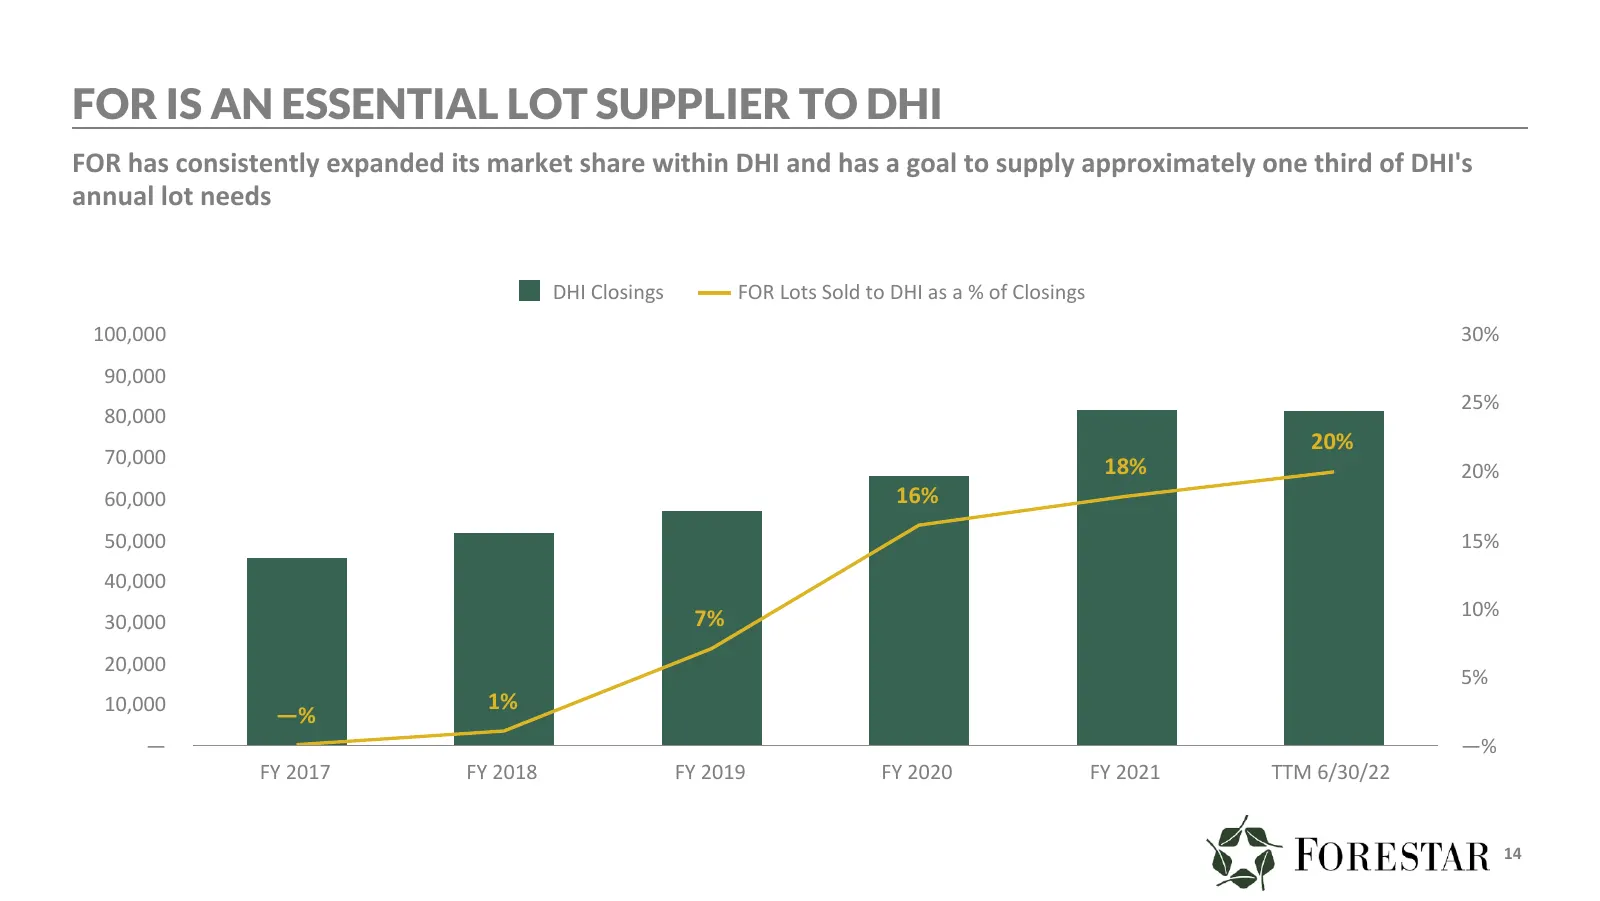
FOR IS AN ESSENTIAL LOT SUPPLIER TO DHI FOR has consistently expanded its market share within DHI and has a goal to supply approximately one third of DHI's annual lot needs DHI Closings FOR Lots Sold to DHI as a % of Closings 100,000 30% 90,000 25% 80,000 20% 70,000 18% 20% 60,000 16% 50,000 15% 40,
Slide 15: FOR Is Successfully Diversifying Its Customer Base
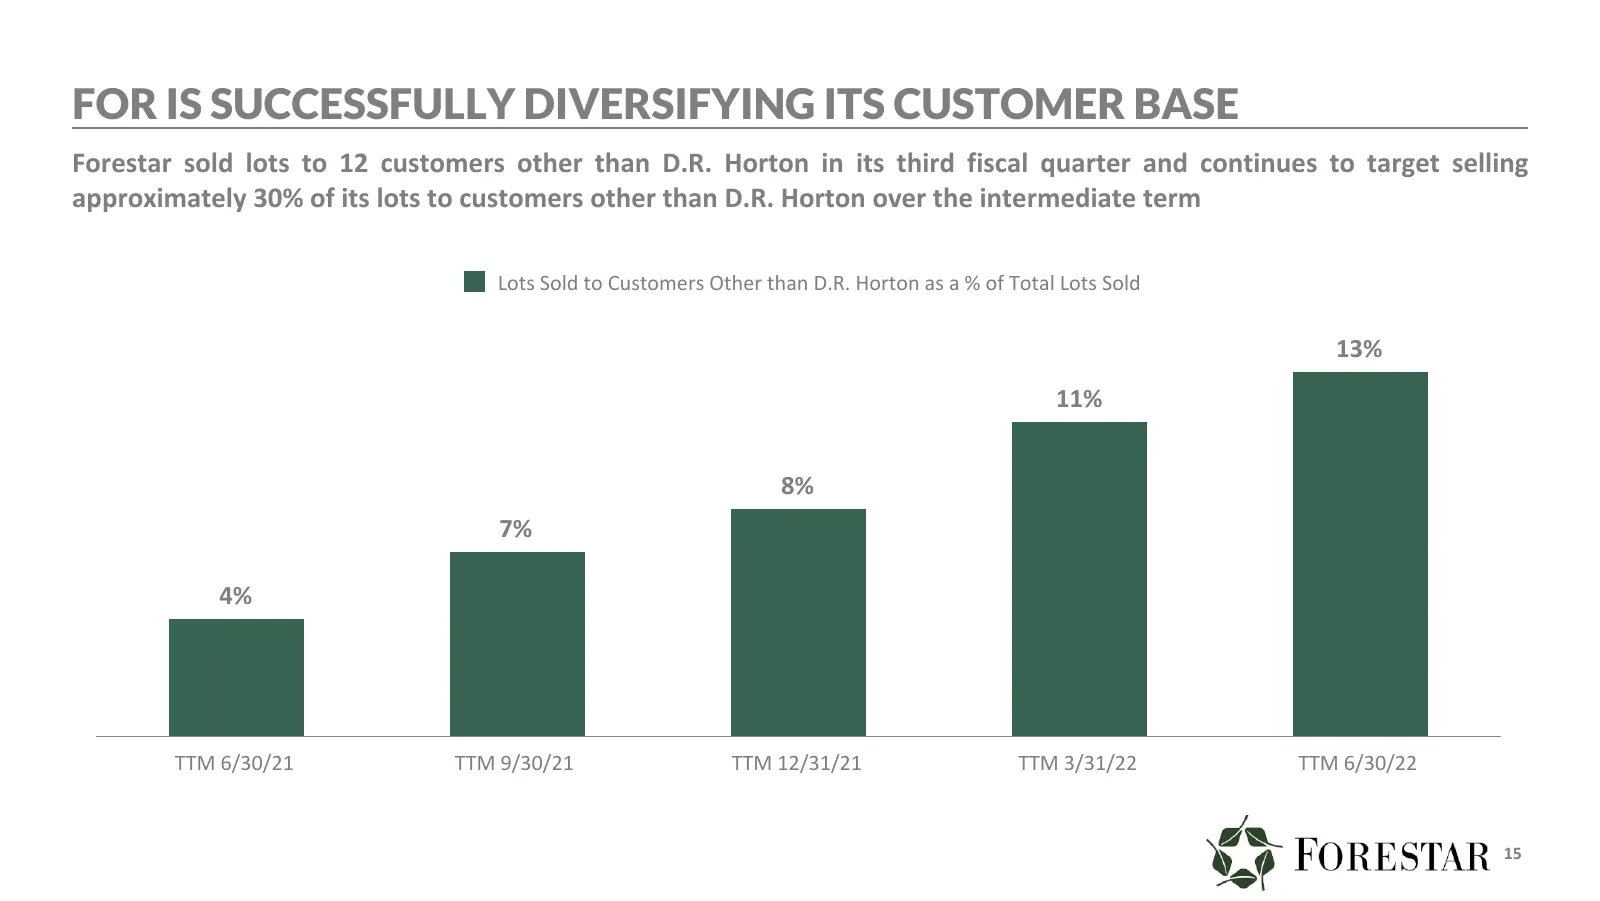
FOR IS SUCCESSFULLY DIVERSIFYING ITS CUSTOMER BASE Forestar sold lots to 12 customers other than D.R. Horton in its third fiscal quarter and continues to target selling approximately 30% of its lots to customers other than D.R. Horton over the intermediate term Lots Sold to Customers Other than D.R.
Slide 16: Land and Development Investments
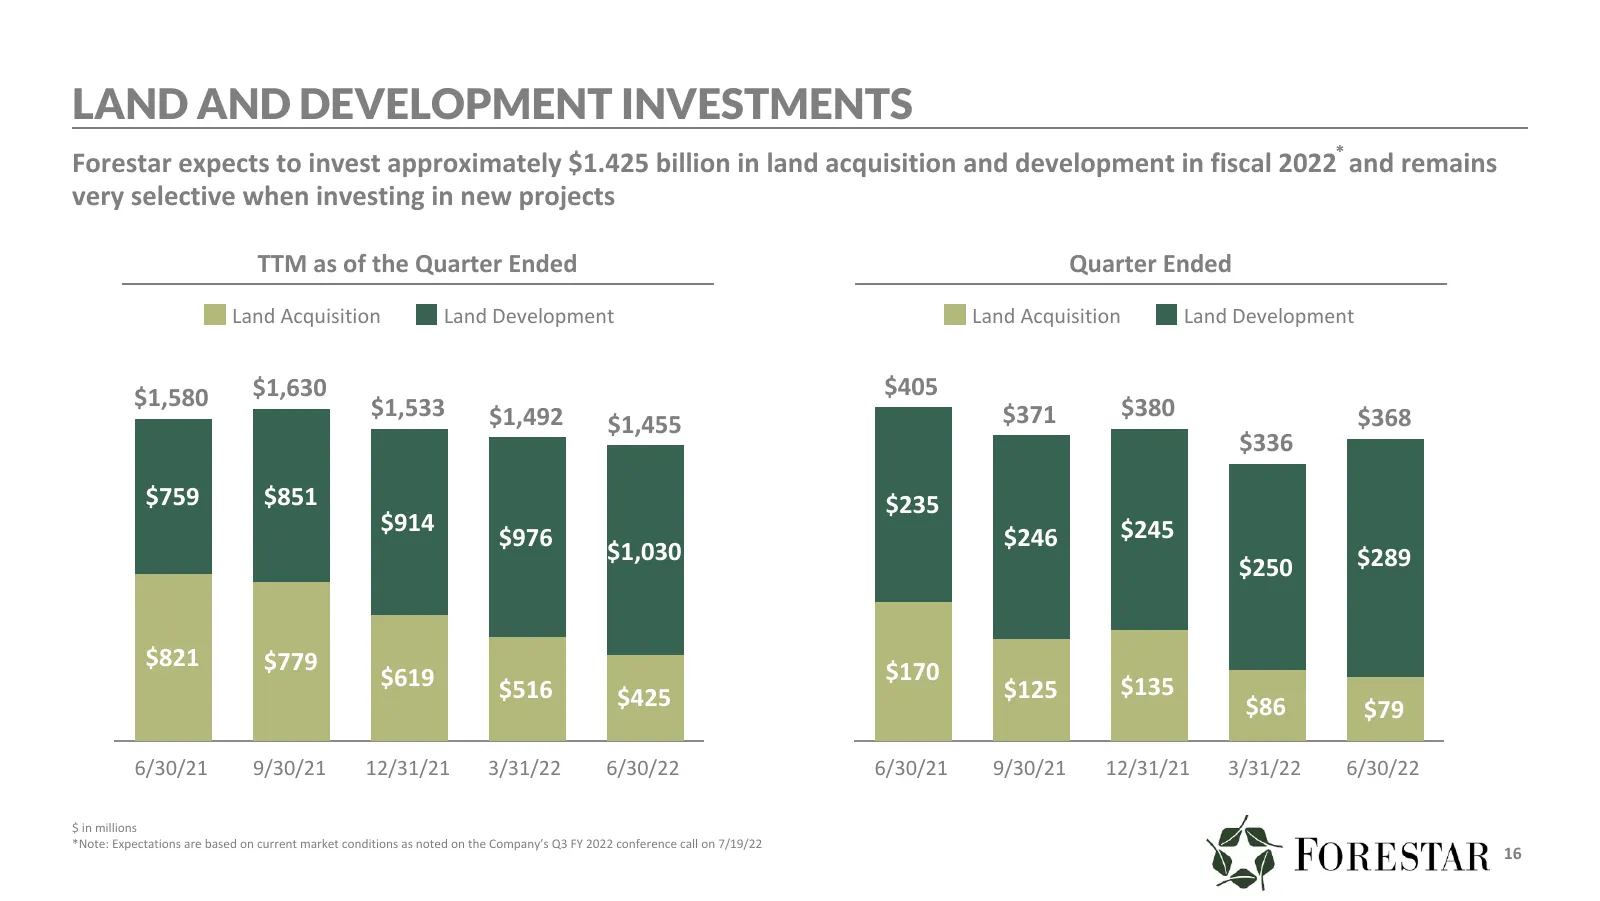
LAND AND DEVELOPMENT INVESTMENTS Forestar expects to invest approximately $1.425 billion in land acquisition and development in fiscal 2022* and remains very selective when investing in new projects TTM as of the Quarter Ended Quarter Ended Land Acquisition Land Development Land Acquisition Land Dev
Slide 17: Lot Position
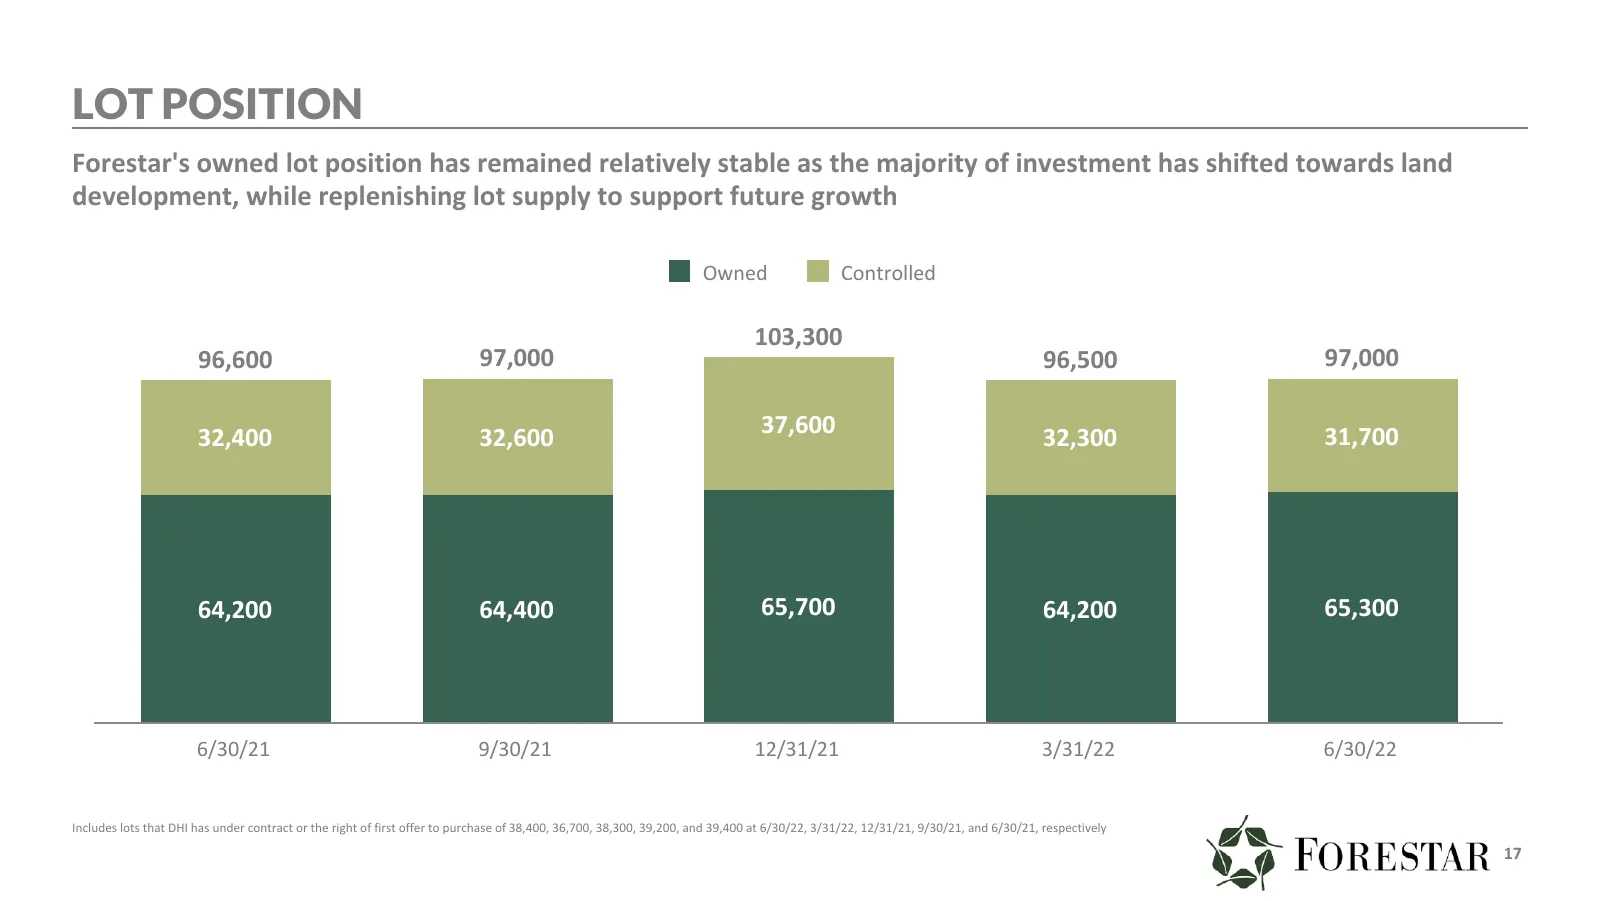
LOT POSITION Forestar's owned lot position has remained relatively stable as the majority of investment has shifted towards land development, while replenishing lot supply to support future growth Owned Controlled 103,300 96,600 97,000 96,500 97,000 32,400 32,600 37,600 32,300 31,700 64,200 64,400 6
Slide 18: Expanding Lot Sourcing Capabilities
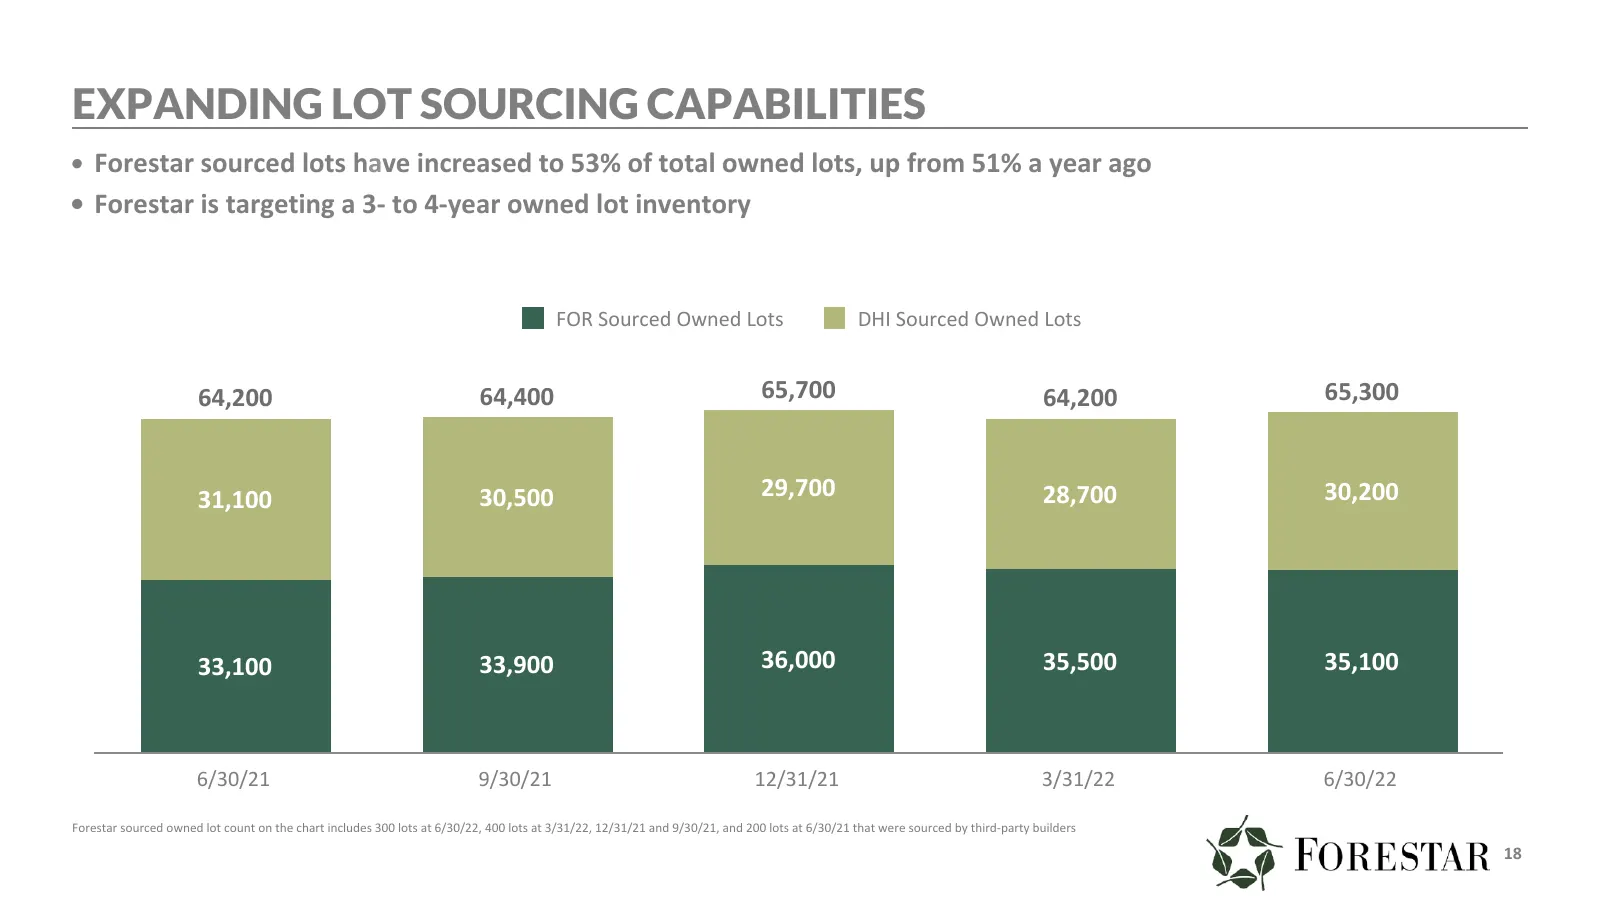
EXPANDING LOT SOURCING CAPABILITIES • Forestar sourced lots have increased to 53% of total owned lots, up from 51% a year ago • Forestar is targeting a 3- to 4-year owned lot inventory FOR Sourced Owned Lots DHI Sourced Owned Lots 64,200 64,400 65,700 64,200 65,300 31,100 30,500 29,700 28,700 30,200
Slide 19: Solid Balance Sheet and Liquidity Position
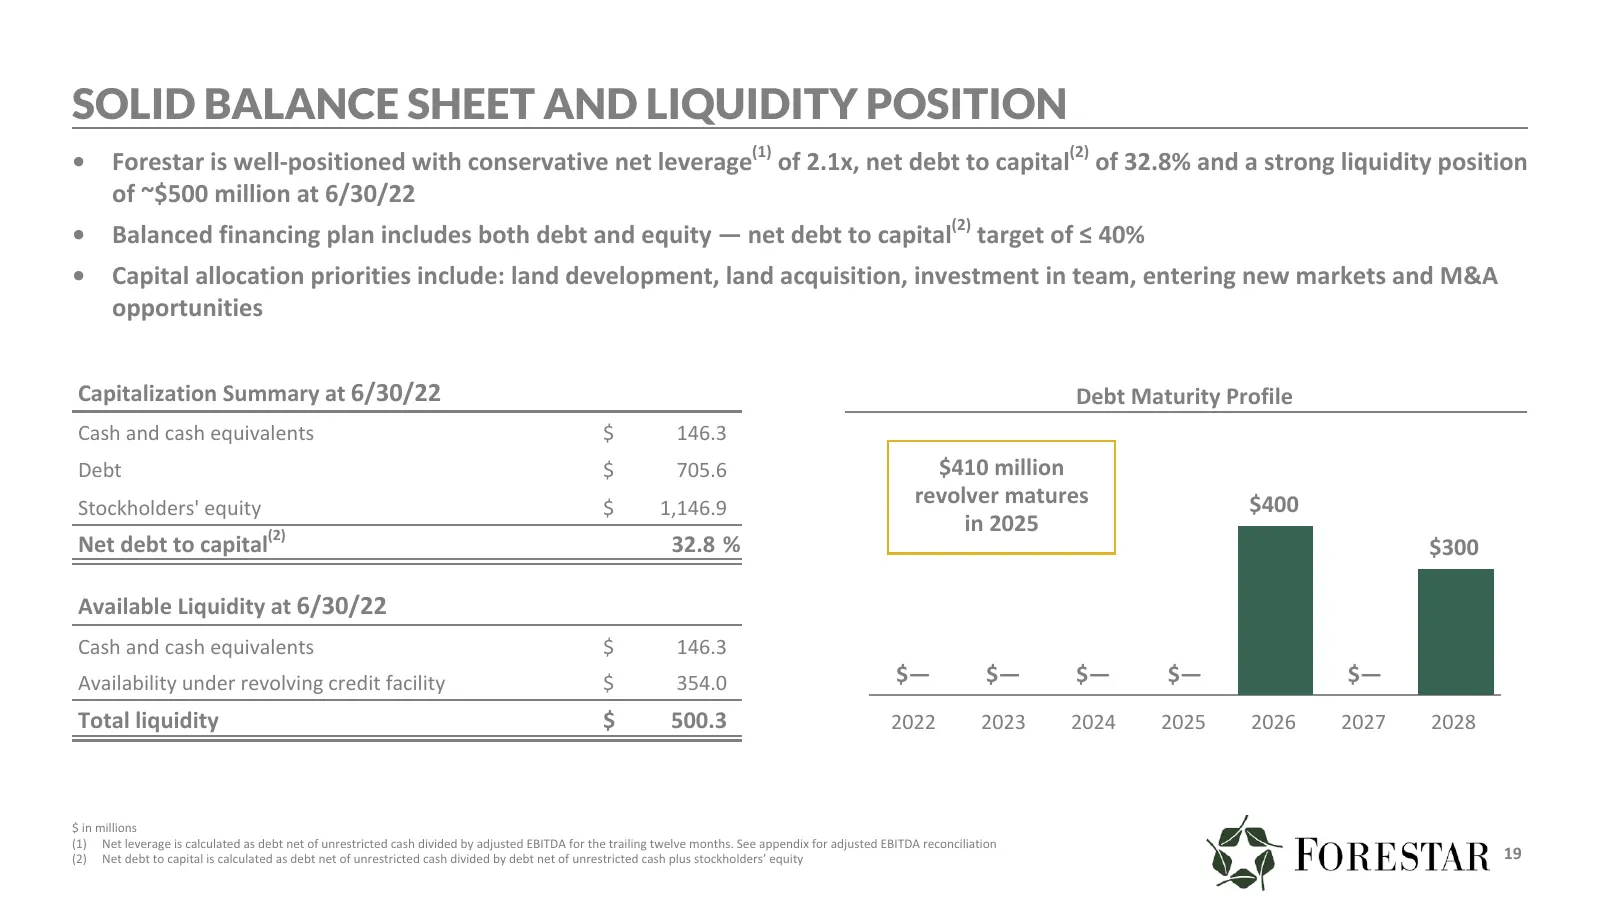
SOLID BALANCE SHEET AND LIQUIDITY POSITION • Forestar is well-positioned with conservative net leverage(1) of 2.1x, net debt to capital(2) of 32.8% and a strong liquidity position of ~$500 million at 6/30/22 • Balanced financing plan includes both debt and equity — net debt to capital(2) target of ≤
Slide 20: Committed Leadership with Decades of Experience
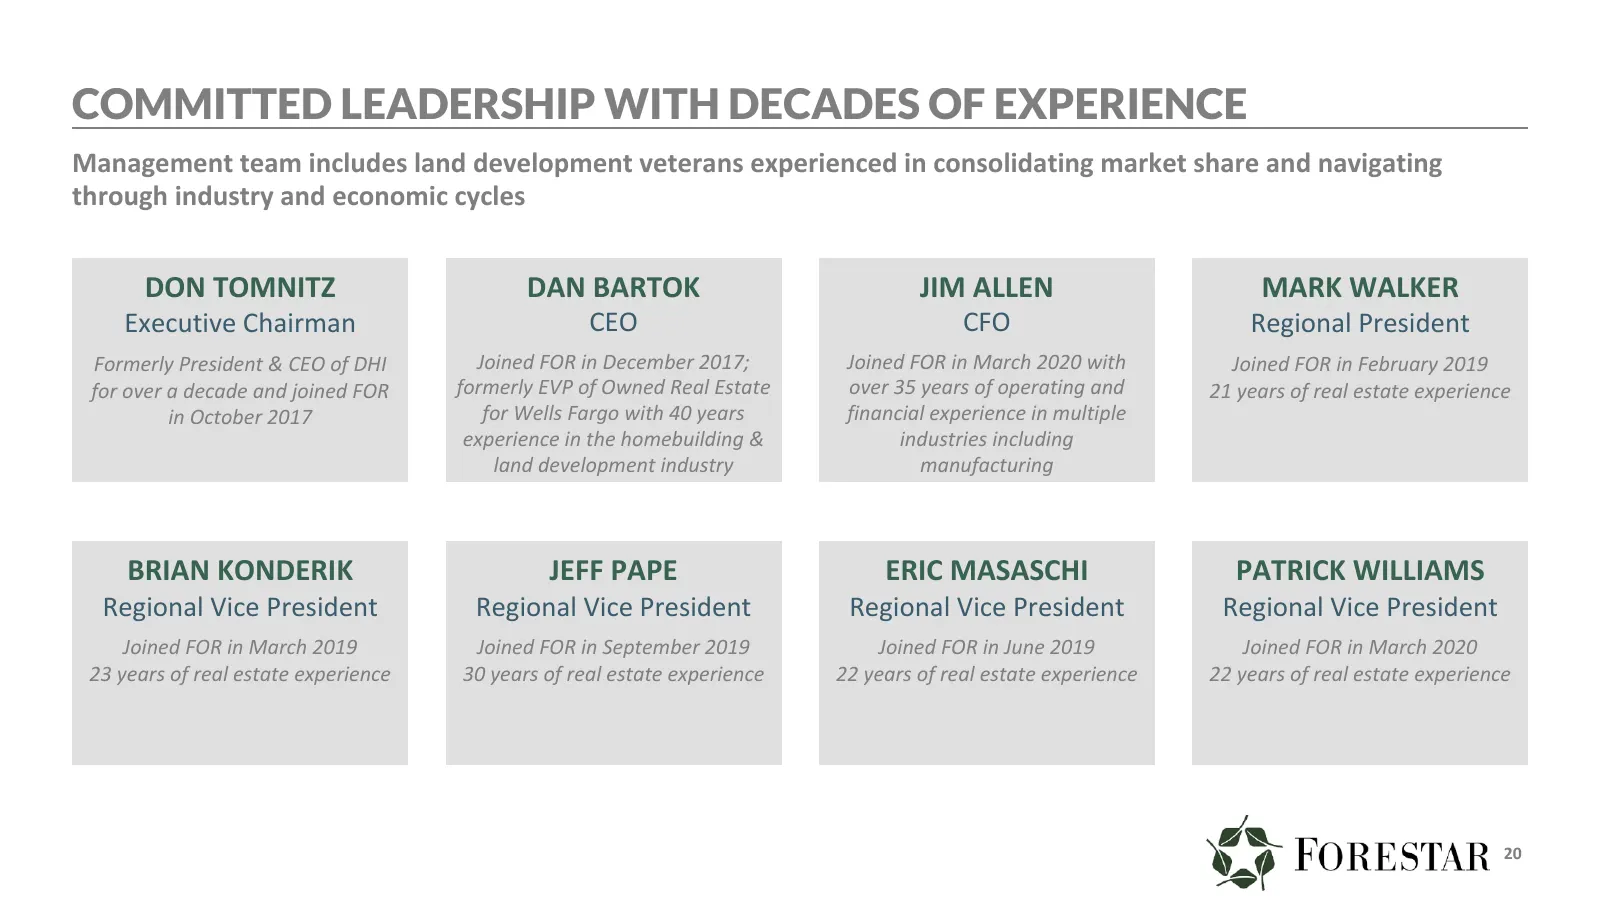
COMMITTED LEADERSHIP WITH DECADES OF EXPERIENCE Management team includes land development veterans experienced in consolidating market share and navigating through industry and economic cycles DON TOMNITZ DAN BARTOK JIM ALLEN MARK WALKER Executive Chairman CEO CFO Regional President Formerly Preside
Slide 21: Diversified National Footprint
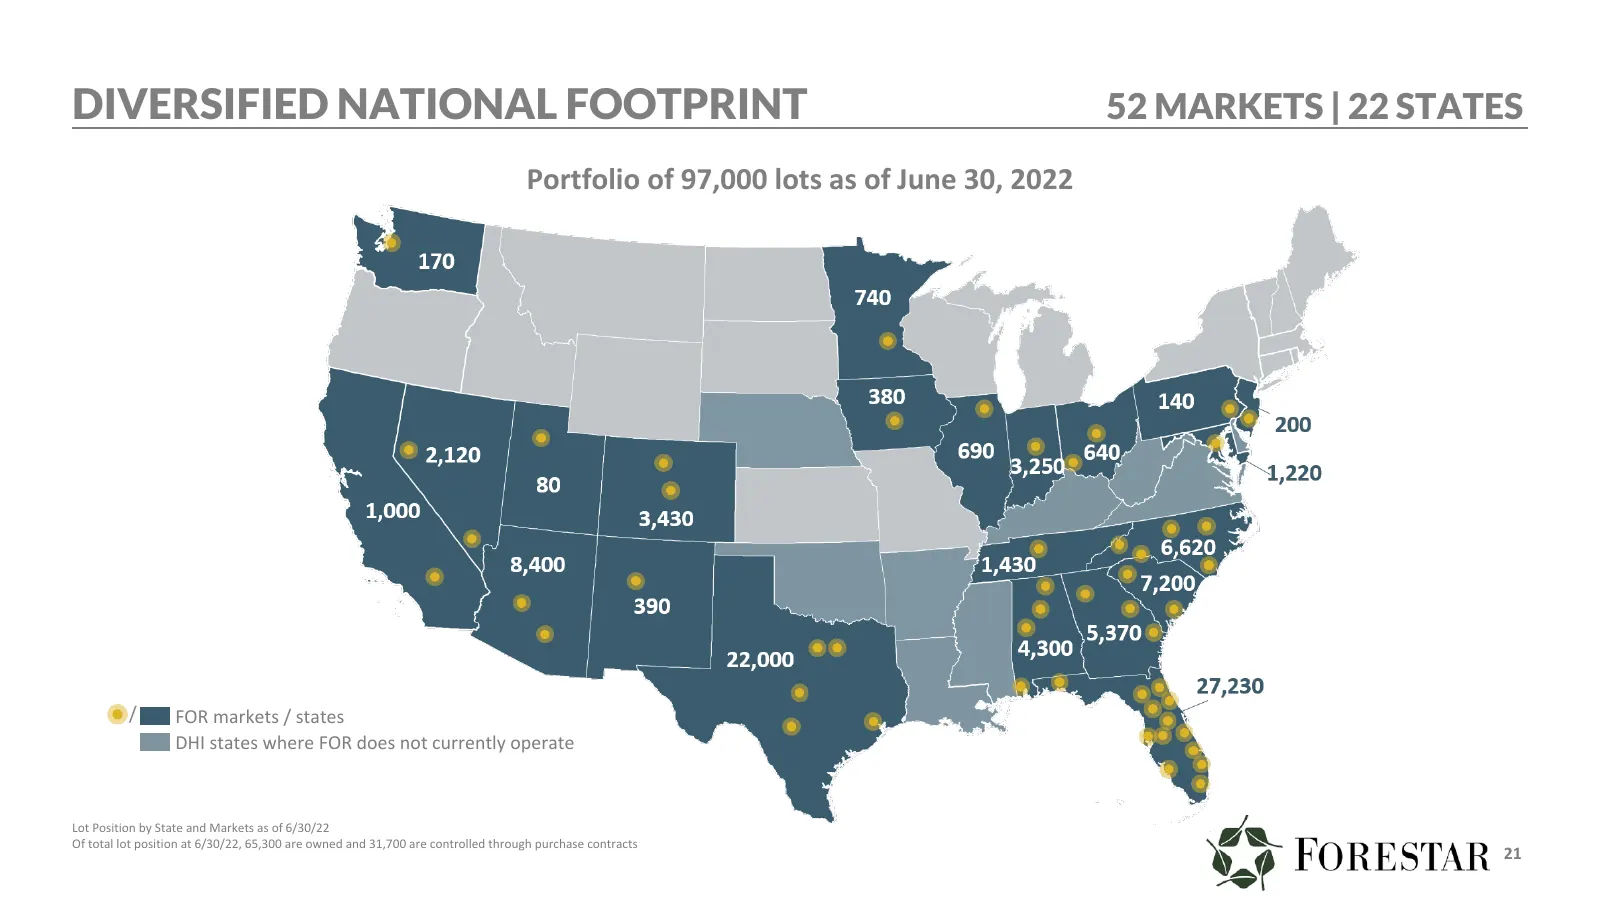
DIVERSIFIED NATIONAL FOOTPRINT 52 MARKETS | 22 STATES Portfolio of 97,000 lots as of June 30, 2022 / FOR markets / states DHI states where FOR does not currently operate Lot Position by State and Markets as of 6/30/22 Of total lot position at 6/30/22, 65,300 are owned and 31,700 are controlled throu
Slide 22: Appendix
APPENDIX bey FORESTAR
Slide 23: Business Overview
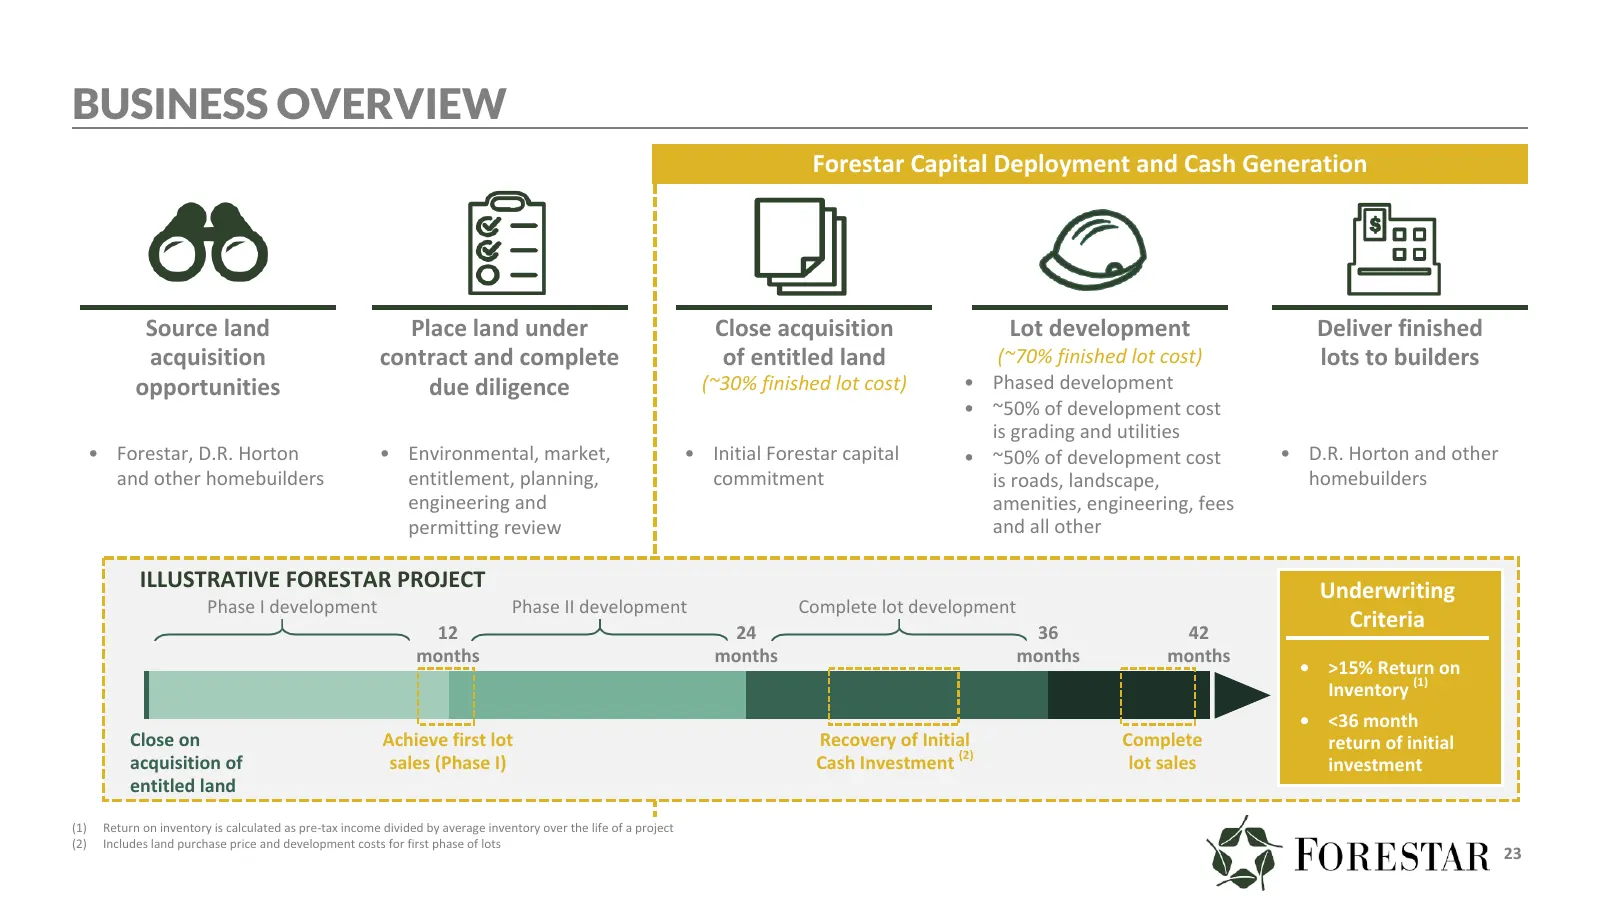
BUSINESS OVERVIEW Forestar Capital Deployment and Cash Generation Source land Place land under Close acquisition Lot development Deliver finished acquisition contract and complete of entitled land (~70% finished lot cost) lots to builders opportunities due diligence (~30% finished lot cost) • Phased
Slide 24: Uniquely Positioned to Provide Finished Lots
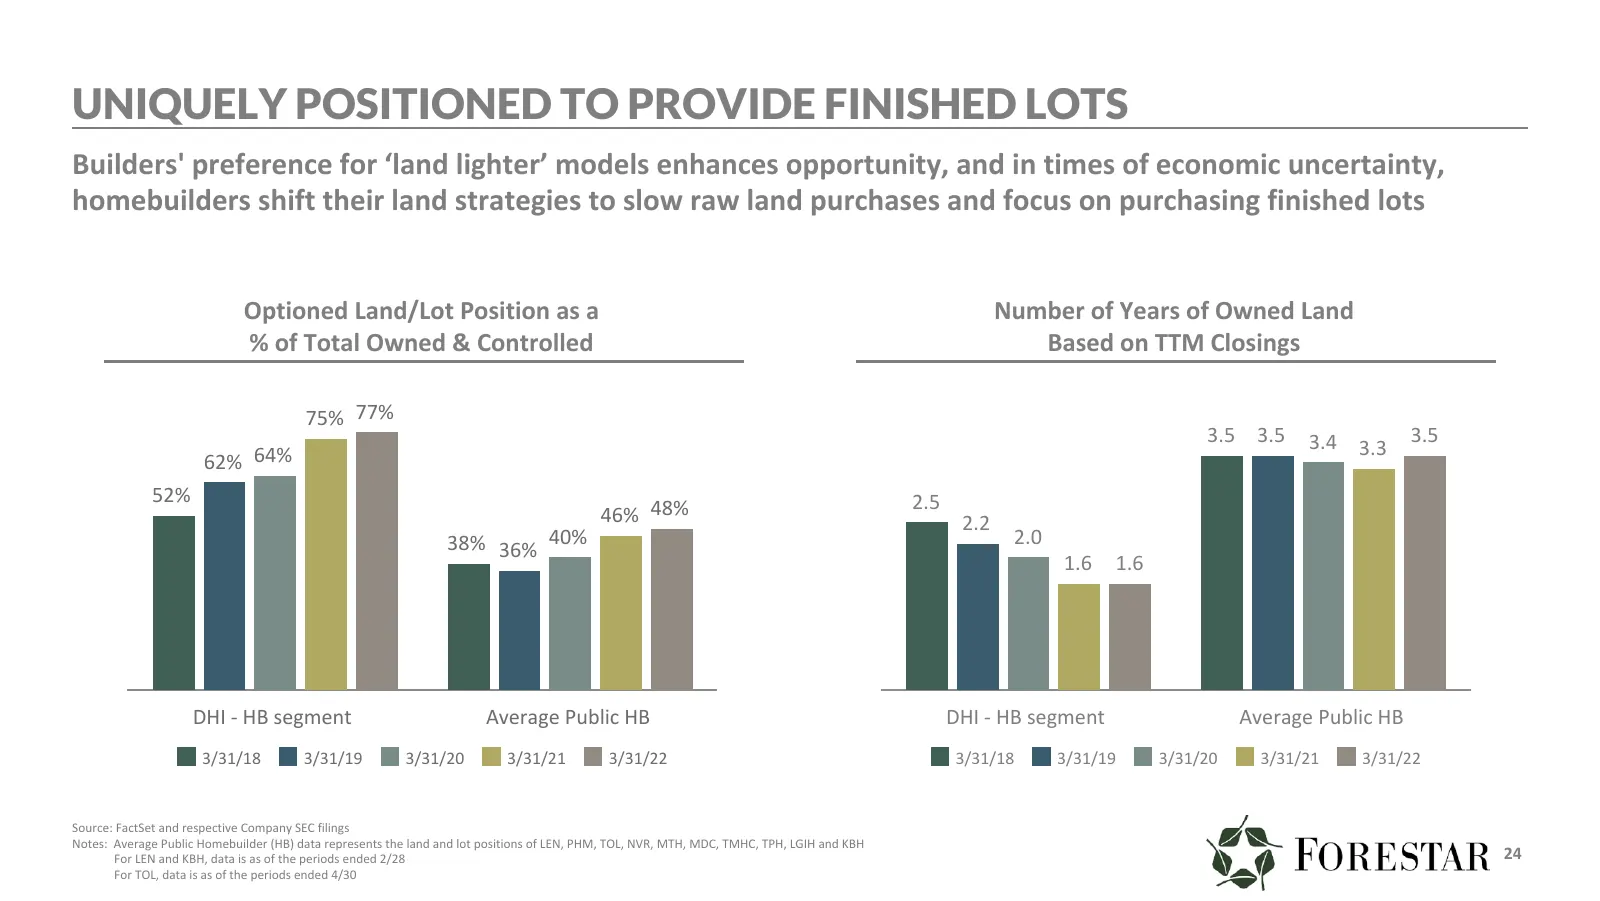
UNIQUELY POSITIONED TO PROVIDE FINISHED LOTS Builders' preference for ‘land lighter’ models enhances opportunity, and in times of economic uncertainty, homebuilders shift their land strategies to slow raw land purchases and focus on purchasing finished lots Optioned Land/Lot Position as a Number of
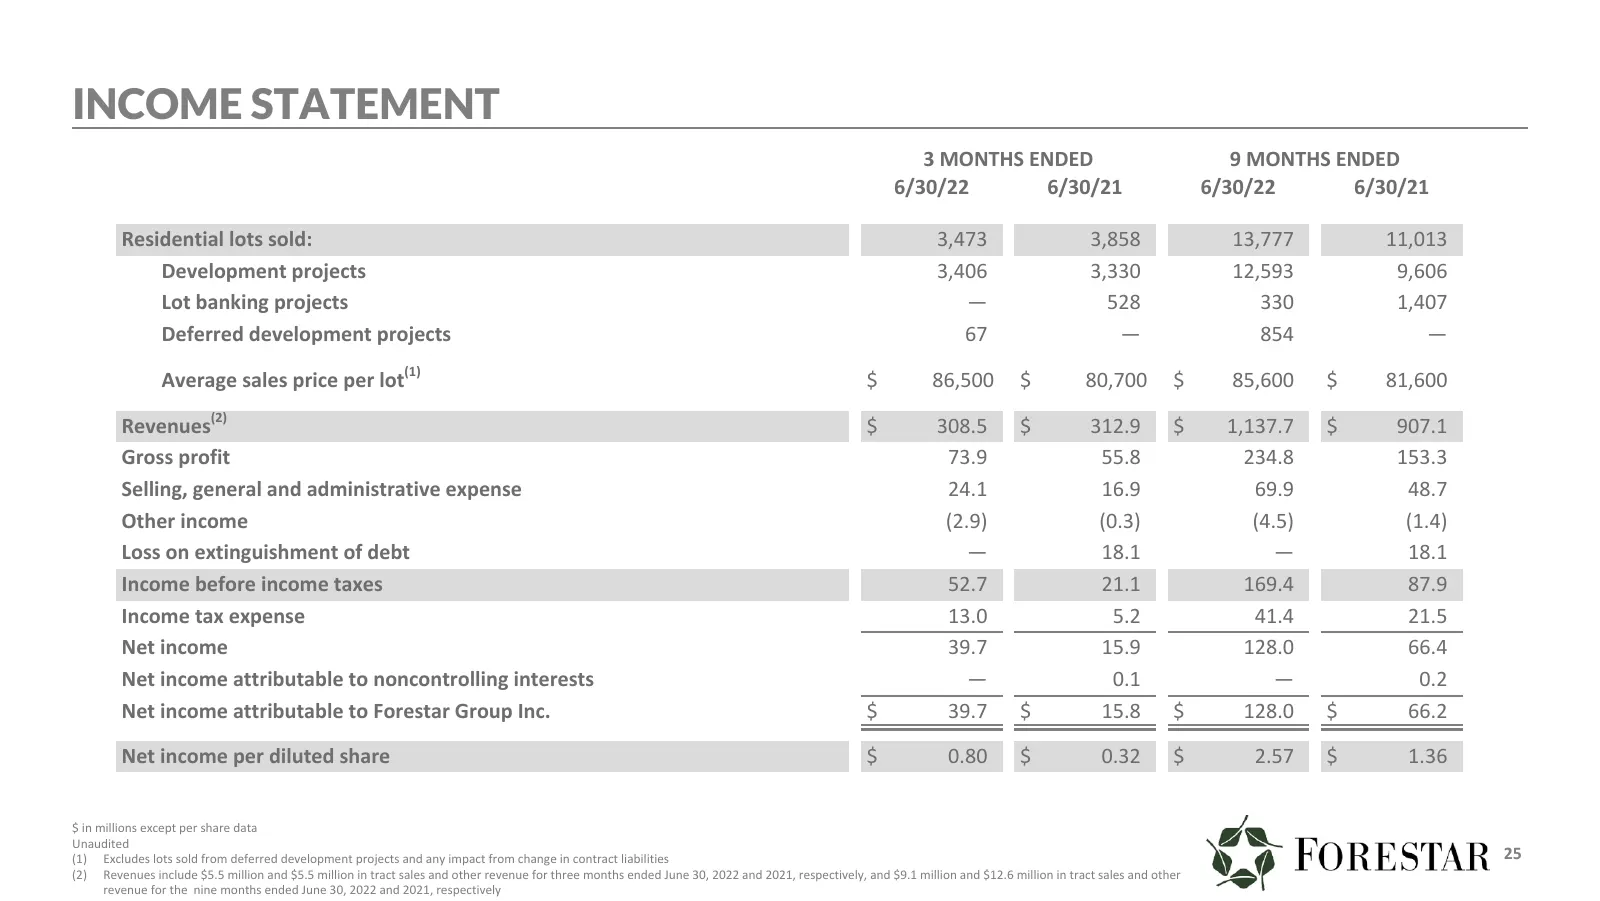
Slide 25: Income Statement
INCOME STATEMENT 3 MONTHS ENDED 9 MONTHS ENDED 6/30/22 6/30/21 6/30/22 6/30/21 Residential lots sold: 3,473 3,858 13,777 11,013 Development projects 3,406 3,330 12,593 9,606 Lot banking projects — 528 330 1,407 Deferred development projects 67 — 854 — Average sales price per lot(1) $ 86,500 $ 80,700
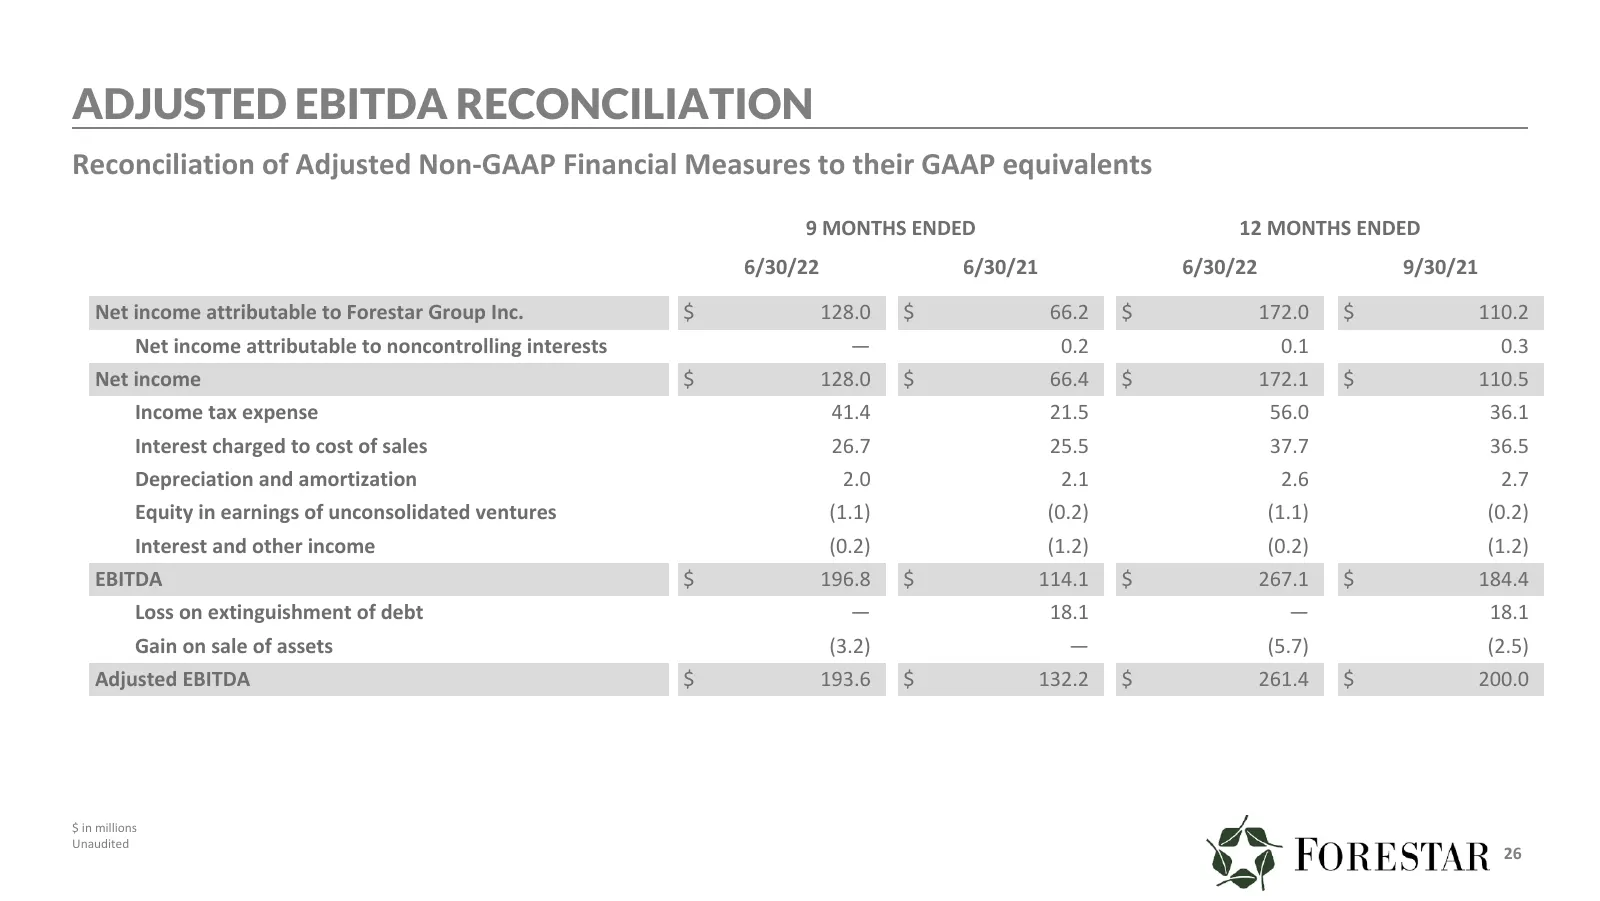
Slide 26: Adjusted EBITDA Reconciliation
ADJUSTED EBITDA RECONCILIATION Reconciliation of Adjusted Non-GAAP Financial Measures to their GAAP equivalents 9 MONTHS ENDED 12 MONTHS ENDED 6/30/22 6/30/21 6/30/22 9/30/21 Net income attributable to Forestar Group Inc. $ 128.0 $ 66.2 $ 172.0 $ 110.2 Net income attributable to noncontrolling inter
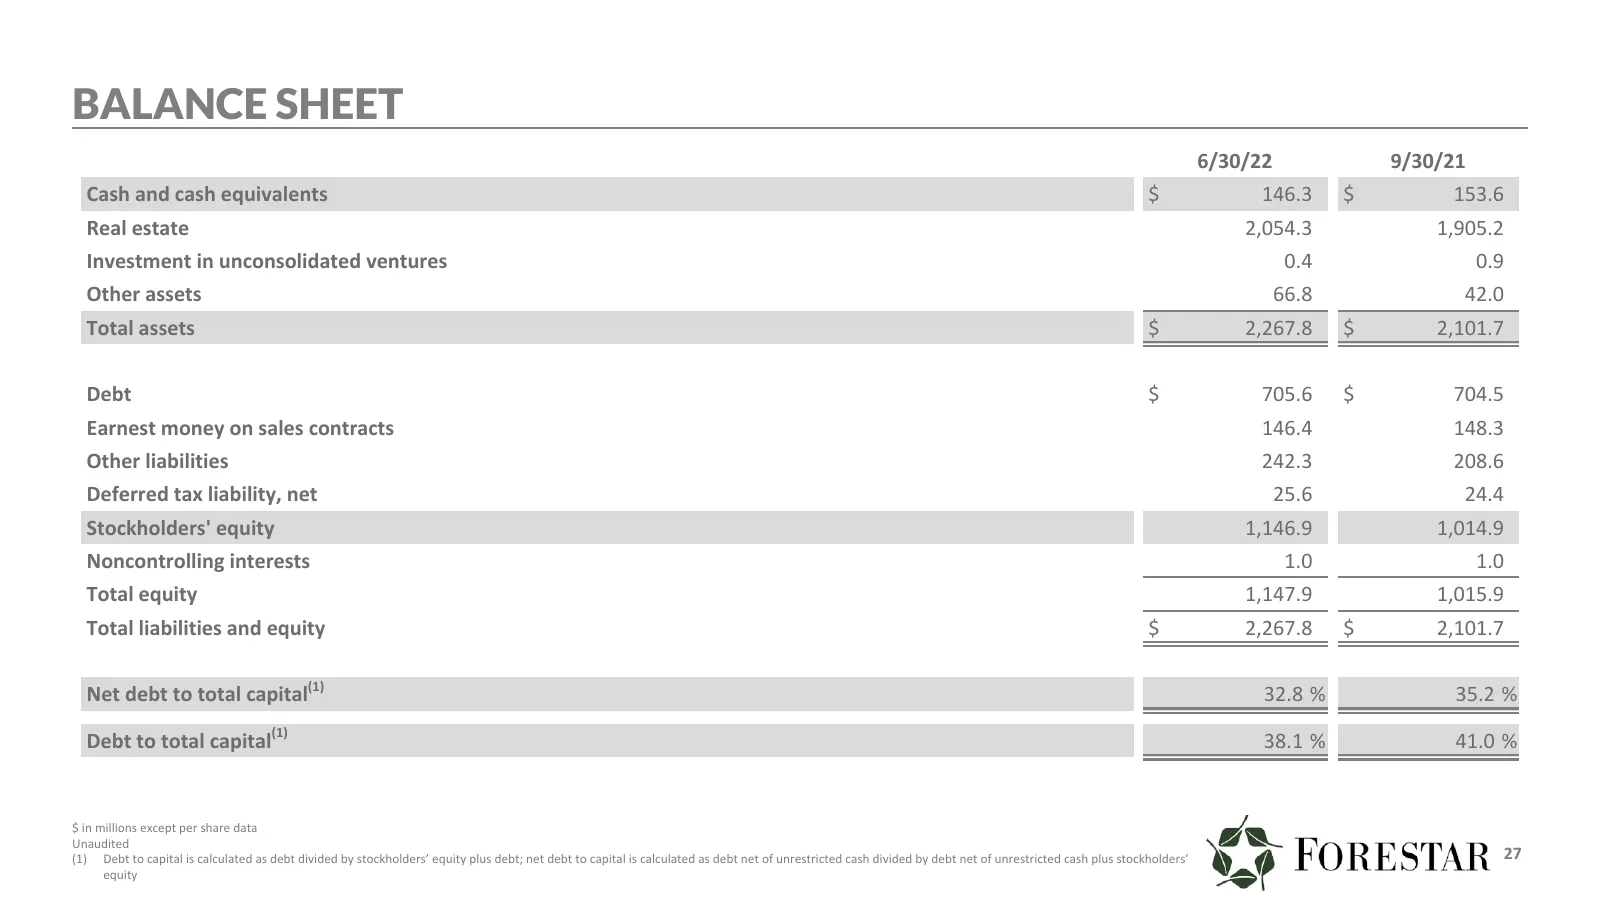
Slide 27: Balance Sheet
BALANCE SHEET 6/30/22 9/30/21 Cash and cash equivalents $ 146.3 $ 153.6 Real estate 2,054.3 1,905.2 Investment in unconsolidated ventures 0.4 0.9 Other assets 66.8 42.0 Total assets $ 2,267.8 $ 2,101.7 Debt $ 705.6 $ 704.5 Earnest money on sales contracts 146.4 148.3 Other liabilities 242.3 208.6 De
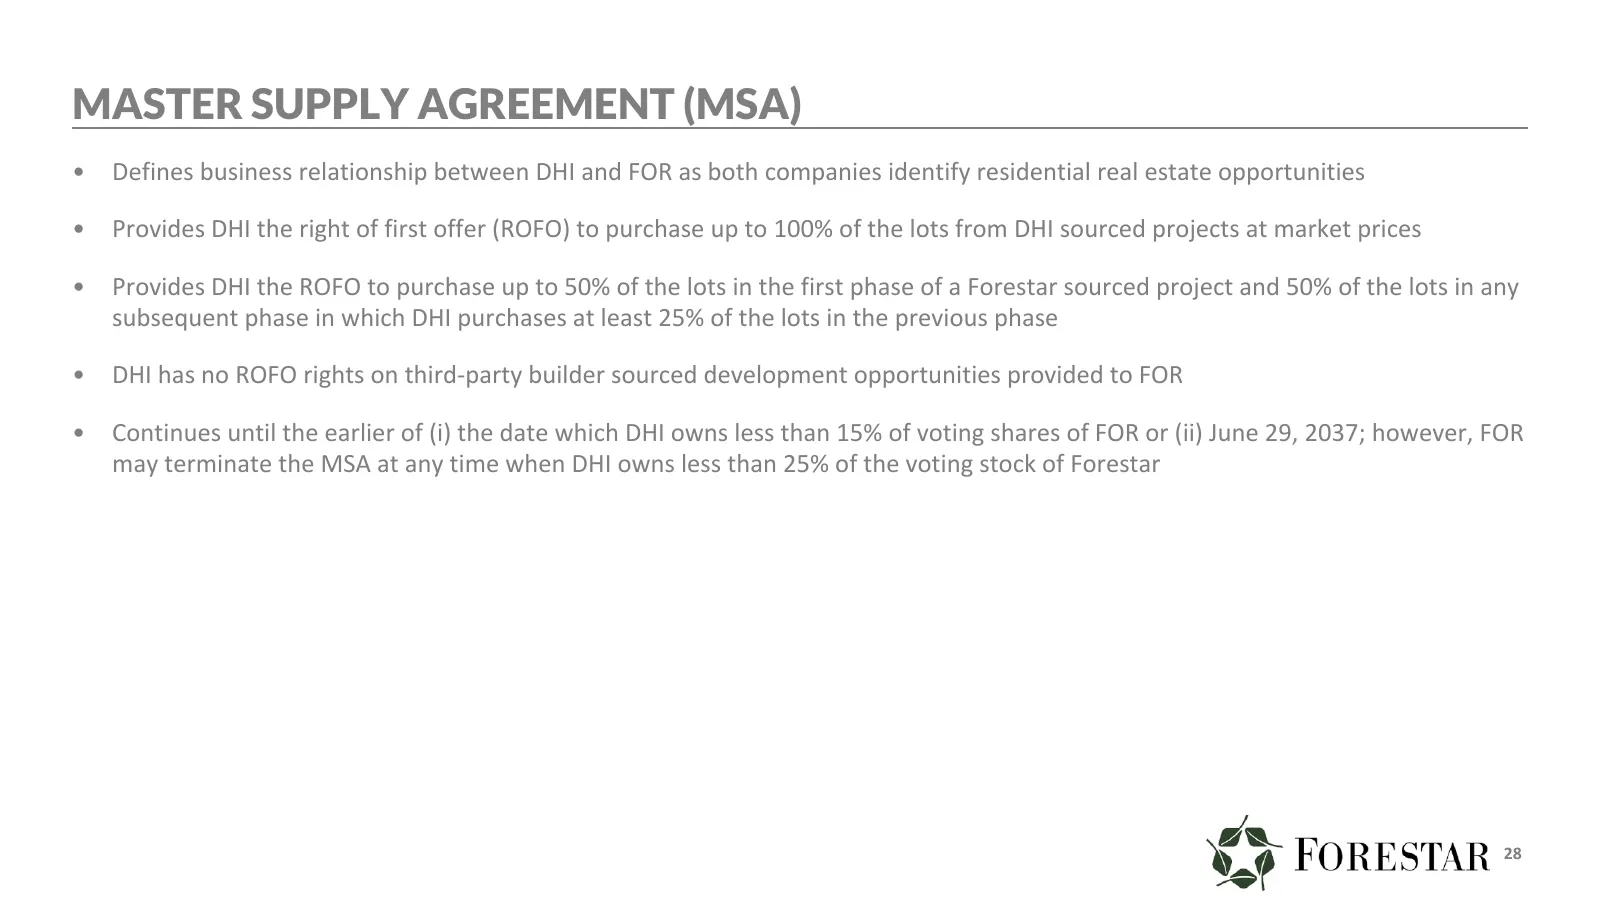
Slide 28: Master Supply Agreement (MSA)
MASTER SUPPLY AGREEMENT (MSA) • Defines business relationship between DHI and FOR as both companies identify residential real estate opportunities • Provides DHI the right of first offer (ROFO) to purchase up to 100% of the lots from DHI sourced projects at market prices • Provides DHI the ROFO to p
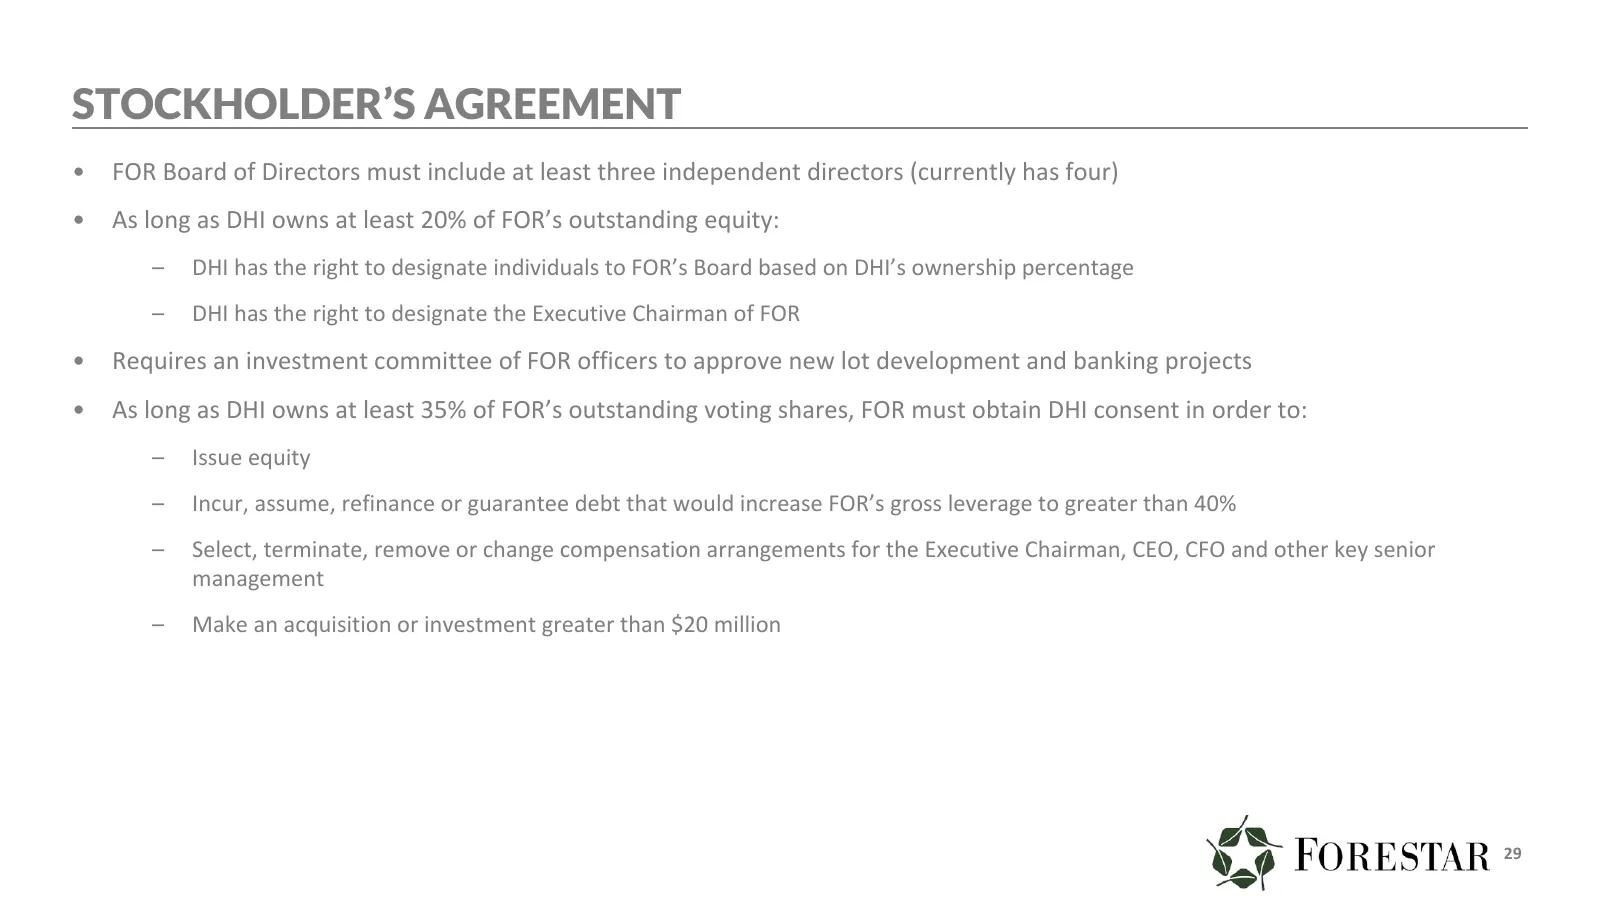
Slide 29: Stockholder's Agreement
STOCKHOLDER’S AGREEMENT • FOR Board of Directors must include at least three independent directors (currently has four) • As long as DHI owns at least 20% of FOR’s outstanding equity: – DHI has the right to designate individuals to FOR’s Board based on DHI’s ownership percentage – DHI has the right
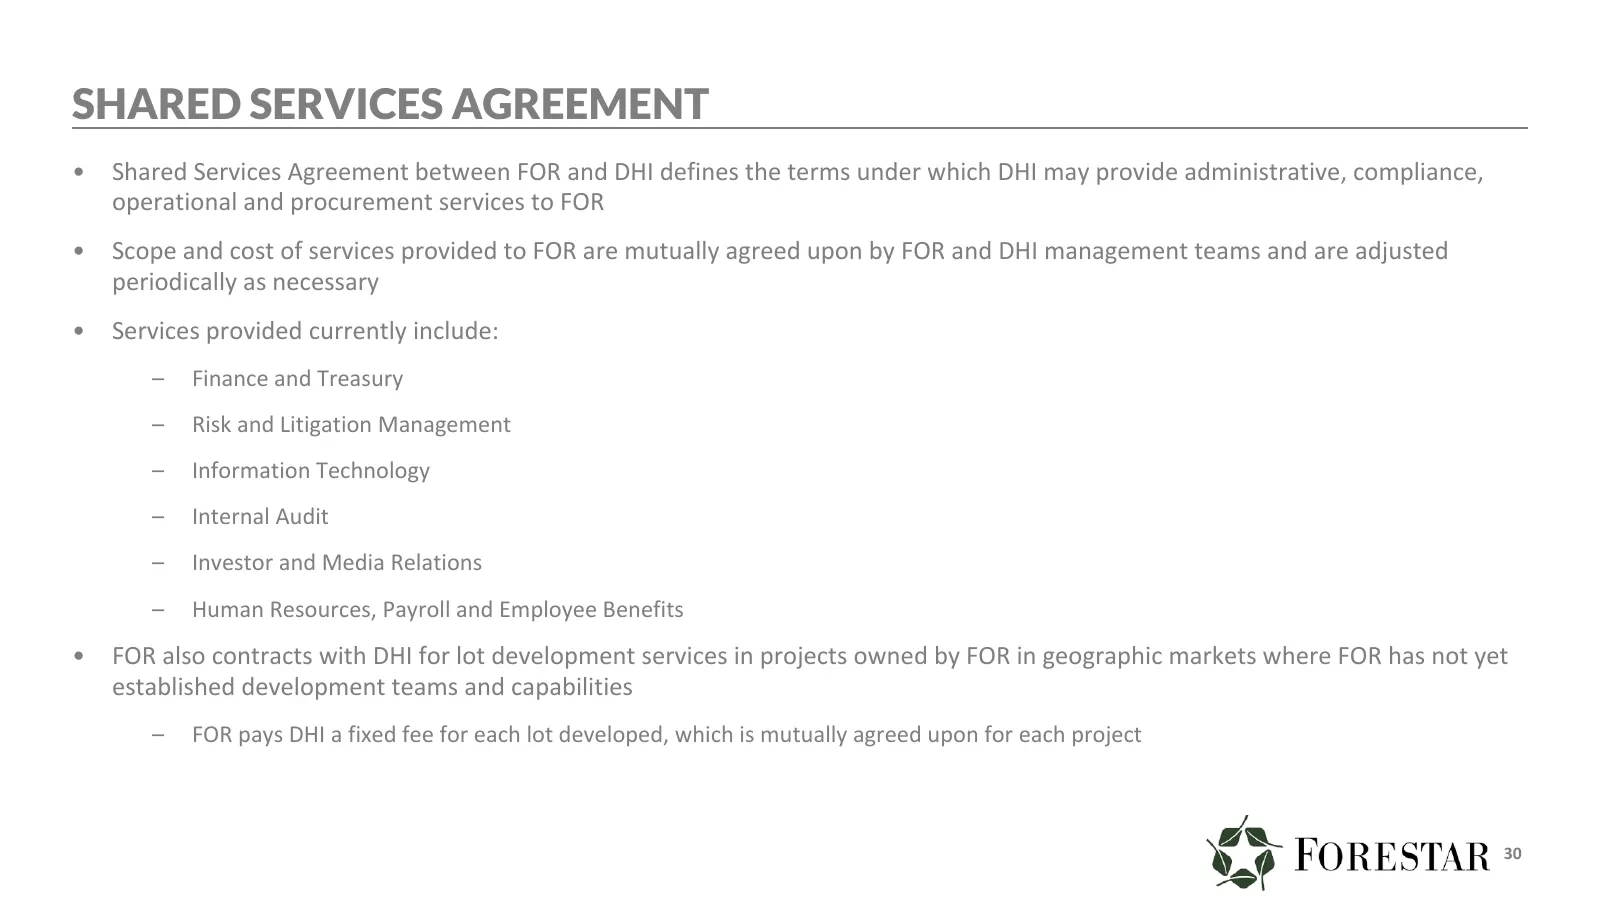
Slide 30: Shared Services Agreement
SHARED SERVICES AGREEMENT • Shared Services Agreement between FOR and DHI defines the terms under which DHI may provide administrative, compliance, operational and procurement services to FOR • Scope and cost of services provided to FOR are mutually agreed upon by FOR and DHI management teams and ar
Source: Internet Archive copy of investor.forestar.com
More decks from Forestar Group Inc
 Q4 2026 Earnings Presentation31 slides · October 2026
 Q3 2026 Earnings Presentation30 slides · Jul 21, 2026
 Q2 2026 Earnings Presentation30 slides · Apr 21, 2026
 Q1 2026 Earnings Presentation30 slides · Jan 20, 2026
 Q4 2025 Earnings Presentation31 slides · Oct 28, 2025
 Q3 2025 Earnings Presentation29 slides · Jul 22, 2025