ACS, Actividades de Construccion y Servicios SA · BME:ACS
ACS, Actividades de Construccion y Servicios SA — 9M 2026 Earnings Presentation
32 slides from ACS, Actividades de Construccion y Servicios SA's earnings presentation, Nov 12, 2026
Slide 1: 9M 2026 Results Presentation
9M 2026 RESULTS PRESENTATION November 12th, 2026
Slide 2: 9M 2026 Overview
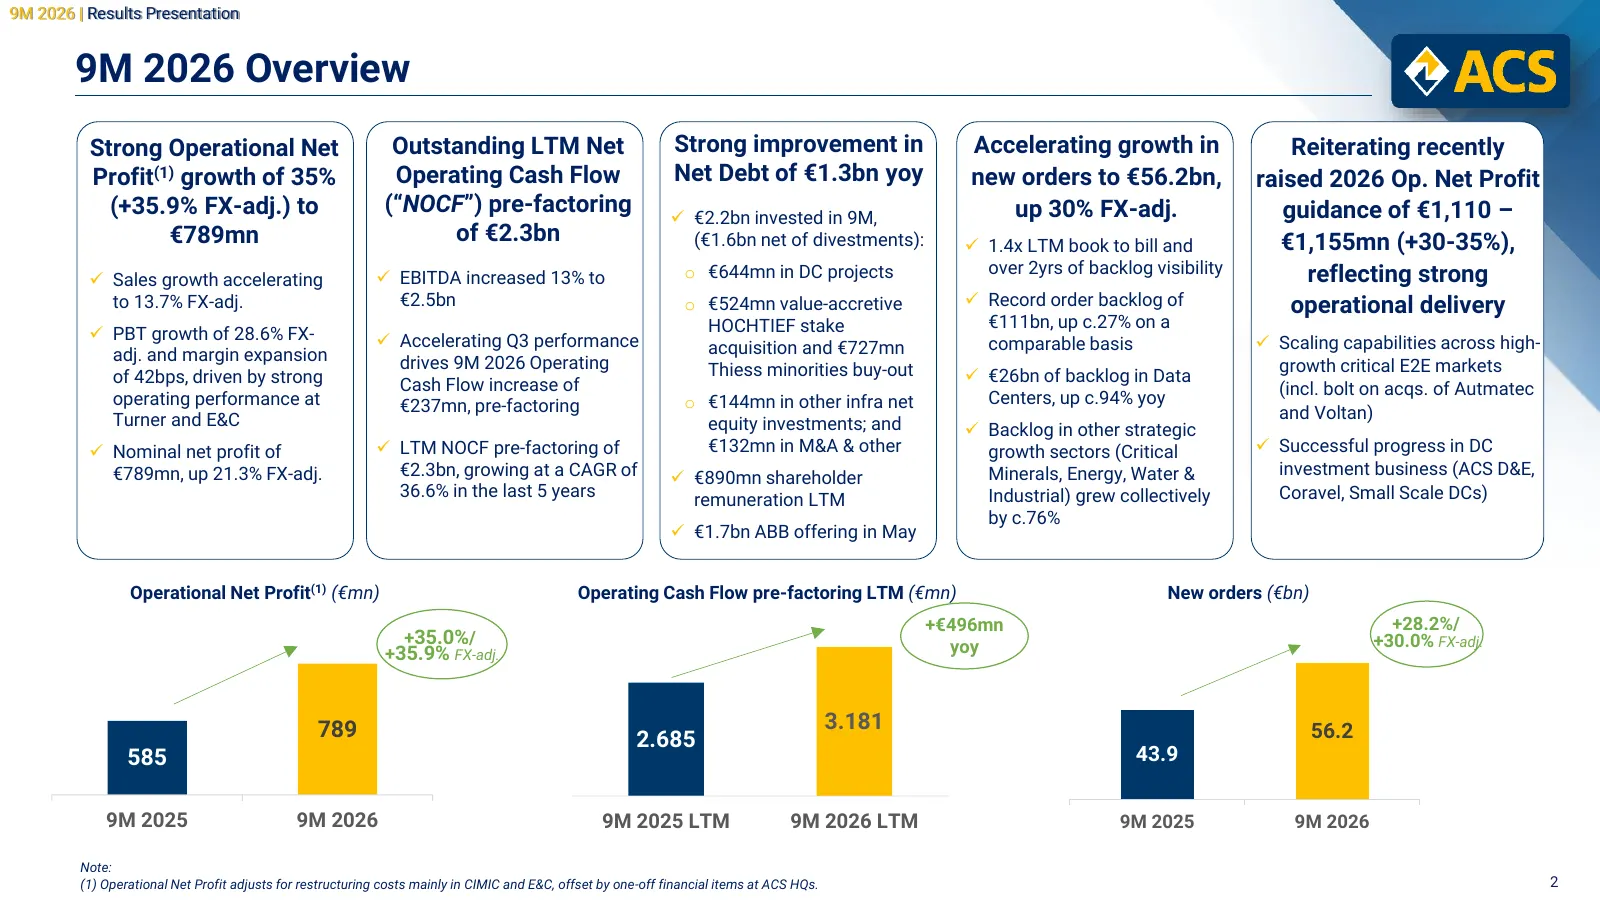
9M 2026 | Results Presentation 9M 2026 Overview Strong Operational Net Outstanding LTM Net Strong improvement in Accelerating growth in Reiterating recently Profit(1) growth of 35% Operating Cash Flow Net Debt of €1.3bn yoy new orders to €56.2bn, raised 2026 Op. Net Profit (+35.9% FX-adj.) to (“NOCF
Slide 3: P&L and operating KPIs
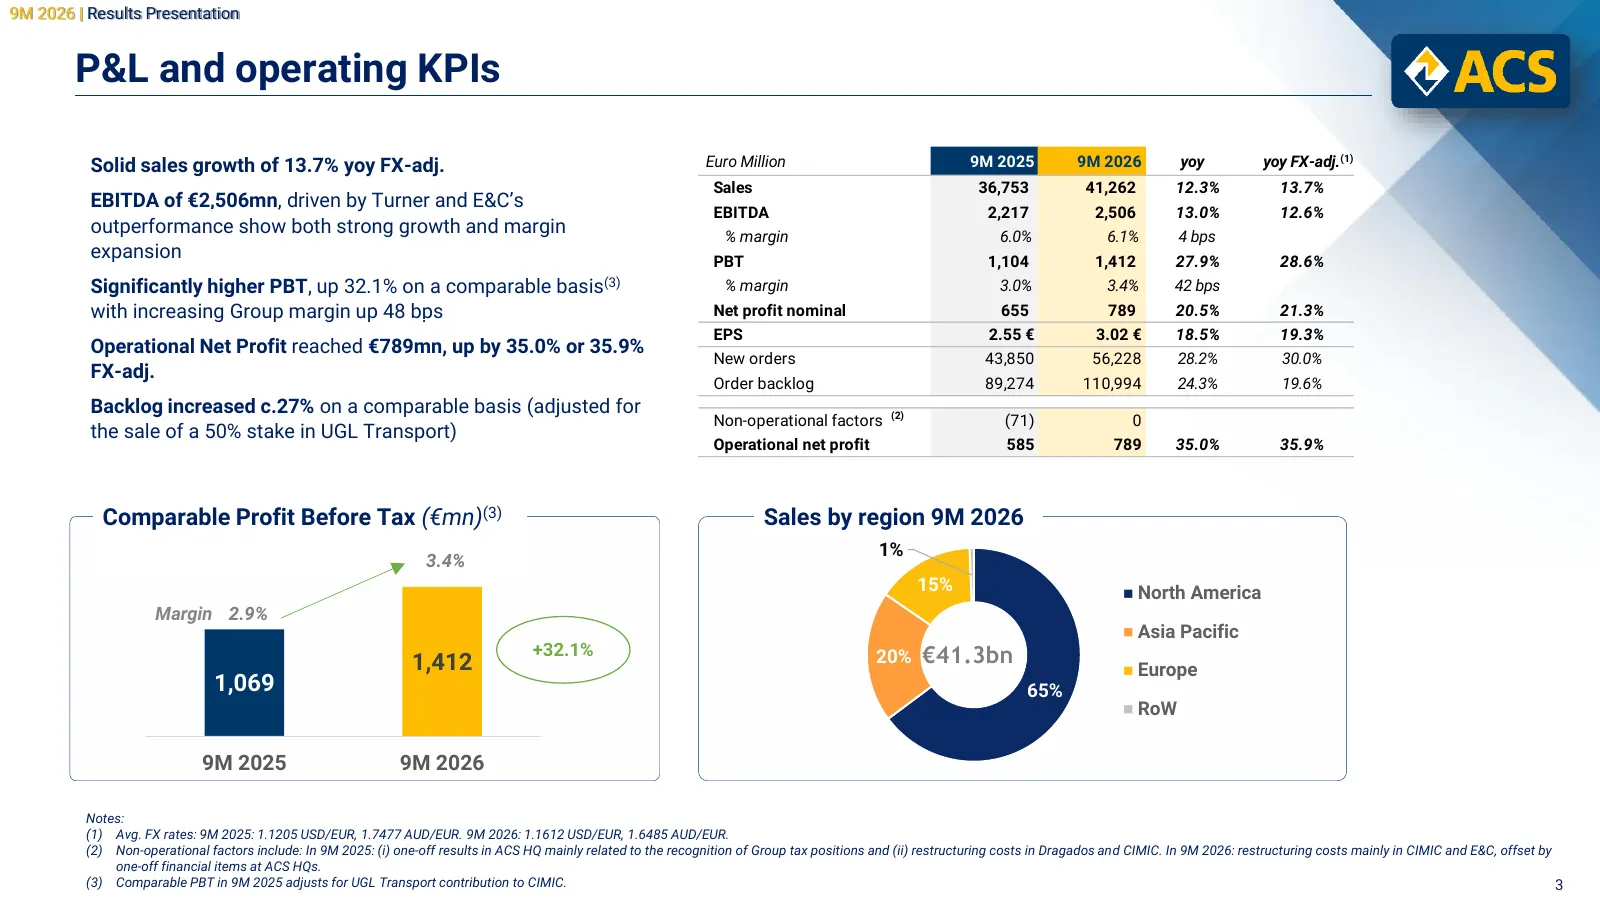
9M 2026 | Results Presentation P&L and operating KPIs Solid sales growth of 13.7% yoy FX-adj. Euro Million 9M 2025 9M 2026 yoy yoy FX-adj.(1) Sales 36,753 41,262 12.3% 13.7% EBITDA of €2,506mn, driven by Turner and E&C’s EBITDA 2,217 2,506 13.0% 12.6% outperformance show both strong growth and margi
Slide 4: Operational Attributable Net Profit breakdown
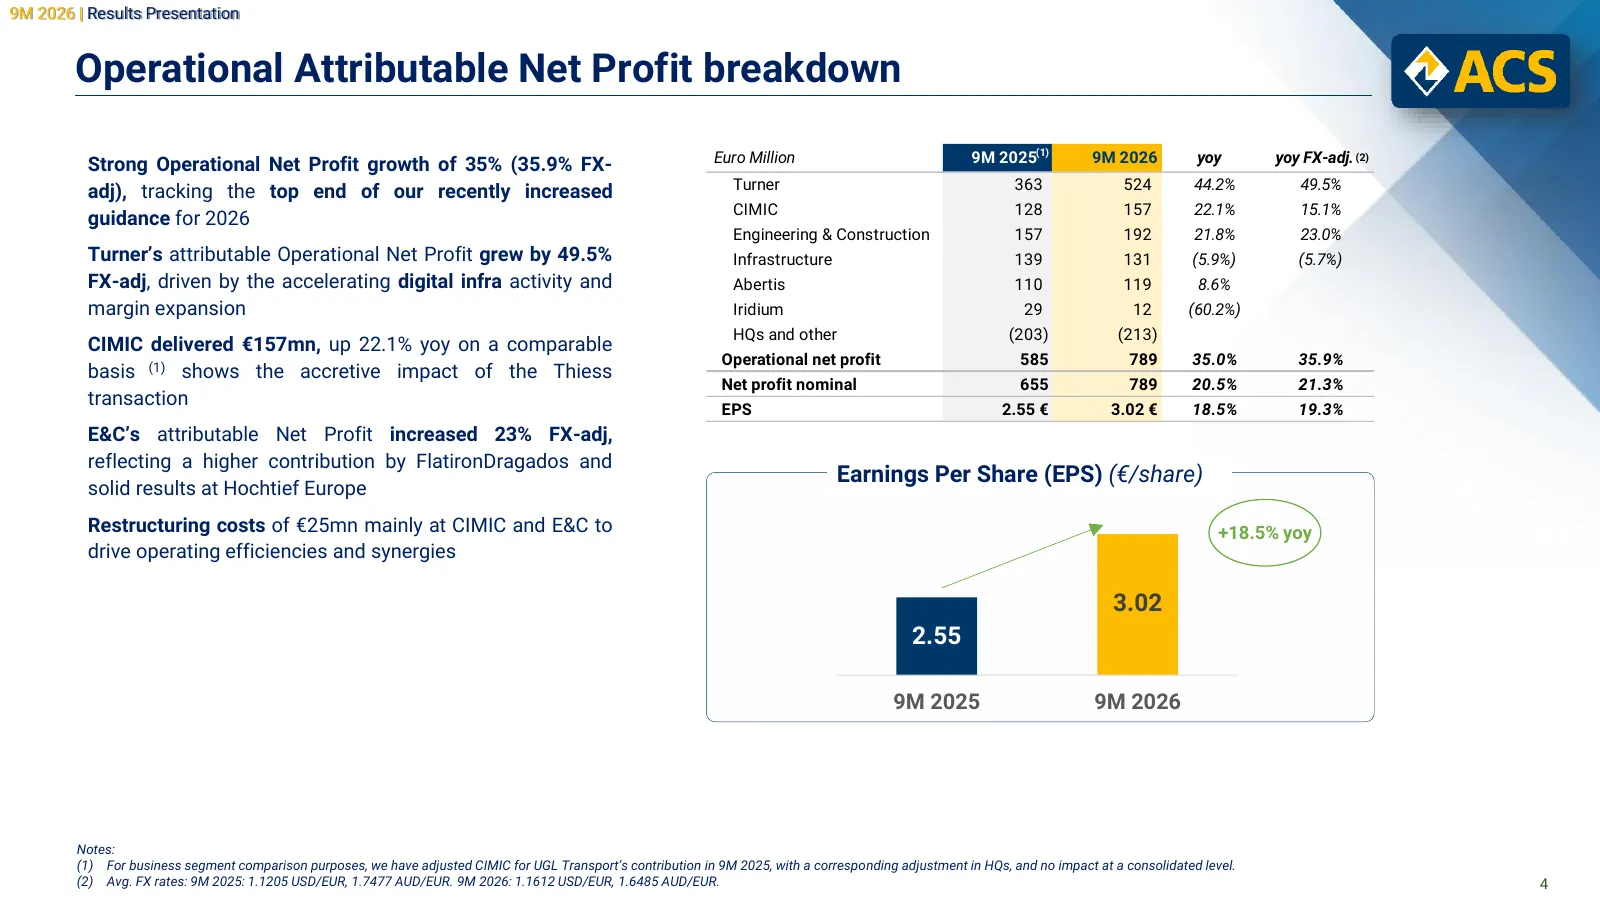
9M 2026 | Results Presentation Operational Attributable Net Profit breakdown Strong Operational Net Profit growth of 35% (35.9% FX- Euro Million 9M 2025(1) 9M 2026 yoy yoy FX-adj. (2) adj), tracking the top end of our recently increased Turner 363 524 44.2% 49.5% CIMIC 128 157 22.1% 15.1% guidance f
Slide 5: Cash flow performance
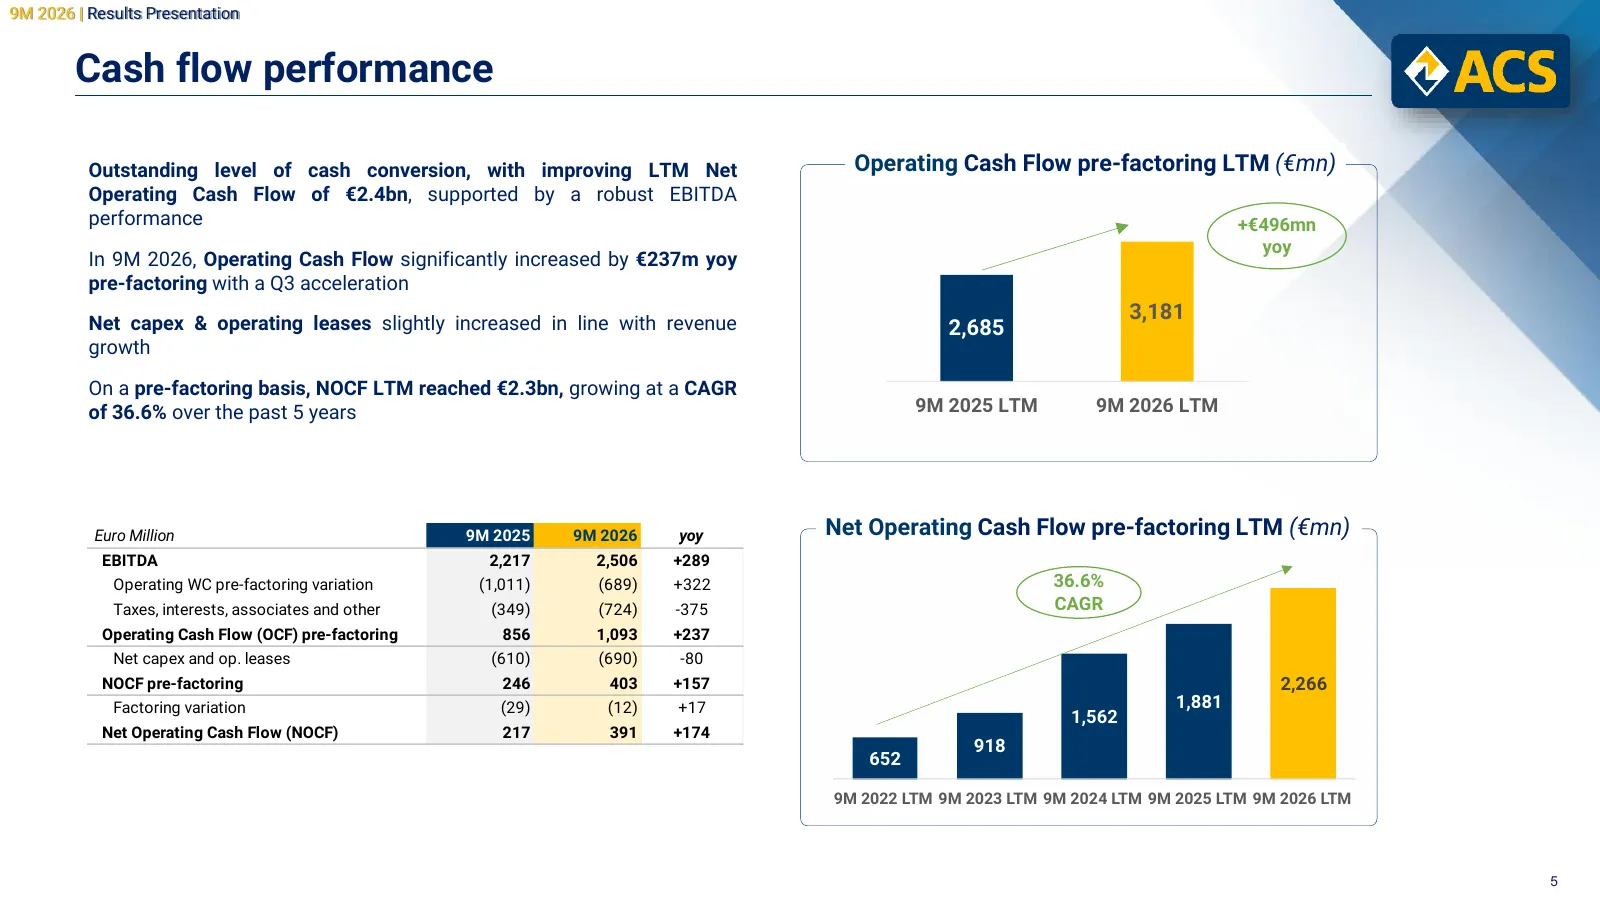
9M 2026 | Results Presentation Cash flow performance Outstanding level of cash conversion, with improving LTM Net Operating Cash Flow pre-factoring LTM (€mn) Operating Cash Flow of €2.4bn, supported by a robust EBITDA performance +€496mn 3,100 yoy In 9M 2026, Operating Cash Flow significantly increa
Slide 6: Financial position
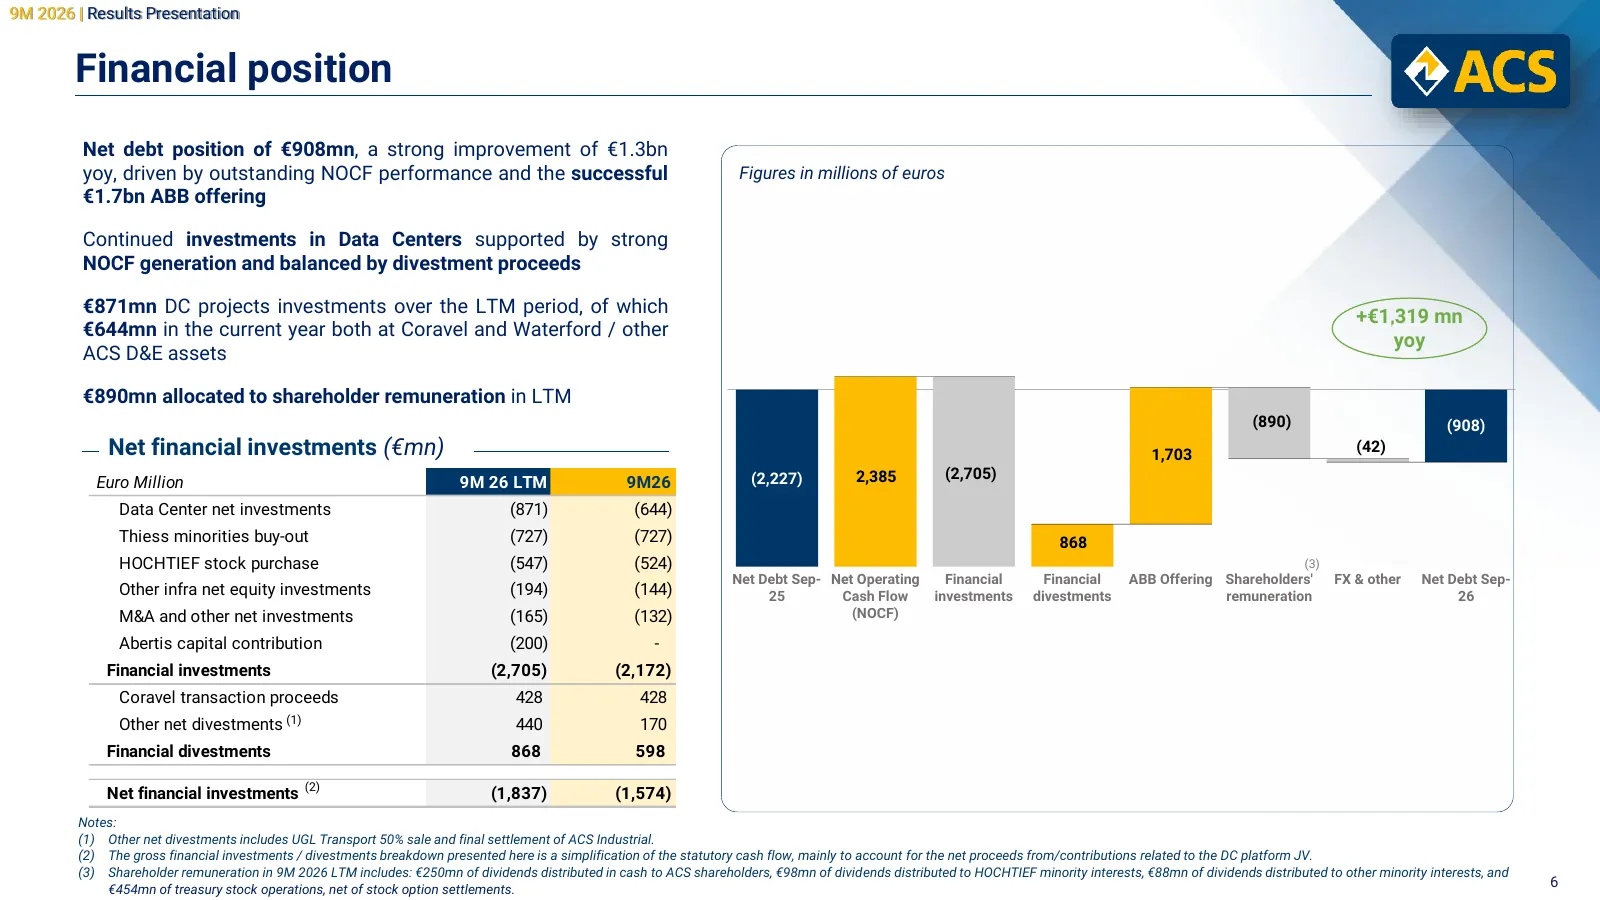
9M 2026 | Results Presentation Financial position Net debt position of €908mn, a strong improvement of €1.3bn yoy, driven by outstanding NOCF performance and the successful Figures in millions of euros €1.7bn ABB offering Continued investments in Data Centers supported by strong NOCF generation and
Slide 7: New orders and order backlog
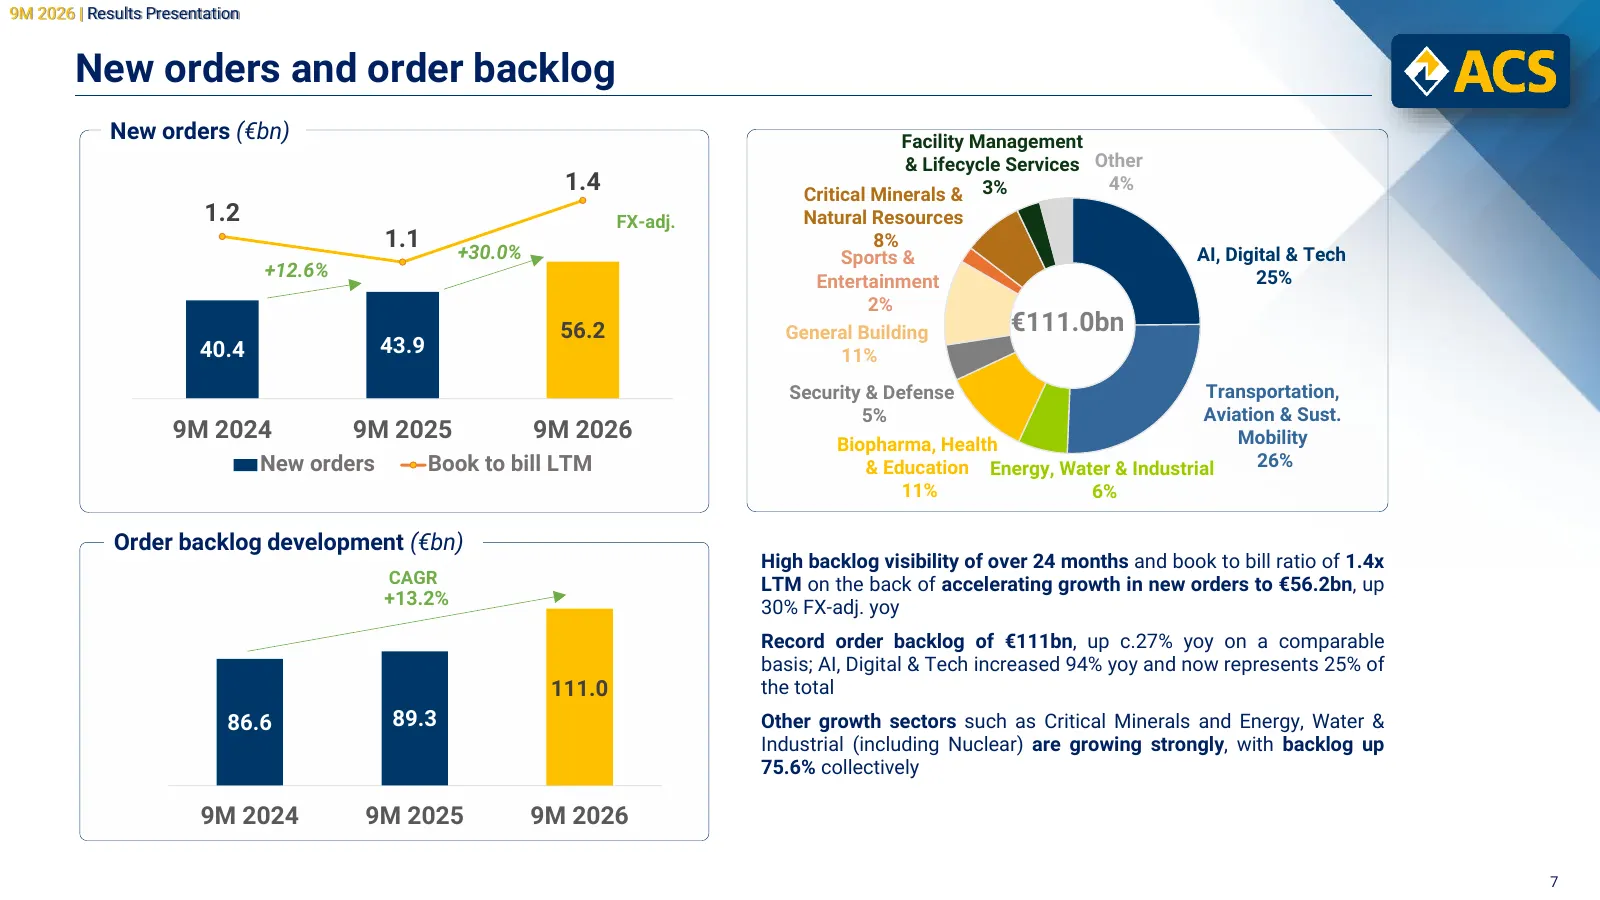
9M 2026 | Results Presentation New orders and order backlog New orders (€bn) Facility Management & Lifecycle Services Other 1.4 1.4 Critical Minerals & 3% 4% 1.2 80.0 70.0 FX-adj. 1.3 Natural Resources 1.1 +30.0% 1.2 8% 60.0 Sports & AI, Digital & Tech +12.6% 1.1 25% 50.0 Entertainment 2% 1.0 40.0 3
Slide 8: Recent significant new orders: AI, Digital & Tech
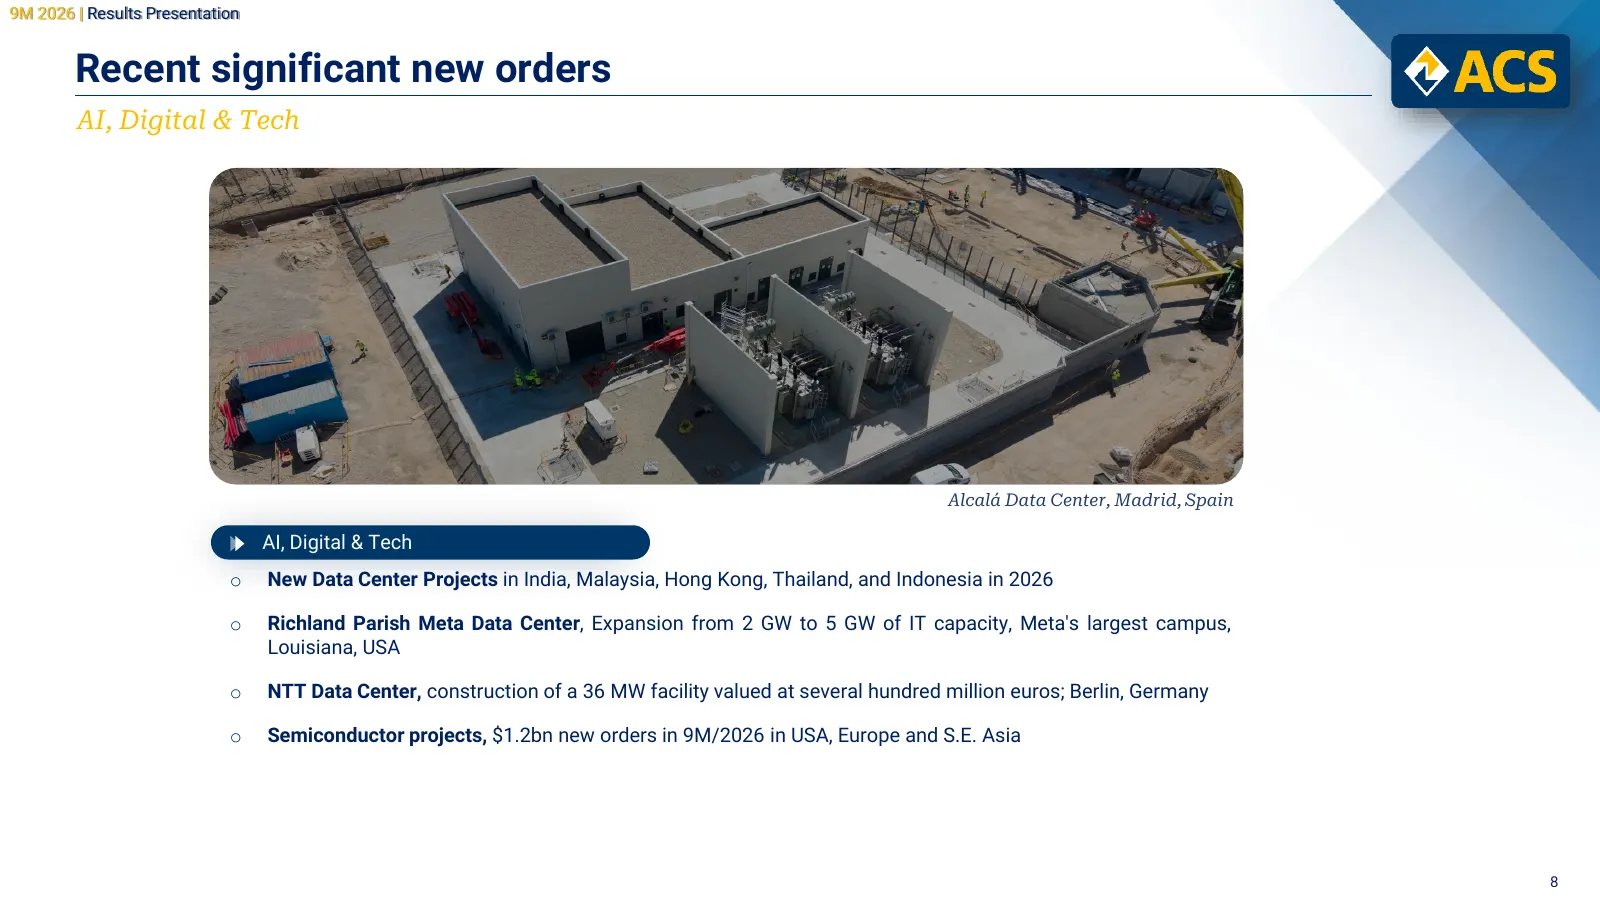
9M 2026 | Results Presentation Recent significant new orders AI, Digital & Tech Alcalá Data Center, Madrid, Spain AI, Digital & Tech o New Data Center Projects in India, Malaysia, Hong Kong, Thailand, and Indonesia in 2026 o Richland Parish Meta Data Center, Expansion from 2 GW to 5 GW of IT capacit
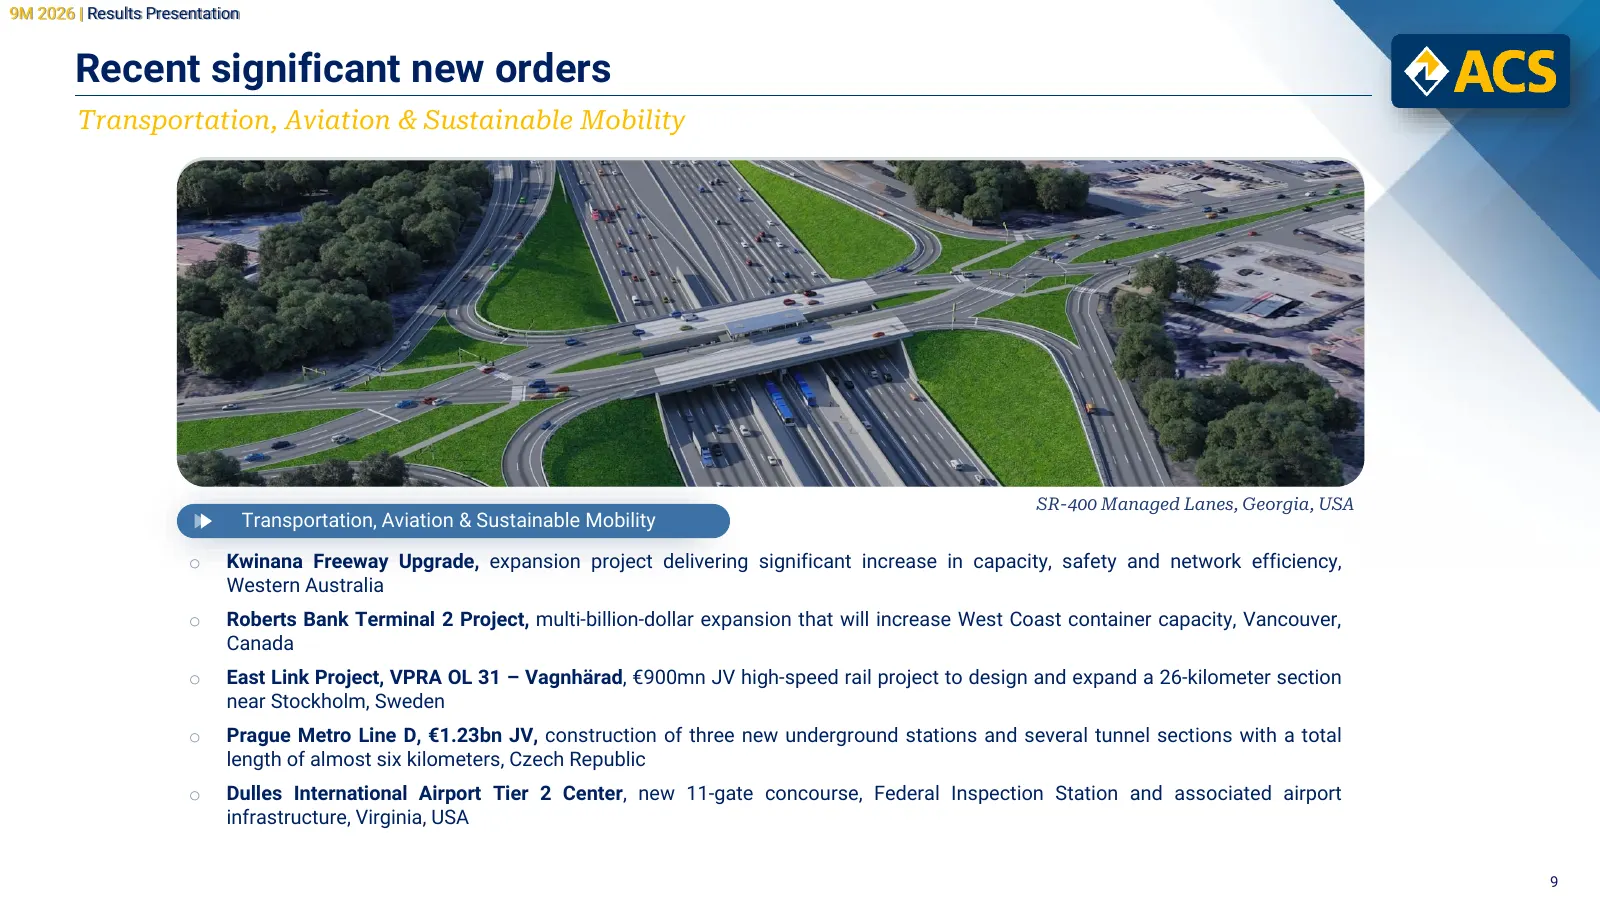
Slide 9: Recent significant new orders: Transportation, Aviation & Sustainable Mobility
9M 2026 | Results Presentation Recent significant new orders Transportation, Aviation & Sustainable Mobility SR-400 Managed Lanes, Georgia, USA Transportation, Aviation & Sustainable Mobility o Kwinana Freeway Upgrade, expansion project delivering significant increase in capacity, safety and network
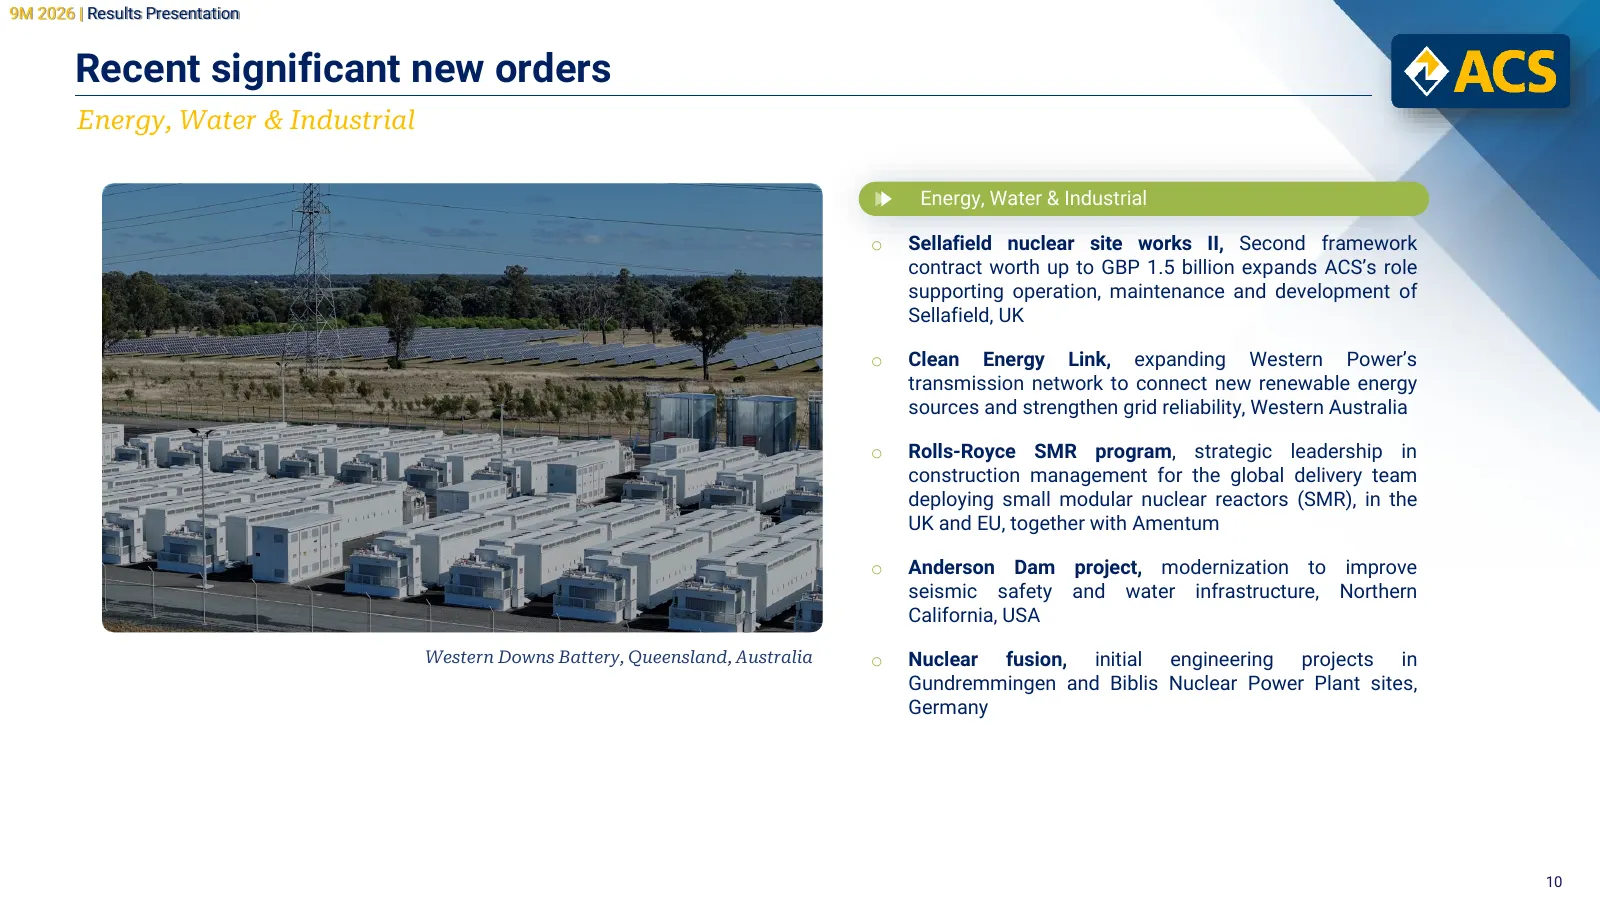
Slide 10: Recent significant new orders: Energy, Water & Industrial
9M 2026 | Results Presentation Recent significant new orders Energy, Water & Industrial Energy, Water & Industrial o Sellafield nuclear site works II, Second framework contract worth up to GBP 1.5 billion expands ACS’s role supporting operation, maintenance and development of Sellafield, UK o Clean
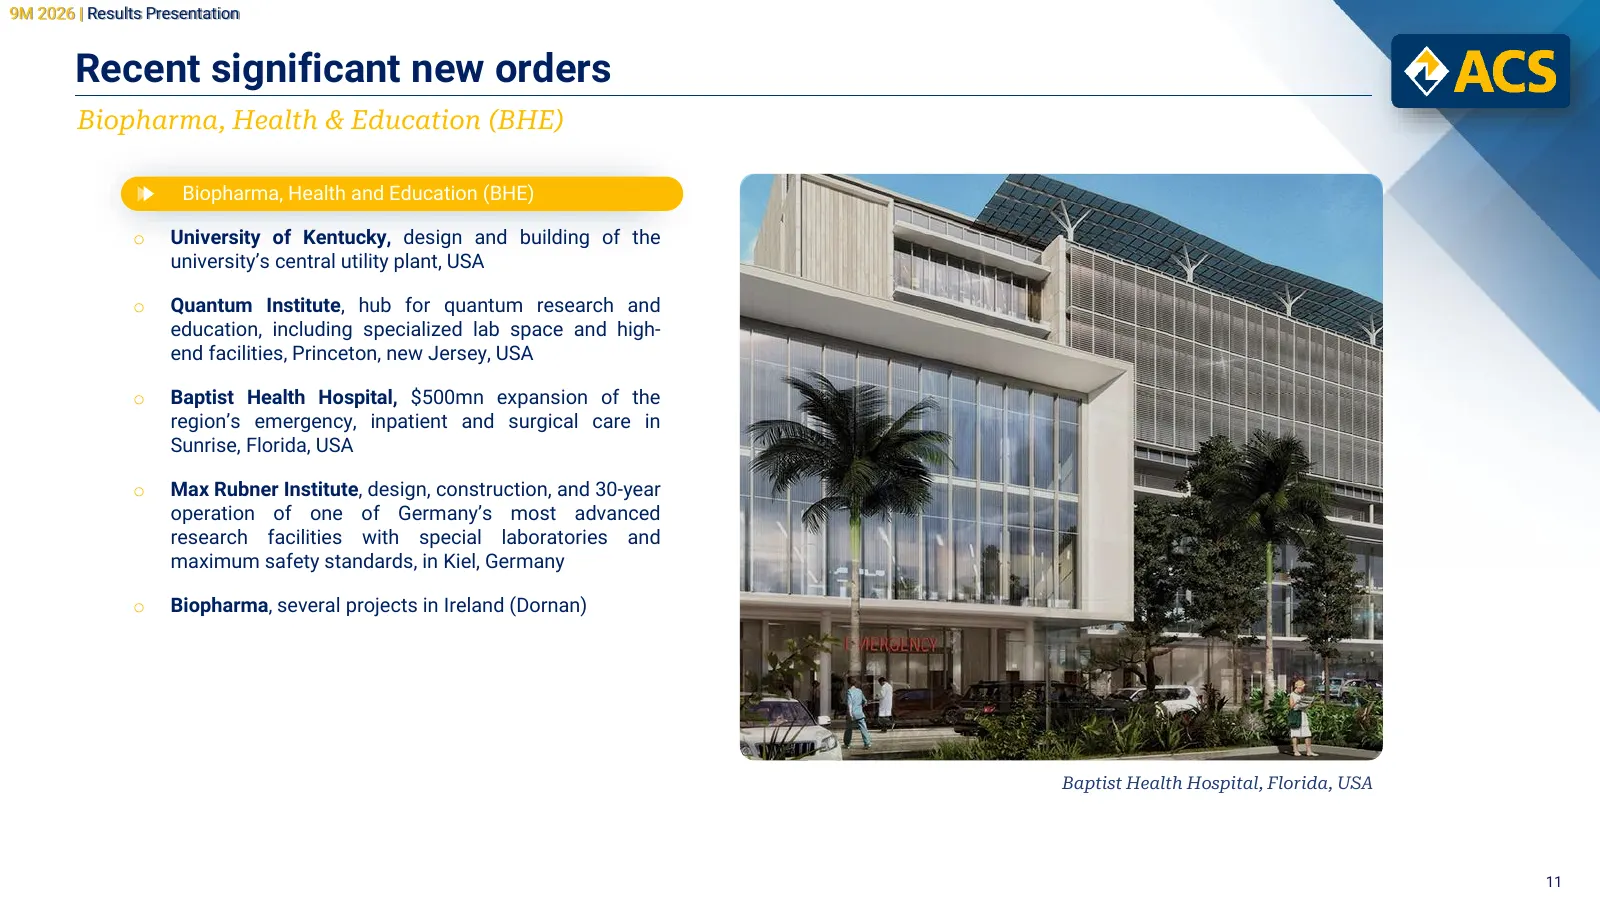
Slide 11: Recent significant new orders: Biopharma, Health & Education
9M 2026 | Results Presentation Recent significant new orders Biopharma, Health & Education (BHE) Biopharma, Health and Education (BHE) o University of Kentucky, design and building of the university’s central utility plant, USA o Quantum Institute, hub for quantum research and education, including s
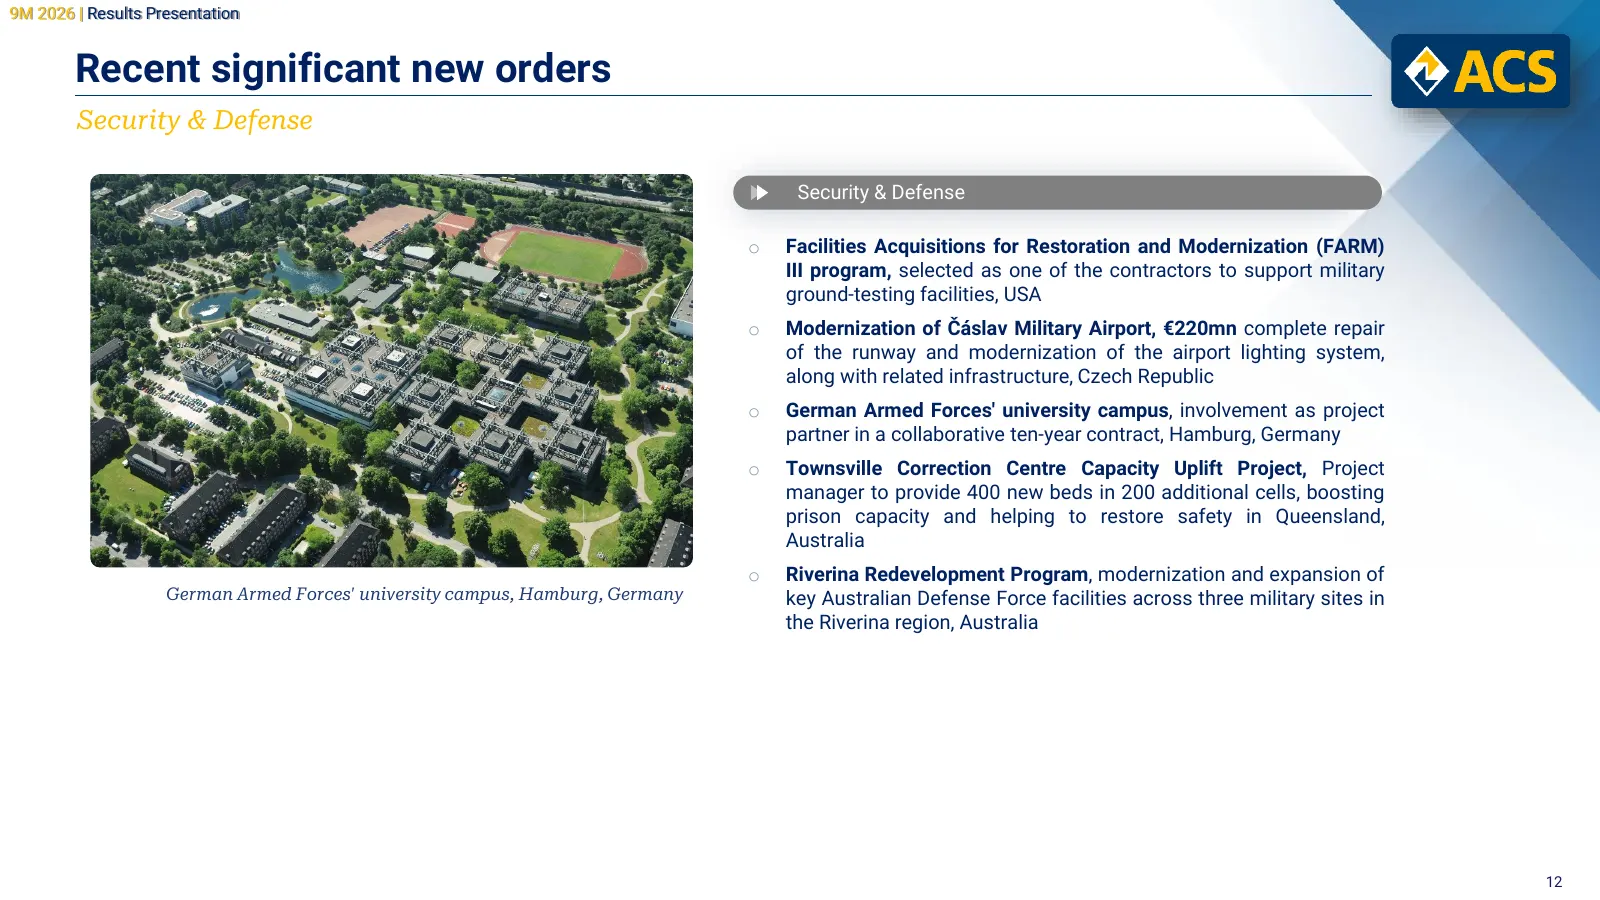
Slide 12: Recent significant new orders: Security & Defense
9M 2026 | Results Presentation Recent significant new orders Security & Defense Security & Defense o Facilities Acquisitions for Restoration and Modernization (FARM) III program, selected as one of the contractors to support military ground-testing facilities, USA o Modernization of Čáslav Military
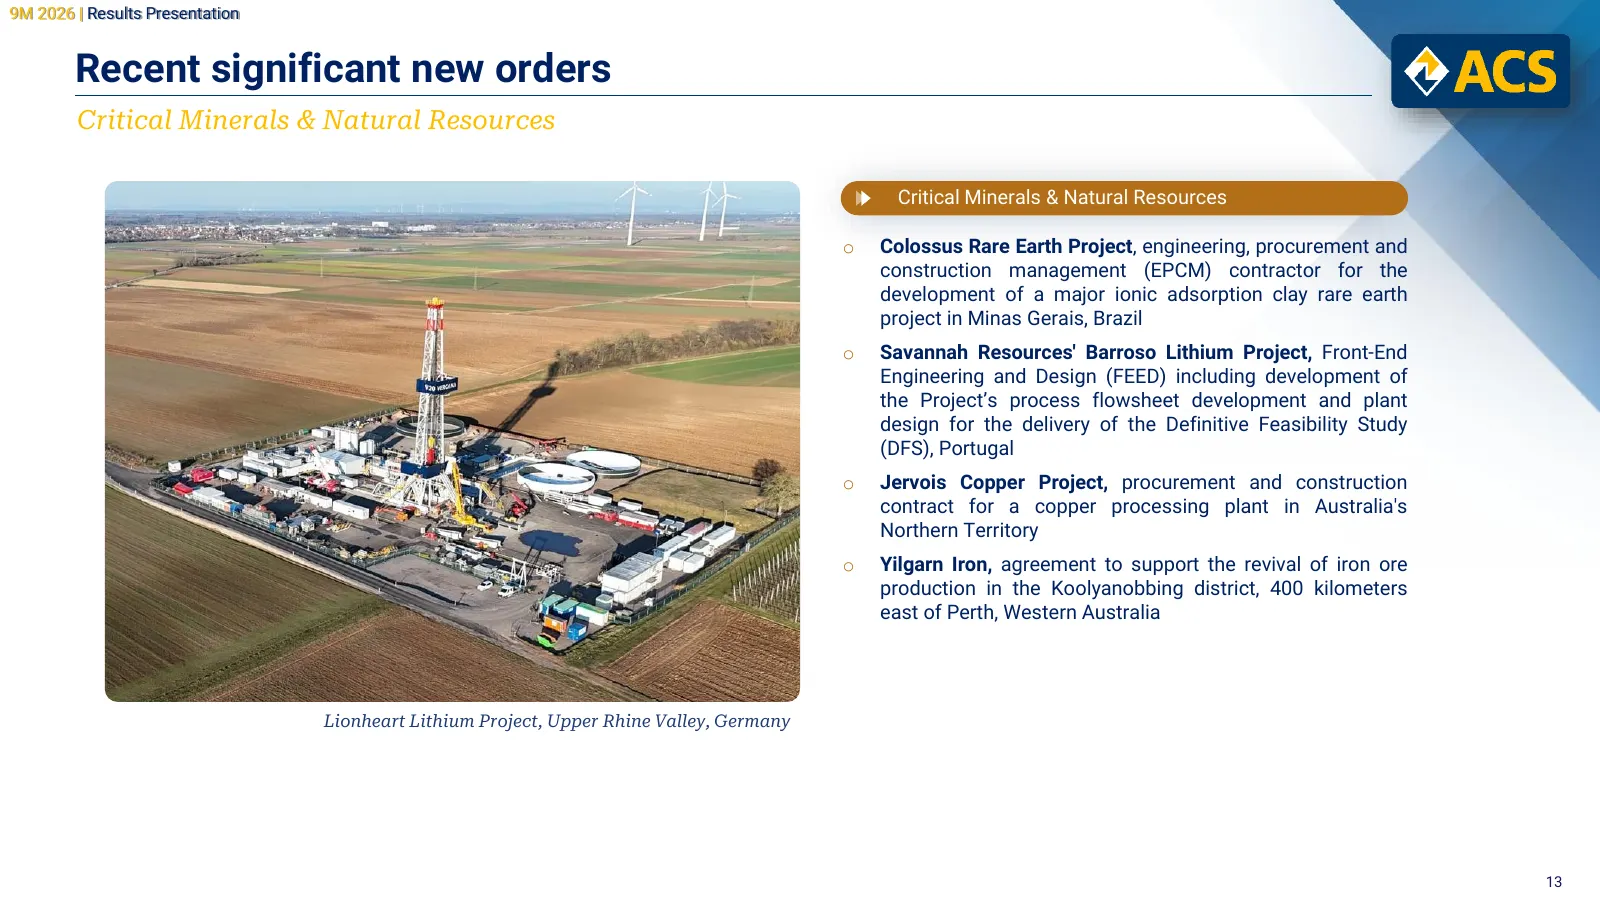
Slide 13: Recent significant new orders: Critical Minerals & Natural Resources
9M 2026 | Results Presentation Recent significant new orders Critical Minerals & Natural Resources Critical Minerals & Natural Resources o Colossus Rare Earth Project, engineering, procurement and construction management (EPCM) contractor for the development of a major ionic adsorption clay rare ear
Slide 14: Performance by segment
Performance by segment 9M 2026 | Results Presentation
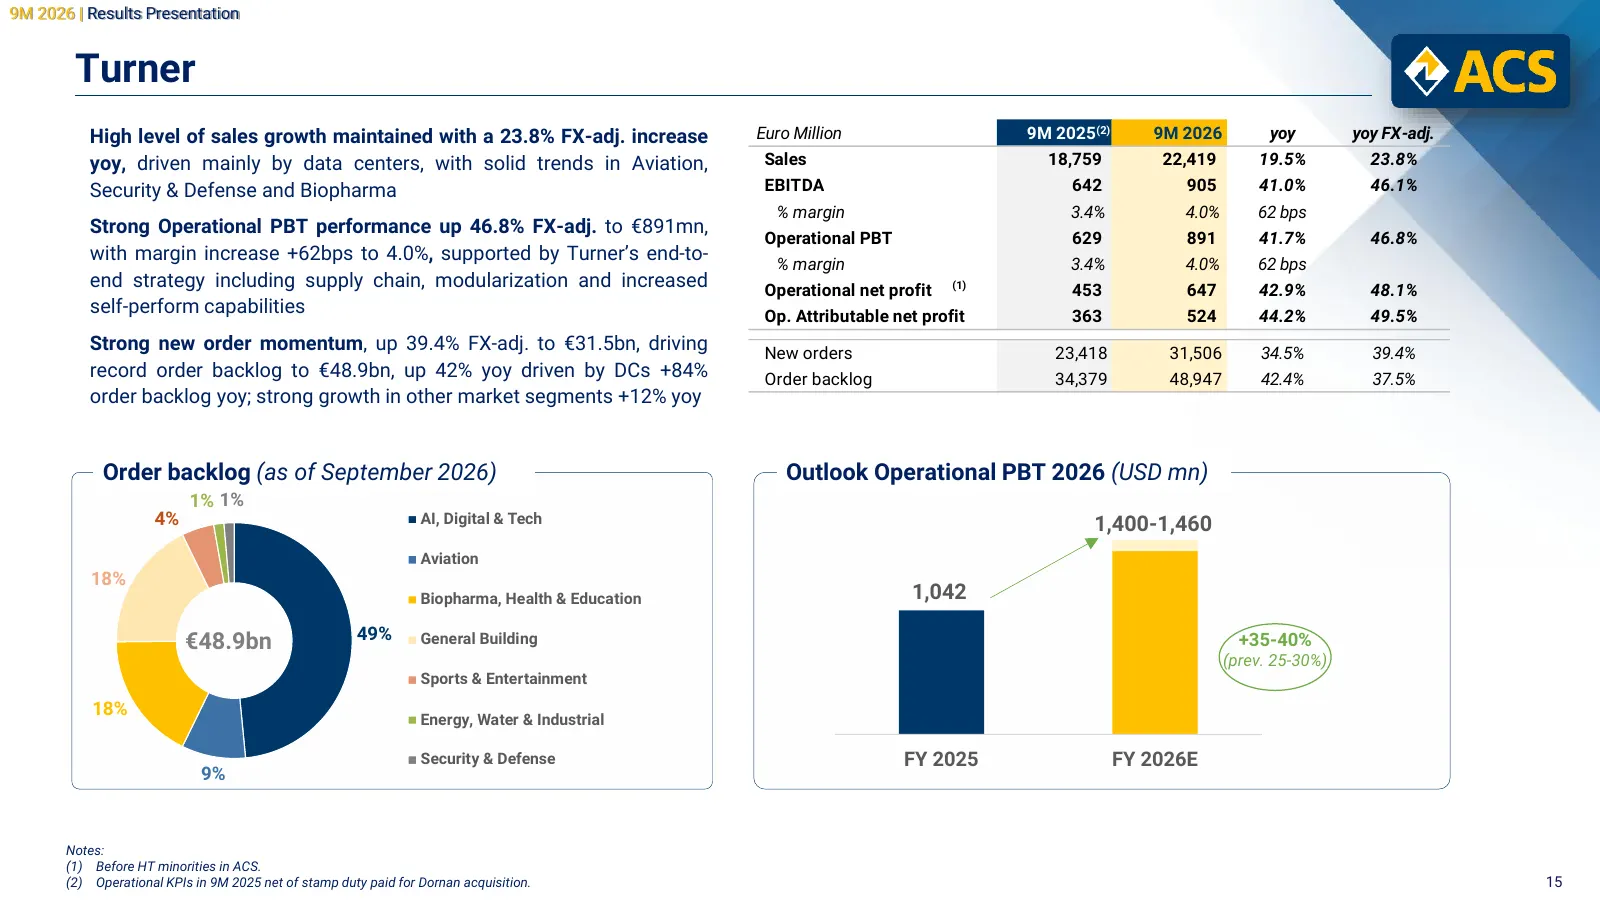
Slide 15: Turner
9M 2026 | Results Presentation Turner High level of sales growth maintained with a 23.8% FX-adj. increase Euro Million 9M 2025(2) 9M 2026 yoy yoy FX-adj. yoy, driven mainly by data centers, with solid trends in Aviation, Sales 18,759 22,419 19.5% 23.8% Security & Defense and Biopharma EBITDA 642 905
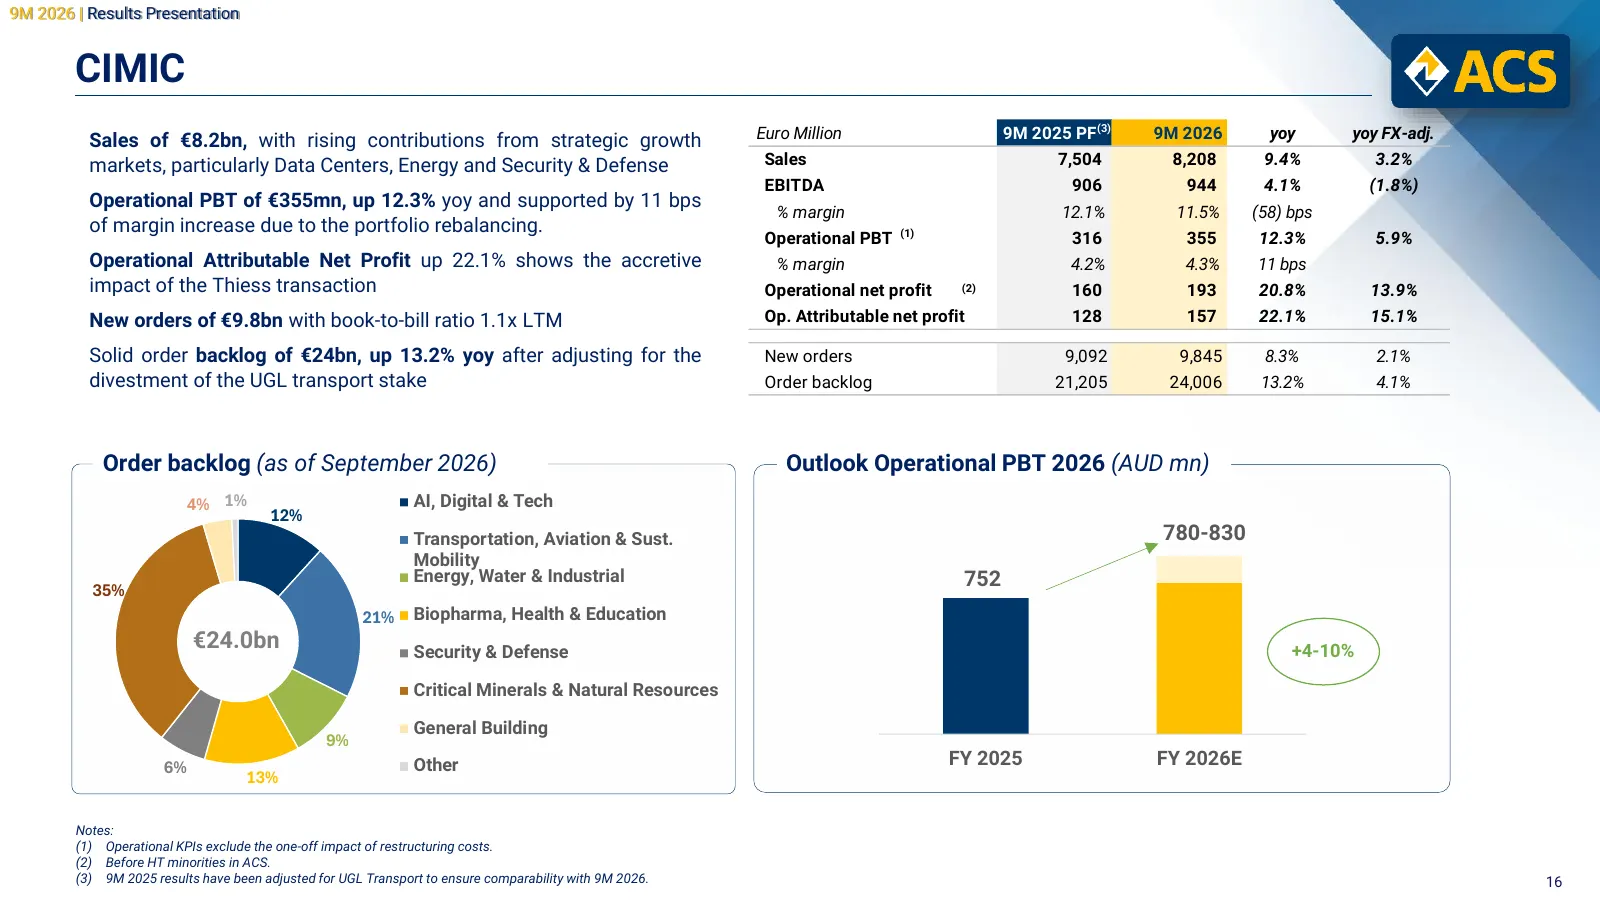
Slide 16: CIMIC
9M 2026 | Results Presentation CIMIC Sales of €8.2bn, with rising contributions from strategic growth Euro Million 9M 2025 PF (3) 9M 2026 yoy yoy FX-adj. markets, particularly Data Centers, Energy and Security & Defense Sales 7,504 8,208 9.4% 3.2% EBITDA 906 944 4.1% (1.8%) Operational PBT of €355mn
Slide 17: Engineering & Construction
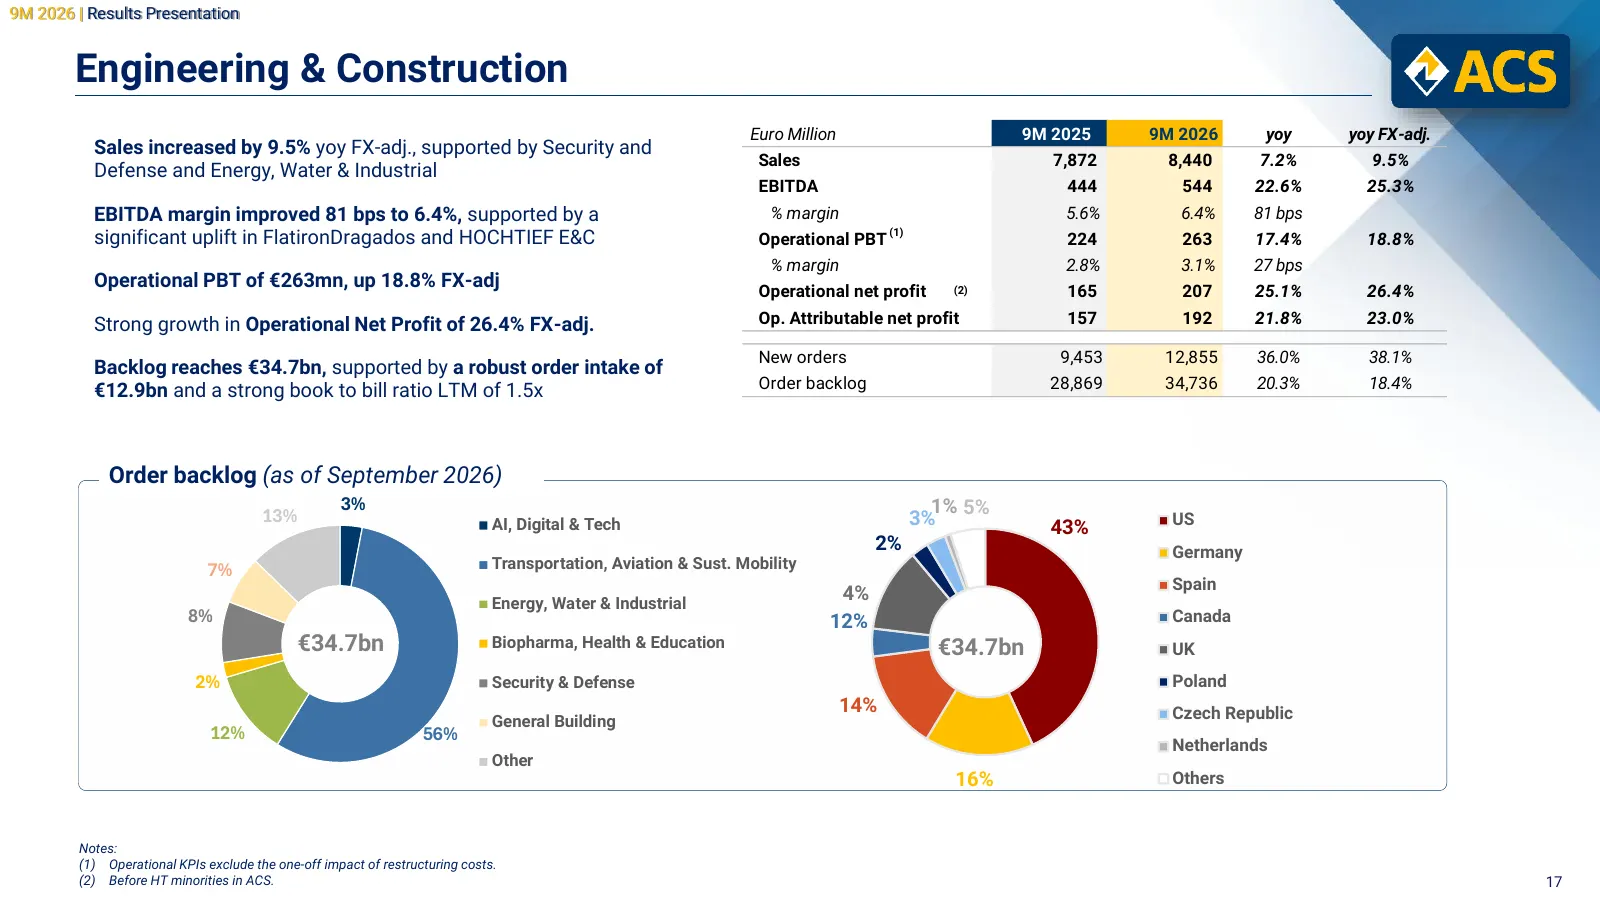
9M 2026 | Results Presentation Engineering & Construction Euro Million 9M 2025 9M 2026 yoy yoy FX-adj. Sales increased by 9.5% yoy FX-adj., supported by Security and Sales 7,872 8,440 7.2% 9.5% Defense and Energy, Water & Industrial EBITDA 444 544 22.6% 25.3% EBITDA margin improved 81 bps to 6.4%, s
Slide 18: Infrastructure
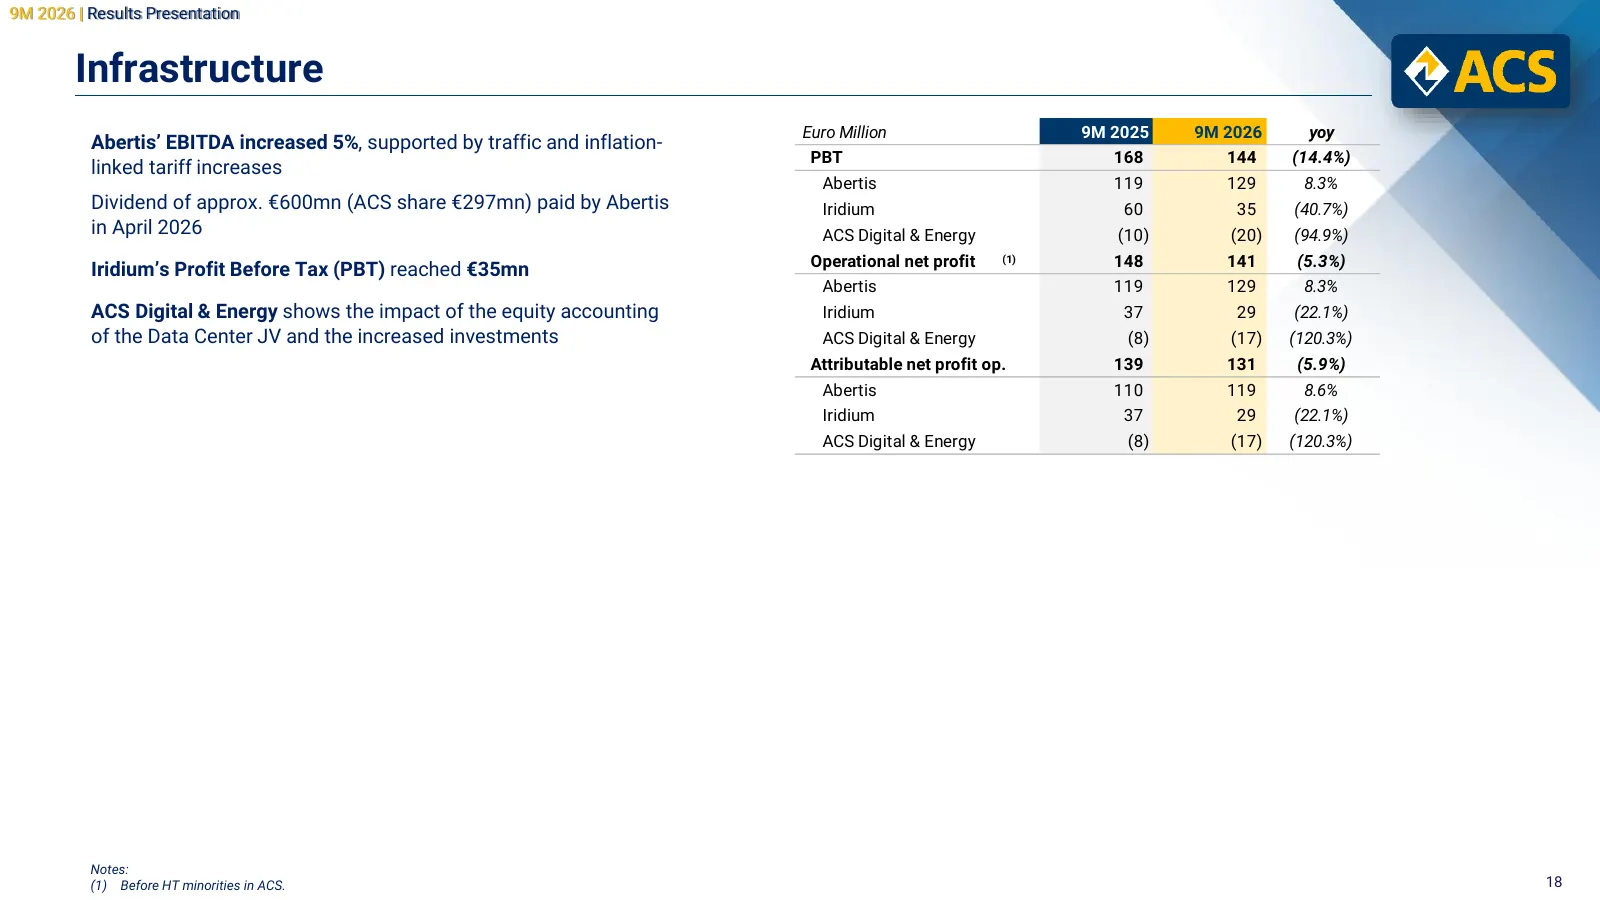
9M 2026 | Results Presentation Infrastructure Euro Million 9M 2025 9M 2026 yoy Abertis’ EBITDA increased 5%, supported by traffic and inflation- PBT 168 144 (14.4%) linked tariff increases Abertis 119 129 8.3% Dividend of approx. €600mn (ACS share €297mn) paid by Abertis Iridium 60 35 (40.7%) in Apr
Slide 19: Infrastructure - Abertis
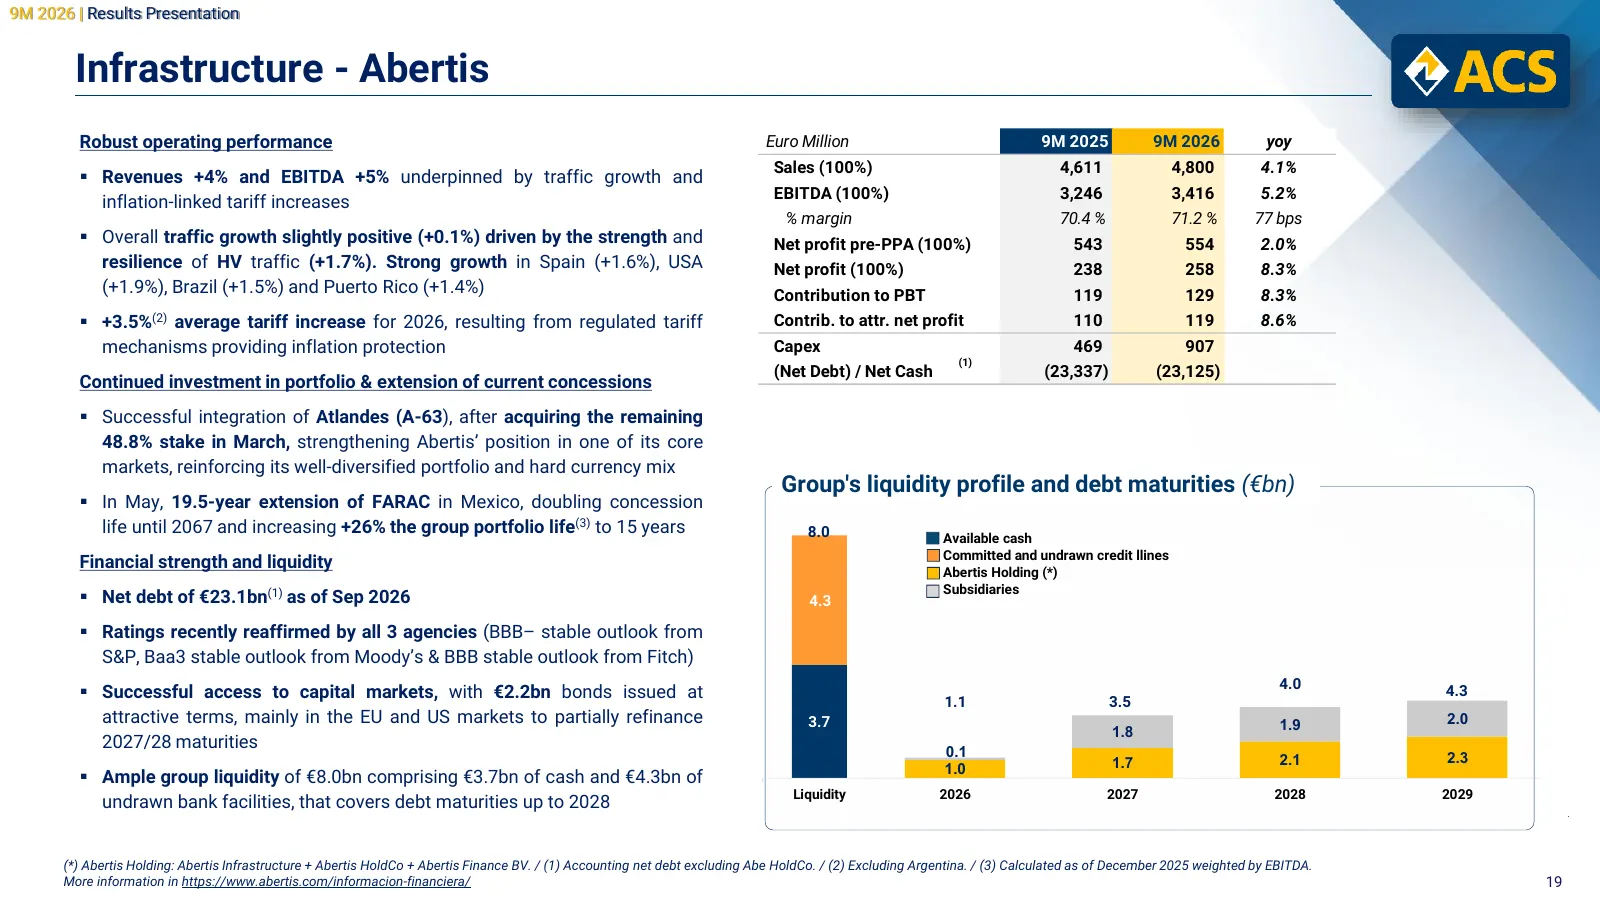
9M 2026 | Results Presentation Infrastructure - Abertis Robust operating performance Euro Million 9M 2025 9M 2026 yoy Sales (100%) 4,611 4,800 4.1% ▪ Revenues +4% and EBITDA +5% underpinned by traffic growth and EBITDA (100%) 3,246 3,416 5.2% inflation-linked tariff increases % margin 70.4 % 71.2 %
Slide 20: Infrastructure - Abertis
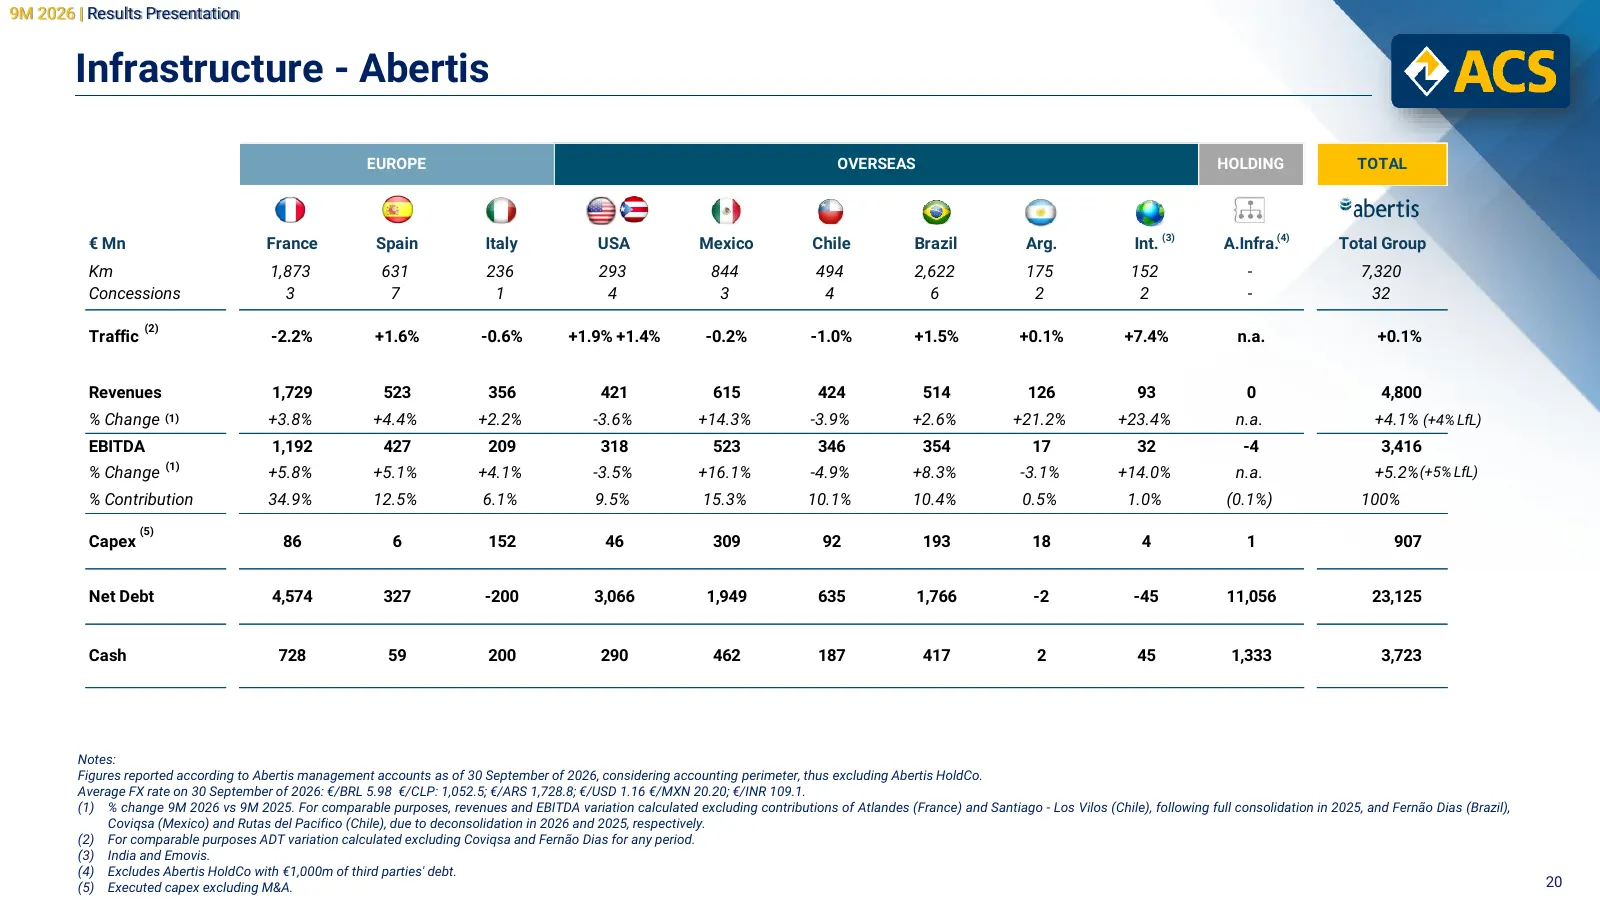
9M 2026 | Results Presentation Infrastructure - Abertis EUROPE OVERSEAS HOLDING TOTAL € Mn France Spain Italy USA Mexico Chile Brazil Arg. Int. (3) A.Infra.(4) Total Group Km 1,873 631 236 293 844 494 2,622 175 152 - 7,320 Concessions 3 7 1 4 3 4 6 2 2 - 32 (2) Traffic -2.2% +1.6% -0.6% +1.9% +1.4%
Slide 21: Conclusions
Conclusions 9M 2026 | Results Presentation
Slide 22: Conclusions
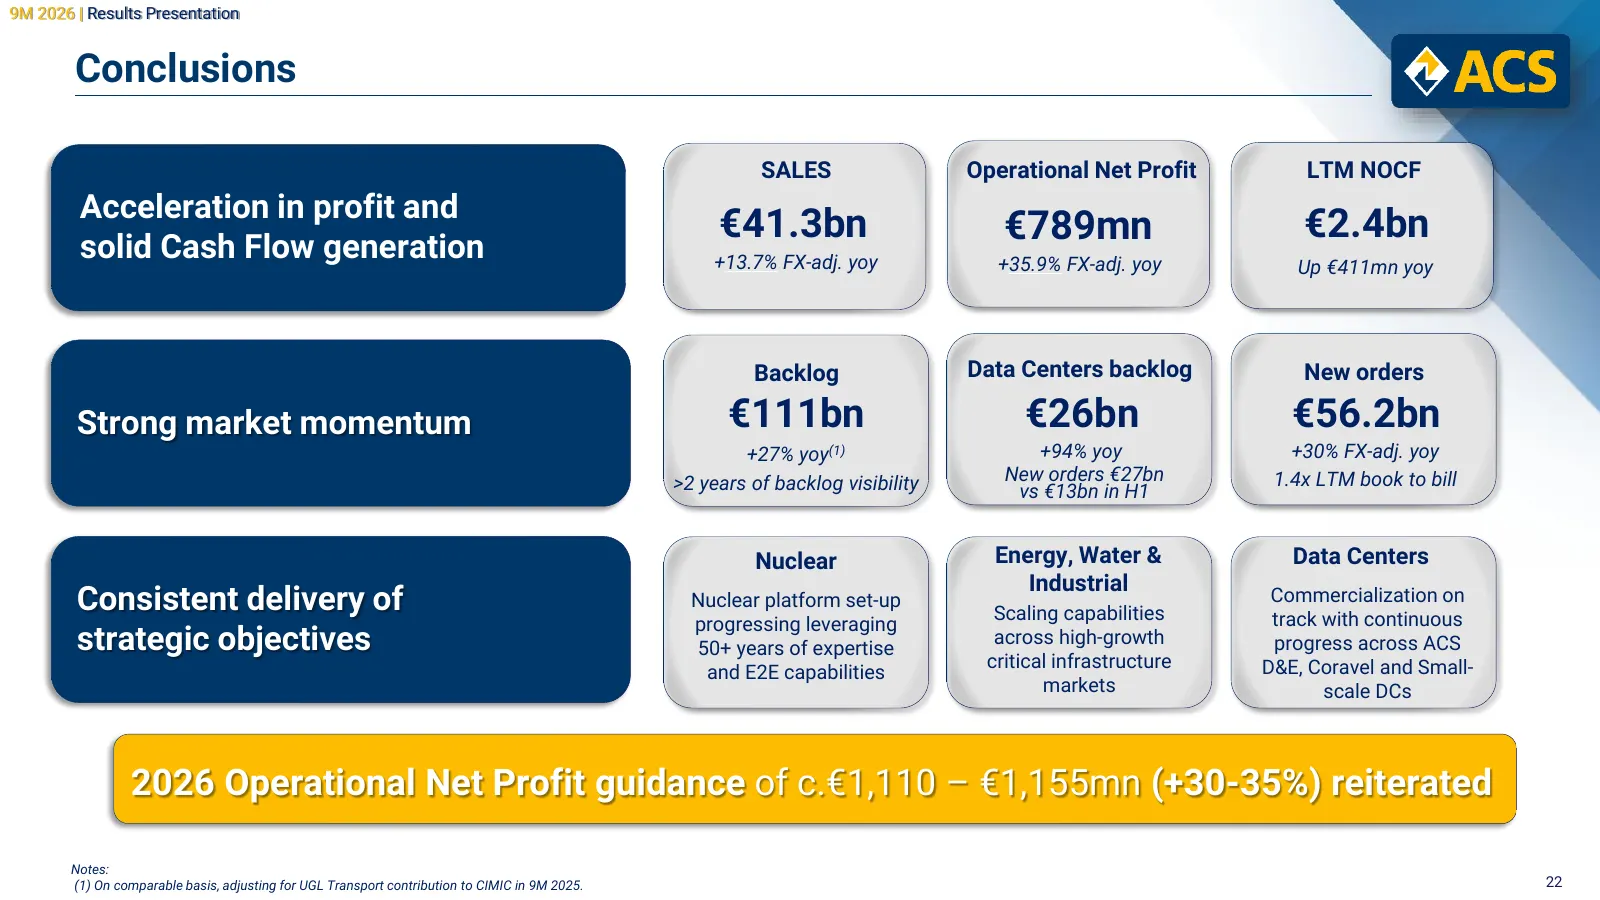
9M 2026 | Results Presentation Conclusions SALES Operational Net Profit LTM NOCF Acceleration in profit and €41.3bn €789mn €2.4bn solid Cash Flow generation +13.7% FX-adj. yoy +35.9% FX-adj. yoy Up €411mn yoy Backlog Data Centers backlog New orders Strong market momentum €111bn €26bn €56.2bn +27% yo
Slide 23: Appendix
Appendix 9M 2026 | Results Presentation
Slide 24: Operating results
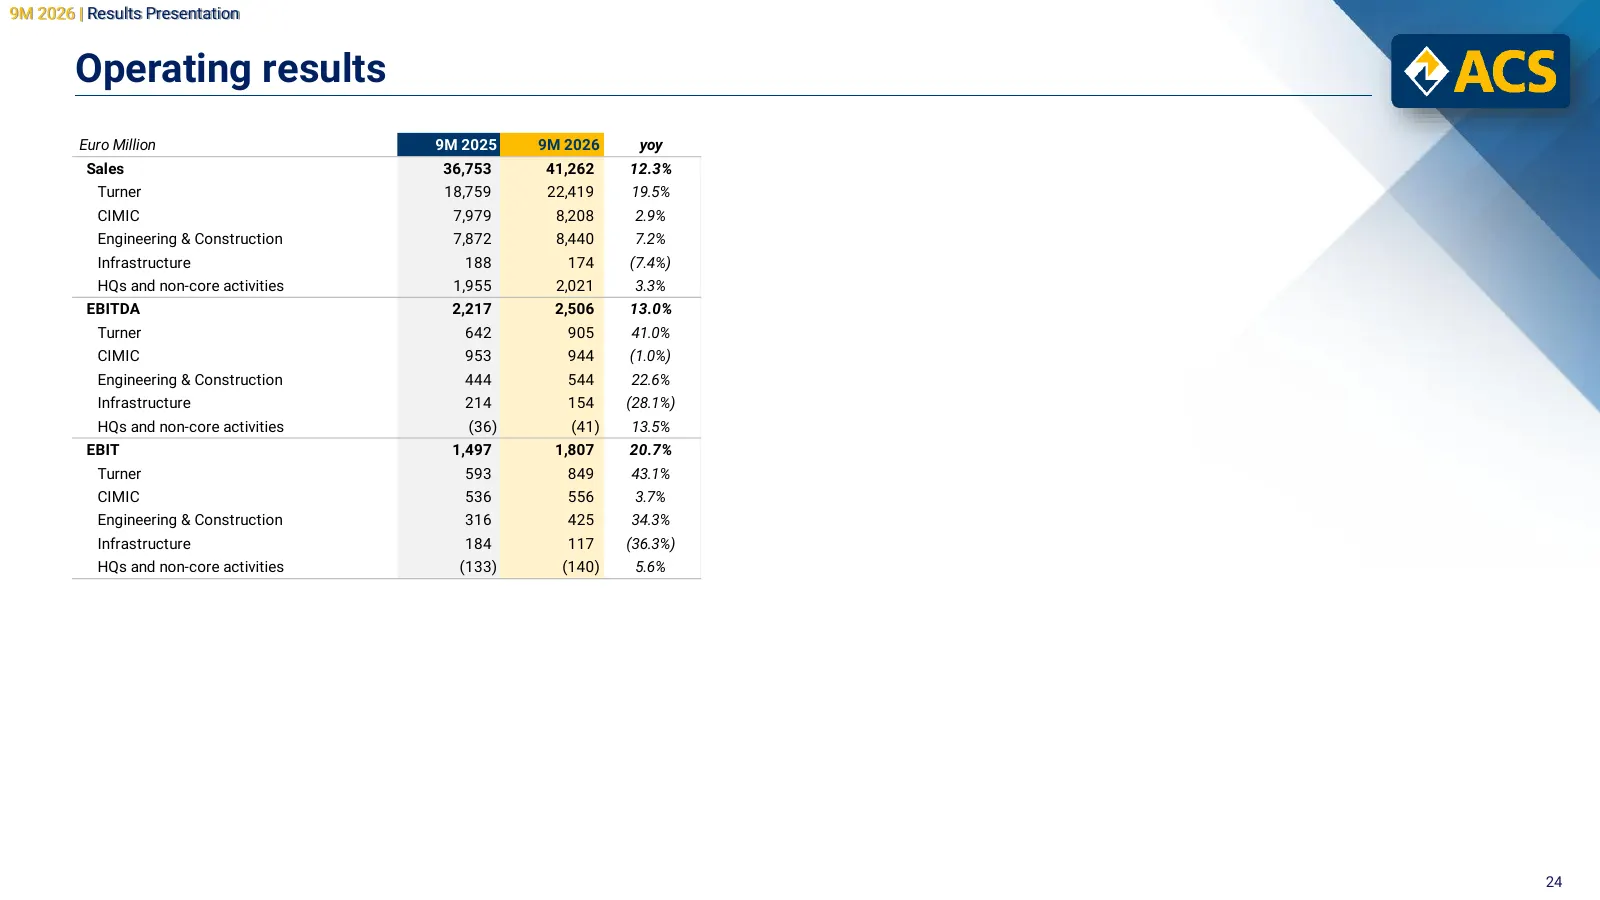
9M 2026 | Results Presentation Operating results Euro Million 9M 2025 9M 2026 yoy Sales 36,753 41,262 12.3% Turner 18,759 22,419 19.5% CIMIC 7,979 8,208 2.9% Engineering & Construction 7,872 8,440 7.2% Infrastructure 188 174 (7.4%) HQs and non-core activities 1,955 2,021 3.3% EBITDA 2,217 2,506 13.0
Slide 25: Income Statement
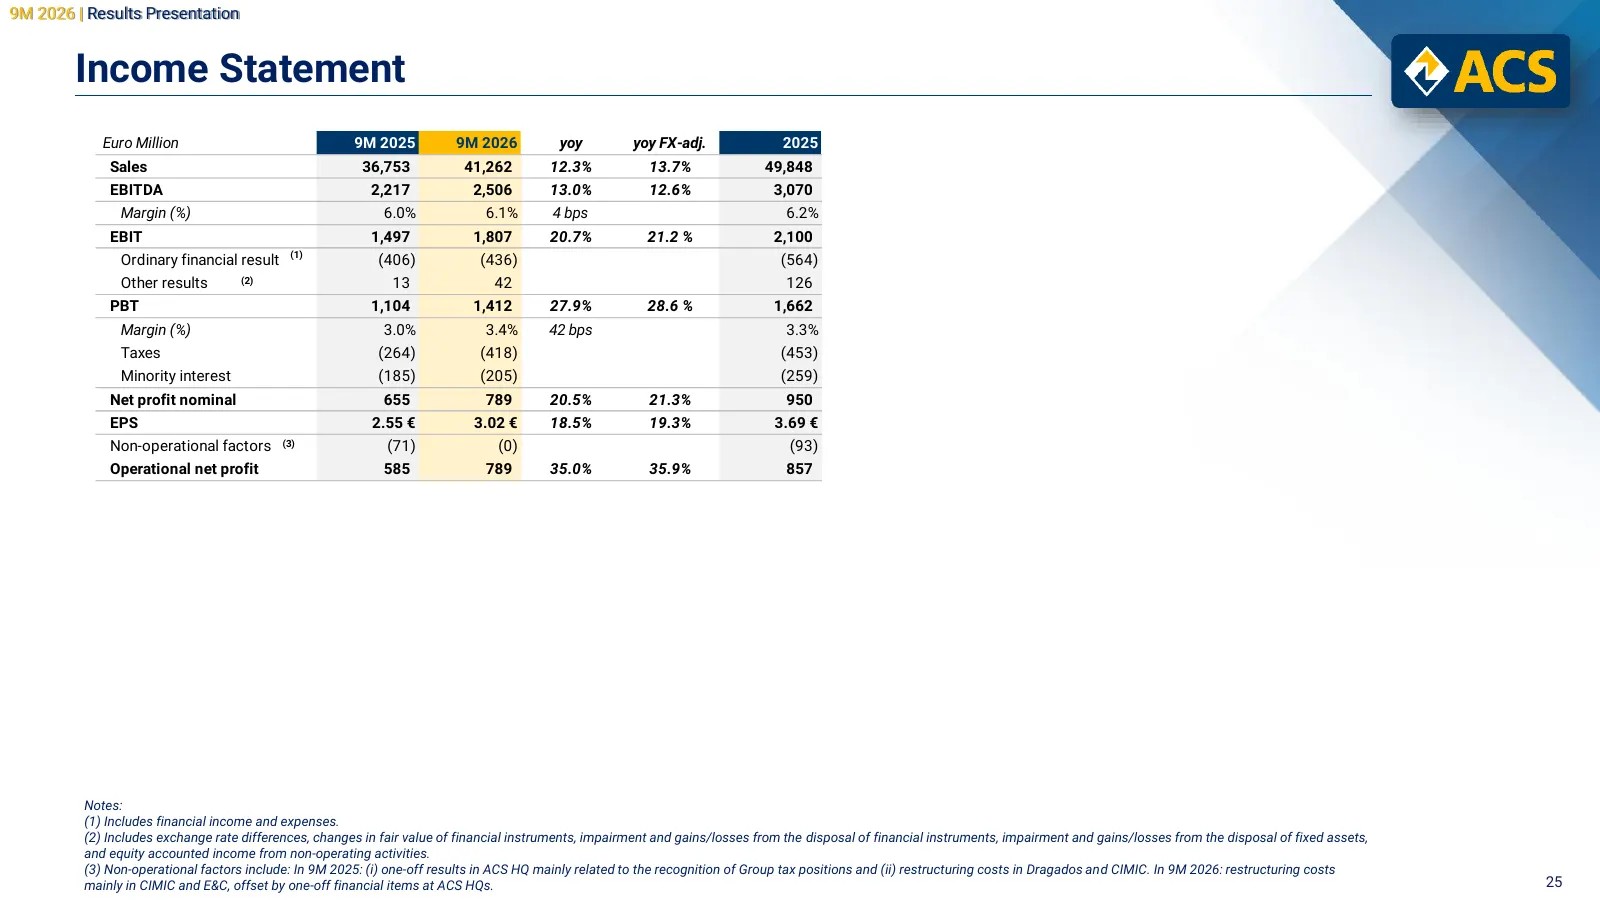
9M 2026 | Results Presentation Income Statement Euro Million 9M 2025 9M 2026 yoy yoy FX-adj. 2025 Sales 36,753 41,262 12.3% 13.7% 49,848 EBITDA 2,217 2,506 13.0% 12.6% 3,070 Margin (%) 6.0% 6.1% 4 bps 6.2% EBIT 1,497 1,807 20.7% 21.2 % 2,100 (1) Ordinary financial result (406) (436) (564) Other resu
Slide 26: Engineering & Construction - Dragados
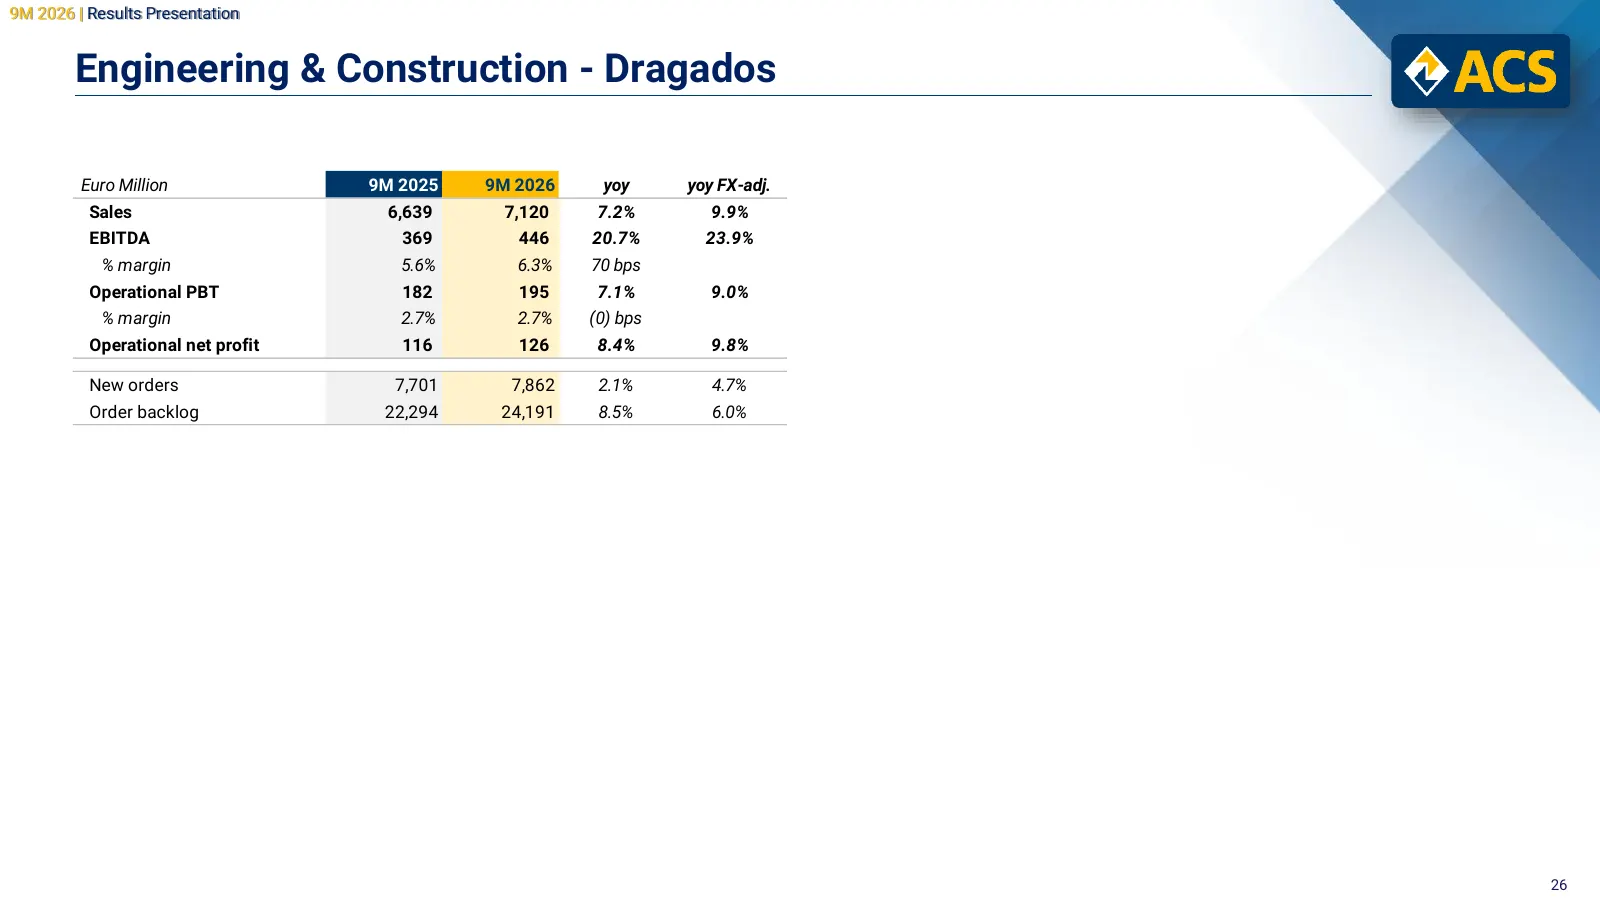
9M 2026 | Results Presentation Engineering & Construction - Dragados Euro Million 9M 2025 9M 2026 yoy yoy FX-adj. Sales 6,639 7,120 7.2% 9.9% EBITDA 369 446 20.7% 23.9% % margin 5.6% 6.3% 70 bps Operational PBT 182 195 7.1% 9.0% % margin 2.7% 2.7% (0) bps Operational net profit 116 126 8.4% 9.8% New
Slide 27: Sales and backlog by geography
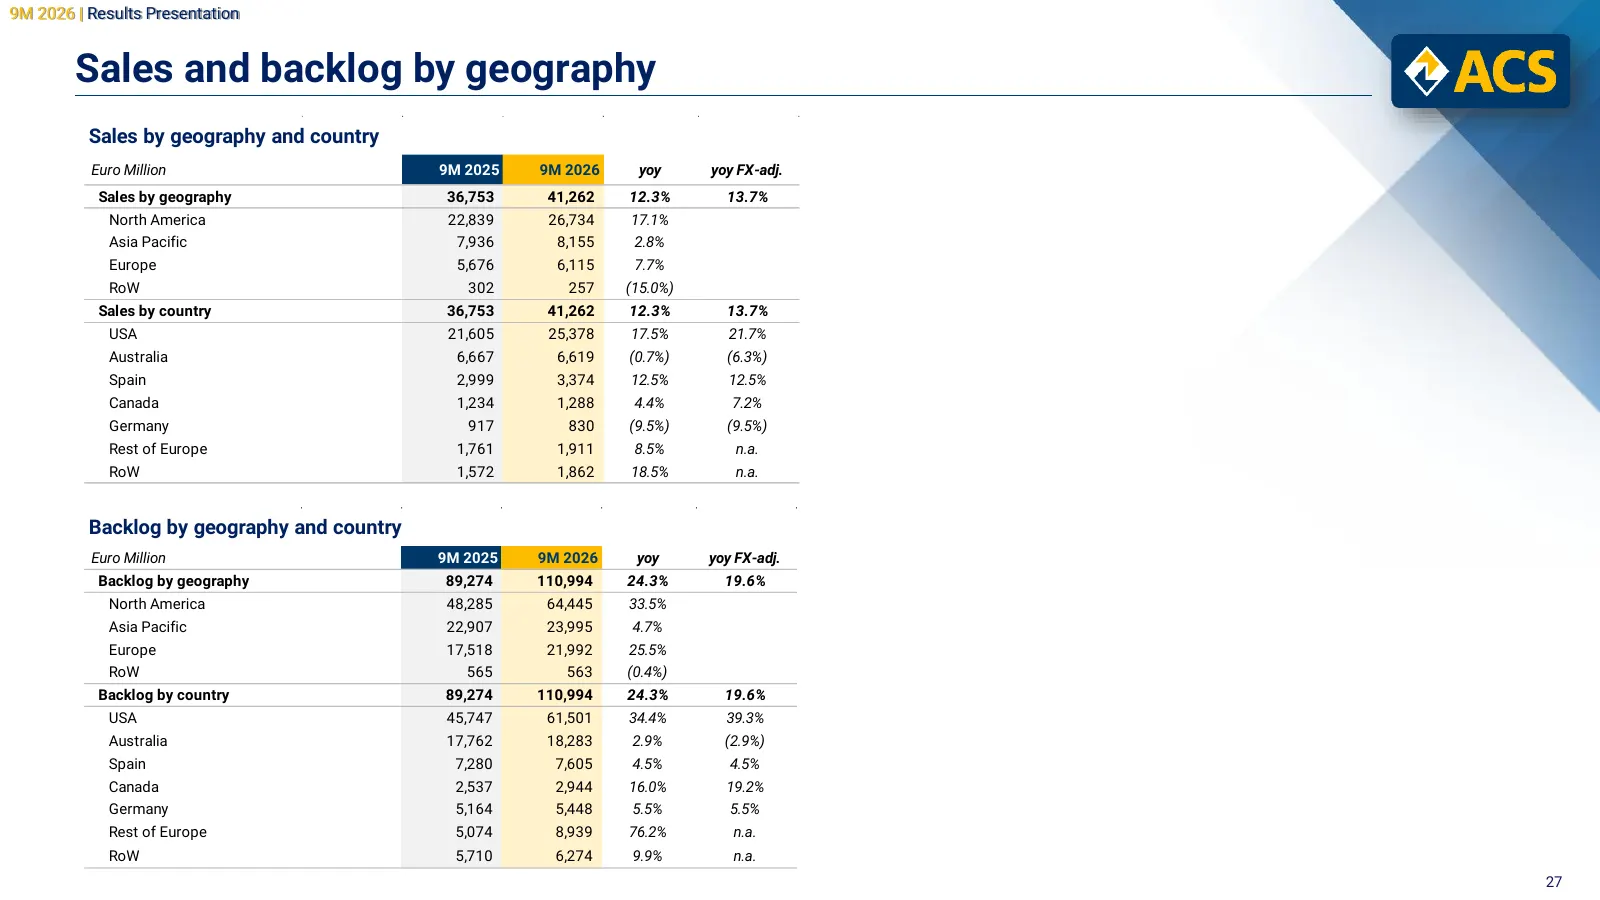
9M 2026 | Results Presentation Sales and backlog by geography Sales by geography and country Euro Million 9M 2025 9M 2026 yoy yoy FX-adj. Sales by geography 36,753 41,262 12.3% 13.7% North America 22,839 26,734 17.1% Asia Pacific 7,936 8,155 2.8% Europe 5,676 6,115 7.7% RoW 302 257 (15.0%) Sales by
Slide 28: Balance Sheet
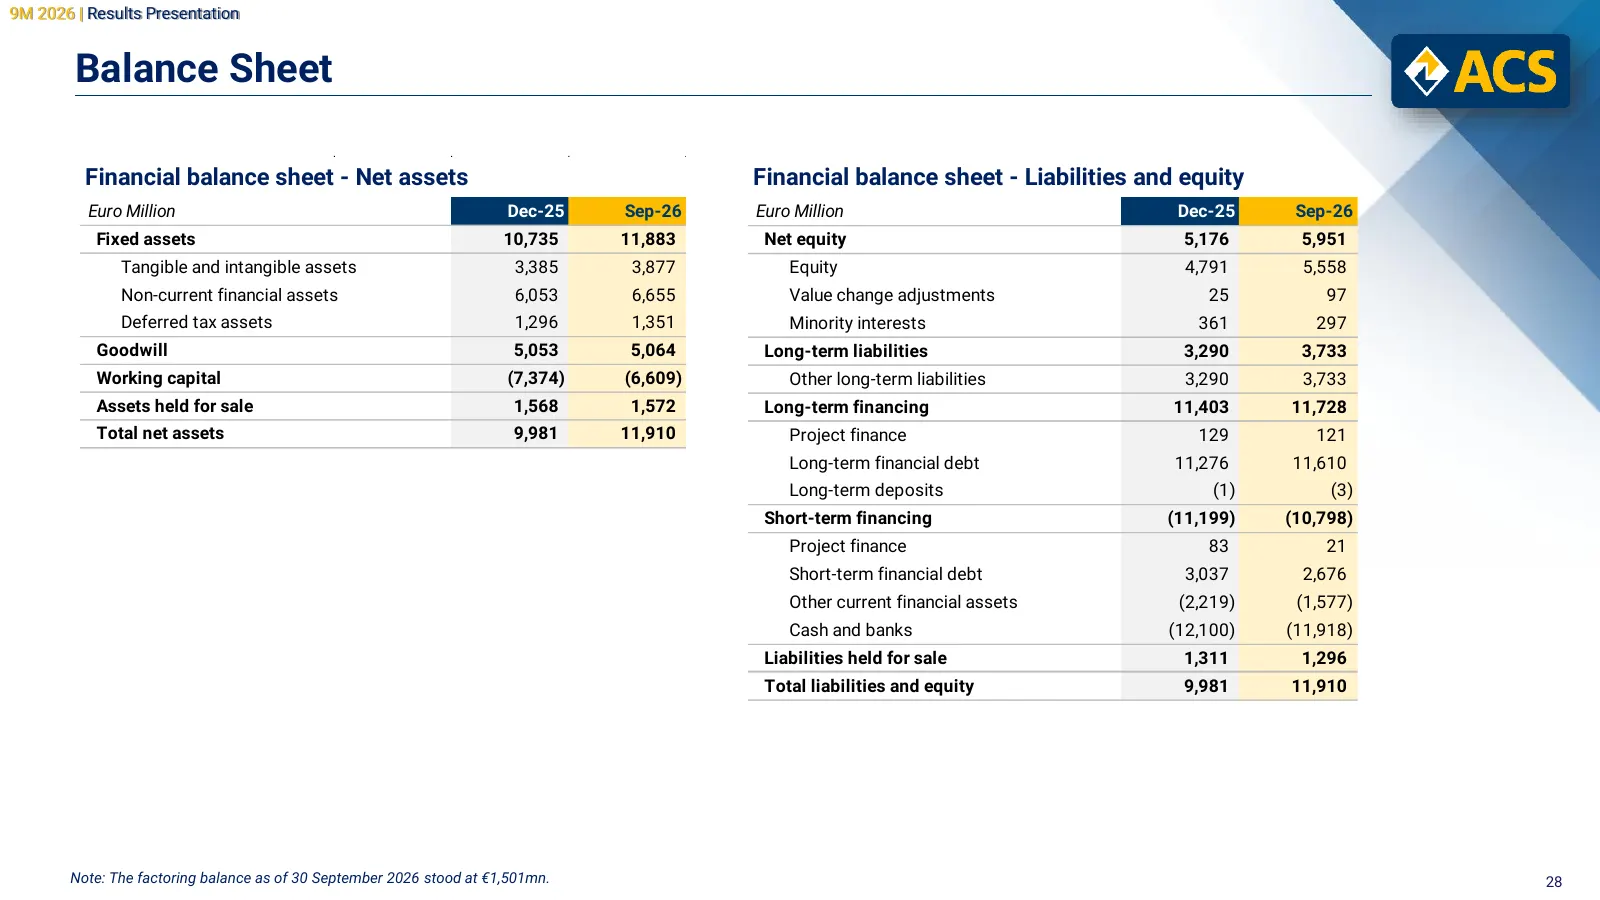
9M 2026 | Results Presentation Balance Sheet Financial balance sheet - Net assets Financial balance sheet - Liabilities and equity Euro Million Dec-25 Sep-26 Euro Million Dec-25 Sep-26 Fixed assets 10,735 11,883 Net equity 5,176 5,951 Tangible and intangible assets 3,385 3,877 Equity 4,791 5,558 Non
Slide 29: Cash flow performance
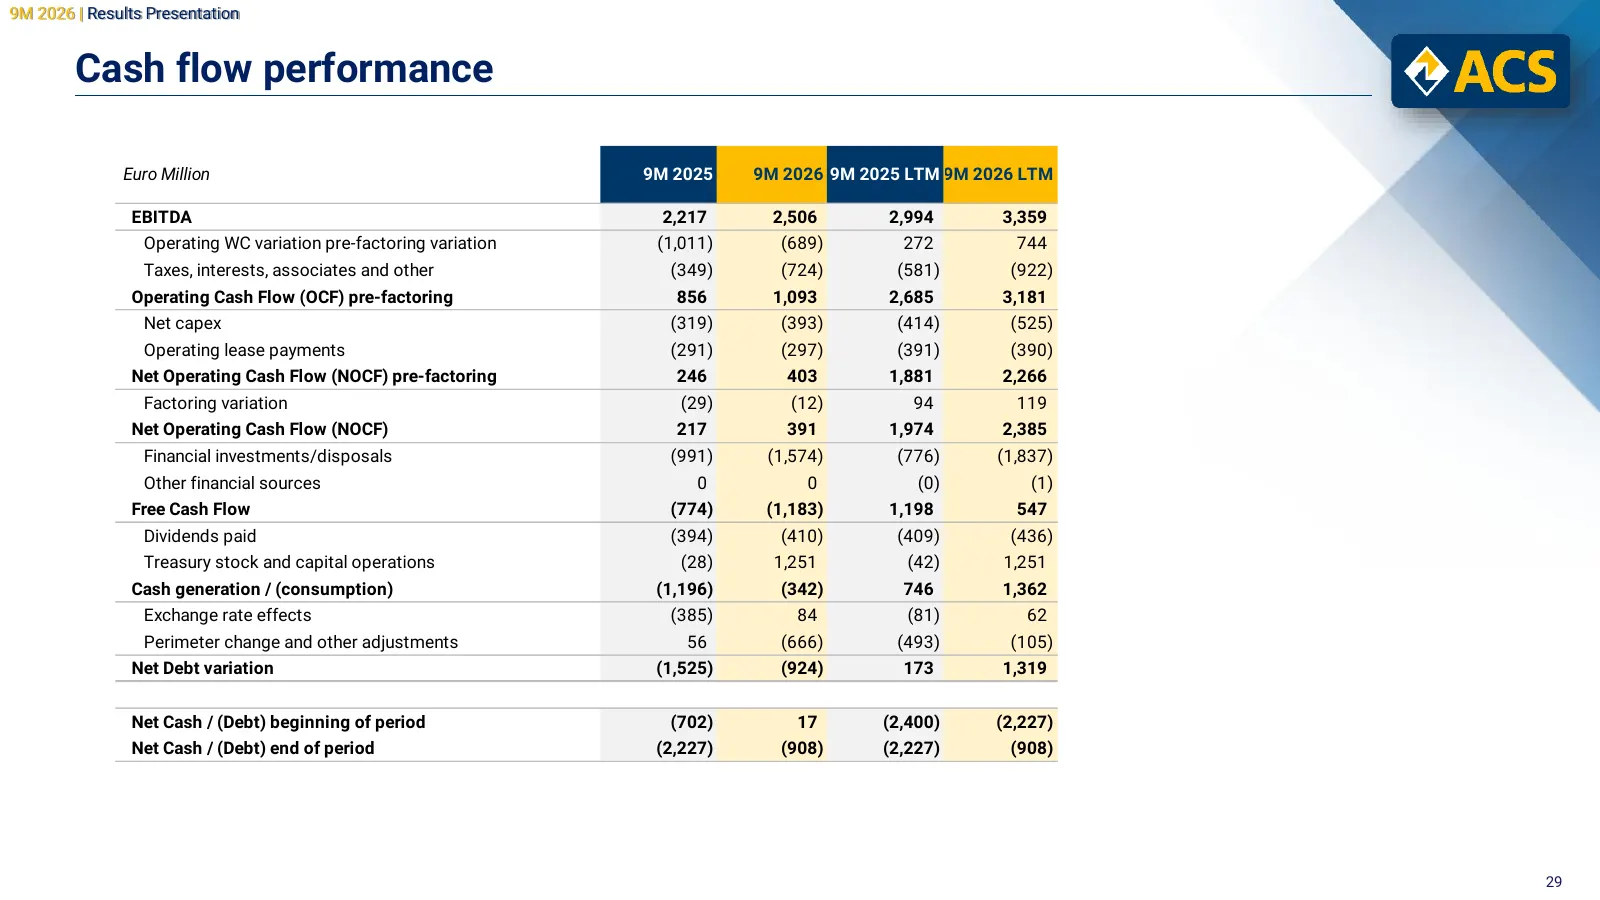
9M 2026 | Results Presentation Cash flow performance Euro Million 9M 2025 9M 2026 9M 2025 LTM 9M 2026 LTM EBITDA 2,217 2,506 2,994 3,359 Operating WC variation pre-factoring variation (1,011) (689) 272 744 Taxes, interests, associates and other (349) (724) (581) (922) Operating Cash Flow (OCF) pre-f
Slide 30: FX rate impact
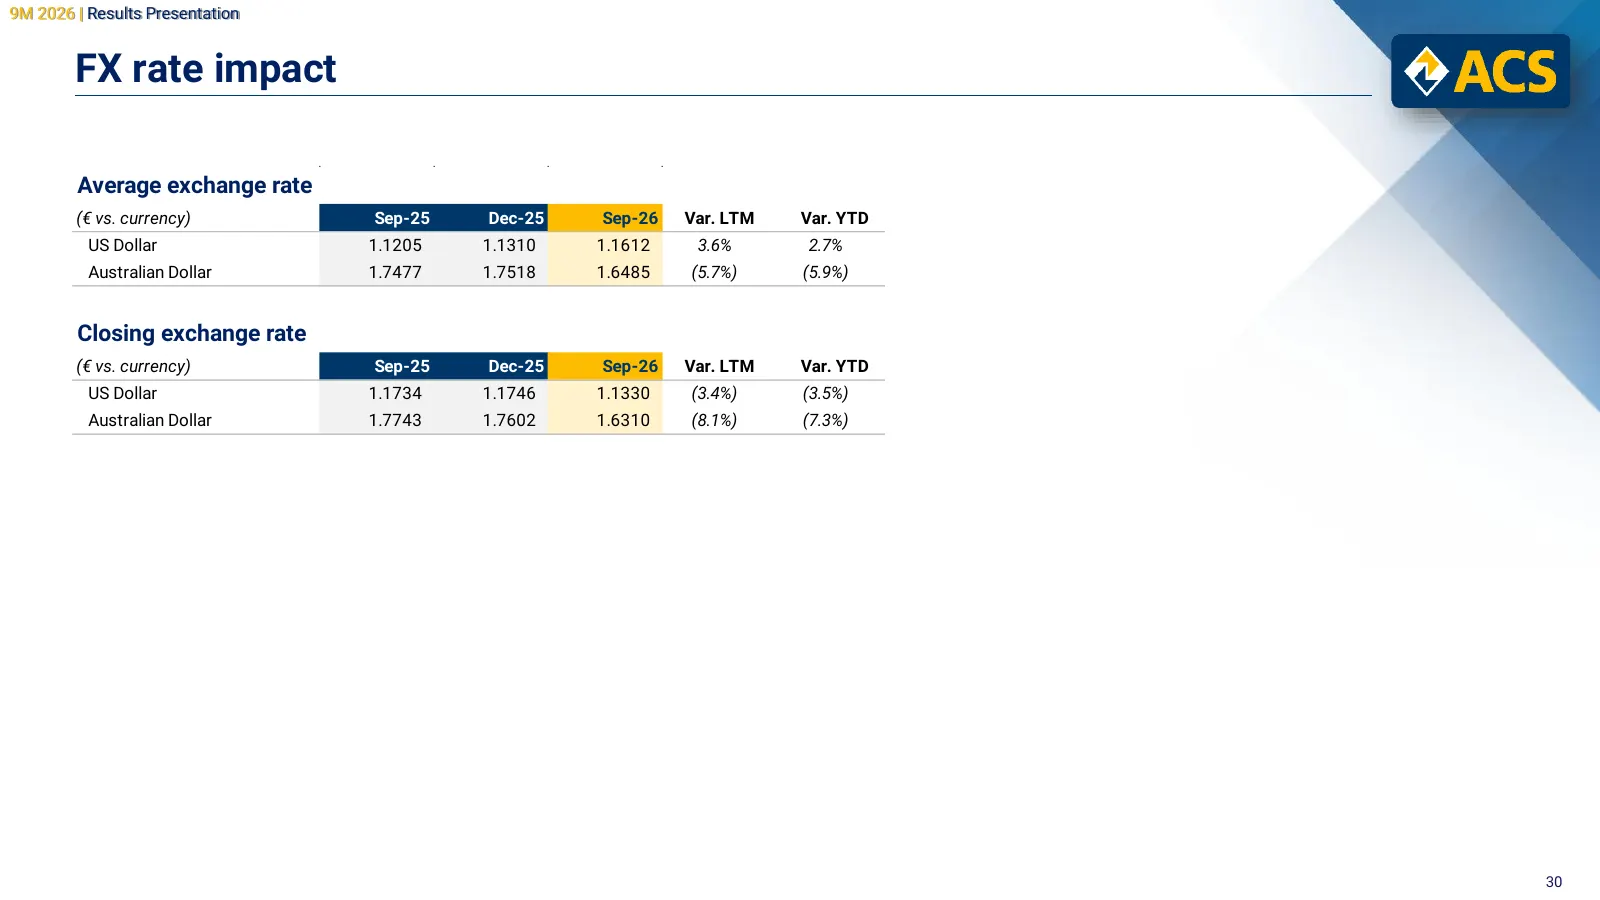
9M 2026 | Results Presentation FX rate impact Average exchange rate (€ vs. currency) Sep-25 Dec-25 Sep-26 Var. LTM Var. YTD US Dollar 1.1205 1.1310 1.1612 3.6% 2.7% Australian Dollar 1.7477 1.7518 1.6485 (5.7%) (5.9%) Closing exchange rate (€ vs. currency) Sep-25 Dec-25 Sep-26 Var. LTM Var. YTD US D
Slide 31: Legal Disclaimer
9M 2026 | Results Presentation 9M 2026 | Results Presentation Legal Disclaimer This document contains forward-looking statements on the intentions, expectations or forecasts of Grupo ACS or its management at the time the document was drawn up and in reference to various matters including, among othe

Slide 32
Source: company website
More decks from ACS, Actividades de Construccion y Servicios SA
 Investor Day (November 2026)177 slides · Nov 12, 2026
 Investor Day (November 2026)104 slides · Nov 12, 2026
 Investor Day (November 2026)14 slides · Nov 12, 2026
 Investor Day (November 2026)17 slides · Nov 12, 2026
 Investor Day (November 2026)13 slides · Nov 12, 2026
 Investor Day (November 2026)17 slides · Nov 12, 2026
All 139 ACS, Actividades de Construccion y Servicios SA decks