TXCO Resources — Exploration Co of Delaware — Shareholder Meeting (May 2005)
9 slides from TXCO Resources's shareholder meeting presentation, May 13, 2005
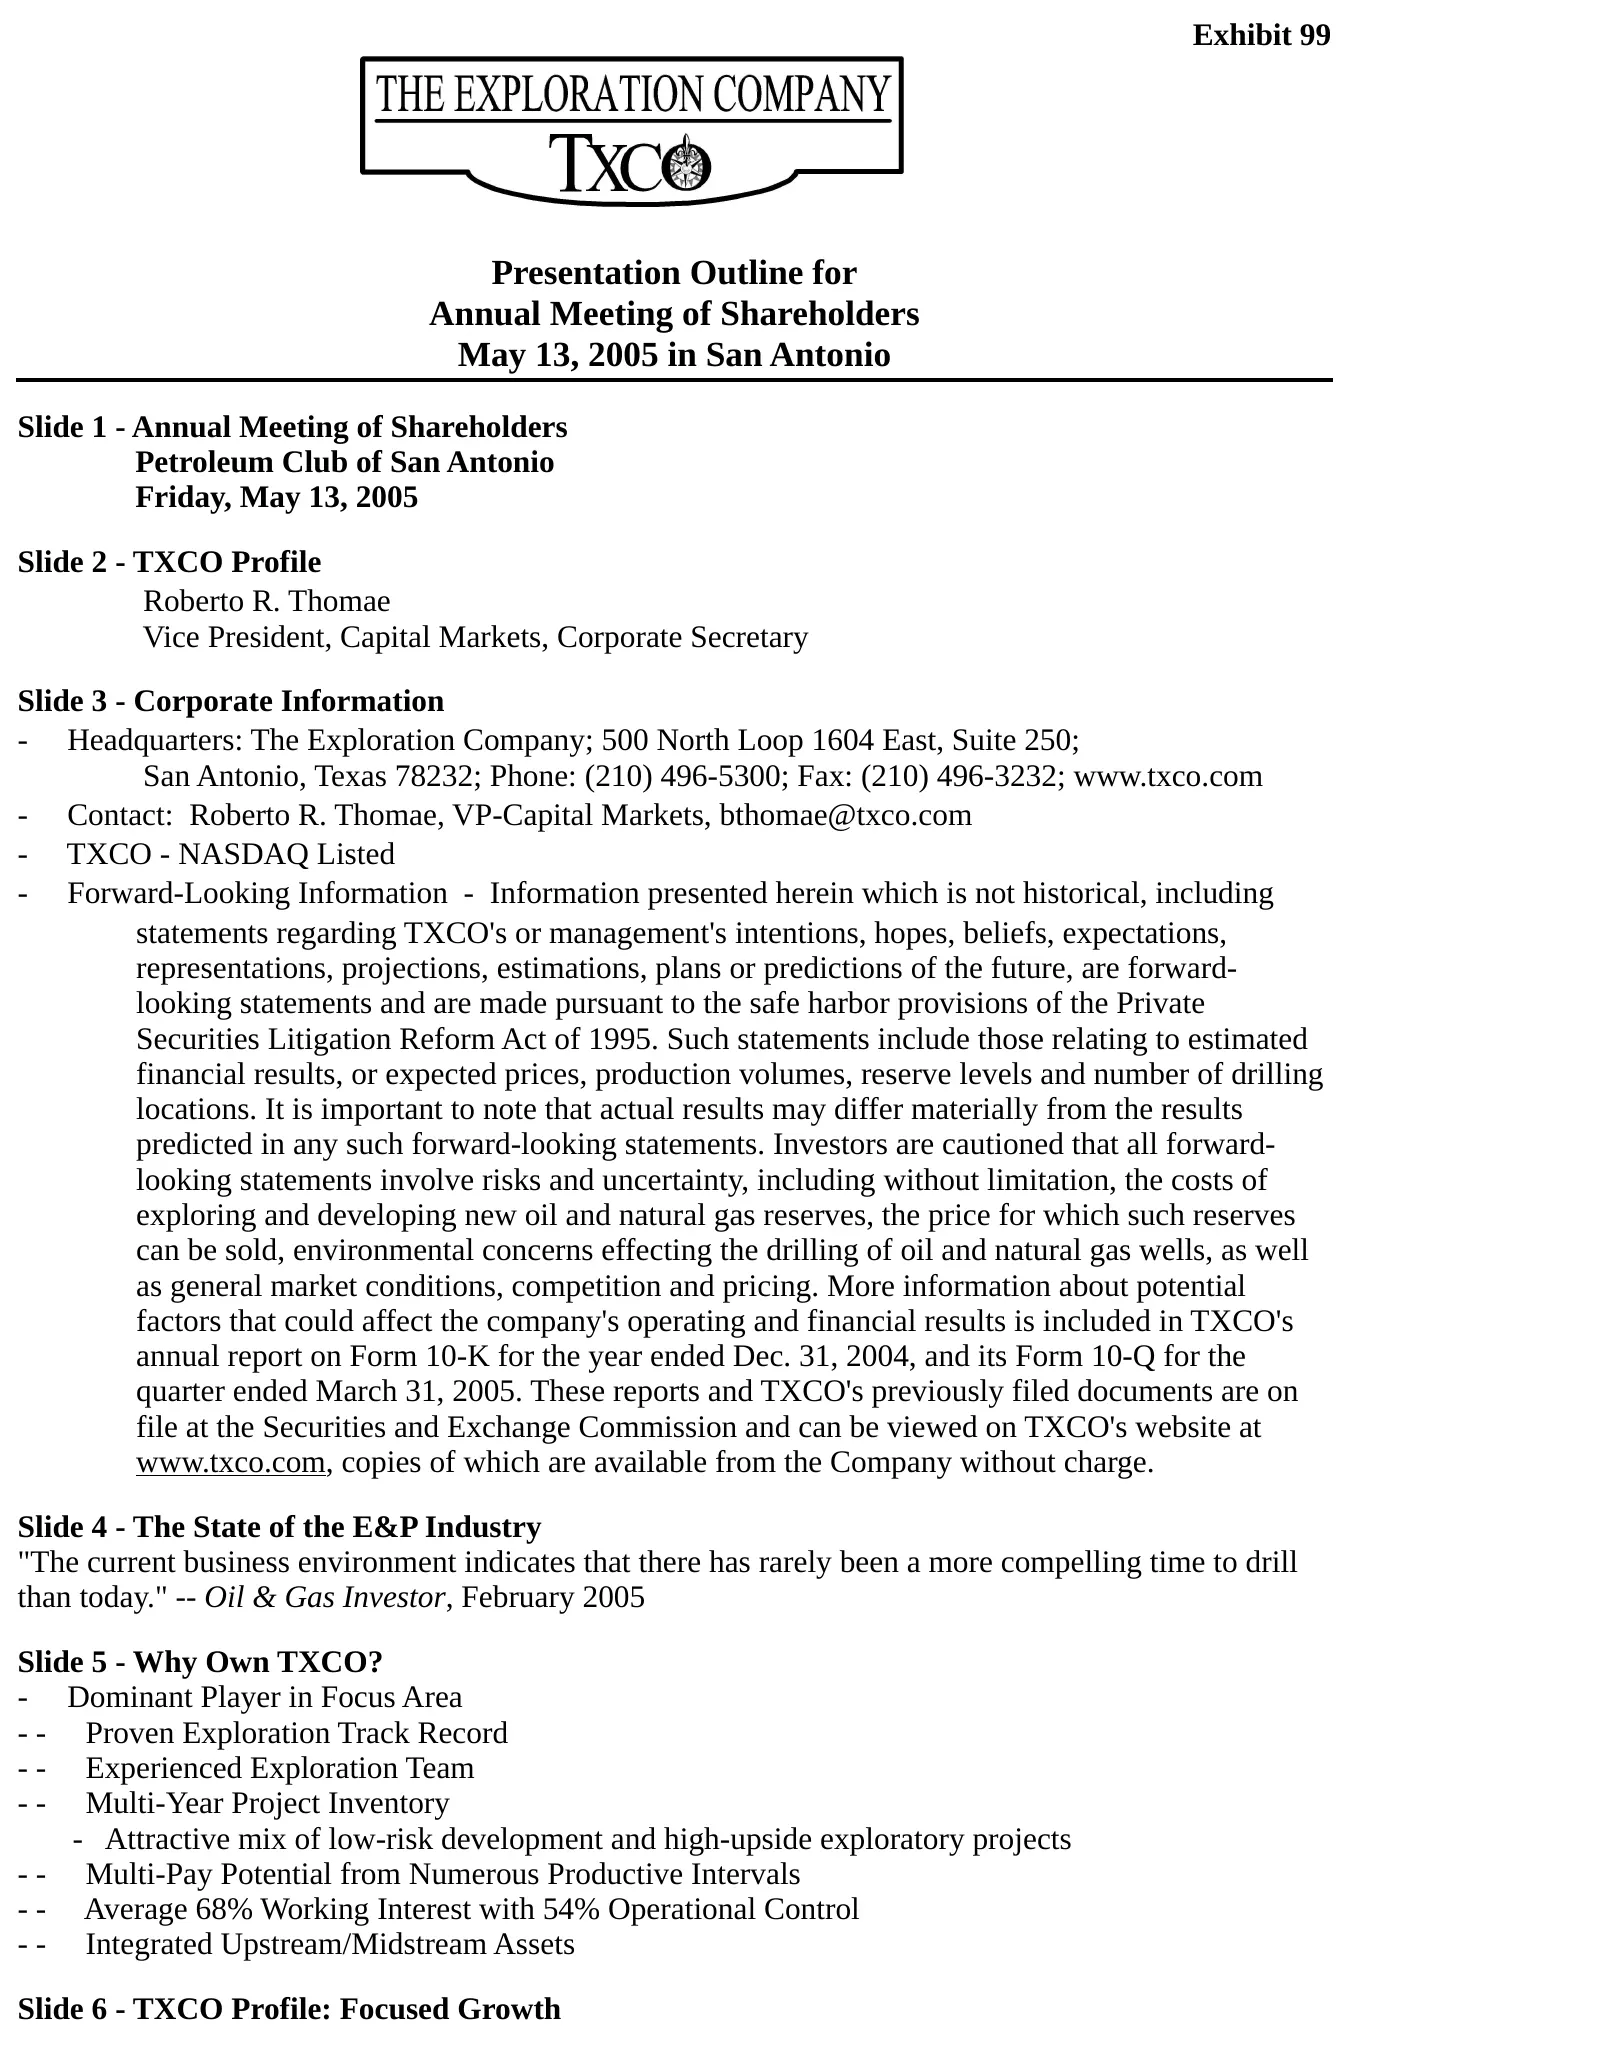
Slide 1: Presentation Outline for Annual Meeting of Shareholders
Exhibit 99 Presentation Outline for Annual Meeting of Shareholders May 13, 2005 in San Antonio Slide 1 - Annual Meeting of Shareholders Petroleum Club of San Antonio Friday, May 13, 2005 Slide 2 - TXCO Profile Roberto R. Thomae Vice President, Capital Markets, Corporate Secretary Slide 3 - Corporate
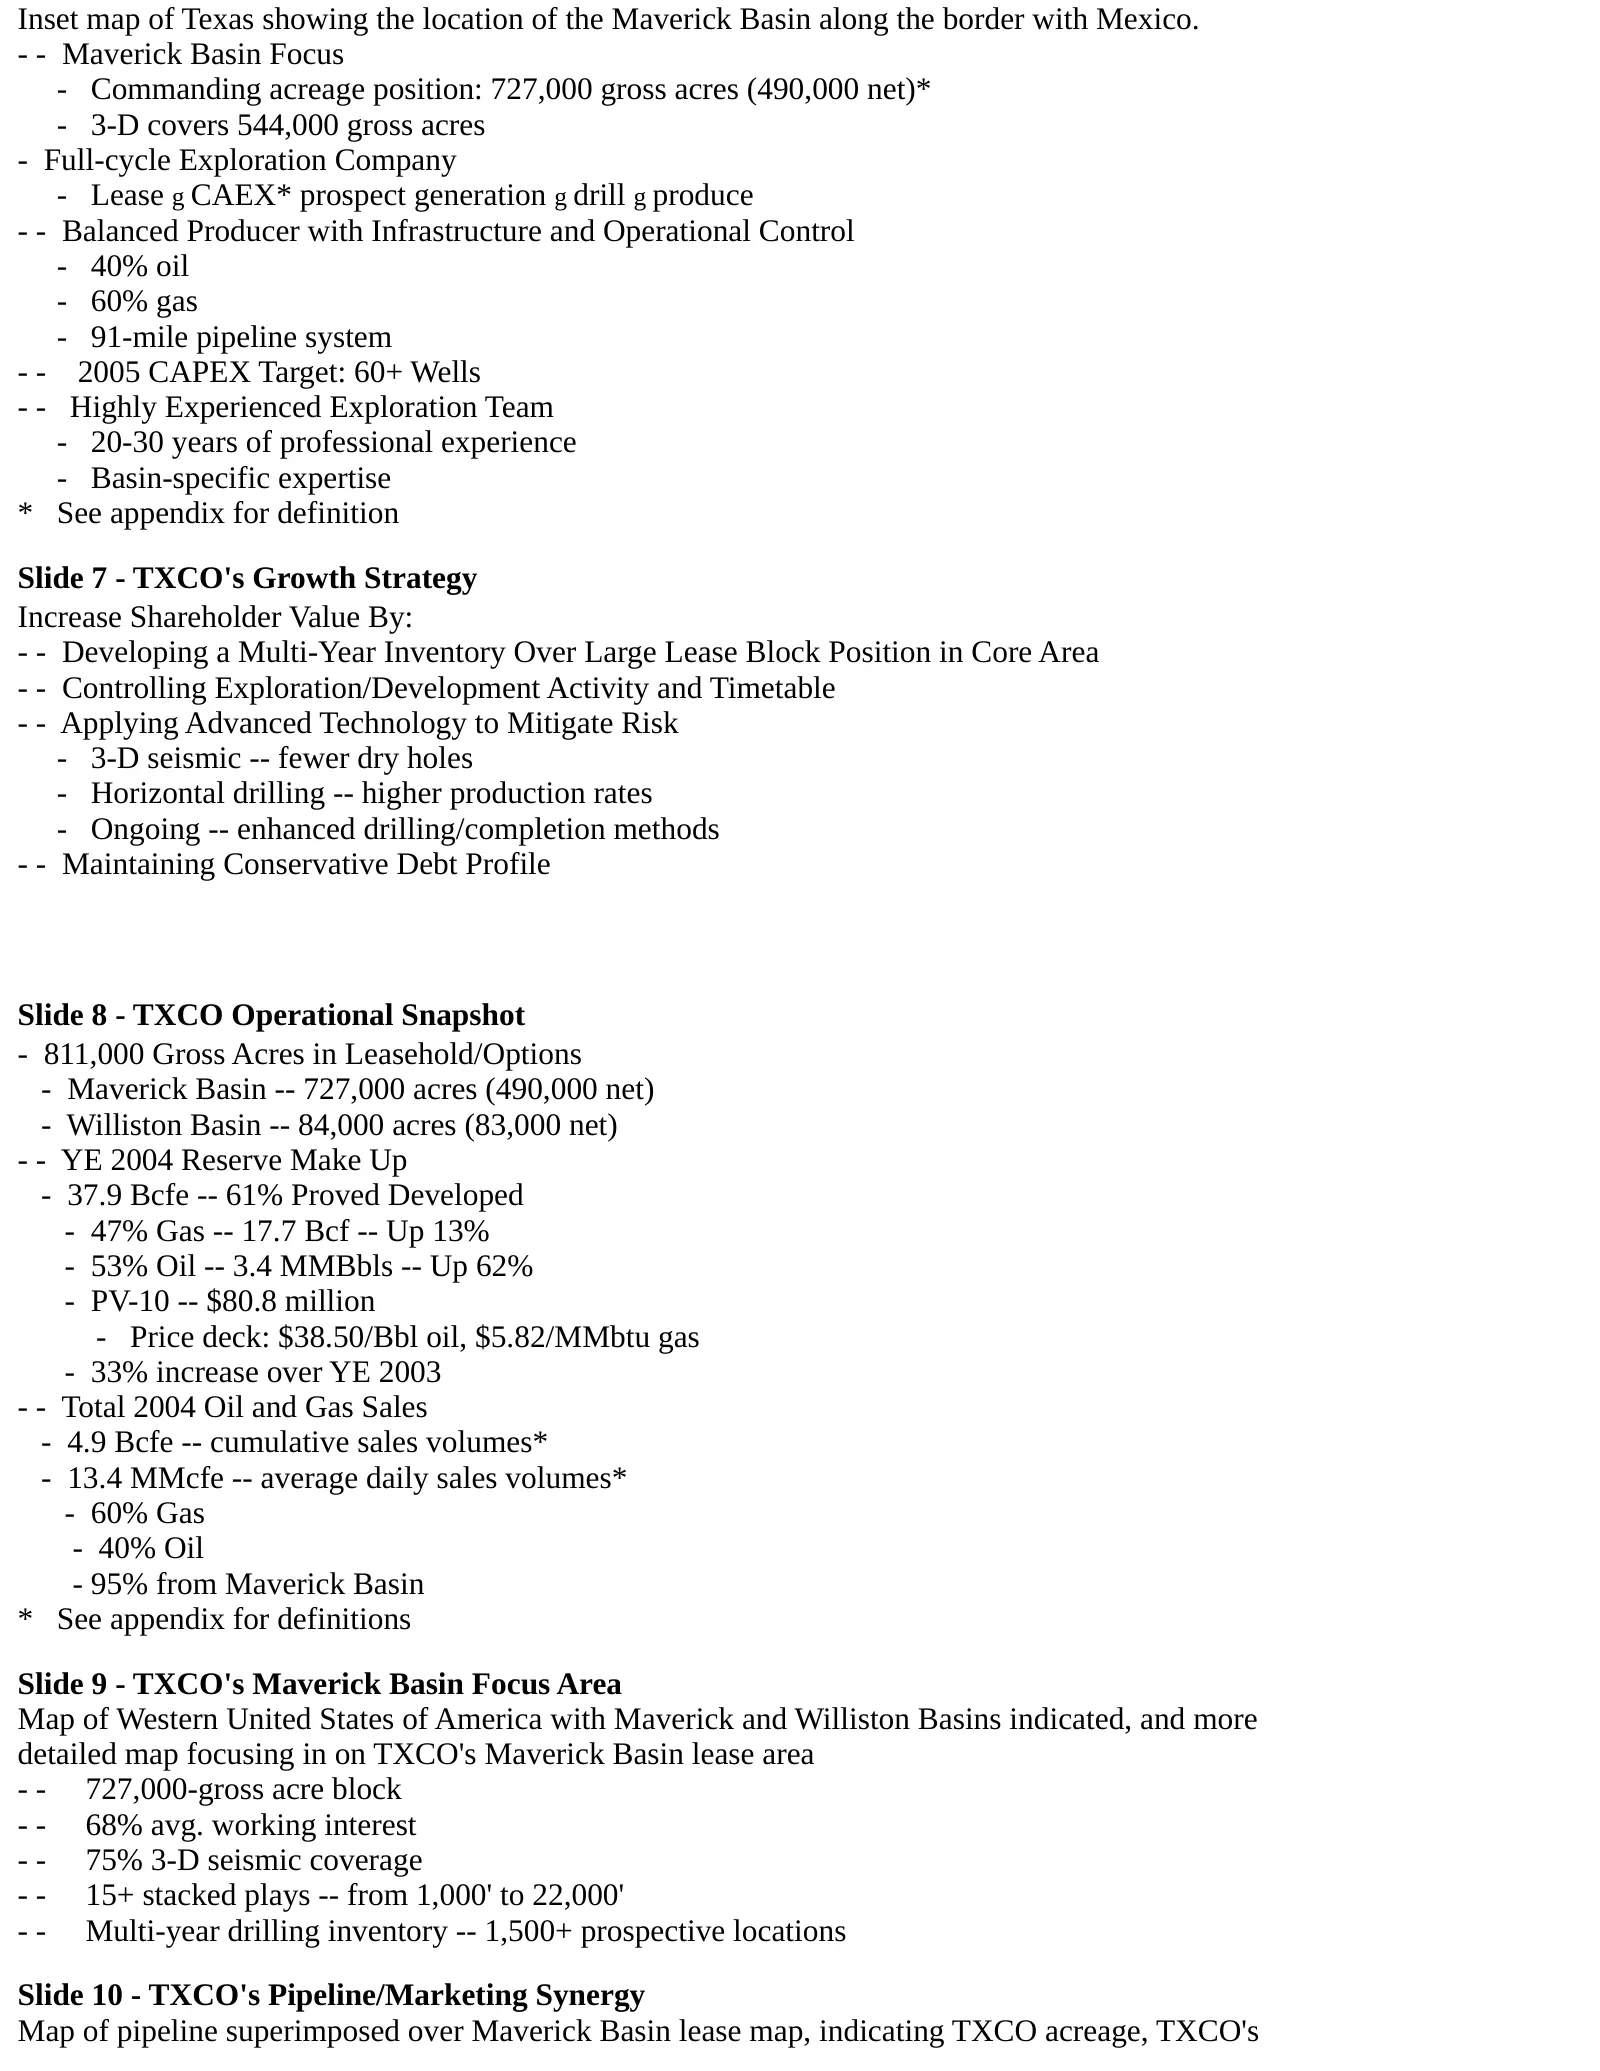
Slide 2: Maverick Basin Focus and TXCO Growth Strategy
Inset map of Texas showing the location of the Maverick Basin along the border with Mexico. - - Maverick Basin Focus - Commanding acreage position: 727,000 gross acres (490,000 net)* - 3-D covers 544,000 gross acres - Full-cycle Exploration Company - Lease g CAEX* prospect generation g drill g produ
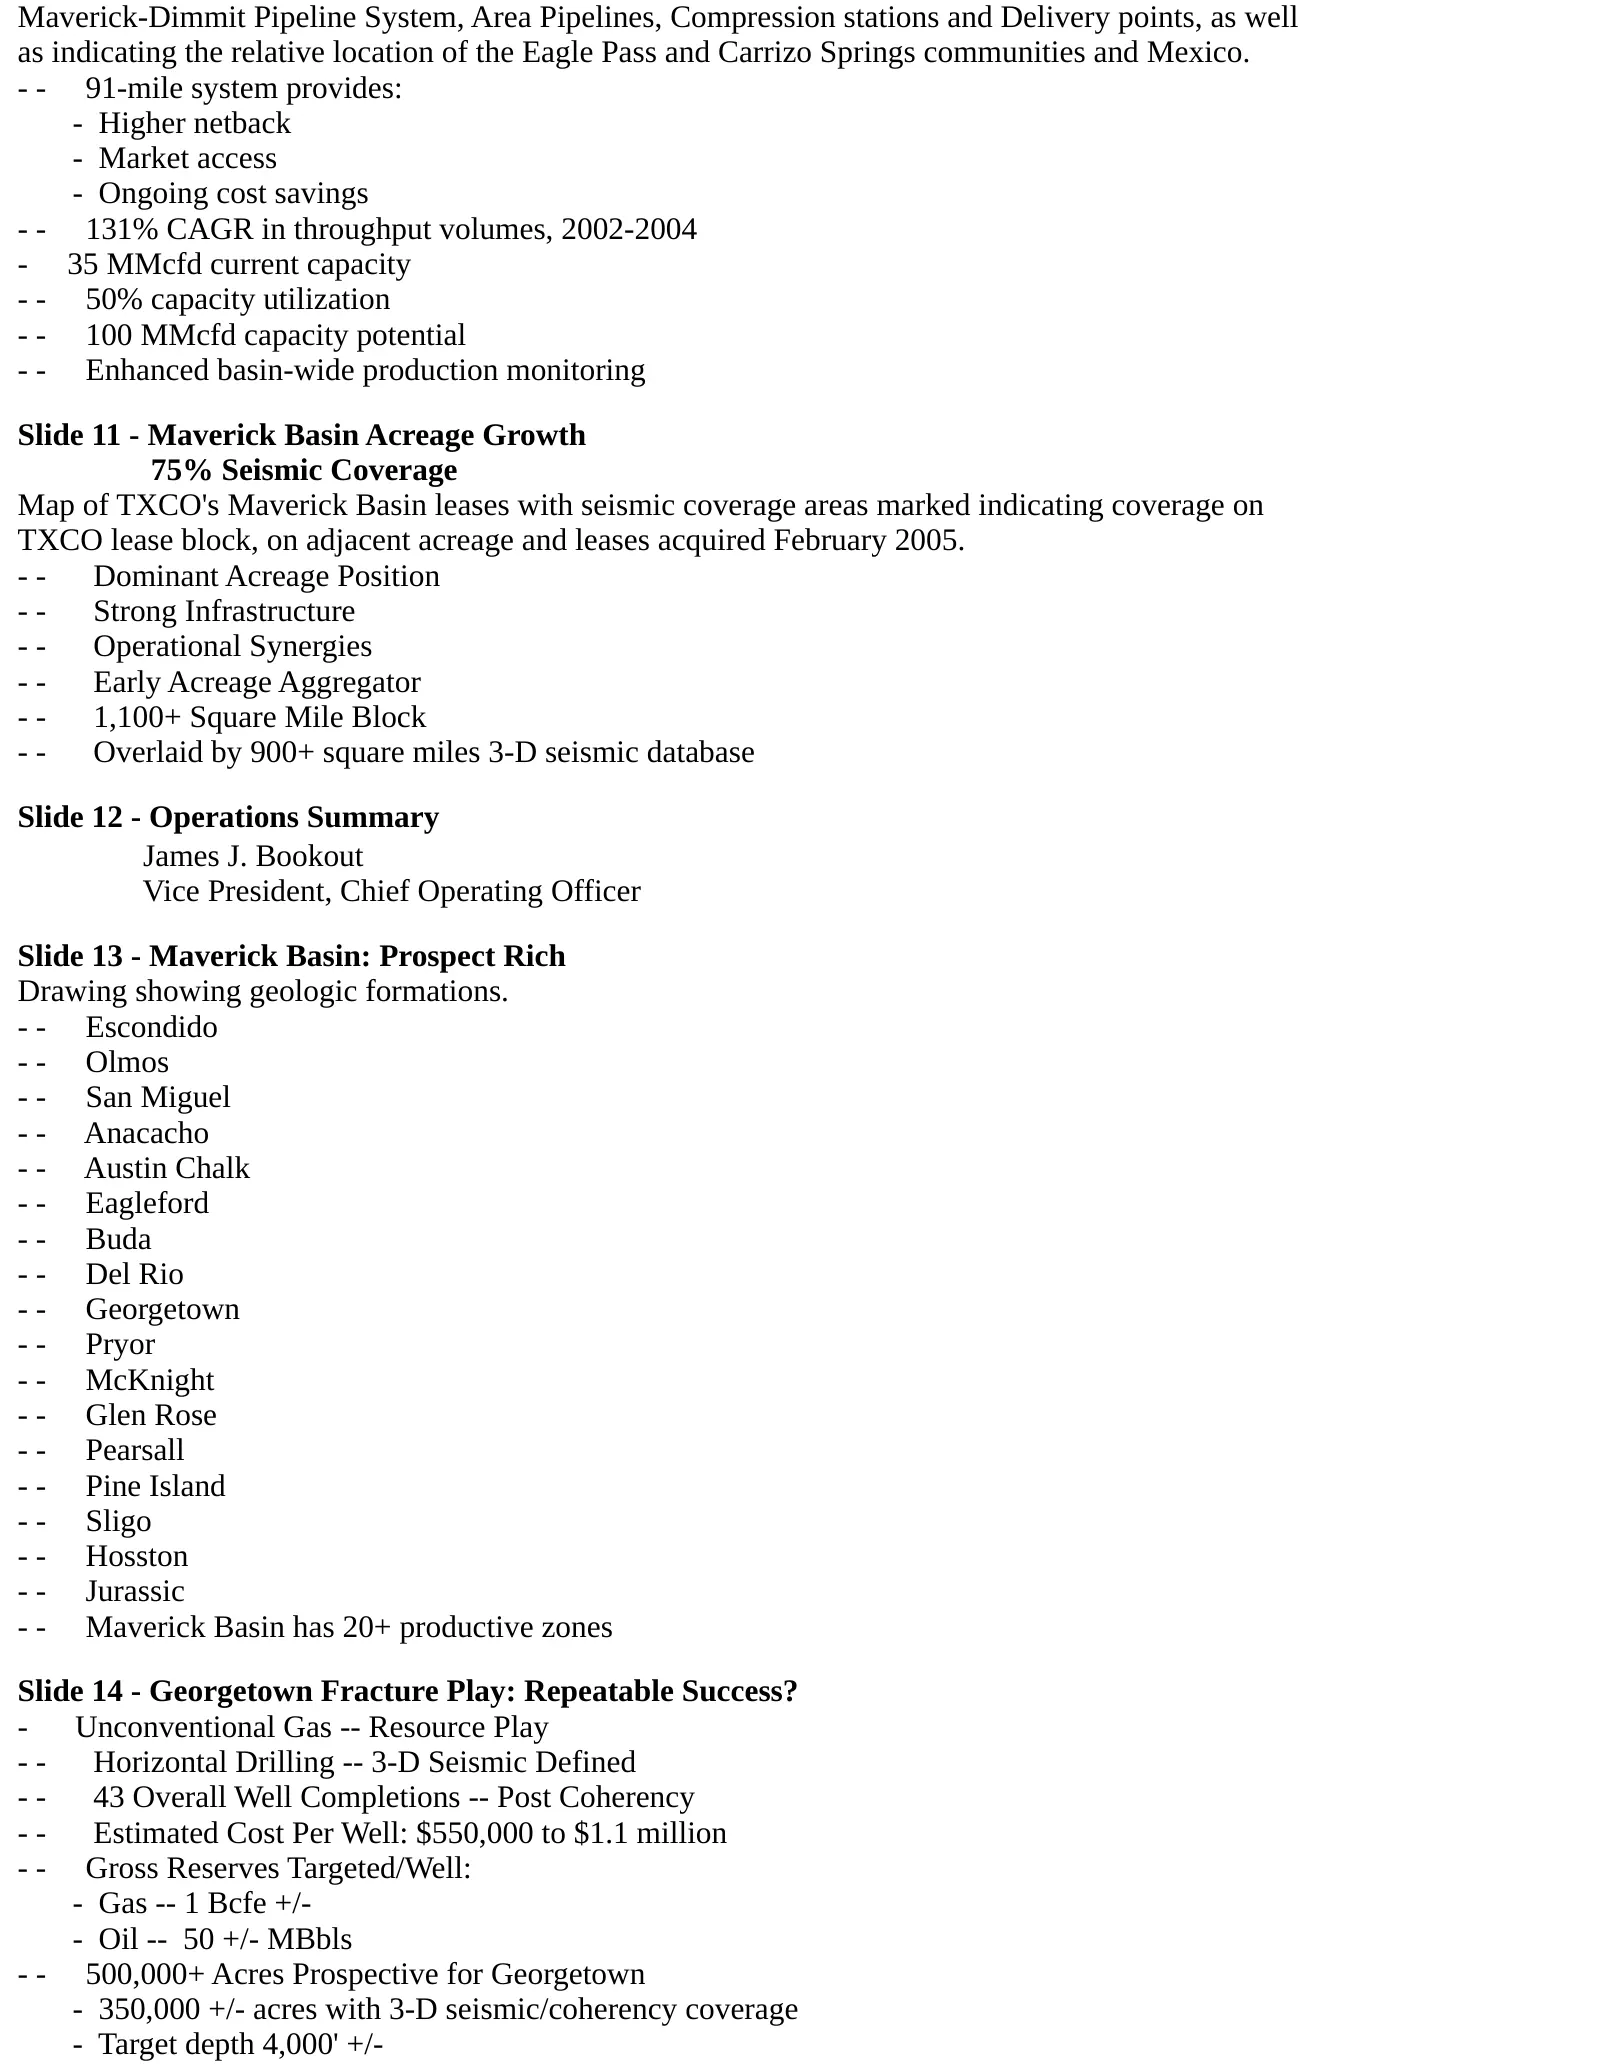
Slide 3: Maverick-Dimmit Pipeline System and Acreage Growth
Maverick-Dimmit Pipeline System, Area Pipelines, Compression stations and Delivery points, as well as indicating the relative location of the Eagle Pass and Carrizo Springs communities and Mexico. - - 91-mile system provides: - Higher netback - Market access - Ongoing cost savings - - 131% CAGR in t
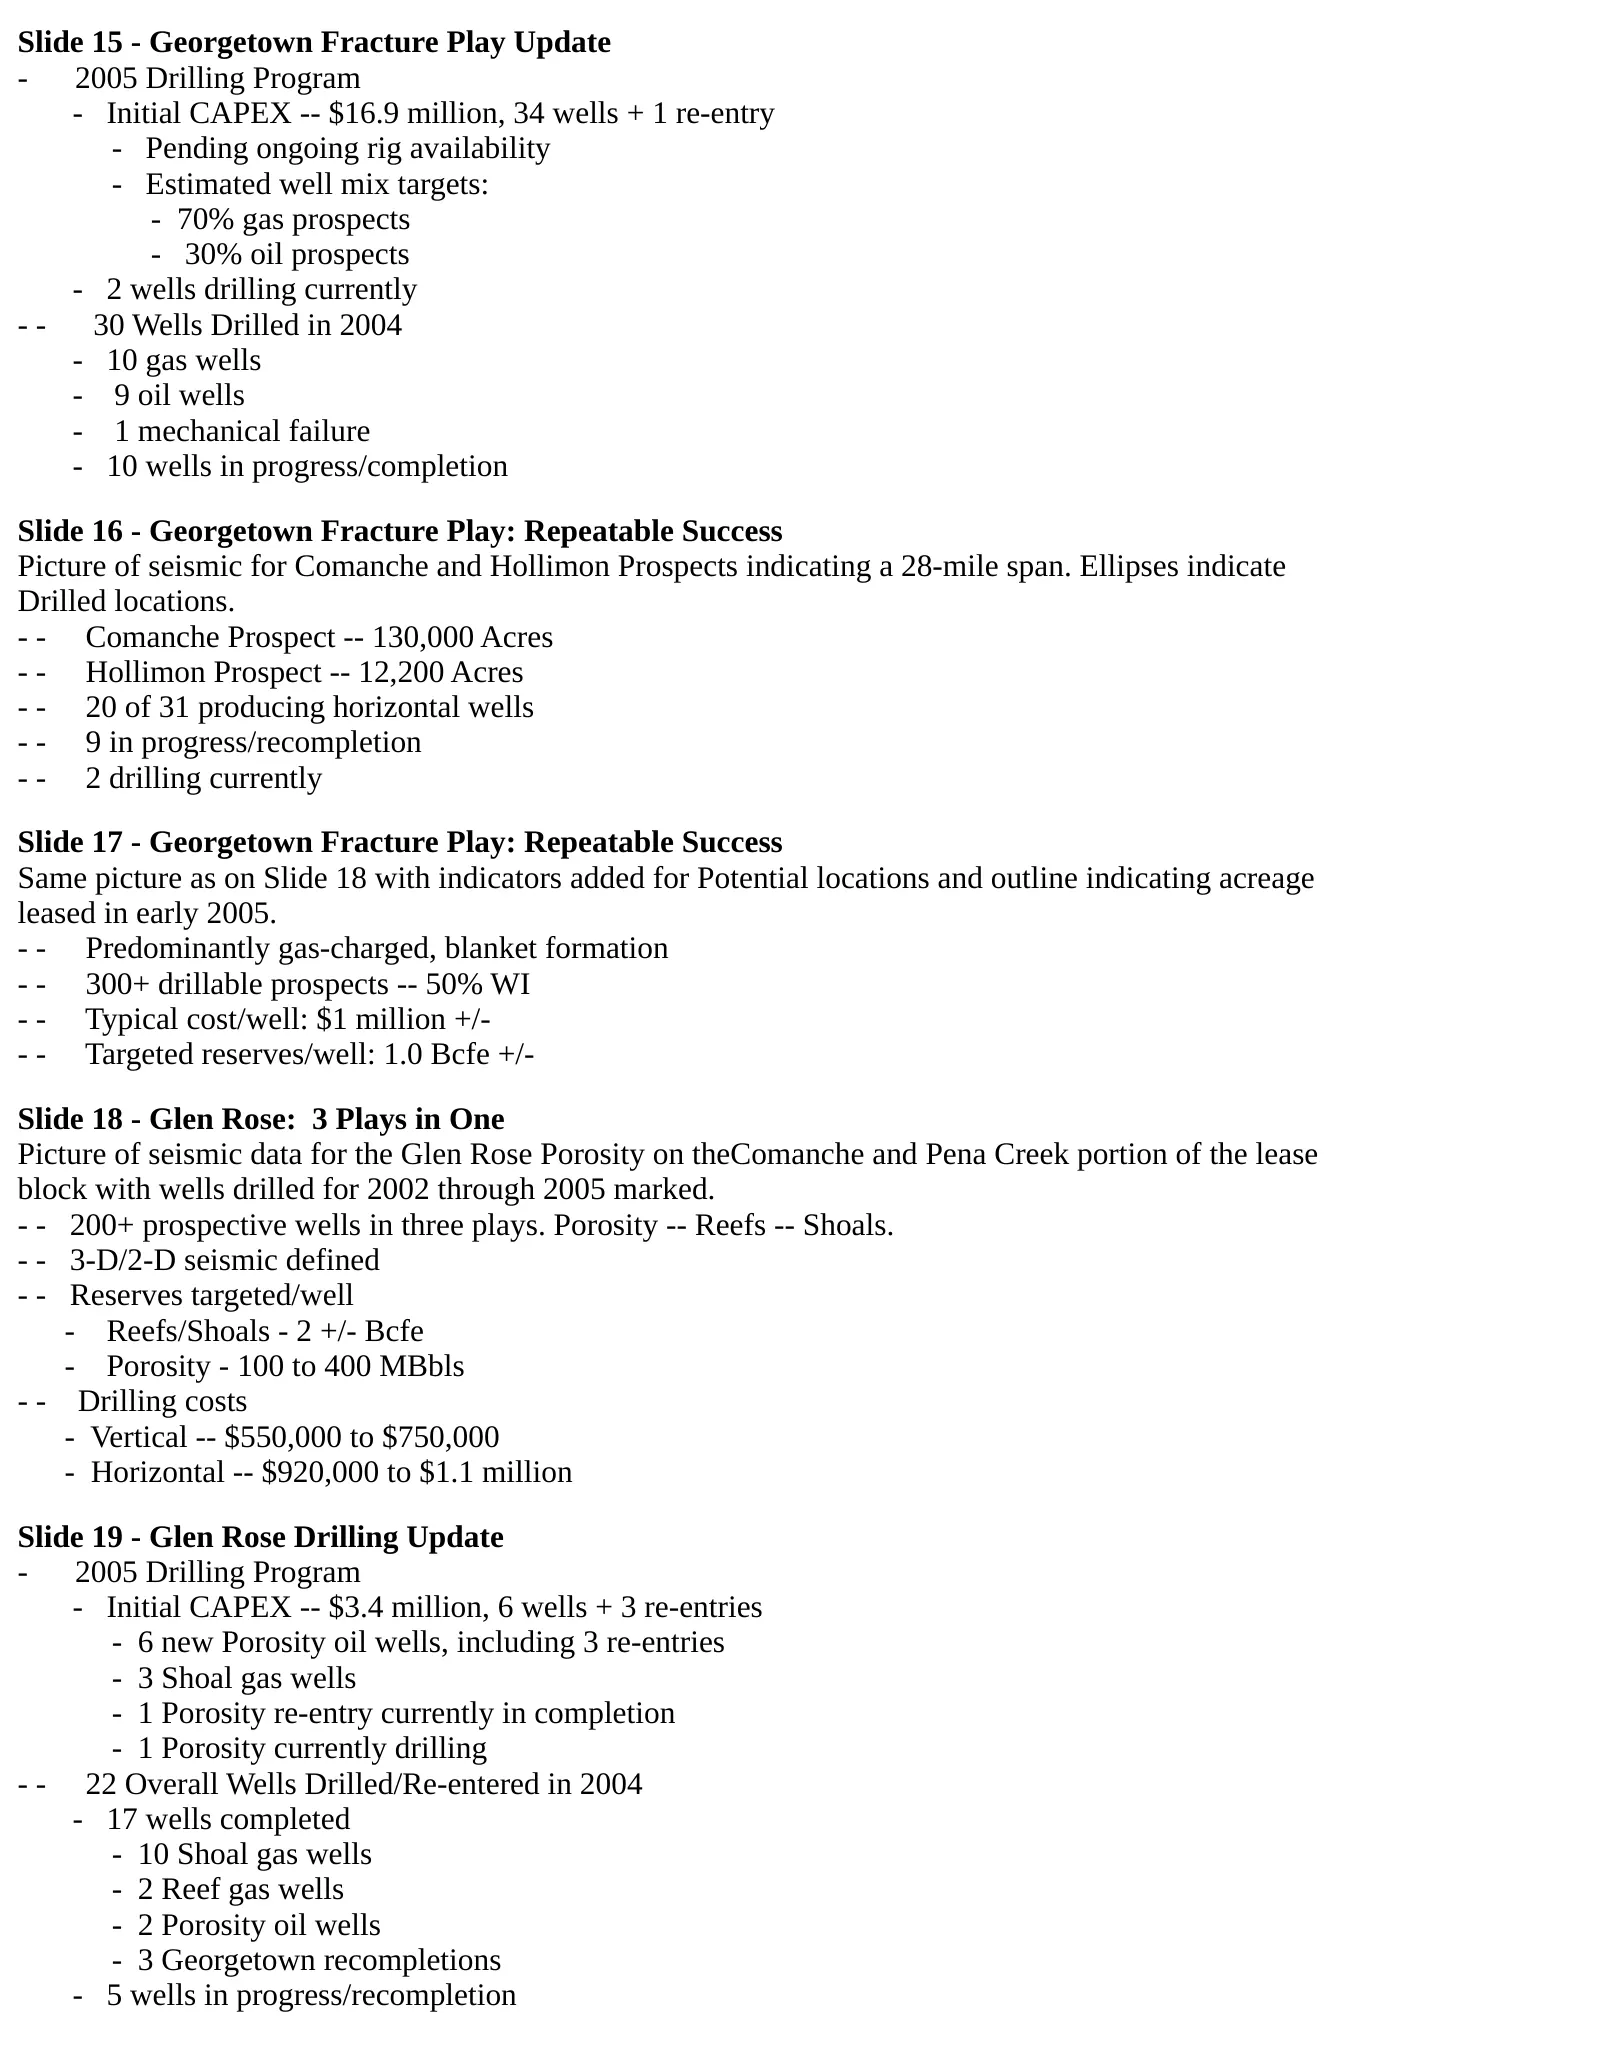
Slide 4: Georgetown Fracture Play Update - 2005 Drilling Program
Slide 15 - Georgetown Fracture Play Update - 2005 Drilling Program - Initial CAPEX -- $16.9 million, 34 wells + 1 re-entry - Pending ongoing rig availability - Estimated well mix targets: - 70% gas prospects - 30% oil prospects - 2 wells drilling currently - - 30 Wells Drilled in 2004 - 10 gas wells
Slide 5: Pearsall Shale Gas Play
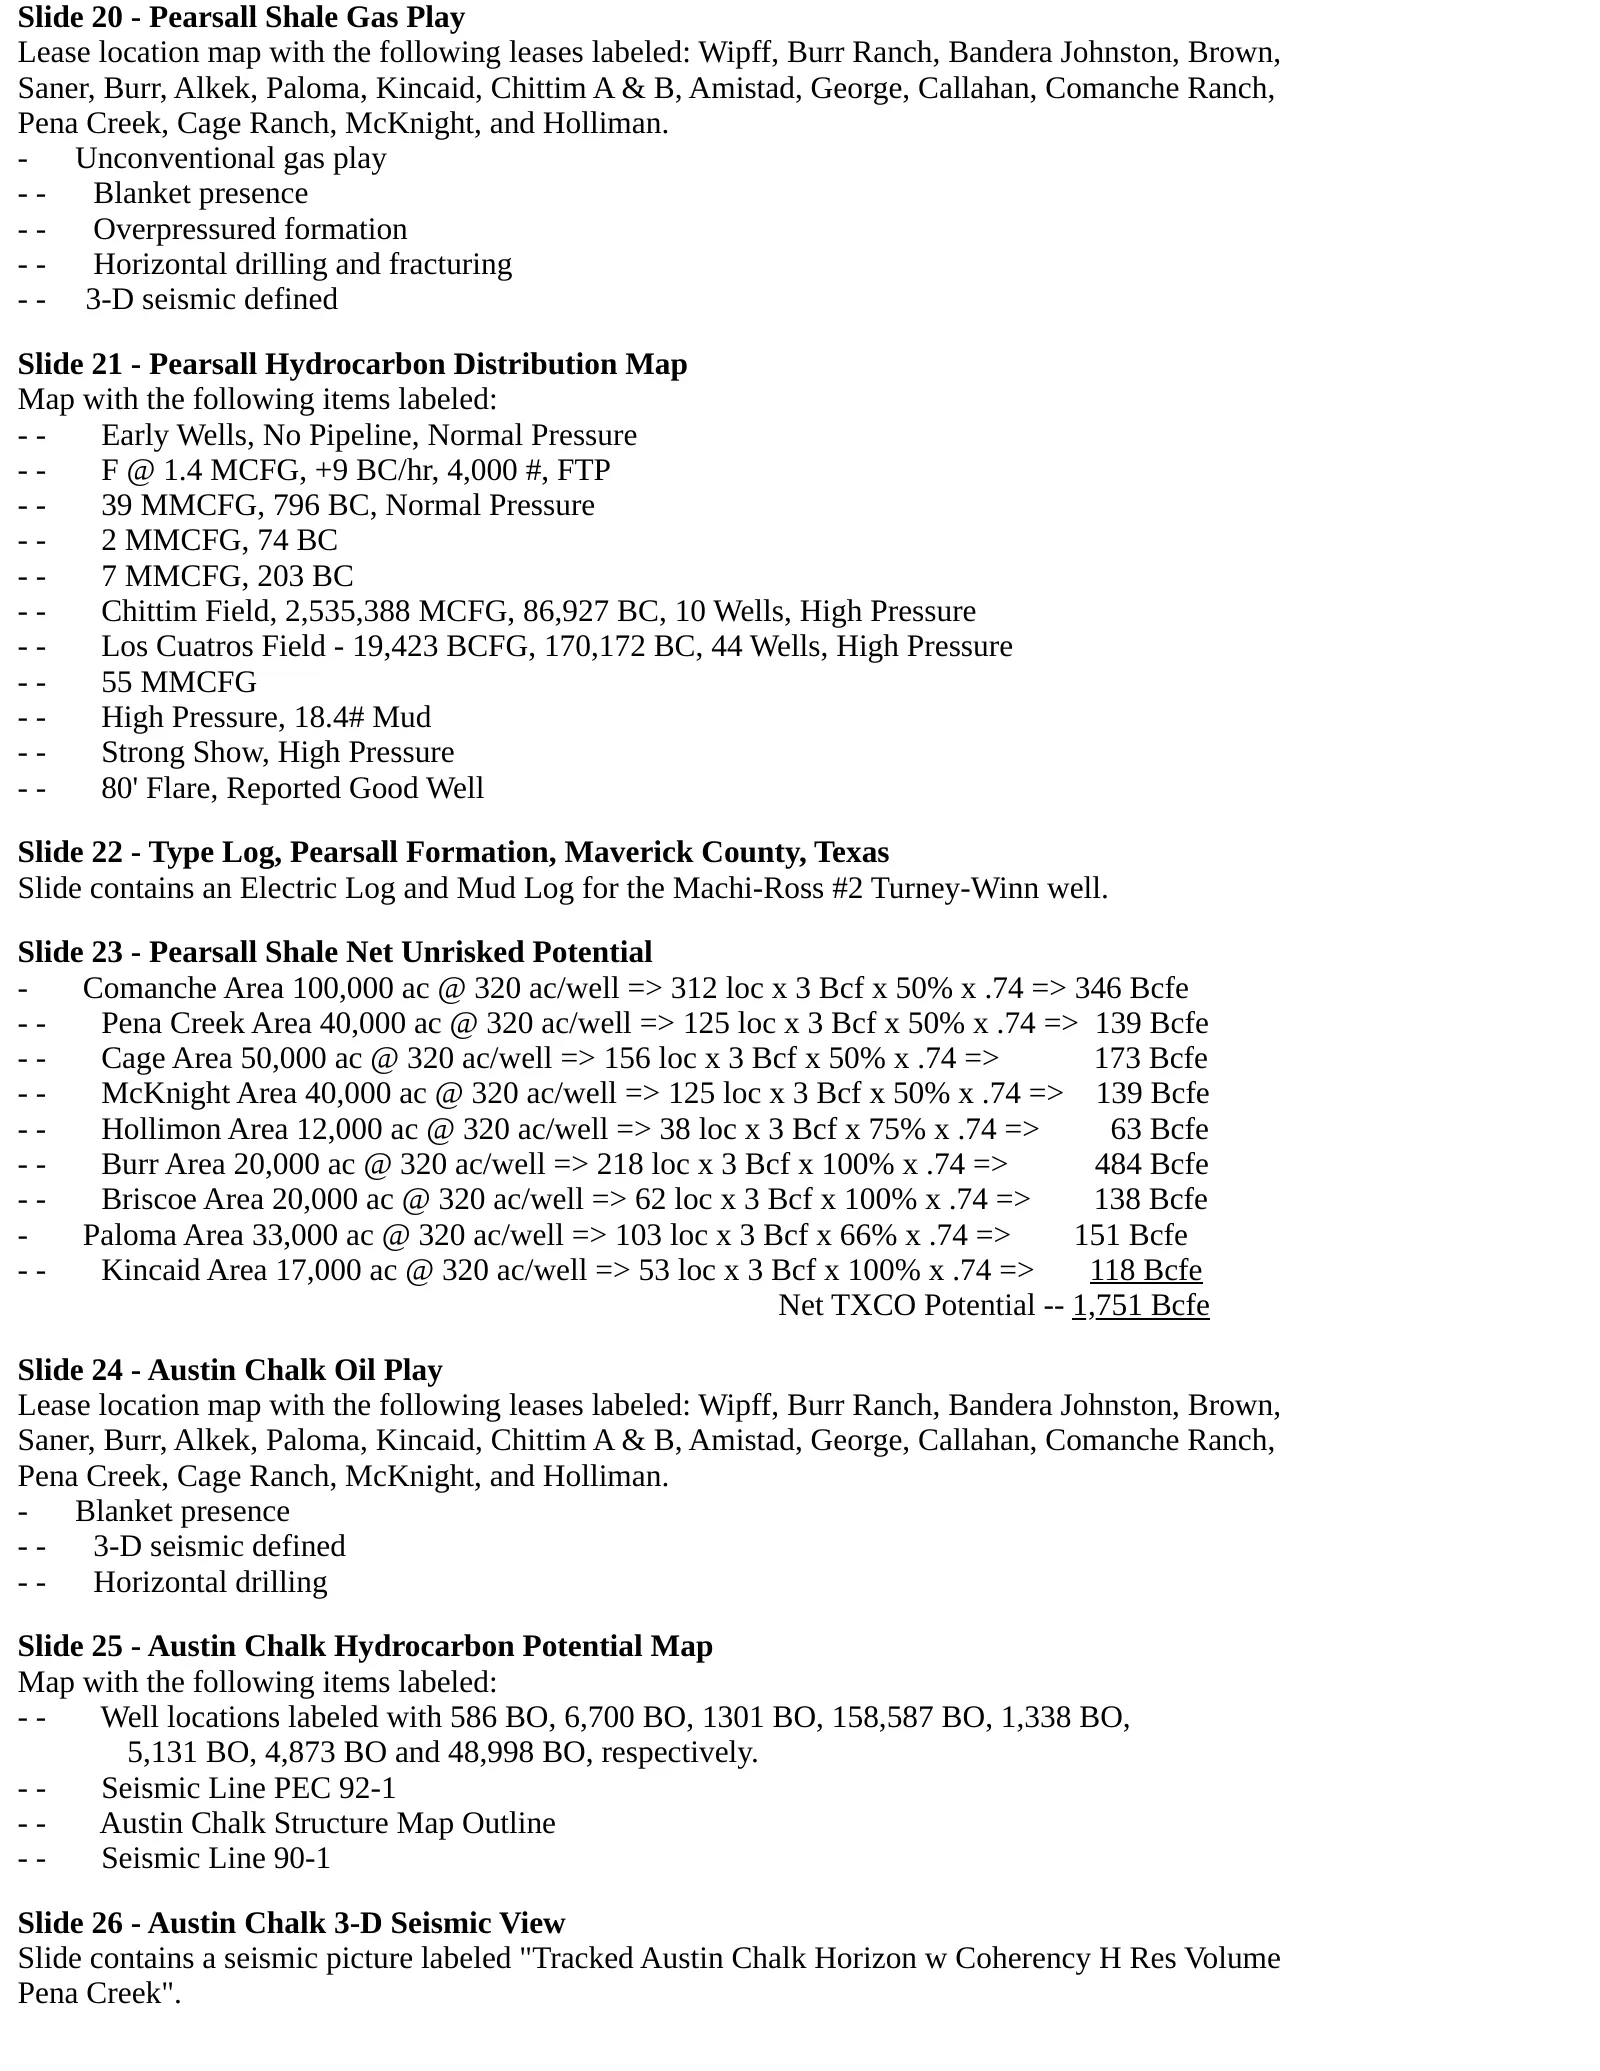
Slide 20 - Pearsall Shale Gas Play Lease location map with the following leases labeled: Wipff, Burr Ranch, Bandera Johnston, Brown, Saner, Burr, Alkek, Paloma, Kincaid, Chittim A & B, Amistad, George, Callahan, Comanche Ranch, Pena Creek, Cage Ranch, McKnight, and Holliman. - Unconventional gas pla
Slide 6: Austin Chalk 3-D Seismic Cross Section and Net Unrisked Potential
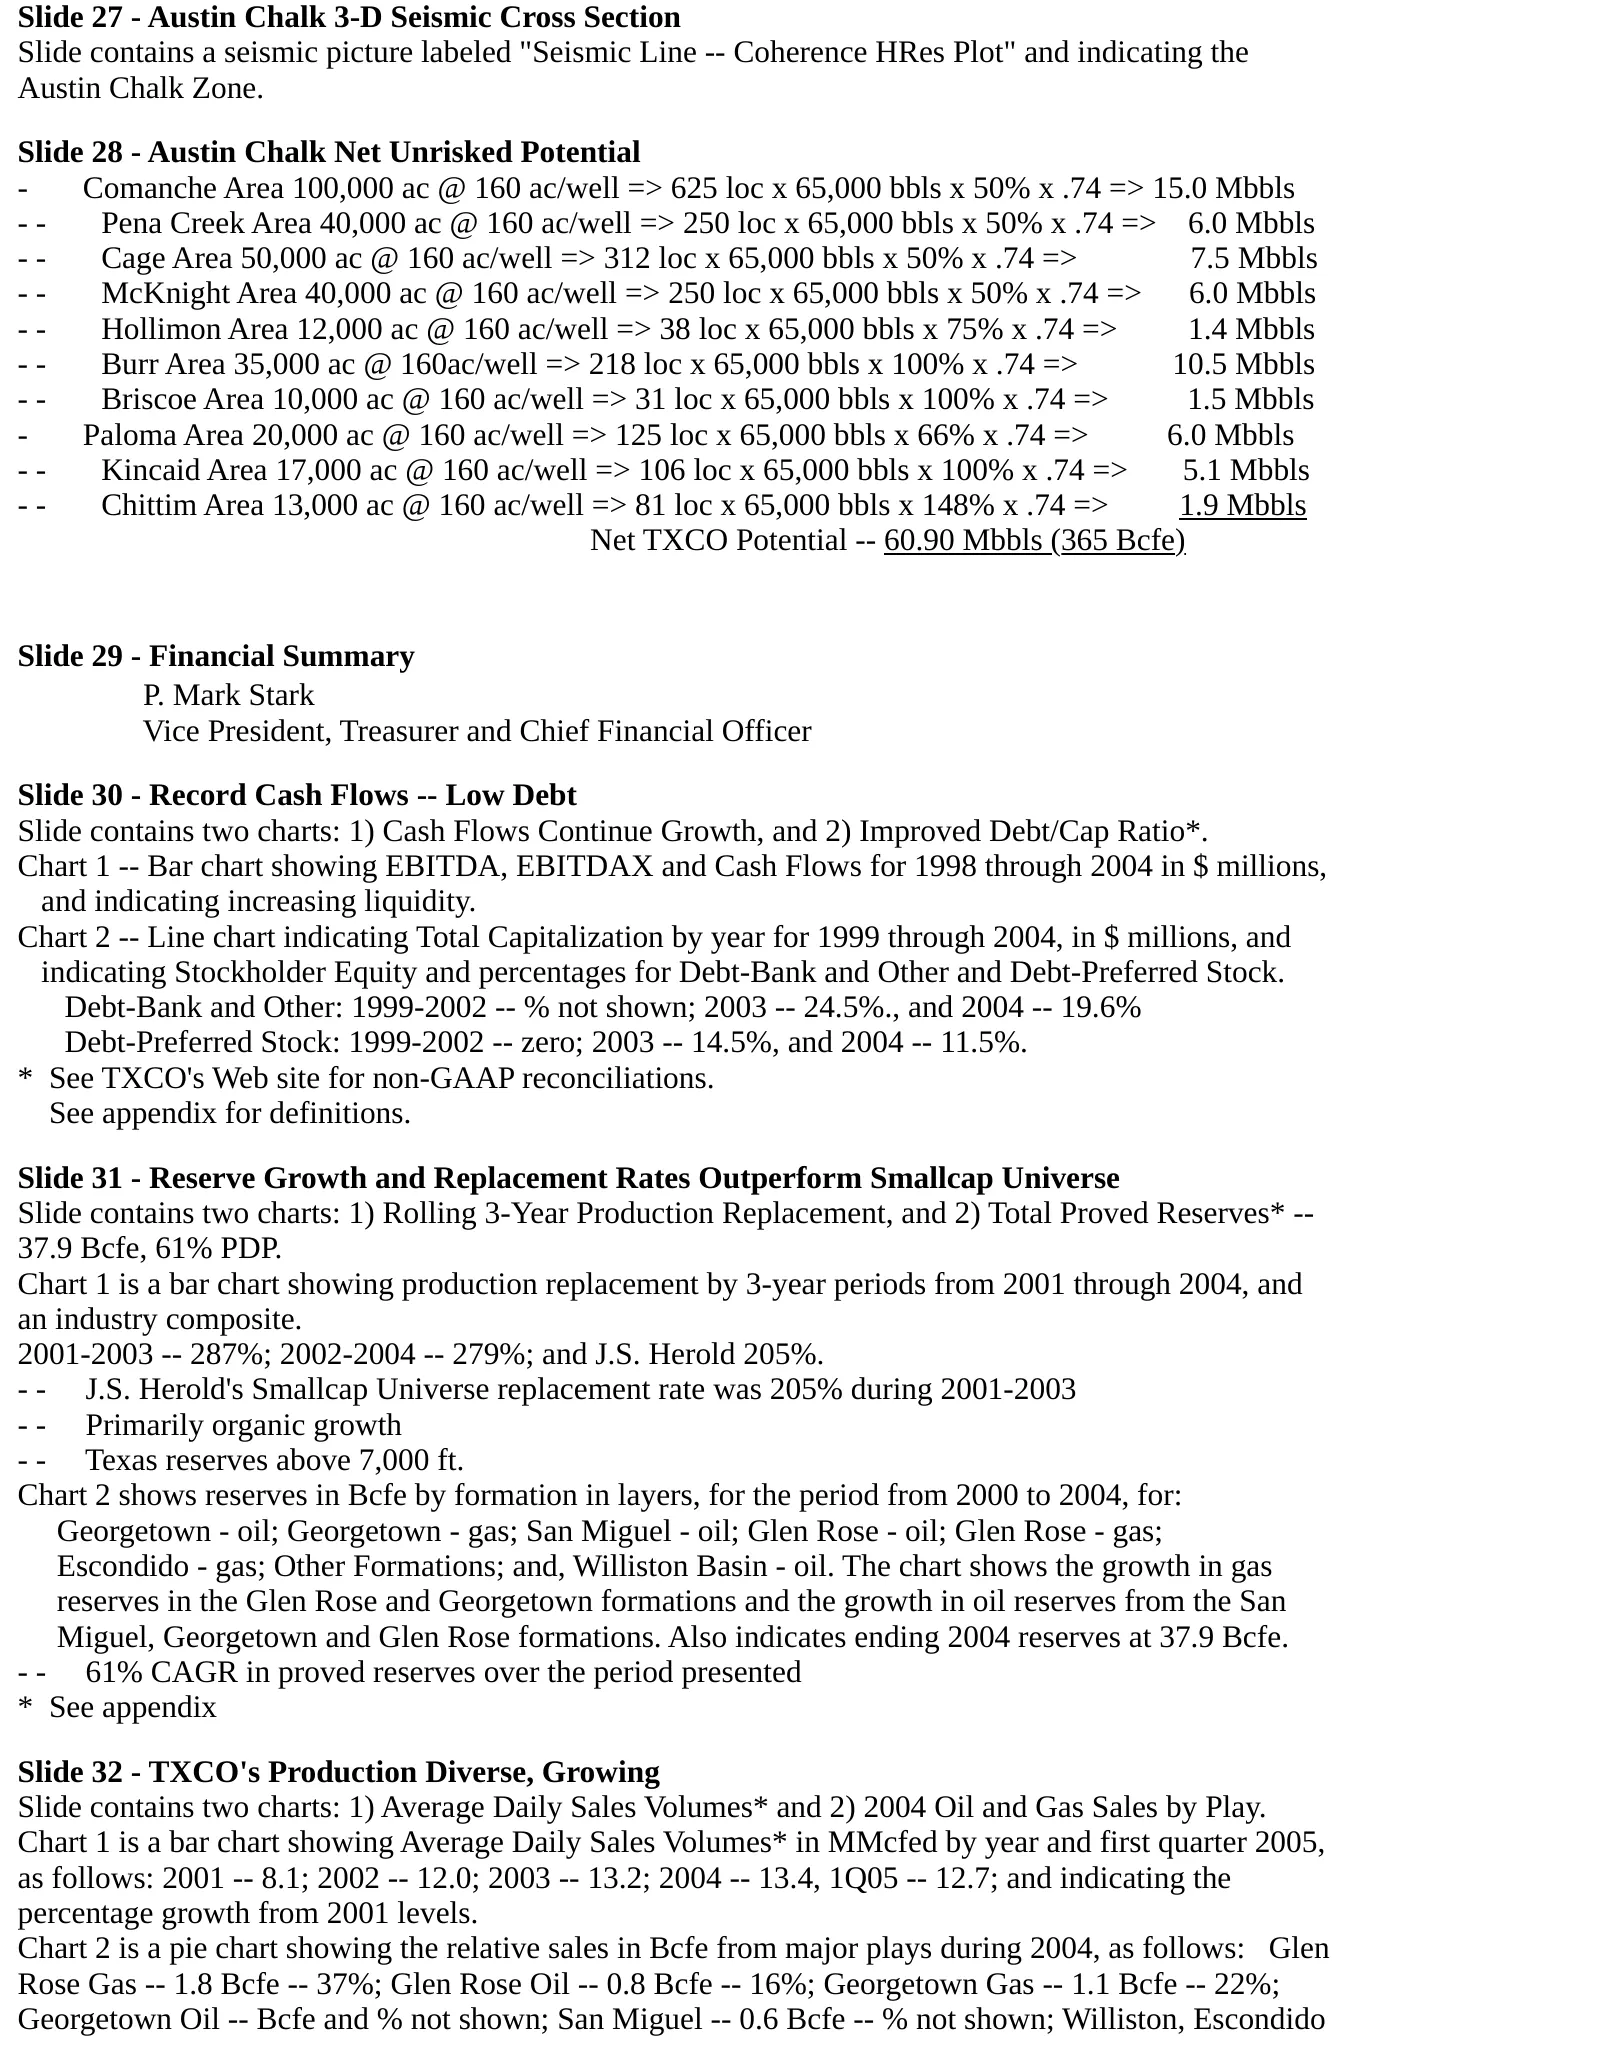
Slide 27 - Austin Chalk 3-D Seismic Cross Section Slide contains a seismic picture labeled "Seismic Line -- Coherence HRes Plot" and indicating the Austin Chalk Zone. Slide 28 - Austin Chalk Net Unrisked Potential - Comanche Area 100,000 ac @ 160 ac/well => 625 loc x 65,000 bbls x 50% x .74 => 15.0
Slide 7: 2005 CAPEX Guidance: Multi-Play, Multi-Pay
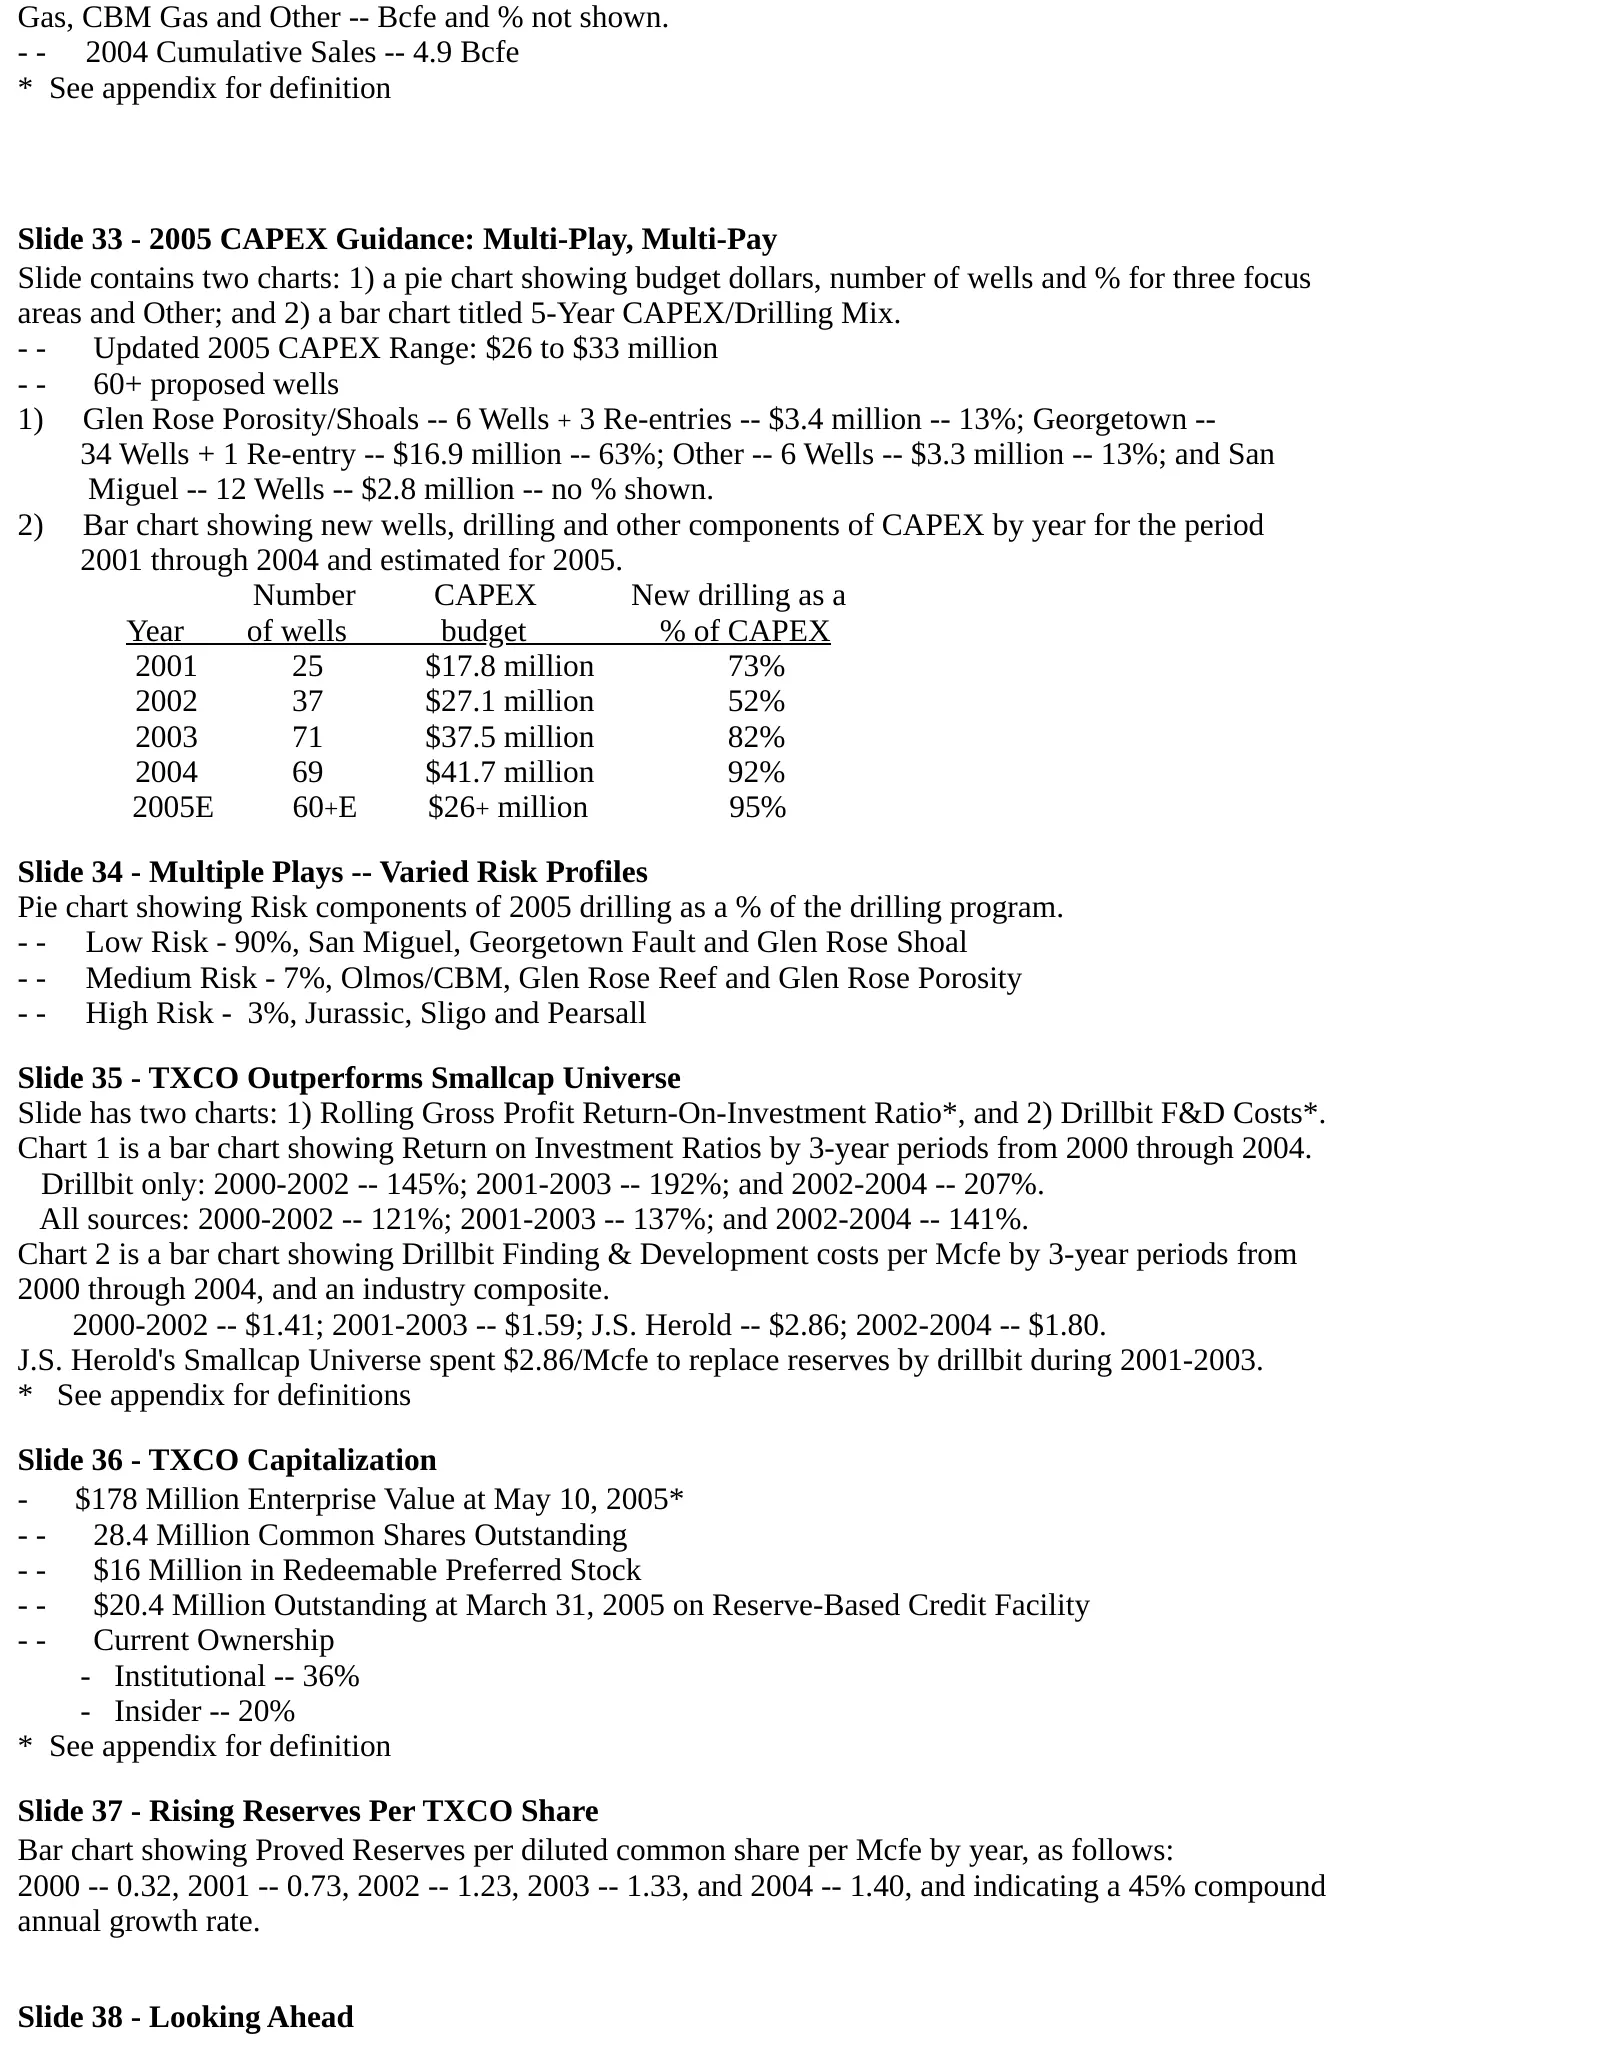
Gas, CBM Gas and Other -- Bcfe and % not shown. - - 2004 Cumulative Sales -- 4.9 Bcfe * See appendix for definition Slide 33 - 2005 CAPEX Guidance: Multi-Play, Multi-Pay Slide contains two charts: 1) a pie chart showing budget dollars, number of wells and % for three focus areas and Other; and 2) a
Slide 8: 4-Year Comparative Stock Performance
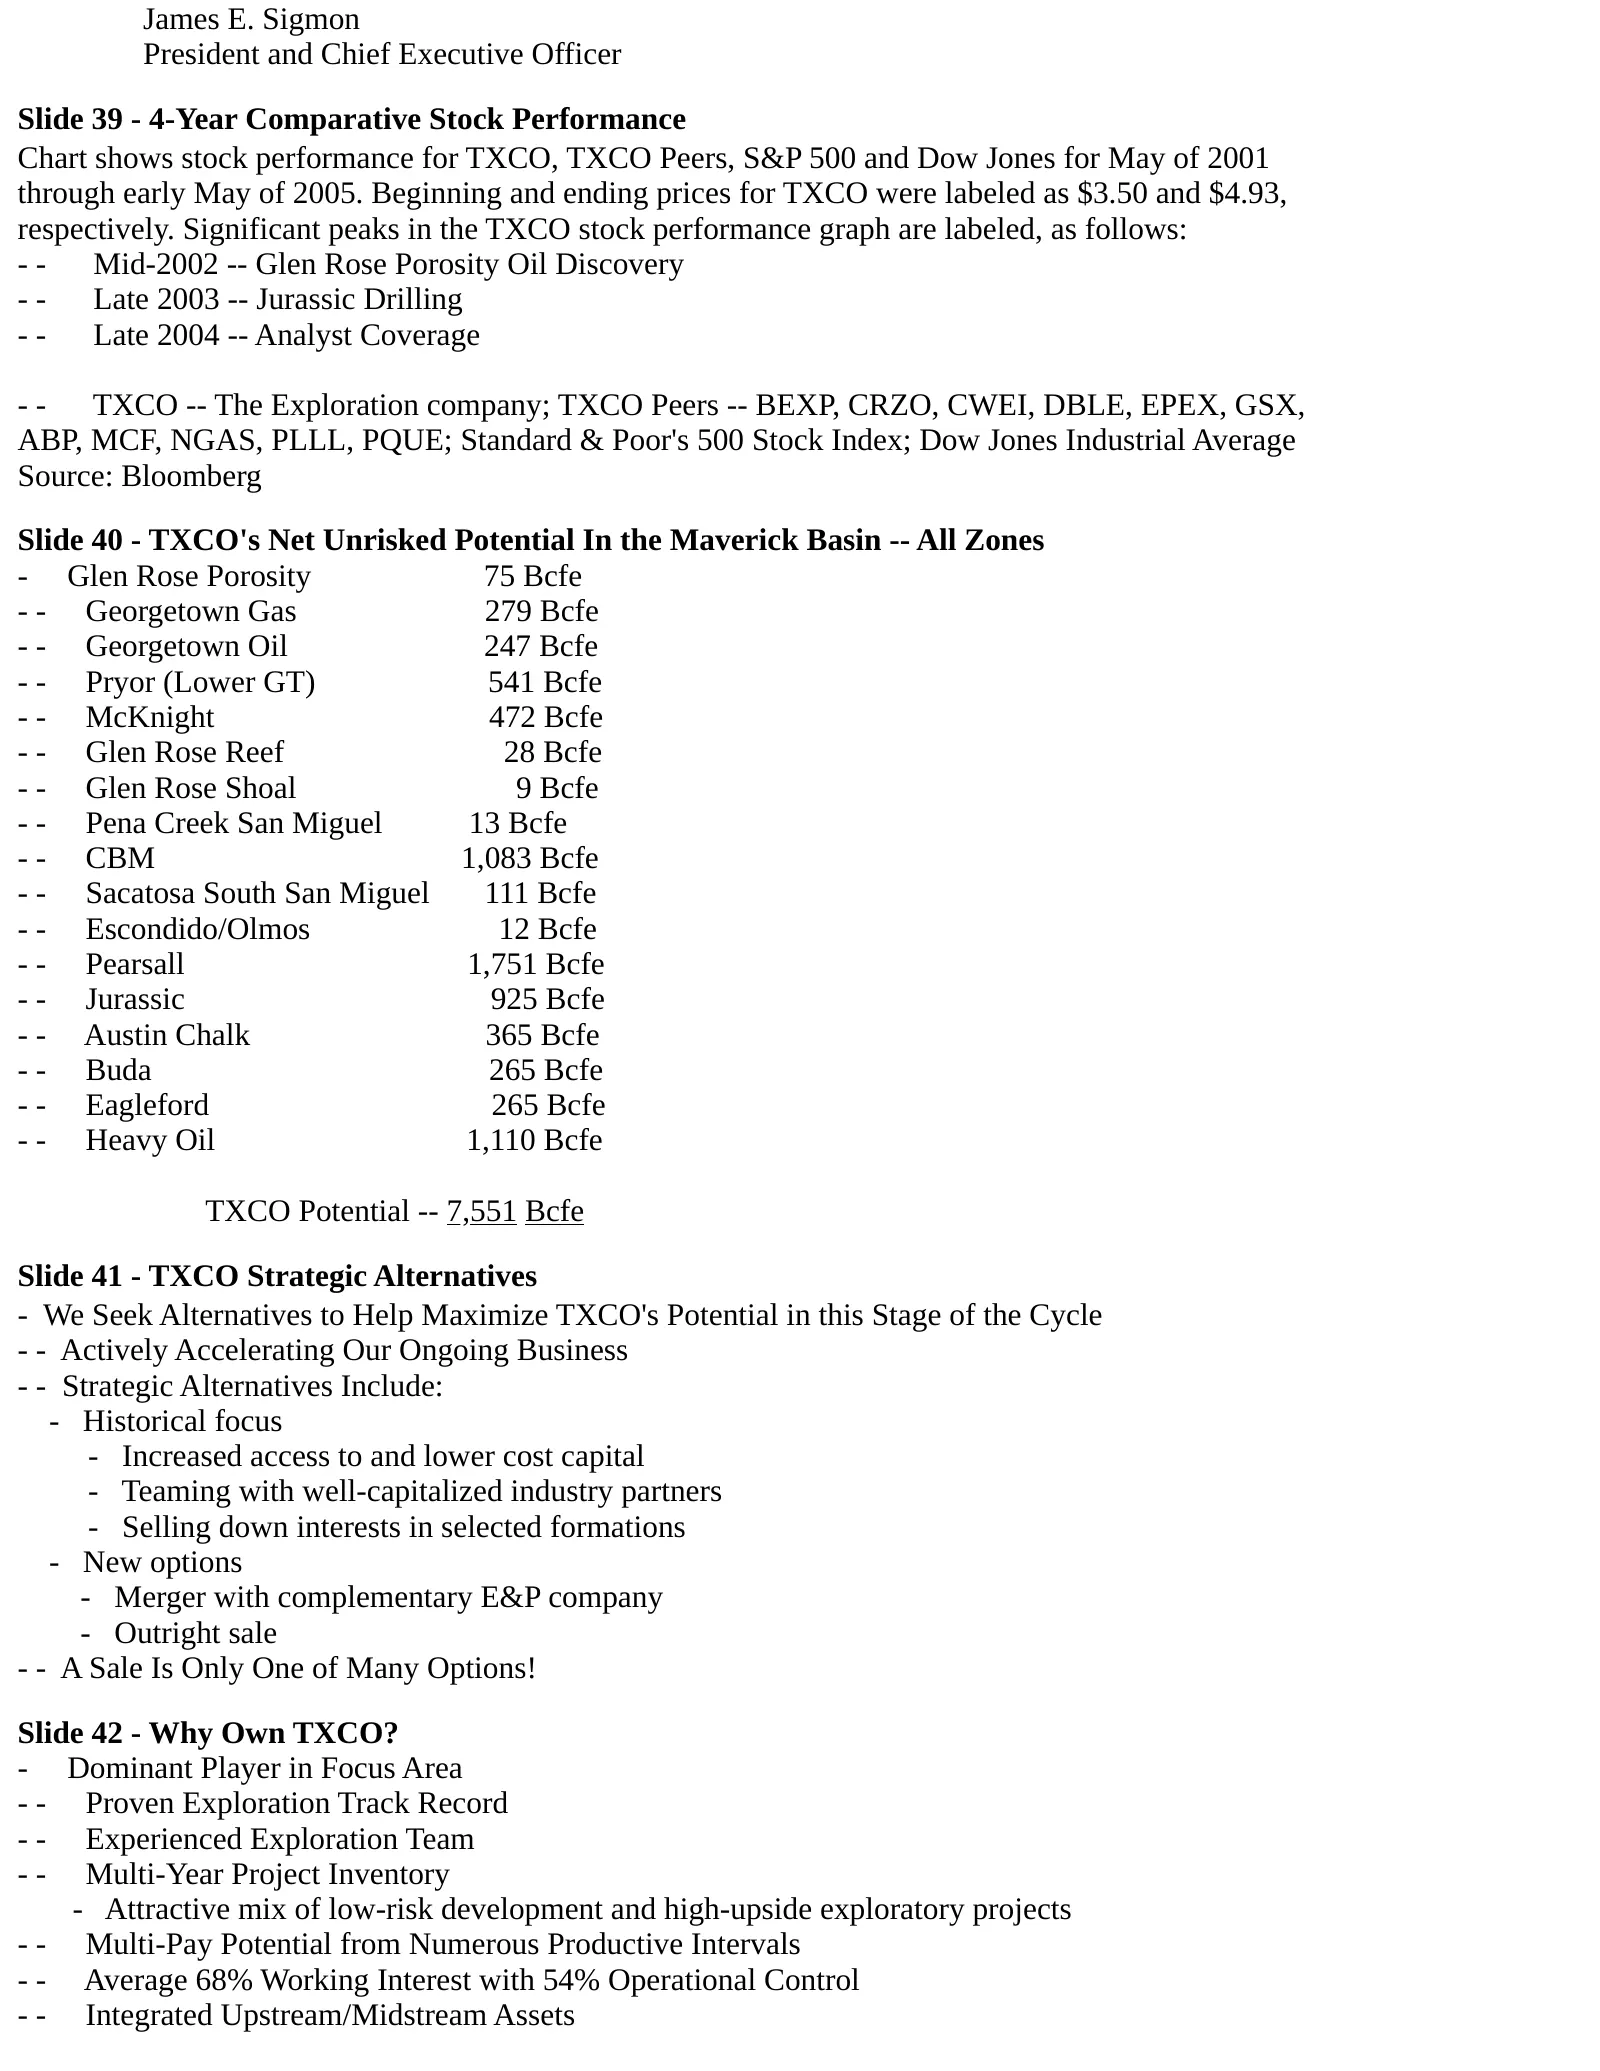
James E. Sigmon President and Chief Executive Officer Slide 39 - 4-Year Comparative Stock Performance Chart shows stock performance for TXCO, TXCO Peers, S&P 500 and Dow Jones for May of 2001 through early May of 2005. Beginning and ending prices for TXCO were labeled as $3.50 and $4.93, respectivel
Slide 9: Appendix - Definitions
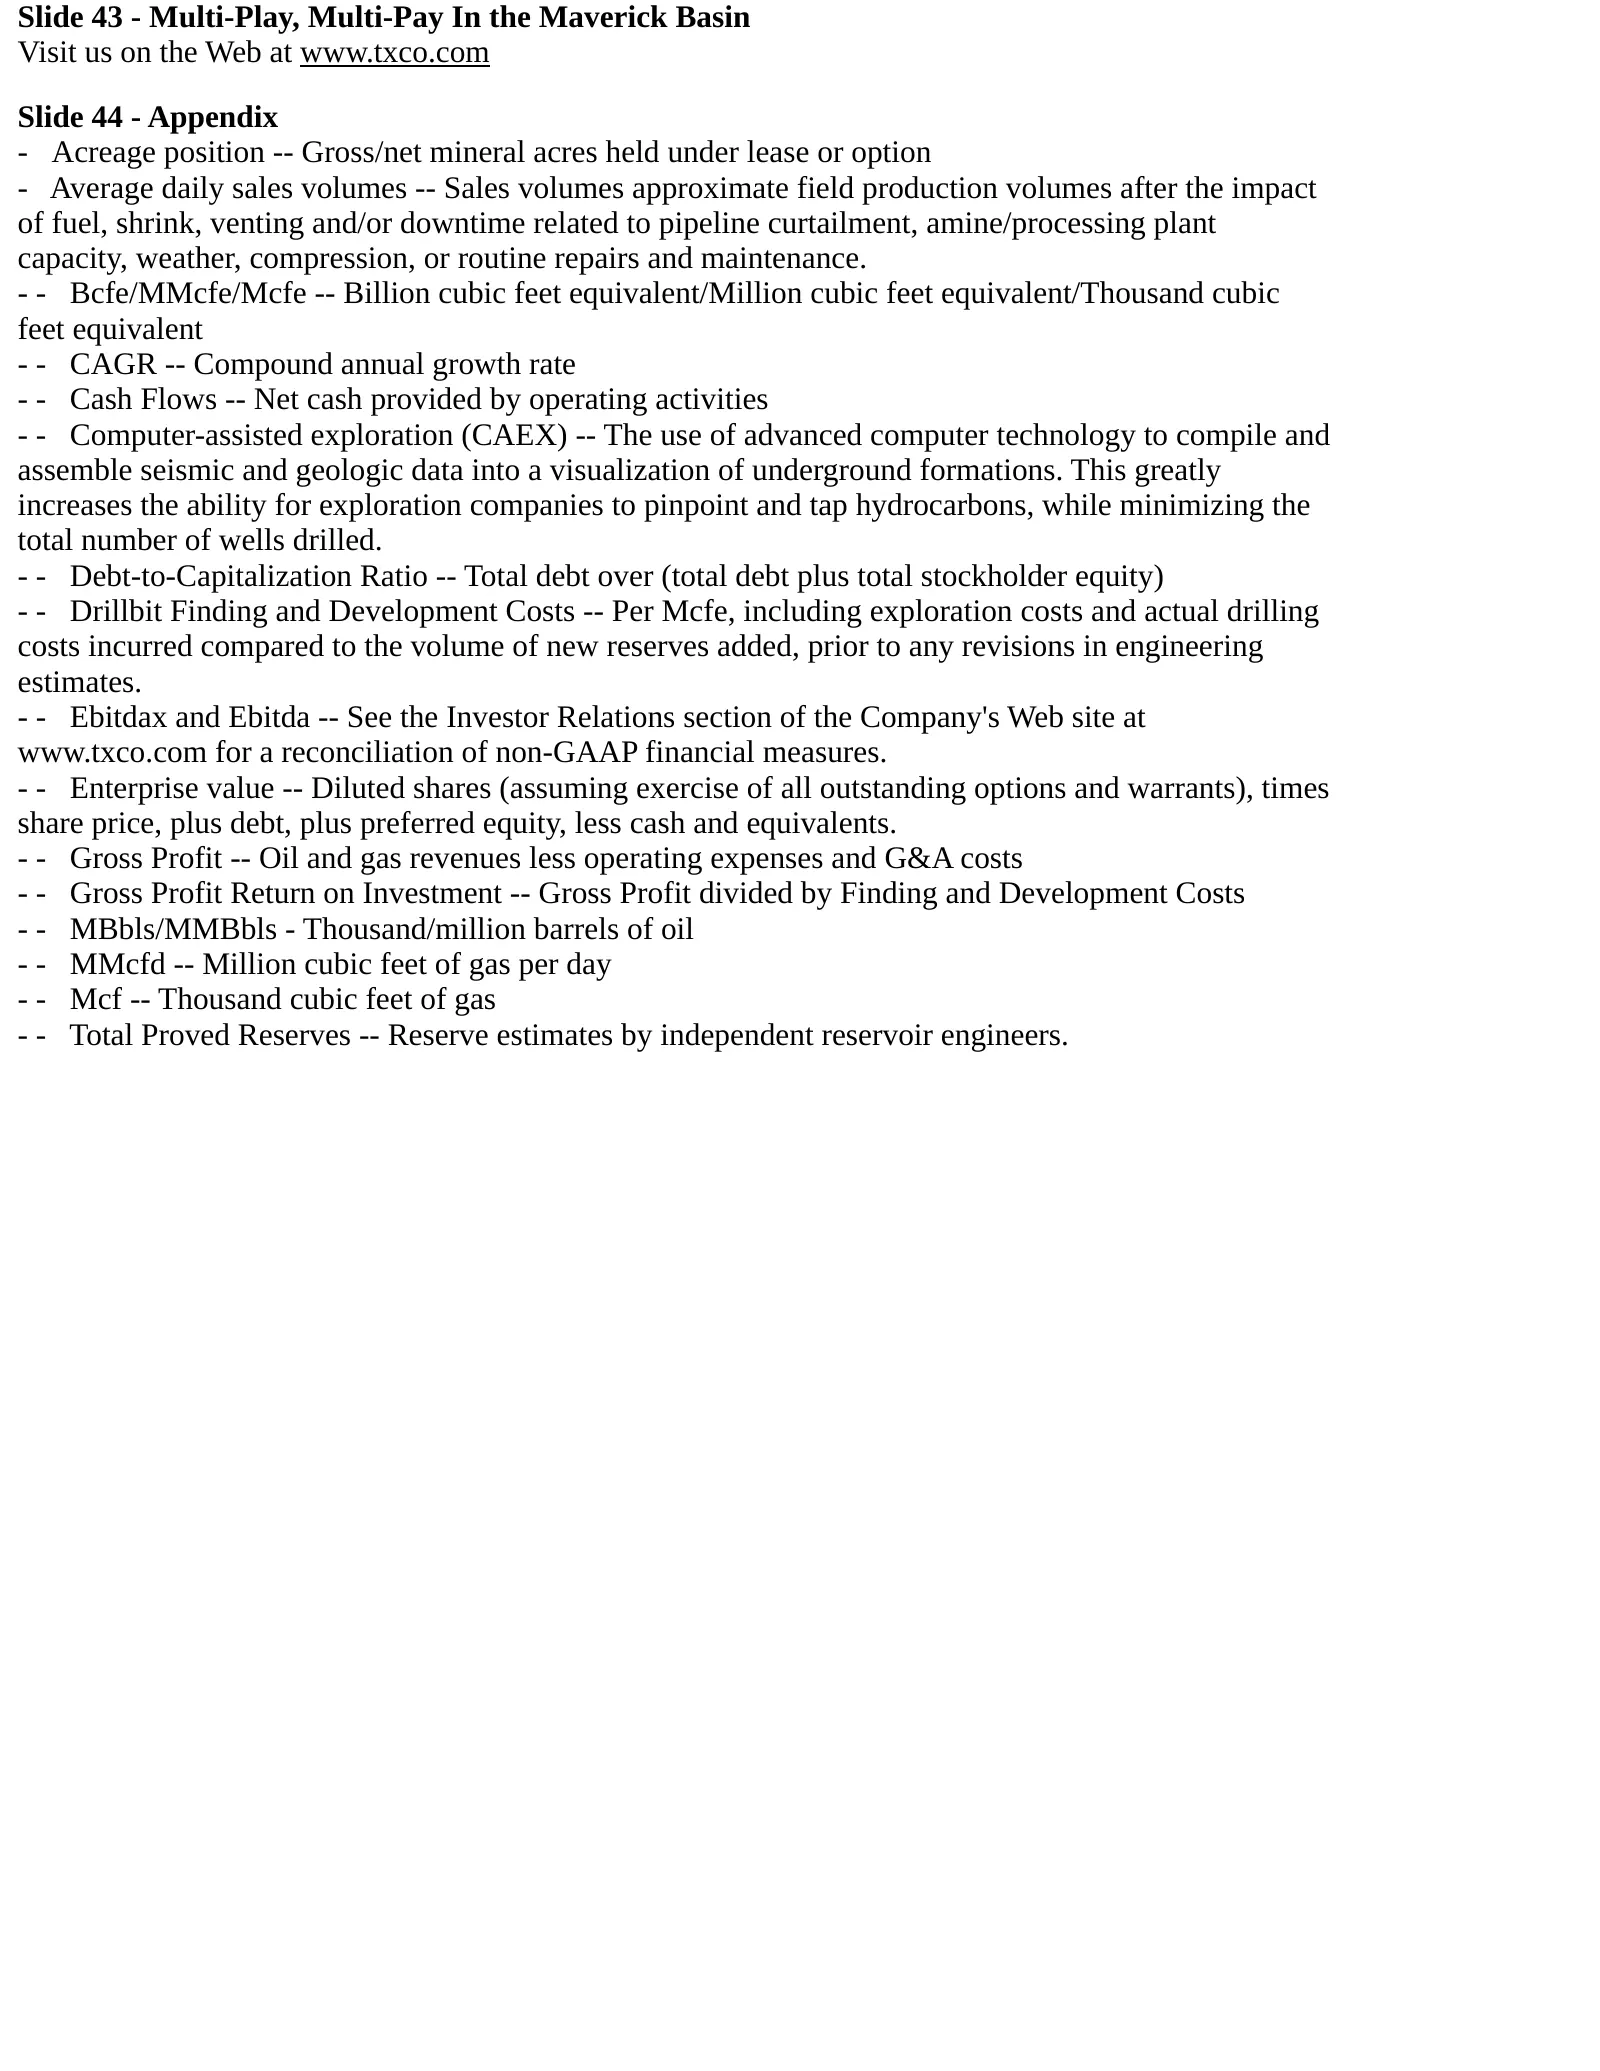
Slide 43 - Multi-Play, Multi-Pay In the Maverick Basin Visit us on the Web at www.txco.com Slide 44 - Appendix - Acreage position -- Gross/net mineral acres held under lease or option - Average daily sales volumes -- Sales volumes approximate field production volumes after the impact of fuel, shrink
Source: SEC EDGAR · 8-K filed May 13, 2005
More decks from TXCO Resources Inc
 IPAA Oil and Gas Investment Symposium 200710 slides · Oct 1, 2007
 Investor Presentation (June 2007)15 slides · Jun 20, 2007
 Exploration Co of Delaware — Shareholder Meeting (May 2007)11 slides · May 16, 2007
 Exploration Co of Delaware — IPAA Oil and Gas Investment Symposium April 200710 slides · Apr 23, 2007
 Exploration Co of Delaware — Howard Weil 35th Annual Energy Conference 200711 slides · Apr 9, 2007
 Exploration Co of Delaware — A.G. Edwards Energy Conference 200712 slides · Mar 20, 2007