Huntington Ingalls Industries, Inc. · NYSE:HII
Huntington Ingalls Industries — Q3 2016 Earnings Presentation
21 slides from Huntington Ingalls Industries's earnings presentation, Nov 3, 2016
Slide 1: Q3 2016 Earnings Presentation
Q3 2016 Earnings Presentation November 3, 2016 Mike Petters President and Chief Executive Officer Chris Kastner Executive Vice President, Business Management and Chief Financial Officer
Slide 2: Forward-Looking Statements
2 Forward-Looking Statements Statements in this presentation, other than statements of historical fact, constitute "forward-looking statements" within the meaning of the Private Securities Litigation Reform Act of 1995. Forward-looking statements involve risks and uncertainties that could cause our
Slide 3: Q3 2016 Highlights
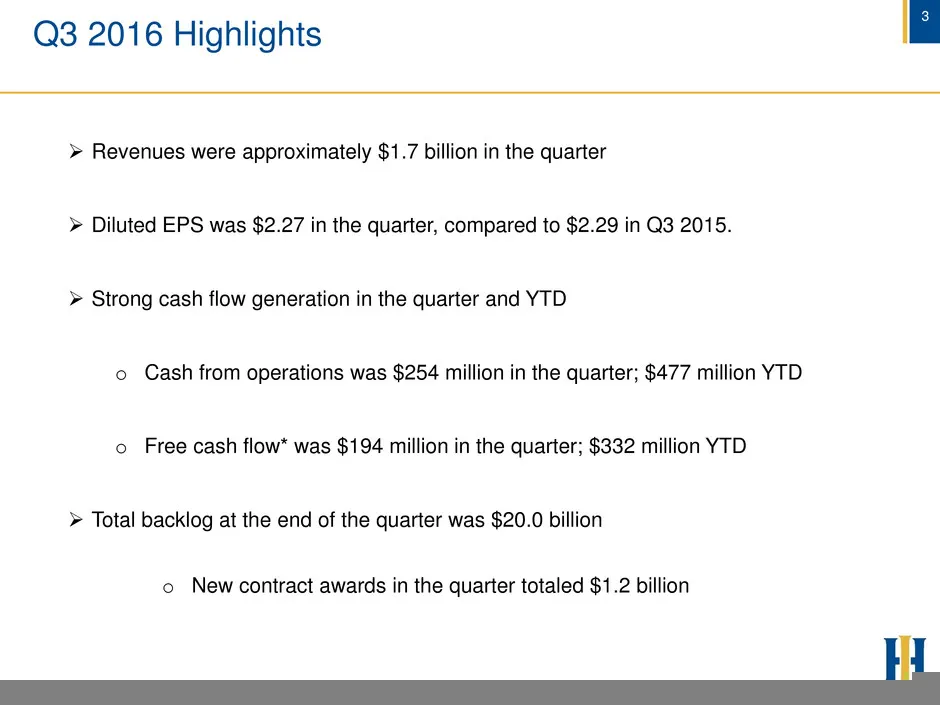
3 Q3 2016 Highlights *Non-GAAP measure. See appendix for definition and reconciliation. Revenues were approximately $1.7 billion in the quarter Diluted EPS was $2.27 in the quarter, compared to $2.29 in Q3 2015. Strong cash flow generation in the quarter and YTD o Cash from operations was $254
Slide 4: Acquisition Transaction Summary
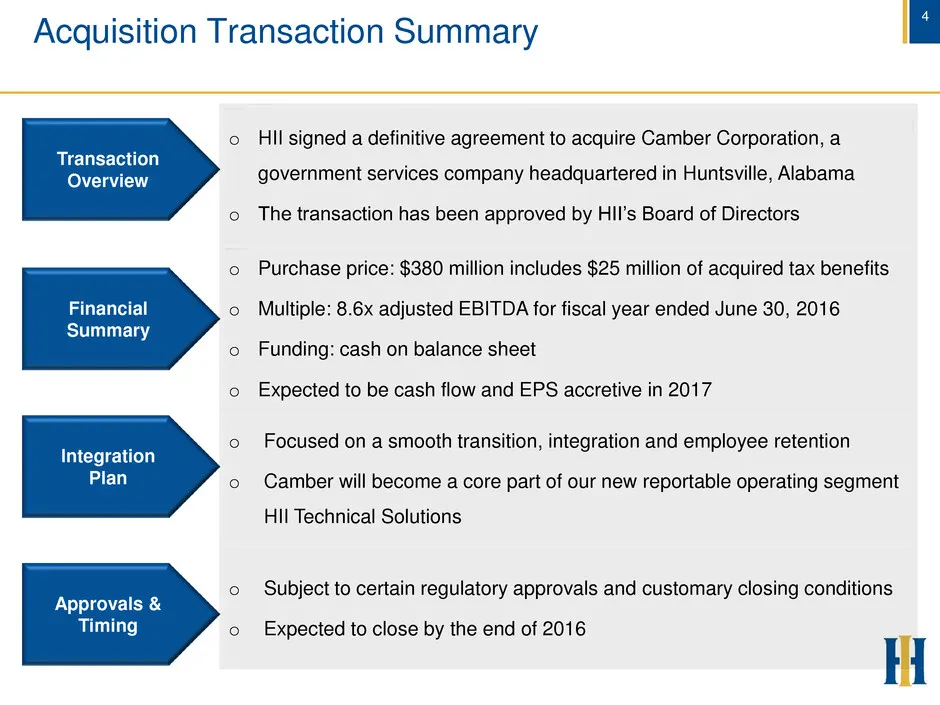
4 Acquisition Transaction Summary Transaction Overview Financial Summary Integration Plan o HII signed a definitive agreement to acquire Camber Corporation, a government services company headquartered in Huntsville, Alabama o The transaction has been approved by HII’s Board of Directors o Purchase p
Slide 5: Q3 2016 Consolidated Results
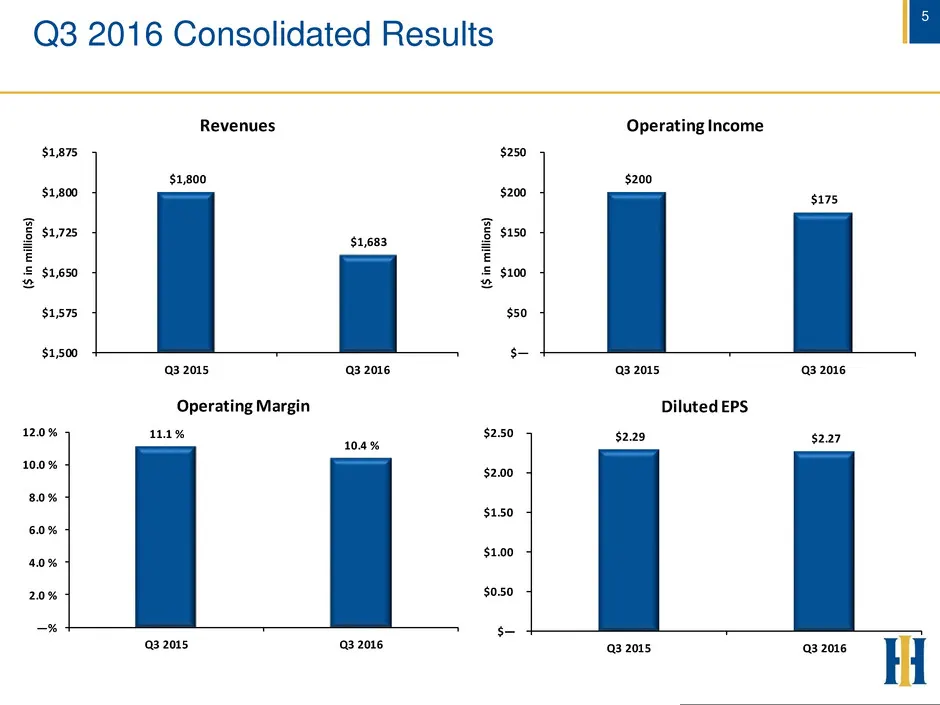
5 Q3 2016 Consolidated Results $1,800 $1,683 $1,500 $1,575 $1,650 $1,725 $1,800 $1,875 Q3 2015 Q3 2016 ($ in m illi on s) Revenues $200 $175 $— $50 $100 $150 $200 $250 Q3 2015 Q3 2016 ($ in m illi on s) Operating Income 11.1 % 10.4 % —% 2.0 % 4.0 % 6.0 % 8.0 % 10.0 % 12.0 % Q3 2015 Q3 2016 Operating
Slide 6: Q3 & YTD 2016 Capital Deployment
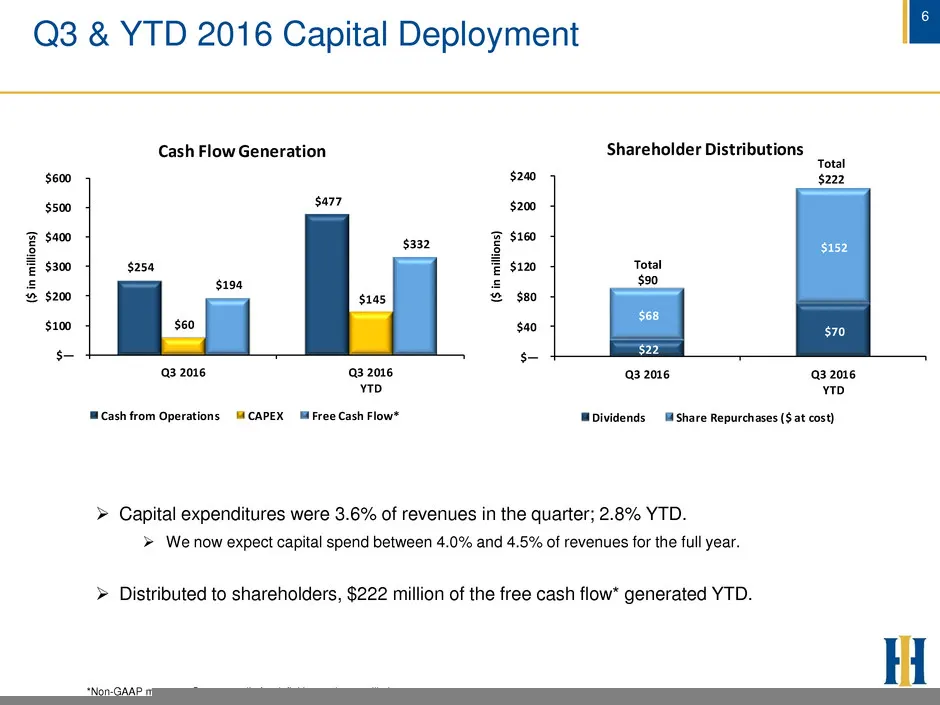
6 $22 $70 $68 $152 $— $40 $80 $120 $160 $200 $240 Q3 2016 Q3 2016 YTD ($ in m illi on s) Shareholder Distributions Dividends Share Repurchases ($ at cost) Q3 & YTD 2016 Capital Deployment *Non-GAAP measure. See appendix for definition and reconciliation. Capital expenditures were 3.6% of revenues
Slide 7: Q3 2016 Ingalls Shipbuilding Results
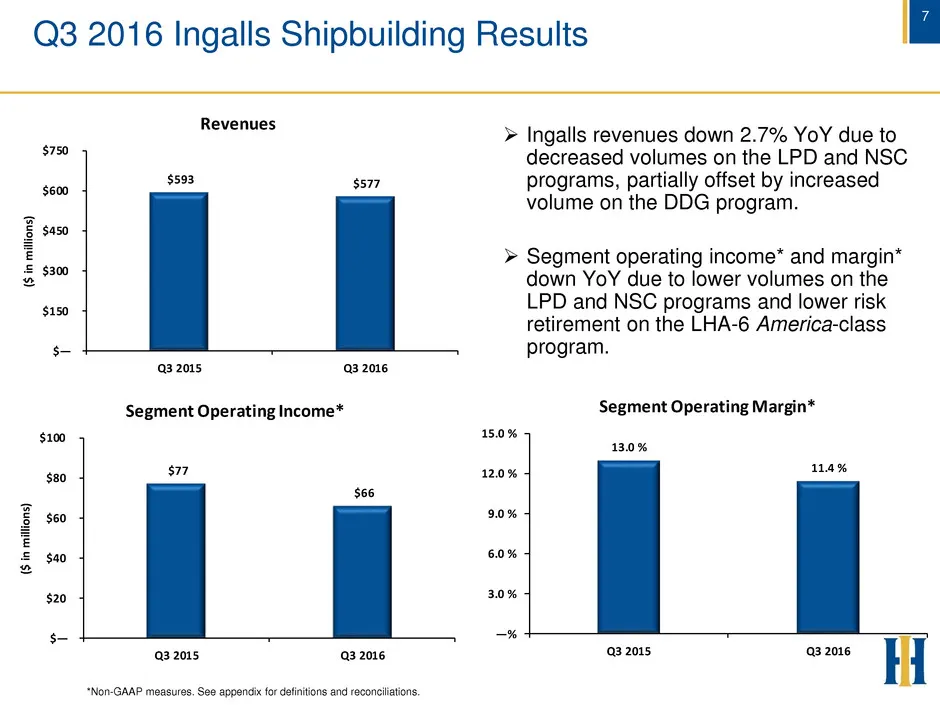
7 Q3 2016 Ingalls Shipbuilding Results Ingalls revenues down 2.7% YoY due to decreased volumes on the LPD and NSC programs, partially offset by increased volume on the DDG program. Segment operating income* and margin* down YoY due to lower volumes on the LPD and NSC programs and lower risk reti
Slide 8: Q3 2016 Newport News Shipbuilding Results
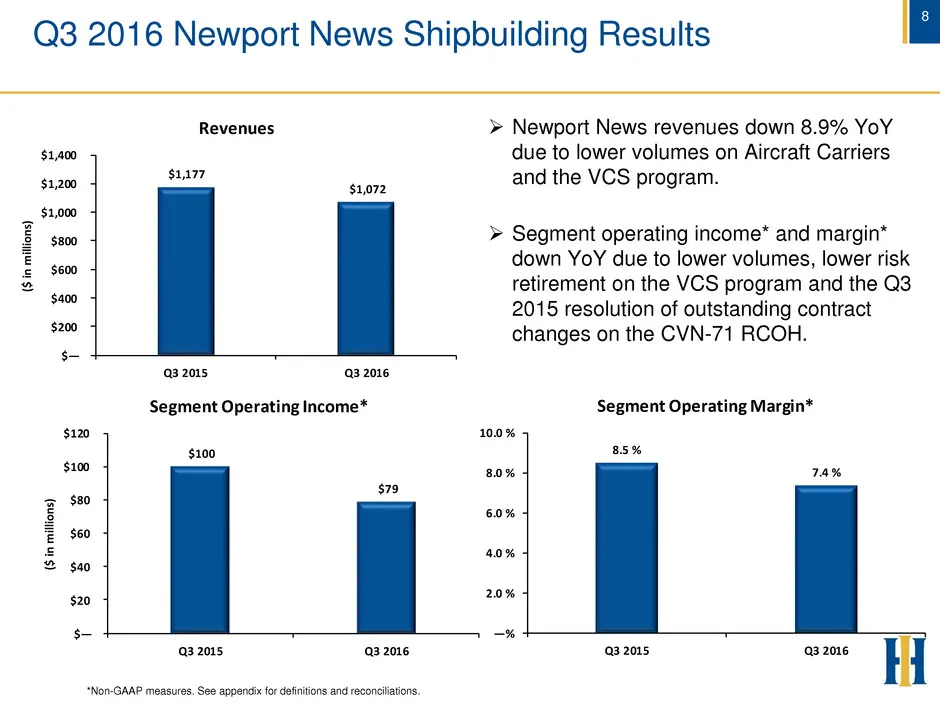
8 Q3 2016 Newport News Shipbuilding Results Newport News revenues down 8.9% YoY due to lower volumes on Aircraft Carriers and the VCS program. Segment operating income* and margin* down YoY due to lower volumes, lower risk retirement on the VCS program and the Q3 2015 resolution of outstanding c
Slide 9: Q3 2016 Other Segment Results
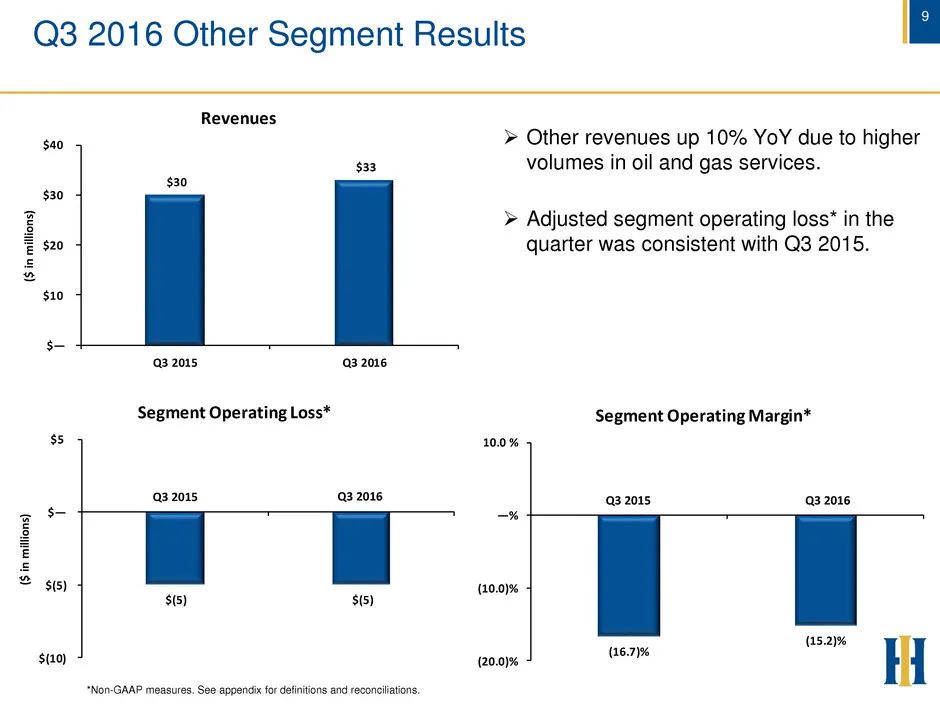
9 (16.7)% (15.2)% (20.0)% (10.0)% —% 10.0 % Segment Operating Margin* $(5) $(5) $(10) $(5) $— $5 ($ in m illi on s) Segment Op rati g Loss* Q3 2016 Other Segment Results Q3 2015 Q3 2016 Q3 2016 Q3 2015 Other revenues up 10% YoY due to higher volumes in oil and gas services. Adjusted segment oper
Slide 10: 2016 Expectation Update
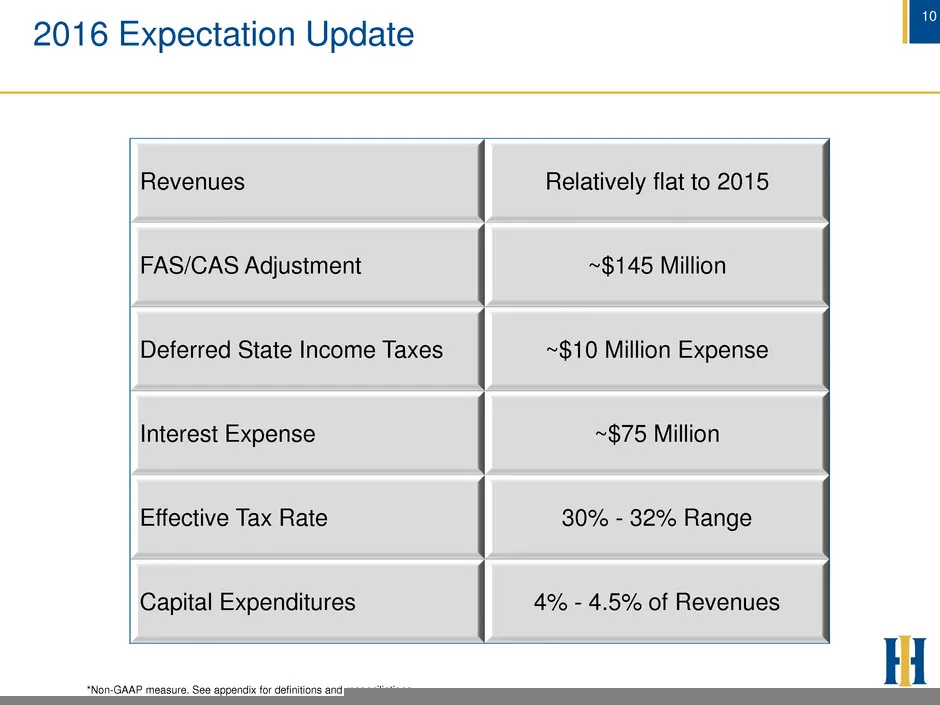
10 2016 Expectation Update *Non-GAAP measure. See appendix for definitions and reconciliations. Revenues Relatively flat to 2015 FAS/CAS Adjustment ~$145 Million Deferred State Income Taxes ~$10 Million Expense Interest Expense ~$75 Million Effective Tax Rate 30% - 32% Range Capital Expenditures 4%

Slide 11: Appendix
11 Appendix
Slide 12: Non-GAAP Measures Definitions & Reconciliations
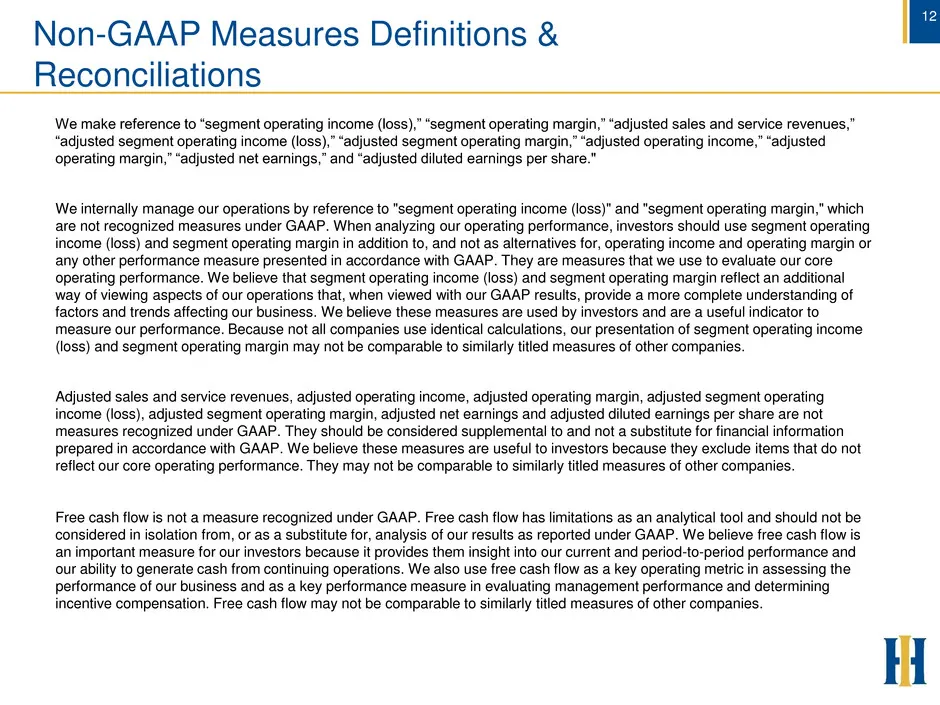
12 Non-GAAP Measures Definitions & Reconciliations We make reference to “segment operating income (loss),” “segment operating margin,” “adjusted sales and service revenues,” “adjusted segment operating income (loss),” “adjusted segment operating margin,” “adjusted operating income,” “adjusted operat
Slide 13: Non-GAAP Measures Definitions & Reconciliations Cont'd
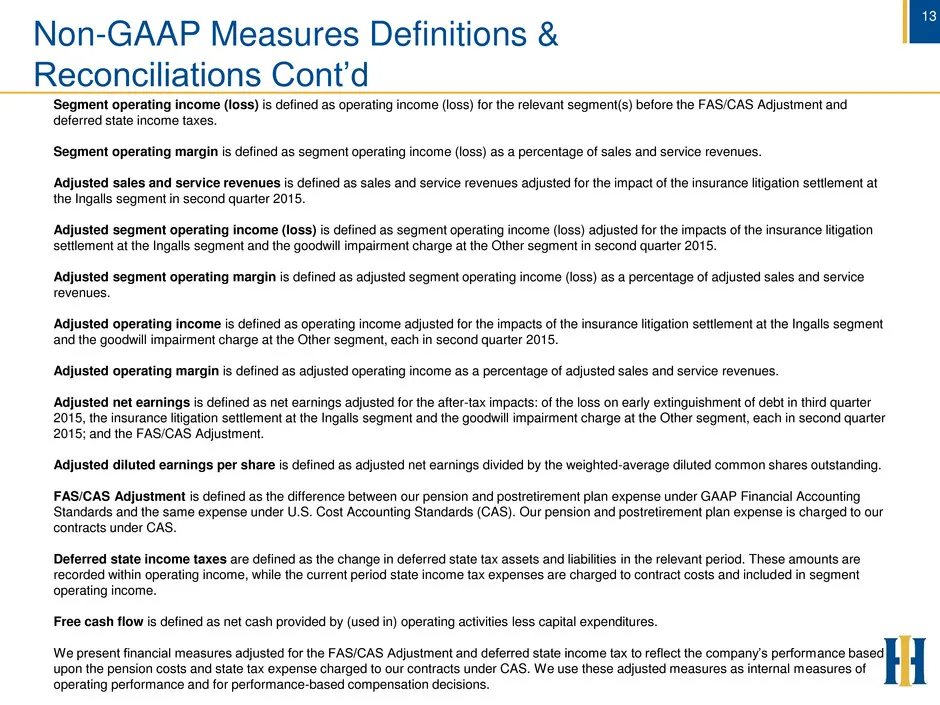
13 Non-GAAP Measures Definitions & Reconciliations Cont’d Segment operating income (loss) is defined as operating income (loss) for the relevant segment(s) before the FAS/CAS Adjustment and deferred state income taxes. Segment operating margin is defined as segment operating income (loss) as a perce
Slide 14: Reconciliation – Segment Operating Income & Segment Operating Margin
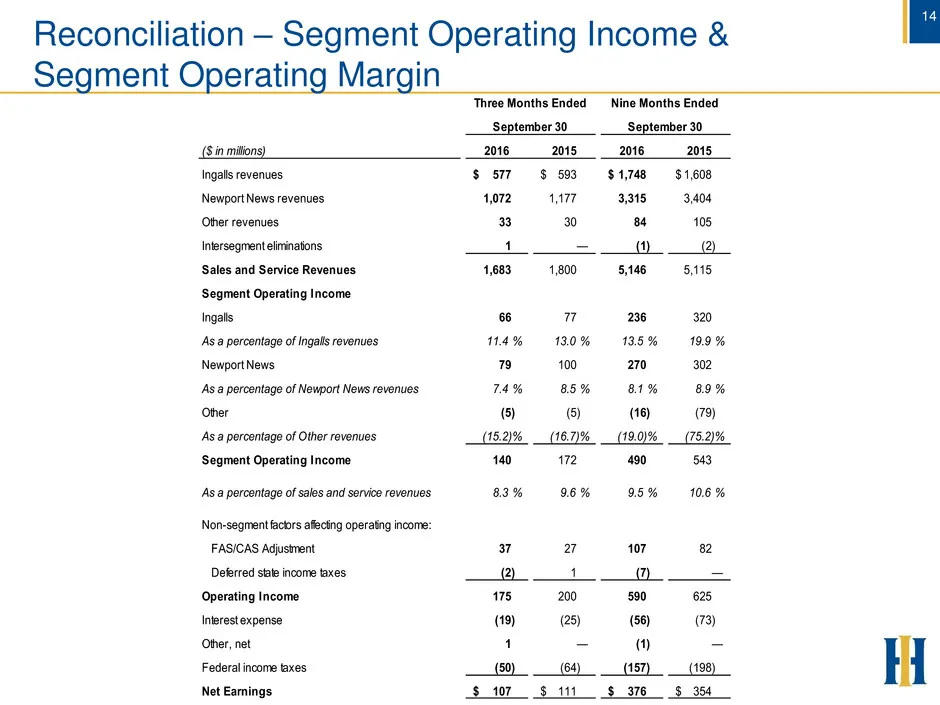
14 Reconciliation – Segment Operating Income & Segment Operating Margin ($ in millions) 2016 2015 2016 2015 Ingalls revenues 577$ 593$ 1,748$ 1,608$ Newport News revenues 1,072 1,177 3,315 3,404 Other revenues 33 30 84 105 Intersegment eliminations 1 — (1) (2) Sales and Service Revenues 1,683 1,800
Slide 15: Reconciliation – Adjusted Sales and Service Revenues
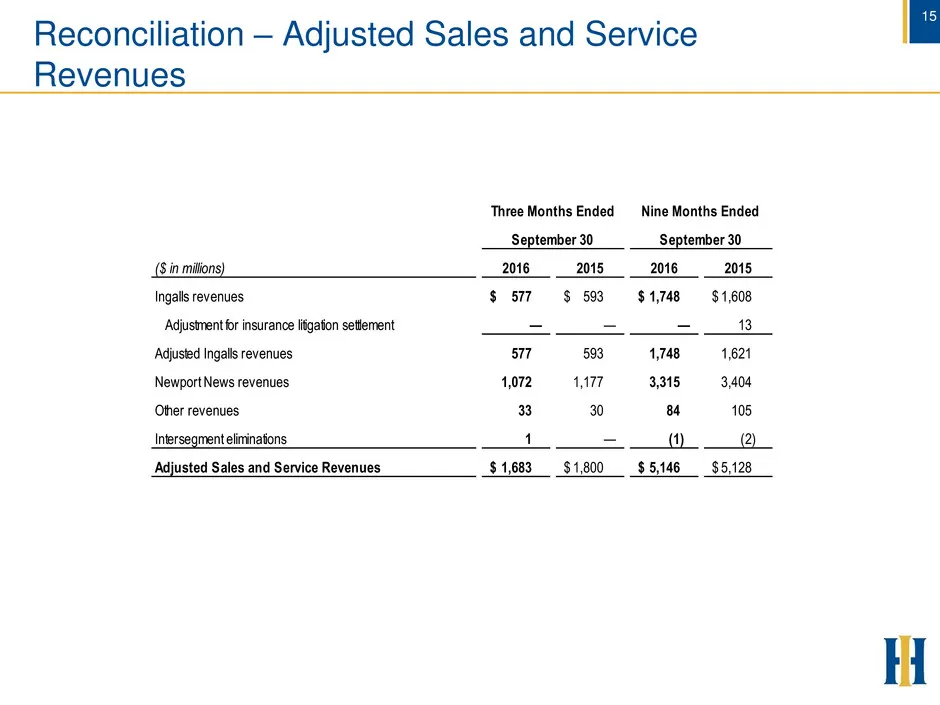
15 Reconciliation – Adjusted Sales and Service Revenues ($ in millions) 2016 2015 2016 2015 Ingalls revenues 577$ 593$ 1,748$ 1,608$ Adjustment for insurance litigation settlement — — — 13 Adjusted Ingalls revenues 577 593 1,748 1,621 Newport News revenues 1,072 1,177 3,315 3,404 Other revenues 33 3
Slide 16: Reconciliation – Adjusted Segment Operating Income & Margin
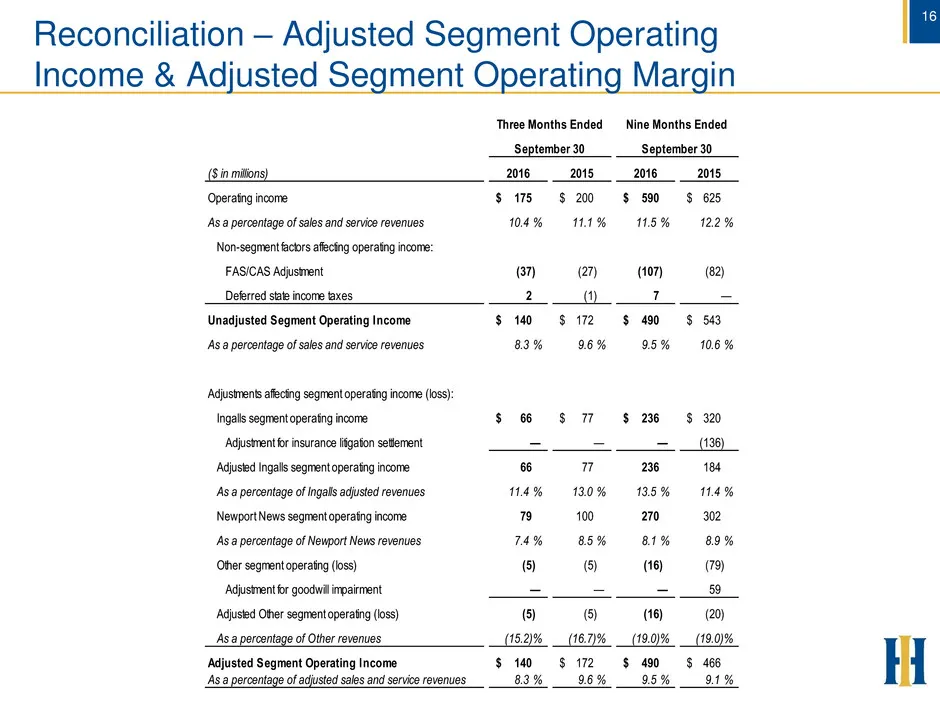
16 Reconciliation – Adjusted Segment Operating Income & Adjusted Segment Operating Margin ($ in millions) 2016 2015 2016 2015 Operating income 175$ 200$ 590$ 625$ As a percentage of sales and service revenues 10.4 % 11.1 % 11.5 % 12.2 % Non-segment factors affecting operating income: FAS/CAS Adjustm
Slide 17: Reconciliation – Adjusted Operating Income & Adjusted Operating Margin
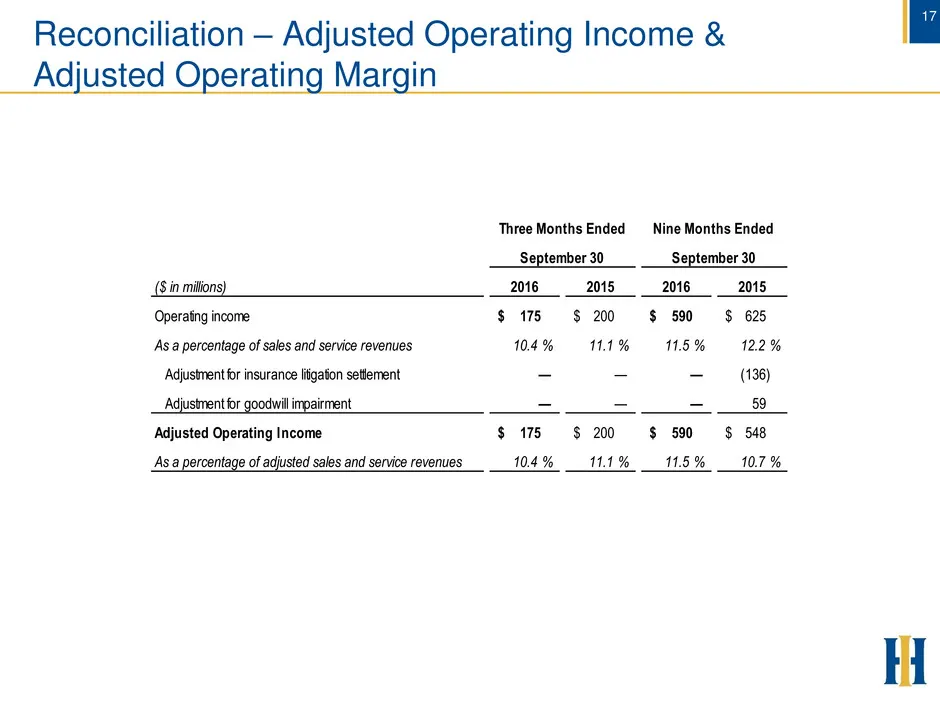
17 Reconciliation – Adjusted Operating Income & Adjusted Operating Margin ($ in millions) 2016 2015 2016 2015 Operating income 175$ 200$ 590$ 625$ As a percentage of sales and service revenues 10.4 % 11.1 % 11.5 % 12.2 % Adjustment for insurance litigation settlement — — — (136) Adjustment for goodw
Slide 18: Reconciliation – Adjusted Net Earnings & Adjusted Diluted EPS
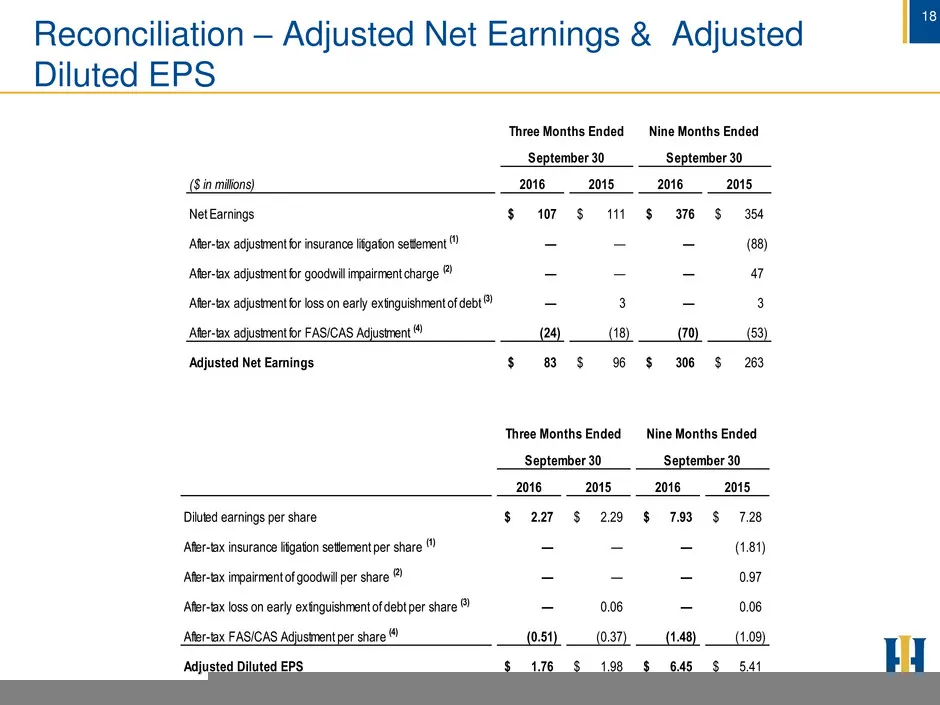
18 Reconciliation – Adjusted Net Earnings & Adjusted Diluted EPS 18 ($ in millions) 2016 2015 2016 2015 Net Earnings 107$ 111$ 376$ 354$ After-tax adjustment for insurance litigation settlement (1) — — — (88) After-tax adjustment for goodwill impairment charge (2) — — — 47 After-tax adjustment for l
Slide 19: Reconciliation – Adjusted Net Earnings & Adjusted Diluted EPS Cont'd
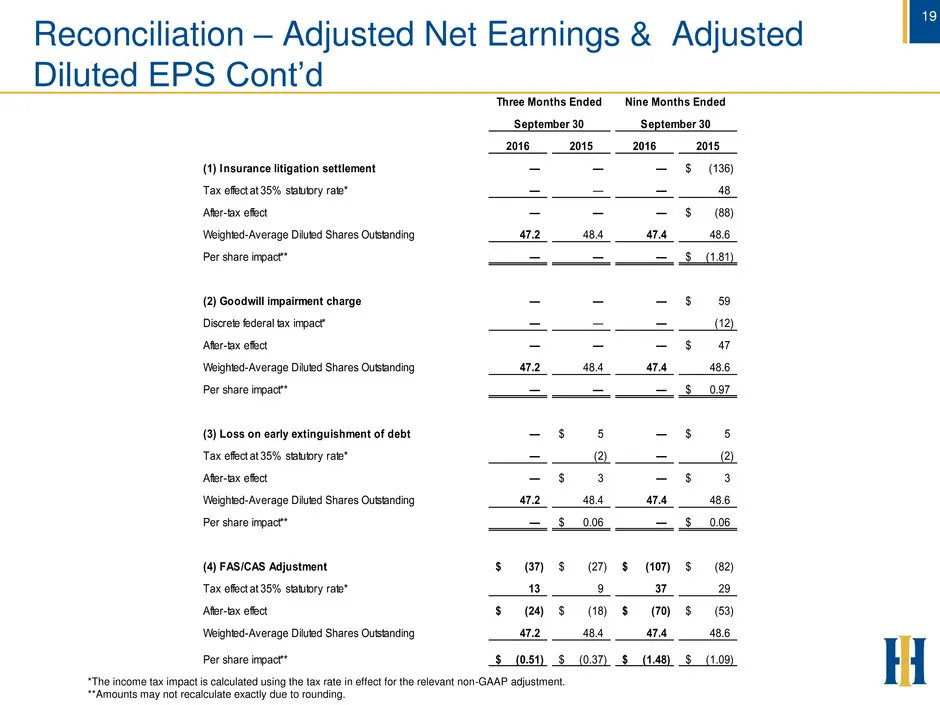
19 Reconciliation – Adjusted Net Earnings & Adjusted Diluted EPS Cont’d 19 *The income tax impact is calculated using the tax rate in effect for the relevant non-GAAP adjustment. **Amounts may not recalculate exactly due to rounding. 2016 2015 2016 2015 (1) Insurance litigation settlement — — — (136
Slide 20: Reconciliation – Free Cash Flow
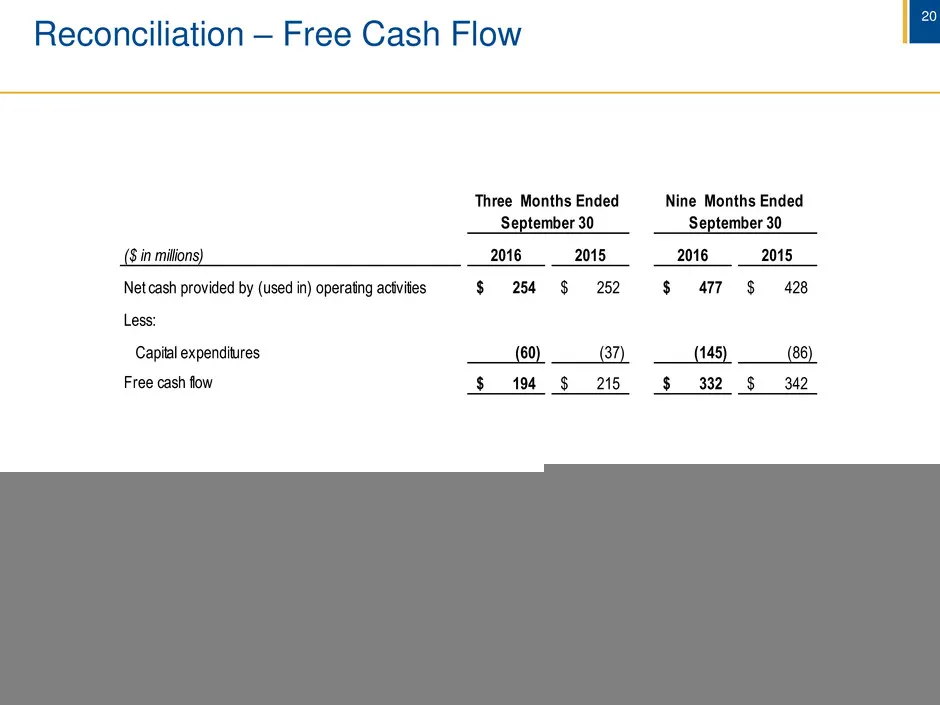
20 Reconciliation – Free Cash Flow 20 ($ in millions) 2016 2015 2016 2015 Net cash provided by (used in) operating activities 254$ 252$ 477$ 428$ Less: Capital expenditures (60) (37) (145) (86) Free cash flow 194$ 215$ 332$ 342$ September 30 September 30 Nine Months EndedThree Months Ended

Slide 21: Huntington Ingalls Industries
Huntington Ingalls Industries
Source: SEC EDGAR · 8-K filed Nov 3, 2016
More decks from Huntington Ingalls Industries, Inc.
 Q3 2026 Earnings Presentation16 slides · Oct 29, 2026
 Q2 2026 Earnings Presentation15 slides · Jul 30, 2026
 Q1 2026 Earnings Presentation15 slides · May 5, 2026
 Q4 2025 Earnings Presentation19 slides · Feb 5, 2026
 External Supplier Webinar: Sensitive Information, Cybersecurity and Data Protection (November 2025)29 slides · Nov 19, 2025
 Q3 2025 Earnings Presentation16 slides · Oct 30, 2025