HKT Trust and HKT Ltd · HKEX:6823
HKT Trust and HKT — FY2014 Earnings Presentation
53 slides from HKT Trust and HKT's earnings presentation, Feb 10, 2015

Slide 1: 2014 Annual Results
2014 Annual Results For the year ended December 31, 2014 February 10, 2015 – Hong Kong
Slide 2: Forward-Looking Statements
Forward-Looking Statements This presentation may contain "forward-looking statements" that are not historical in nature. These forward-looking statements, which include, without limitation, statements regarding HKT’s future results of operations, financial condition or business prospects, are based
Slide 3: Overview
Overview Alex Arena Group Managing Director 2
Slide 4: Adjusted Funds Flow
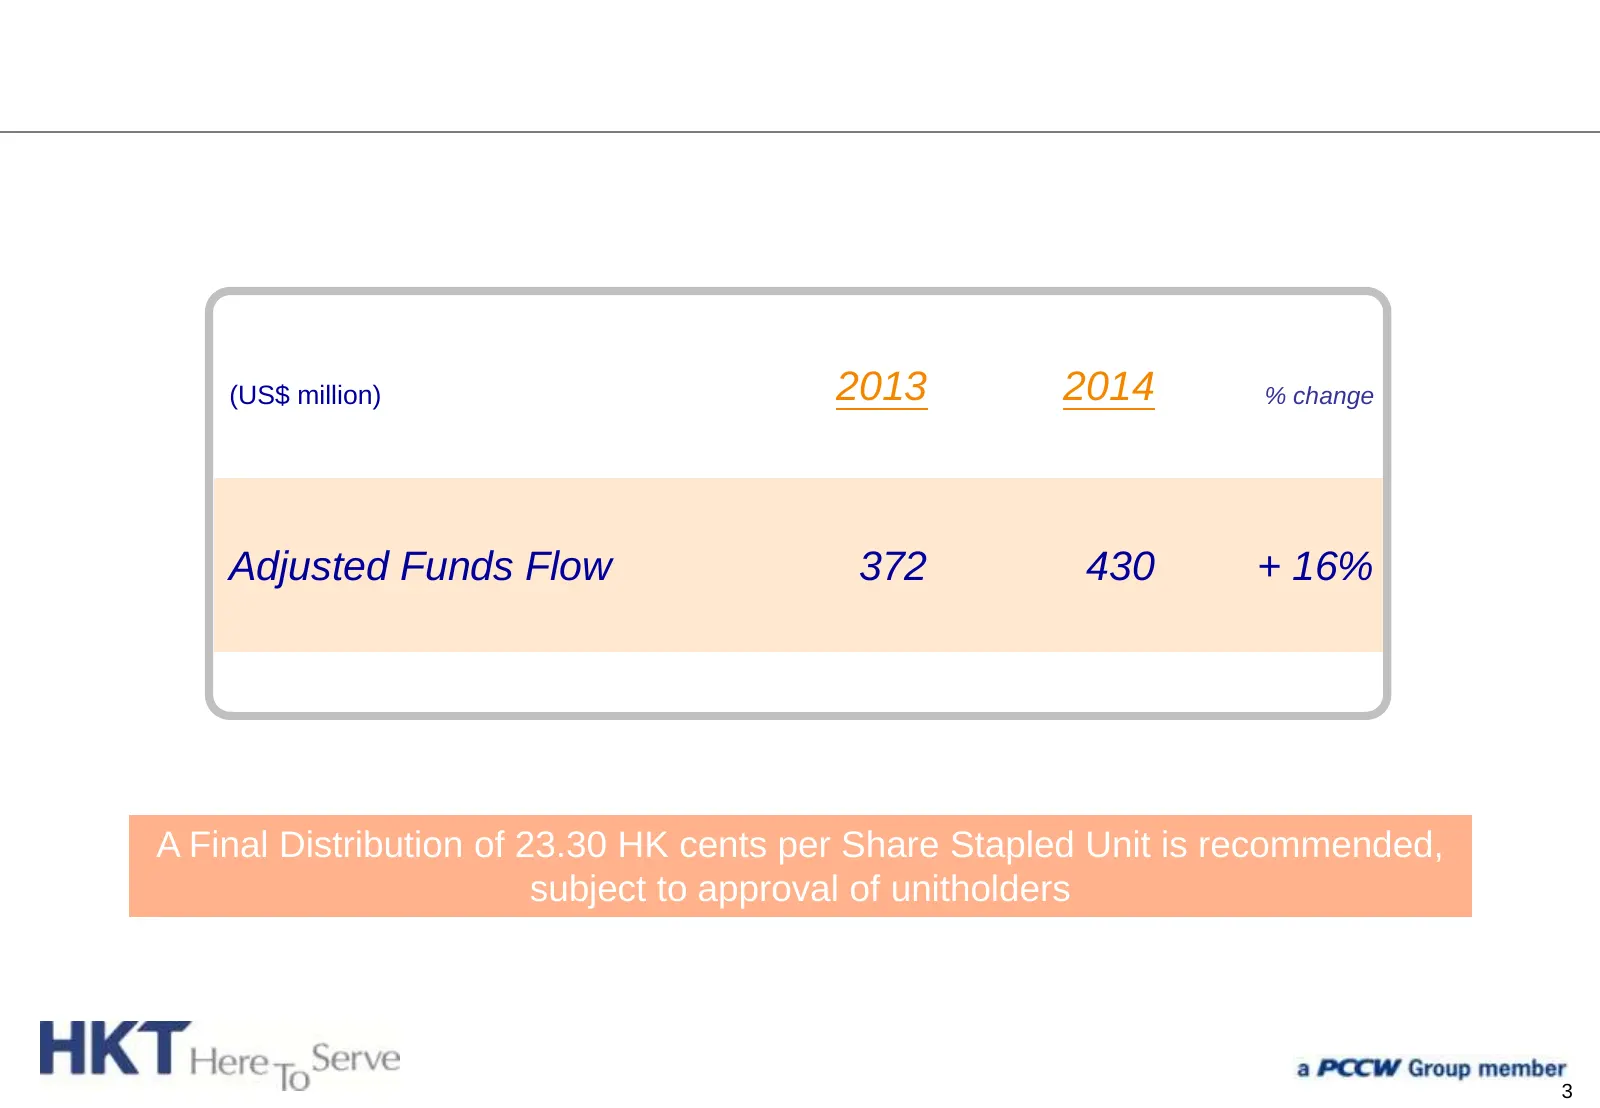
(US$ million) 2013 2014 % change Adjusted Funds Flow 372 430 + 16% A Final Distribution of 23.30 HK cents per Share Stapled Unit is recommended, subject to approval of unitholders 3
Slide 5: Delivering on CSL Integration
Delivering on CSL Integration Branding Rationalized Retail Channels Revamped Pricing Plans Network Enhancement Network Integration 4
Slide 6: Financial Review
Financial Review Susanna Hui Group Chief Financial Officer 5
Slide 7: Solid Growth in EBITDA and AFF
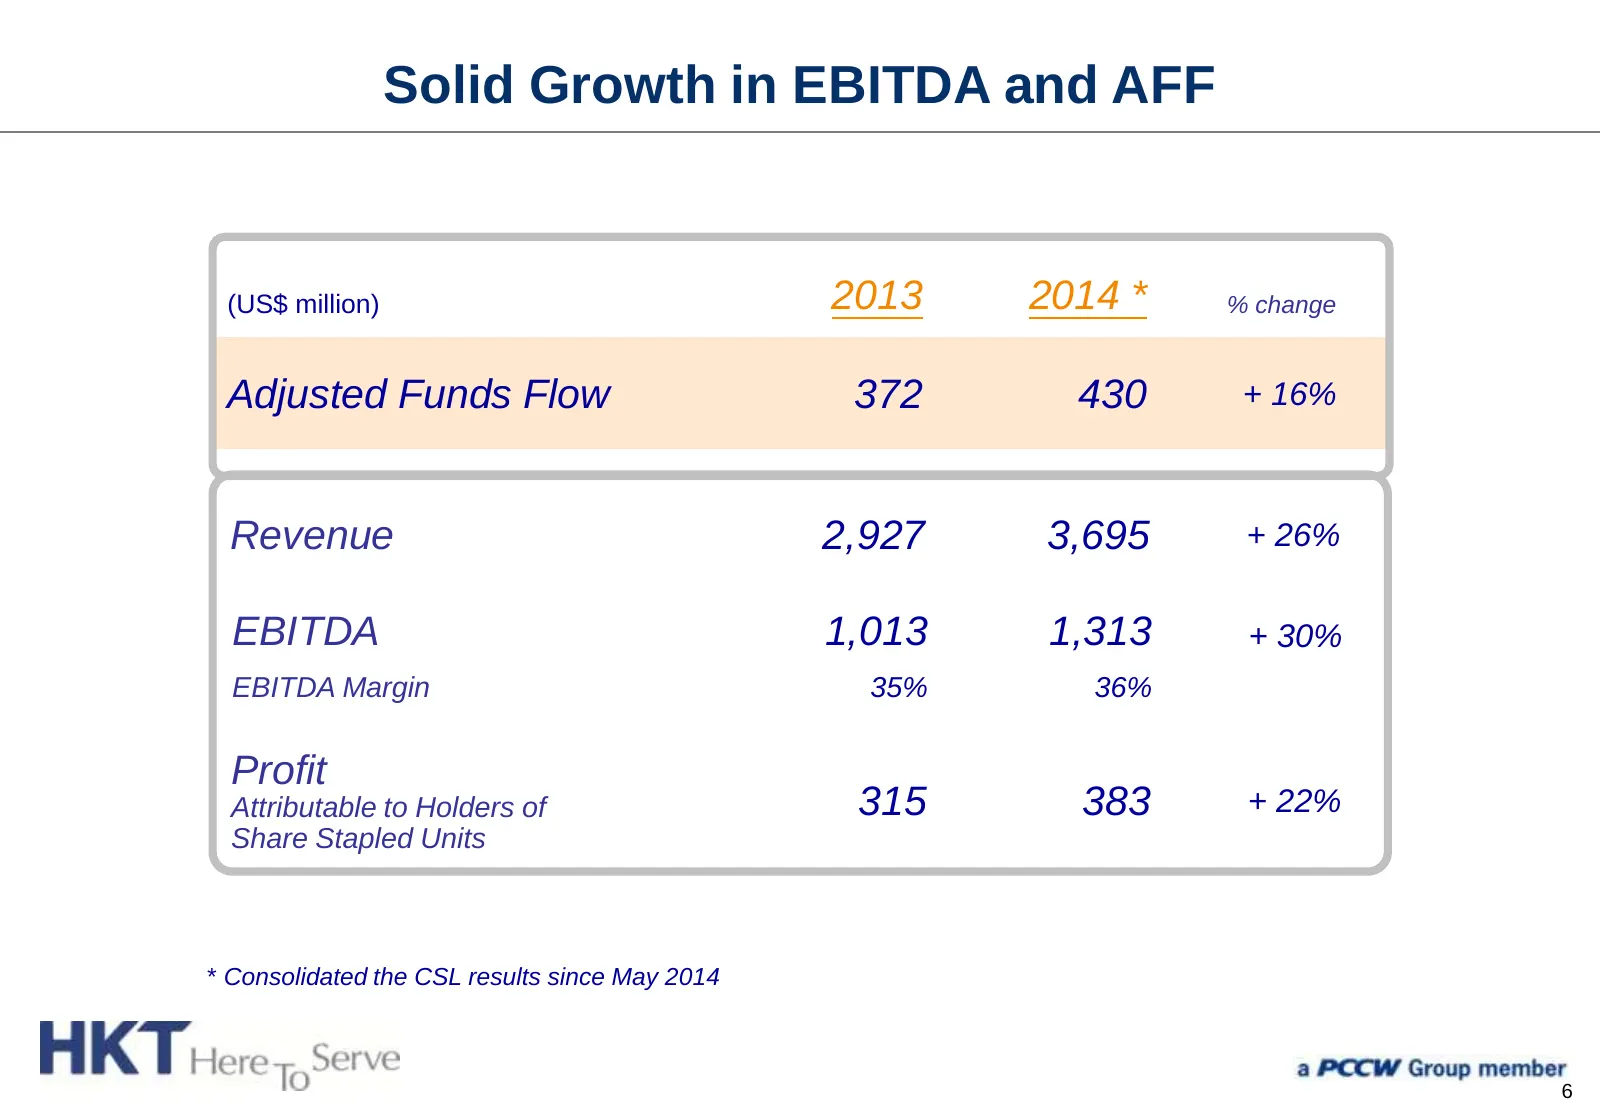
Solid Growth in EBITDA and AFF (US$ million) 2013 2014 * % change Adjusted Funds Flow 372 430 + 16% Revenue 2,927 3,695 + 26% EBITDA 1,013 1,313 + 30% EBITDA Margin 35% 36% Profit Attributable to Holders of 315 383 + 22% Share Stapled Units * Consolidated the CSL results since May 2014 6
Slide 8: Mobile Business Rising to the Fore
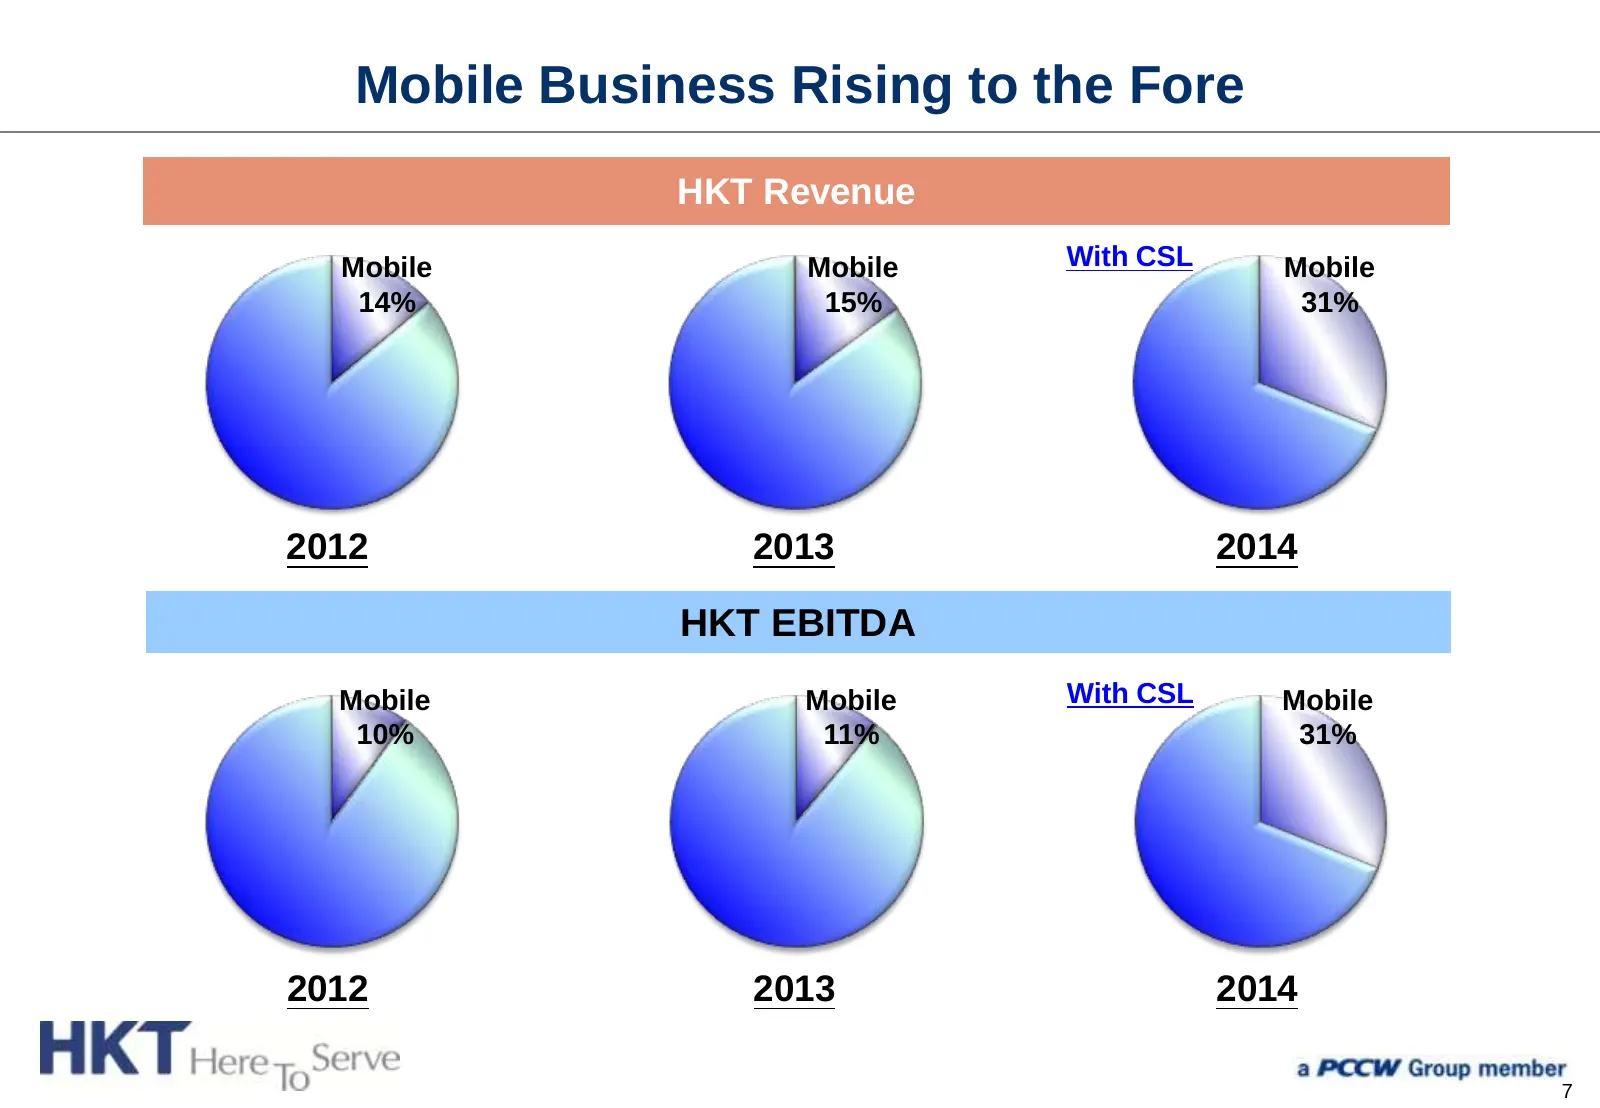
Mobile Business Rising to the Fore HKT HKT Revenue Revenue Mobile Mobile With CSL Mobile 14% 15% 31% 2012 2013 2014 HKT EBITDA Mobile Mobile With CSL Mobile 10% 11% 31% 2012 2013 2014 7
Slide 9: Pro-forma Comparison Shows Solid Mobile Growth
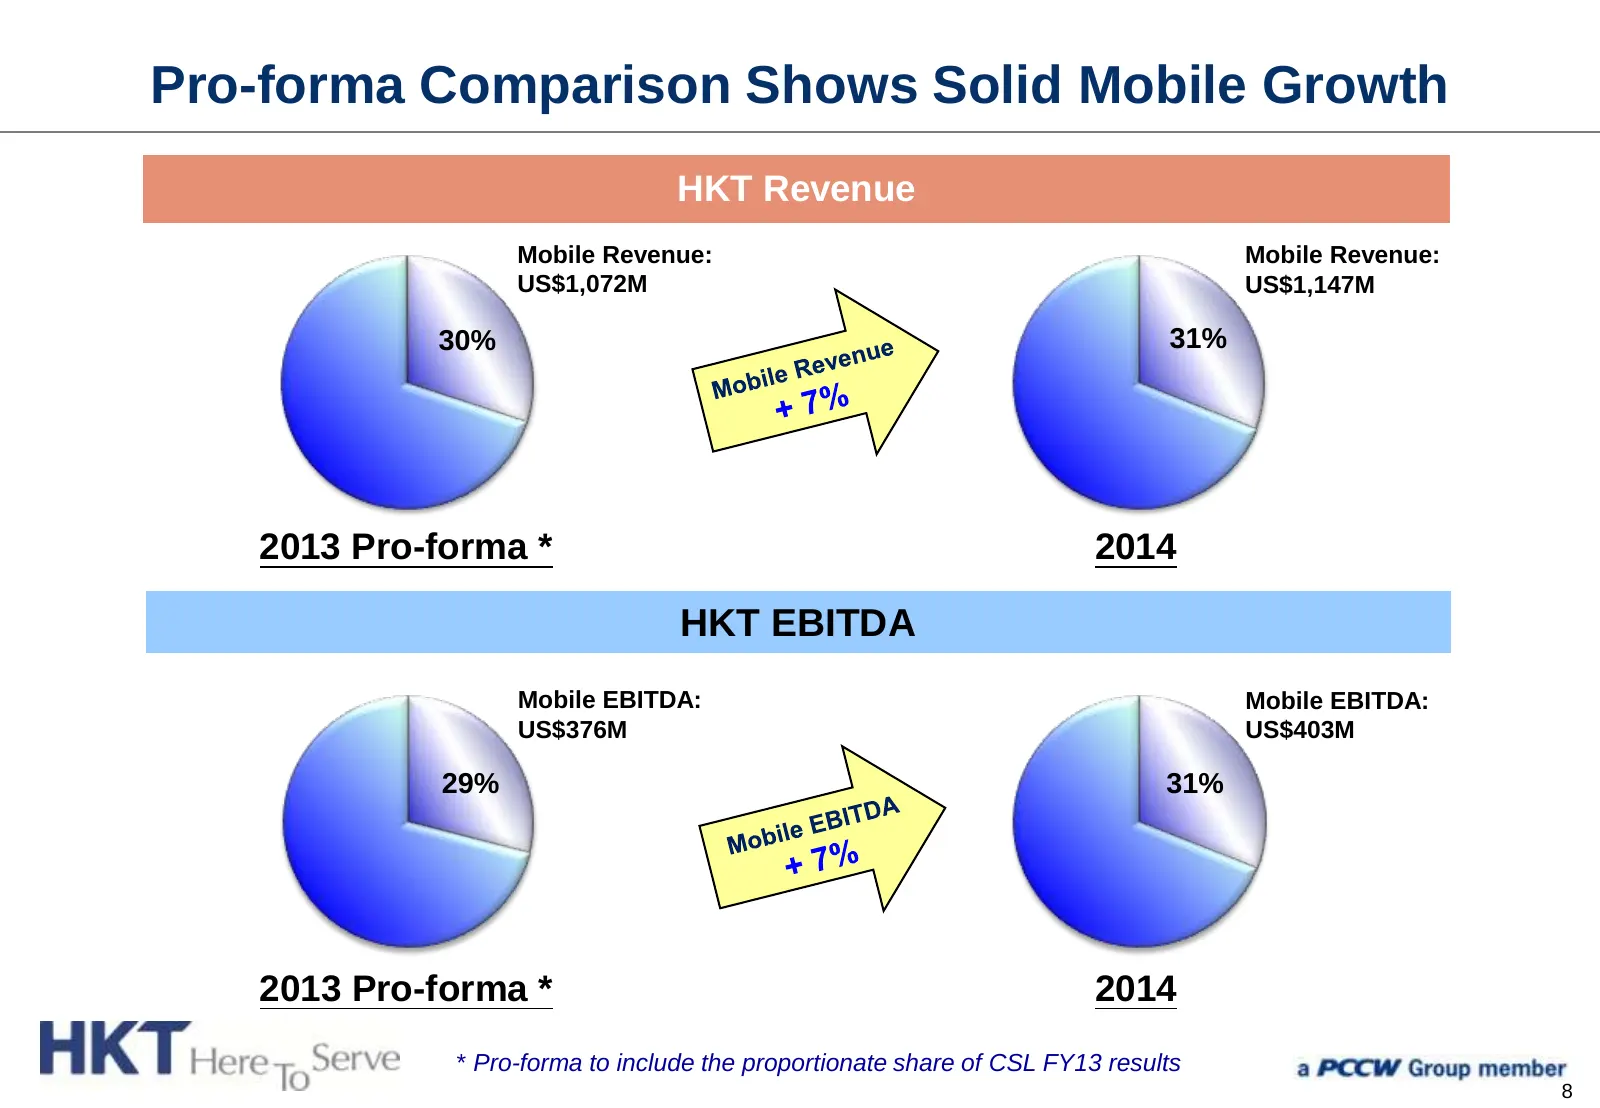
Pro-forma Comparison Shows Solid Mobile Growth HKT Revenue HKT Revenue Mobile Revenue: Mobile Revenue: US$1,072M US$1,147M 30% 31% 2013 Pro-forma * 2014 HKT EBITDA Mobile EBITDA: Mobile EBITDA: US$376M US$403M 29% 31% 2013 Pro-forma * 2014 * Pro-forma to include the proportionate share of CSL FY13 r
Slide 10: Benefiting from Market Leadership in Mobile
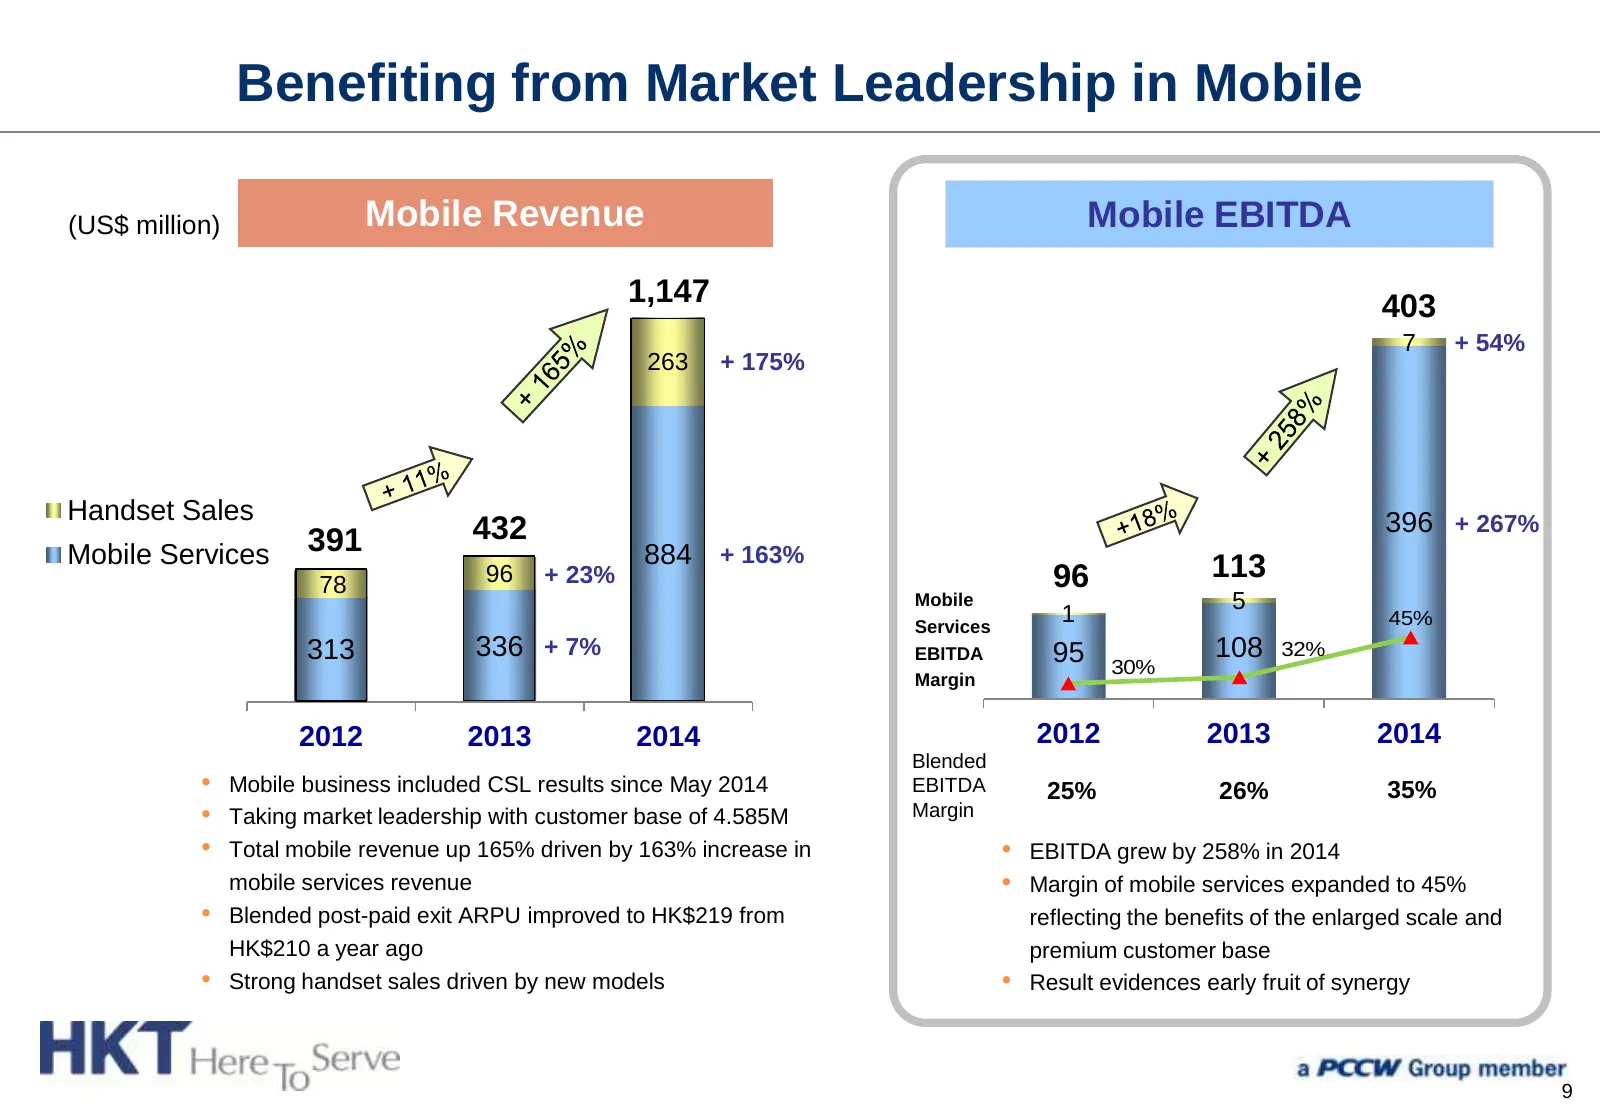
Benefiting from Market Leadership in Mobile (US$ million) Mobile Revenue Mobile EBITDA 1,147 403 7 + 54% 263 + 175% Handset Sales 396 + 267% 391 432 Mobile Services 884 + 163% 113 78 96 + 23% 96 Mobile 5 Services 1 45% 313 336 + 7% EBITDA 95 108 32% 30% Margin 2012 2013 2014 2012 2013 2014 Blended •
Slide 11: Sustained Growth within TSS
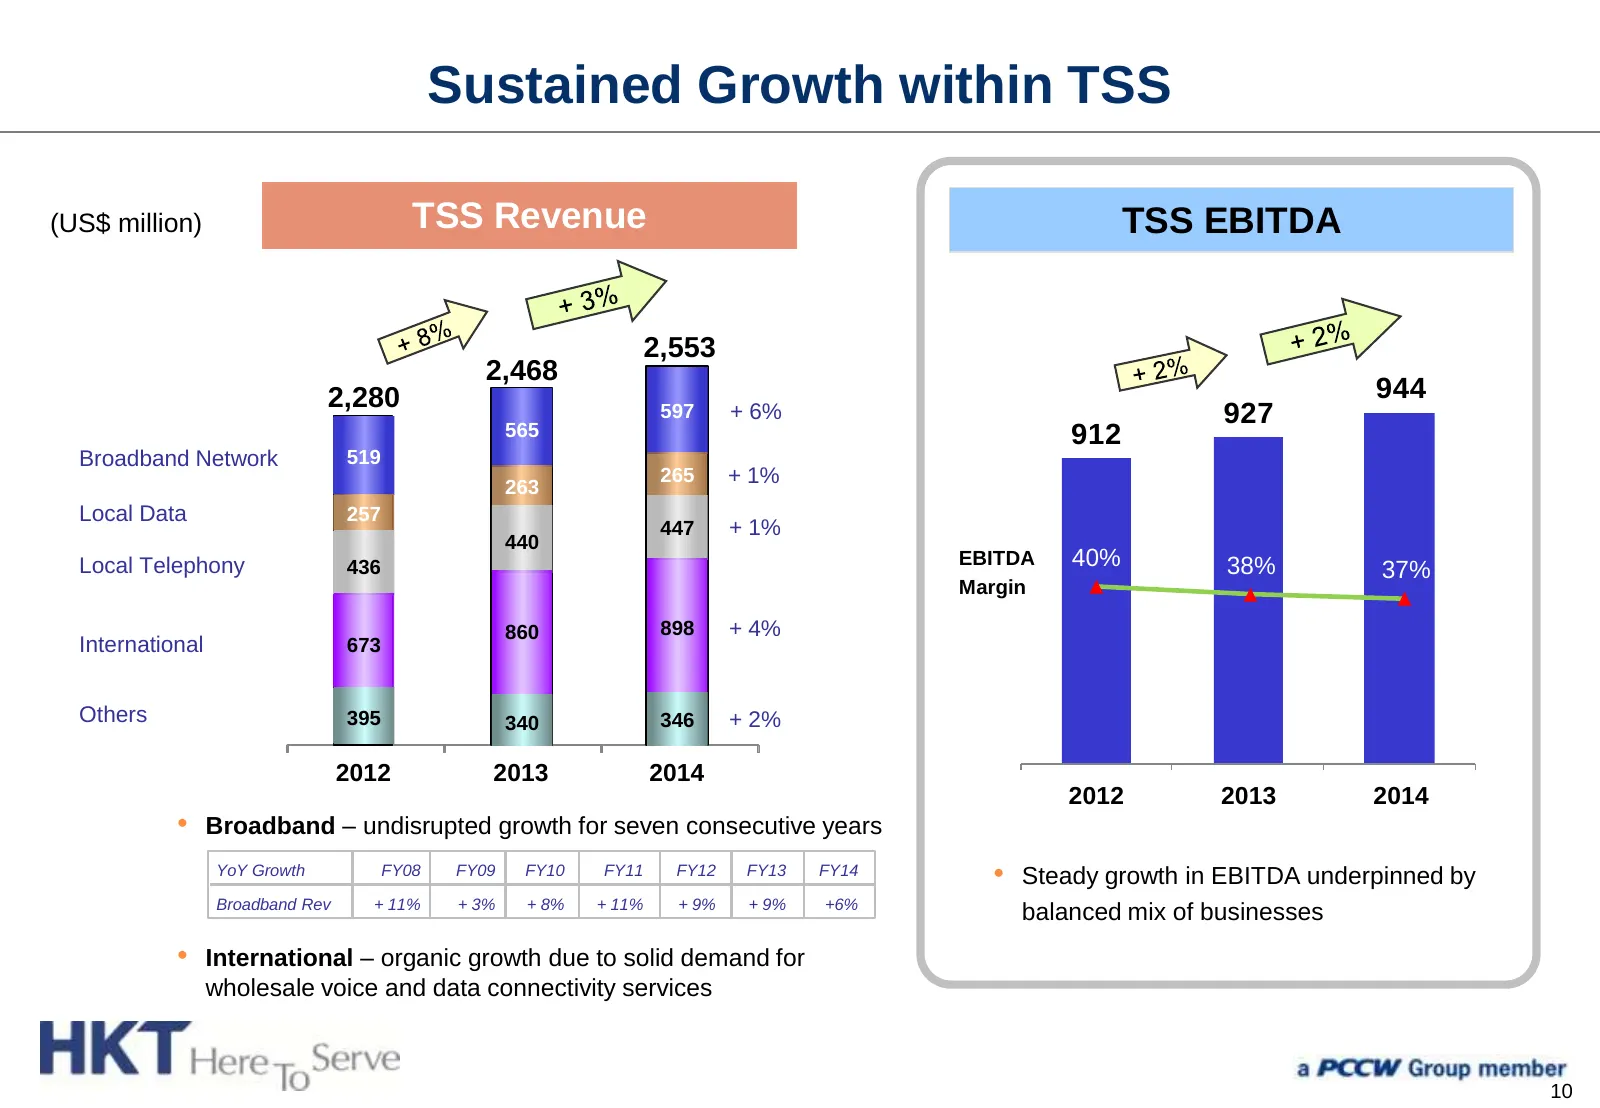
Sustained Growth within TSS (US$ million) TSS Revenue TSS EBITDA 2,553 2,468 2,280 944 565 597 + 6% 927 912 Broadband Network 519 263 265 + 1% Local Data 257 447 + 1% 440 Local Telephony 436 EBITDA 40% 38% 37% Margin 860 898 + 4% International 673 Others 395 340 346 + 2% 2012 2013 2014 2012 2013 201
Slide 12: TSS – Balanced Mix of Businesses
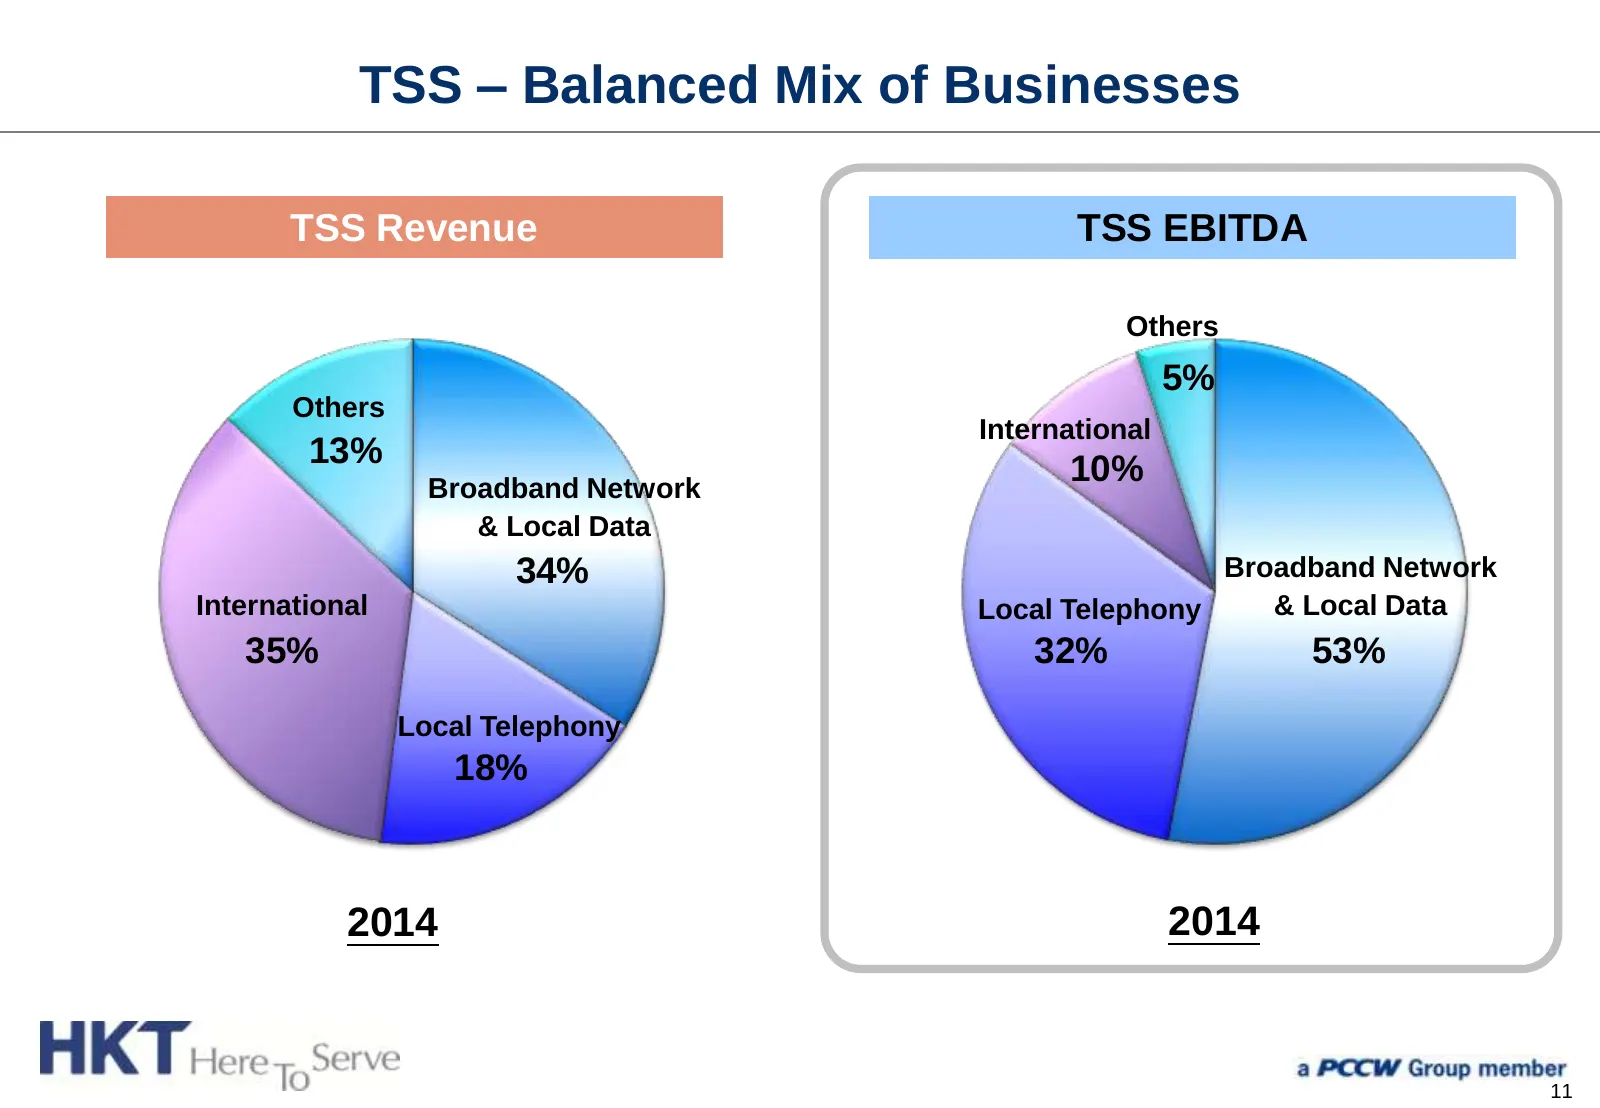
TSS – Balanced Mix of Businesses TSS Revenue TSS EBITDA Others 5% Others International 13% 10% Broadband Network & Local Data 34% Broadband Network International Local Telephony & Local Data 35% 32% 53% Local Telephony 18% 2014 2014 11
Slide 13: More Synergies Expected in Coming Periods
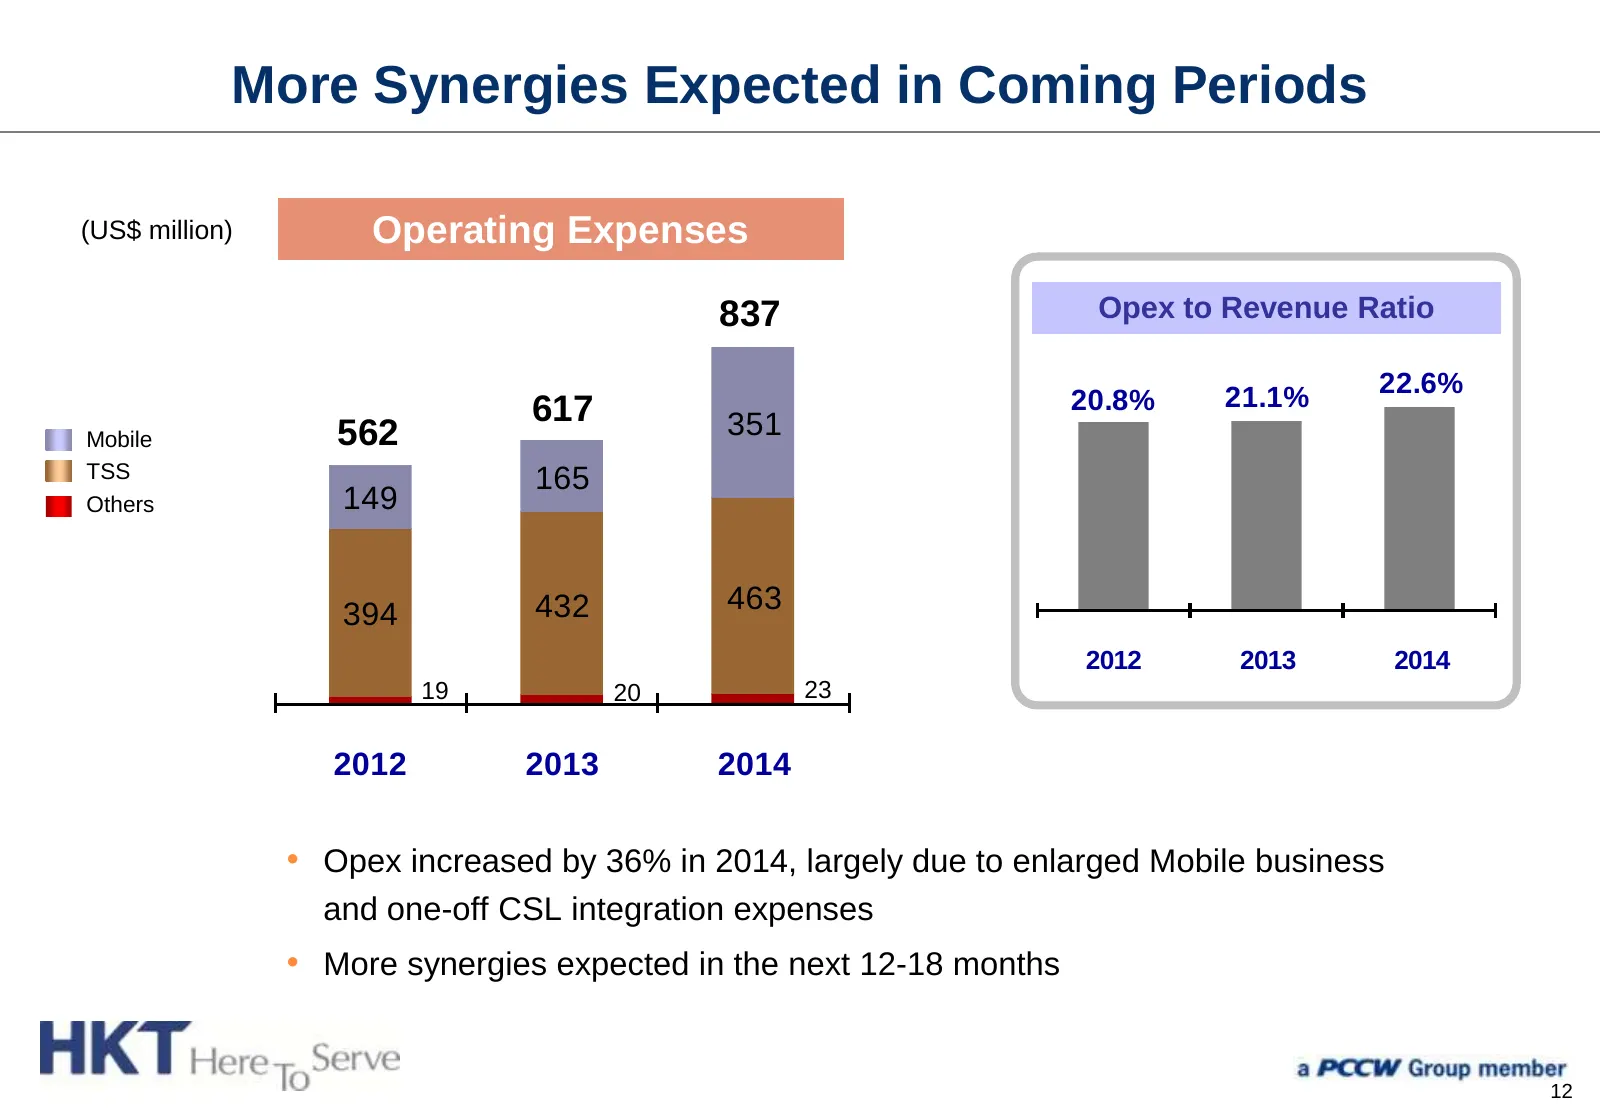
More Synergies Expected in Coming Periods (US$ million) Operating Expenses 837 Opex to Revenue Ratio 21.1% 22.6% 617 20.8% Mobile 562 351 TSS 165 Others 149 432 463 394 2012 2013 2014 19 20 23 2012 2013 2014 • Opex increased by 36% in 2014, largely due to enlarged Mobile business and one-off CSL int
Slide 14: Customer Acquisition Costs
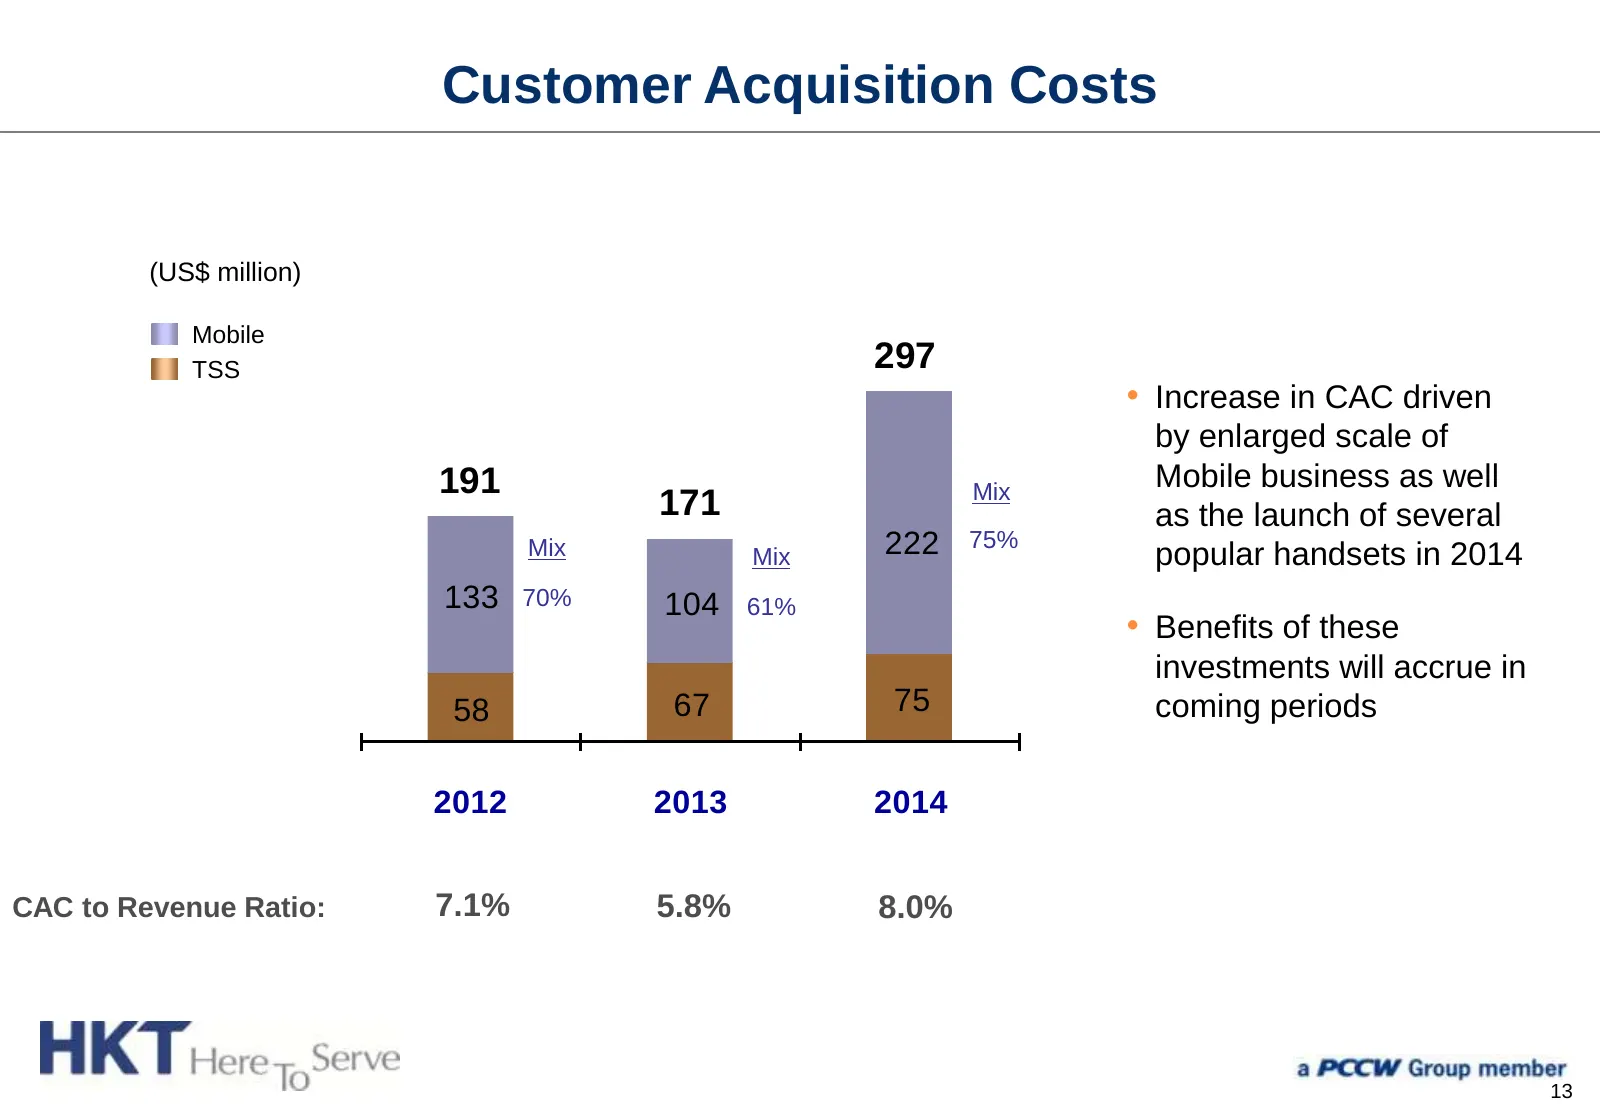
Customer Acquisition Costs (US$ million) Mobile TSS 297 • Increase in CAC driven by enlarged scale of 191 Mix Mobile business as well 171 as the launch of several Mix Mix 222 75% popular handsets in 2014 133 70% 104 61% • Benefits of these investments will accrue in 58 67 75 coming periods 2012 2013
Slide 15: Capex Efficiency Continues to Improve
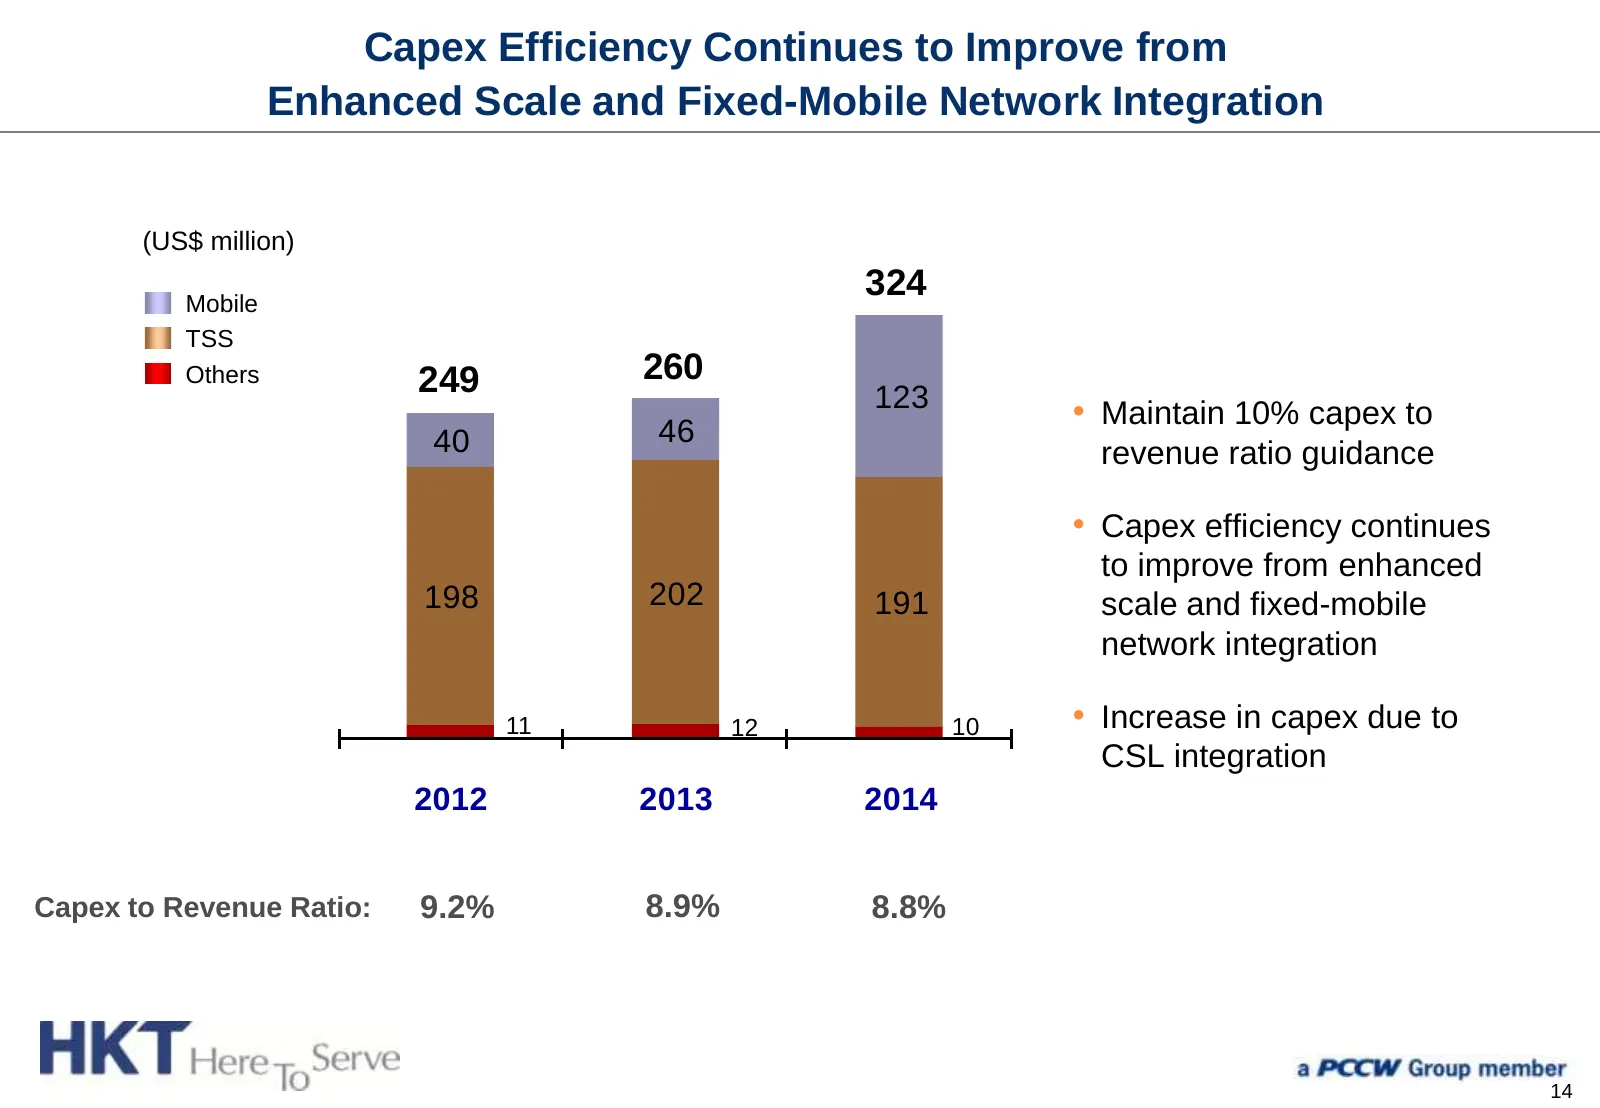
Capex Efficiency Continues to Improve from Enhanced Scale and Fixed-Mobile Network Integration (US$ million) Mobile 324 TSS Others 249 260 123 46 • Maintain 10% capex to 40 revenue ratio guidance • Capex efficiency continues to improve from enhanced 198 202 191 scale and fixed-mobile network integra
Slide 16: Adjusted Funds Flow
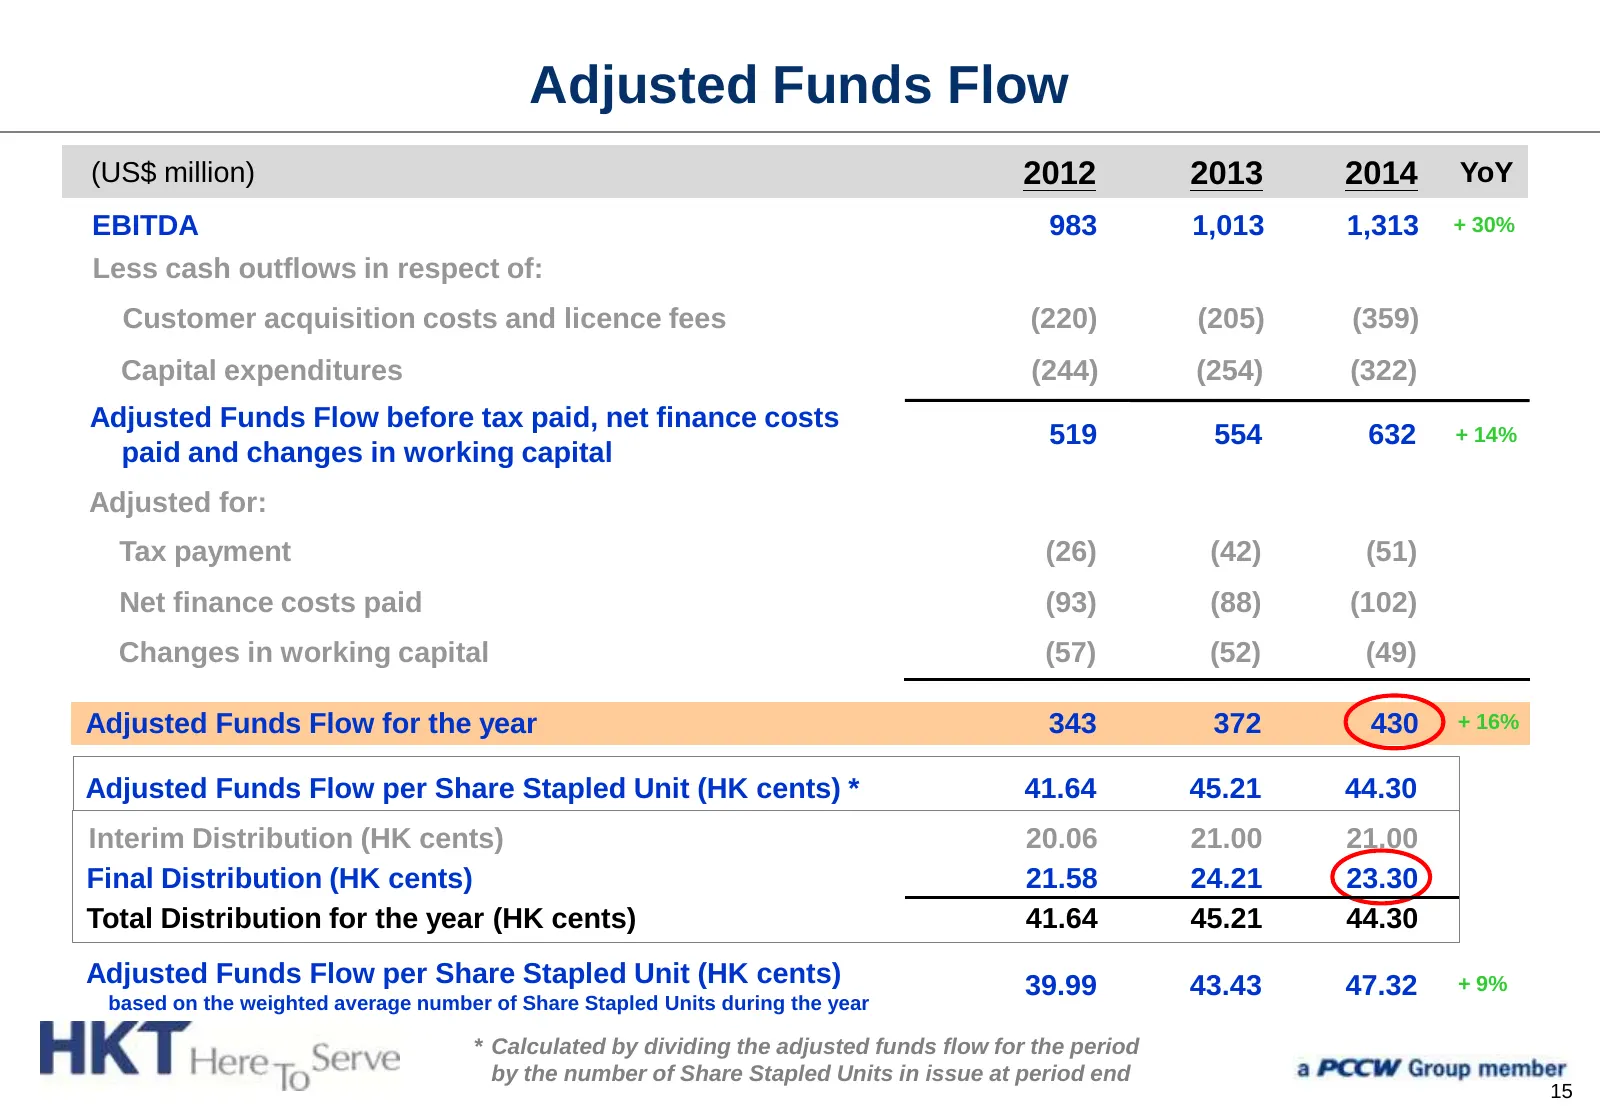
Adjusted Funds Flow (US$ million) 2012 2013 2014 YoY EBITDA 983 1,013 1,313 + 30% Less cash outflows in respect of: Customer acquisition costs and licence fees (220) (205) (359) Capital expenditures (244) (254) (322) Adjusted Funds Flow before tax paid, net finance costs 519 554 632 + 14% paid and c
Slide 17: Income Statement
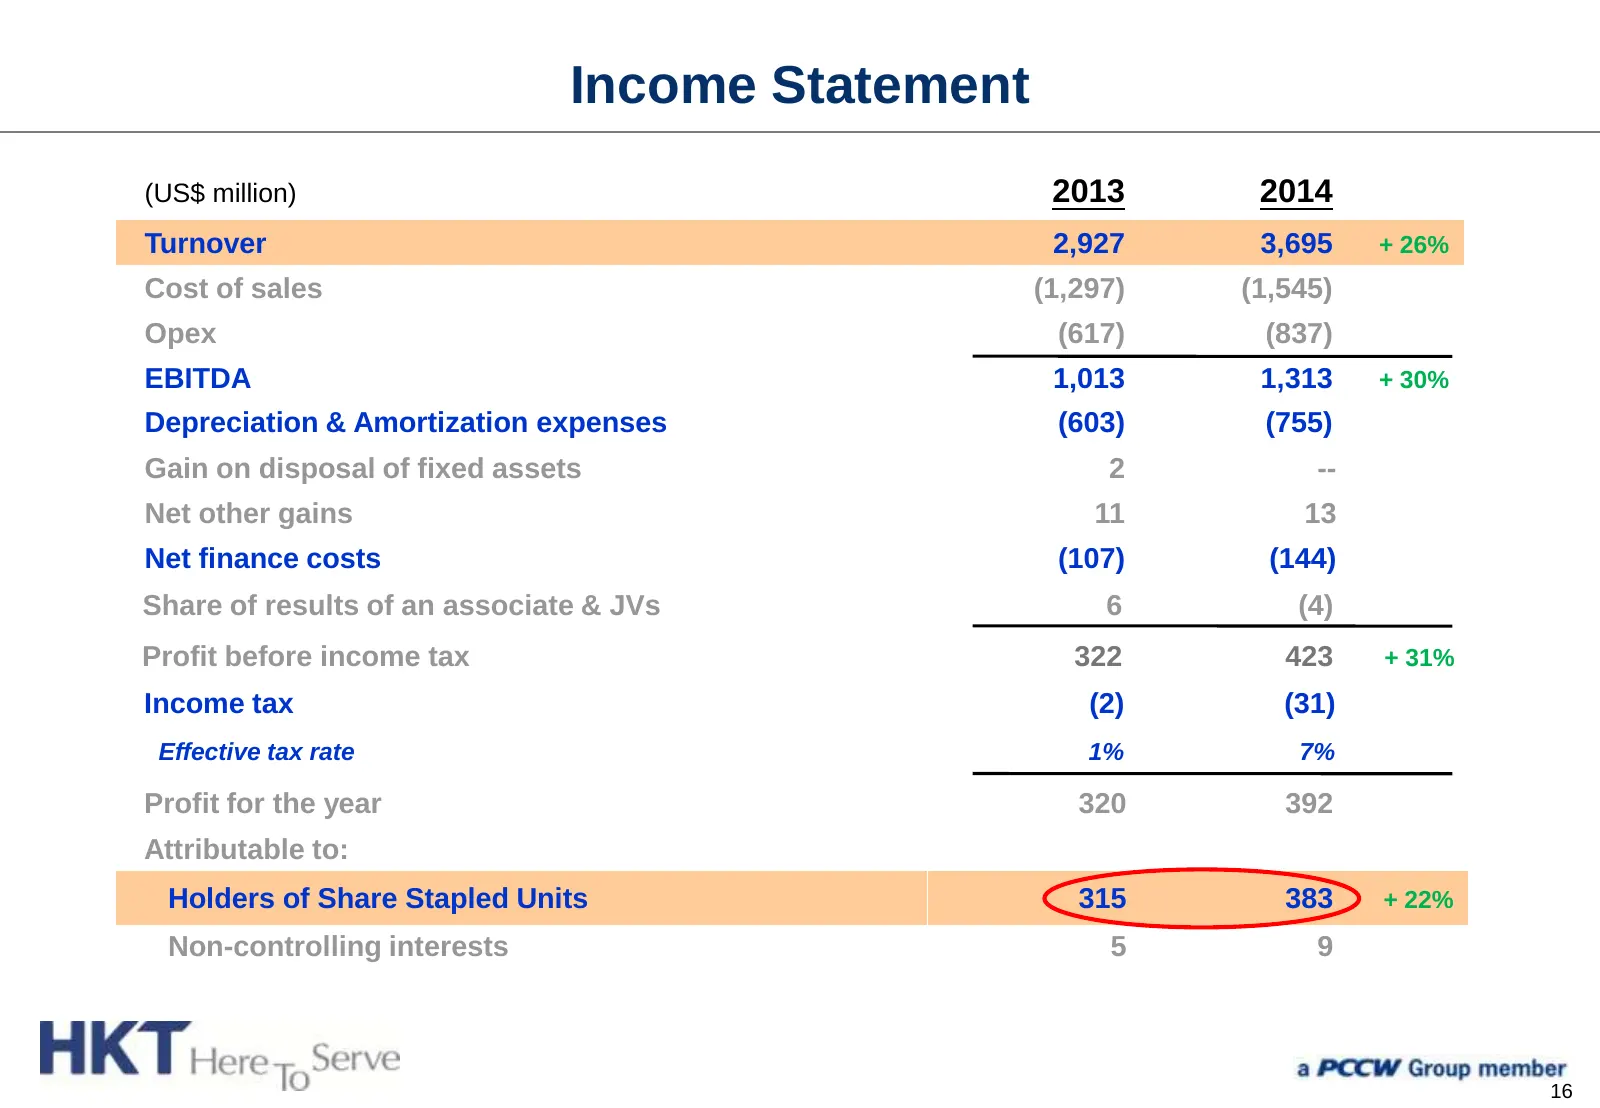
Income Statement (US$ million) 2013 2014 Turnover 2,927 3,695 + 26% Cost of sales (1,297) (1,545) Opex (617) (837) EBITDA 1,013 1,313 + 30% Depreciation & Amortization expenses (603) (755) Gain on disposal of fixed assets 2 -- Net other gains 11 13 Net finance costs (107) (144) Share of results of a
Slide 18: Maintaining a Solid Financial Position
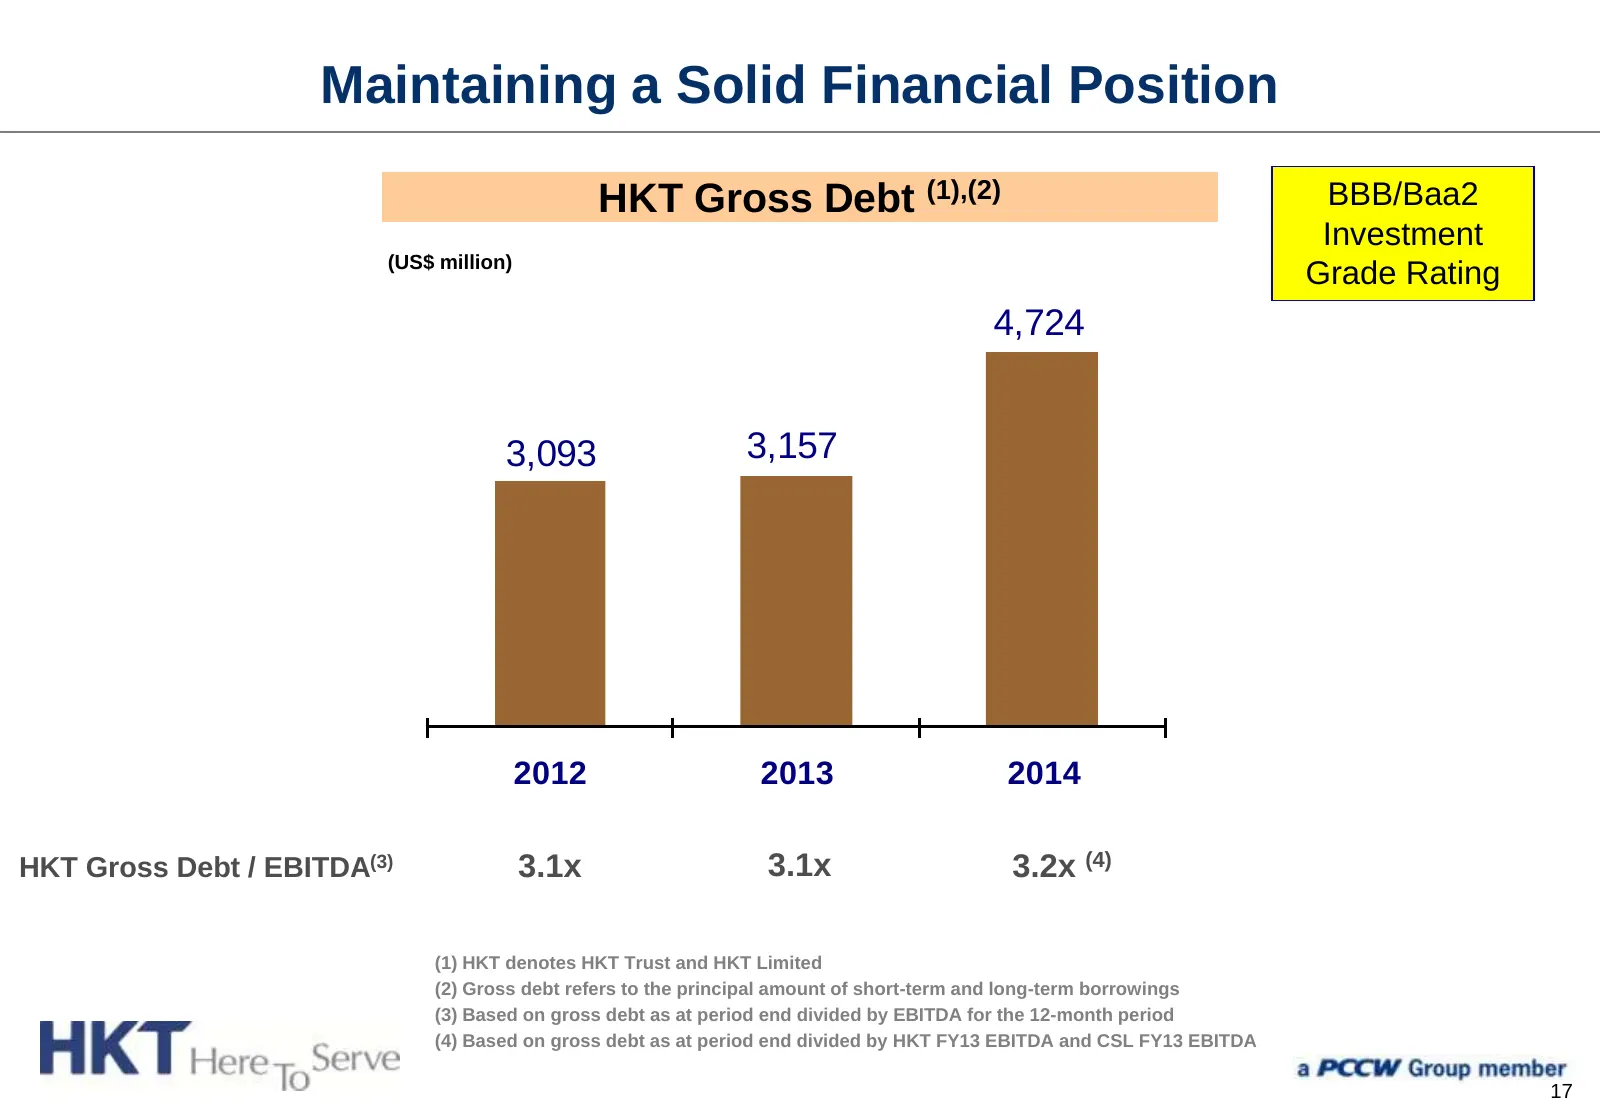
Maintaining a Solid Financial Position HKT Gross Debt (1),(2) BBB/Baa2 Investment (US$ million) Grade Rating 4,724 3,093 3,157 2012 2013 2014 HKT Gross Debt / EBITDA(3) 3.1x 3.1x 3.2x (4) (1) HKT denotes HKT Trust and HKT Limited (2) Gross debt refers to the principal amount of short-term and long-t
Slide 19: Debt Maturity Profile
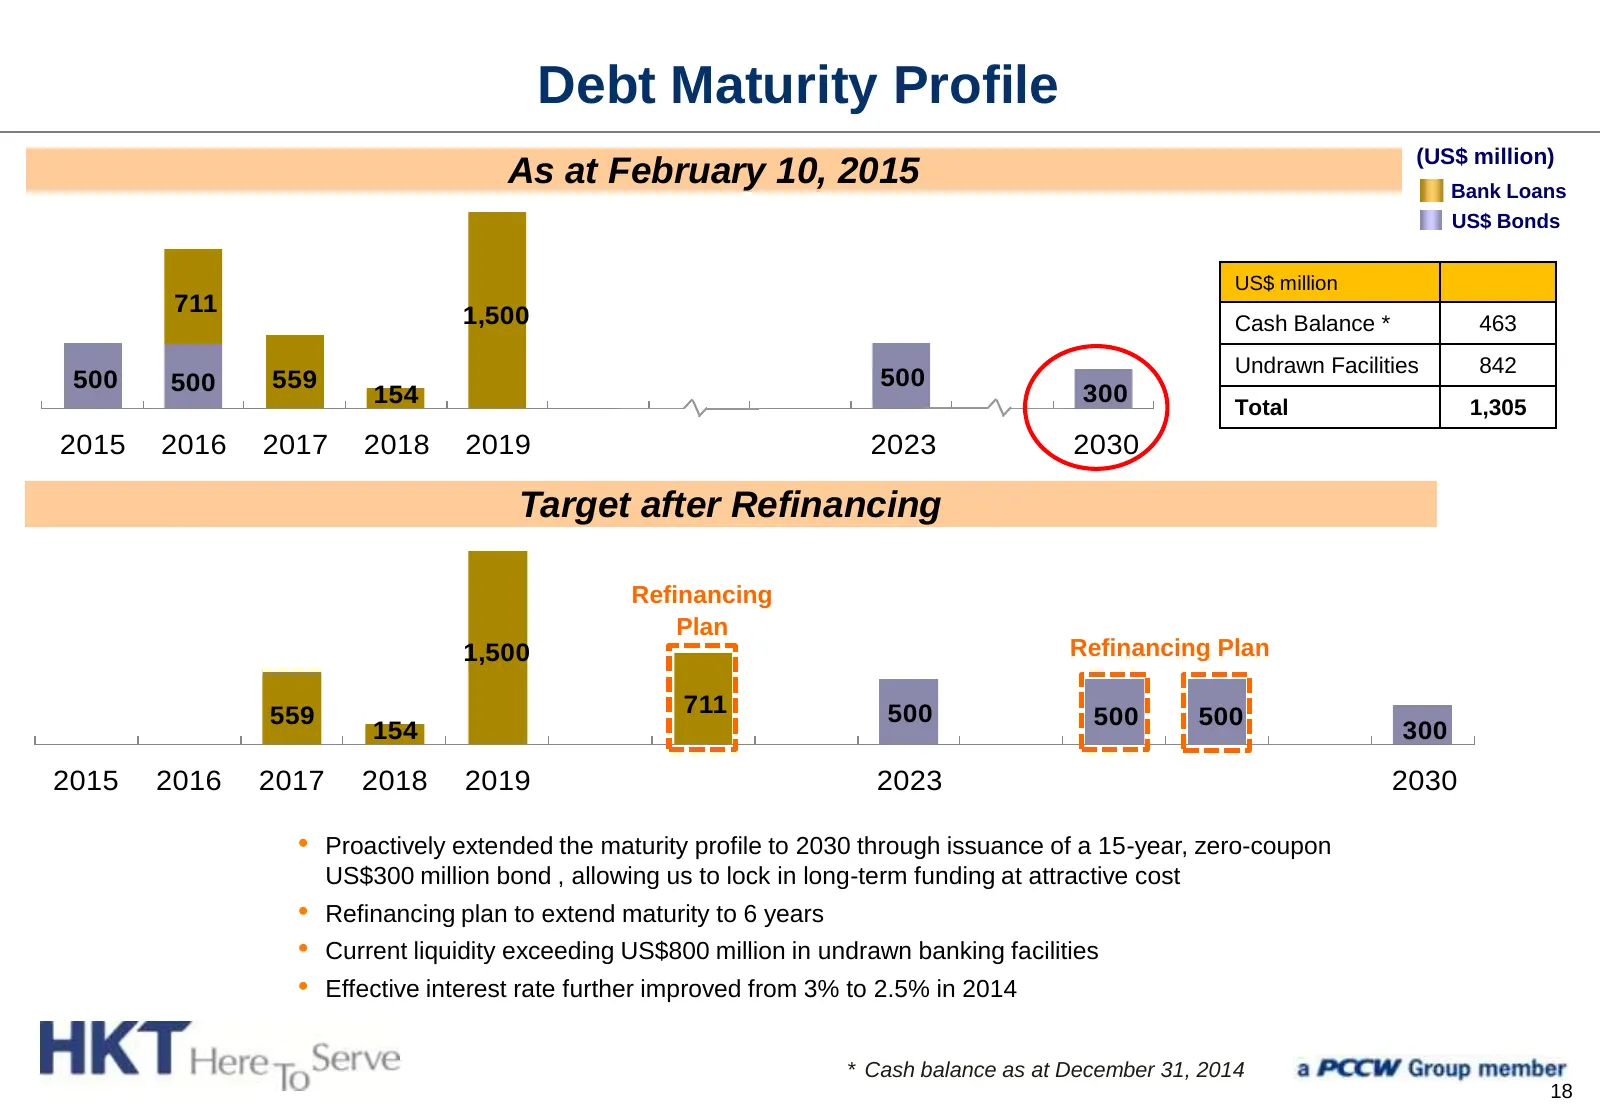
Debt Maturity Profile (US$ million) As at February 10, 2015 Bank Loans US$ Bonds US$ million 711 1,500 Cash Balance * 463 Undrawn Facilities 842 500 500 559 500 154 300 Total 1,305 2015 2016 2017 2018 2019 2023 2030 Target after Refinancing Refinancing Plan 1,500 Refinancing Plan 559 711 500 500 500
Slide 20: Business Review
Business Review Alex Arena Group Managing Director 19
Slide 21: Financial Results Underpinned by Rapid Progress on Integration
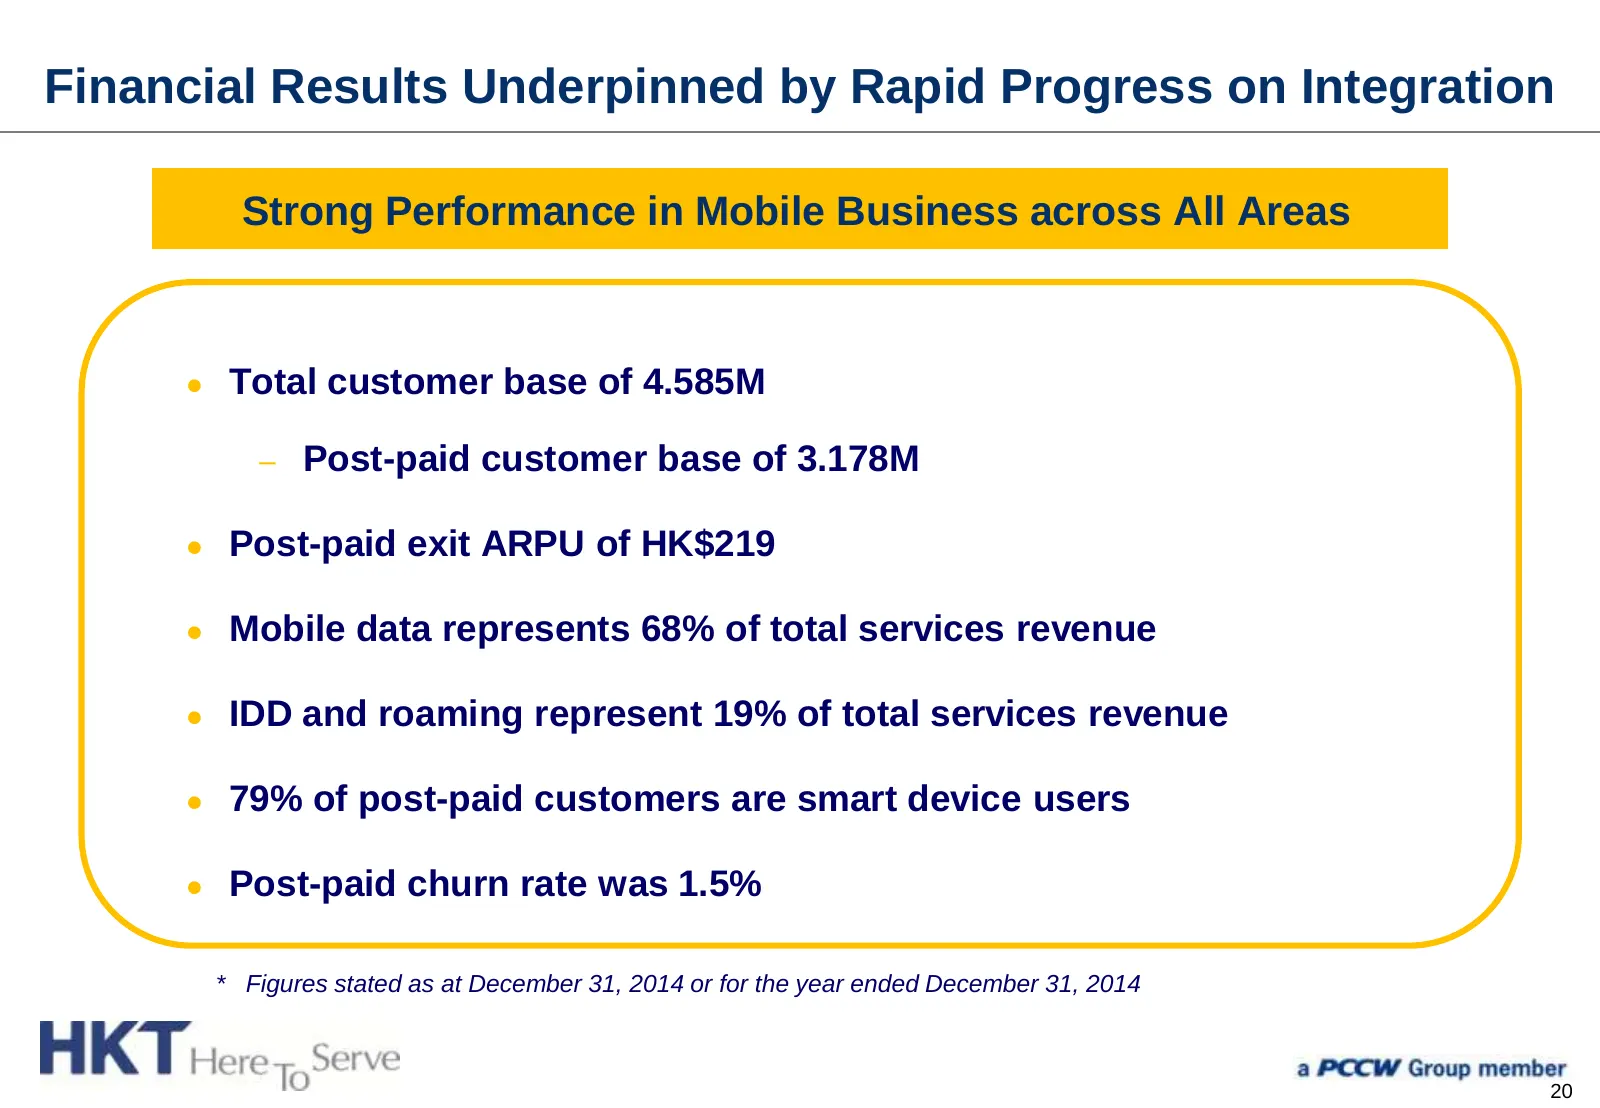
Financial Results Underpinned by Rapid Progress on Integration Strong Performance in Mobile Business across All Areas ● Total customer base of 4.585M – Post-paid customer base of 3.178M ● Post-paid exit ARPU of HK$219 ● Mobile data represents 68% of total services revenue ● IDD and roaming represent
Slide 22: Delivering on CSL Integration
Delivering on CSL Integration Branding Rationalized Retail Channels Revamped Pricing Plans Network Enhancement Network Integration 21
Slide 23: Branding
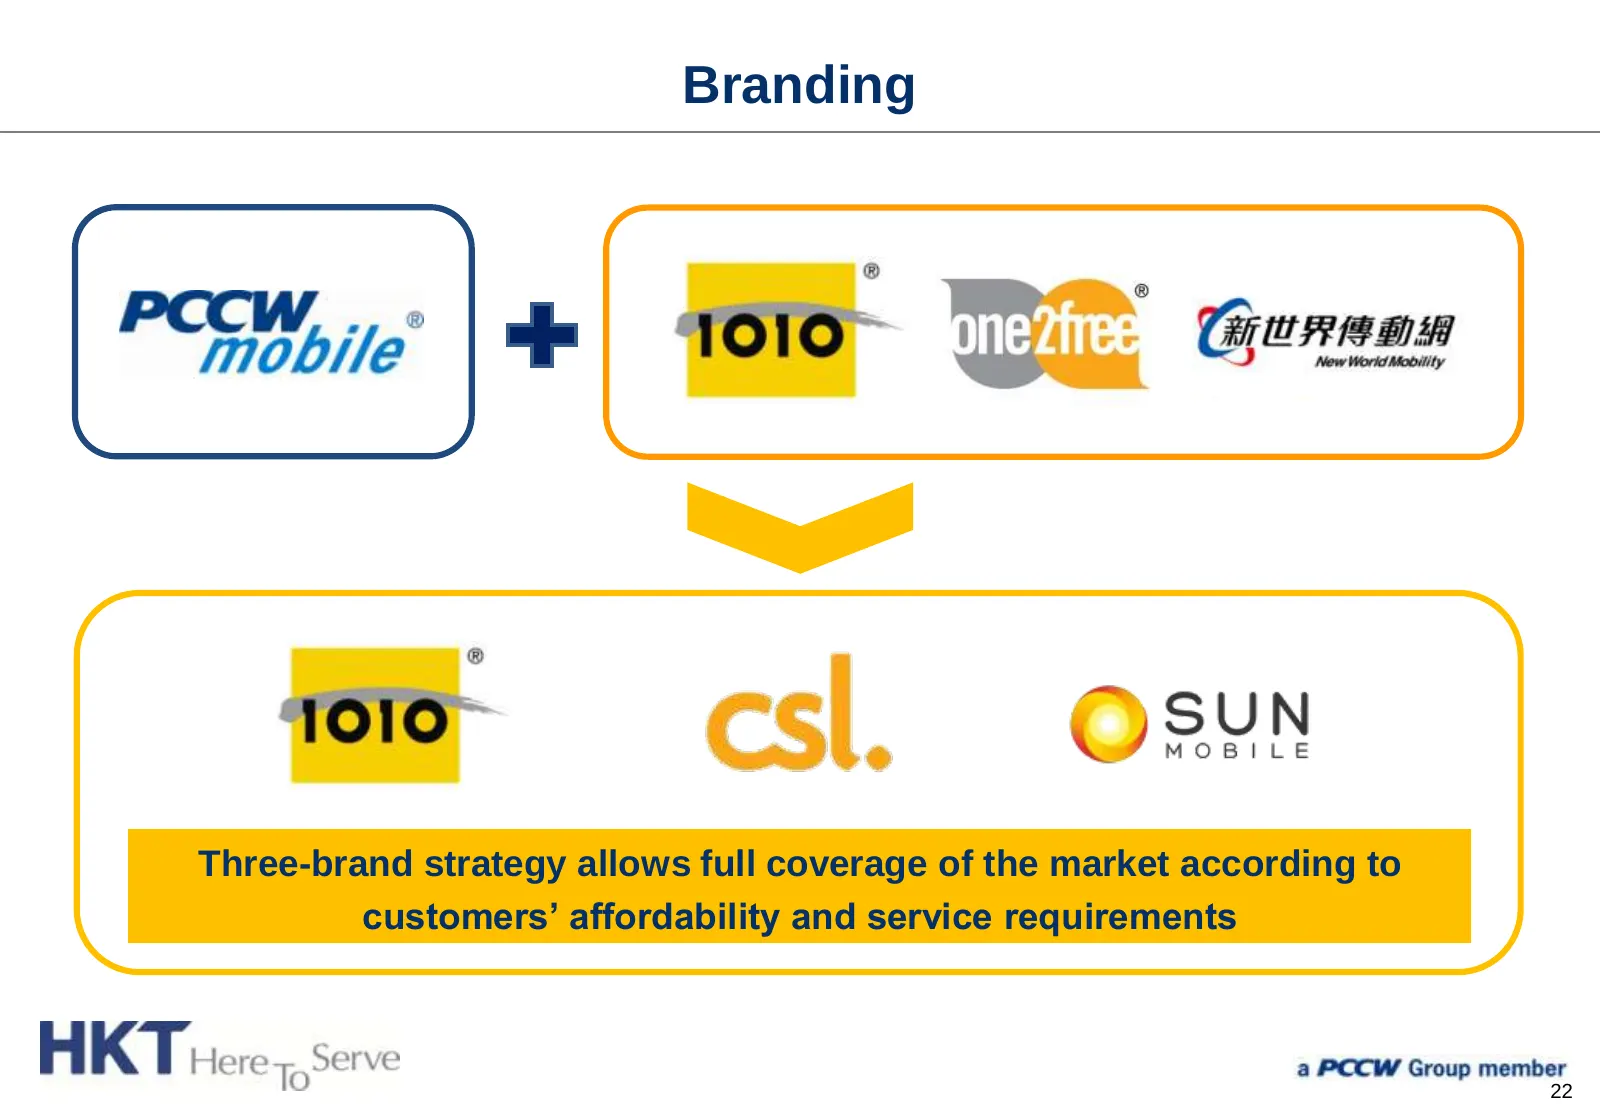
Branding Three-brand strategy allows full coverage of the market according to customers’ affordability and service requirements 22
Slide 24: Rationalized Retail Channels
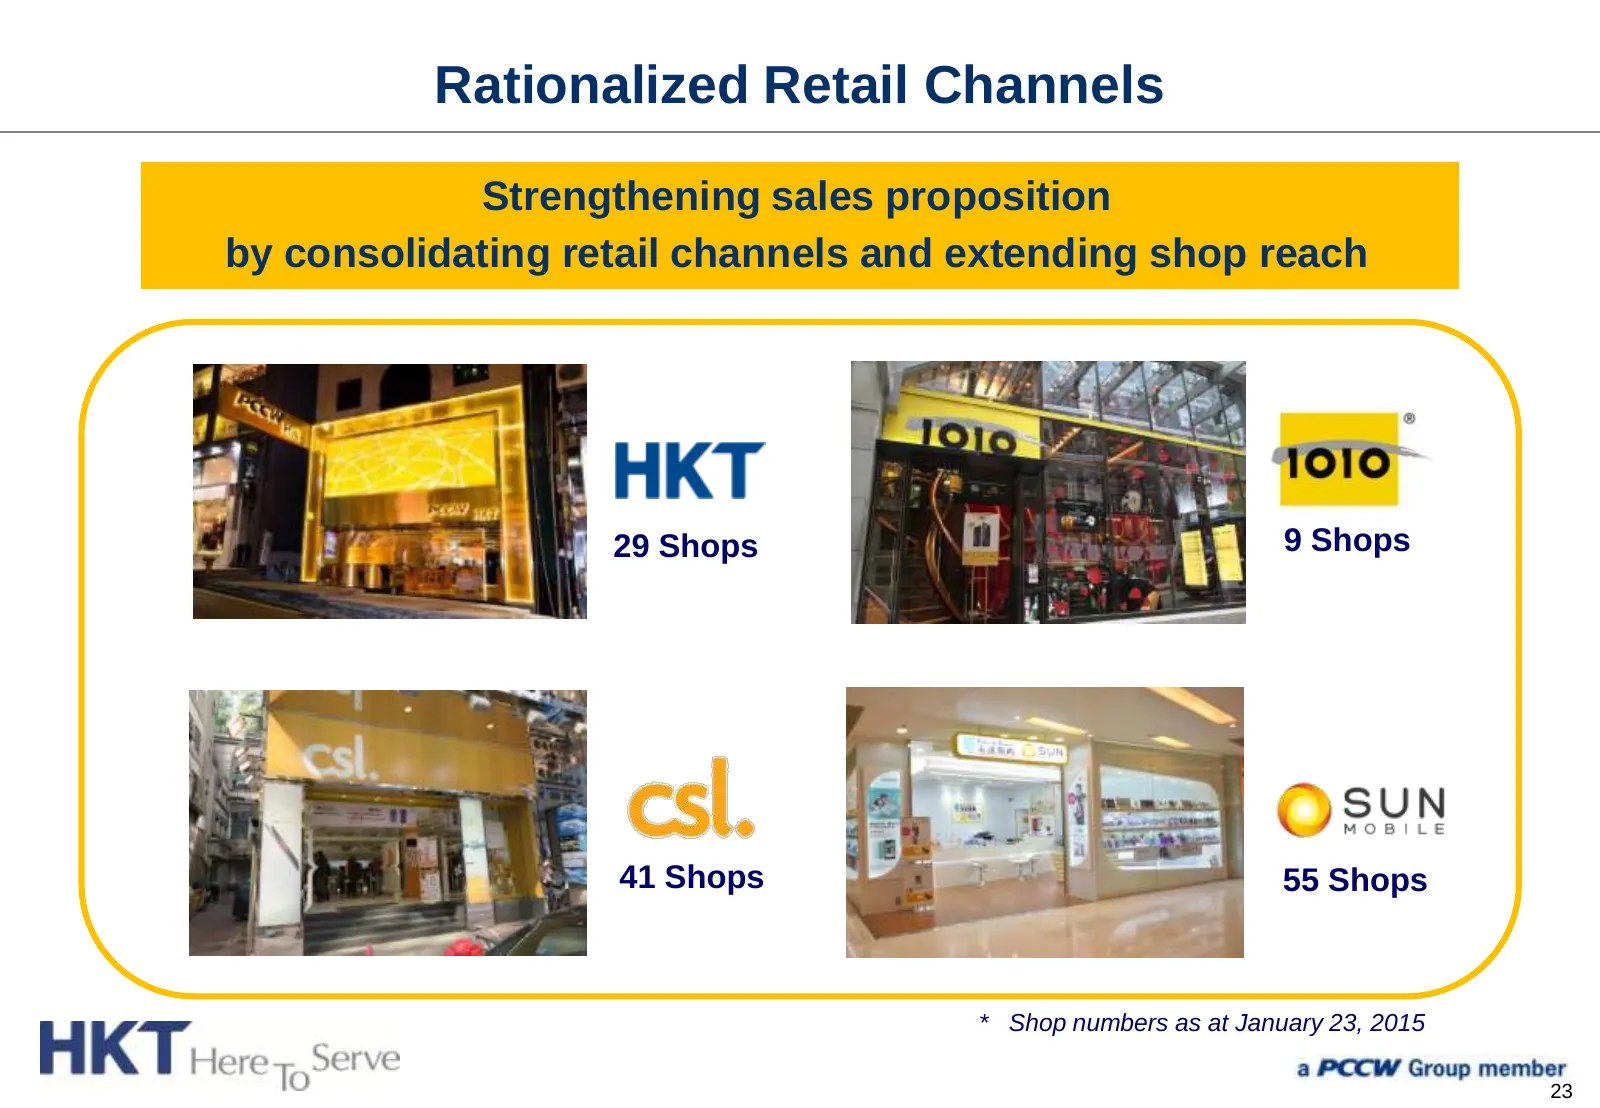
Rationalized Retail Channels Strengthening sales proposition by consolidating retail channels and extending shop reach 29 Shops 9 Shops 41 Shops 55 Shops * Shop numbers as at January 23, 2015 23
Slide 25: Revamped Pricing Plans
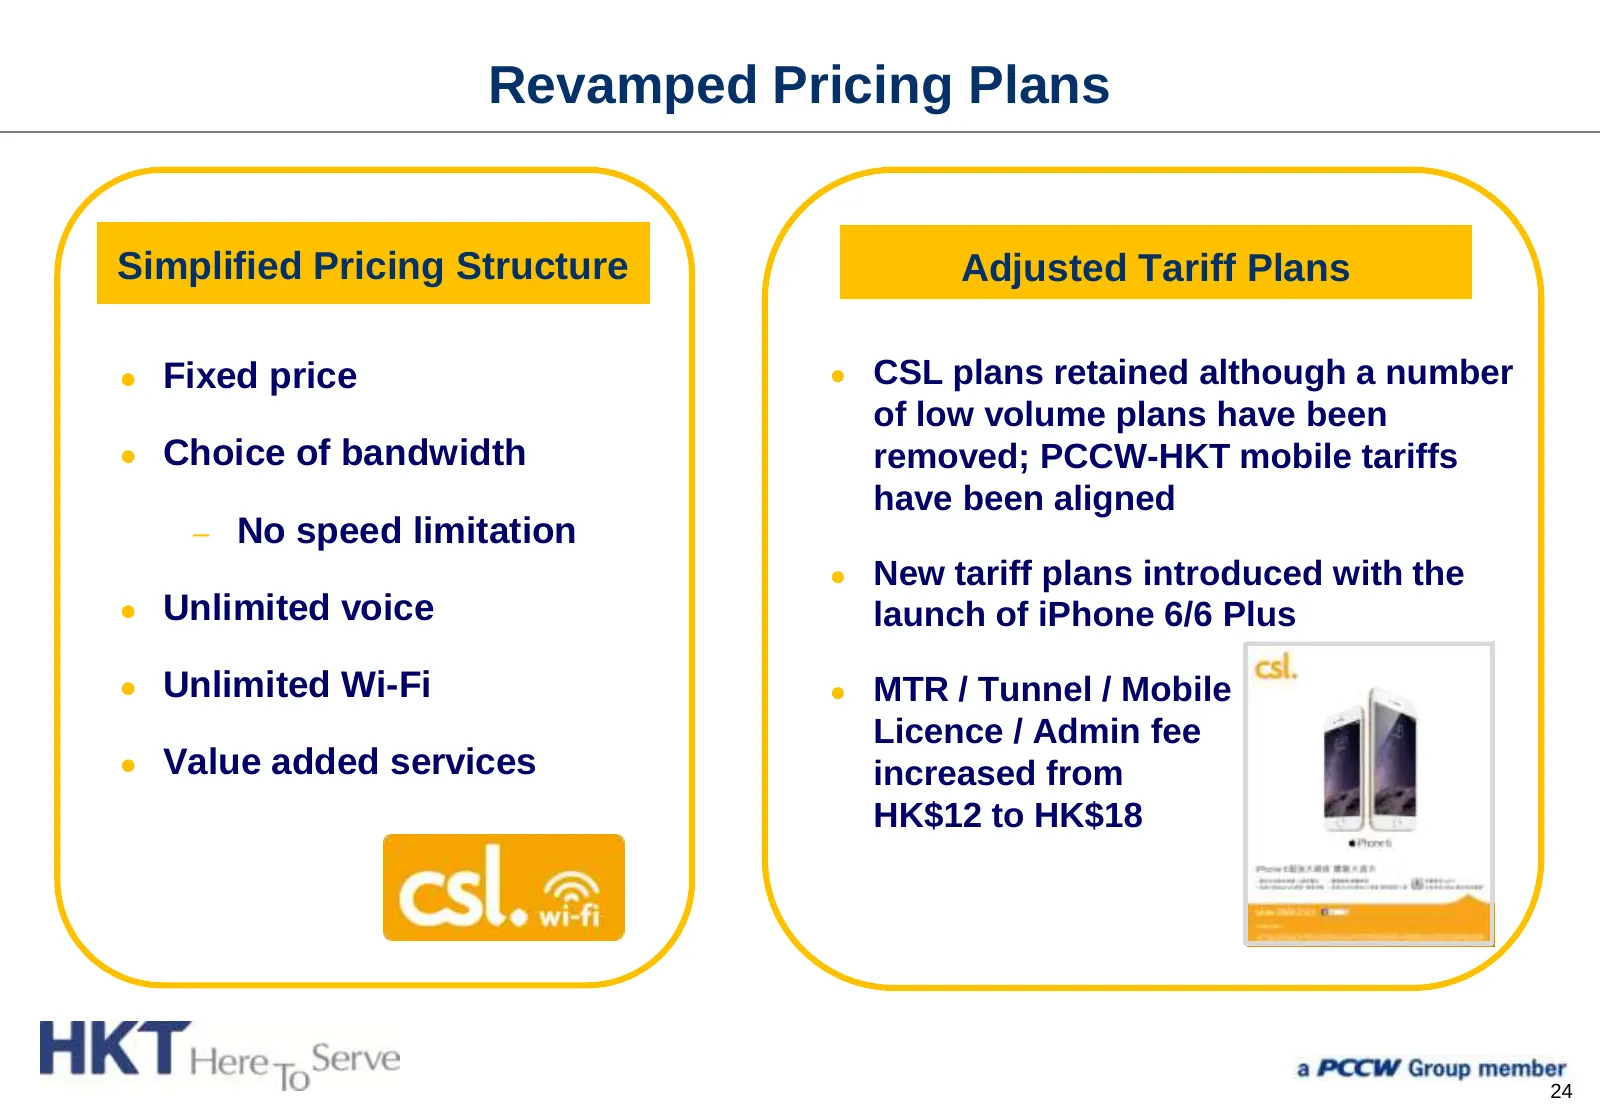
Revamped Pricing Plans Simplified Pricing Structure Adjusted Tariff Plans ● Fixed price ● CSL plans retained although a number of low volume plans have been ● Choice of bandwidth removed; PCCW-HKT mobile tariffs have been aligned – No speed limitation ● New tariff plans introduced with the ● Unlimit
Slide 26: Mobile Network Improvements after CSL Acquisition
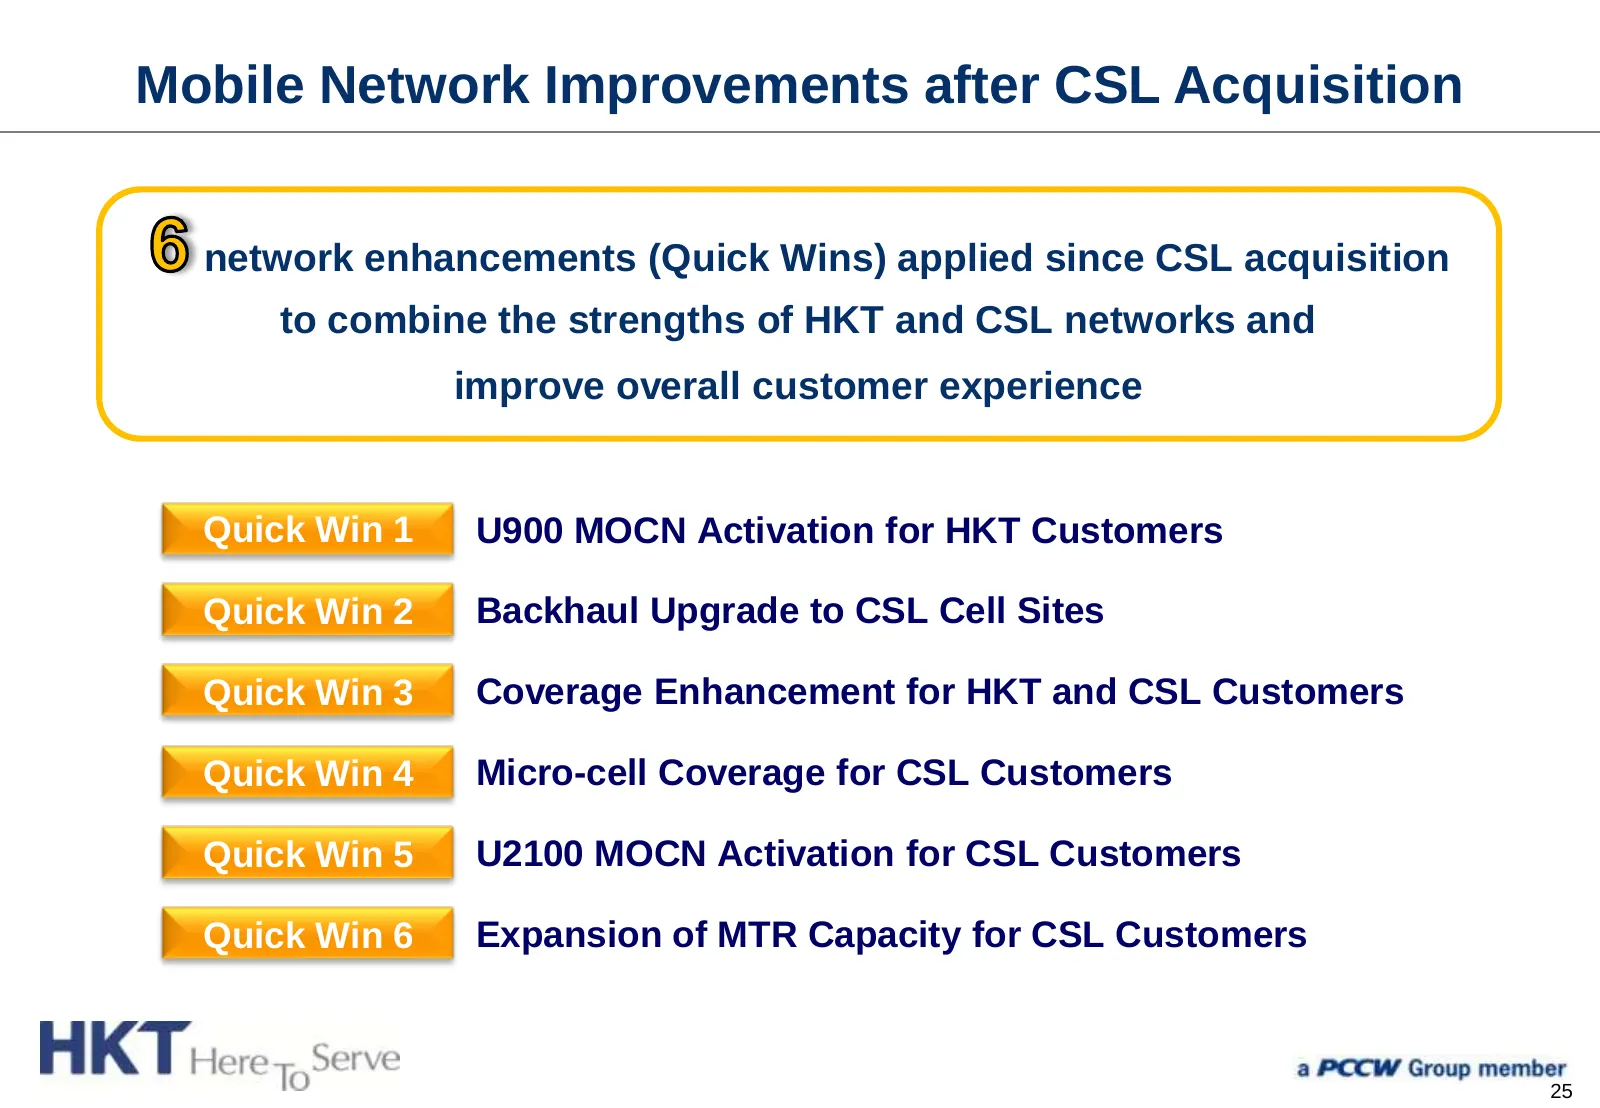
Mobile Network Improvements after CSL Acquisition network enhancements (Quick Wins) applied since CSL acquisition to combine the strengths of HKT and CSL networks and improve overall customer experience Quick Win 1 U900 MOCN Activation for HKT Customers Quick Win 2 Backhaul Upgrade to CSL Cell Sites
Slide 27: QW1 – U900 MOCN Activation for HKT Customers
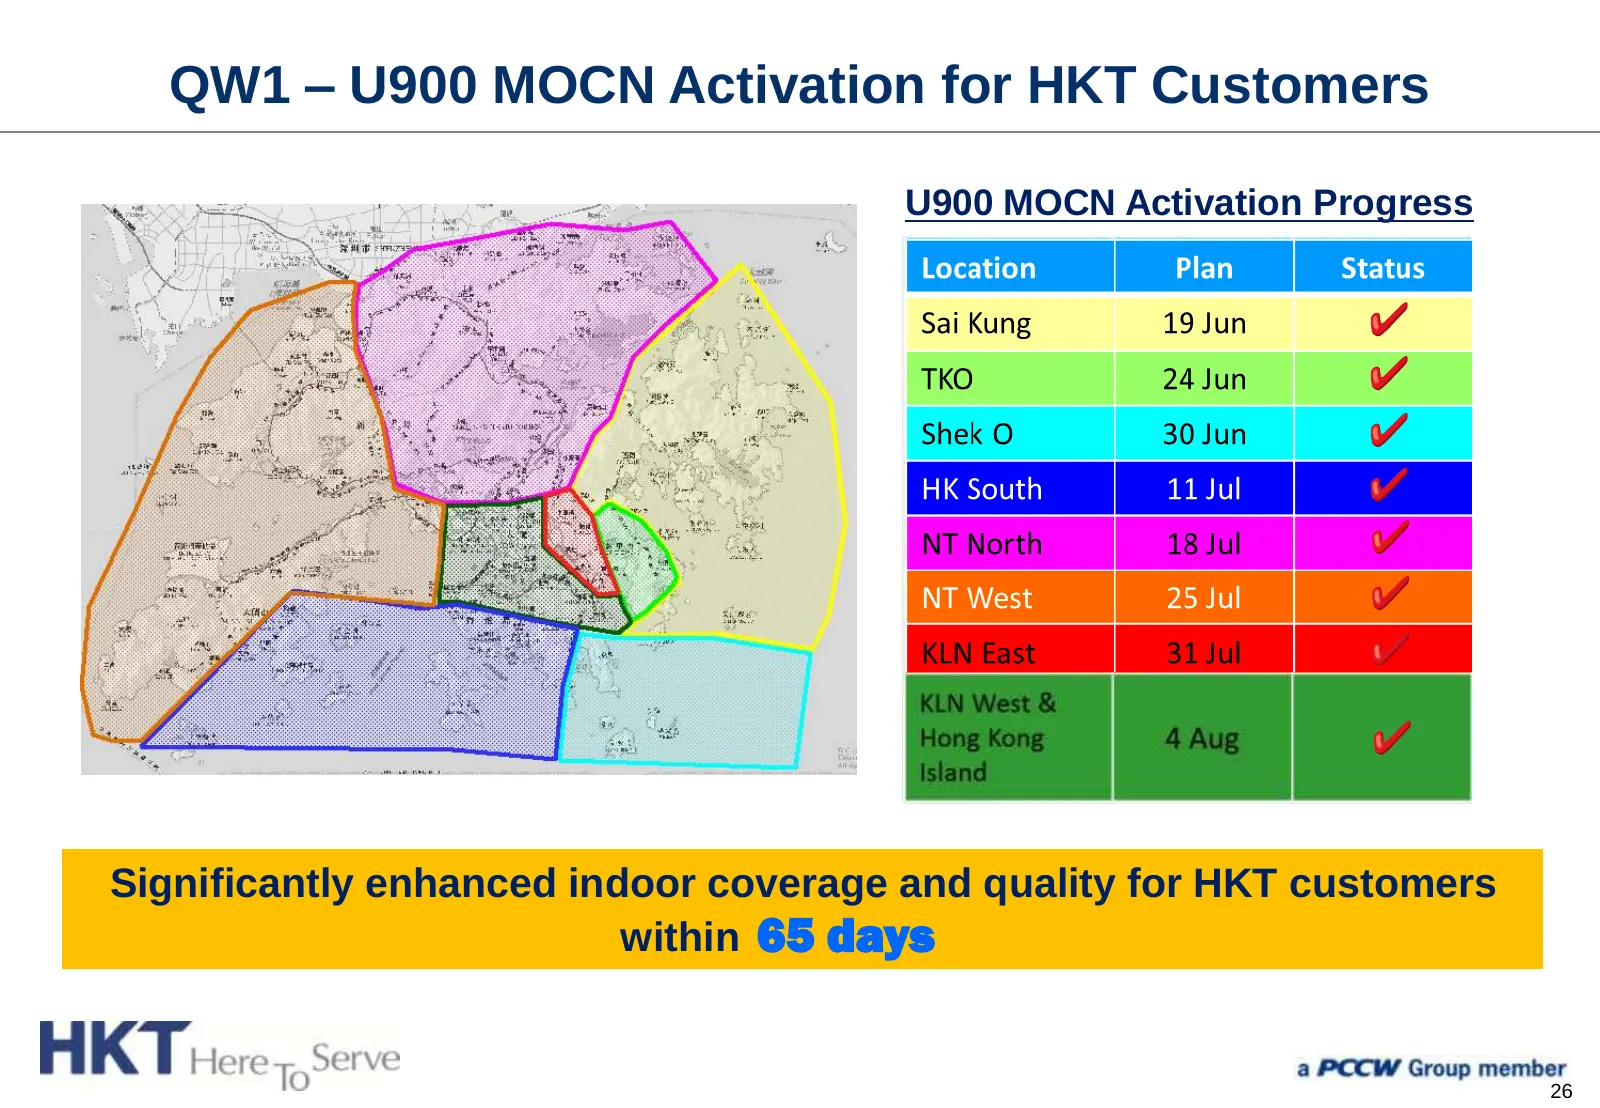
QW1 – U900 MOCN Activation for HKT Customers U900 MOCN Activation Progress Location Plan Status Sai Kung 19 Jun TKO 24 Jun Shek O 30 Jun HK South 11 Jul NT North 18 Jul NT West 25 Jul KLN East 31 Jul KLN West & Hong Kong 4 Aug Island Significantly enhanced indoor coverage and quality for HKT custome
Slide 28: QW2 – Backhaul Upgrade to CSL Cell Sites
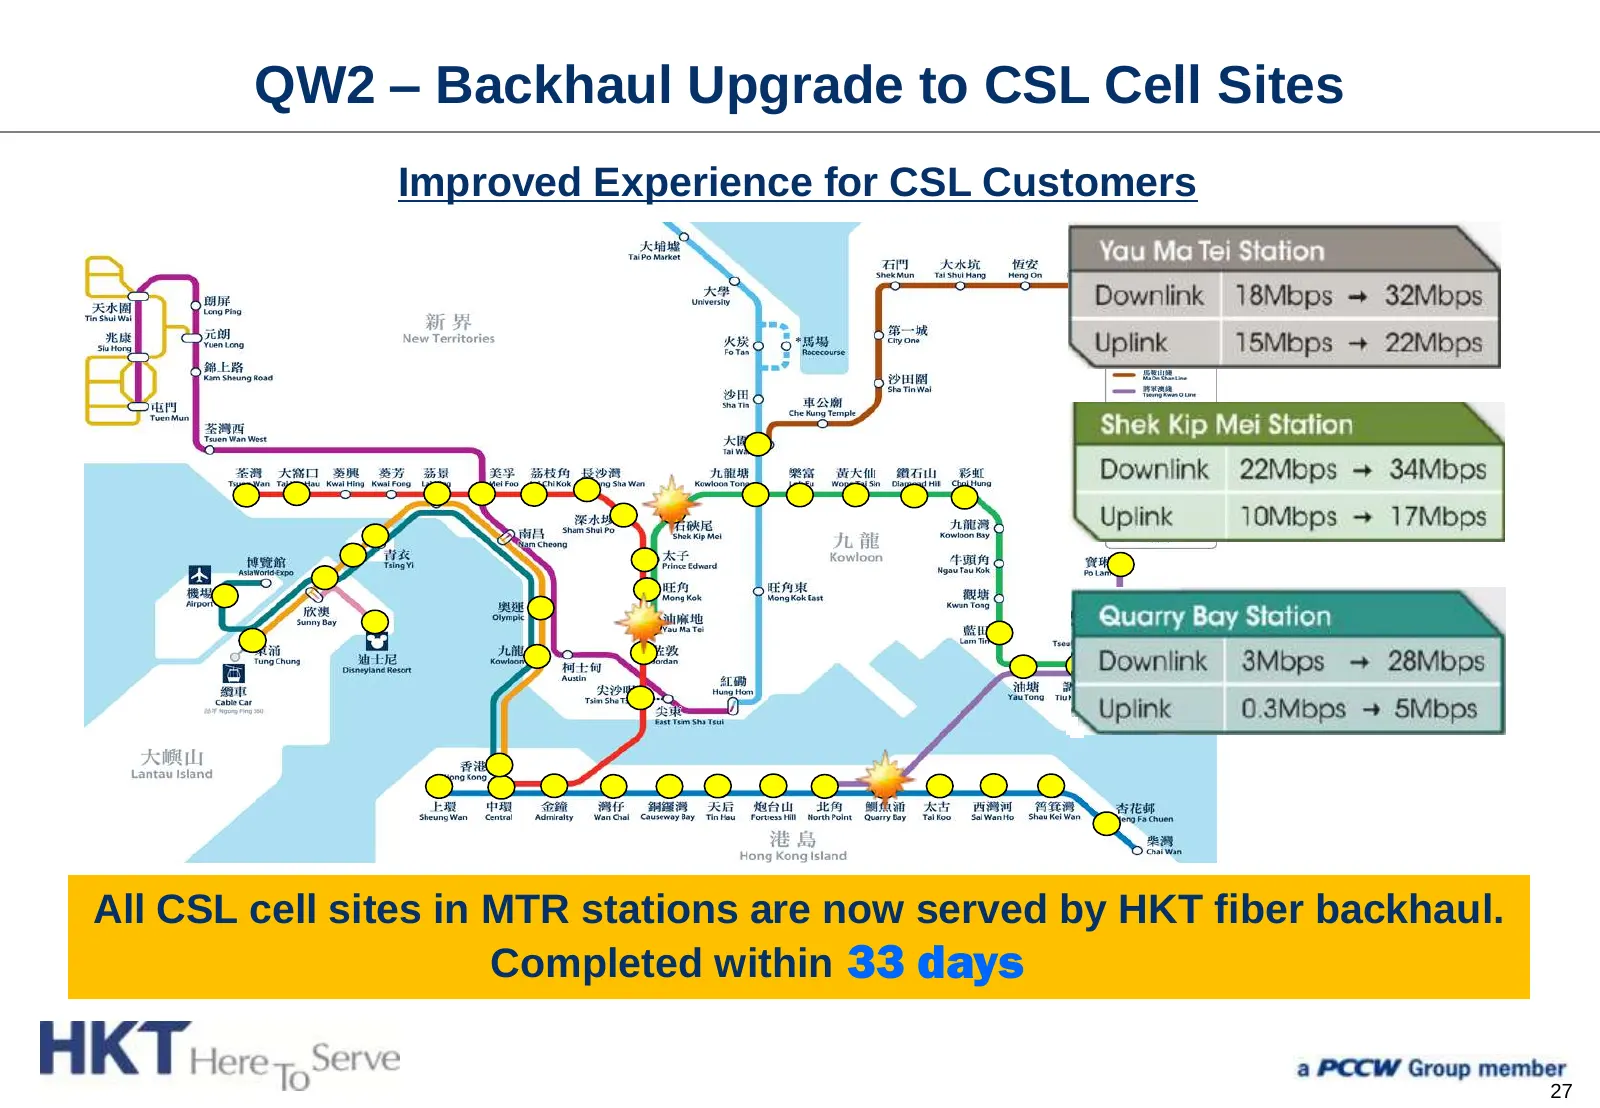
QW2 – Backhaul Upgrade to CSL Cell Sites Improved Experience for CSL Customers All CSL cell sites in MTR stations are now served by HKT fiber backhaul. Completed within 33 days 27
Slide 29: QW2 – Backhaul Upgrade to CSL Cell Sites
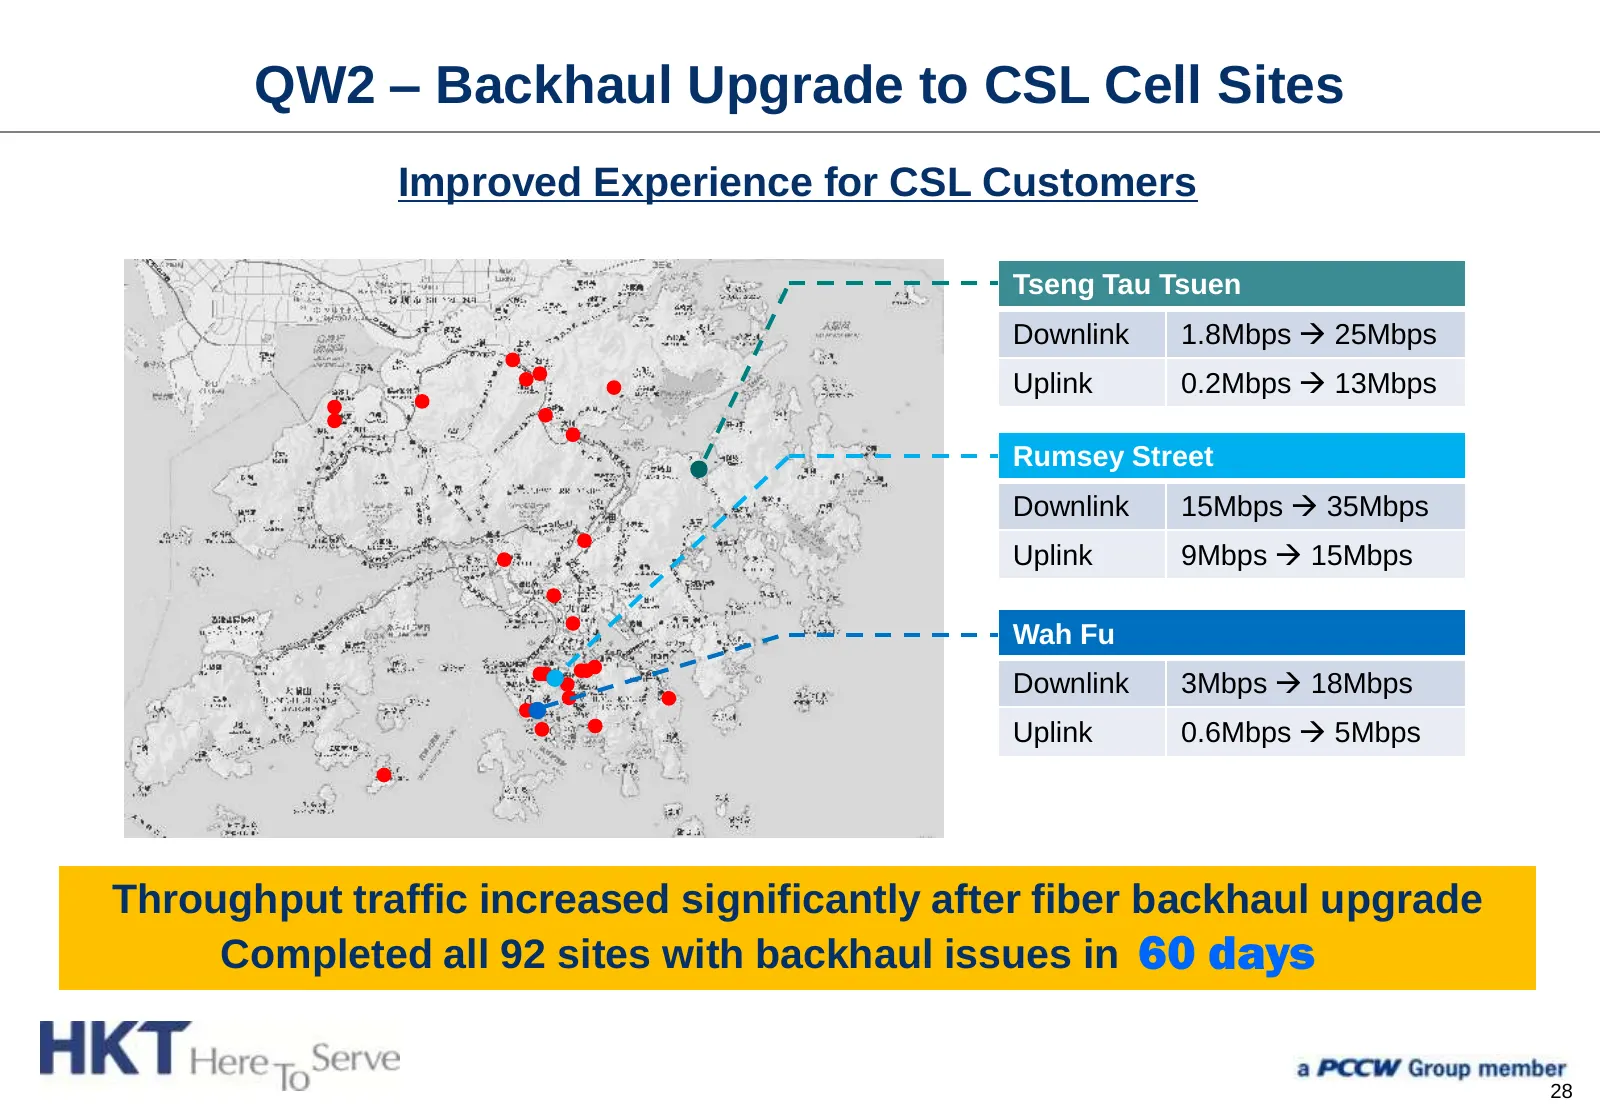
QW2 – Backhaul Upgrade to CSL Cell Sites Improved Experience for CSL Customers Tseng Tau Tsuen Downlink 1.8Mbps 25Mbps Uplink 0.2Mbps 13Mbps Rumsey Street Downlink 15Mbps 35Mbps Uplink 9Mbps 15Mbps Wah Fu Downlink 3Mbps 18Mbps Uplink 0.6Mbps 5Mbps Throughput traffic increased significant
Slide 30: QW3 – Coverage Enhancement for HKT and CSL Customers
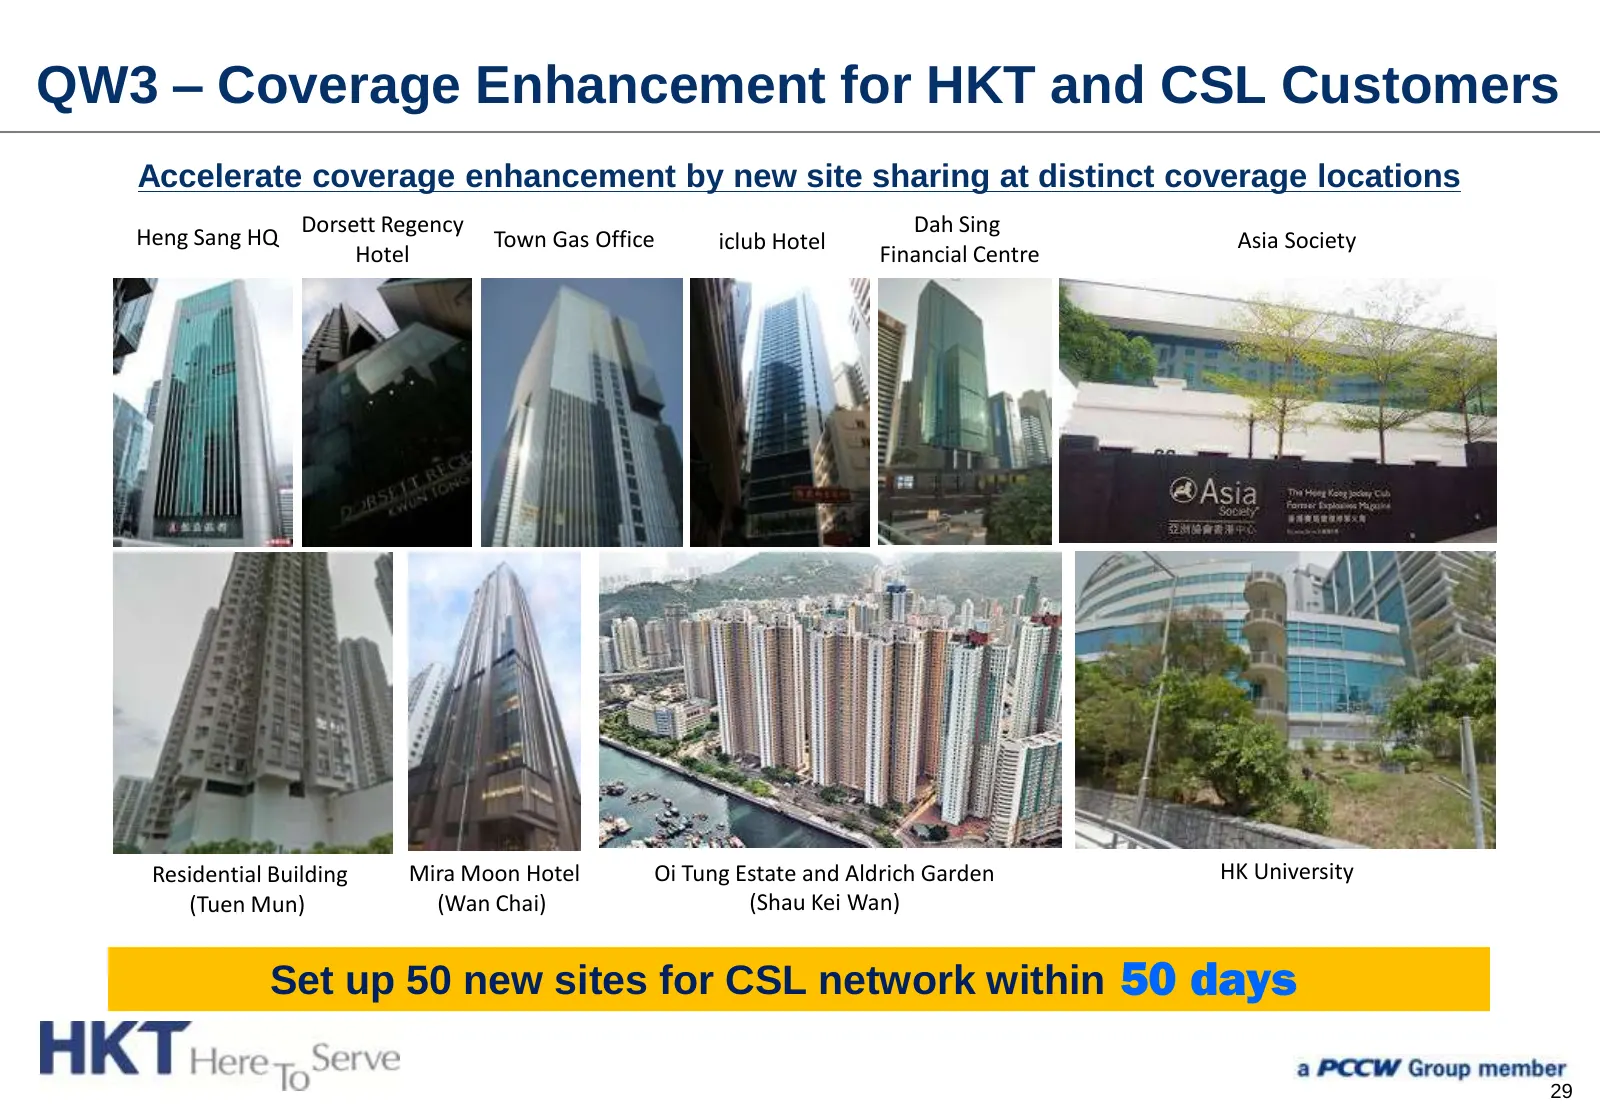
QW3 – Coverage Enhancement for HKT and CSL Customers Accelerate coverage enhancement by new site sharing at distinct coverage locations Dorsett Regency Dah Sing Heng Sang HQ Town Gas Office iclub Hotel Asia Society Hotel Financial Centre Residential Building Mira Moon Hotel Oi Tung Estate and Aldric
Slide 31: QW4 – Micro-cell Coverage for CSL Customers
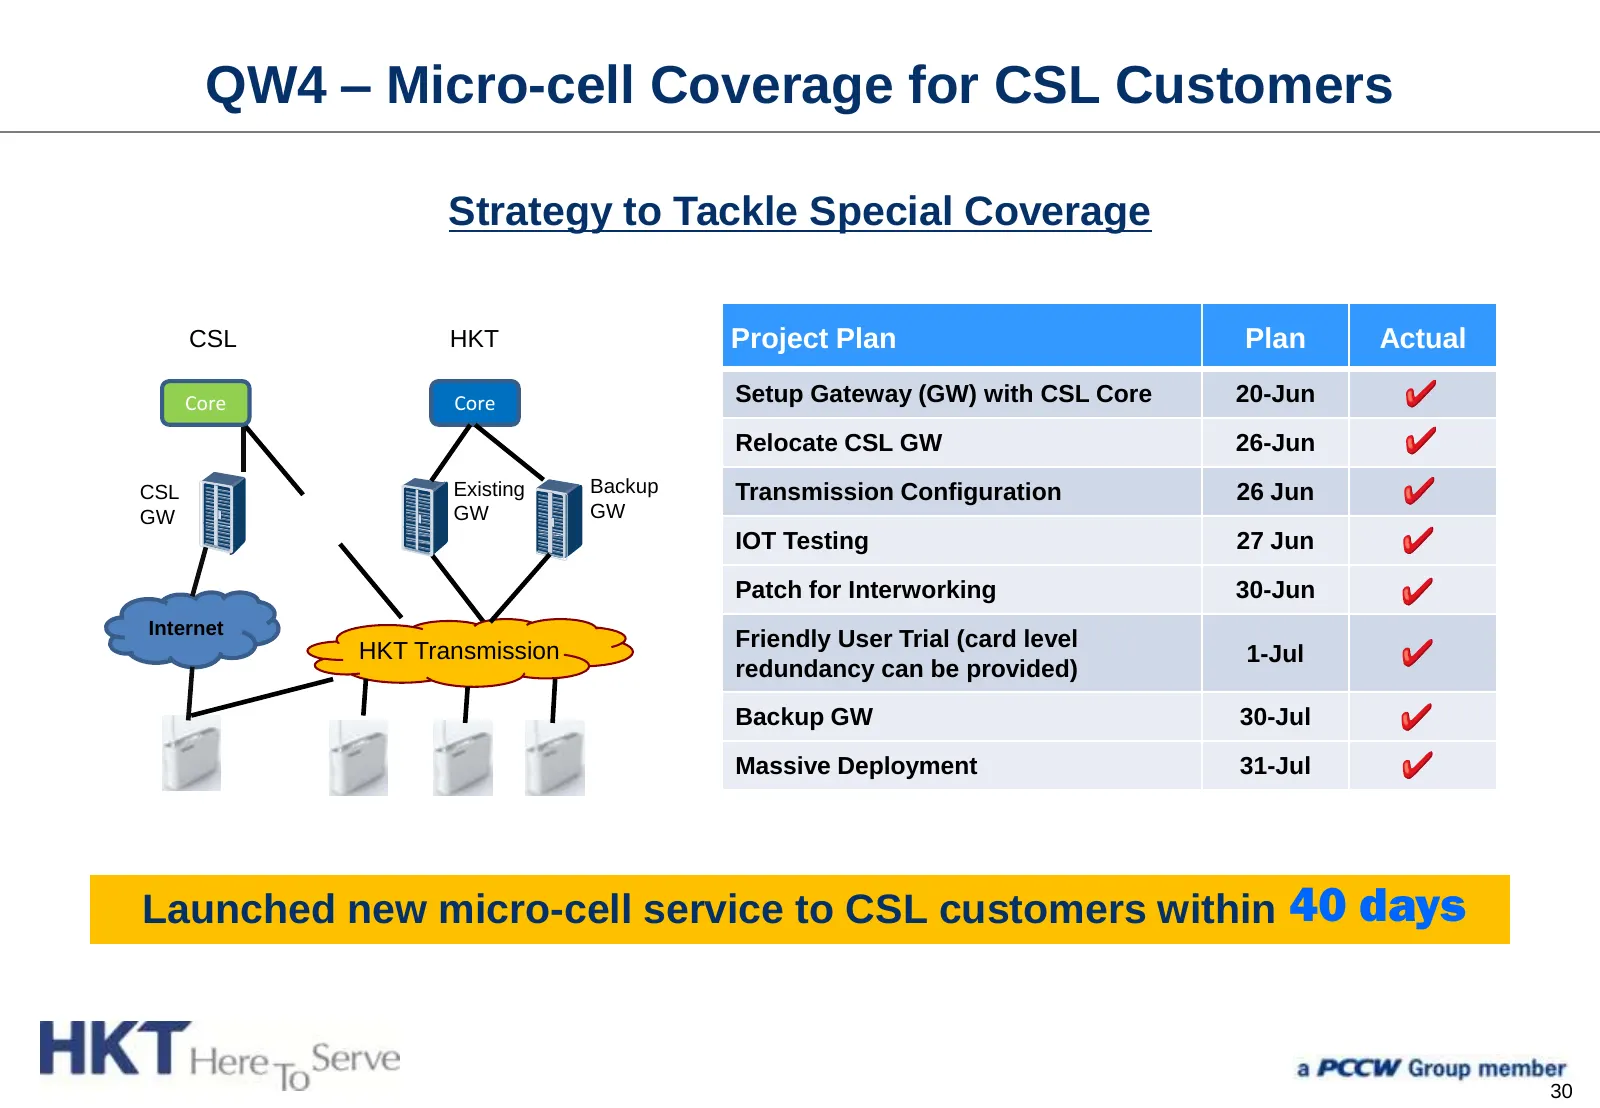
QW4 – Micro-cell Coverage for CSL Customers Strategy to Tackle Special Coverage CSL HKT Project Plan Plan Actual Core Core Setup Gateway (GW) with CSL Core 20-Jun Relocate CSL GW 26-Jun CSL Existing Backup Transmission Configuration 26 Jun GW GW GW IOT Testing 27 Jun Patch for Interworking 30-Jun In
Slide 32: QW5 – U2100 MOCN Activation for CSL Customers
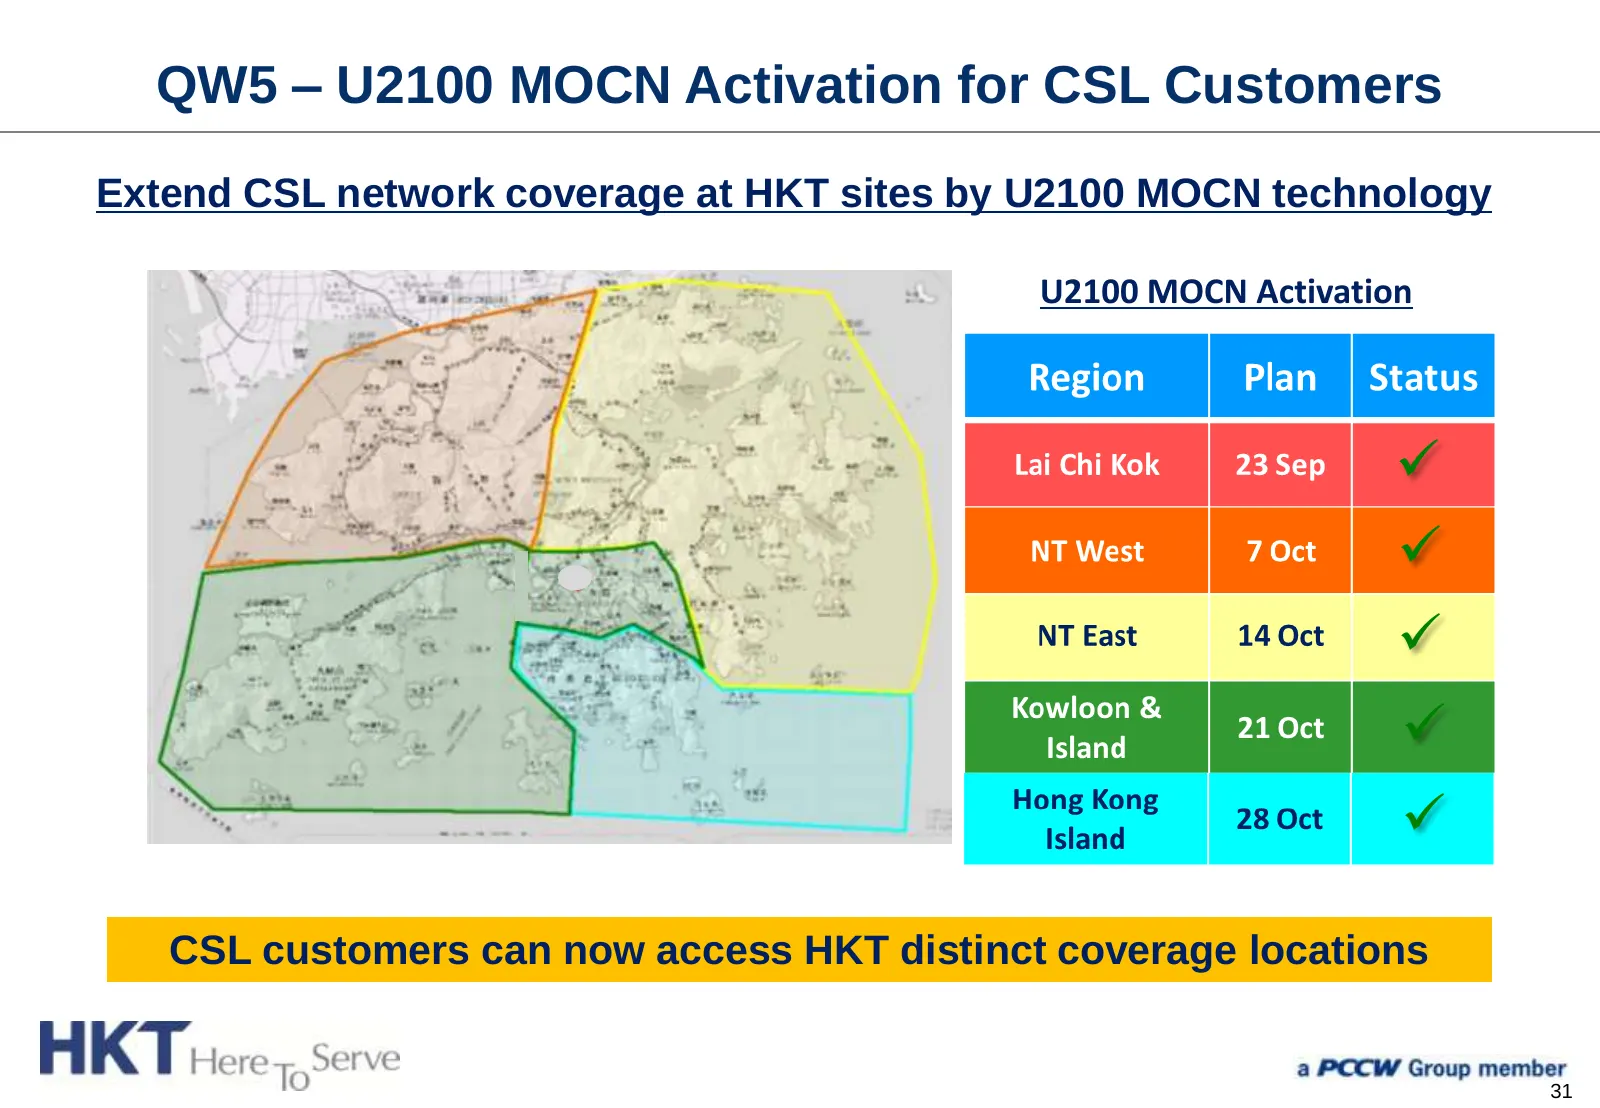
QW5 – U2100 MOCN Activation for CSL Customers Extend CSL network coverage at HKT sites by U2100 MOCN technology U2100 MOCN Activation Region Plan Status Lai Chi Kok 23 Sep NT West 7 Oct NT East 14 Oct Kowloon & Island 21 Oct Hong Kong Island 28 Oct CSL customers can now access HKT distinct
Slide 33: QW6 – Expansion of MTR Capacity for CSL Customers
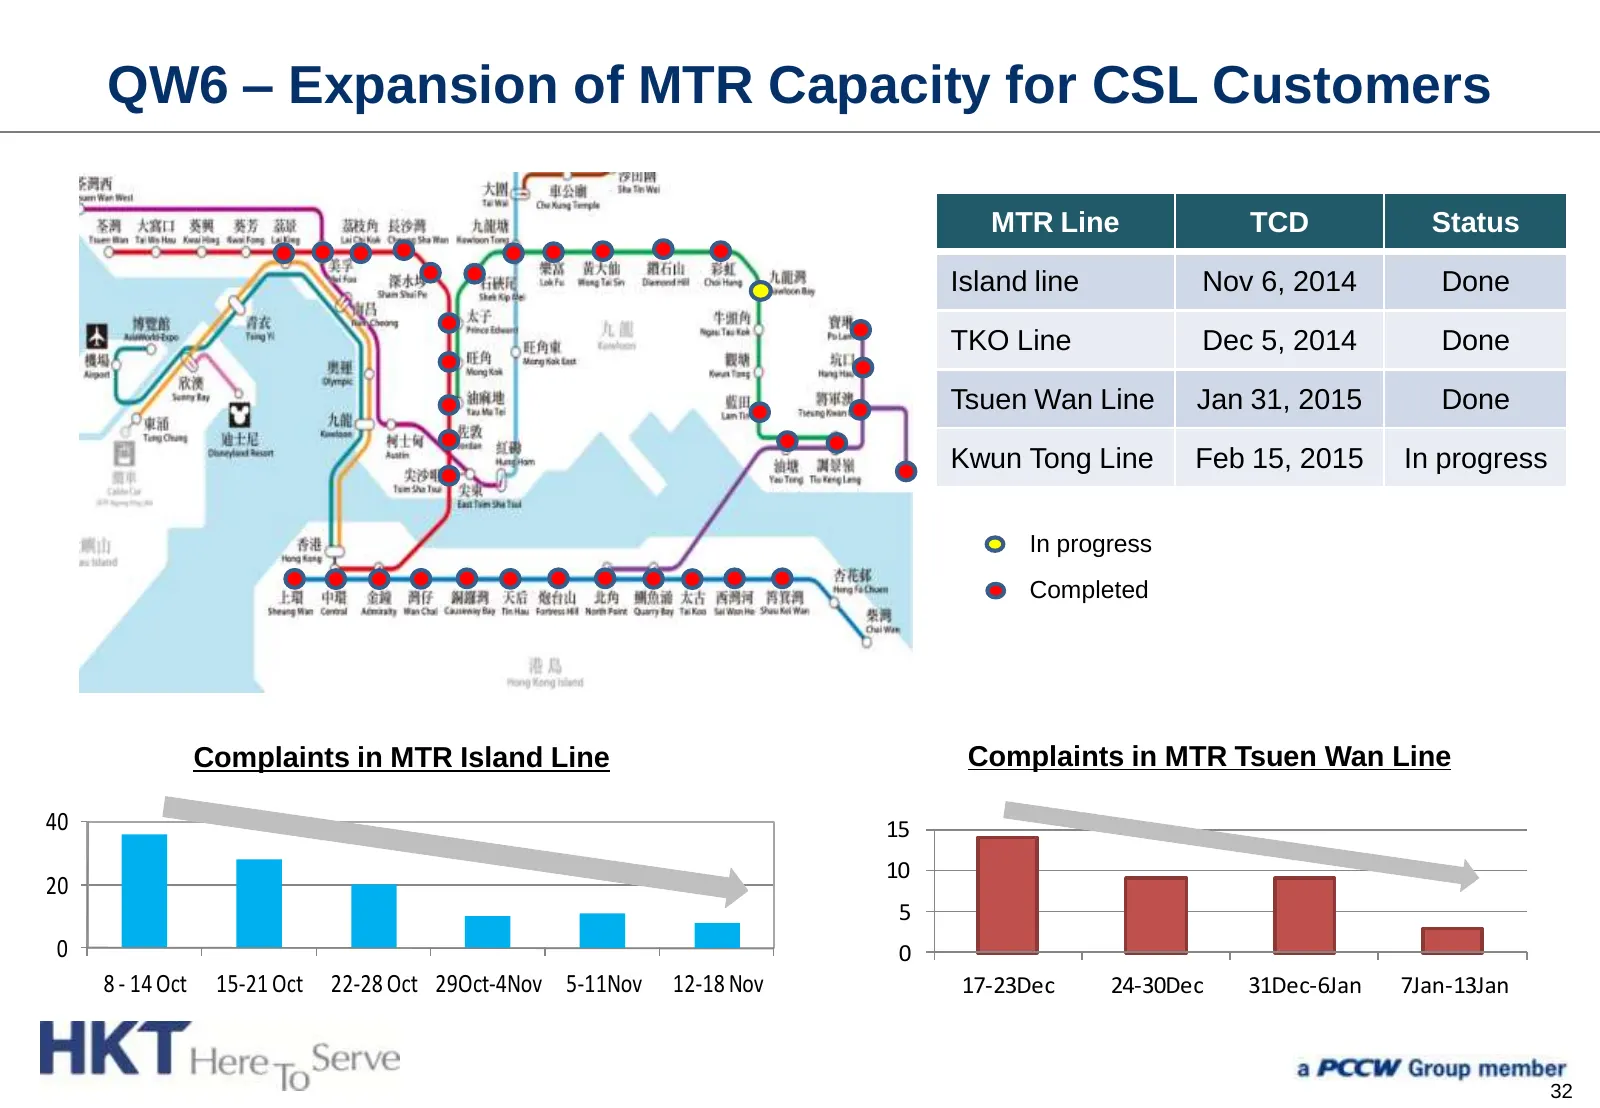
QW6 – Expansion of MTR Capacity for CSL Customers MTR Line TCD Status Island line Nov 6, 2014 Done TKO Line Dec 5, 2014 Done Tsuen Wan Line Jan 31, 2015 Done Kwun Tong Line Feb 15, 2015 In progress In progress Completed Complaints in MTR Island Line Complaints in MTR Tsuen Wan Line 40 15 10 20 5 0 0
Slide 34: Network Integration Plan
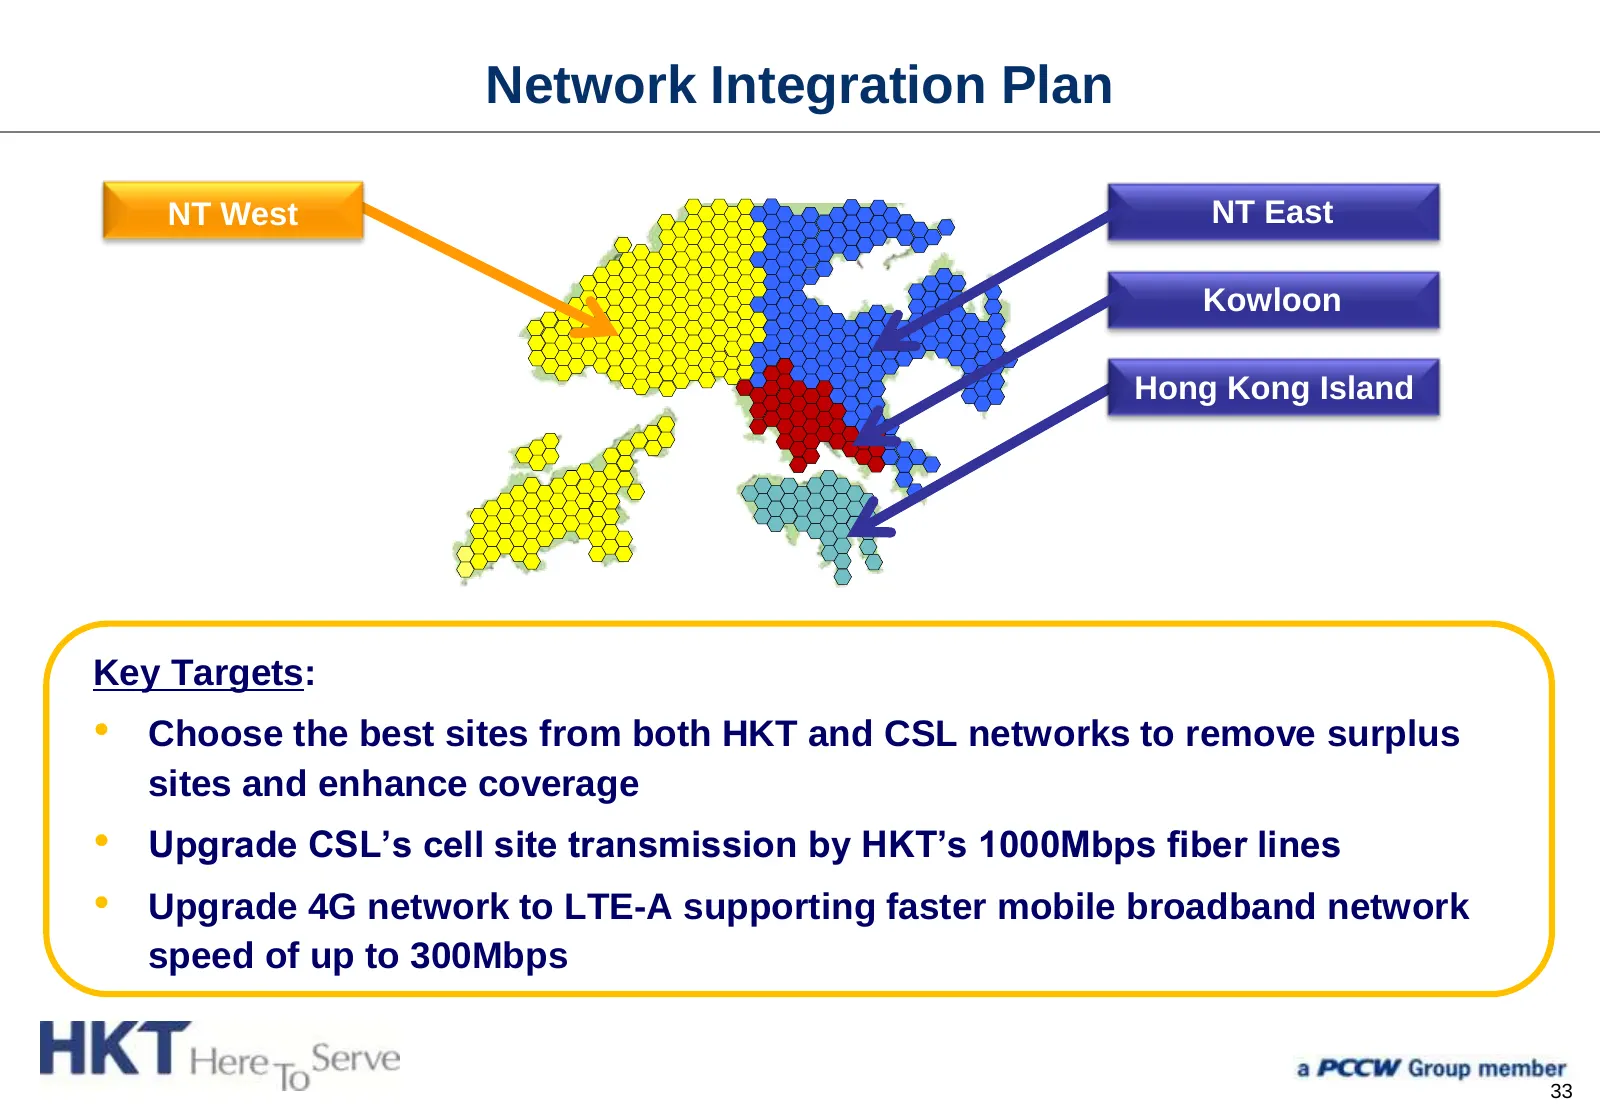
Network Integration Plan NT West NT East Kowloon Hong Kong Island Key Targets: • Choose the best sites from both HKT and CSL networks to remove surplus sites and enhance coverage • Upgrade CSL’s cell site transmission by HKT’s 1000Mbps fiber lines • Upgrade 4G network to LTE-A supporting faster mobi
Slide 35: Network Integration Upgrade Plan
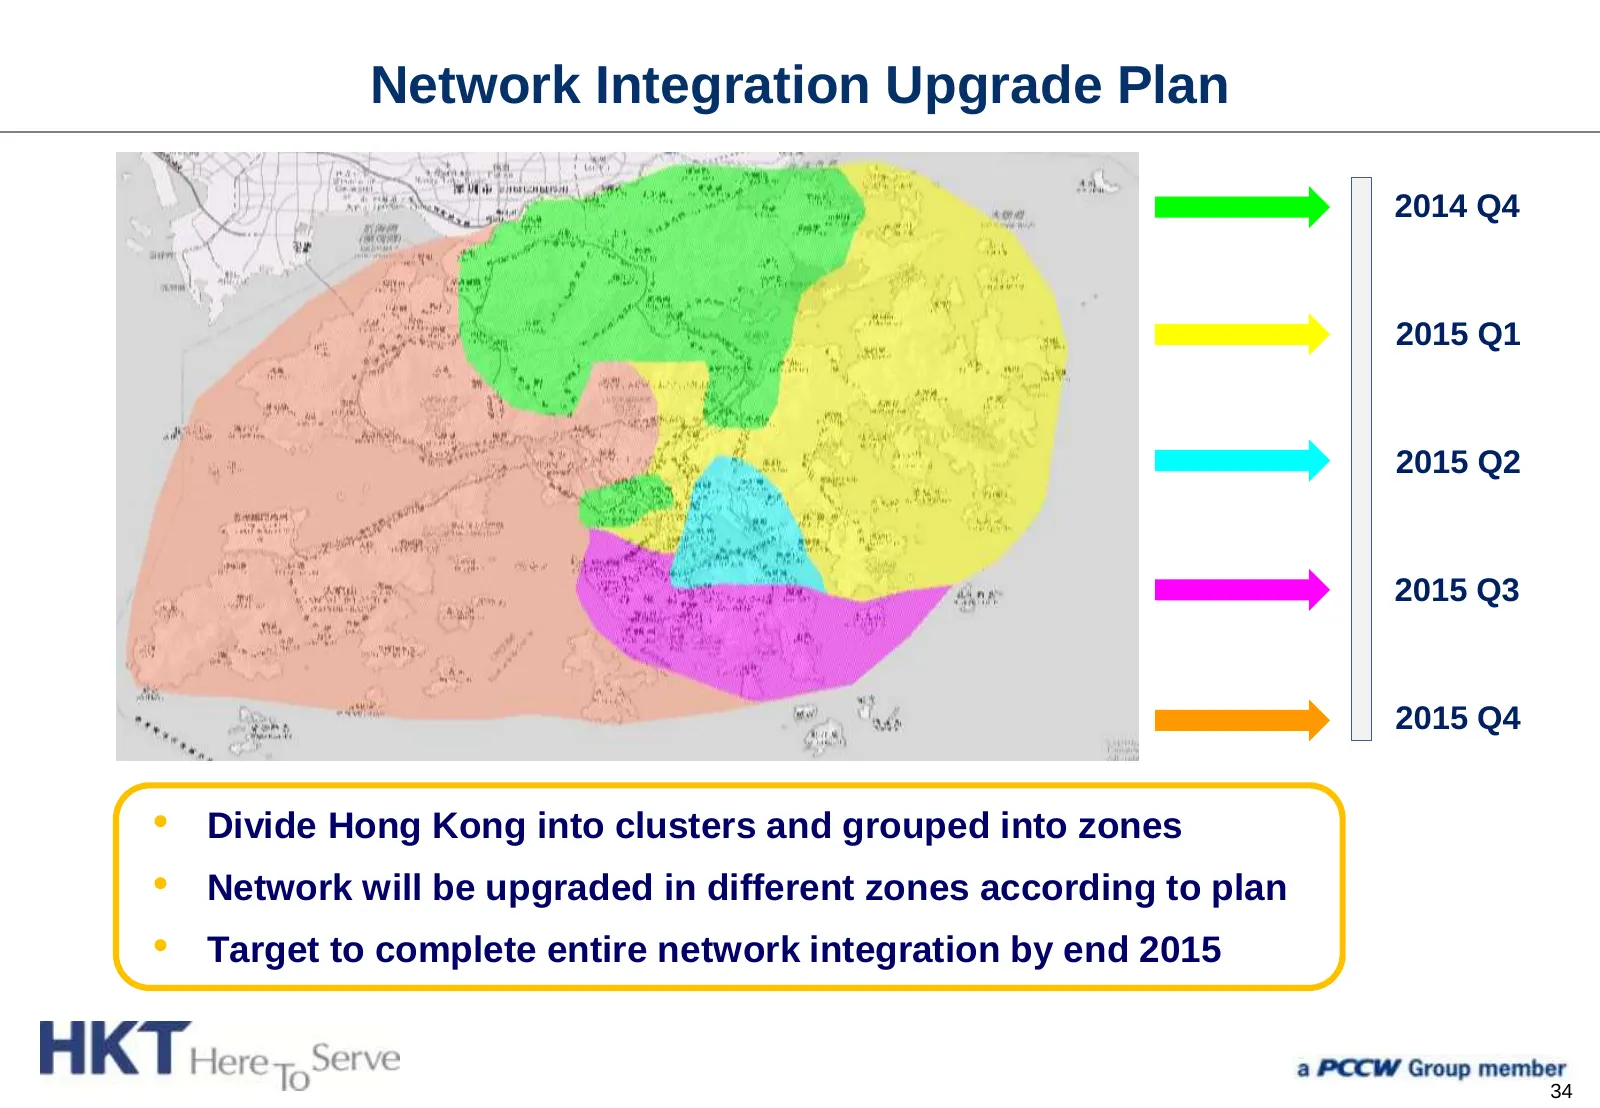
Network Integration Upgrade Plan 2014 Q4 2015 Q1 2015 Q2 2015 Q3 2015 Q4 • Divide Hong Kong into clusters and grouped into zones • Network will be upgraded in different zones according to plan • Target to complete entire network integration by end 2015 34
Slide 36: Progress of Cell Site Integration
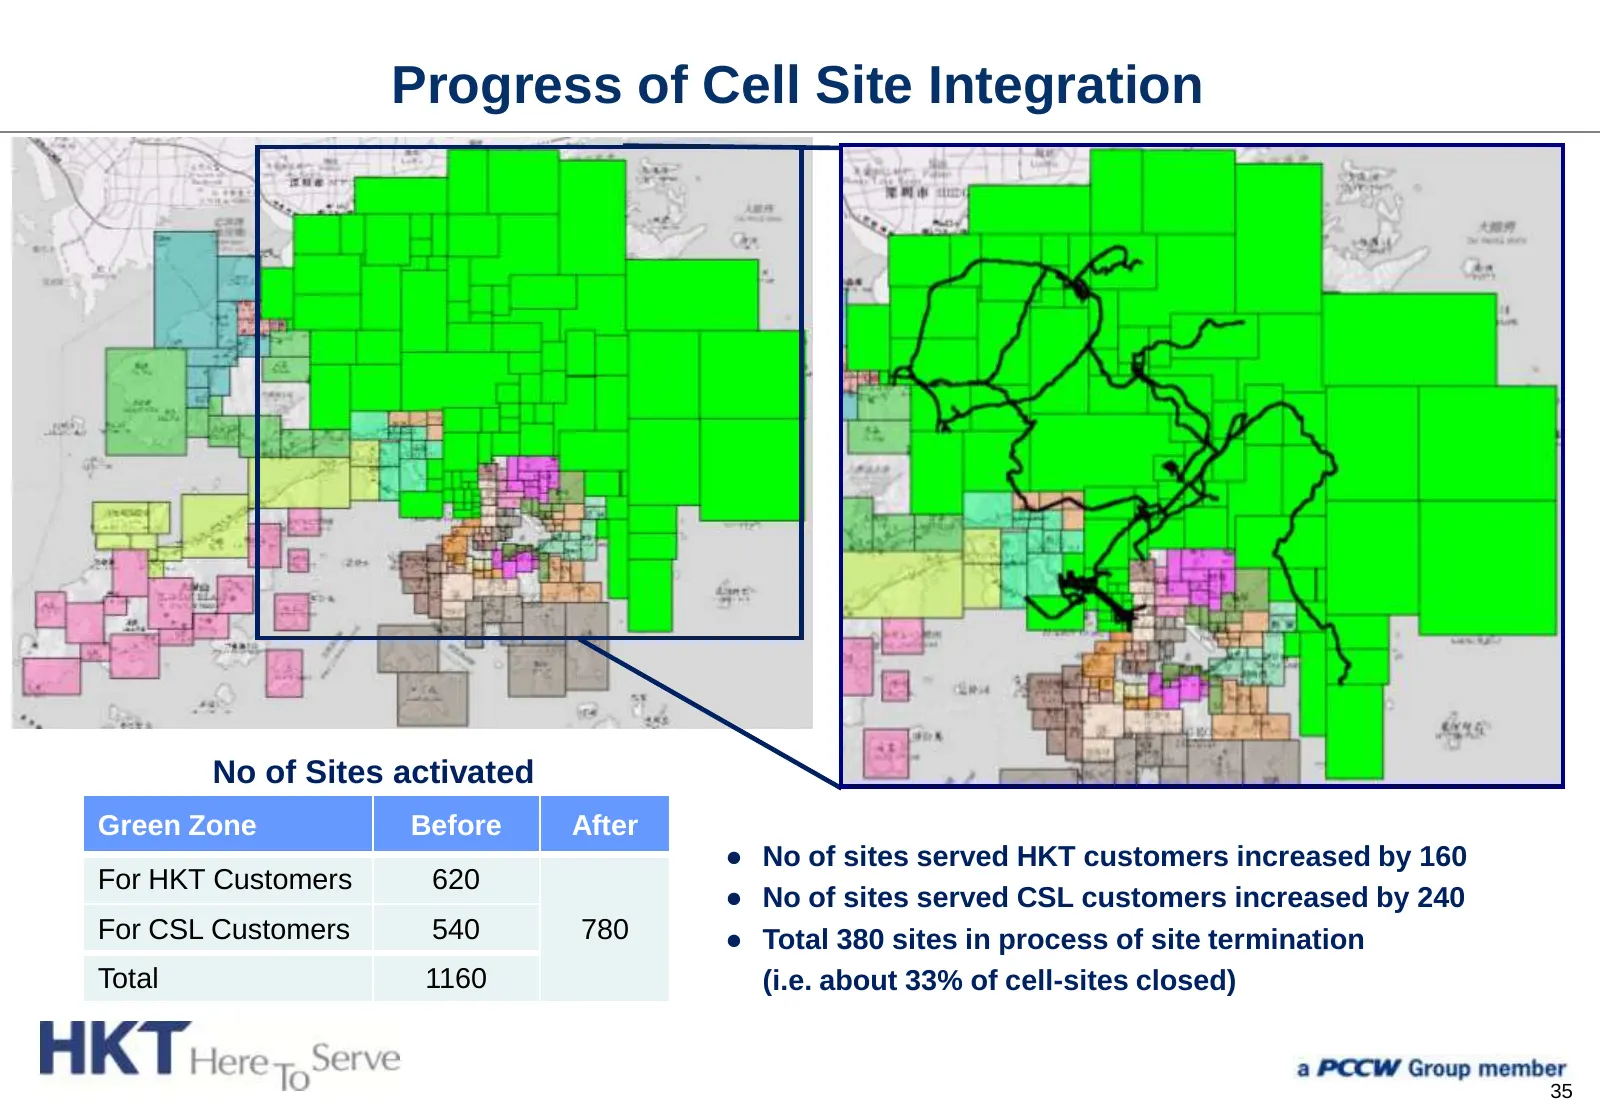
Progress of Cell Site Integration No of Sites activated Green Zone Before After ● No of sites served HKT customers increased by 160 For HKT Customers 620 ● No of sites served CSL customers increased by 240 For CSL Customers 540 780 ● Total 380 sites in process of site termination Total 1160 (i.e. ab
Slide 37: Performance Improvement in Green Zone
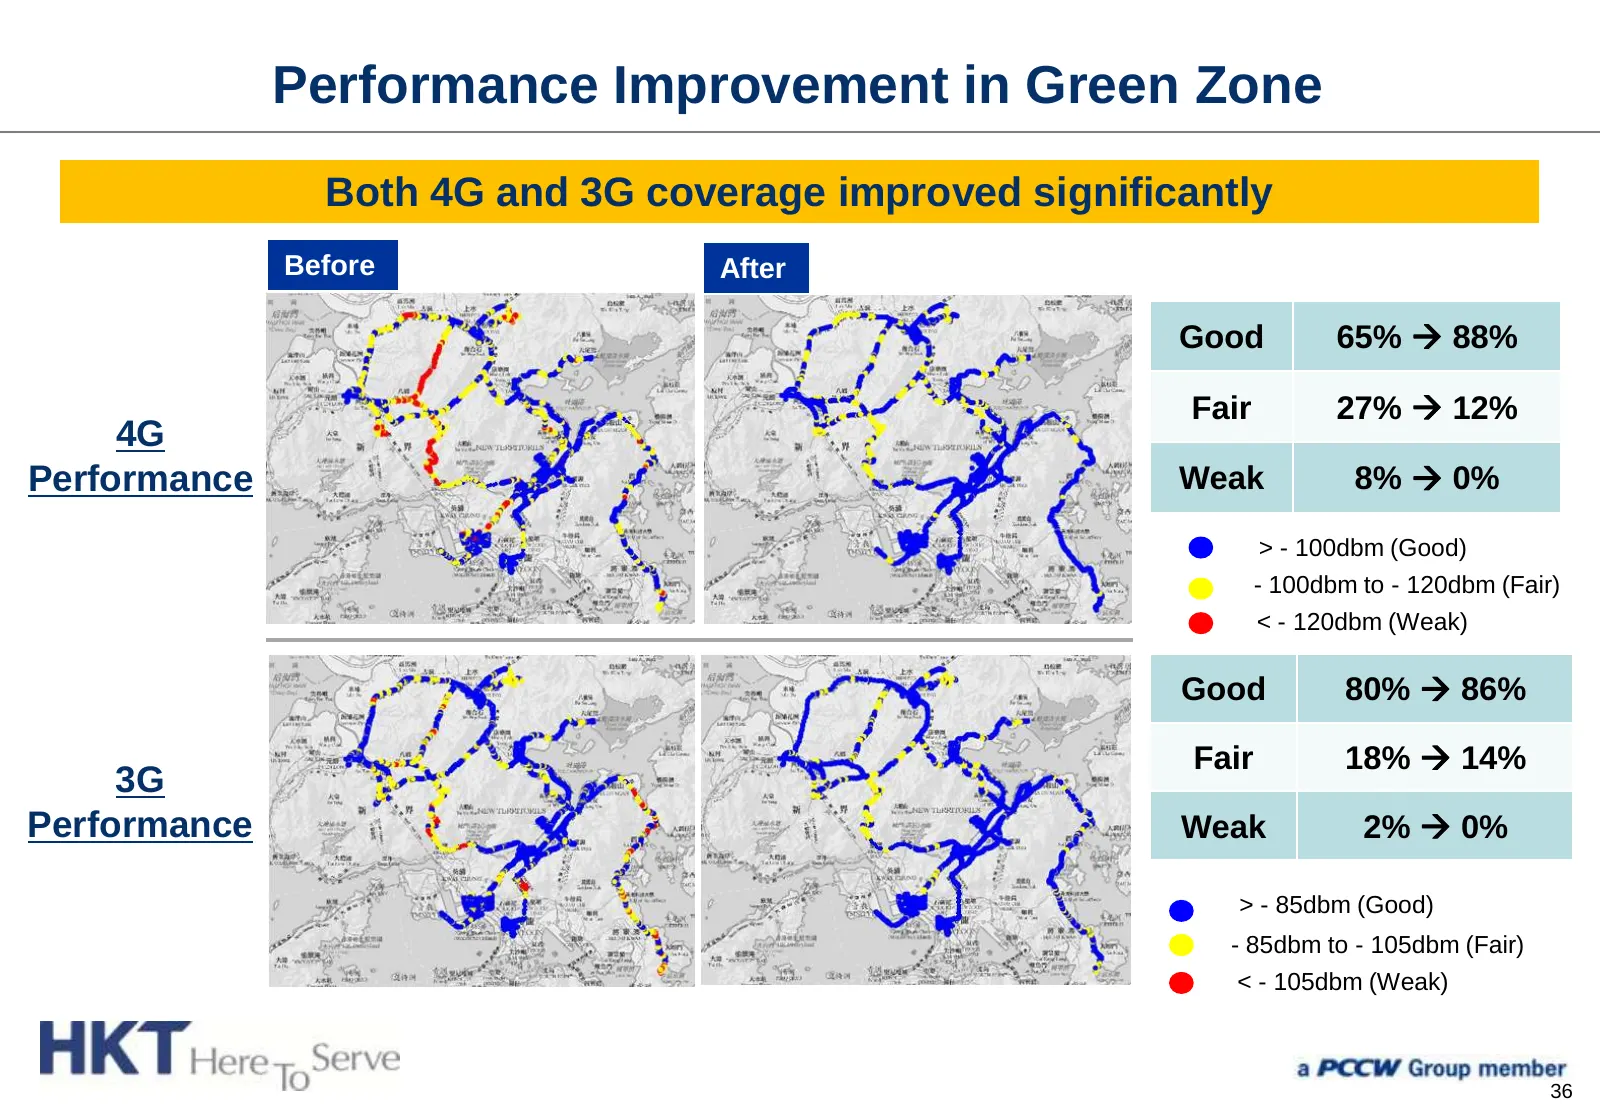
Performance Improvement in Green Zone Both 4G and 3G coverage improved significantly Before After Good 65% 88% Fair 27% 12% 4G Performance Weak 8% 0% > - 100dbm (Good) - 100dbm to - 120dbm (Fair) < - 120dbm (Weak) Good 80% 86% Fair 18% 14% 3G Performance Weak 2% 0% > - 85dbm (Good) - 85d
Slide 38: LTE-Advanced 300Mbps Network Launch
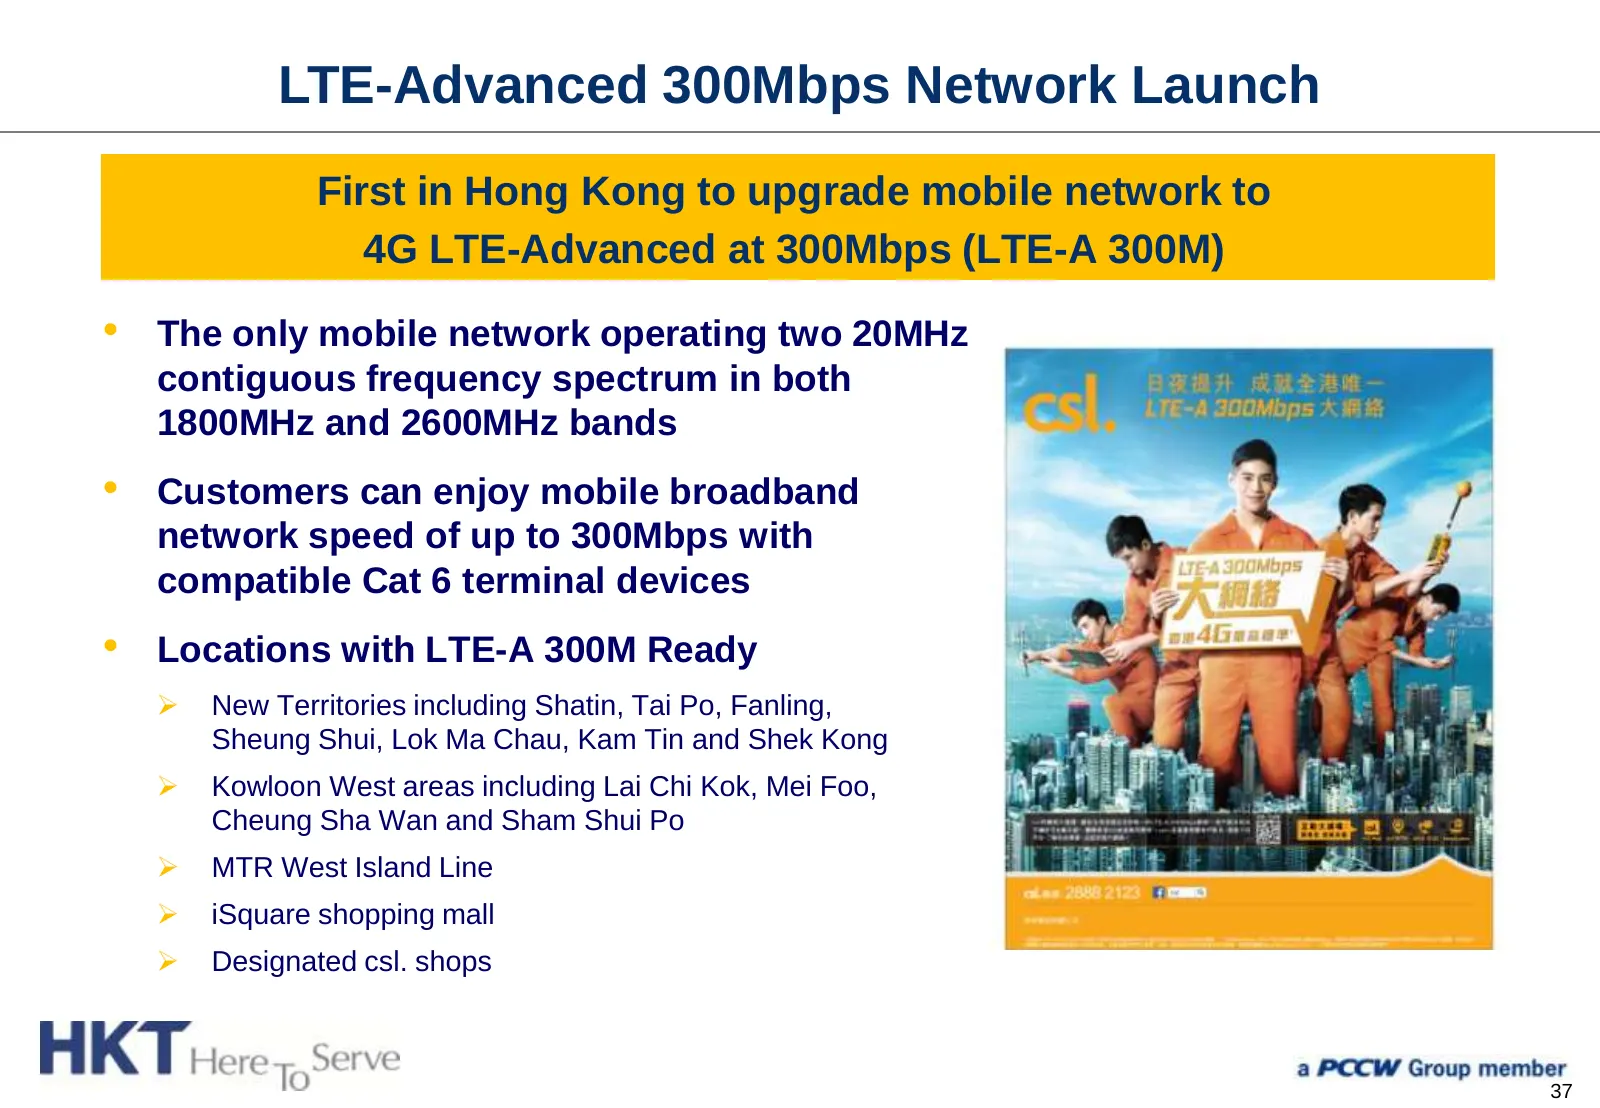
LTE-Advanced 300Mbps Network Launch First in Hong Kong to upgrade mobile network to 4G LTE-Advanced at 300Mbps (LTE-A 300M) • The only mobile network operating two 20MHz contiguous frequency spectrum in both 1800MHz and 2600MHz bands • Customers can enjoy mobile broadband network speed of up to 300M
Slide 39: International Business Continues to Strengthen
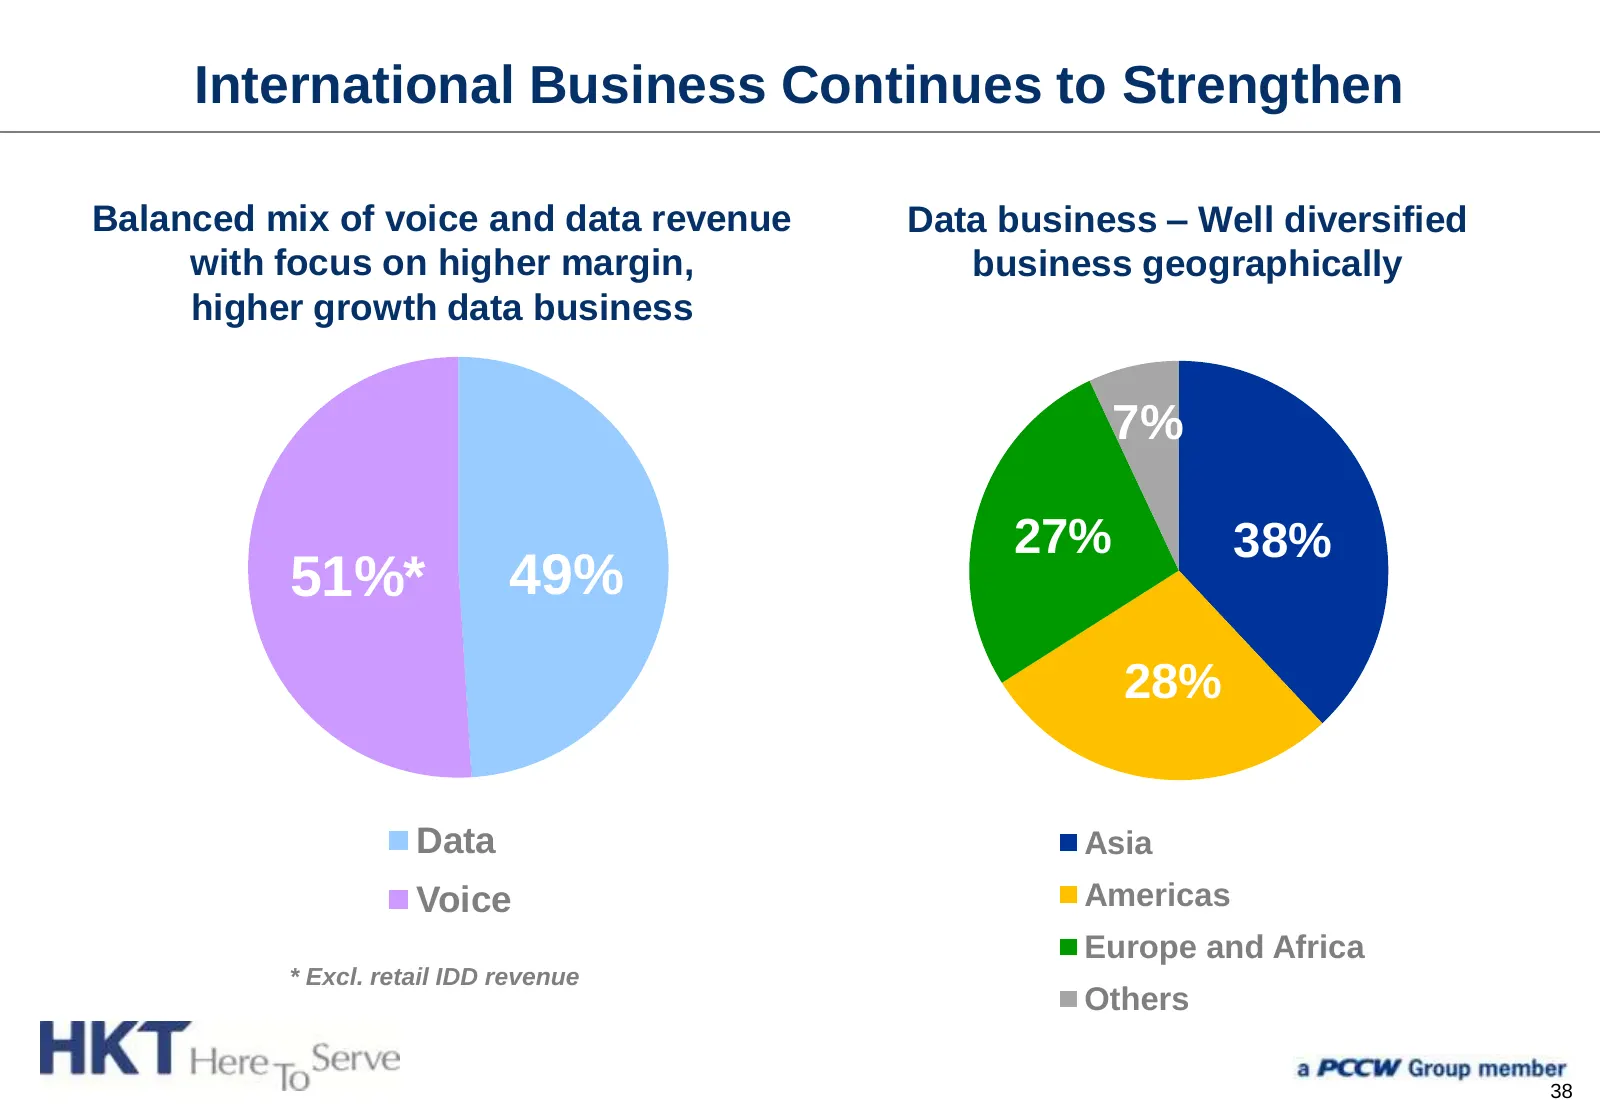
International Business Continues to Strengthen Balanced mix of voice and data revenue Data business – Well diversified with focus on higher margin, business geographically higher growth data business 7% 27% 38% 51%* 49% 28% Data Asia Voice Americas Europe and Africa * Excl. retail IDD revenue Others
Slide 40: Stable Fixed-line Business
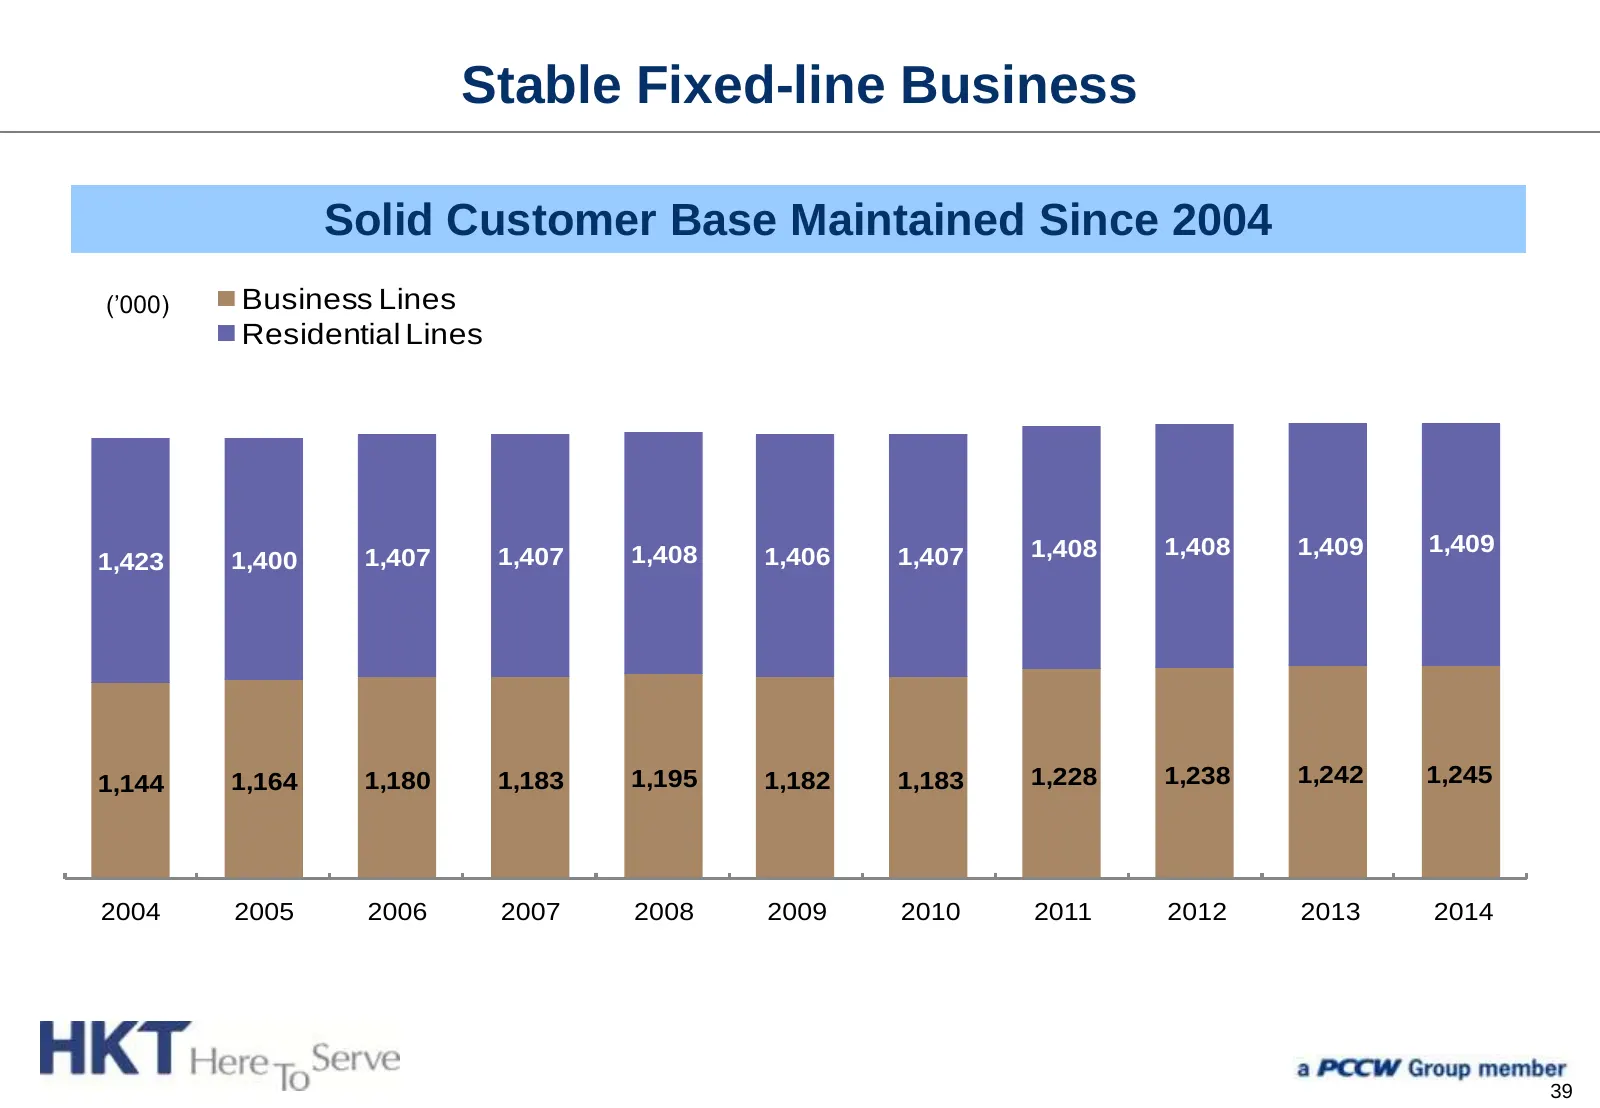
Stable Fixed-line Business Solid Customer Base Maintained Since 2004 (’000) Business Lines Residential Lines 1,408 1,408 1,408 1,409 1,409 1,423 1,400 1,407 1,407 1,406 1,407 1,144 1,164 1,180 1,183 1,195 1,182 1,183 1,228 1,238 1,242 1,245 2004 2005 2006 2007 2008 2009 2010 2011 2012 2013 2014 39
Slide 41: Fixed Mobile Integration (FMI) Solutions
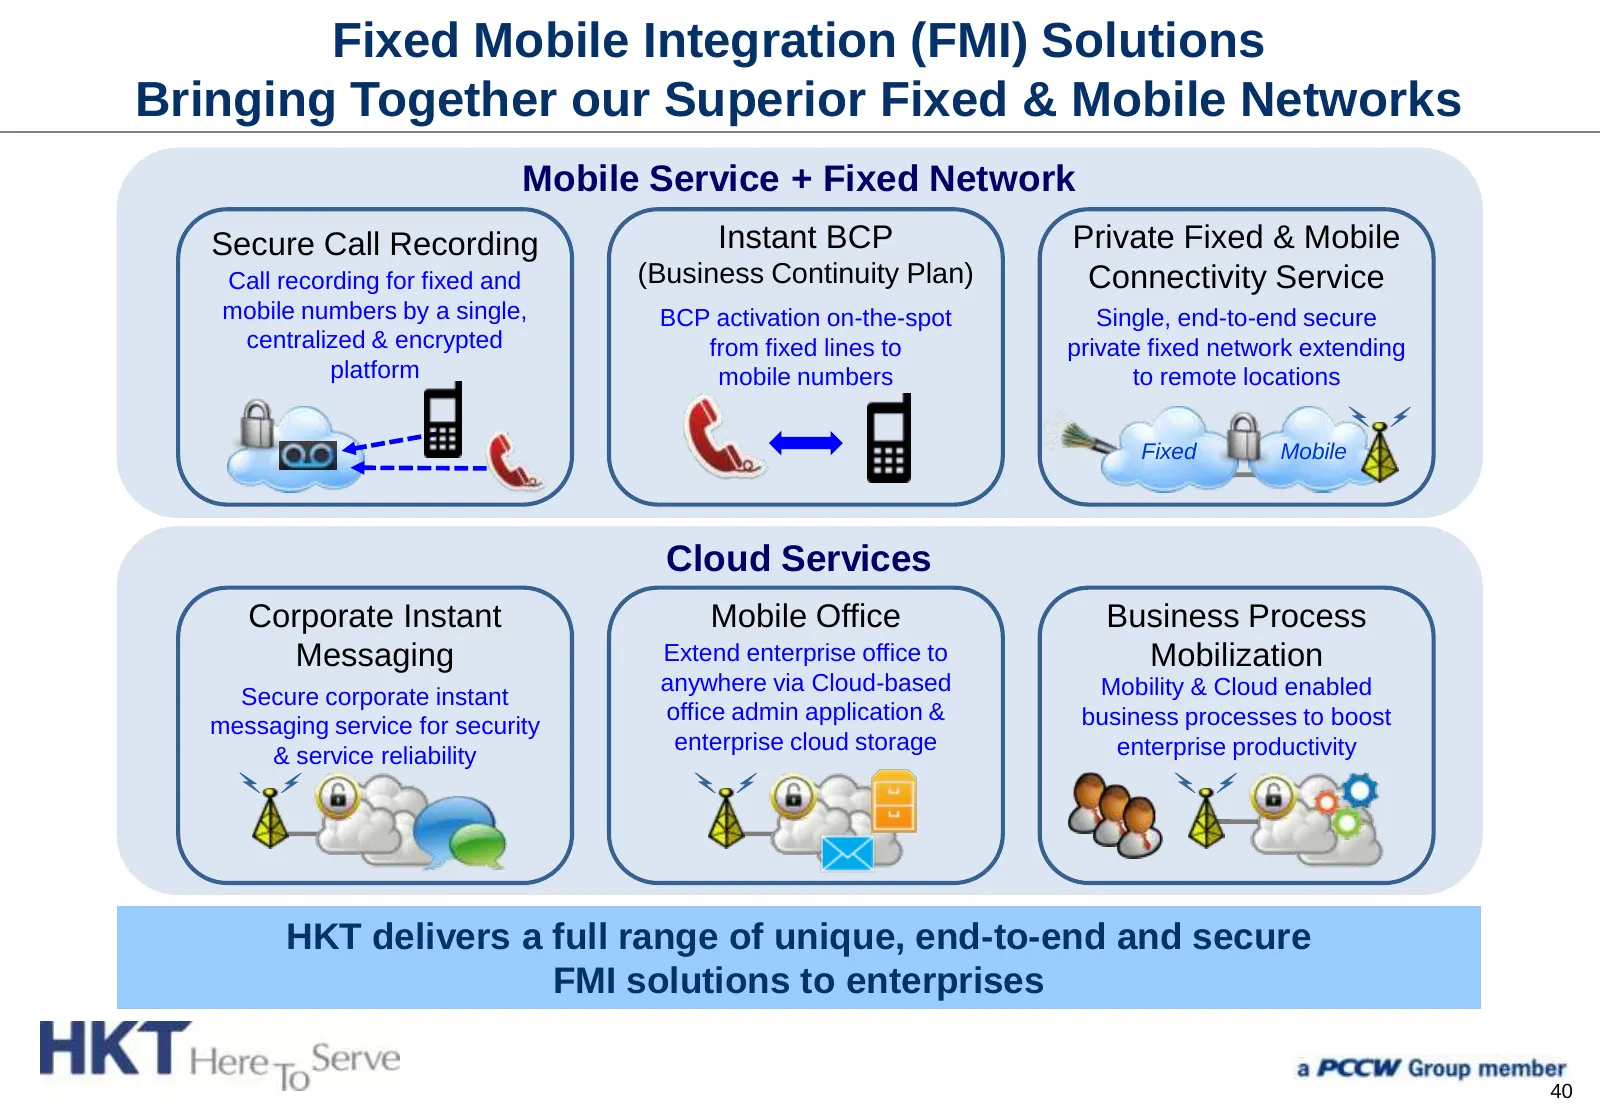
Fixed Mobile Integration (FMI) Solutions Bringing Together our Superior Fixed & Mobile Networks Mobile Service + Fixed Network Secure Call Recording Instant BCP Private Fixed & Mobile Call recording for fixed and (Business Continuity Plan) Connectivity Service mobile numbers by a single, BCP activat
Slide 42: Consolidated Position in Broadband
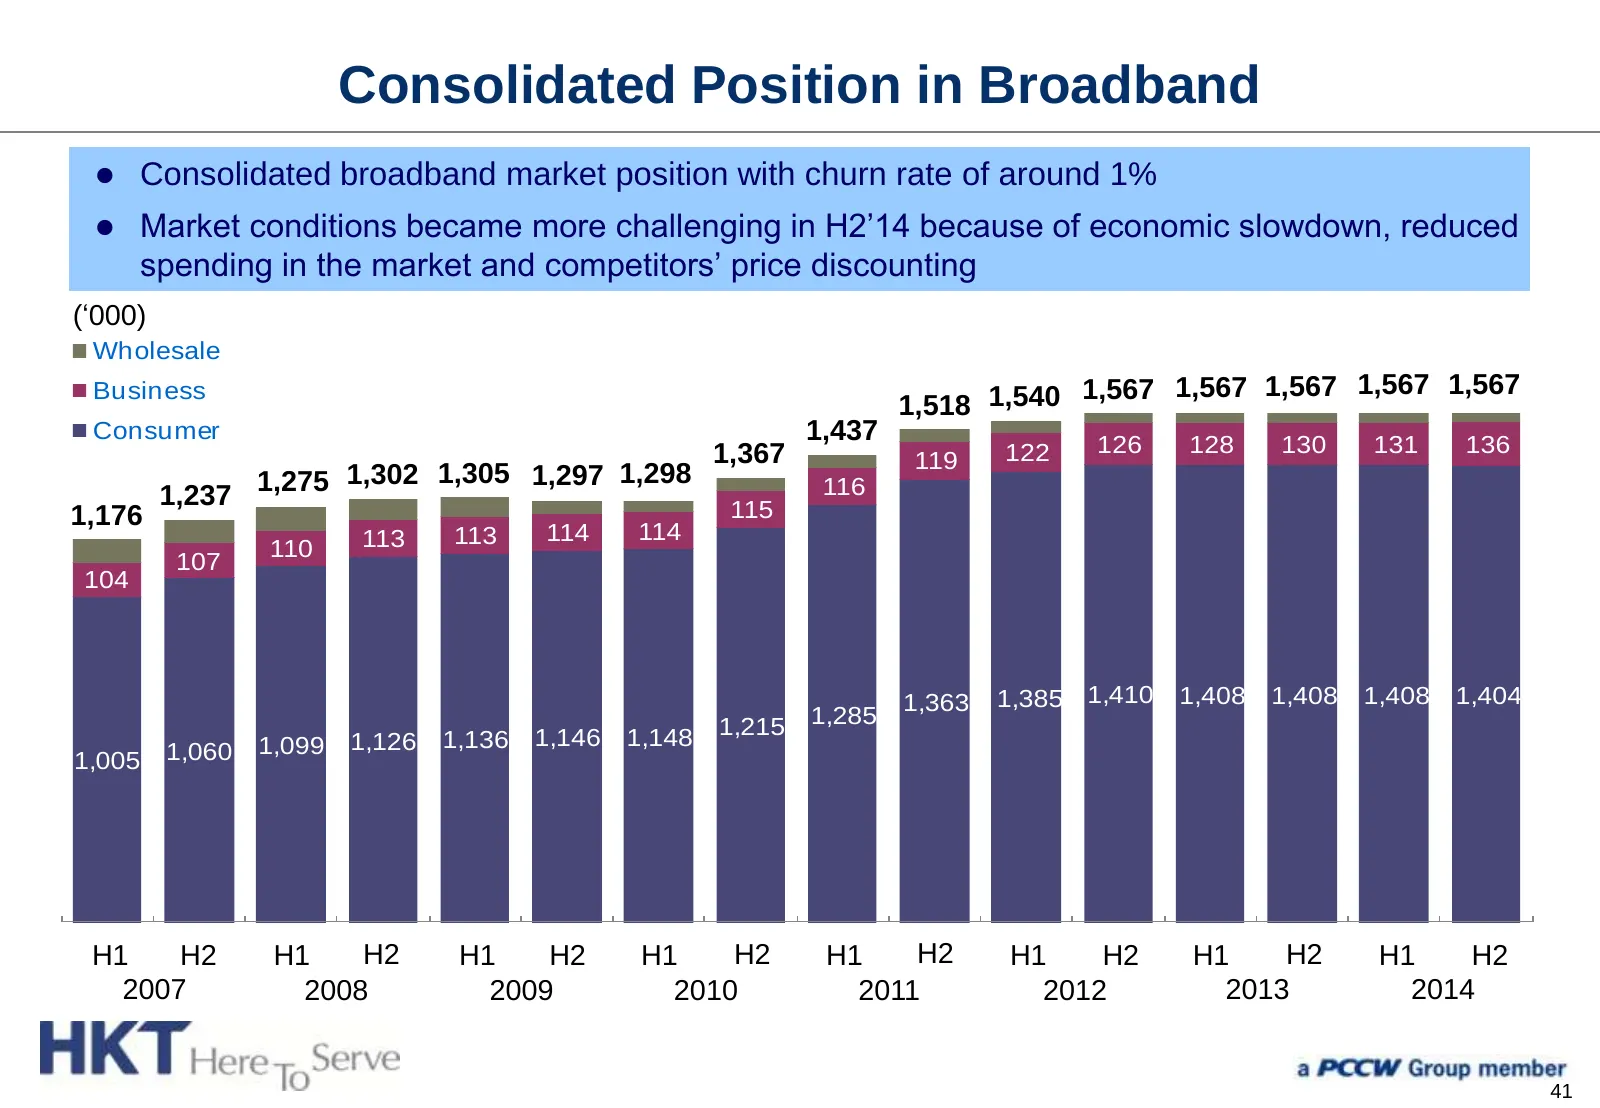
Consolidated Position in Broadband Consolidated broadband market position with churn rate of around 1% Market conditions became more challenging in H2’14 because of economic slowdown, reduced spending in the market and competitors’ price discounting (‘000) Wholesale Business 1,567 1,567 1,567 1,
Slide 43: Wide Availability of our Fiber Network
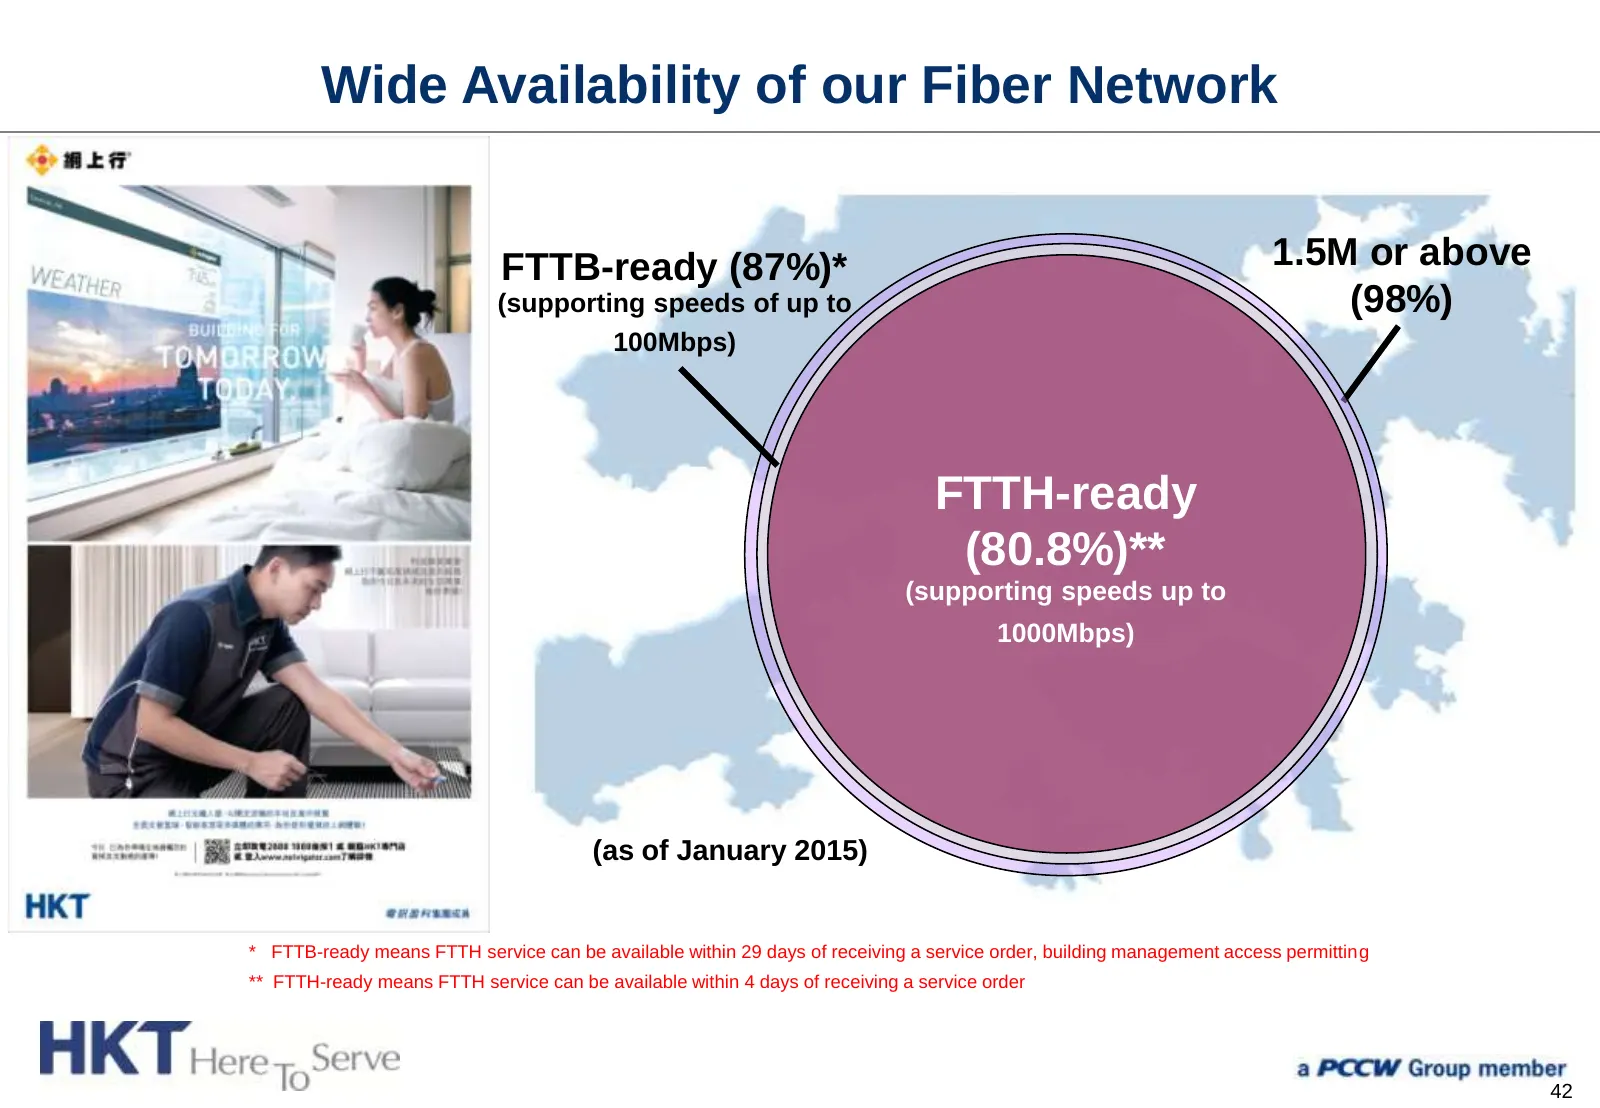
Wide Availability of our Fiber Network FTTB-ready (87%)* 1.5M or above (supporting speeds of up to (98%) 100Mbps) FTTH-ready (80.8%)** (supporting speeds up to 1000Mbps) (as of January 2015) * FTTB-ready means FTTH service can be available within 29 days of receiving a service order, building manage
Slide 44: Continued Growth of Fiber Customers
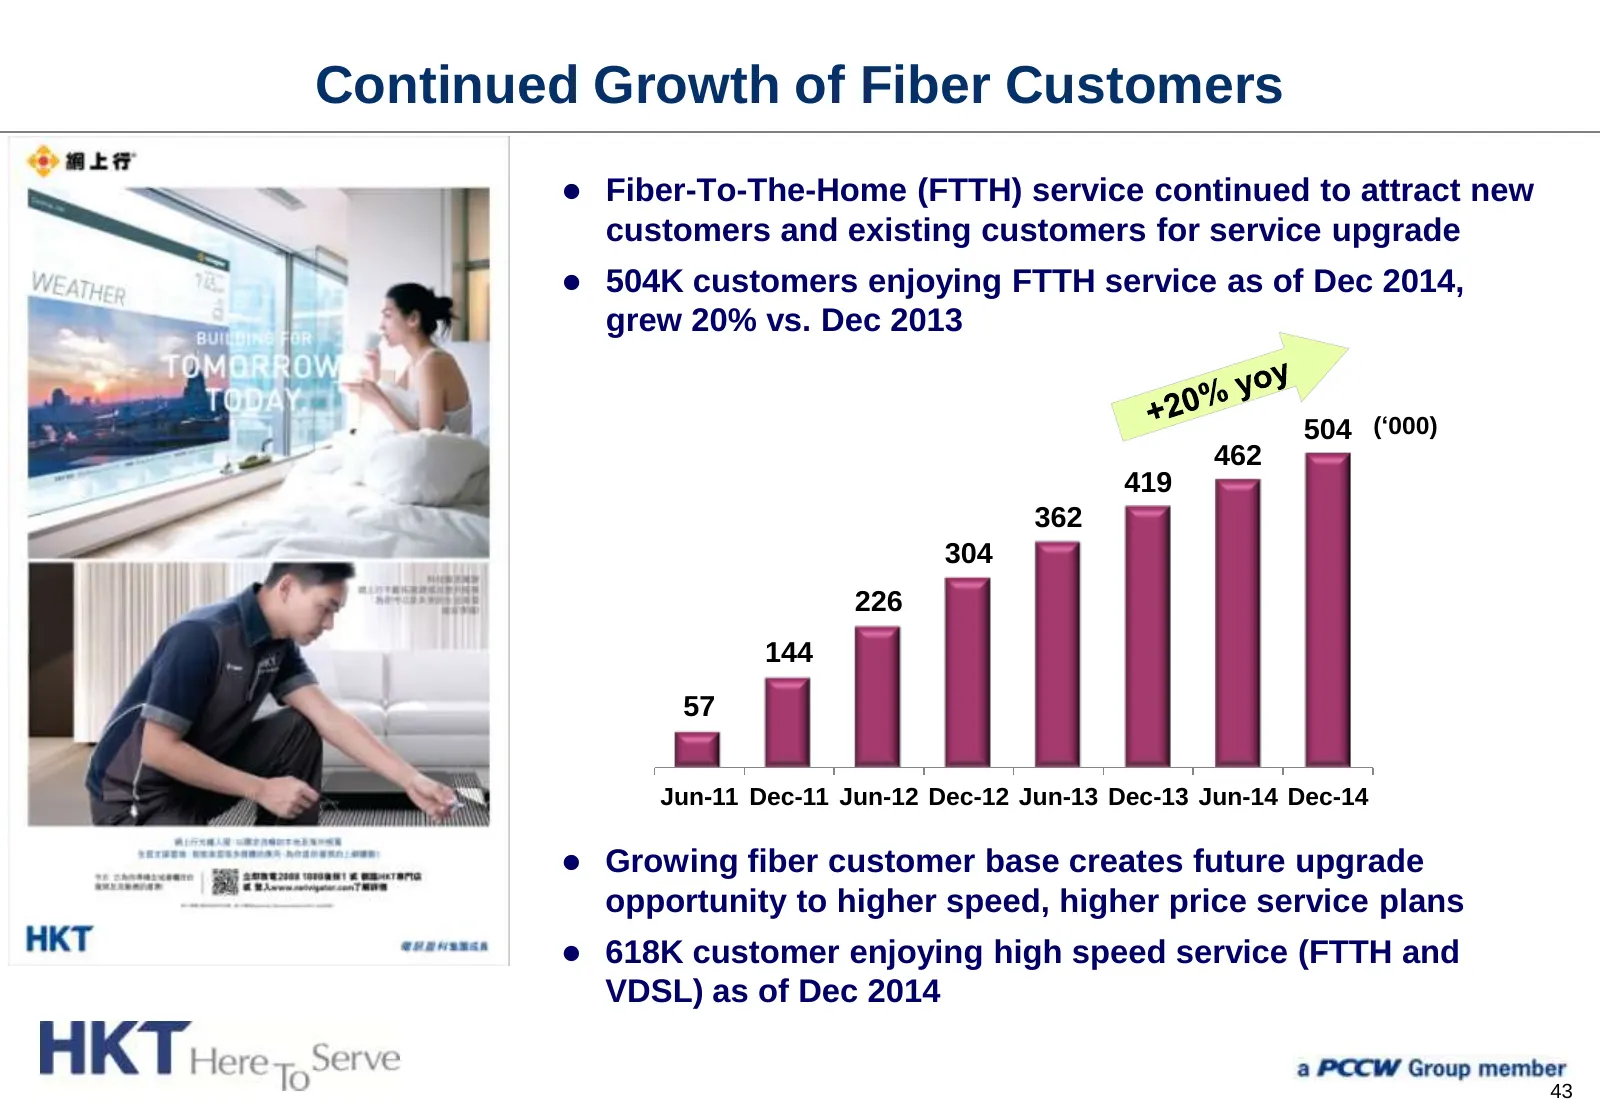
Continued Growth of Fiber Customers Fiber-To-The-Home (FTTH) service continued to attract new customers and existing customers for service upgrade 504K customers enjoying FTTH service as of Dec 2014, grew 20% vs. Dec 2013 504 (‘000) 462 419 362 304 226 144 57 Jun-11 Dec-11 Jun-12 Dec-12 Jun-13 D
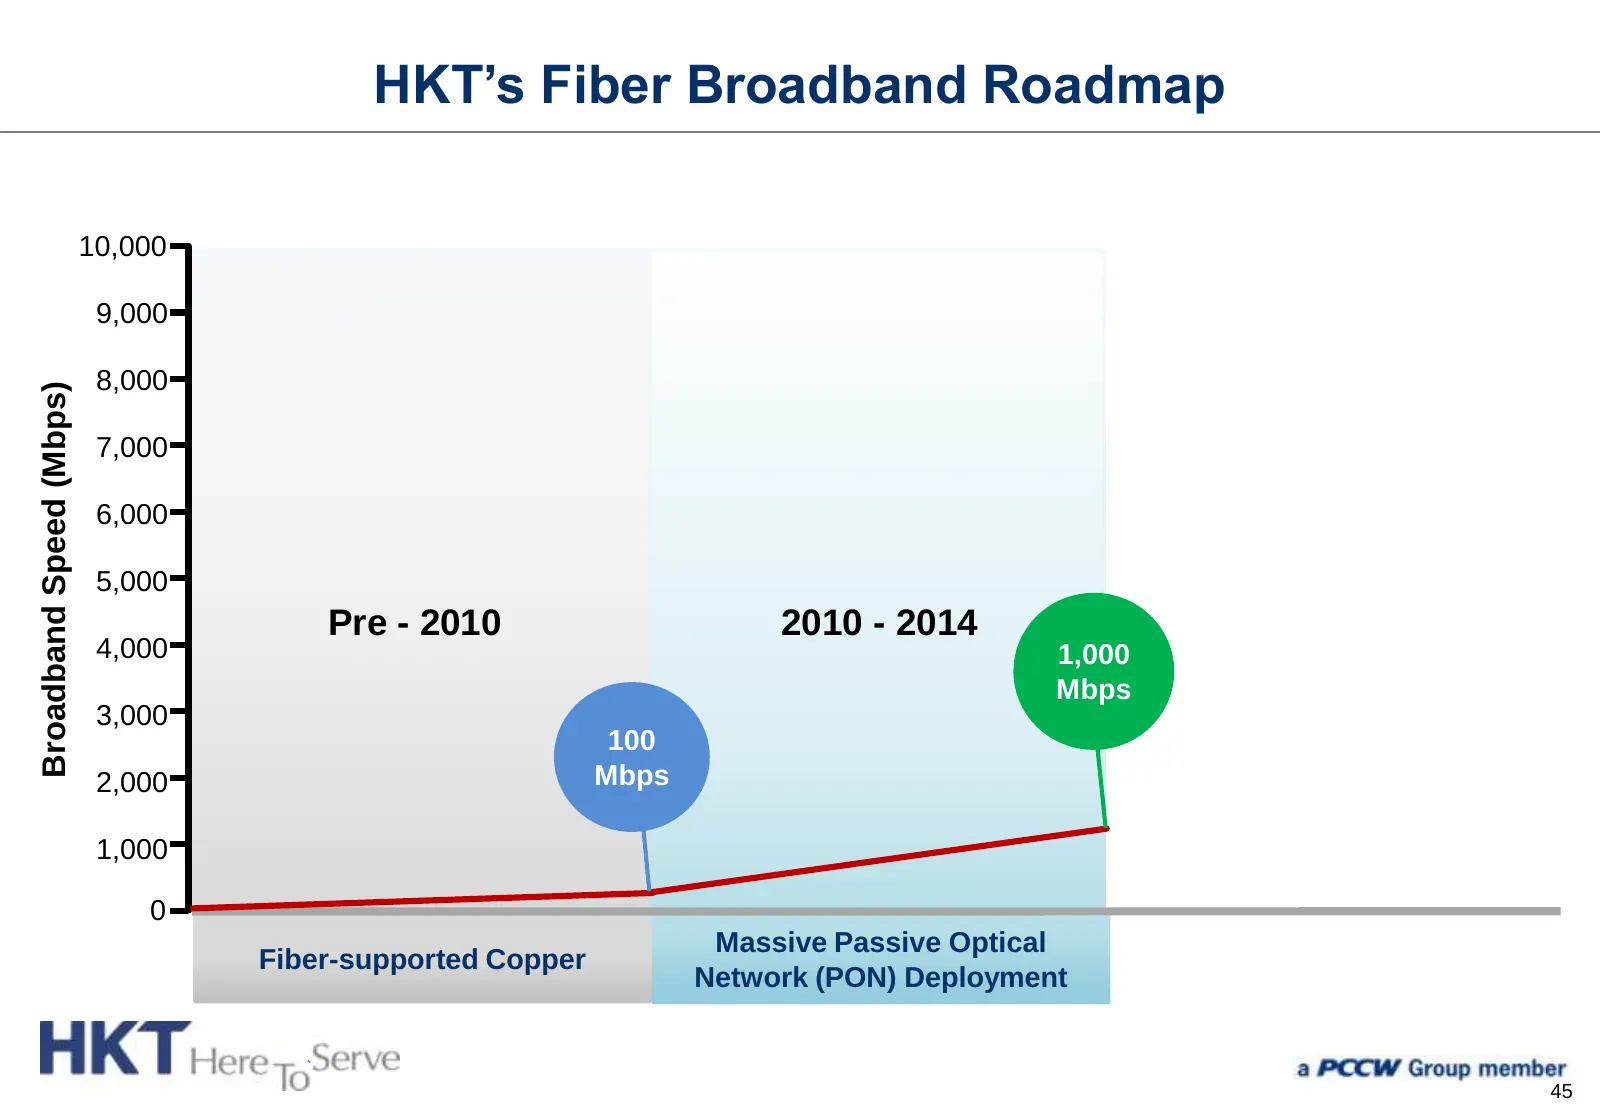
Slide 45: HKT's Fiber Broadband Roadmap
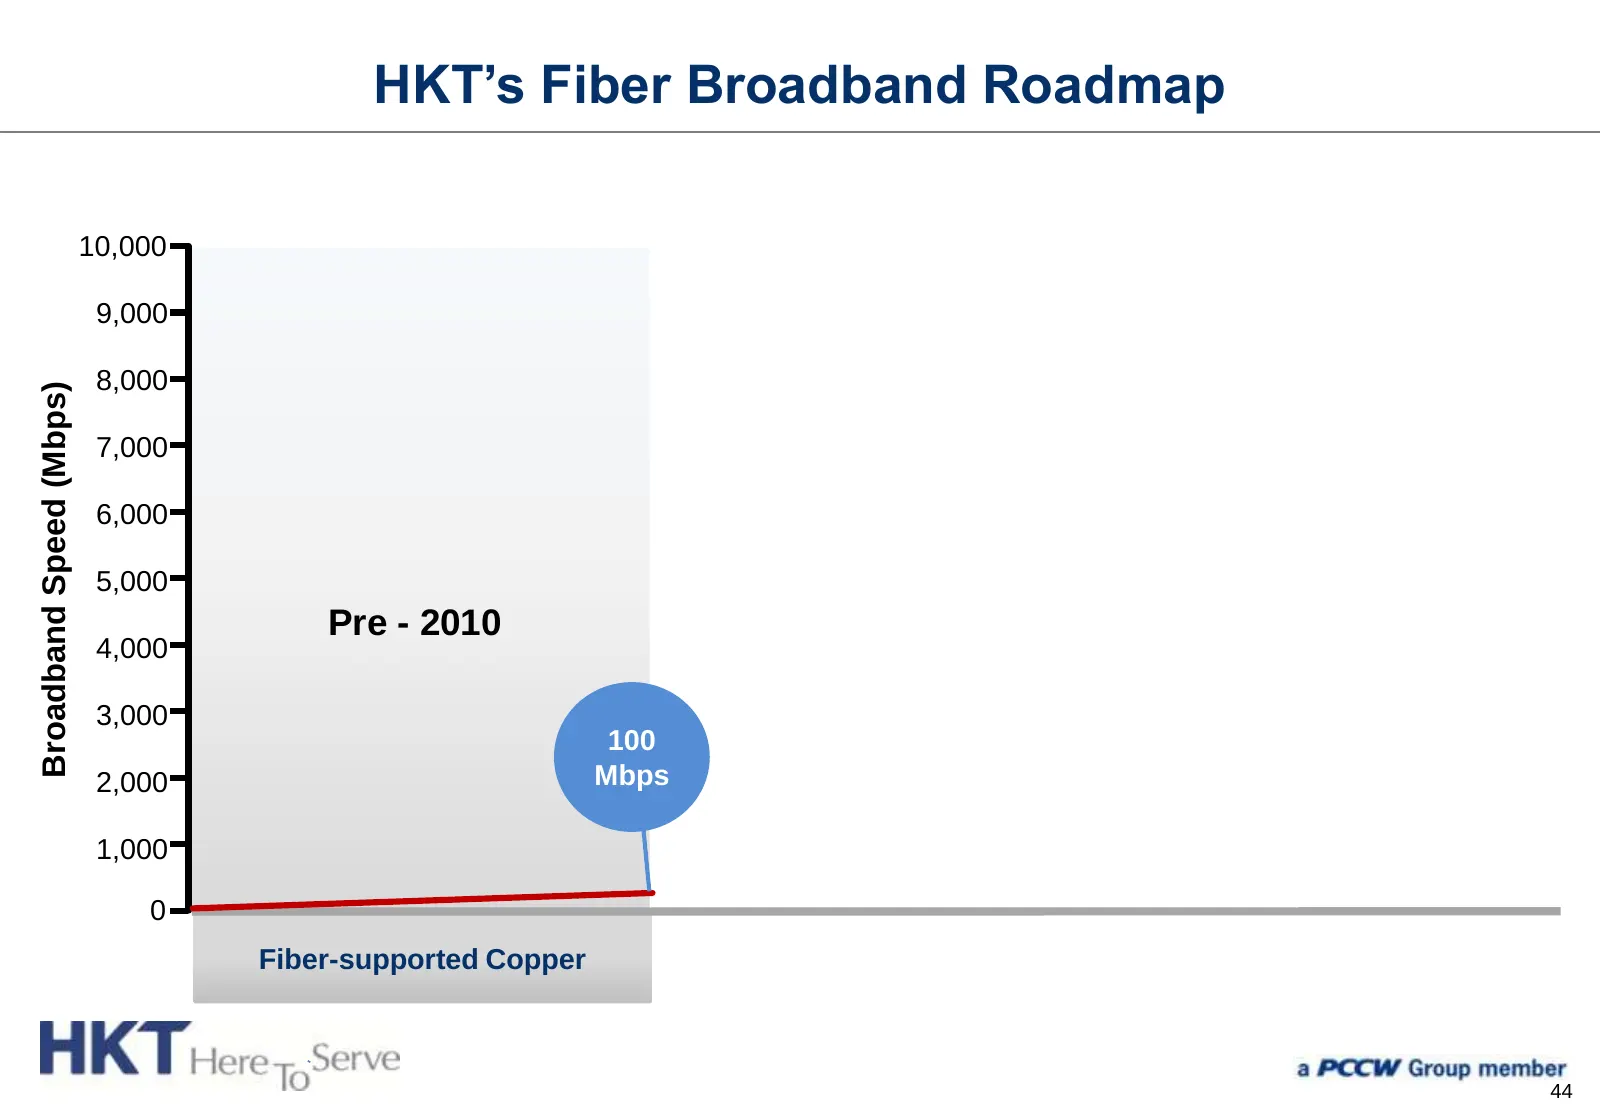
HKT’s Fiber Broadband Roadmap 10,000 9,000 8,000 Broadband Speed (Mbps) 7,000 6,000 5,000 Pre - 2010 4,000 3,000 100 2,000 Mbps 1,000 0 Fiber-supported Copper 44
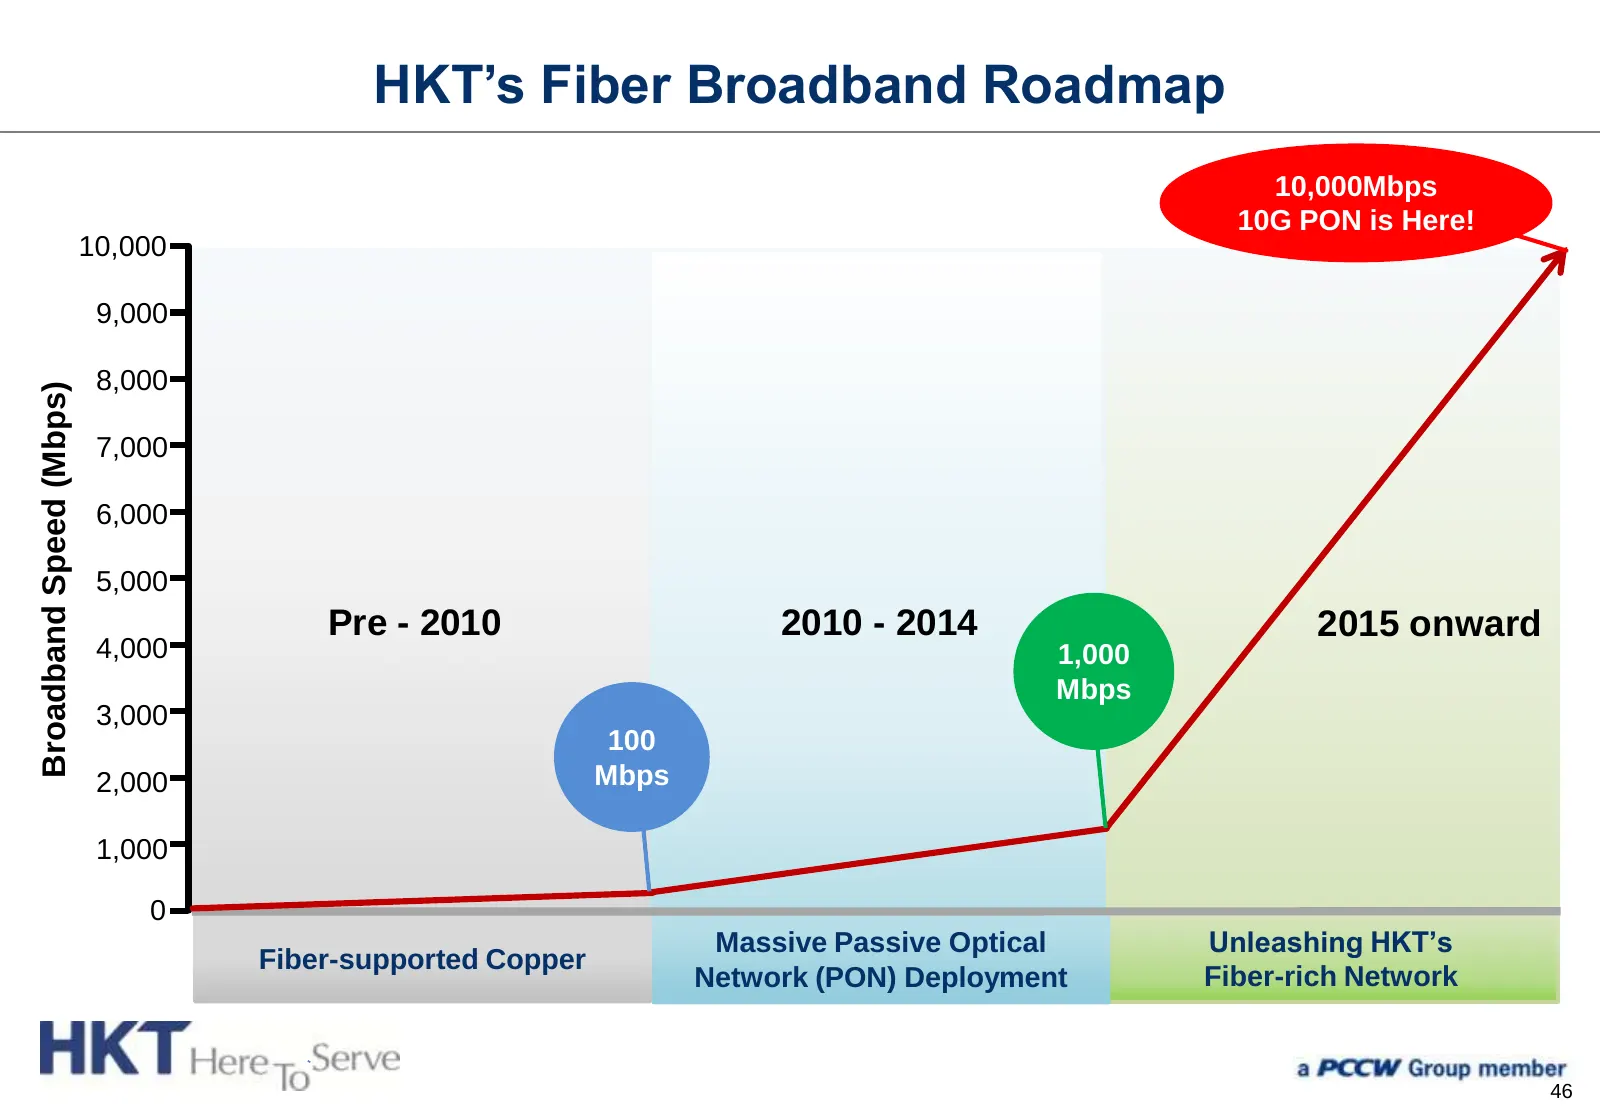
Slide 46: HKT's Fiber Broadband Roadmap
HKT’s Fiber Broadband Roadmap 10,000 9,000 8,000 Broadband Speed (Mbps) 7,000 6,000 5,000 Pre - 2010 2010 - 2014 4,000 1,000 Mbps 3,000 100 2,000 Mbps 1,000 0 Massive Passive Optical Fiber-supported Copper Network (PON) Deployment 45
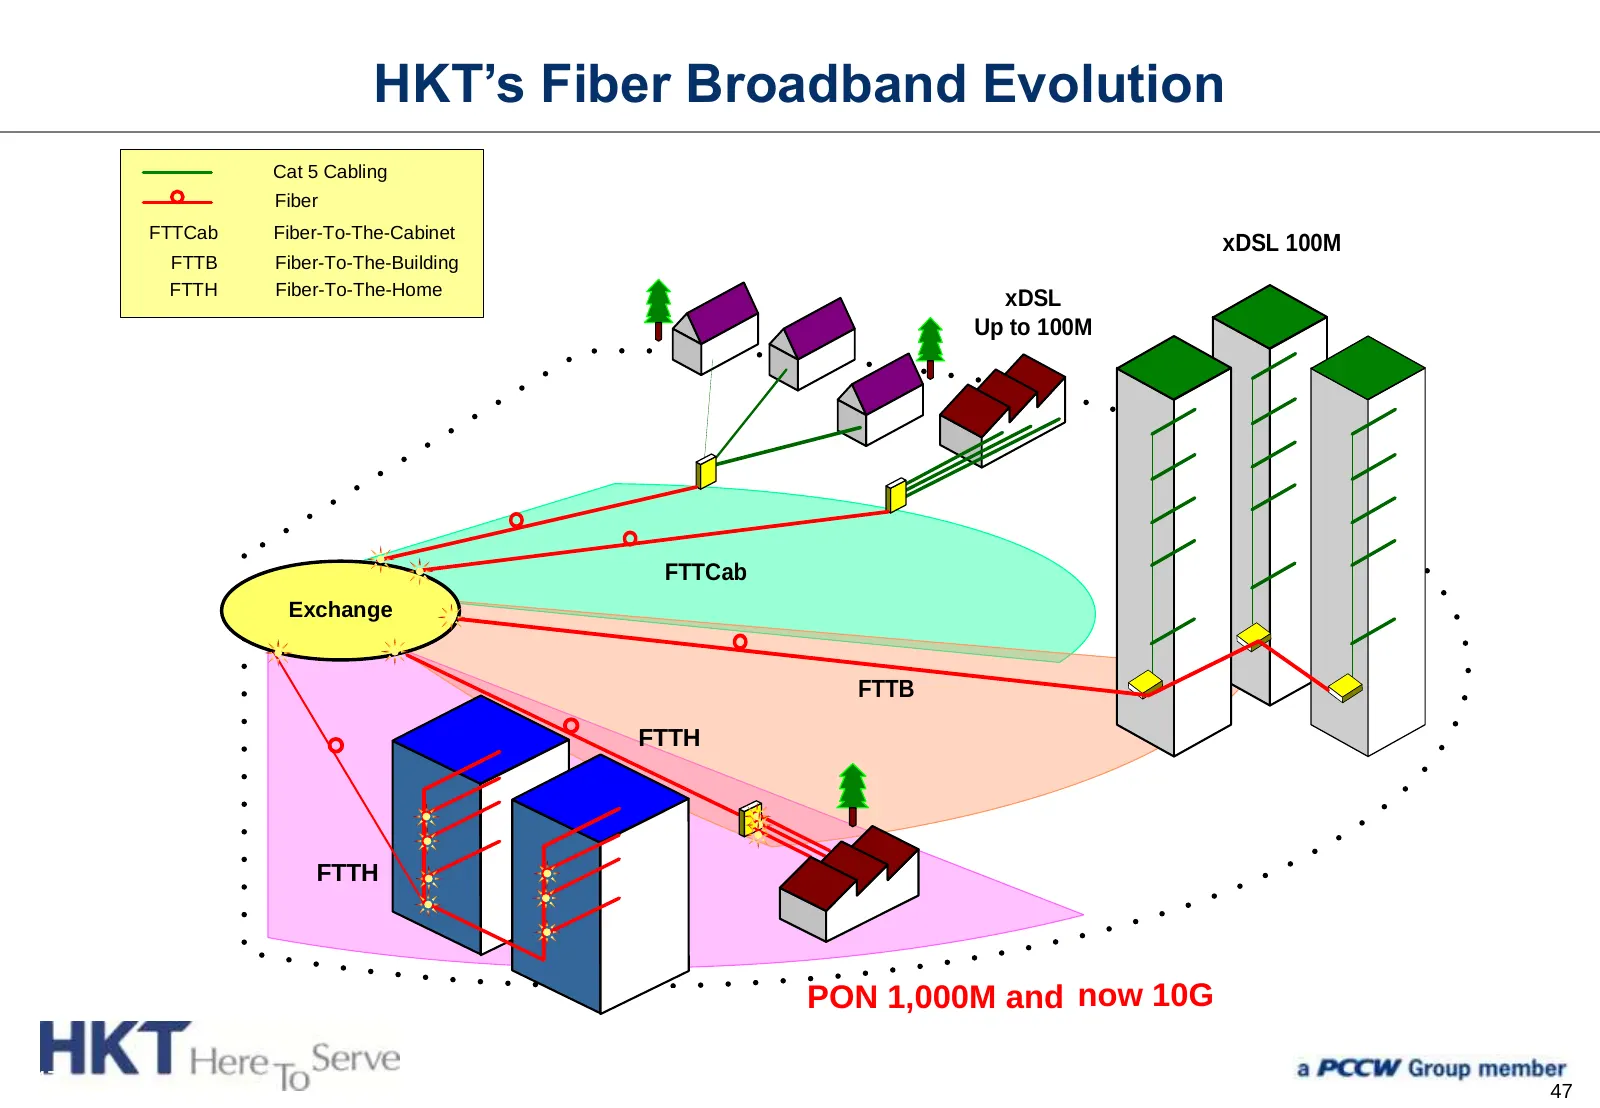
Slide 47: HKT's Fiber Broadband Roadmap
HKT’s Fiber Broadband Roadmap 10,000Mbps 10G PON is Here! 10,000 9,000 8,000 Broadband Speed (Mbps) 7,000 6,000 5,000 Pre - 2010 2010 - 2014 2015 onward 4,000 1,000 Mbps 3,000 100 2,000 Mbps 1,000 0 Massive Passive Optical Unleashing HKT’s Fiber-supported Copper Network (PON) Deployment Fiber-rich N
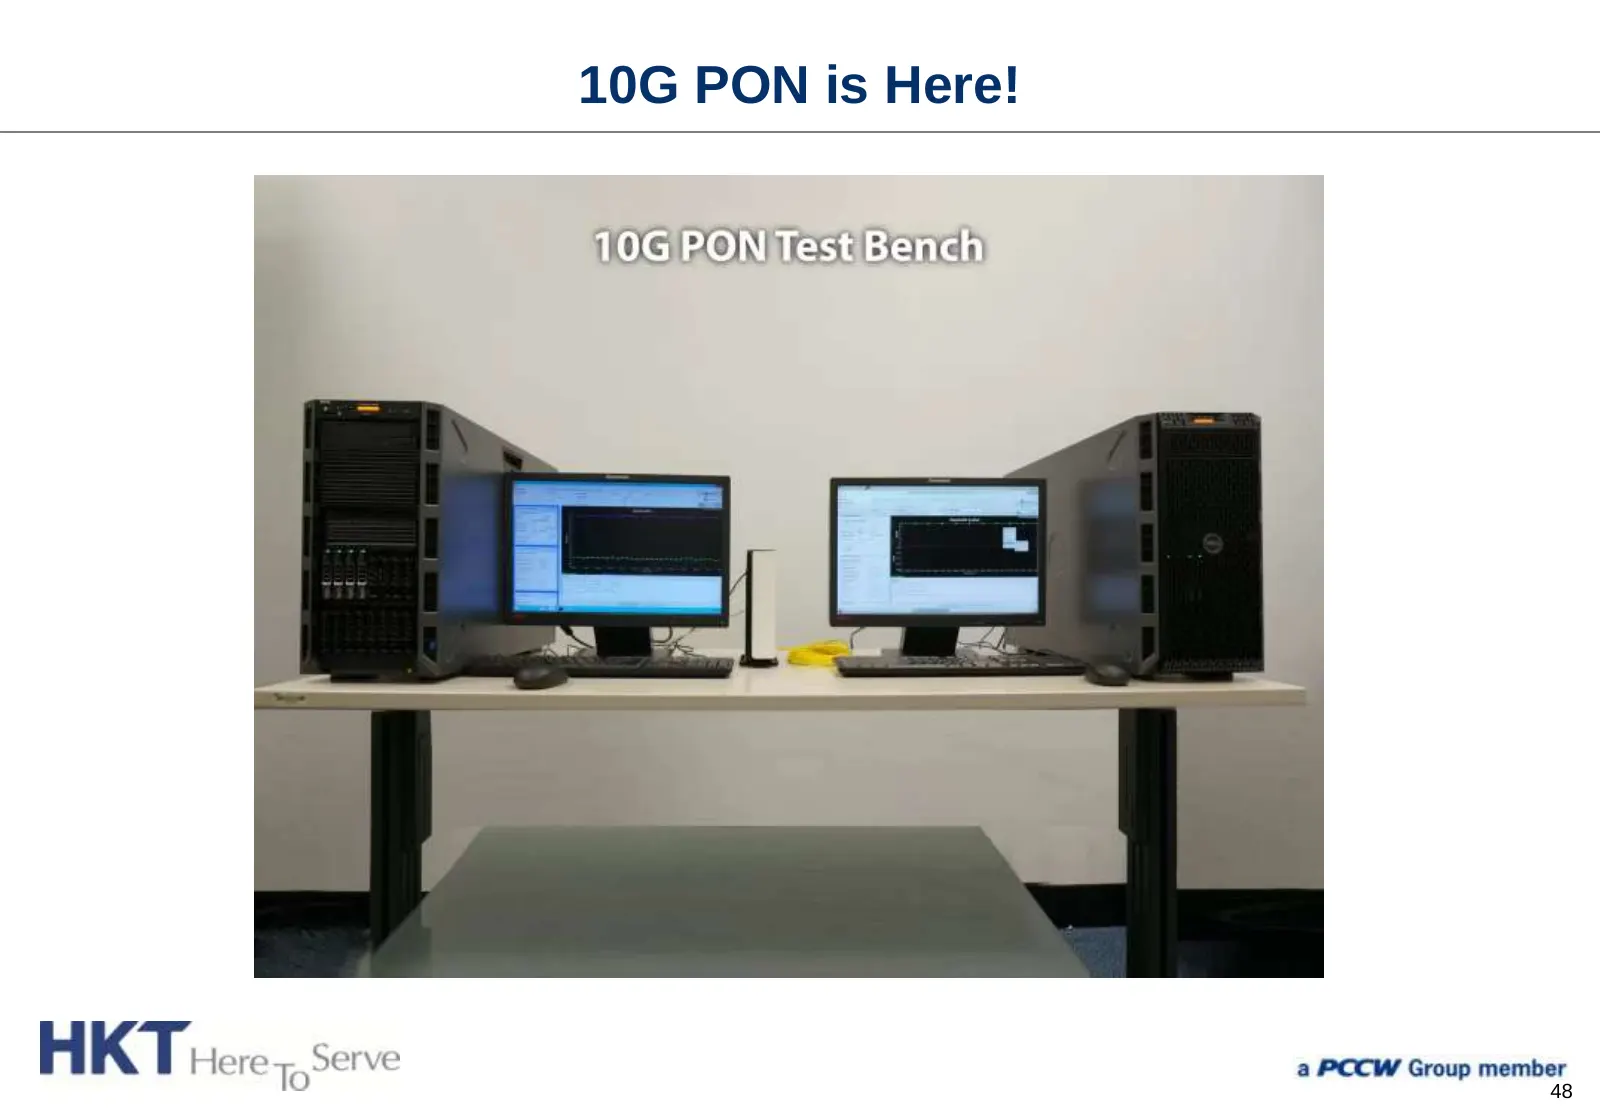
Slide 48: HKT's Fiber Broadband Evolution
HKT’s Fiber Broadband Evolution Cat 5 Cabling Fiber FTTCab Fiber-To-The-Cabinet xDSL 100M FTTB Fiber-To-The-Building FTTH Fiber-To-The-Home xDSL Up to 100M FTTCab Exchange FTTB FTTH FTTH PON 1,000M and now 10G 47 47
Slide 49: 10G PON is Here!
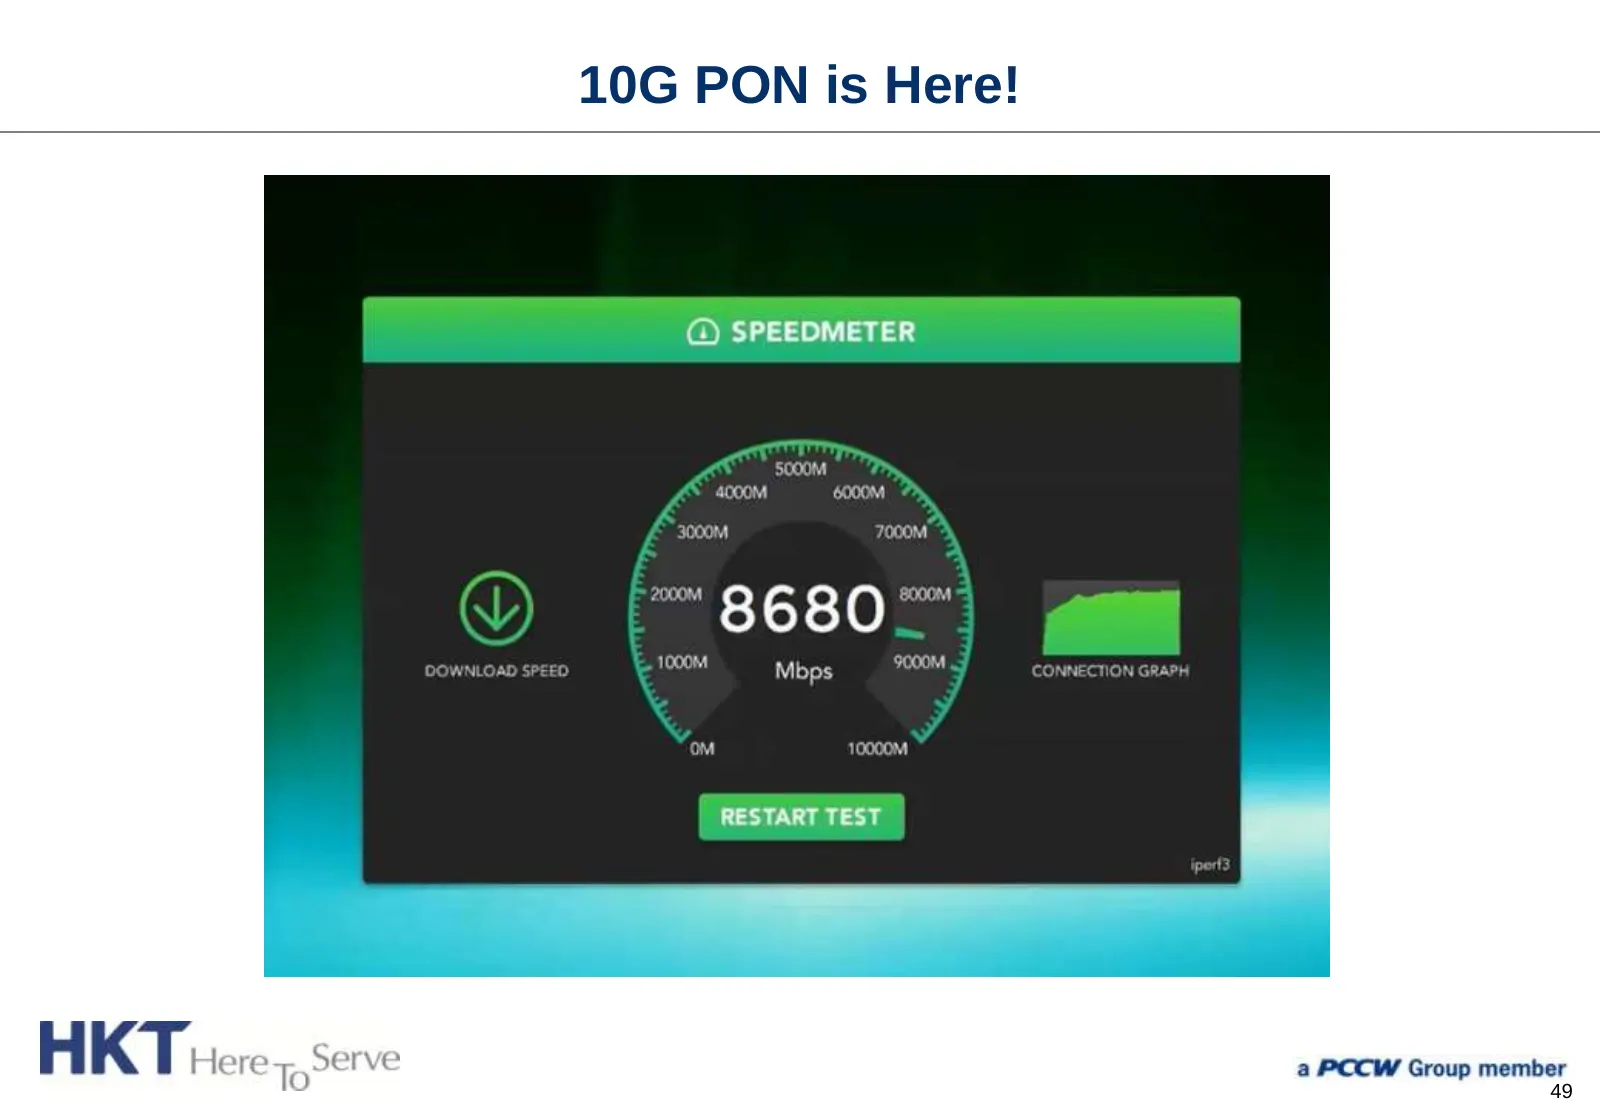
10G PON is Here! 10G: PONiTest Bench HKT Here+,9erve a PCCW Group member 48
Slide 50: 10G PON is Here!
10G PON is Here! HK i Here s.erve a PCCW Group member 49
Slide 51: 10G PON Download 25GB File 100 Times Faster than 100Mbps
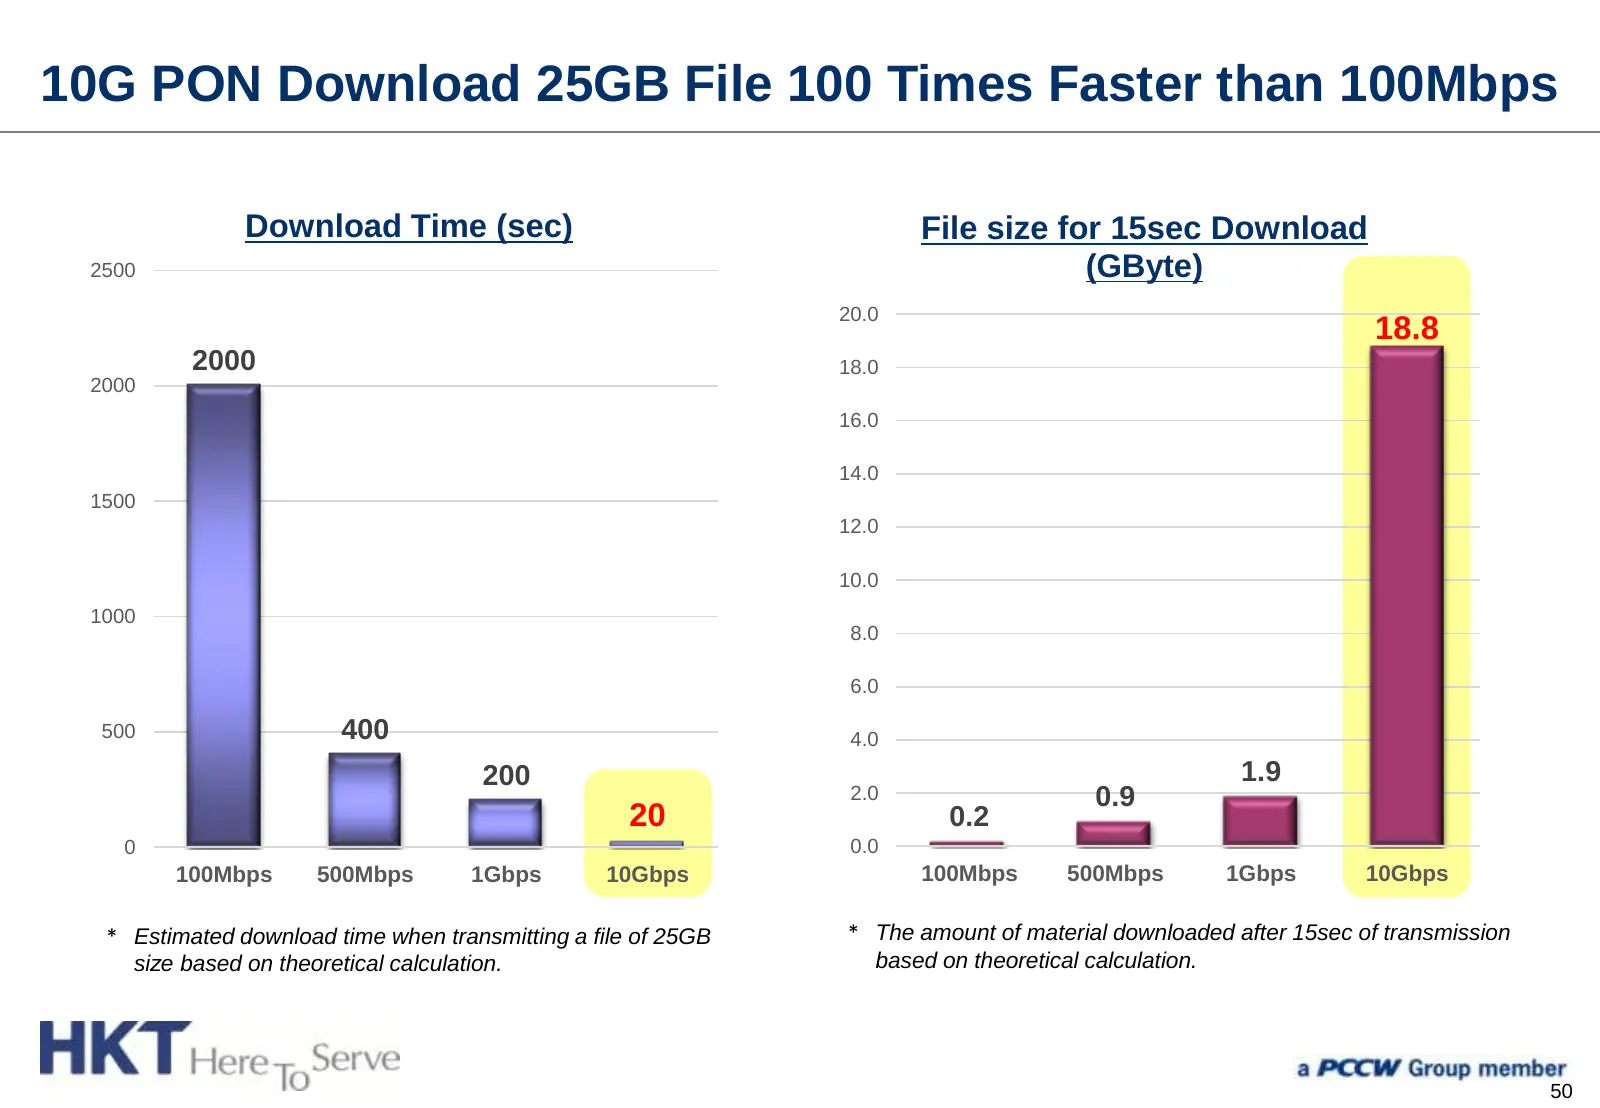
10G PON Download 25GB File 100 Times Faster than 100Mbps Download Time (sec) File size for 15sec Download 2500 (GByte) 20.0 18.8 2000 18.0 2000 16.0 14.0 1500 12.0 10.0 1000 8.0 6.0 500 400 4.0 200 1.9 2.0 0.9 20 0.2 0 0.0 100Mbps 500Mbps 1Gbps 10Gbps 100Mbps 500Mbps 1Gbps 10Gbps * Estimated downloa
Slide 52: 10G PON Rollout Strategy
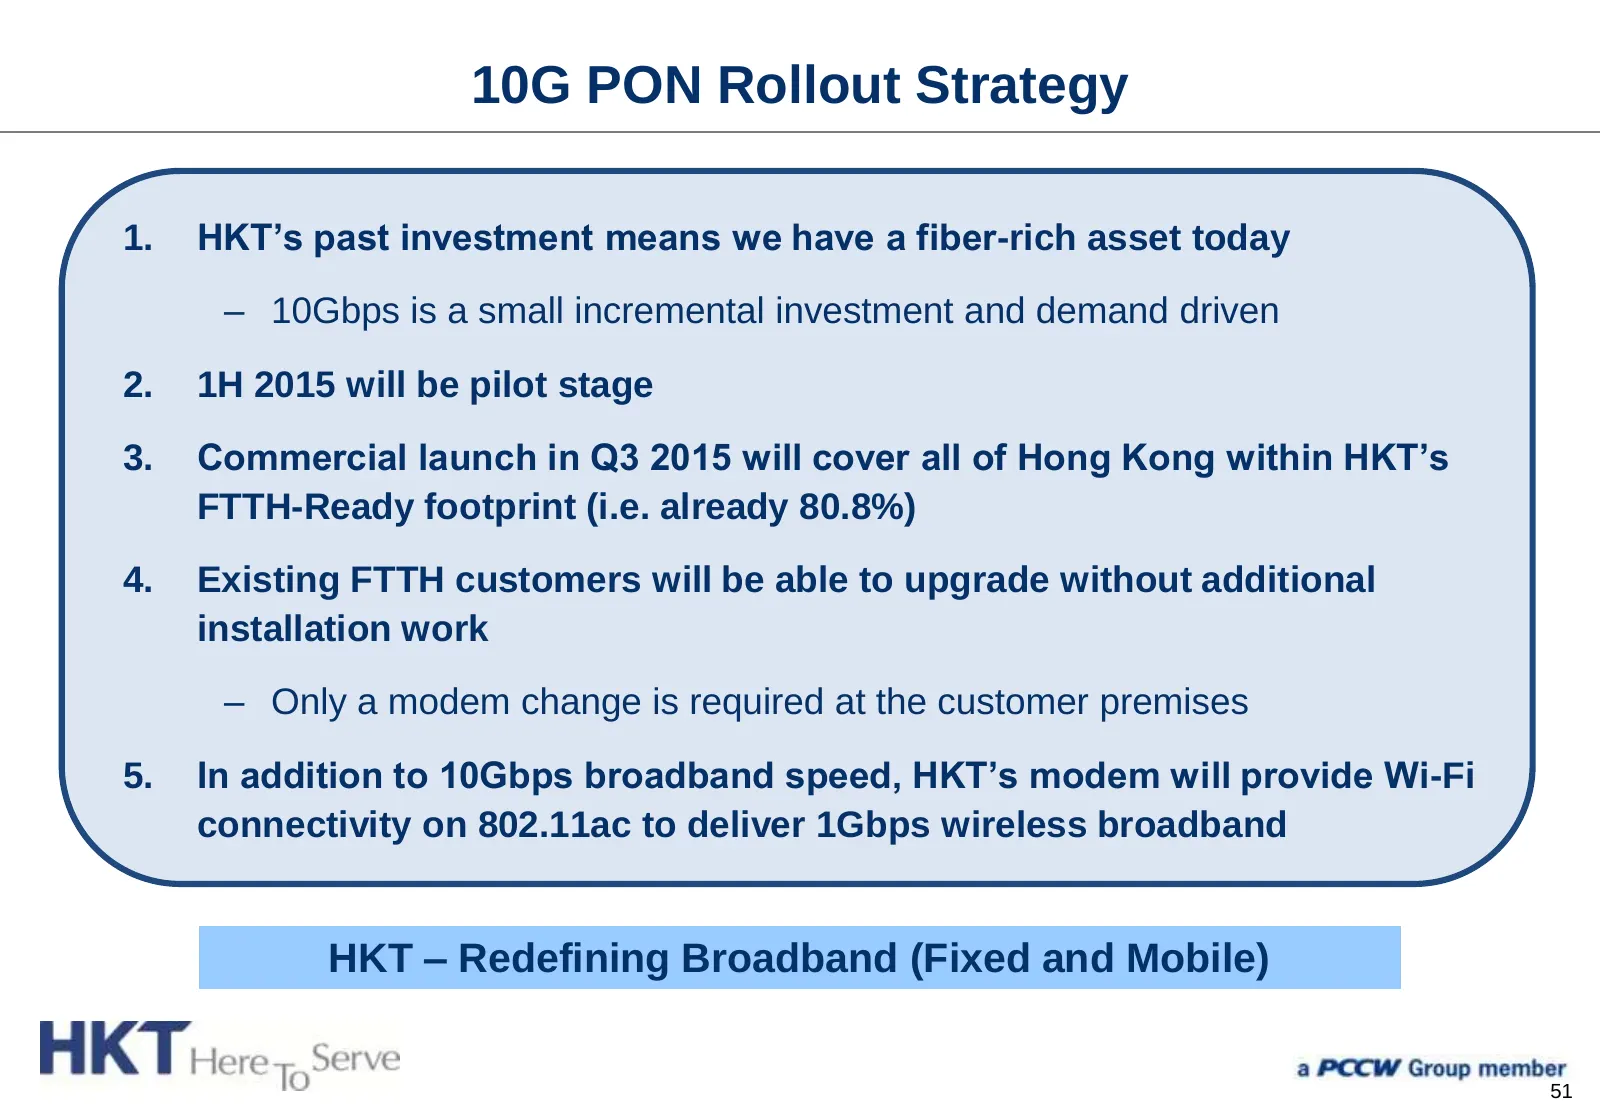
10G PON Rollout Strategy 1. HKT’s past investment means we have a fiber-rich asset today – 10Gbps is a small incremental investment and demand driven 2. 1H 2015 will be pilot stage 3. Commercial launch in Q3 2015 will cover all of Hong Kong within HKT’s FTTH-Ready footprint (i.e. already 80.8%) 4. E
Slide 53: Strong Financial Performance Underpinned by Solid Operating Performance
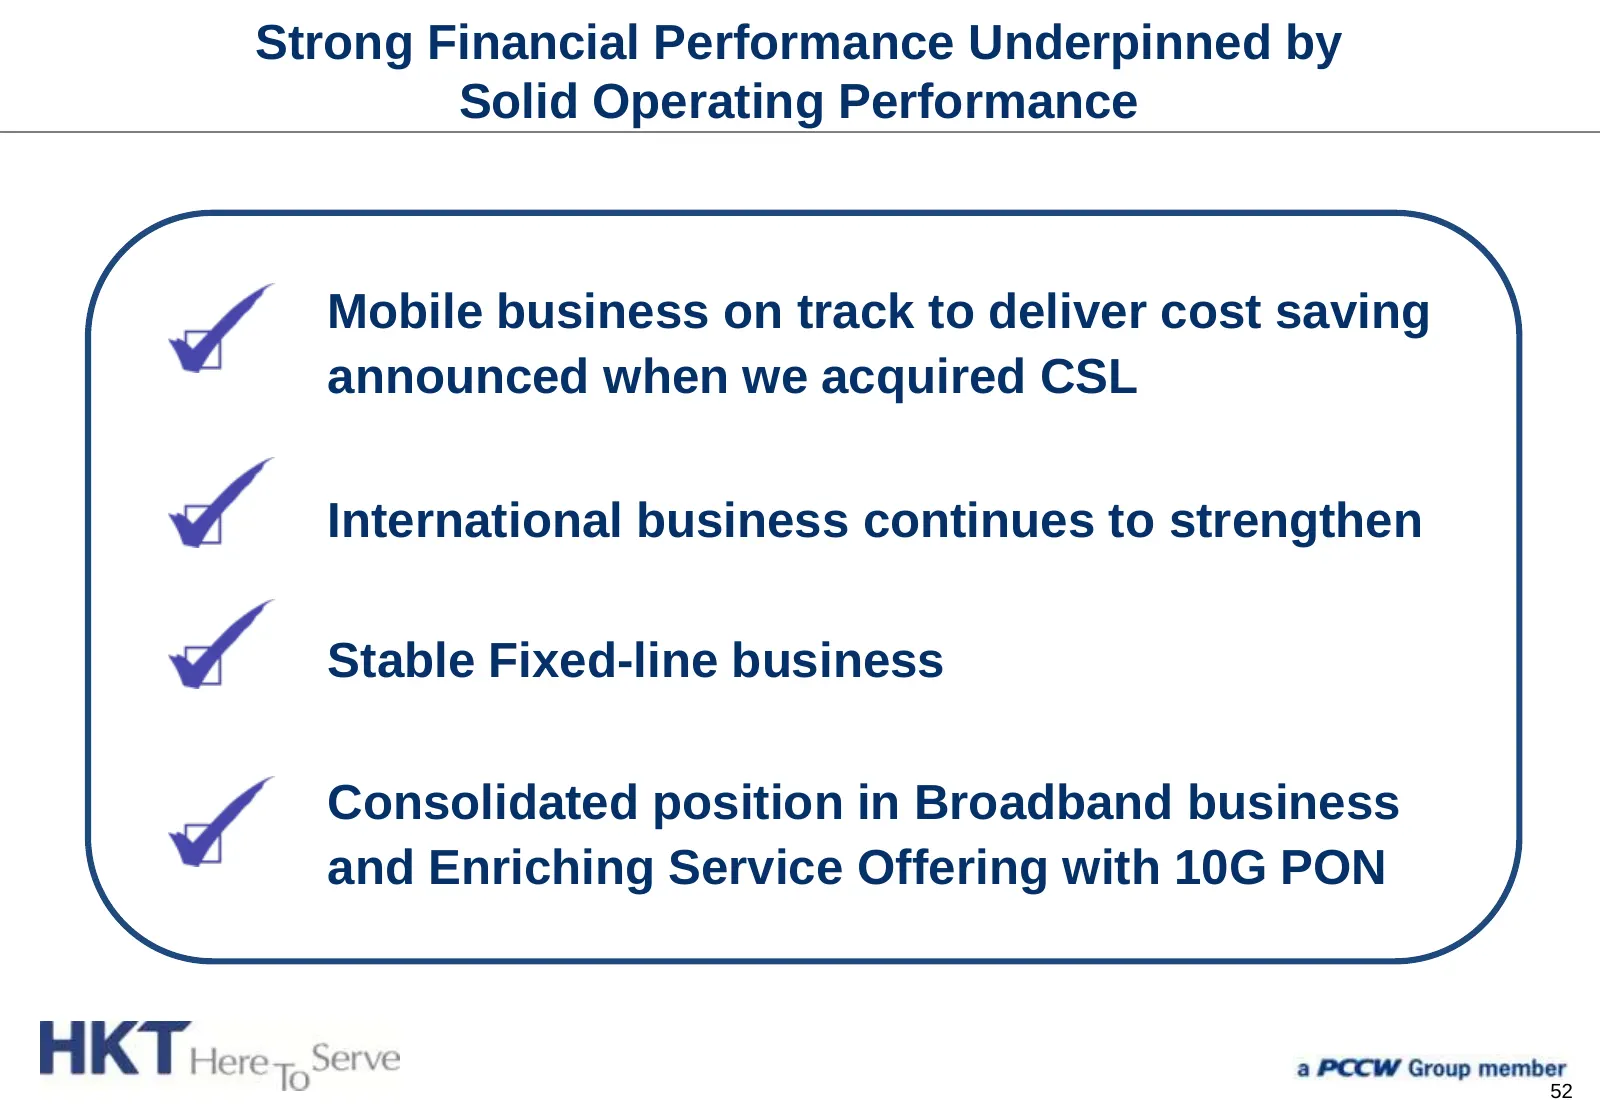
Strong Financial Performance Underpinned by Solid Operating Performance Mobile business on track to deliver cost saving announced when we acquired CSL International business continues to strengthen Stable Fixed-line business Consolidated position in Broadband business and Enriching Service Offering
Source: Internet Archive copy of hkt.com
More decks from HKT Trust and HKT Ltd
 HKT — H1 2025 Earnings Presentation35 slides · Jul 31, 2025
 FY2024 Earnings Presentation35 slides · Feb 20, 2025
 H1 2024 Earnings Presentation34 slides · Jul 25, 2024
 FY2023 Earnings Presentation36 slides · Feb 22, 2024
 H1 2023 Earnings Presentation32 slides · Aug 2, 2023
 HKT — FY2022 Earnings Presentation32 slides · Feb 23, 2023