SunTrust Banks — Credit Suisse Financial Services Forum 2015
21 slides from SunTrust Banks's conference presentation, Feb 11, 2015
Slide 1: Credit Suisse Financial Services Forum
Credit Suisse Financial Services Forum Aleem Gillani, Chief Financial Officer, SunTrust Banks, Inc. February 11, 2015
Slide 2: The following should be read in conjunction with the financial statements, notes and other
2 The following should be read in conjunction with the financial statements, notes and other information contained in the Company’s 2013 Annual Report on Form 10-K, Quarterly Reports on Form 10-Q, and Current Reports on Form 8-K. This presentation includes non-GAAP financial measures to describe Sun
Slide 3: Investment Thesis
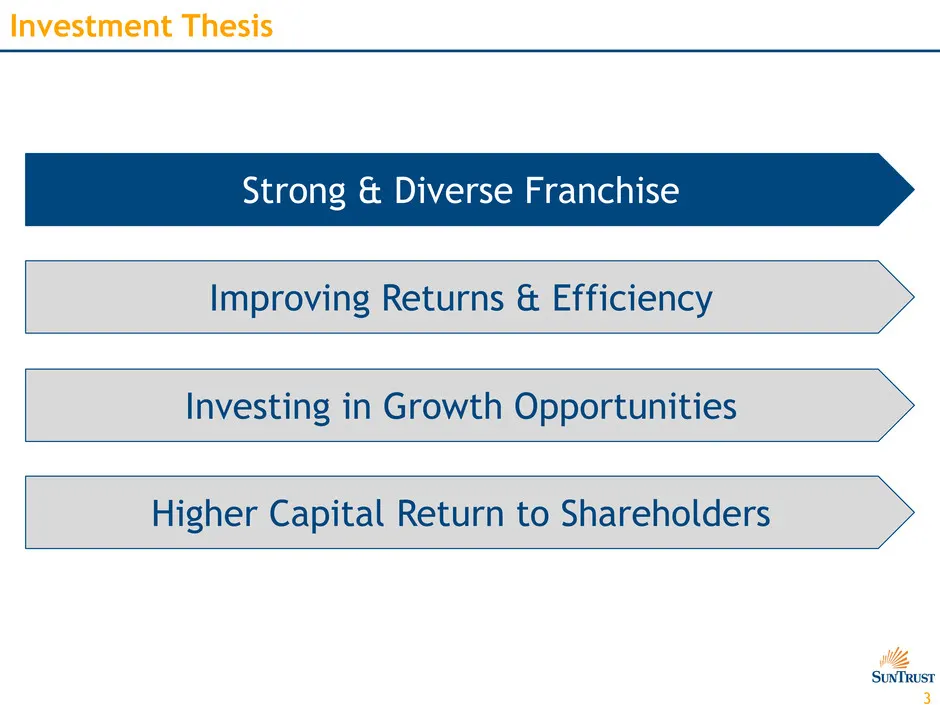
3 Investment Thesis Improving Returns & Efficiency Investing in Growth Opportunities Strong & Diverse Franchise Higher Capital Return to Shareholders
Slide 4: Franchise Overview: Who is SunTrust?
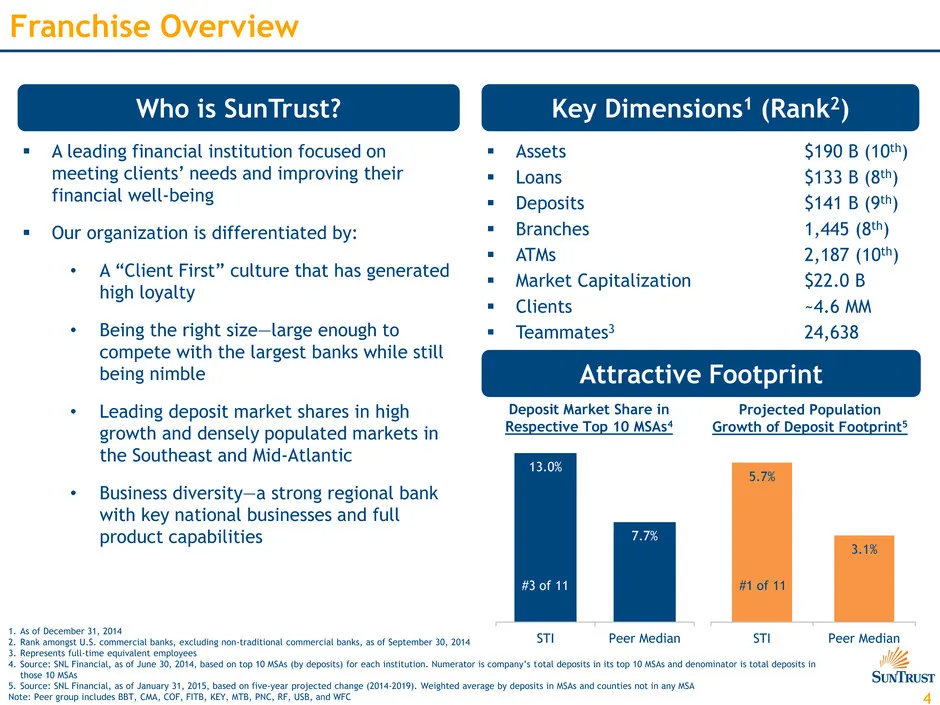
4 5.7% 3.1% STI Peer Median Franchise Overview Who is SunTrust? Key Dimensions1 (Rank2) A leading financial institution focused on meeting clients’ needs and improving their financial well-being Our organization is differentiated by: • A “Client First” culture that has generated high loyalty • B
Slide 5: Diverse Business Mix
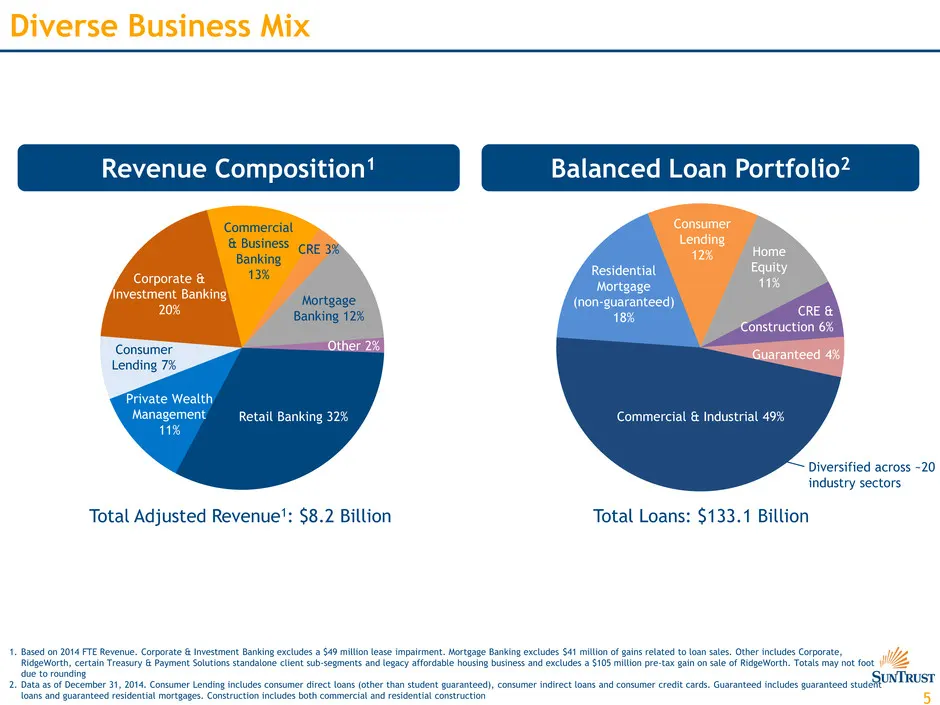
5 Diverse Business Mix 1. Based on 2014 FTE Revenue. Corporate & Investment Banking excludes a $49 million lease impairment. Mortgage Banking excludes $41 million of gains related to loan sales. Other includes Corporate, RidgeWorth, certain Treasury & Payment Solutions standalone client sub-segments
Slide 6: Investment Thesis
6 Investment Thesis Improving Returns & Efficiency Investing in Growth Opportunities Strong & Diverse Franchise Higher Capital Return to Shareholders
Slide 7: Solid Progress on Key Fronts
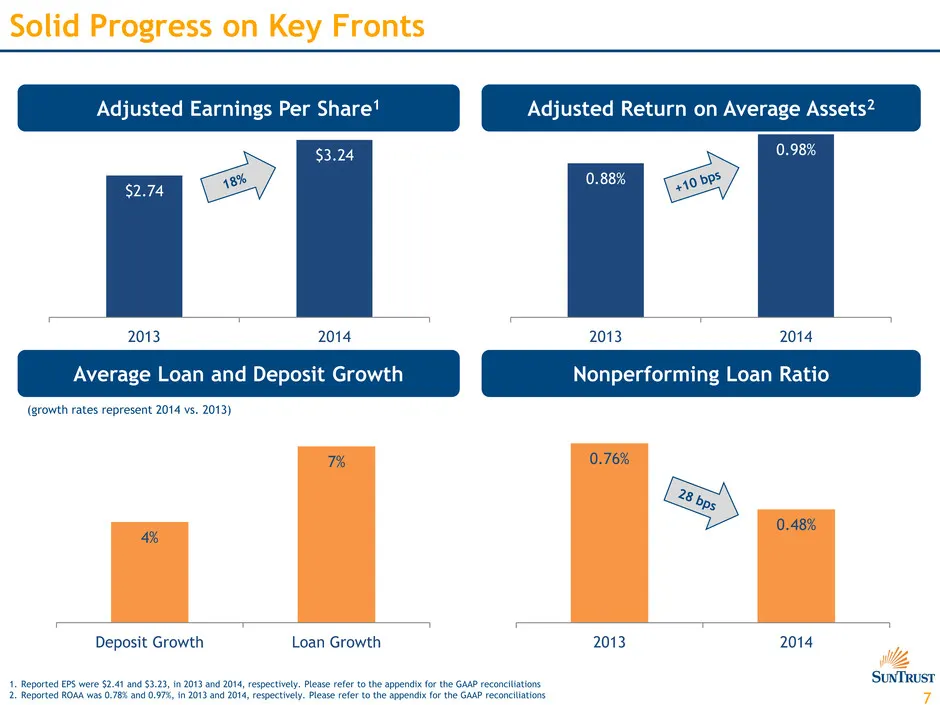
7 $2.74 $3.24 2013 2014 0.88% 0.98% 2013 2014 Solid Progress on Key Fronts Adjusted Earnings Per Share1 Nonperforming Loan Ratio Adjusted Return on Average Assets2 Average Loan and Deposit Growth (growth rates represent 2014 vs. 2013) 1. Reported EPS were $2.41 and $3.23, in 2013 and 2014, respectiv
Slide 8: Broad-based Momentum Across Each Segment
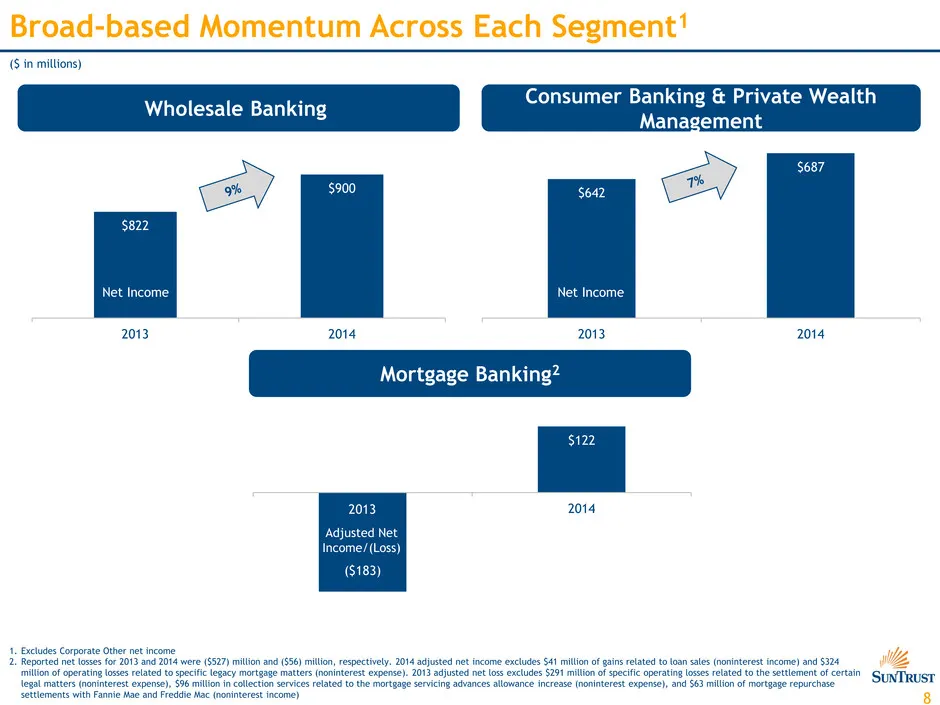
8 $822 $900 2013 2014 Broad-based Momentum Across Each Segment1 Wholesale Banking Consumer Banking & Private Wealth Management Mortgage Banking2 $642 $687 2013 2014 ($183) $122 2013 2014 ($ in millions) Net Income Net Income Adjusted Net Income/(Loss) 1. Excludes Corporate Other net income 2. Report
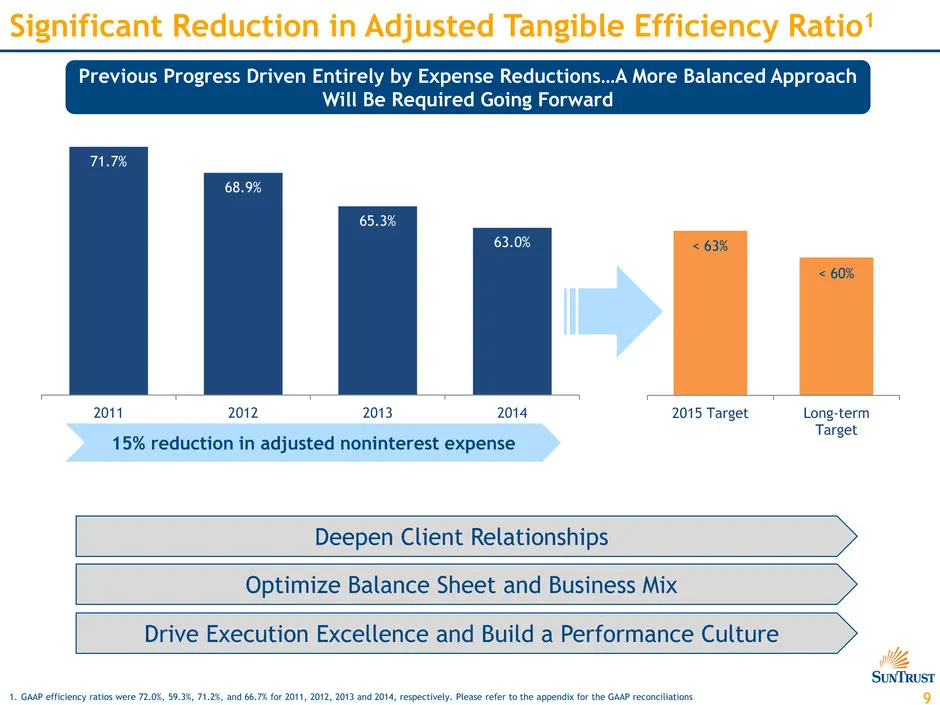
Slide 9: Significant Reduction in Adjusted Tangible Efficiency Ratio
9 2015 Target Long-term Target 15% reduction in adjusted noninterest expense Significant Reduction in Adjusted Tangible Efficiency Ratio1 1. GAAP efficiency ratios were 72.0%, 59.3%, 71.2%, and 66.7% for 2011, 2012, 2013 and 2014, respectively. Please refer to the appendix for the GAAP reconciliatio
Slide 10: Investment Thesis
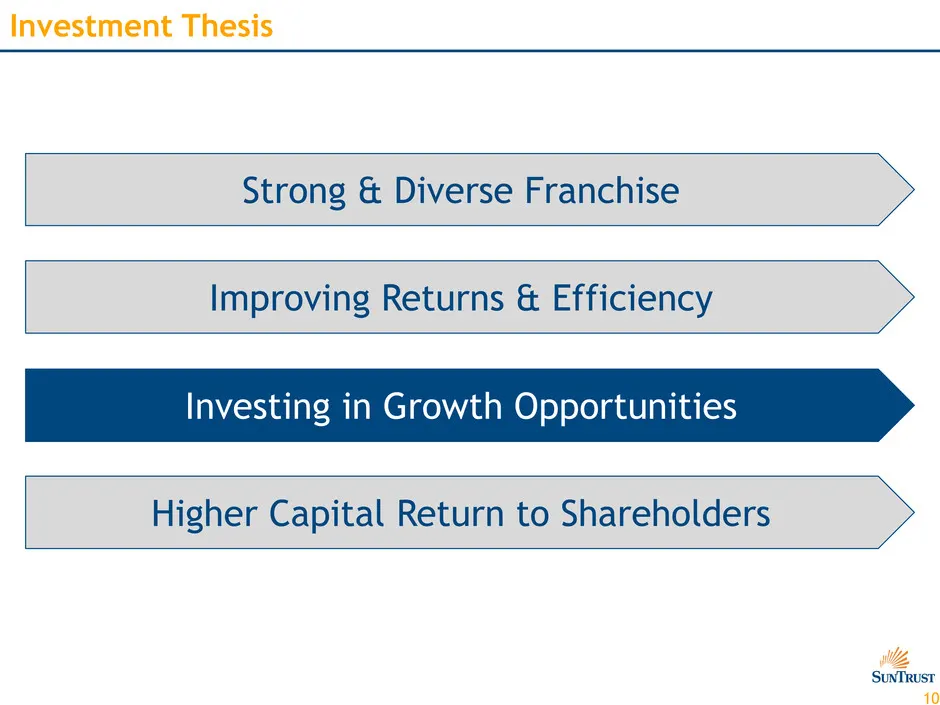
10 Investment Thesis Improving Returns & Efficiency Investing in Growth Opportunities Strong & Diverse Franchise Higher Capital Return to Shareholders
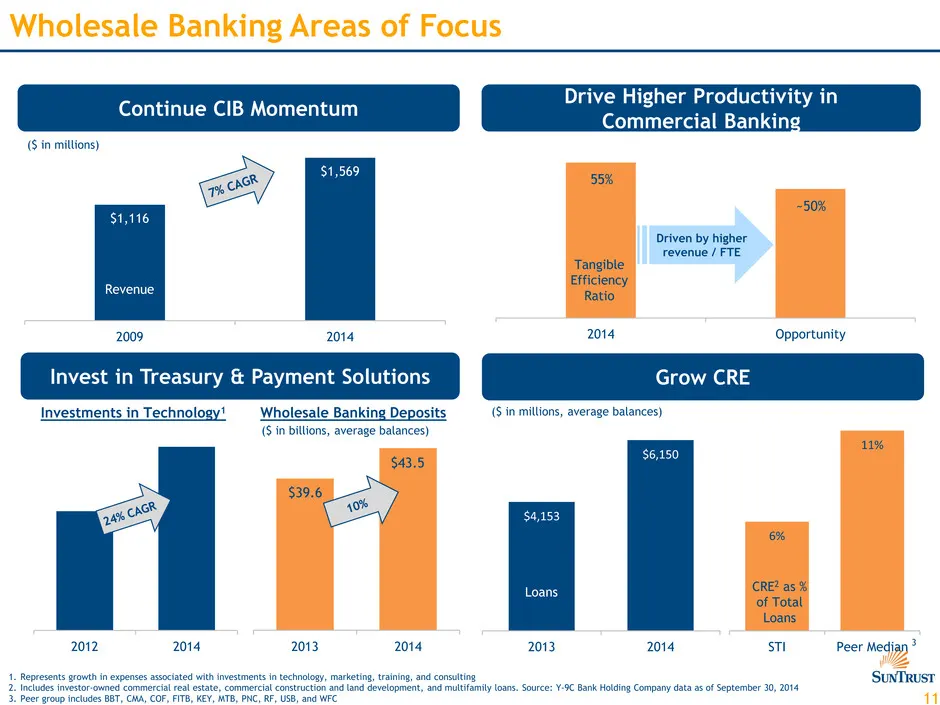
Slide 11: Wholesale Banking Areas of Focus
11 2013 20142012 2014 2014 Opportunity Wholesale Banking Areas of Focus 1. Represents growth in expenses associated with investments in technology, marketing, training, and consulting 2. Includes investor-owned commercial real estate, commercial construction and land development, and multifamily loa
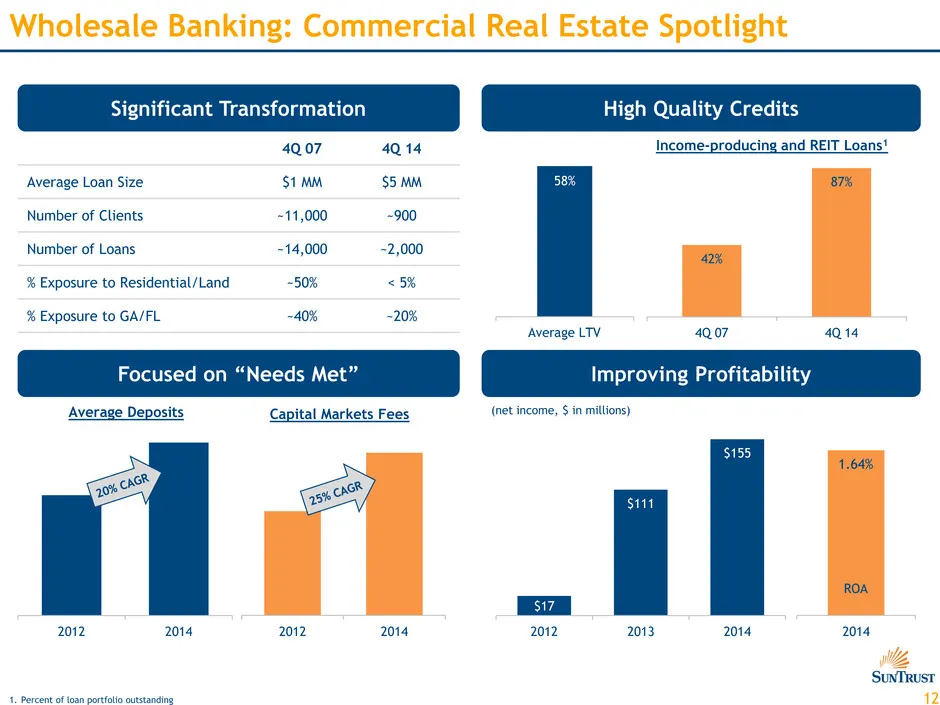
Slide 12: Wholesale Banking: Commercial Real Estate Spotlight
12 42% 87% 4Q 07 4Q 14 2012 2014 $17 $111 $155 2012 2013 20142012 2014 Wholesale Banking: Commercial Real Estate Spotlight (net income, $ in millions) Average Deposits Capital Markets Fees 58% Significant Transformation High Quality Credits Focused on “Needs Met” Improving Profitability Average LTV
Slide 13: Consumer Banking and Private Wealth Management Areas of Focus
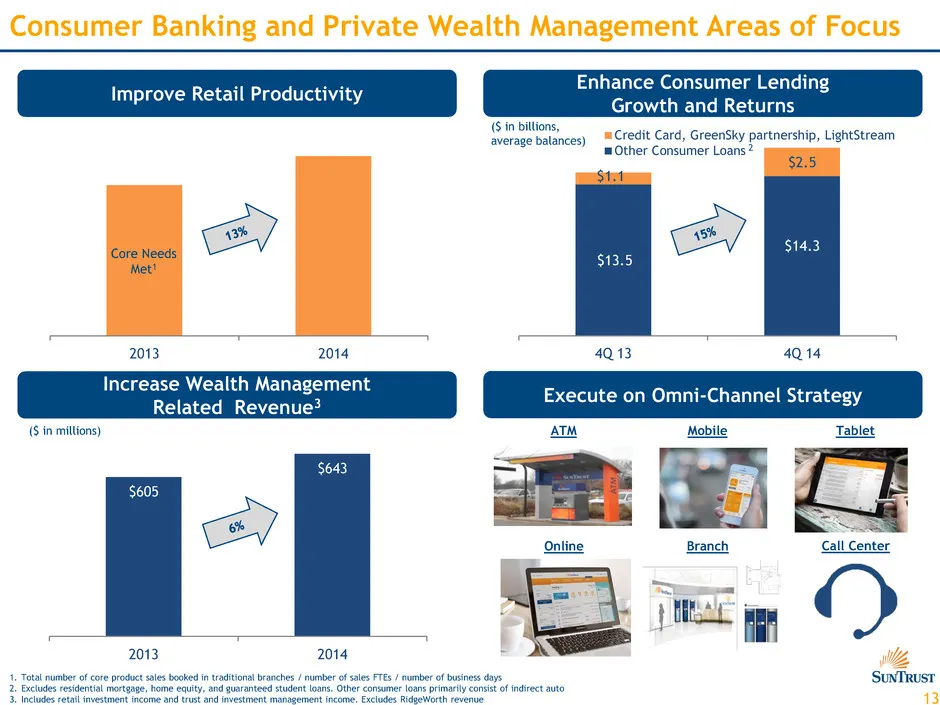
13 $13.5 $14.3 $1.1 $2.5 4Q 13 4Q 14 Credit Card, GreenSky partnership, LightStream Other Consumer Loans $605 $643 2013 2014 2013 2014 Consumer Banking and Private Wealth Management Areas of Focus Execute on Omni-Channel Strategy Improve Retail Productivity Enhance Consumer Lending Growth and Return
Slide 14: CPWM: Wealth and Investment Management Spotlight
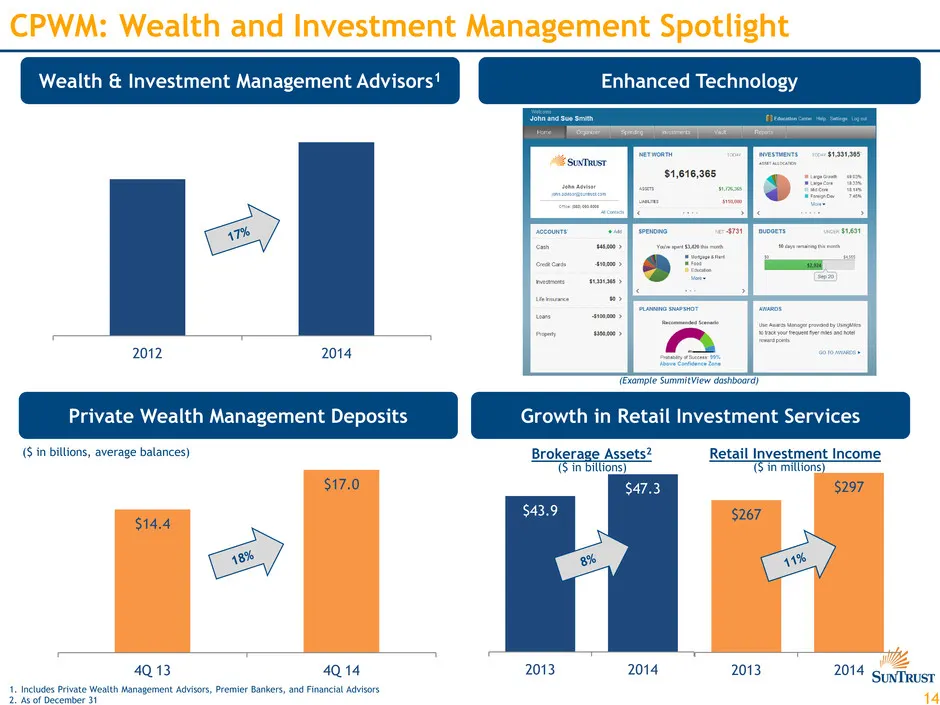
14 2012 2014 $43.9 $47.3 2013 2014 CPWM: Wealth and Investment Management Spotlight 1. Includes Private Wealth Management Advisors, Premier Bankers, and Financial Advisors 2. As of December 31 Retail Investment Income Brokerage Assets2 ($ in billions, average balances) Wealth & Investment Management
Slide 15: Mortgage Banking Areas of Focus
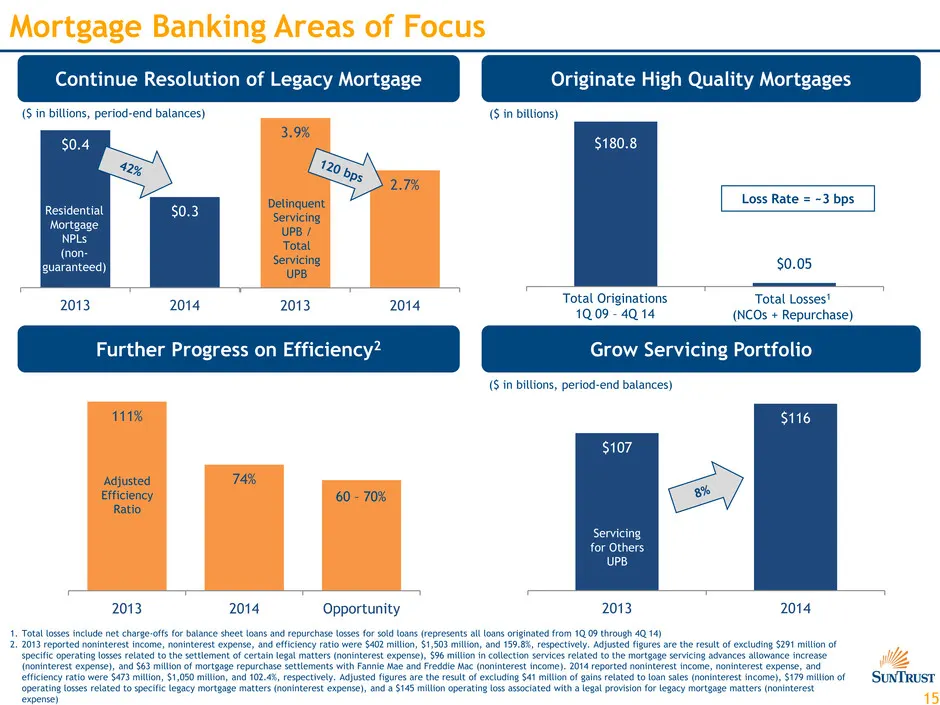
15 $107 $116 2013 2014 $0.4 $0.3 2013 2014 3.9% 2.7% 2013 2014 111% 74% 2013 2014 Opportunity Mortgage Banking Areas of Focus ($ in billions) Residential Mortgage NPLs (non- guaranteed) 1. Total losses include net charge-offs for balance sheet loans and repurchase losses for sold loans (represents a
Slide 16: Investment Thesis
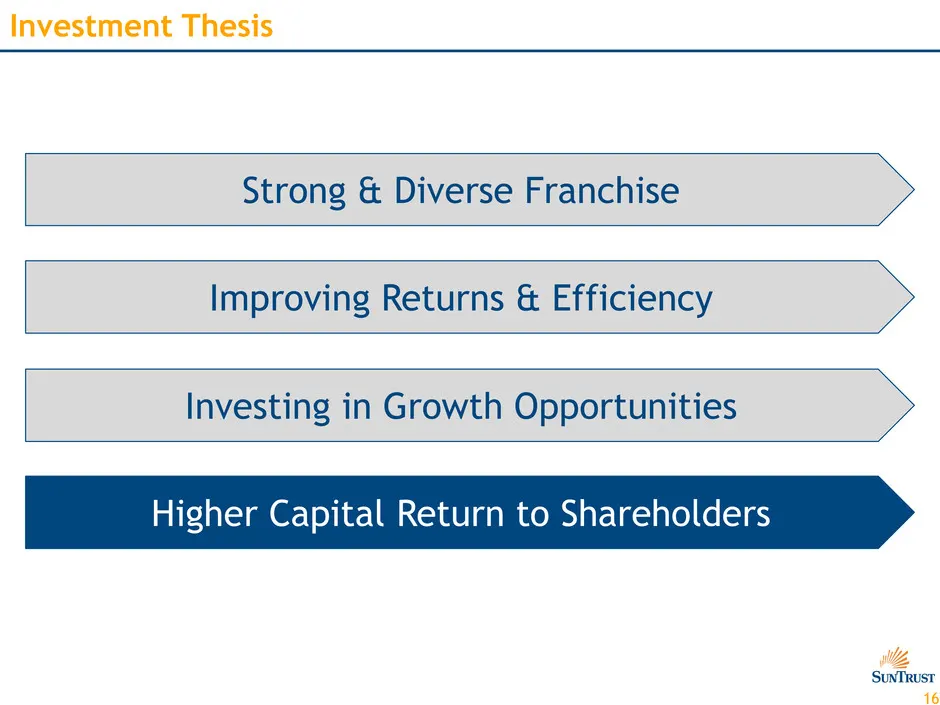
16 Investment Thesis Improving Returns & Efficiency Investing in Growth Opportunities Strong & Diverse Franchise Higher Capital Return to Shareholders
Slide 17: Capital Management
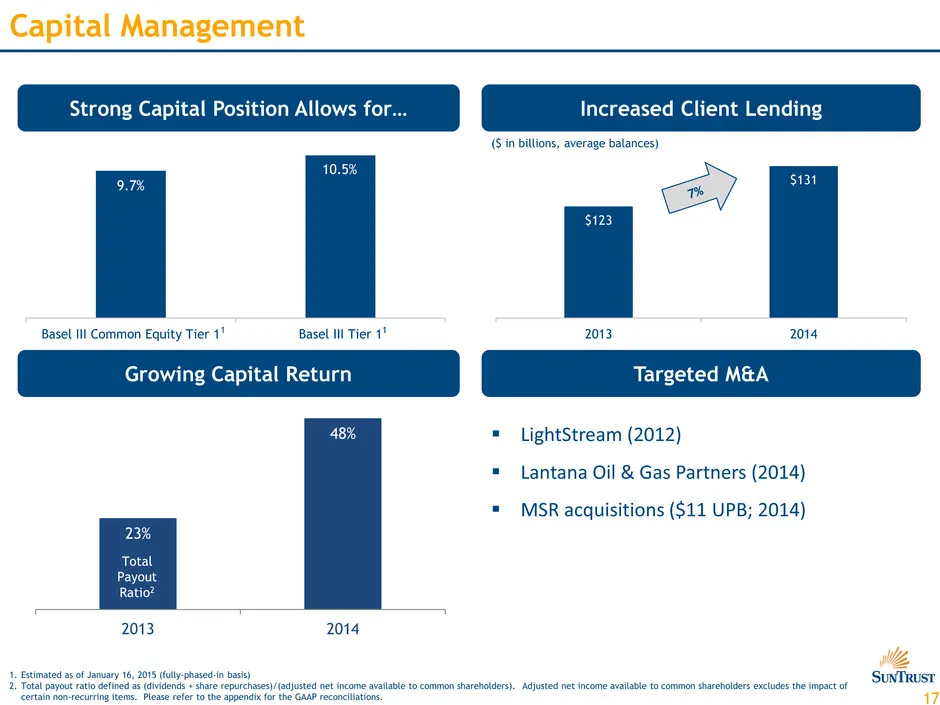
17 Capital Management Growing Capital Return Strong Capital Position Allows for… Increased Client Lending Targeted M&A LightStream (2012) Lantana Oil & Gas Partners (2014) MSR acquisitions ($11 UPB; 2014) Basel III Common Equity Tier 1 Basel III Tier 1 10.5% 9.7% 1 1. Estimated as of January 1
Slide 18: Investment Thesis
18 Investment Thesis Improving Returns & Efficiency Investing in Growth Opportunities Strong & Diverse Franchise Higher Capital Return to Shareholders

Slide 19: Appendix
Appendix
Slide 20: Reconciliation of Efficiency Ratio
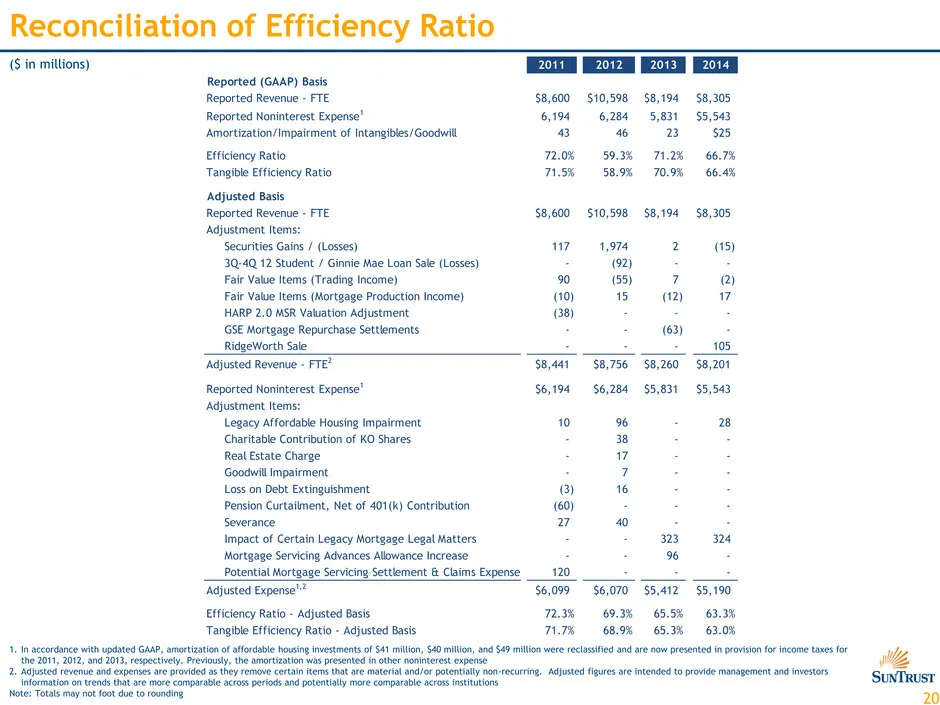
20 Reconciliation of Efficiency Ratio ($ in millions) 1. In accordance with updated GAAP, amortization of affordable housing investments of $41 million, $40 million, and $49 million were reclassified and are now presented in provision for income taxes for the 2011, 2012, and 2013, respectively. Prev
Slide 21: Income Statement
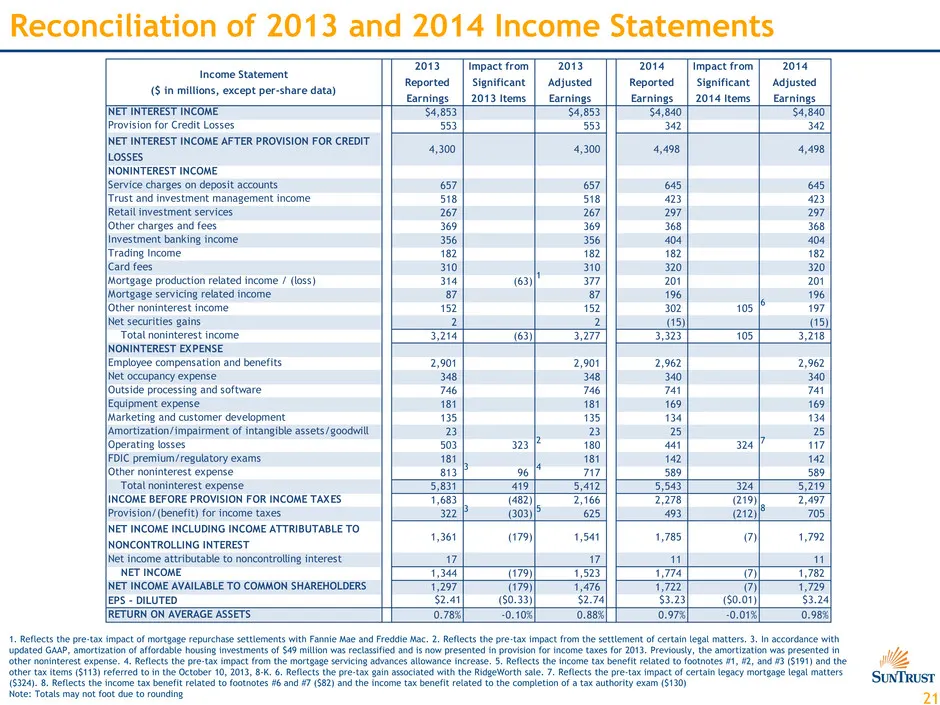
21 Income Statement ($ in millions, except per-share data) 2013 Reported Earnings Impact from Significant 2013 Items 2013 Adjusted Earnings 2014 Reported Earnings Impact from Significant 2014 Items 2014 Adjusted Earnings NET INTEREST INCOME $4,853 $4,853 $4,840 $4,840 Provision for Credit Losses 553
Source: SEC EDGAR · 8-K filed Feb 11, 2015
More decks from SunTrust Banks Inc
 Q3 2019 Earnings Presentation21 slides · Oct 17, 2019
 Q2 2019 Earnings Presentation22 slides · Jul 18, 2019
 Q1 2019 Earnings Presentation22 slides · Apr 18, 2019
 Merger or Acquisition (February 2019)38 slides · Feb 7, 2019
 Q4 2018 Earnings Presentation23 slides · Jan 18, 2019
 2018 Goldman Sachs US Financial Services Conference30 slides · Dec 4, 2018