Dun & Bradstreet Holdings Inc.
Dun & Bradstreet — Q2 2022 Earnings Presentation
14 slides from Dun & Bradstreet's earnings presentation, Aug 4, 2022
Slide 1: Second Quarter 2022 Financial Results
Dun & Bradstreet SECOND QUARTER 2022 FINANCIAL RESULTS August 4, 2022
Slide 2: Forward-looking statements
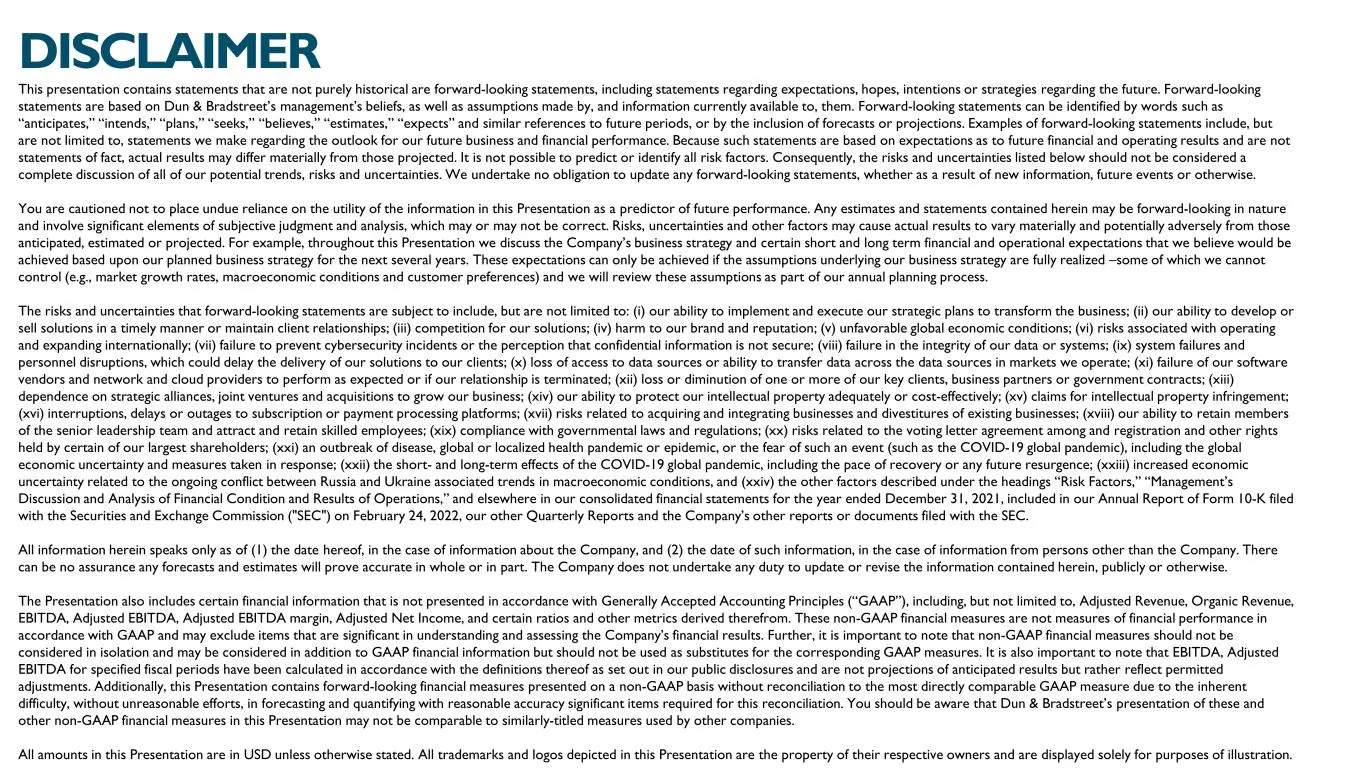
This presentation contains statements that are not purely historical are forward-looking statements, including statements regarding expectations, hopes, intentions or strategies regarding the future. Forward-looking statements are based on Dun & Bradstreet’s management’s beliefs, as well as assumpti
Slide 3: Financial Highlights (GAAP) Metrics Second Quarter 2022
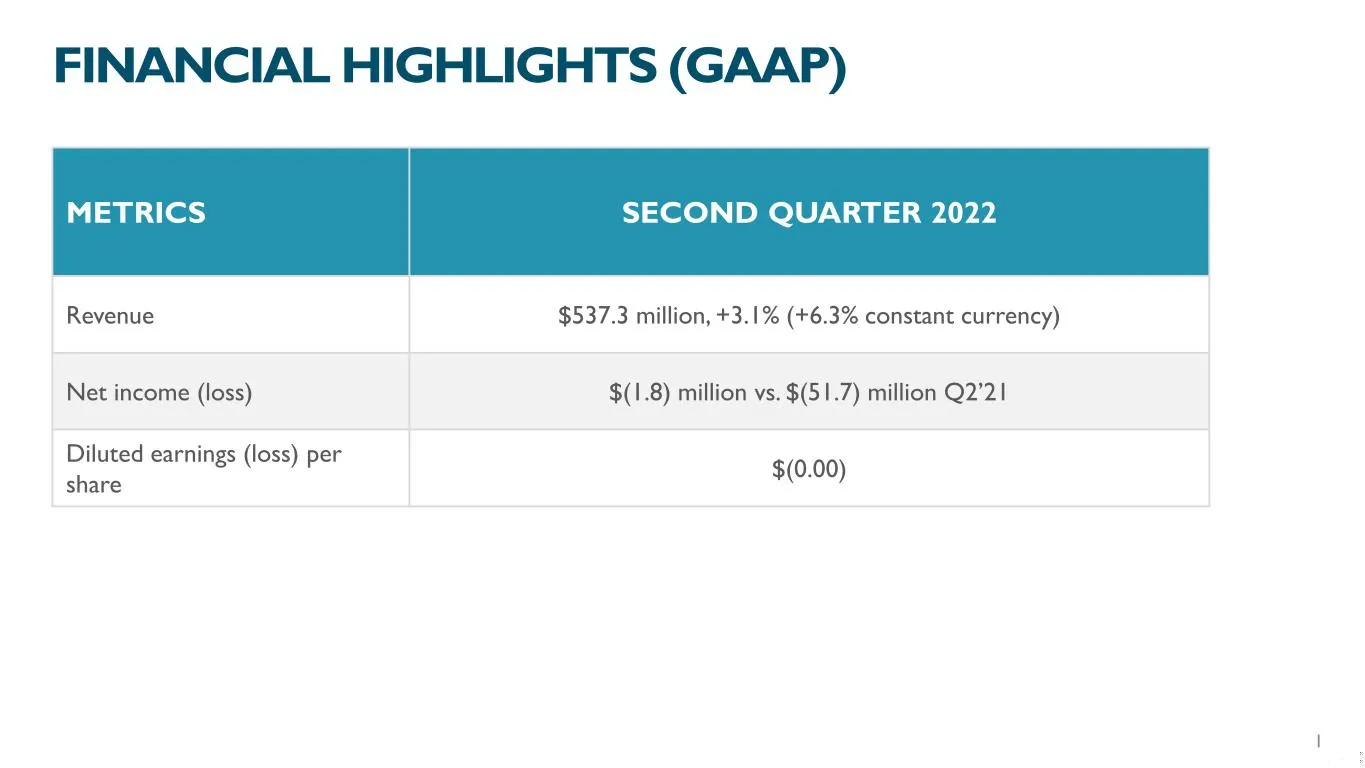
FINANCIAL HIGHLIGHTS (GAAP) METRICS SECOND QUARTER 2022 Revenue $537.3 million, +3.1% (+6.3% constant currency) Net income (loss) $(1.8) million vs. $(51.7) million Q2’21 Diluted earnings (loss) per share $(0.00) 1
Slide 4: Financial Highlights (Non-GAAP) Metrics Second Quarter 2022
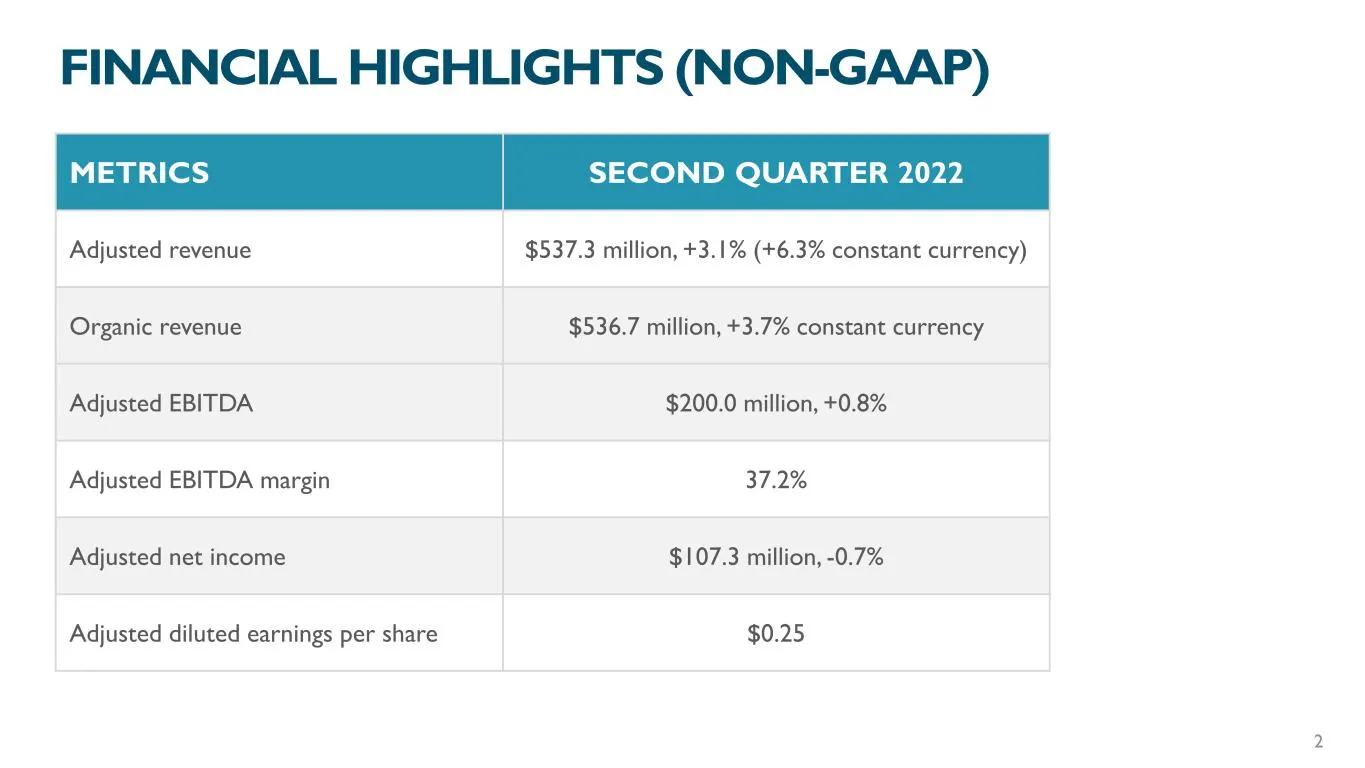
FINANCIAL HIGHLIGHTS (NON-GAAP) METRICS SECOND QUARTER 2022 Adjusted revenue $537.3 million, +3.1% (+6.3% constant currency) Organic revenue $536.7 million, +3.7% constant currency Adjusted EBITDA $200.0 million, +0.8% Adjusted EBITDA margin 37.2% Adjusted net income $107.3 million, -0.7% Adjusted d
Slide 5: Second Quarter Highlights: North America
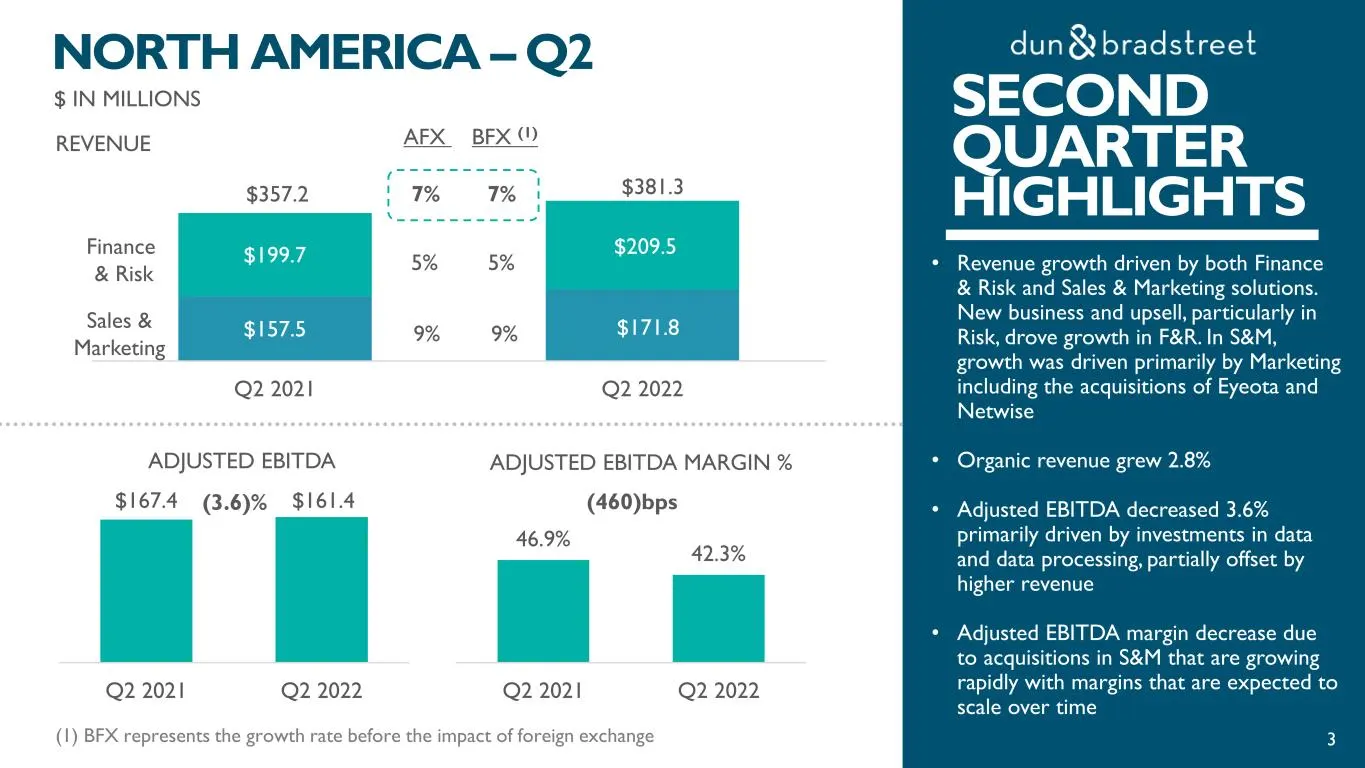
SECOND QUARTER HIGHLIGHTS • Revenue growth driven by both Finance & Risk and Sales & Marketing solutions. New business and upsell, particularly in Risk, drove growth in F&R. In S&M, growth was driven primarily by Marketing including the acquisitions of Eyeota and Netwise • Organic revenue grew 2.8%
Slide 6: Second Quarter Highlights: International
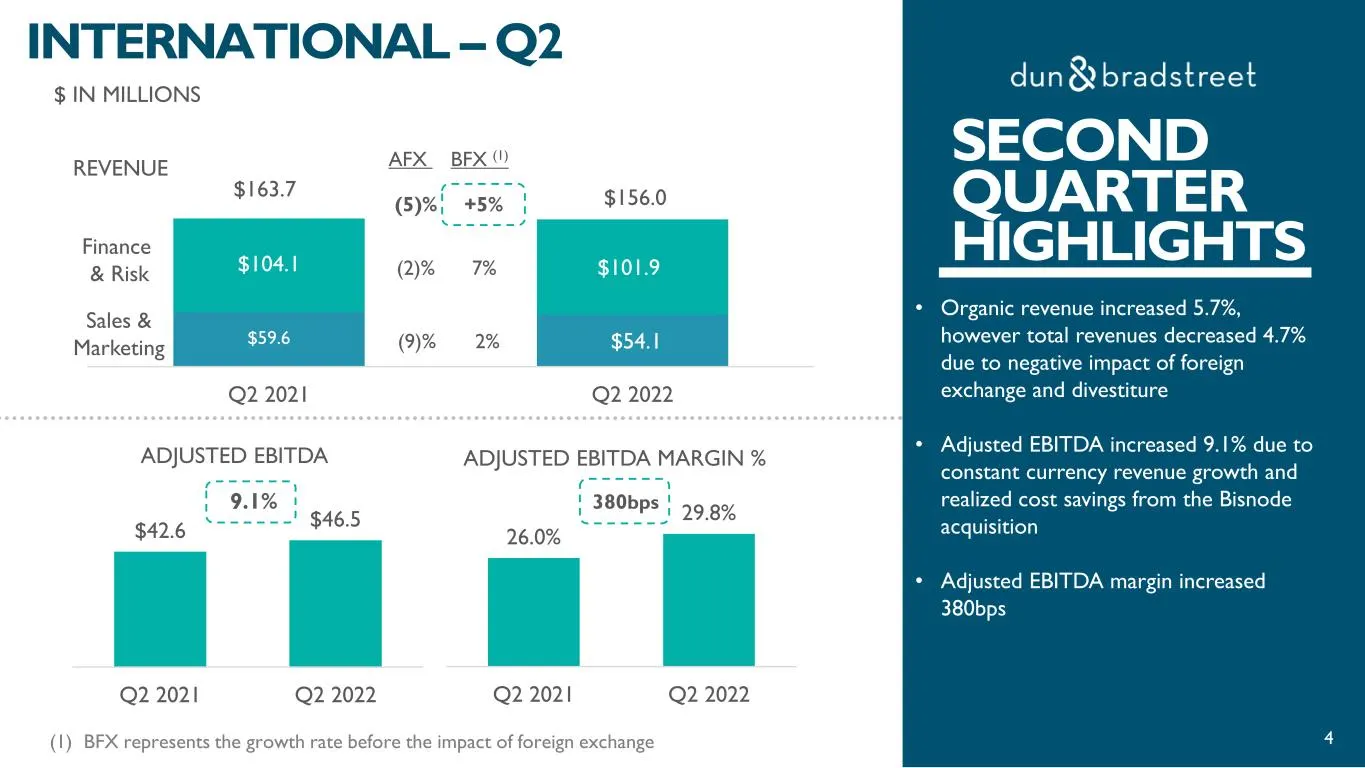
26.0% 29.8% Q2 2021 Q2 2022 FOURTH QUARTER HIGHLIGHTS • Organic revenue increased 5.7%, however total revenues decreased 4.7% due to negative impact of foreign exchange and divestiture • Adjusted EBITDA increased 9.1% due to constant currency revenue growth and realized cost savings from the Bisnode
Slide 7: Debt Summary
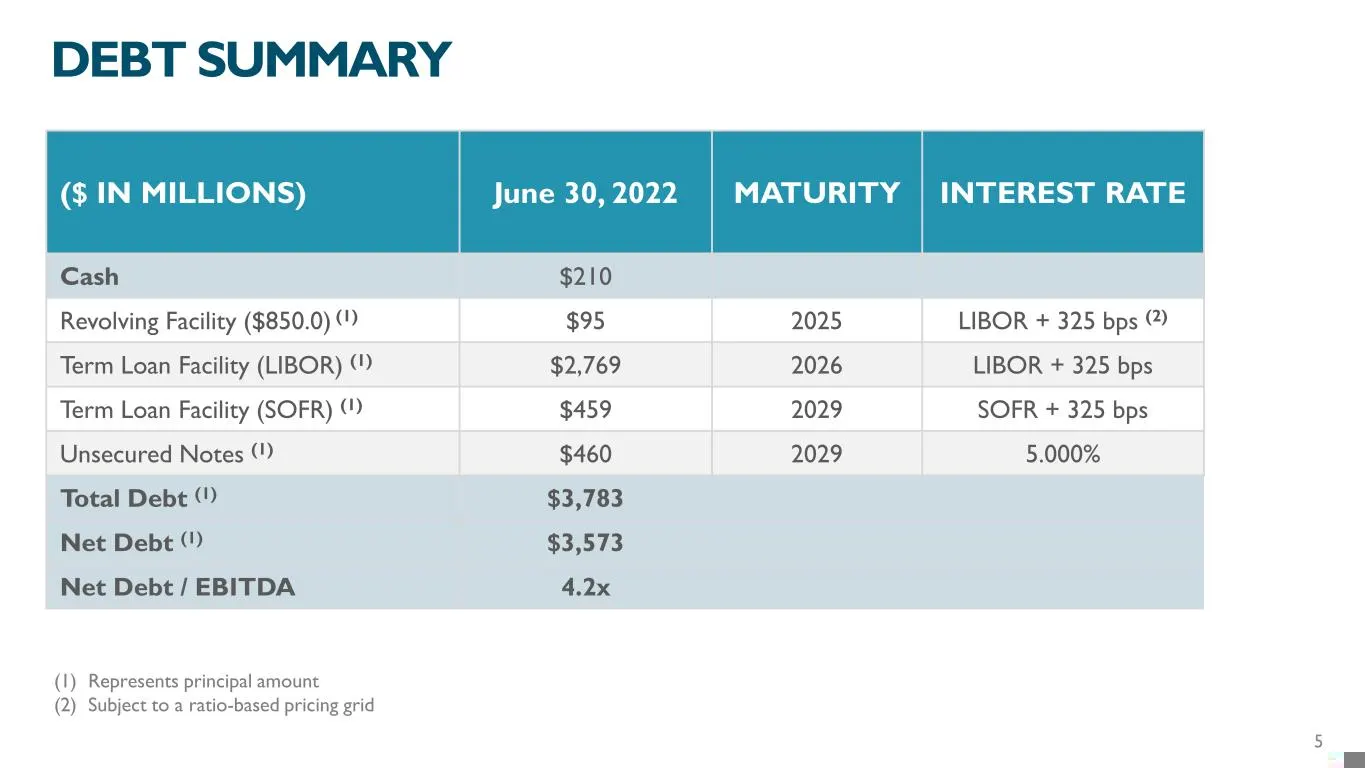
($ IN MILLIONS) June 30, 2022 MATURITY INTEREST RATE Cash $210 Revolving Facility ($850.0) (1) $95 2025 LIBOR + 325 bps (2) Term Loan Facility (LIBOR) (1) $2,769 2026 LIBOR + 325 bps Term Loan Facility (SOFR) (1) $459 2029 SOFR + 325 bps Unsecured Notes (1) $460 2029 5.000% Total Debt (1) $3,783 Net
Slide 8: Full Year 2022 Financial Guidance
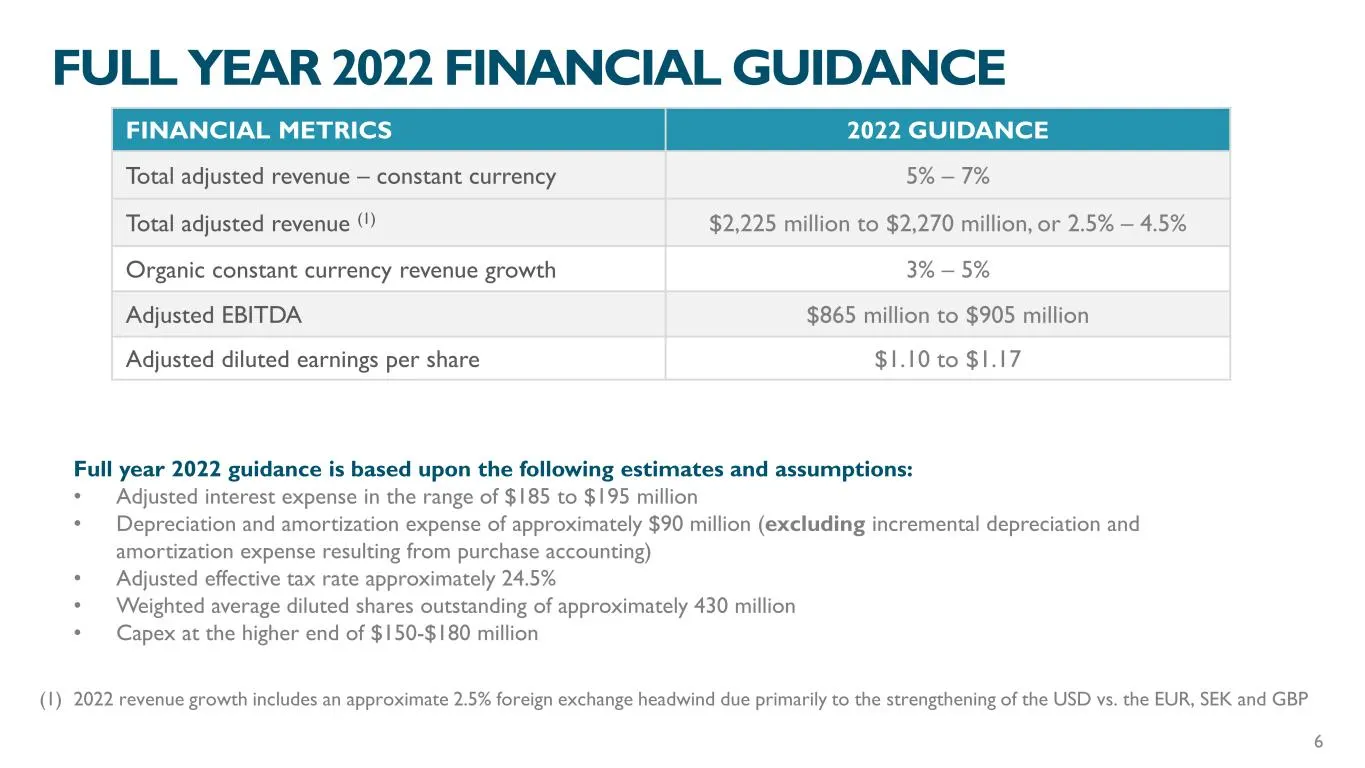
FINANCIAL METRICS 2022 GUIDANCE Total adjusted revenue – constant currency 5% – 7% Total adjusted revenue (1) $2,225 million to $2,270 million, or 2.5% – 4.5% Organic constant currency revenue growth 3% – 5% Adjusted EBITDA $865 million to $905 million Adjusted diluted earnings per share $1.10 to $1

Slide 9: Appendix
dun &bradstreet APPENDIX | |
Slide 10: Non-GAAP financial measures
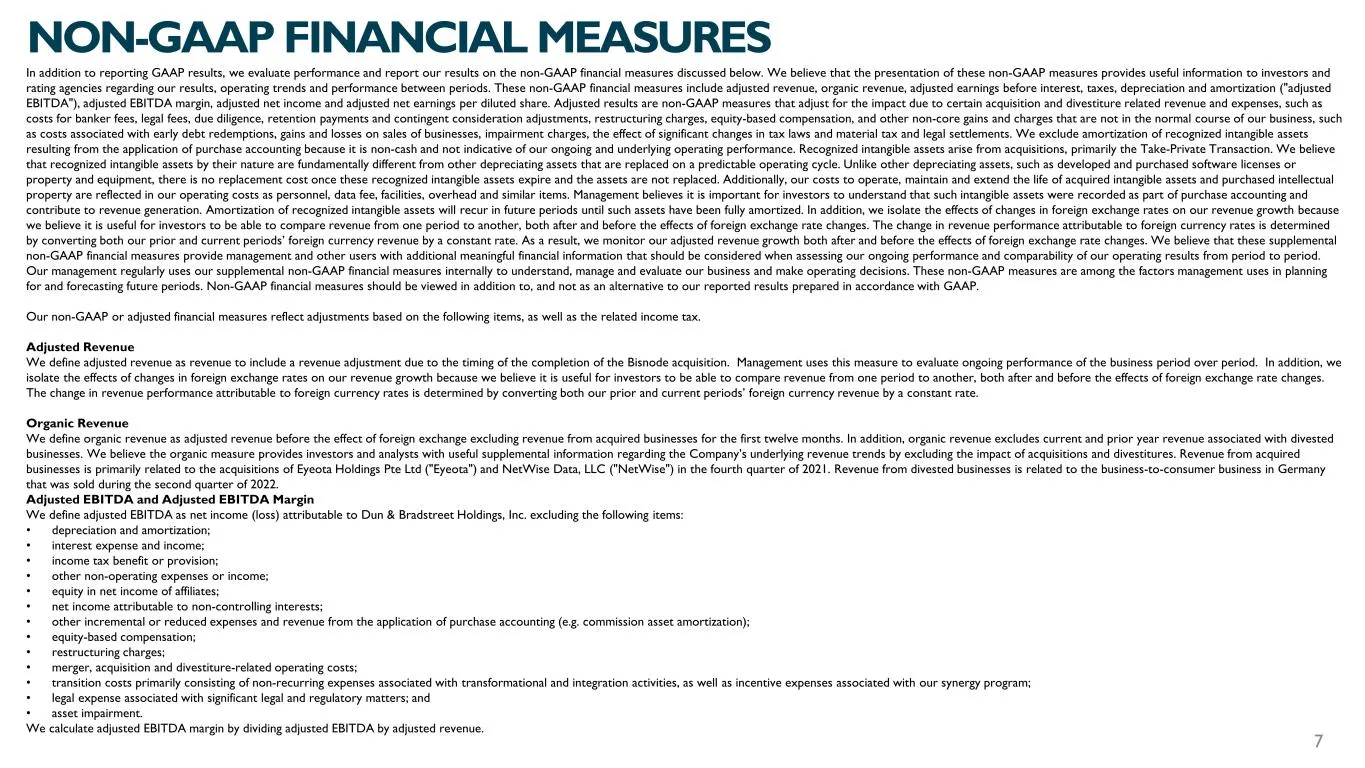
In addition to reporting GAAP results, we evaluate performance and report our results on the non-GAAP financial measures discussed below. We believe that the presentation of these non-GAAP measures provides useful information to investors and rating agencies regarding our results, operating trends a
Slide 11: Adjusted Net Income
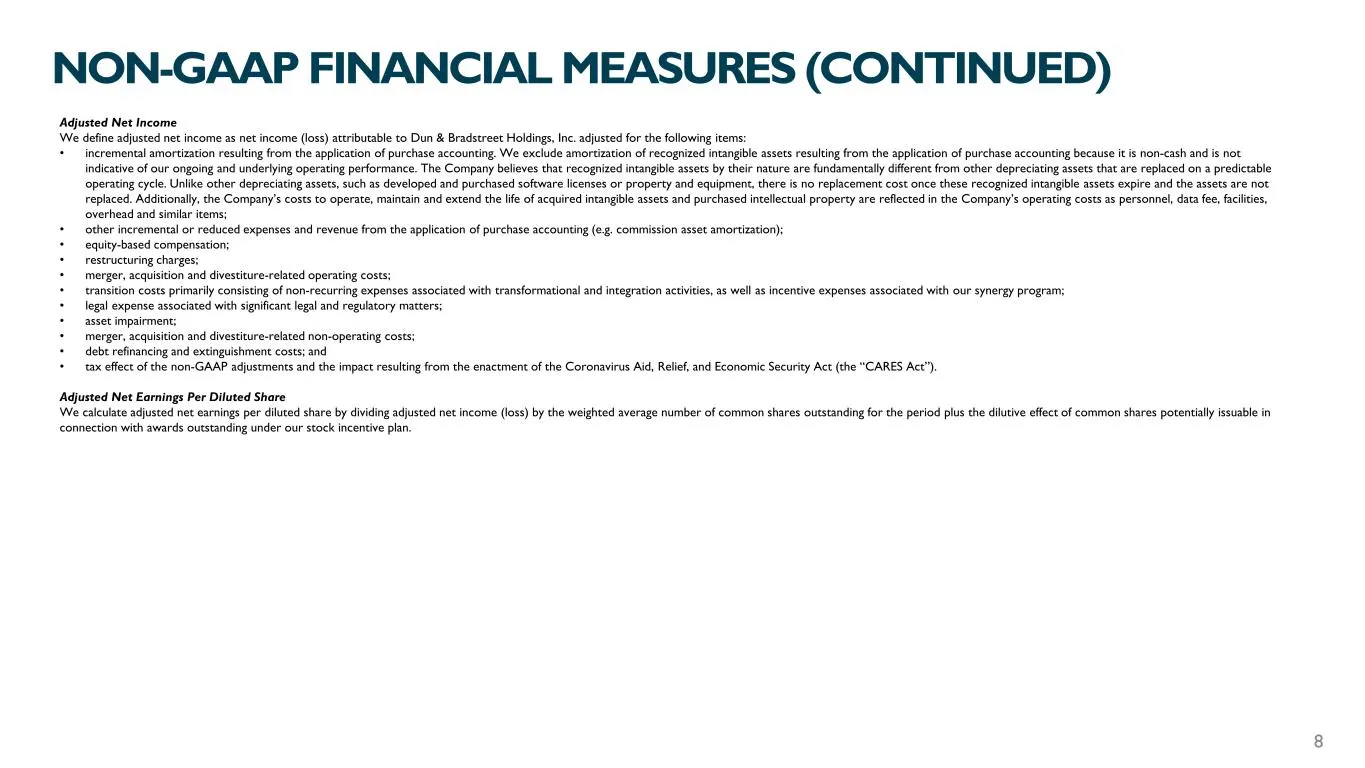
Adjusted Net Income We define adjusted net income as net income (loss) attributable to Dun & Bradstreet Holdings, Inc. adjusted for the following items: • incremental amortization resulting from the application of purchase accounting. We exclude amortization of recognized intangible assets resulting
Slide 12: Non-GAAP Reconciliation: Adjusted Revenue
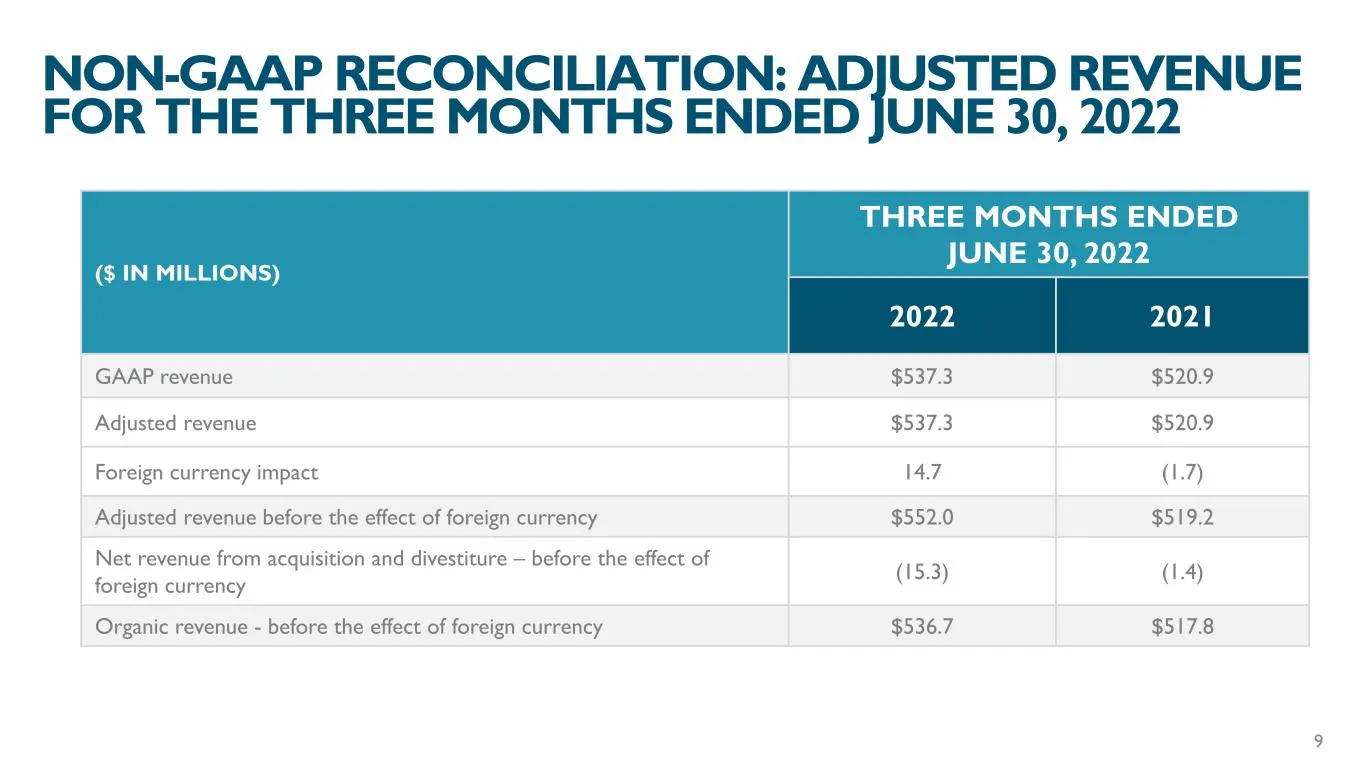
($ IN MILLIONS) THREE MONTHS ENDED JUNE 30, 2022 2022 2021 GAAP revenue $537.3 $520.9 Adjusted revenue $537.3 $520.9 Foreign currency impact 14.7 (1.7) Adjusted revenue before the effect of foreign currency $552.0 $519.2 Net revenue from acquisition and divestiture – before the effect of foreign cur
Slide 13: Non-GAAP Reconciliation: Adjusted EBITDA
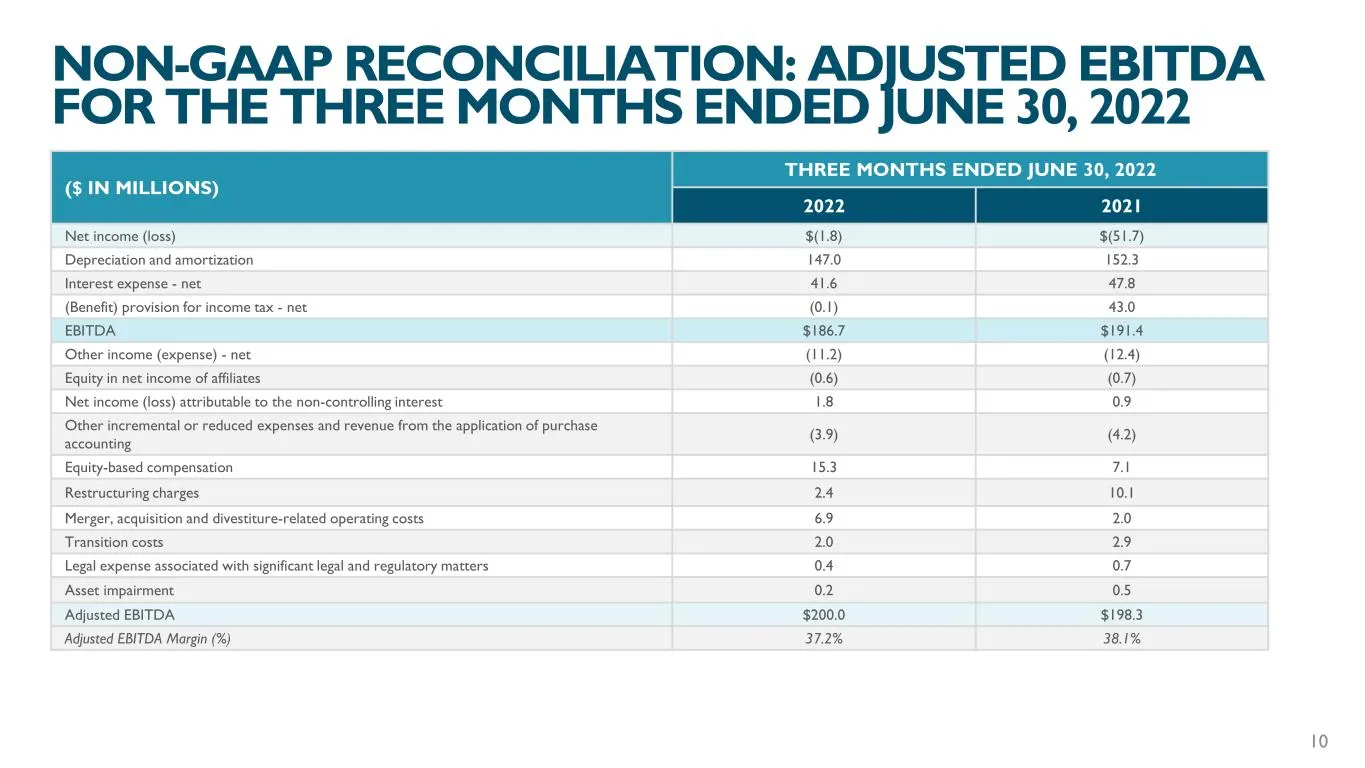
($ IN MILLIONS) THREE MONTHS ENDED JUNE 30, 2022 2022 2021 Net income (loss) $(1.8) $(51.7) Depreciation and amortization 147.0 152.3 Interest expense - net 41.6 47.8 (Benefit) provision for income tax - net (0.1) 43.0 EBITDA $186.7 $191.4 Other income (expense) - net (11.2) (12.4) Equity in net inc
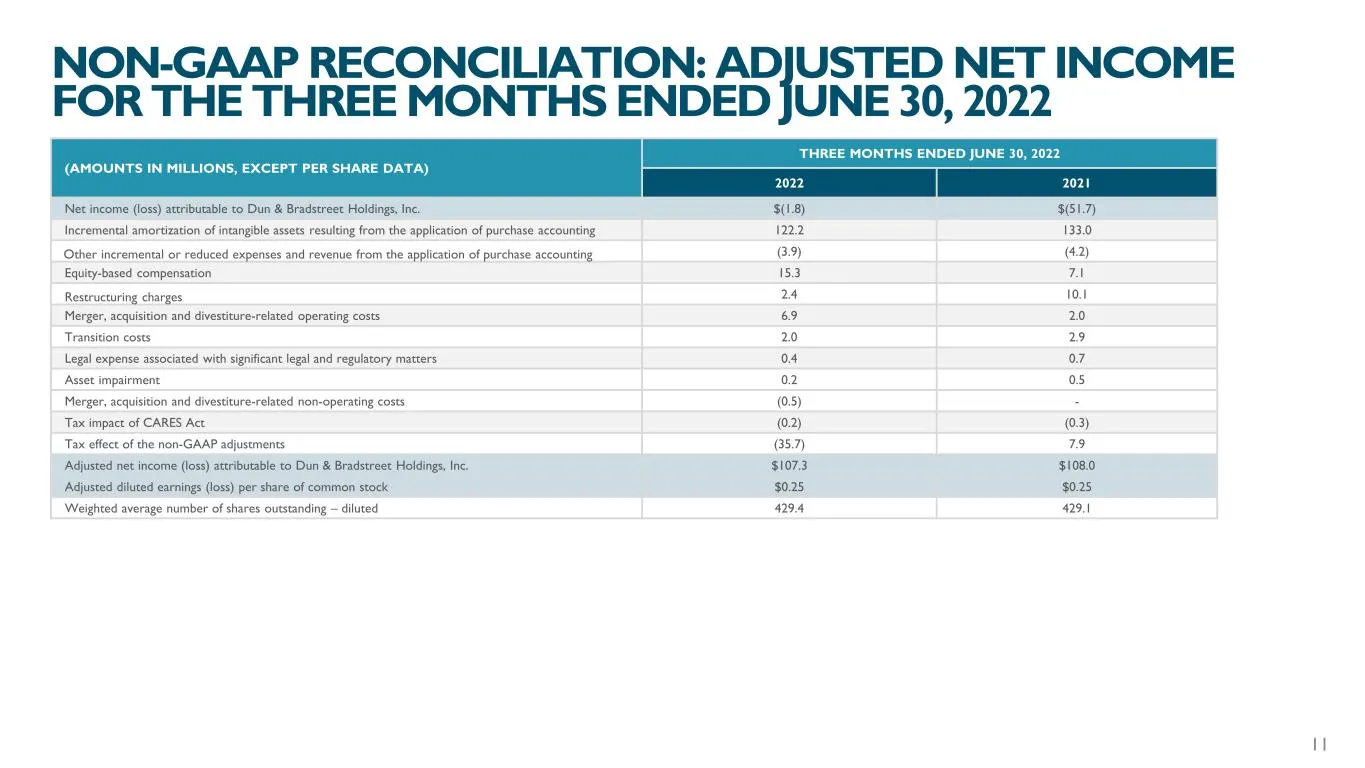
Slide 14: Non-GAAP Reconciliation: Adjusted Net Income
(AMOUNTS IN MILLIONS, EXCEPT PER SHARE DATA) THREE MONTHS ENDED JUNE 30, 2022 2022 2021 Net income (loss) attributable to Dun & Bradstreet Holdings, Inc. $(1.8) $(51.7) Incremental amortization of intangible assets resulting from the application of purchase accounting 122.2 133.0 Other incremental o
Source: SEC EDGAR · 8-K filed Aug 4, 2022
More decks from Dun & Bradstreet Holdings Inc.
 Q1 2025 Earnings Presentation12 slides · May 1, 2025
 Q4 2024 Earnings Presentation15 slides · Feb 20, 2025
 Q3 2024 Earnings Presentation13 slides · Oct 31, 2024
 Q2 2024 Earnings Presentation13 slides · Aug 1, 2024
 Q1 2024 Earnings Presentation13 slides · May 2, 2024
 FY2023 Earnings Presentation16 slides · Feb 15, 2024