Monolithic Power Systems, Inc. · NASDAQ:MPWR
Monolithic Power Systems — Investor Presentation (2026)
39 slides from Monolithic Power Systems's investor presentation, 2026

Slide 1: Investor Overview Q3 2026
Investor Overview Q3 2026
Slide 2: Safe Harbor Statement
Safe Harbor Statement Statements made in this presentation contain forward-looking statements, as that term is defined in the Private Securities Litigation Reform Act of 1995. These forward-looking statements are not historical facts or guarantees of future performance or events, are based on curren
Slide 3: Creating What's Next – Together
Creating What’s Next – Together We are a global leader in powering the most important technological innovations of our lives – working with our customers to create what’s next.
Slide 4: Outstanding Organic Revenue & Operational Growth
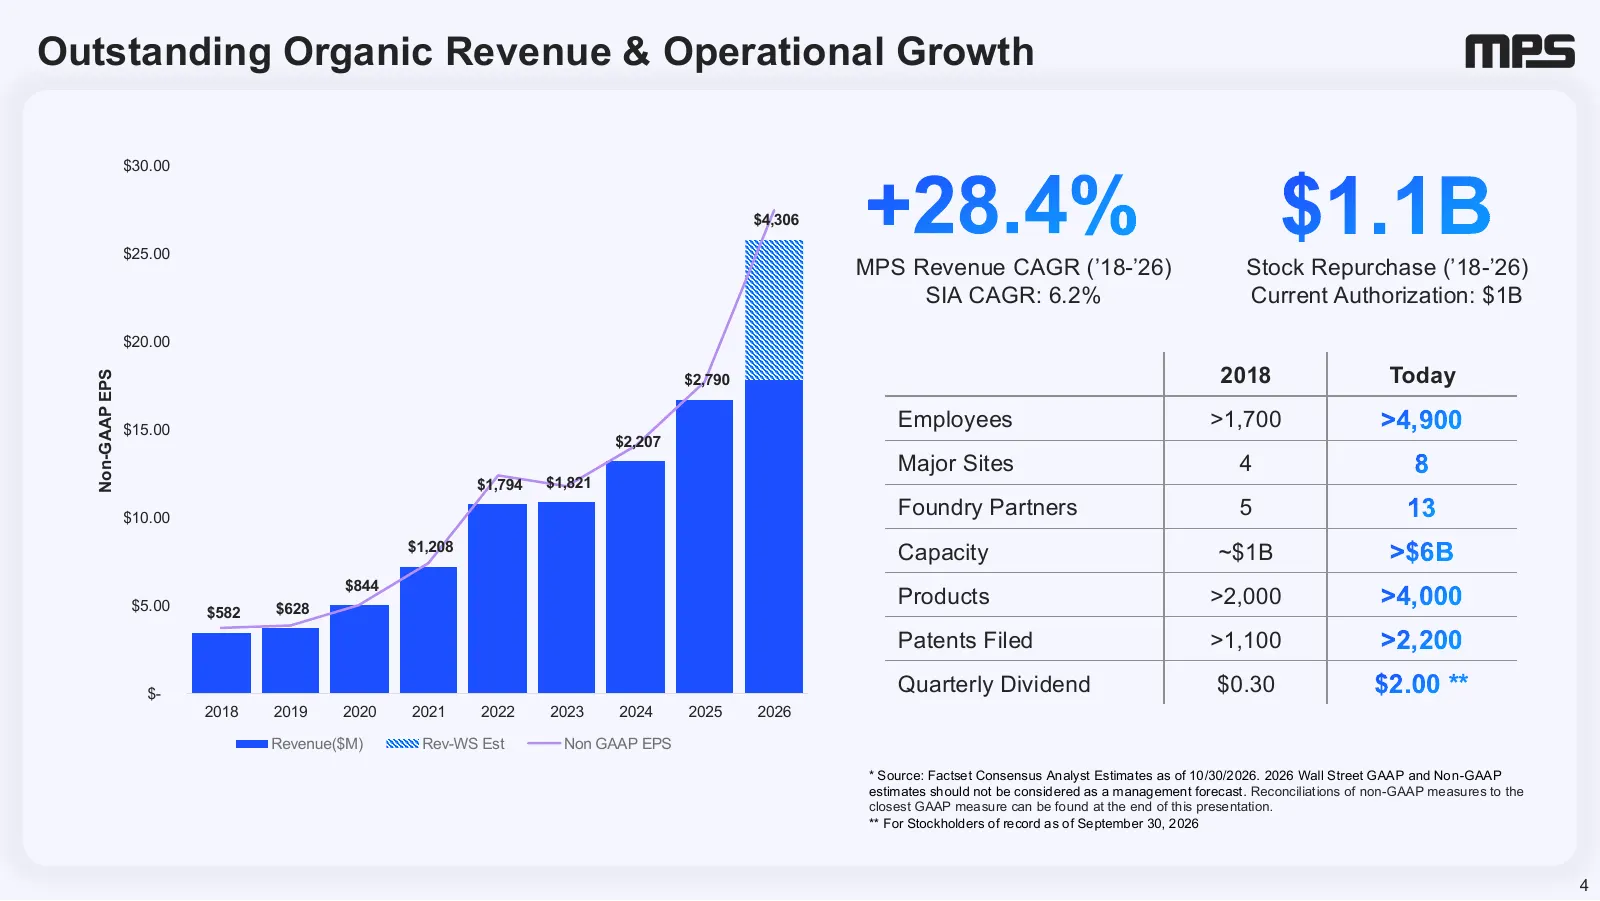
Outstanding Organic Revenue & Operational Growth $30.00 $25.00 $4,306 +28.4% $1.1B MPS Revenue CAGR (’18-’26) Stock Repurchase (’18-’26) SIA CAGR: 6.2% Current Authorization: $1B $20.00 2018 Today Non-GAAP EPS $2,790 $15.00 Employees >1,700 >4,900 $2,207 Major Sites 4 8 $1,794 $1,821 $10.00 Foundry
Slide 5: Our Global Presence
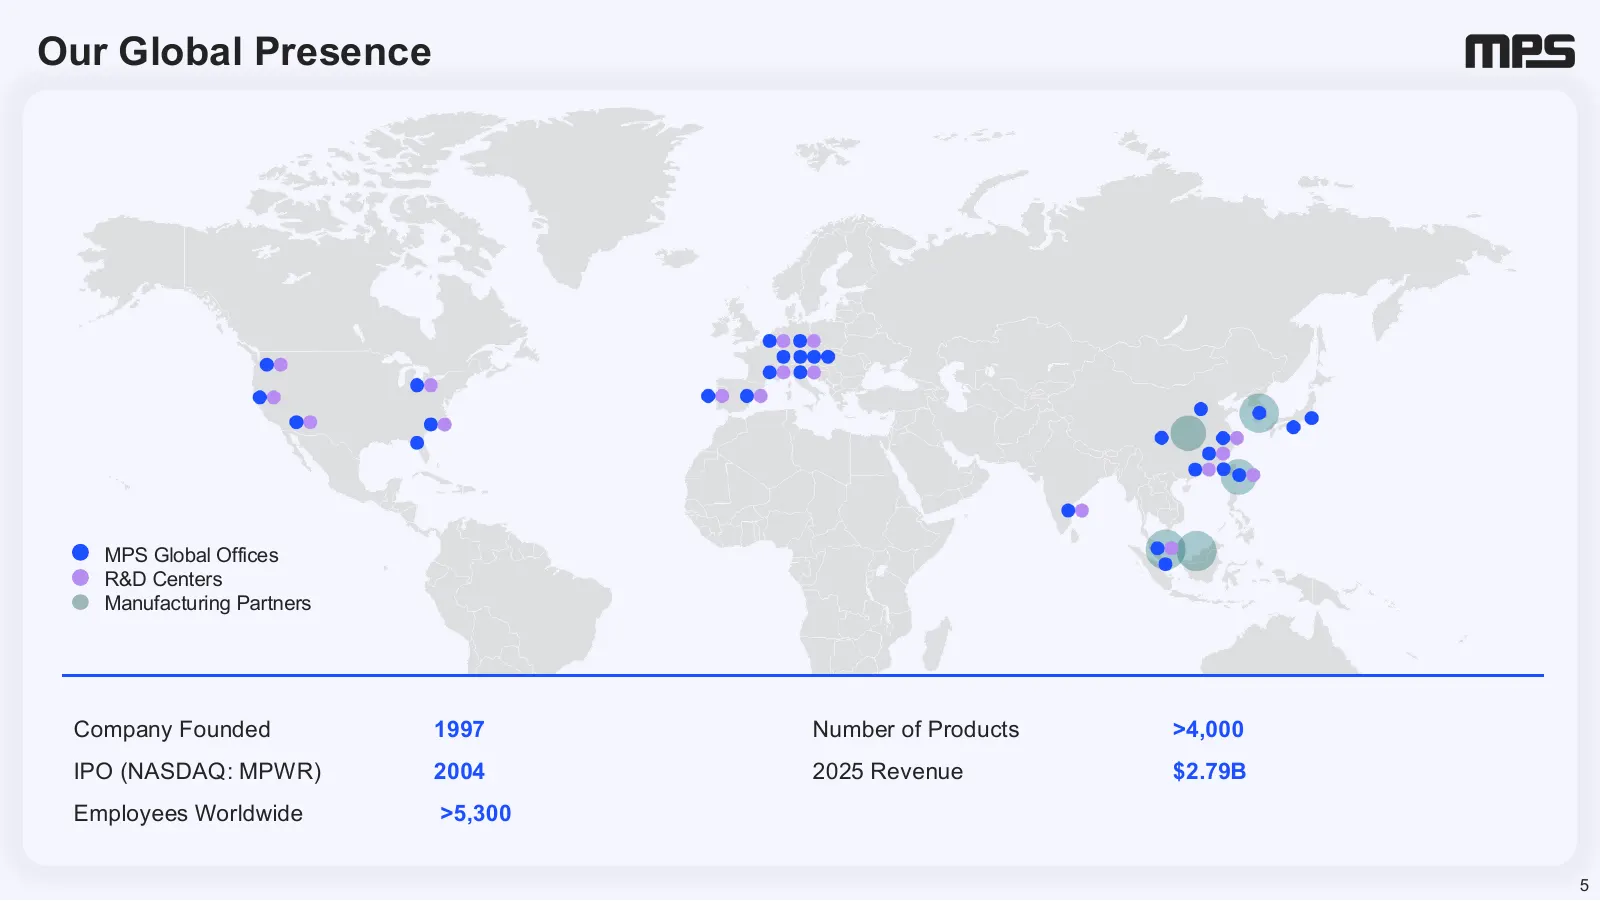
Our Global Presence MPS Global Offices R&D Centers Manufacturing Partners Company Founded 1997 Number of Products >4,000 IPO (NASDAQ: MPWR) 2004 2025 Revenue $2.79B Employees Worldwide >5,300 5
Slide 6: Corporate Profile
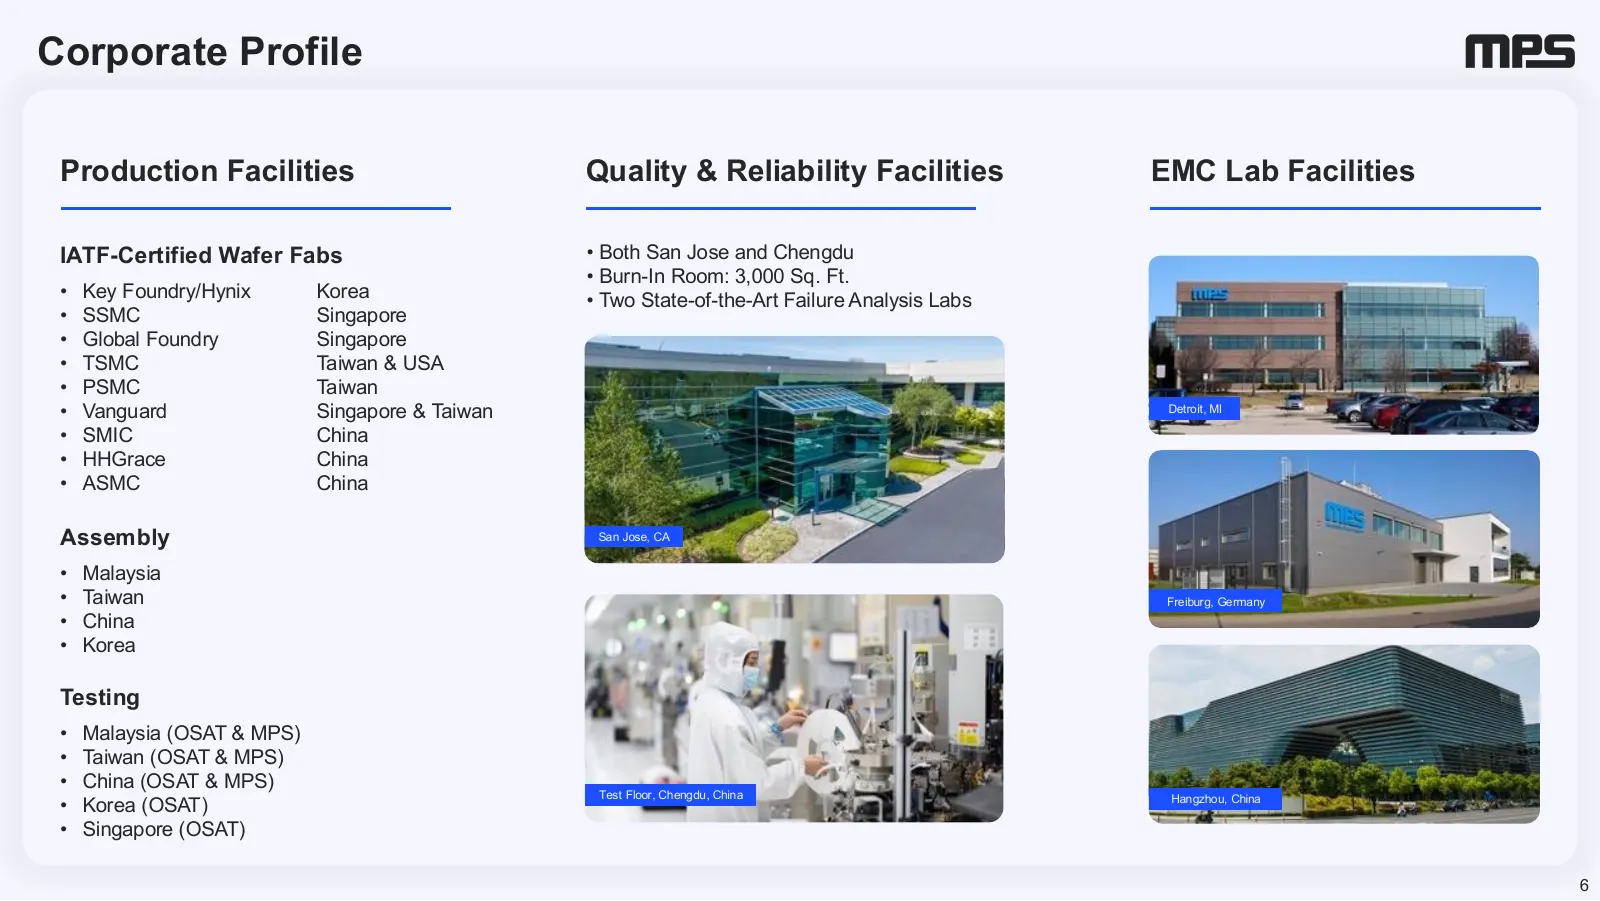
Corporate Profile Production Facilities Quality & Reliability Facilities EMC Lab Facilities IATF-Certified Wafer Fabs • Both San Jose and Chengdu • Burn-In Room: 3,000 Sq. Ft. • Key Foundry/Hynix Korea • Two State-of-the-Art Failure Analysis Labs • SSMC Singapore • Global Foundry Singapore • TSMC Ta
Slide 7: Why Customers Choose MPS
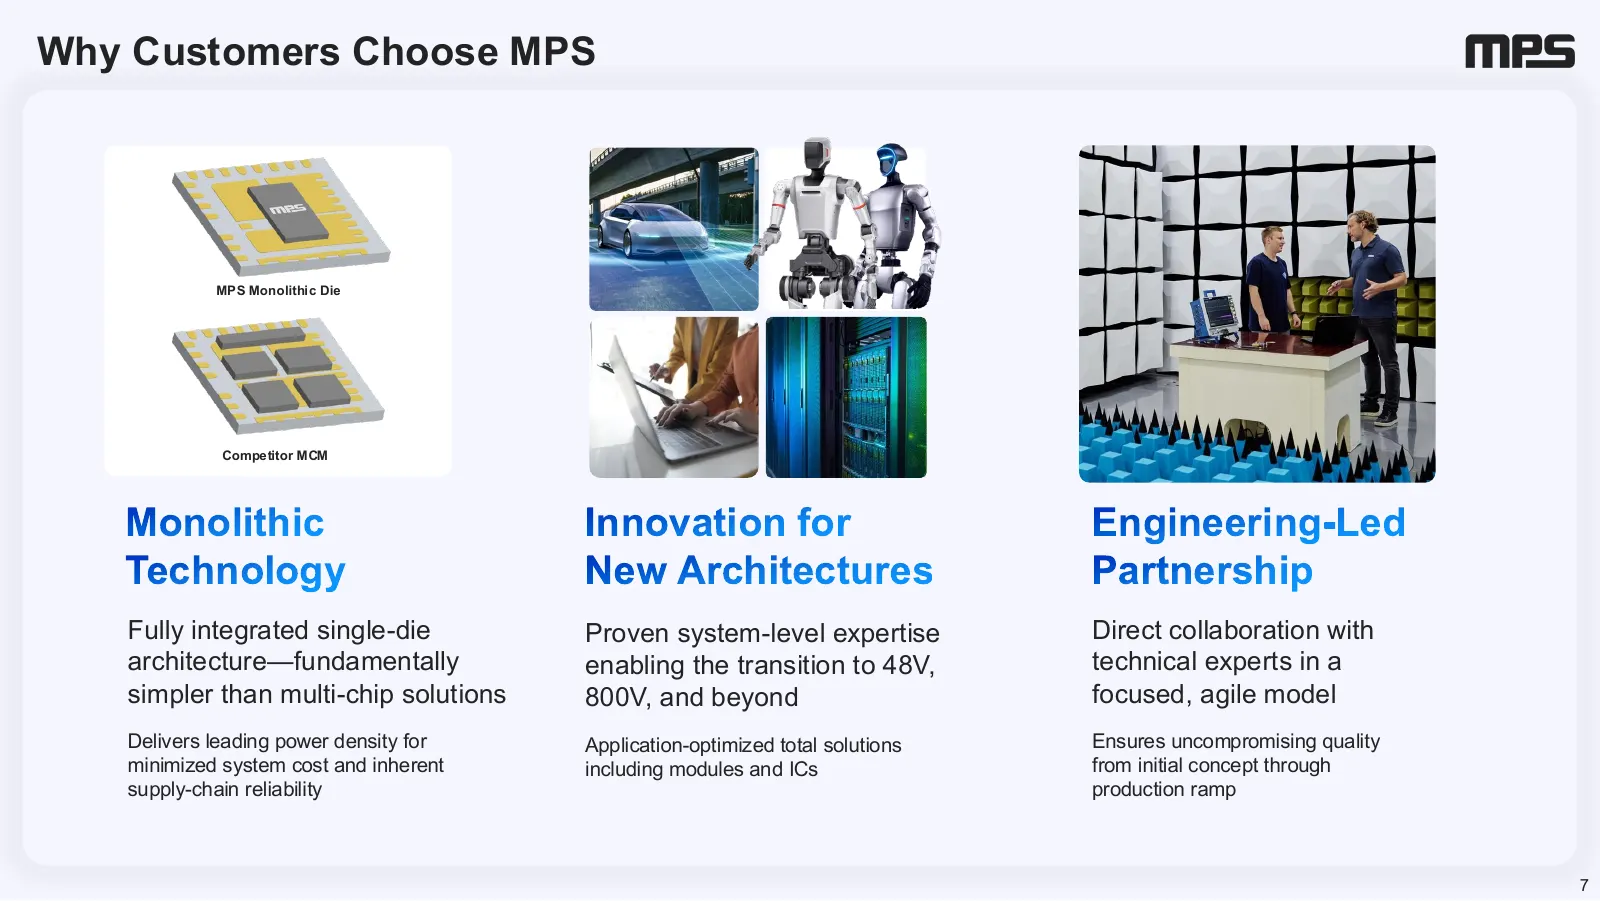
Why Customers Choose MPS MPS Monolithic Die Competitor MCM Monolithic Innovation for Engineering-Led Technology New Architectures Partnership Fully integrated single-die Proven system-level expertise Direct collaboration with architecture—fundamentally enabling the transition to 48V, technical exper
Slide 8: End Customer Diversity
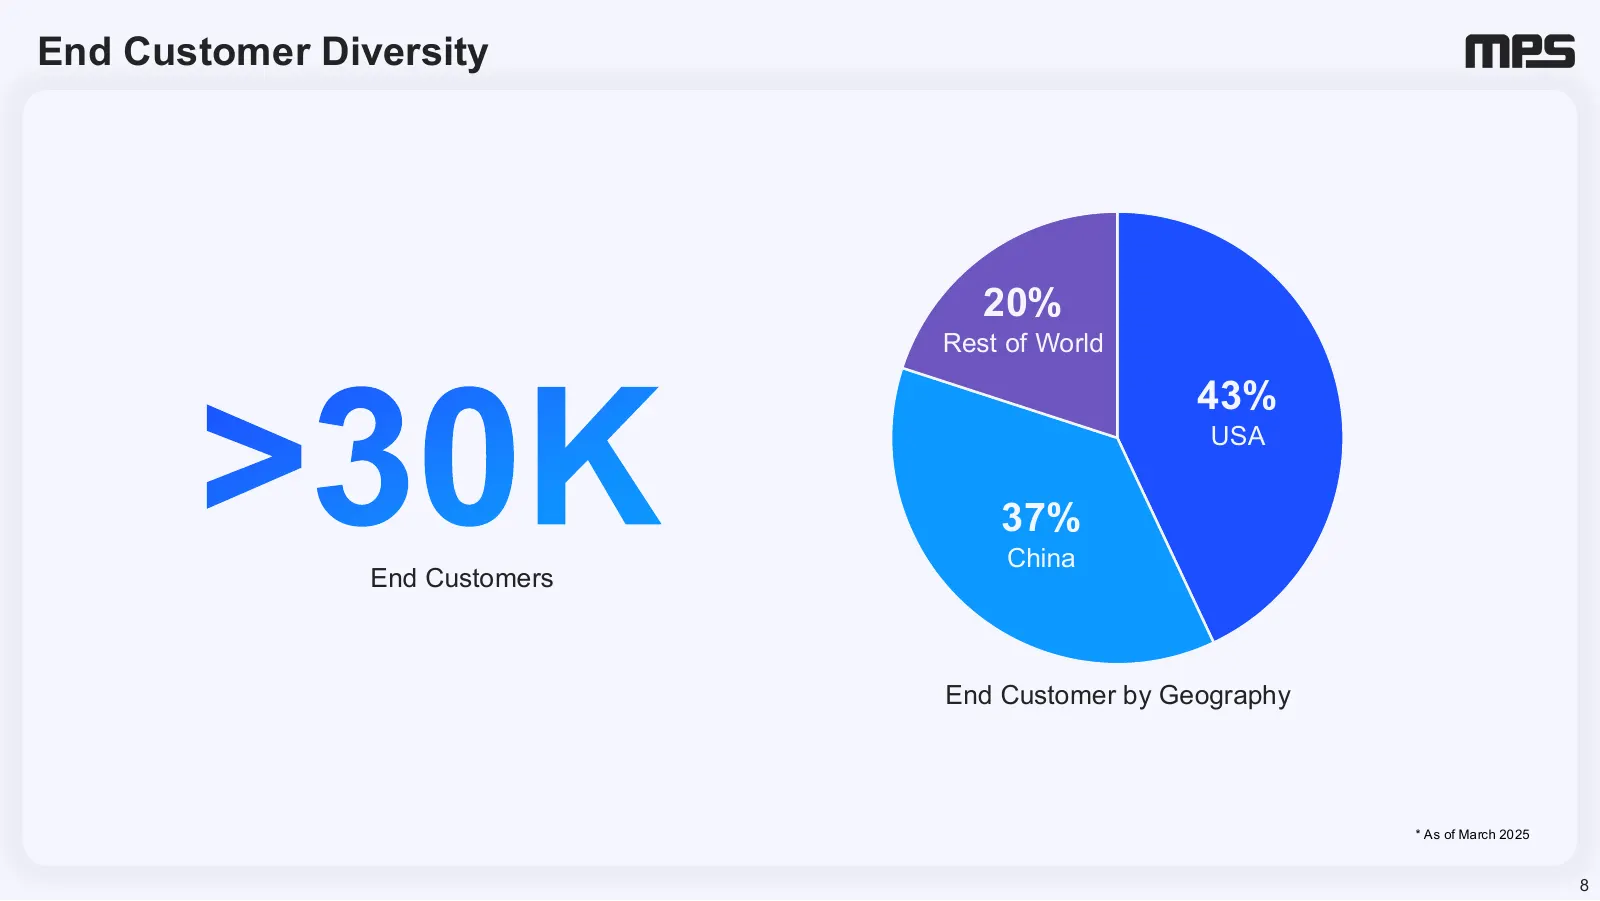
End Customer Diversity 20% Rest of World >30K 43% USA 37% China End Customers End Customer by Geography * As of March 2025 8
Slide 9: Diversity of End Markets
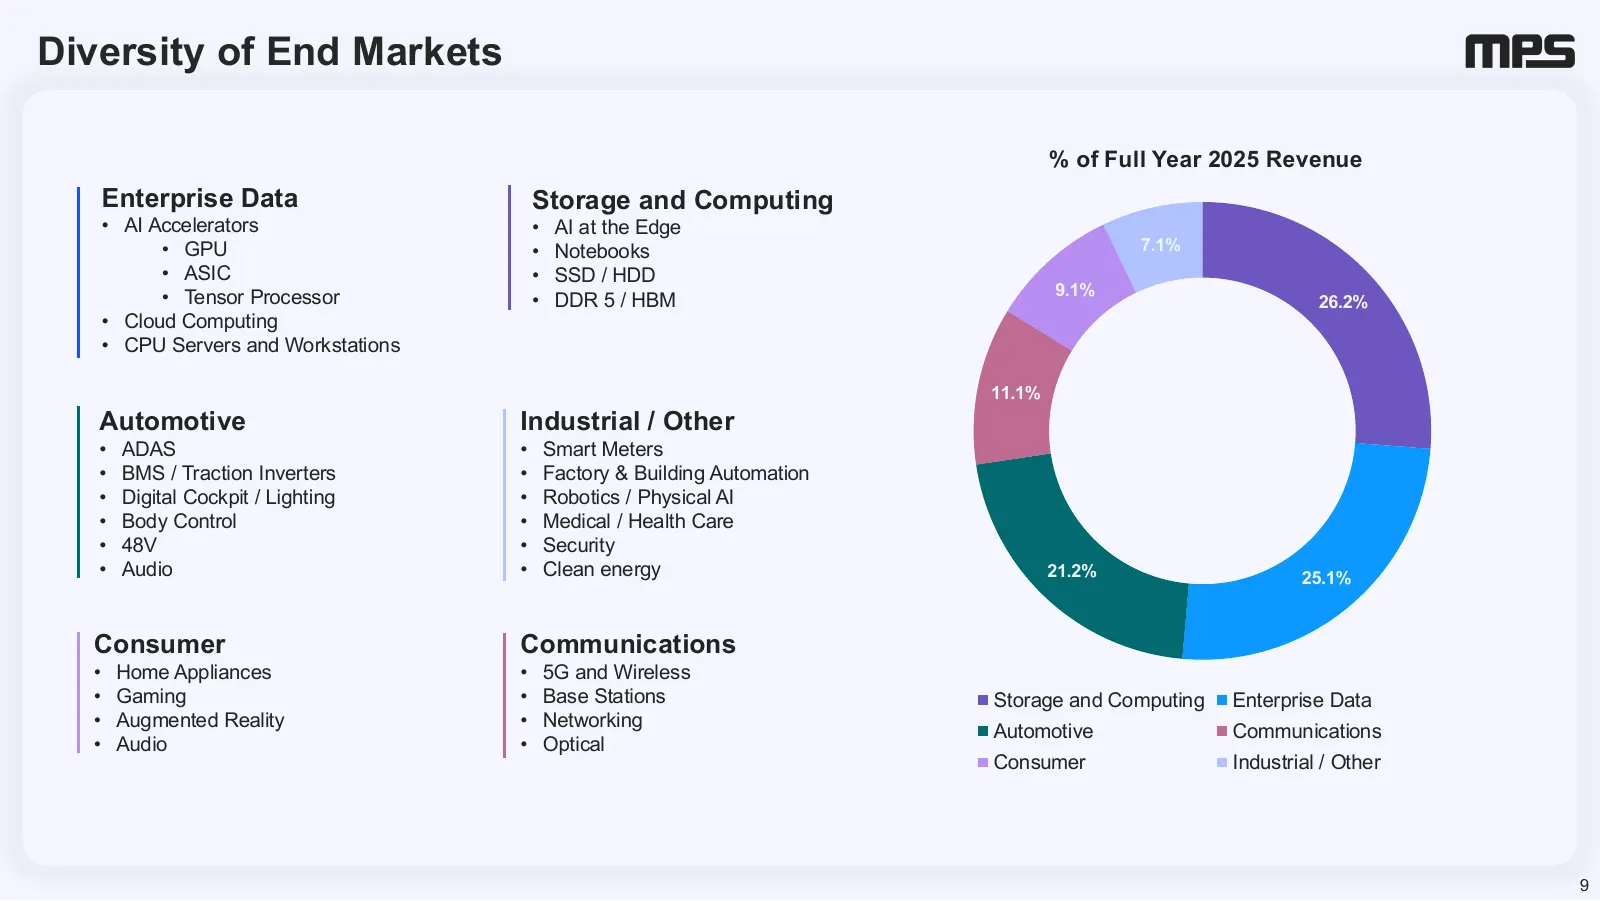
Diversity of End Markets % of Full Year 2025 Revenue Enterprise Data Storage and Computing • AI Accelerators • AI at the Edge • GPU • Notebooks 7.1% • ASIC • SSD / HDD • Tensor Processor 9.1% • DDR 5 / HBM 26.2% • Cloud Computing • CPU Servers and Workstations 11.1% Automotive Industrial / Other • A
Slide 10: Product Families
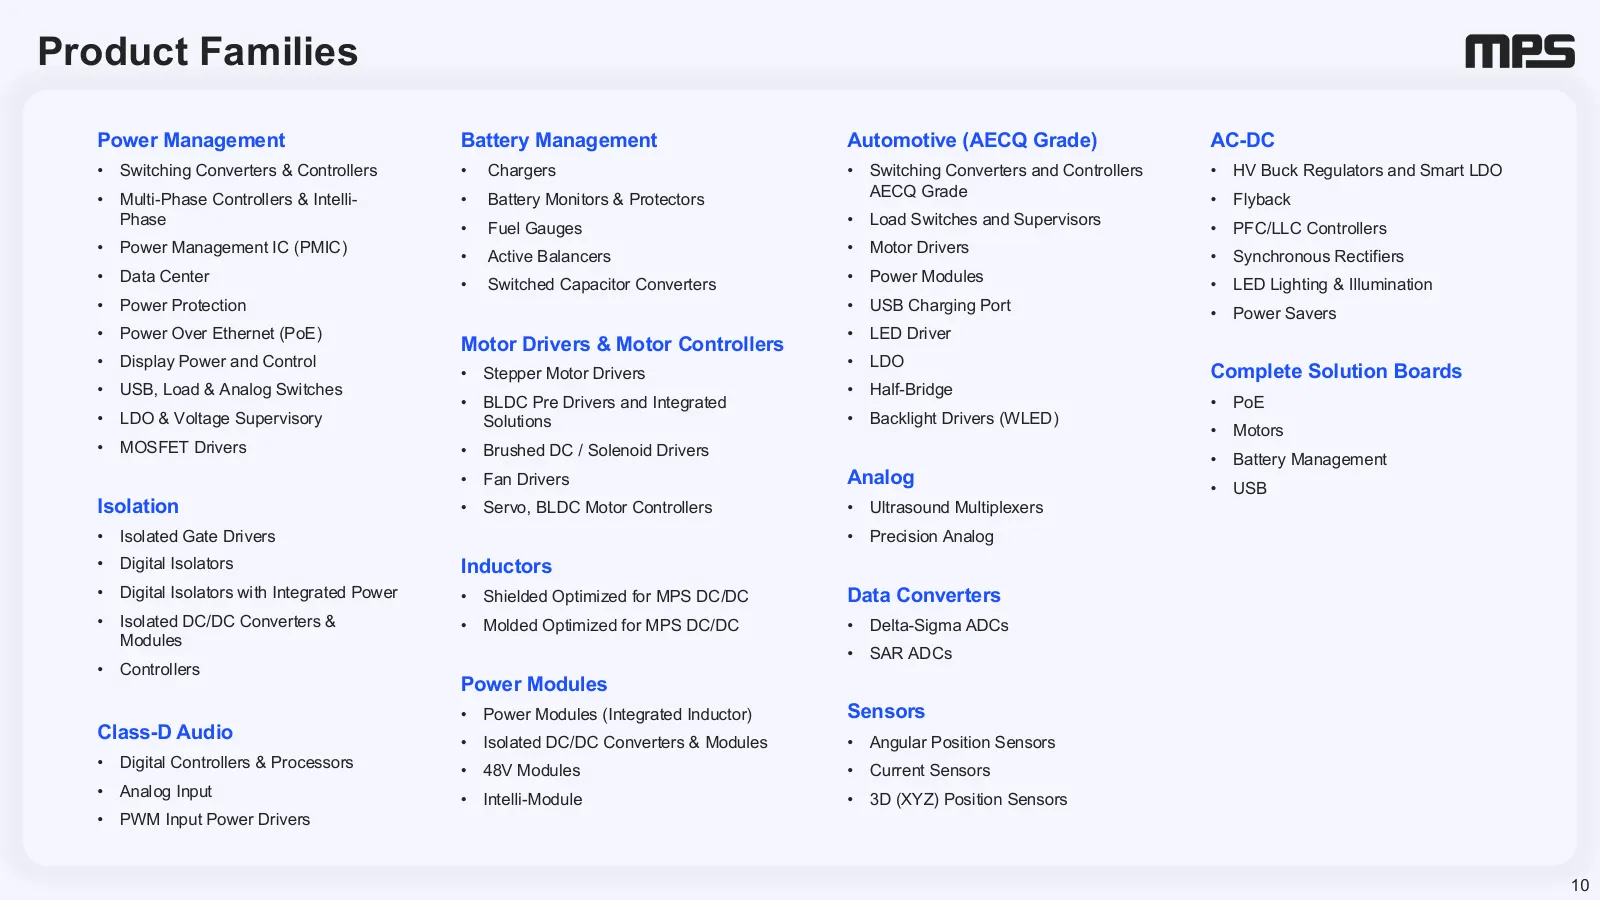
Product Families Power Management Battery Management Automotive (AECQ Grade) AC-DC • Switching Converters & Controllers • Chargers • Switching Converters and Controllers • HV Buck Regulators and Smart LDO • Multi-Phase Controllers & Intelli- • Battery Monitors & Protectors AECQ Grade • Flyback Phase
Slide 11: Technology Drives SAM Expansion
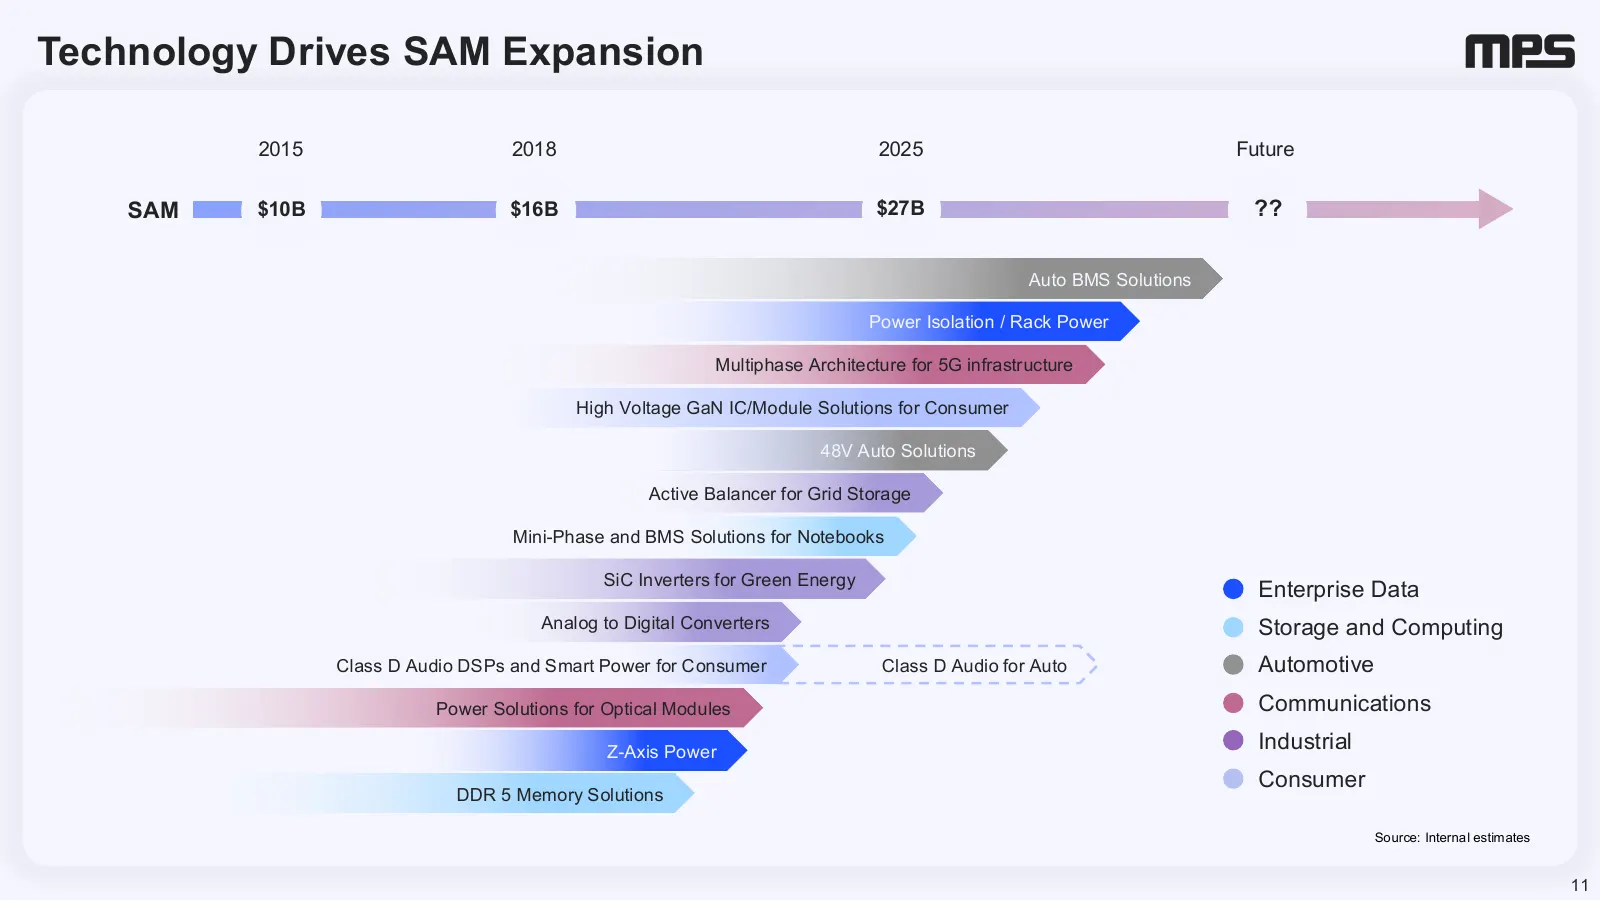
Technology Drives SAM Expansion 2015 2018 2025 Future SAM $10B $16B $27B ?? Auto BMS Solutions Power Isolation / Rack Power Multiphase Architecture for 5G infrastructure High Voltage GaN IC/Module Solutions for Consumer 48V Auto Solutions Active Balancer for Grid Storage Mini-Phase and BMS Solutions
Slide 12: Above-Market Growth and Attractive Margin Profile
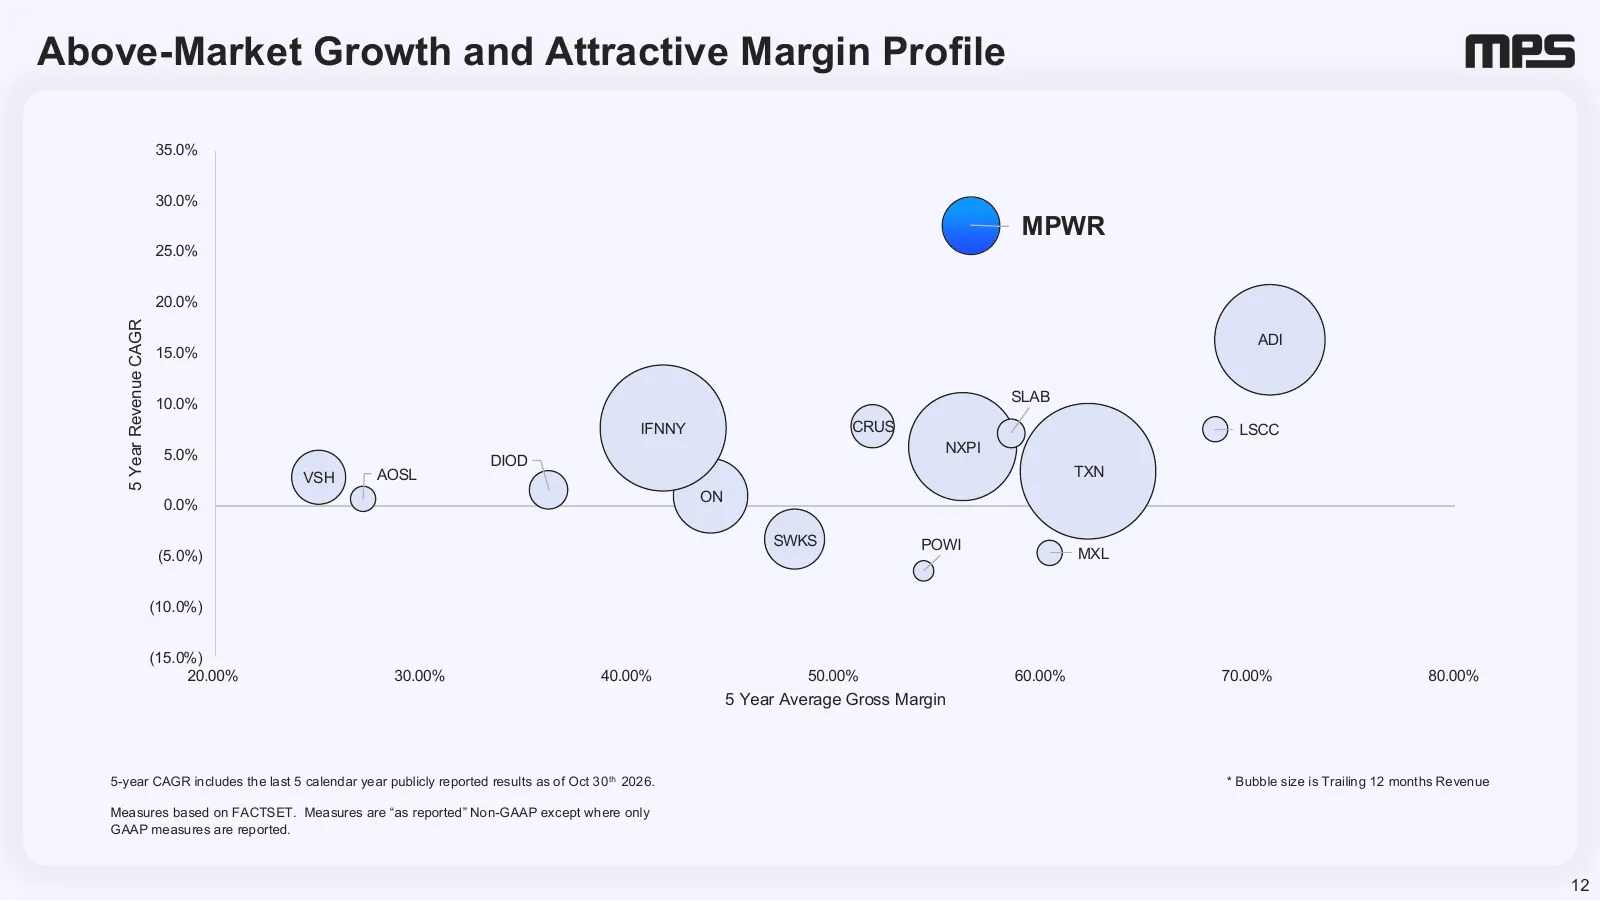
Above-Market Growth and Attractive Margin Profile 35.0% 30.0% MPWR 25.0% 20.0% 5 Year Revenue CAGR ADI 15.0% 10.0% SLAB IFNNY CRUS LSCC 5.0% NXPI DIOD VSH AOSL TXN ON 0.0% SWKS POWI (5.0%) MXL (10.0%) (15.0%) 20.00% 30.00% 40.00% 50.00% 60.00% 70.00% 80.00% 5 Year Average Gross Margin 5-year CAGR in
Slide 13: Powering Progress Through Innovation
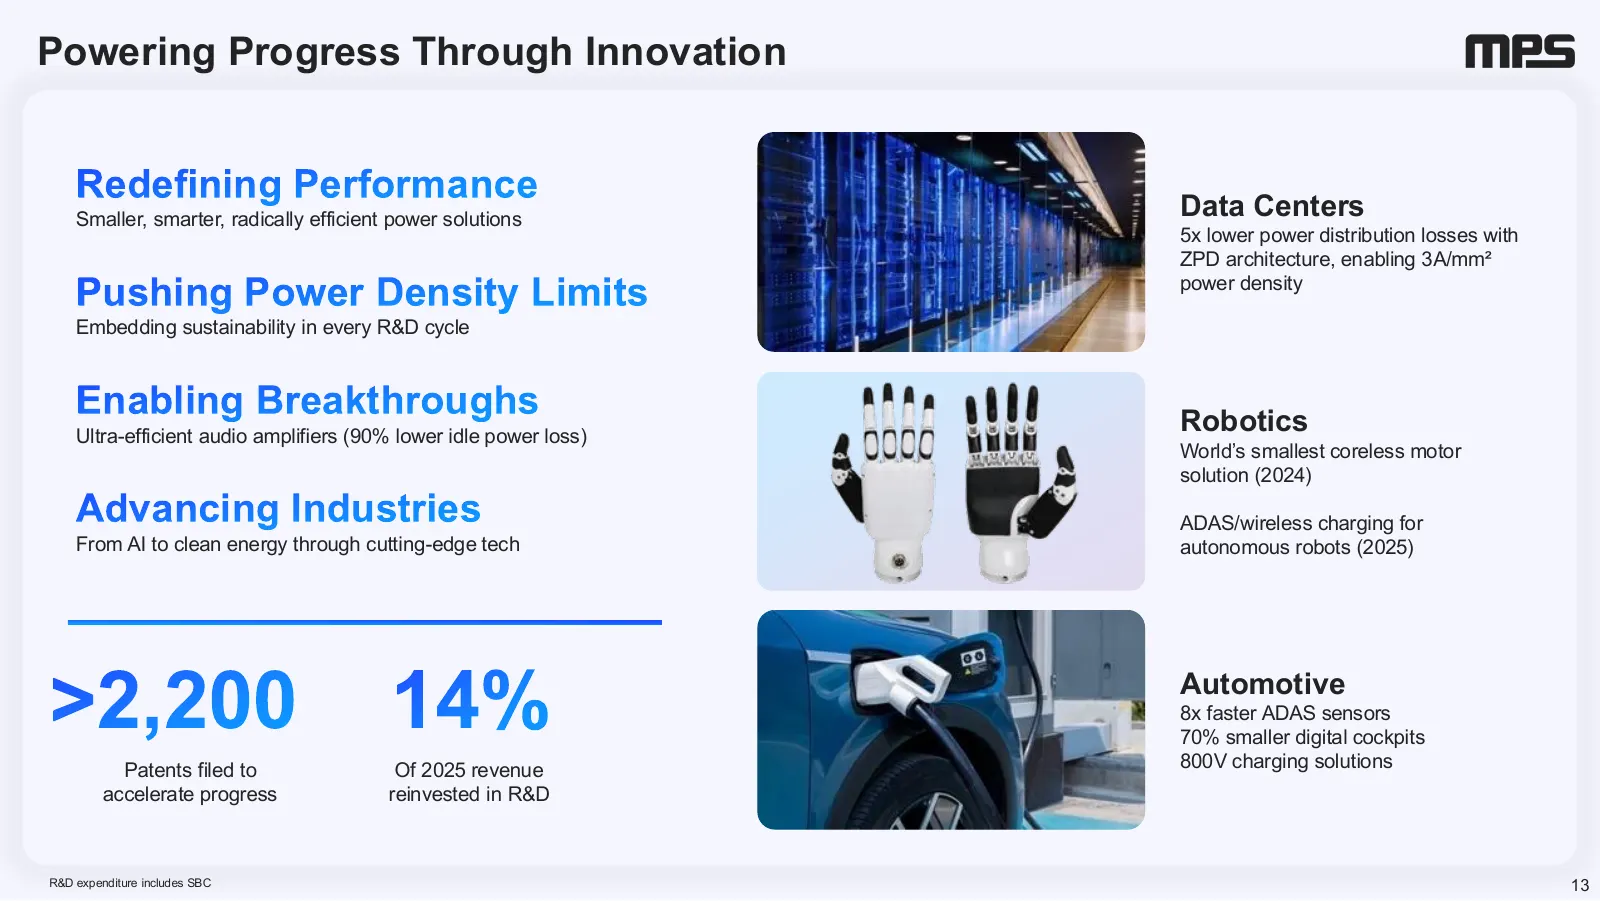
Powering Progress Through Innovation Redefining Performance Data Centers Smaller, smarter, radically efficient power solutions IMAGE 5x lower power distribution losses with ZPD architecture, enabling 3A/mm² Pushing Power Density Limits power density Embedding sustainability in every R&D cycle Enabli

Slide 14: Computing Power Evolution
Computing Power Evolution
Slide 15: Leading the Next Wave of Computing Power
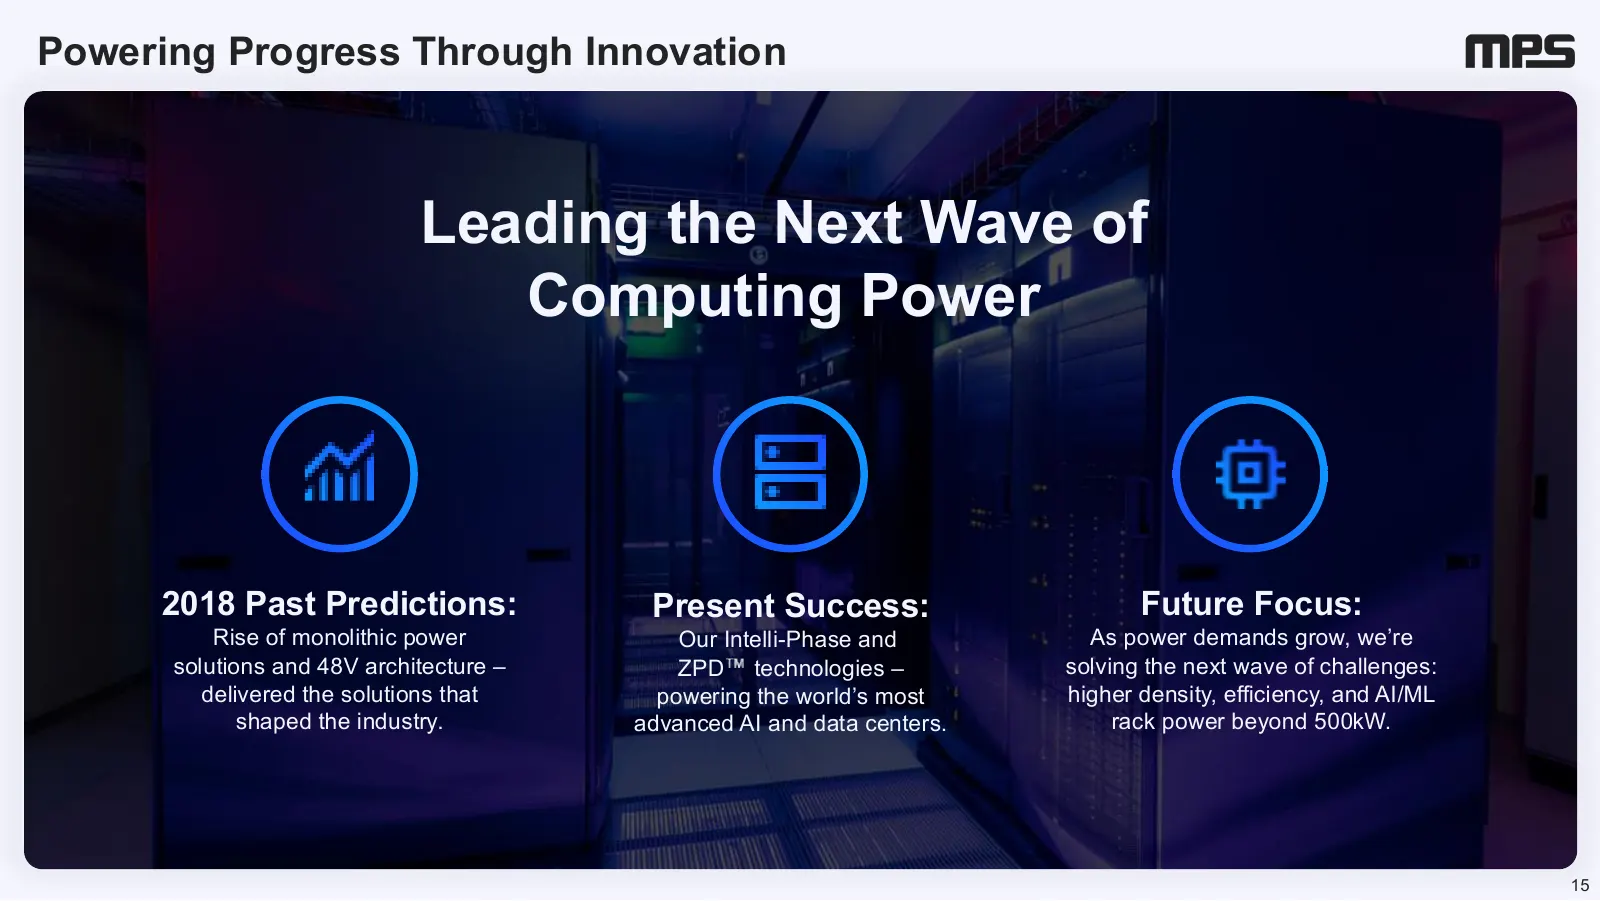
Powering Progress Through Innovation Leading the Next Wave of Computing Power 2018 Past Predictions: Present Success: Future Focus: Rise of monolithic power Our Intelli-Phase and As power demands grow, we’re solutions and 48V architecture – ZPD technologies – solving the next wave of challenges: del
Slide 16: Accelerating Power Demands: The New Normal
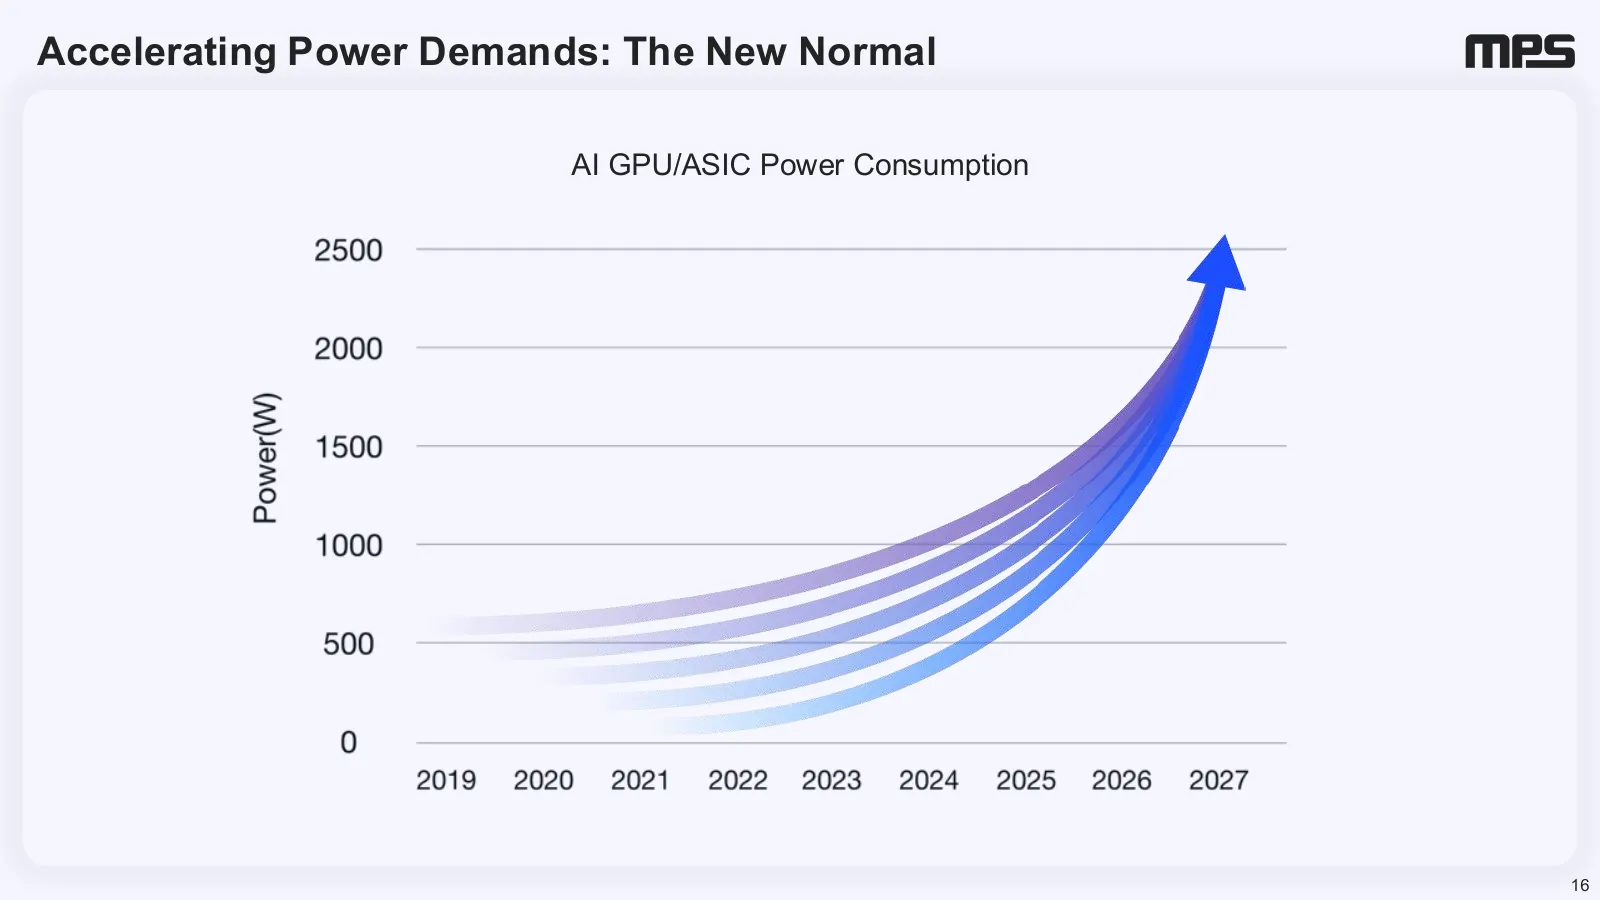
Accelerating Power Demands: The New Normal AI GPU/ASIC Power Consumption 16
Slide 17: Z-Axis Power Delivery (ZPD)
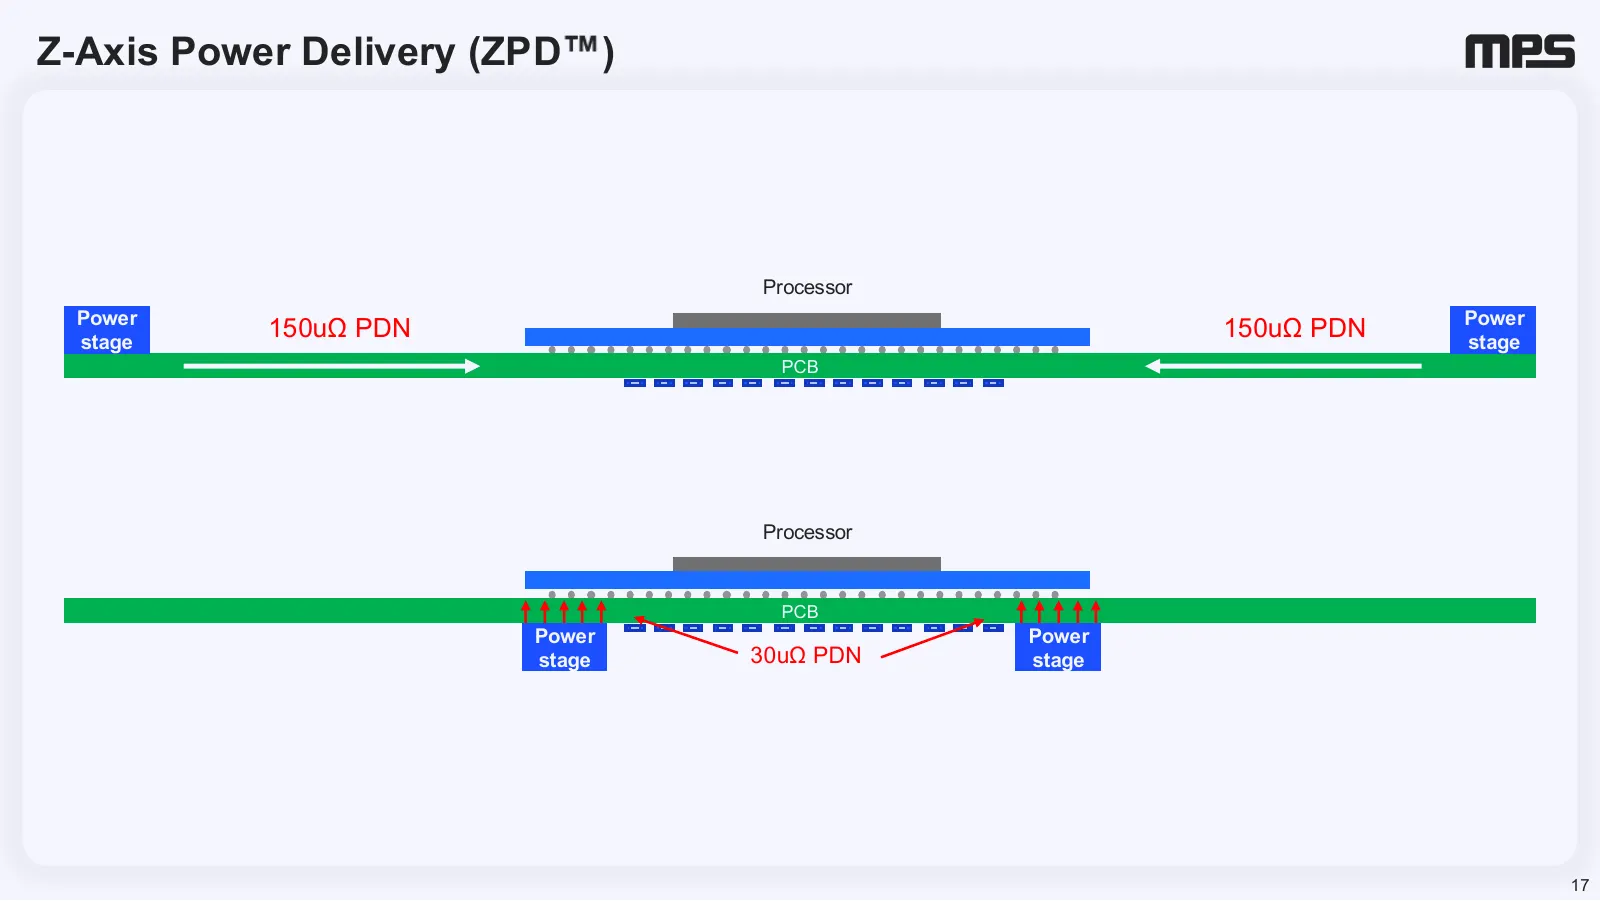
Z-Axis Power Delivery (ZPD ) Processor Power Power stage 150uΩ PDN 150uΩ PDN stage PCB Processor PCB Power Power stage 30uΩ PDN stage 17
Slide 18: GPU Power: Driving Data Center Architectural Evolution
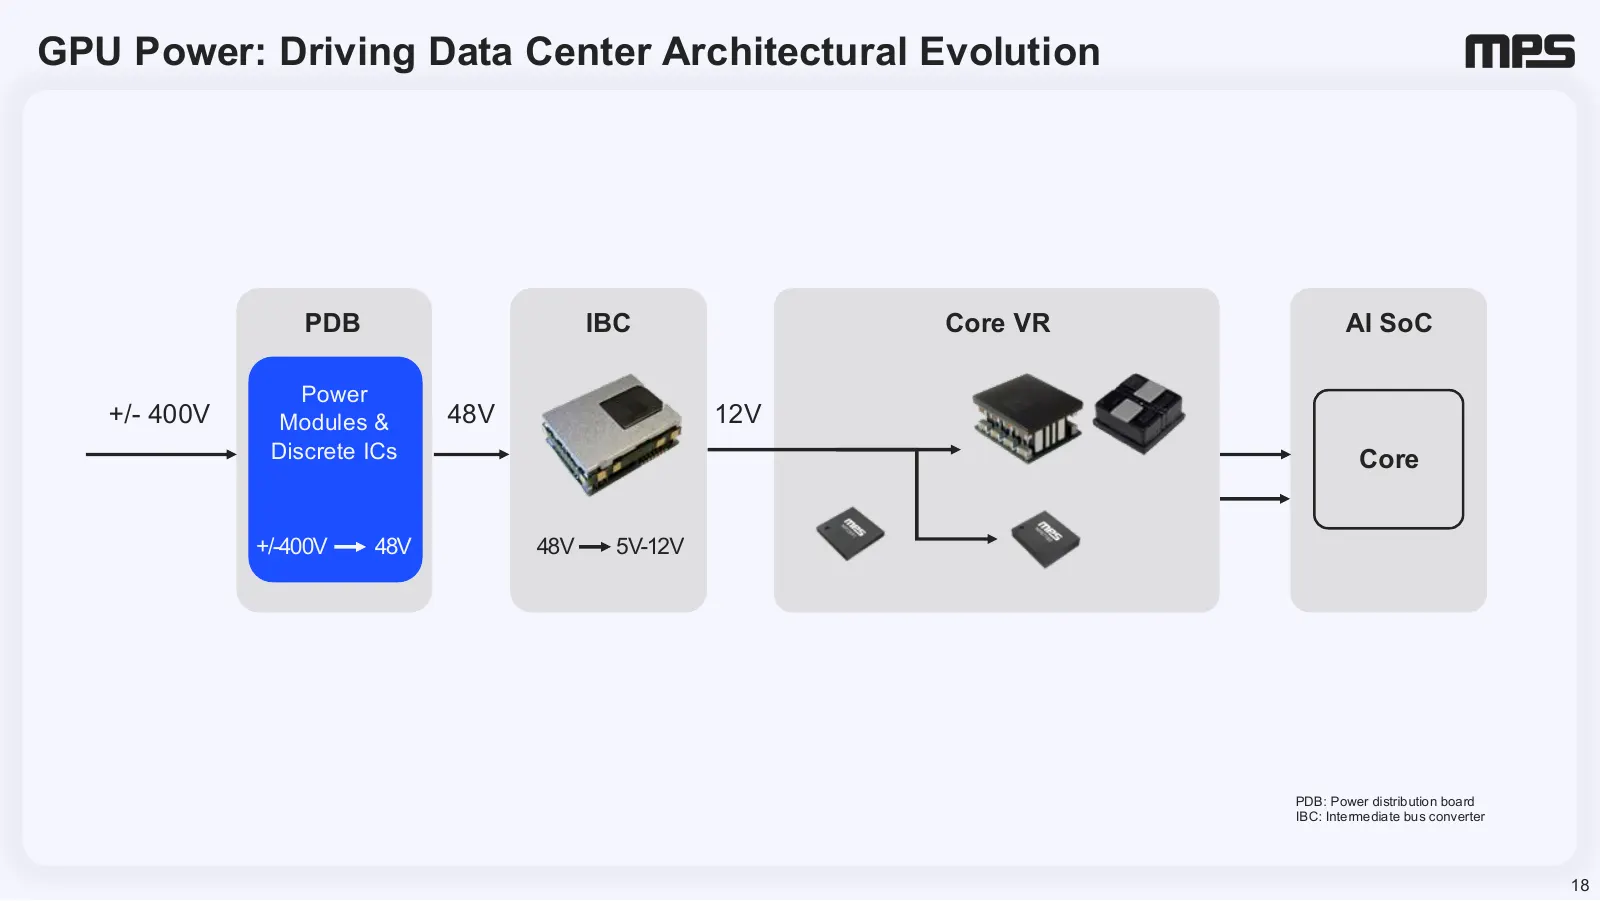
GPU Power: Driving Data Center Architectural Evolution PDB IBC Core VR AI SoC Power +/- 400V Modules & 48V 12V Discrete ICs Core +/-400V 48V 48V 5V-12V PDB: Power distribution board IBC: Intermediate bus converter 18
Slide 19: GPU Power: Power Density
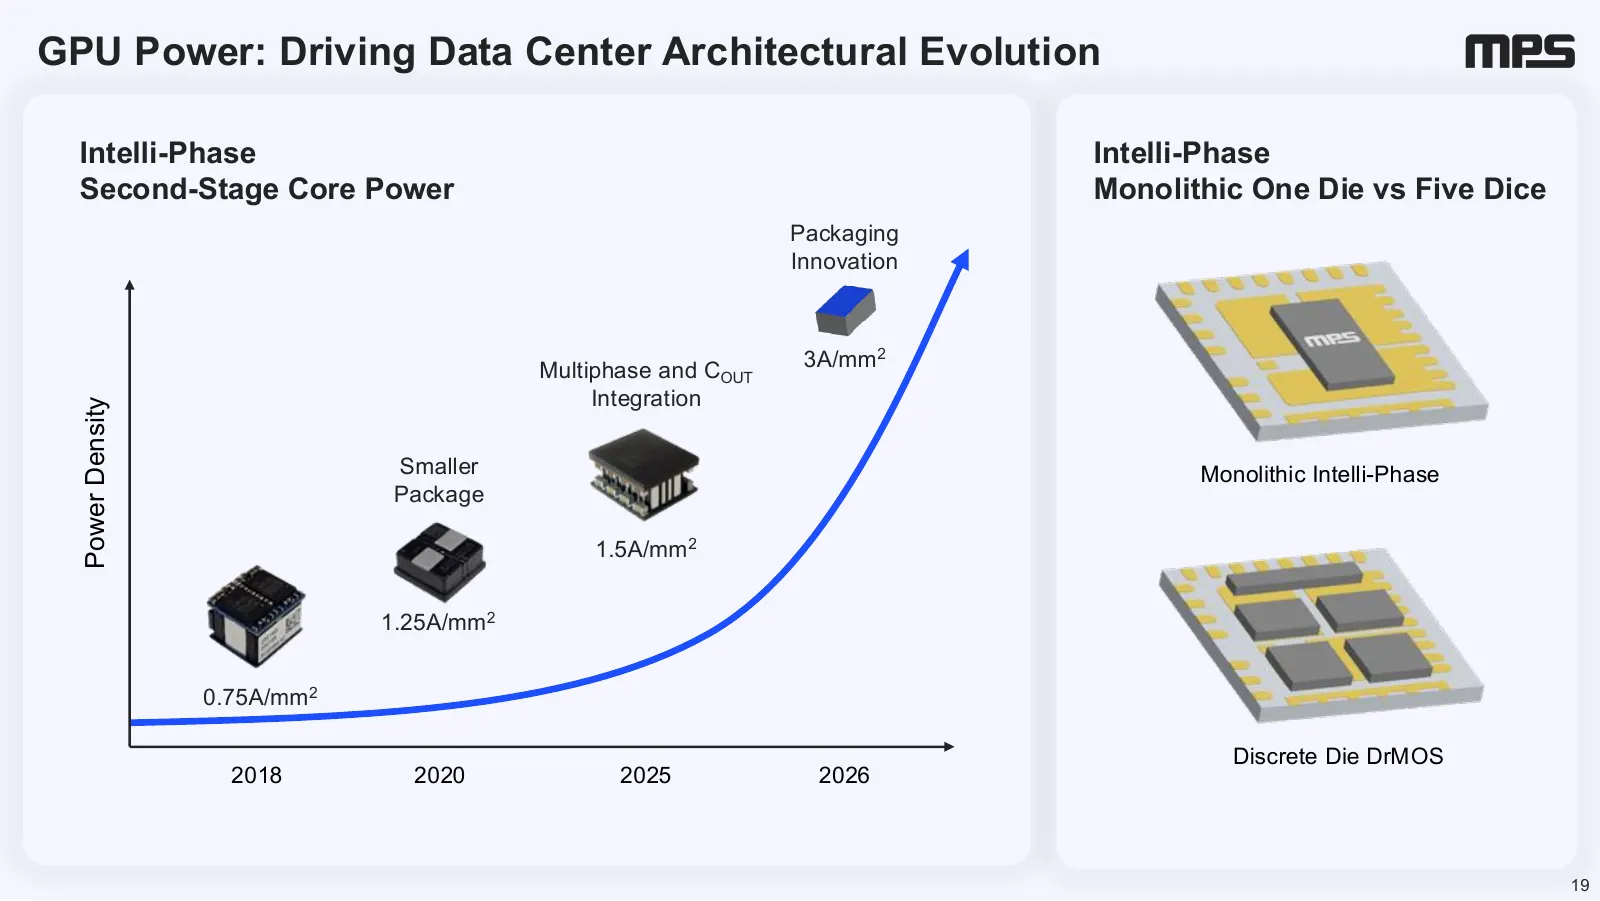
GPU Power: Driving Data Center Architectural Evolution Intelli-Phase Intelli-Phase Second-Stage Core Power Monolithic One Die vs Five Dice Packaging Innovation 3A/mm 2 Multiphase and COUT Integration Power Density Smaller Monolithic Intelli-Phase Package 1.5A/mm 2 1.25A/mm 2 0.75A/mm 2 Discrete Die
Slide 20: Recap: >$4B SAM and Rapidly Growing
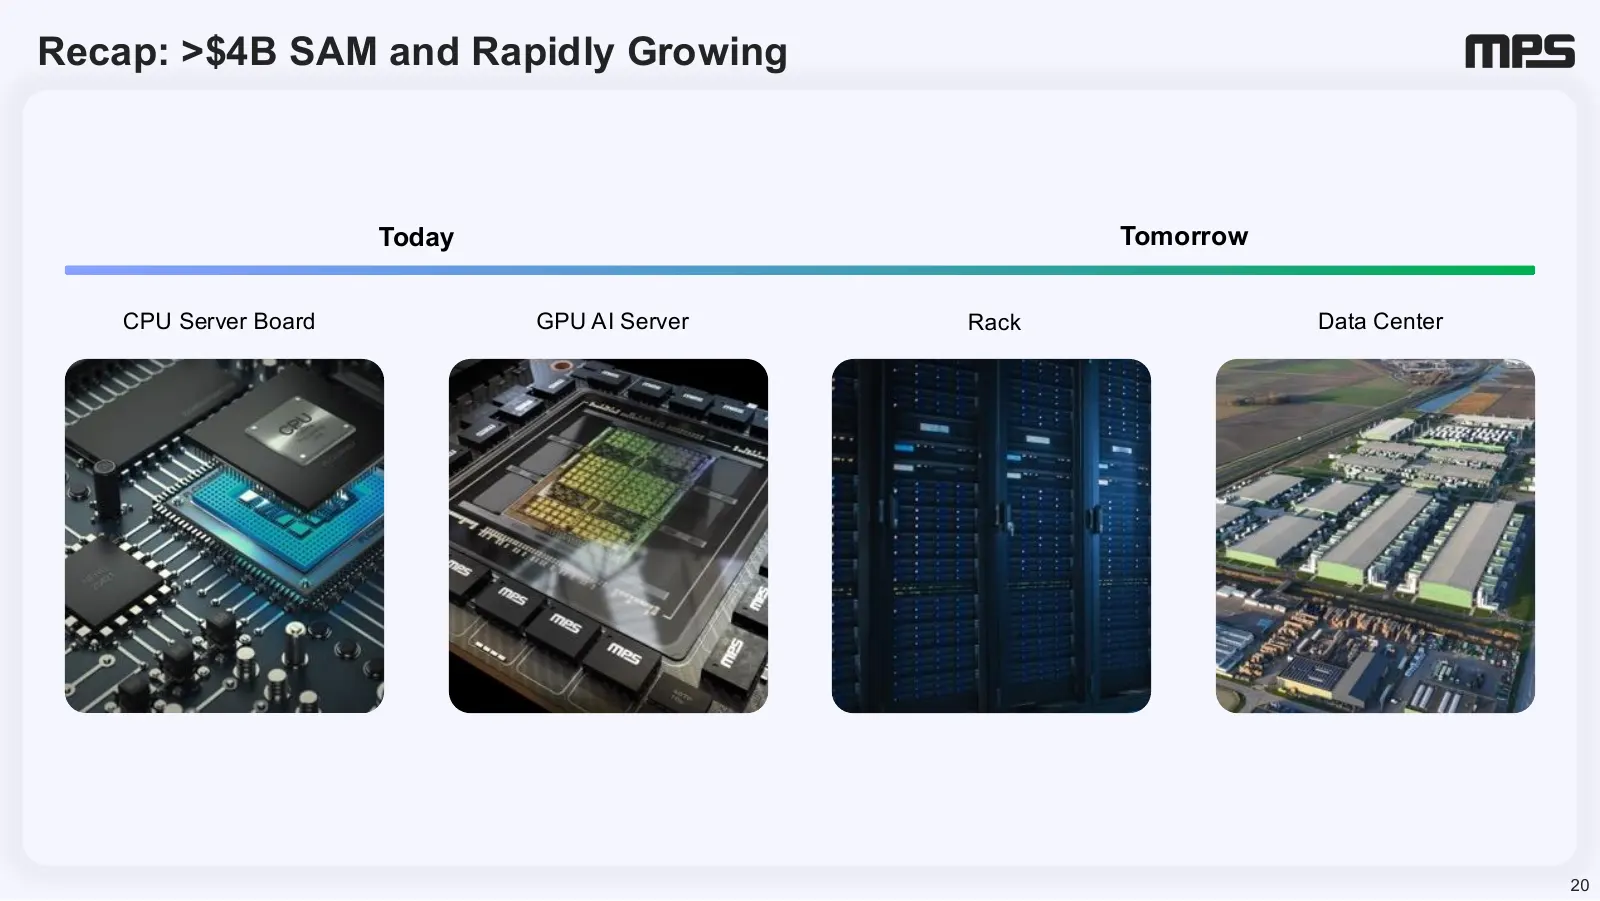
Recap: >$4B SAM and Rapidly Growing Today Tomorrow CPU Server Board GPU AI Server Rack Data Center 20

Slide 21: Driving the Future of Software-Defined Mobility
Driving the Future of Software-Defined Mobility
Slide 22: Diversified Impact
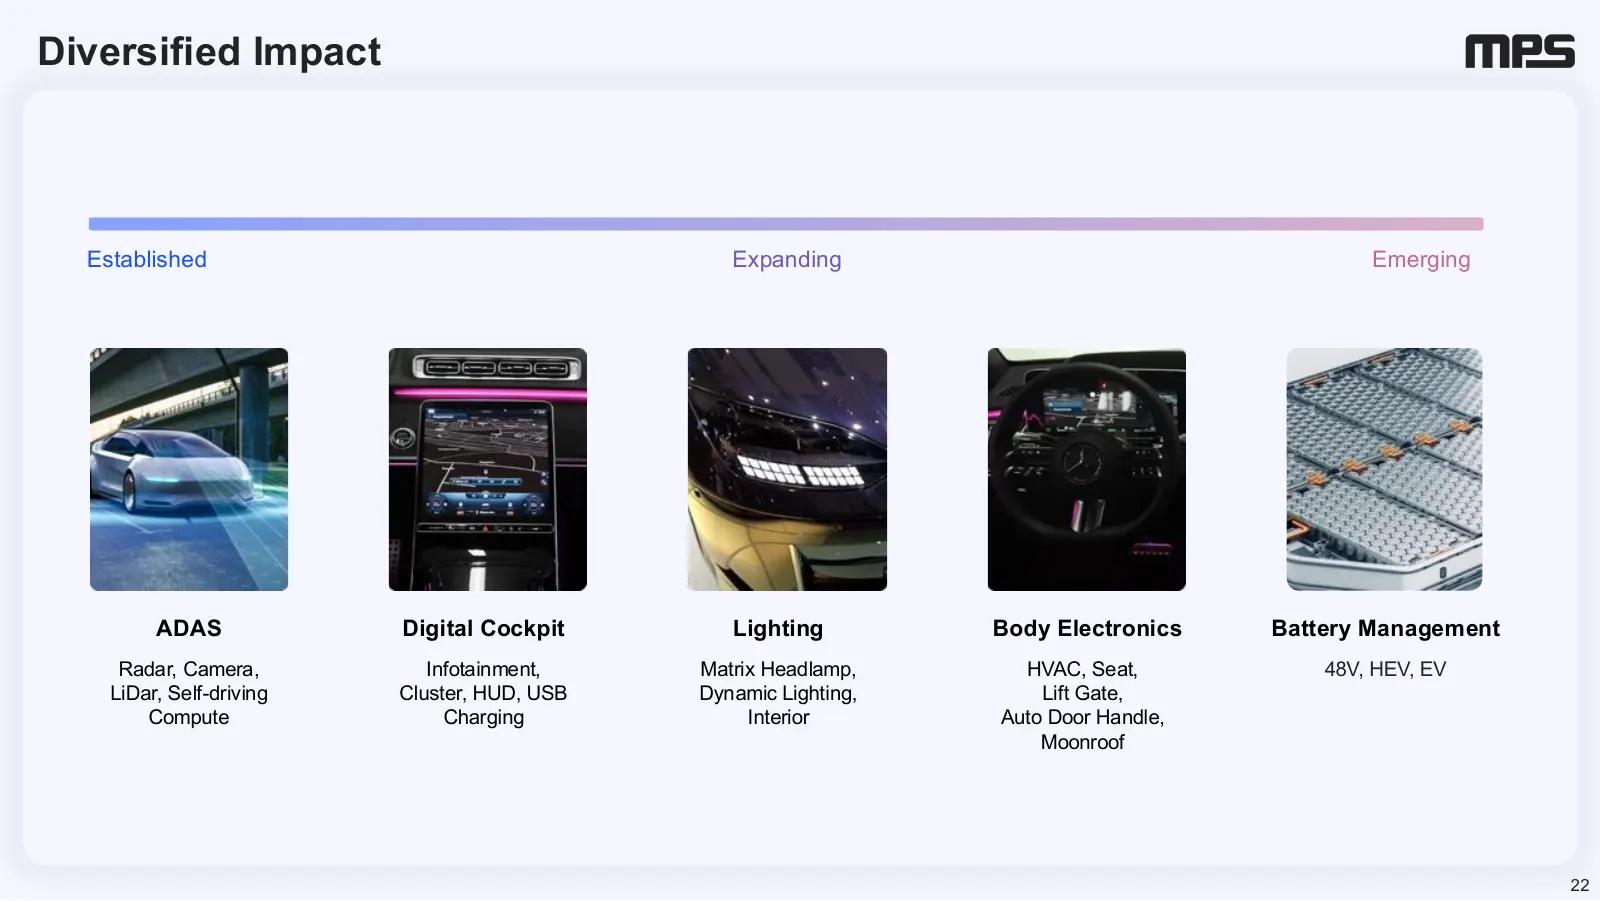
Diversified Impact Established Expanding Emerging ADAS Digital Cockpit Lighting Body Electronics Battery Management Radar, Camera, Infotainment, Matrix Headlamp, HVAC, Seat, 48V, HEV, EV LiDar, Self-driving Cluster, HUD, USB Dynamic Lighting, Lift Gate, Compute Charging Interior Auto Door Handle, M
Slide 23: Strategically Positioned for What's Next
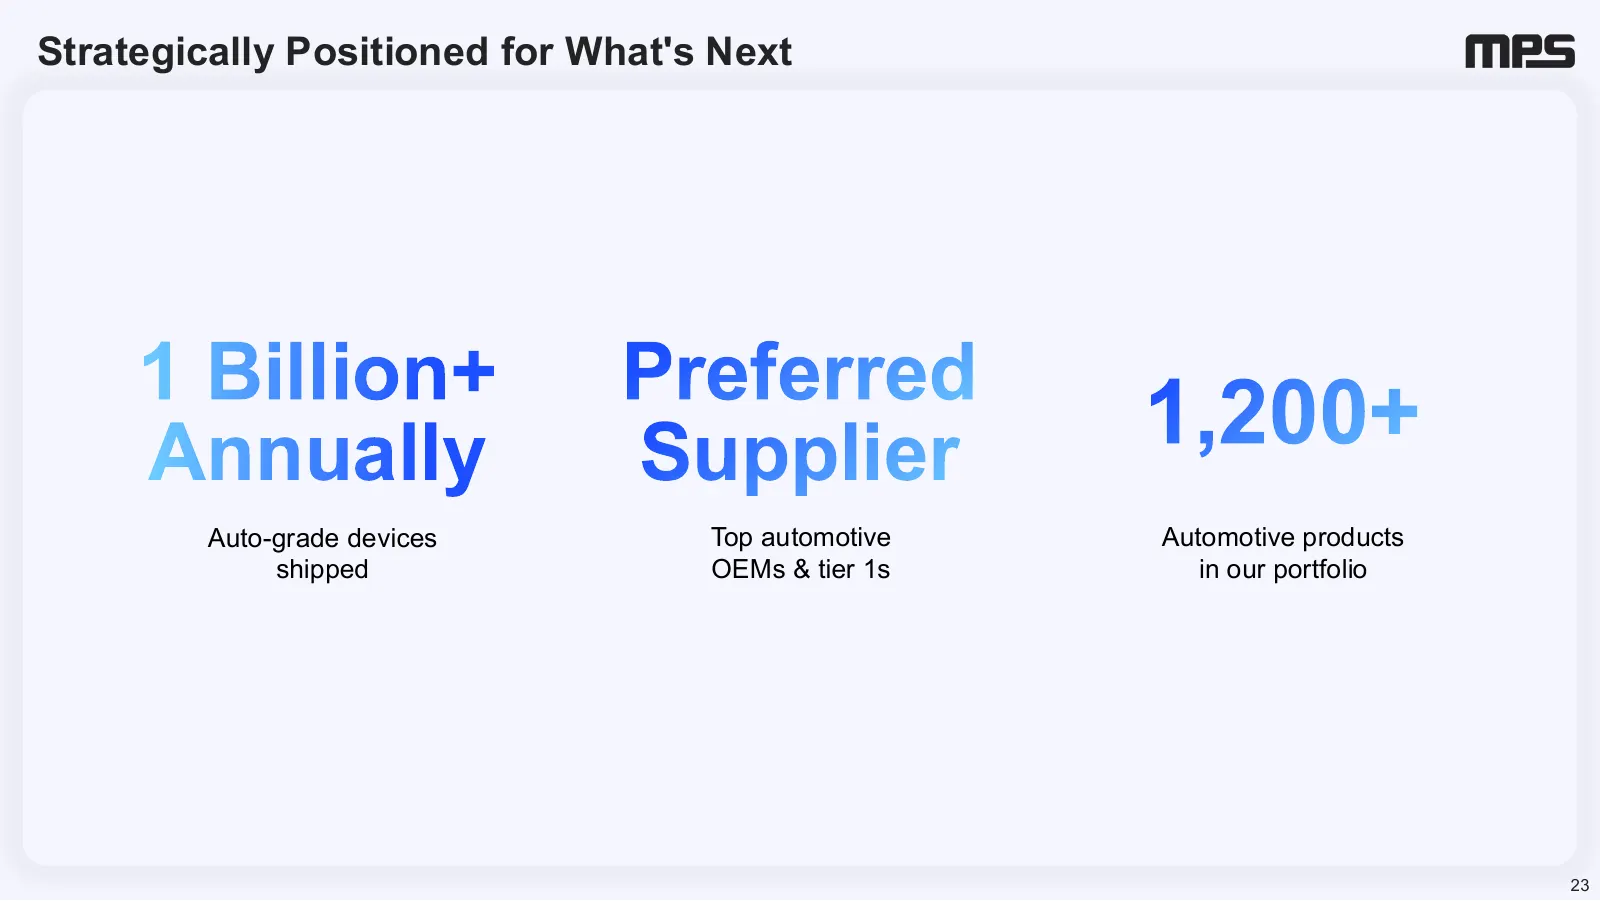
Strategically Positioned for What's Next 1 Billion+ Preferred Annually Supplier 1,200+ Auto-grade devices Top automotive Automotive products shipped OEMs & tier 1s in our portfolio 23
Slide 24: Driving the Future of Software-Defined Mobility
Powering Progress Through Innovation Driving the Future of Software-Defined Mobility The Car Compute Era ADAS Sensor Proliferation Digital Cockpit High Voltage (800V+) 48V Transition 24
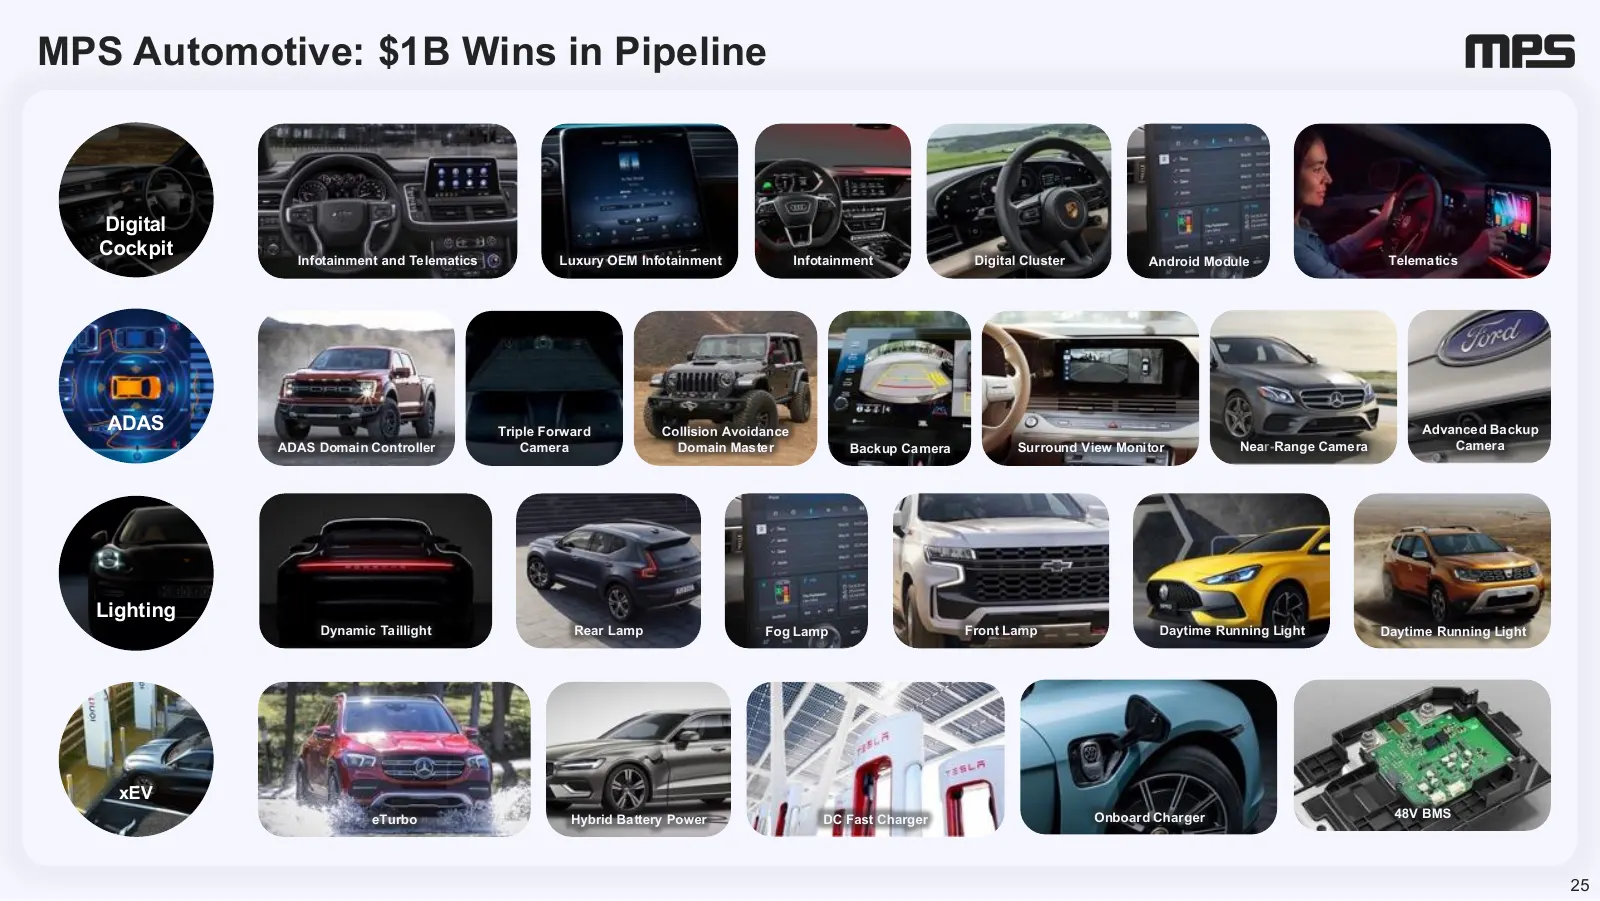
Slide 25: MPS Automotive: $1B Wins in Pipeline
MPS Automotive: $1B Wins in Pipeline Digital Cockpit Infotainment and Telematics Luxury OEM Infotainment Infotainment Digital Cluster Android Module Telematics ADAS Triple Forward Collision Avoidance Advanced Backup ADAS Domain Controller Camera Domain Master Backup Camera Surround View Monitor Near
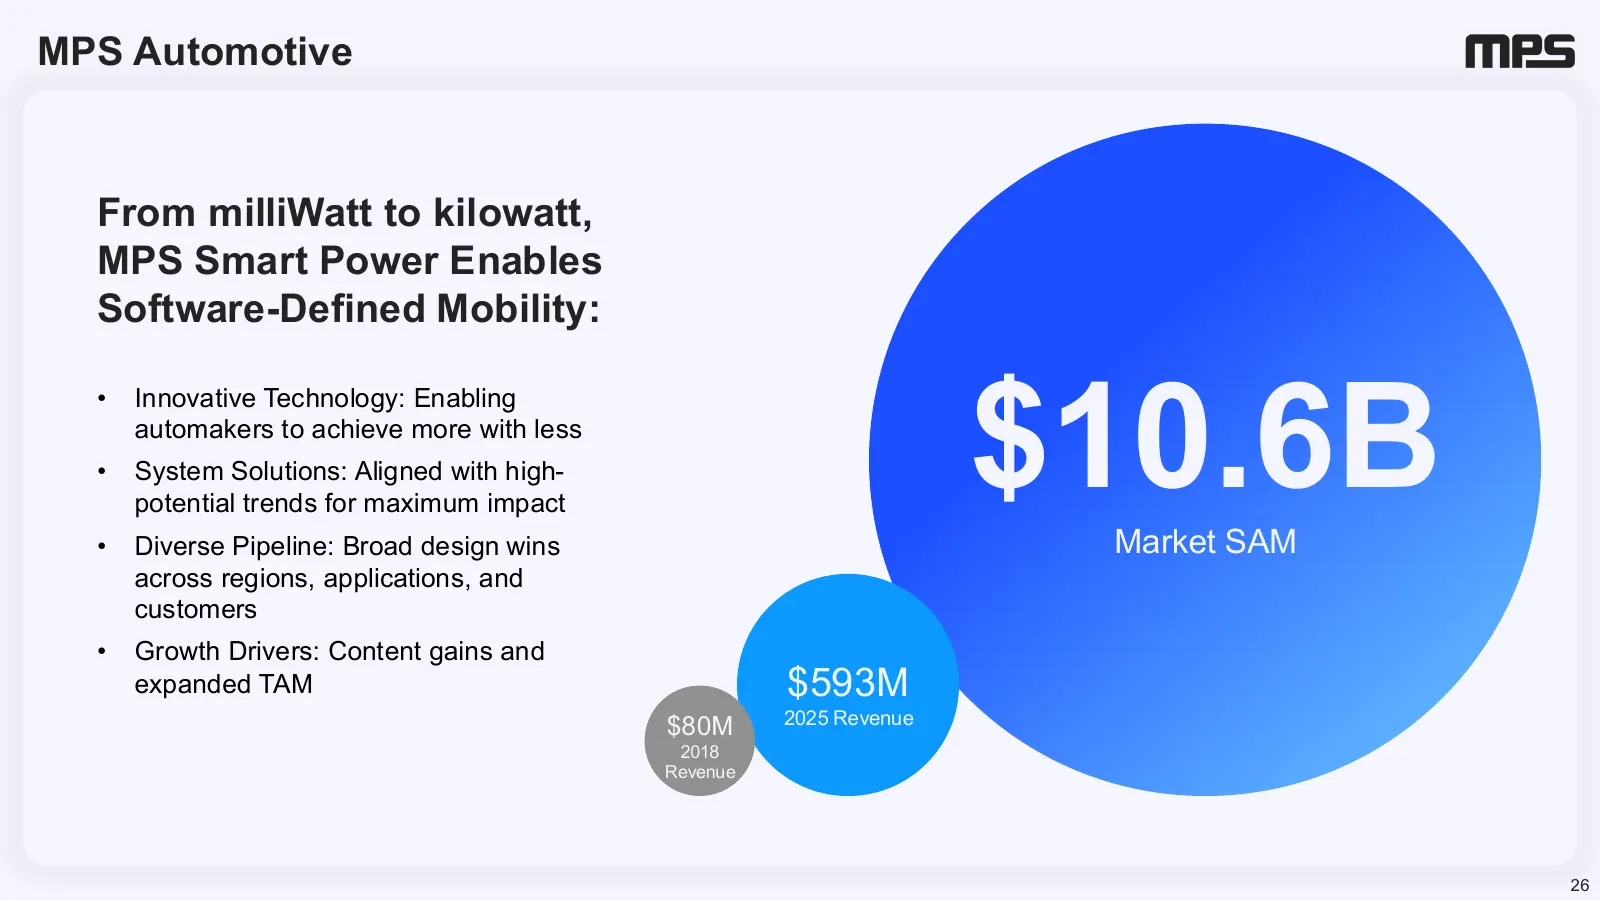
Slide 26: MPS Automotive: milliWatt to kilowatt
MPS Automotive From milliWatt to kilowatt, MPS Smart Power Enables Software-Defined Mobility: $10.6B • Innovative Technology: Enabling automakers to achieve more with less • System Solutions: Aligned with high- potential trends for maximum impact • Diverse Pipeline: Broad design wins Market SAM acro

Slide 27: Clean Energy, Robotics and Building Automation
Clean Energy, Robotics and Building Automation
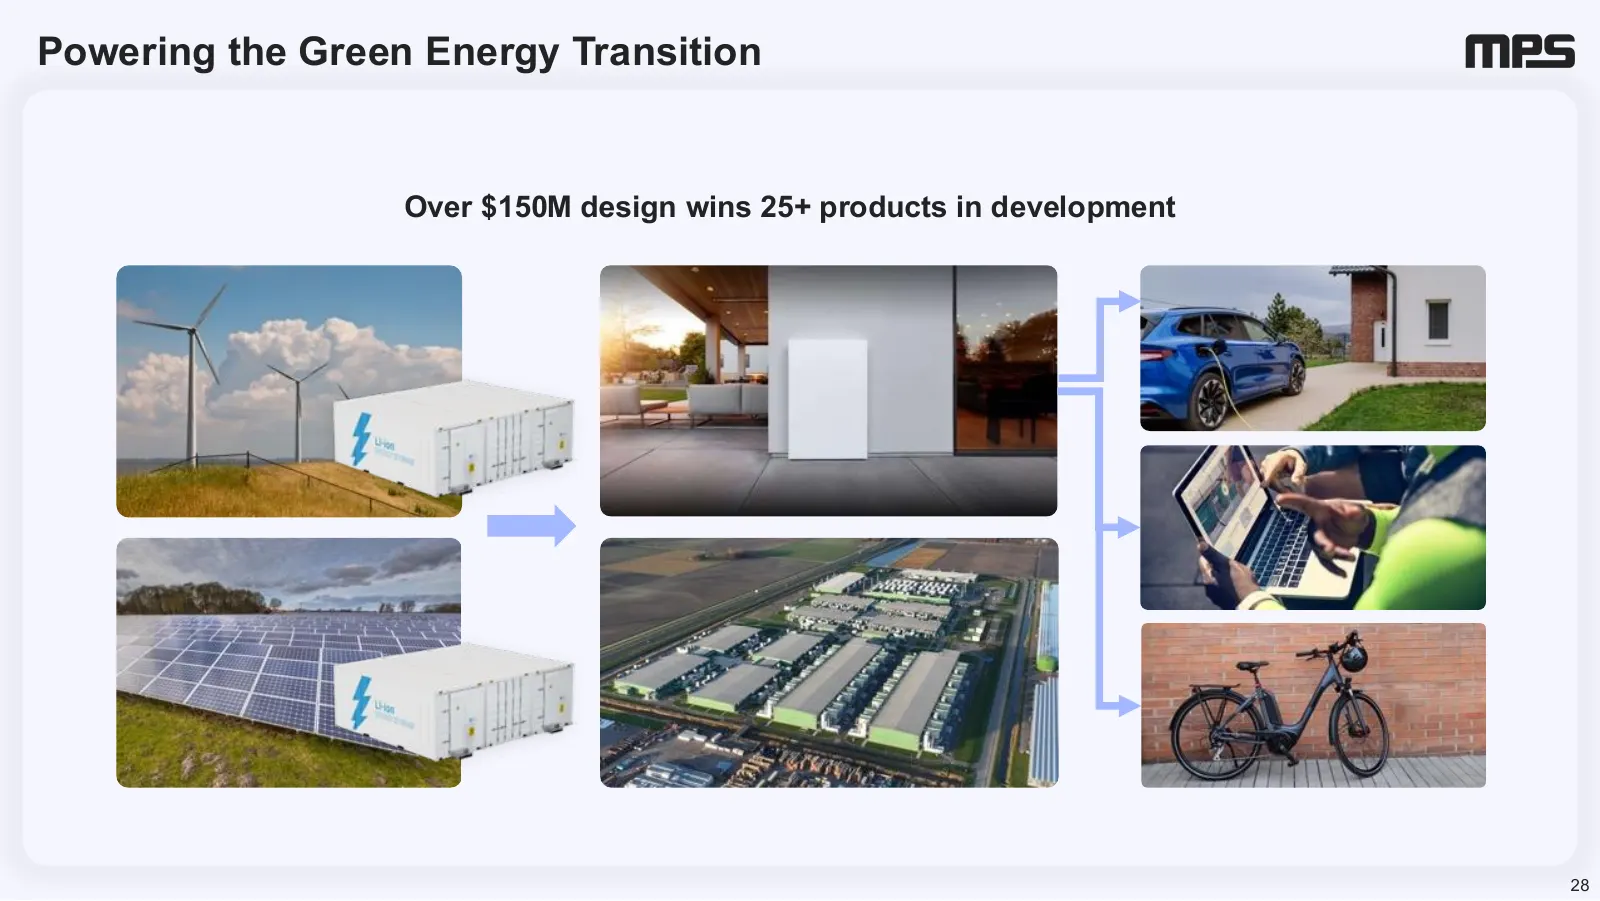
Slide 28: Powering the Green Energy Transition
Powering the Green Energy Transition Over $150M design wins 25+ products in development 28
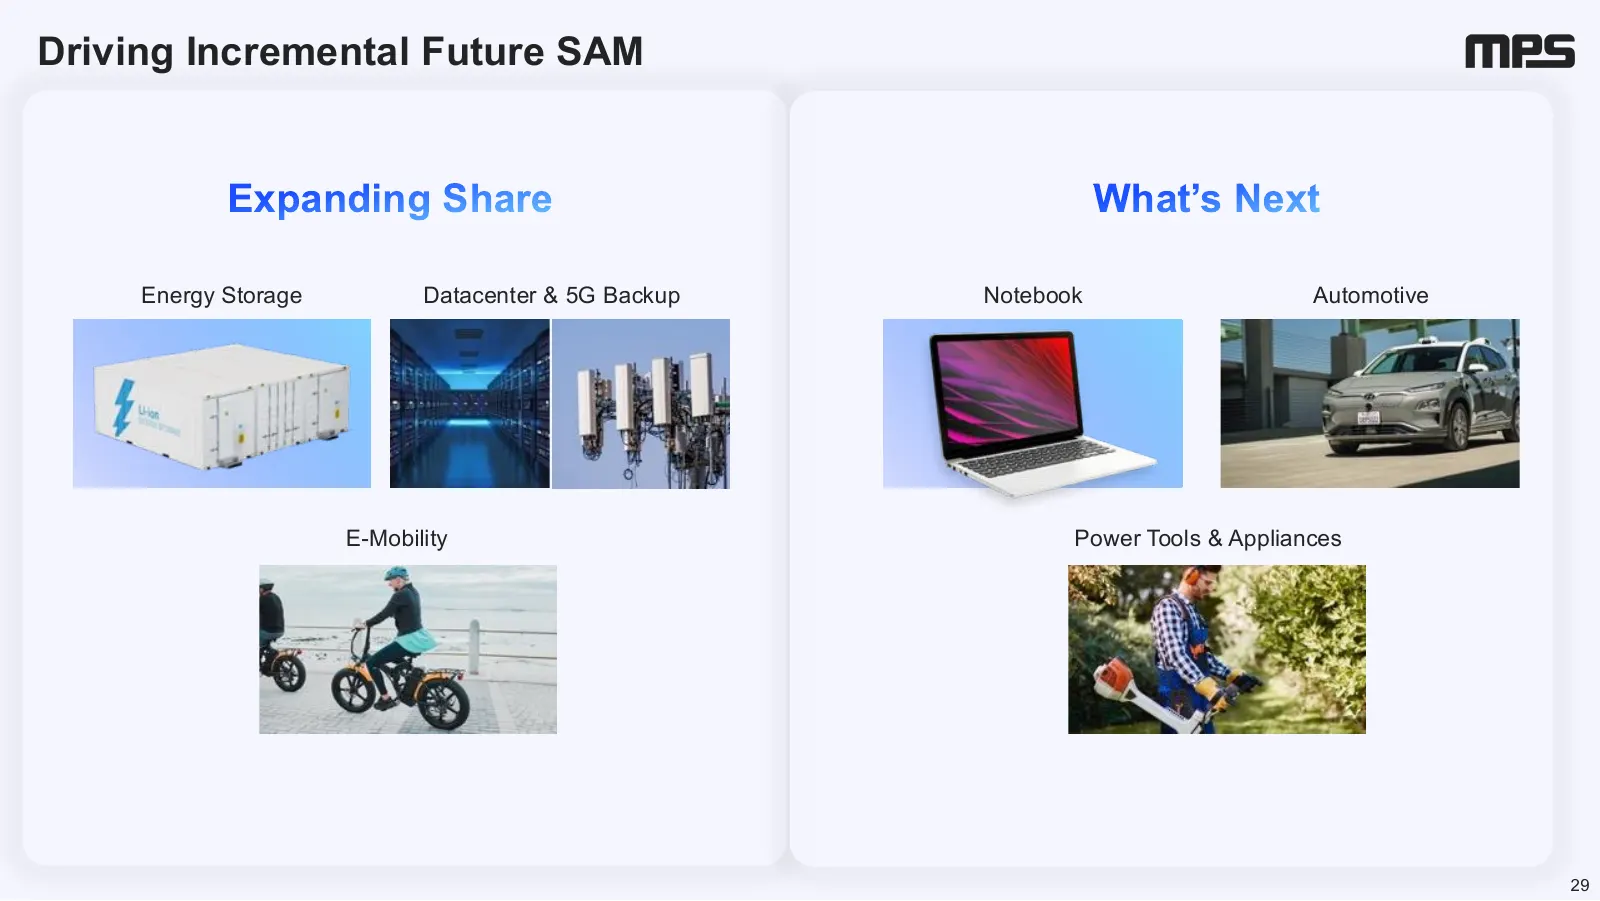
Slide 29: Driving Incremental Future SAM
Driving Incremental Future SAM Expanding Share What’s Next Energy Storage Datacenter & 5G Backup Notebook Automotive E-Mobility Power Tools & Appliances 29
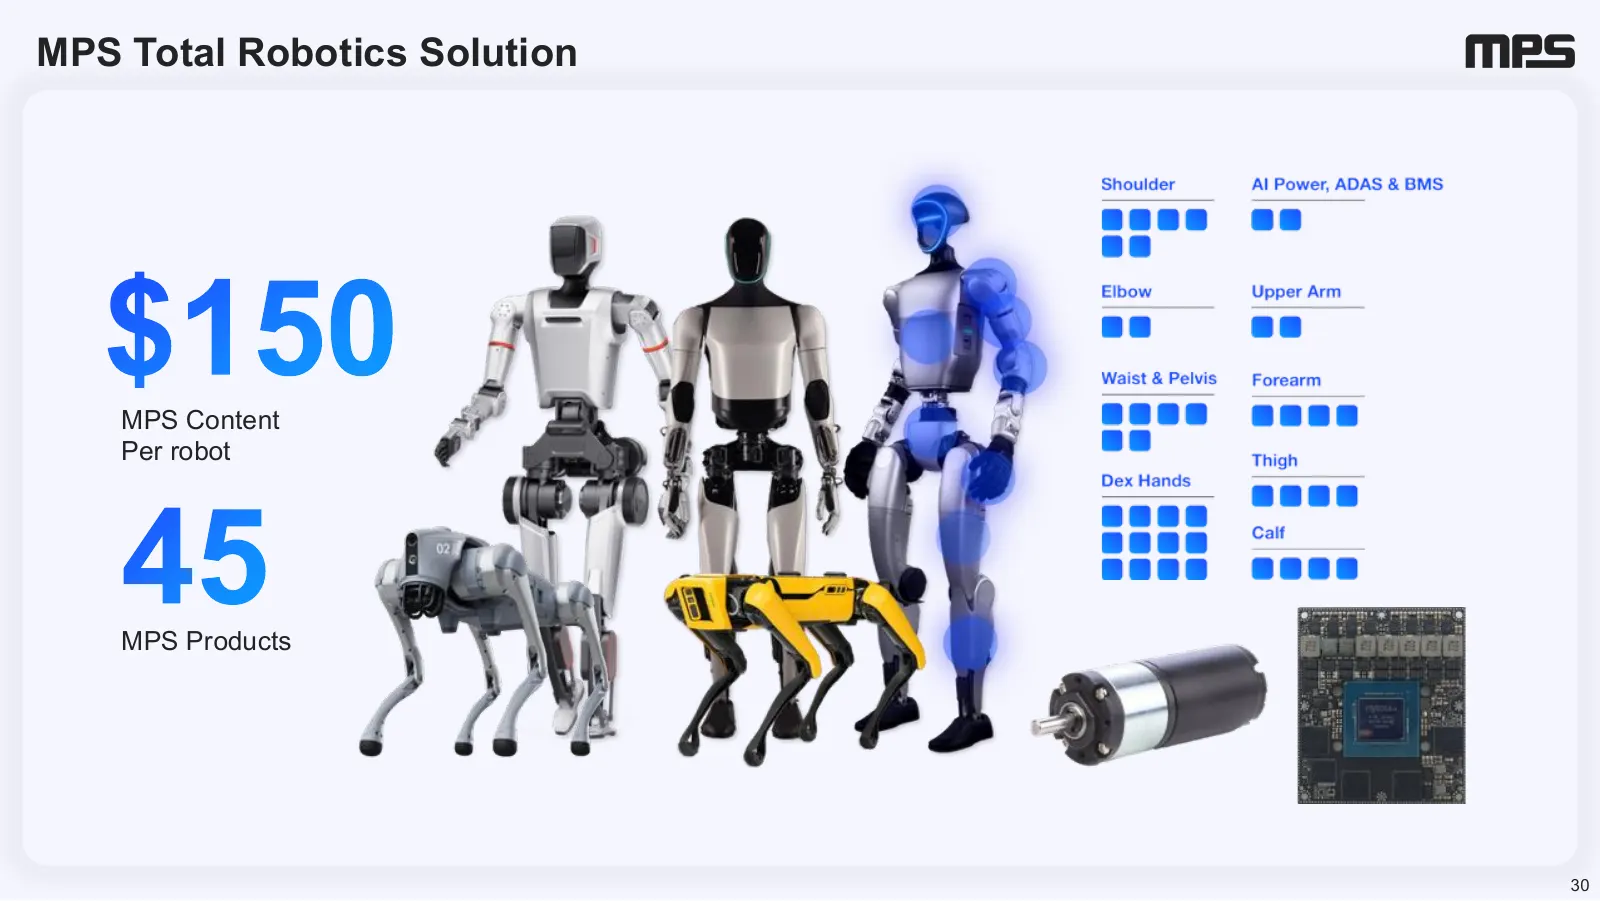
Slide 30: MPS Total Robotics Solution
MPS Total Robotics Solution $150 MPS Content Per robot 45 MPS Products 30
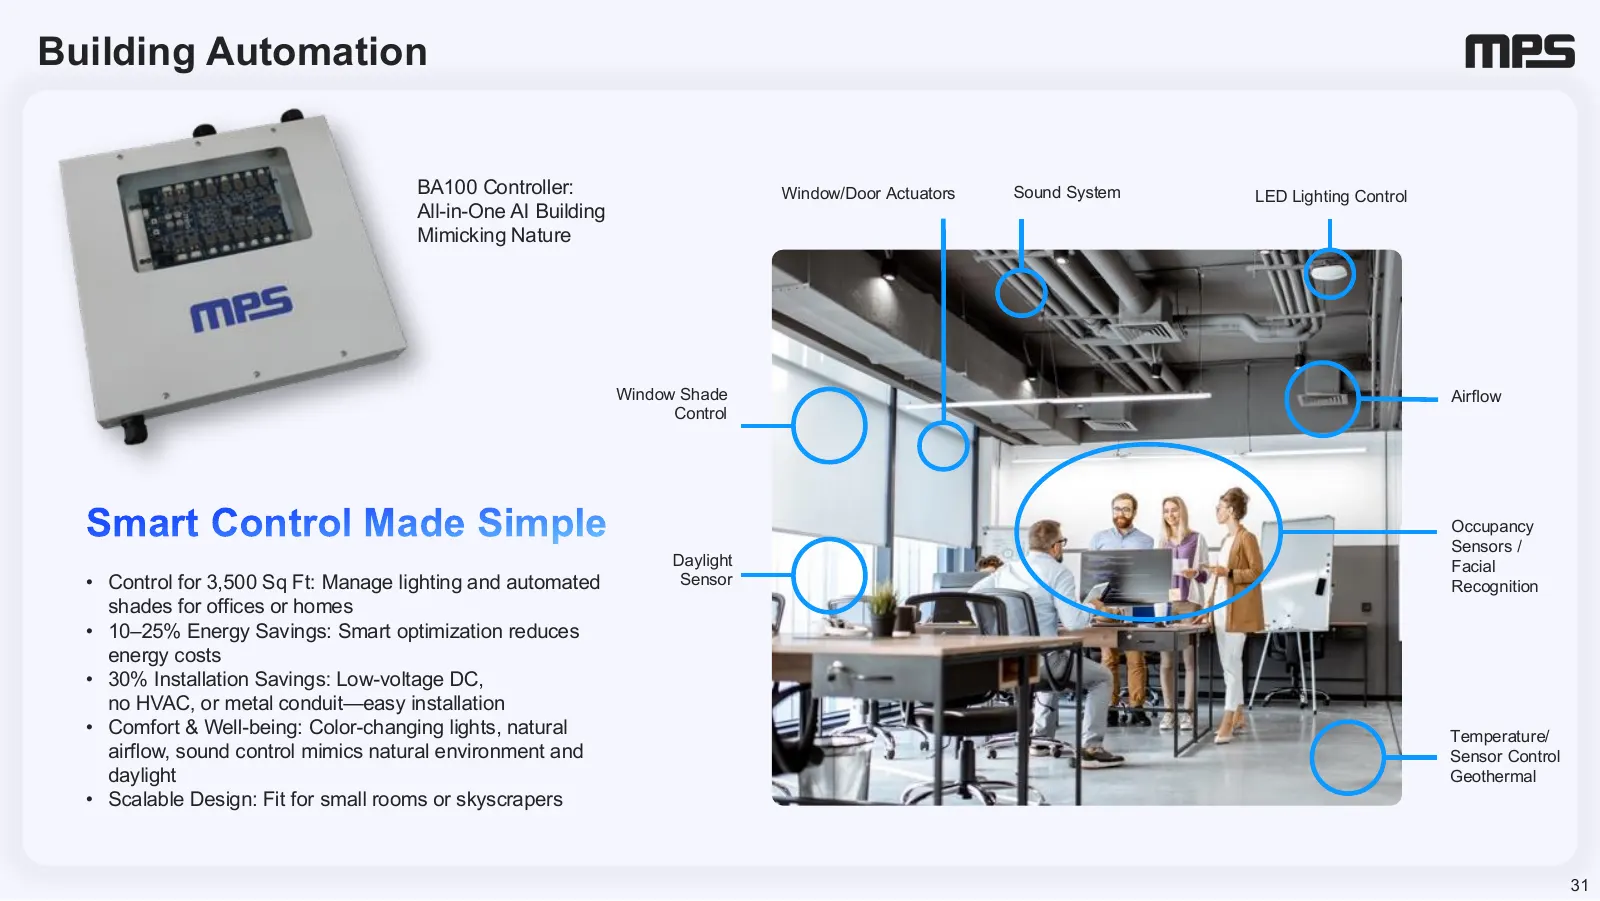
Slide 31: Building Automation: Smart Control Made Simple
Building Automation BA100 Controller: Window/Door Actuators Sound System LED Lighting Control All-in-One AI Building Mimicking Nature Window Shade Airflow Control Smart Control Made Simple Occupancy Sensors / Daylight Facial • Control for 3,500 Sq Ft: Manage lighting and automated Sensor Recognition

Slide 32: Financial Strength and Corporate Responsibility
Financial Strength and Corporate Responsibility
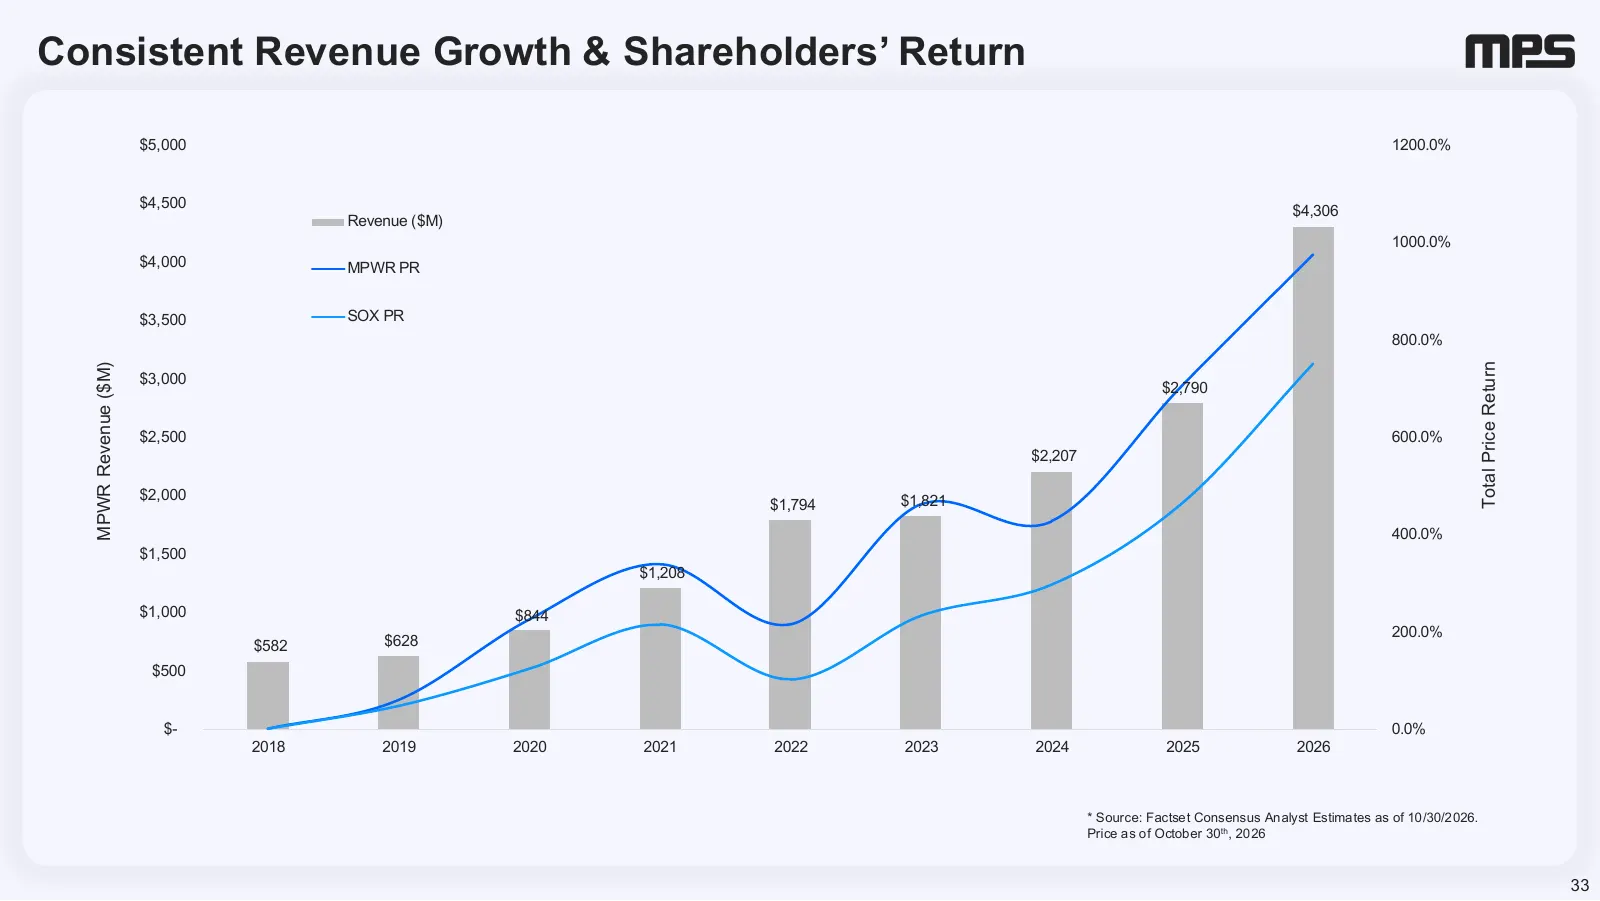
Slide 33: Consistent Revenue Growth & Shareholders' Return
Consistent Revenue Growth & Shareholders’ Return $5,000 1200.0% $4,500 $4,306 Revenue ($M) 1000.0% $4,000 MPWR PR $3,500 SOX PR 800.0% Total Price Return MPWR Revenue ($M) $3,000 $2,790 $2,500 600.0% $2,207 $2,000 $1,821 $1,794 400.0% $1,500 $1,208 $1,000 $844 200.0% $582 $628 $500 $- 0.0% 2018 2019
Slide 34: Consistent Revenue Growth & Shareholders' Return
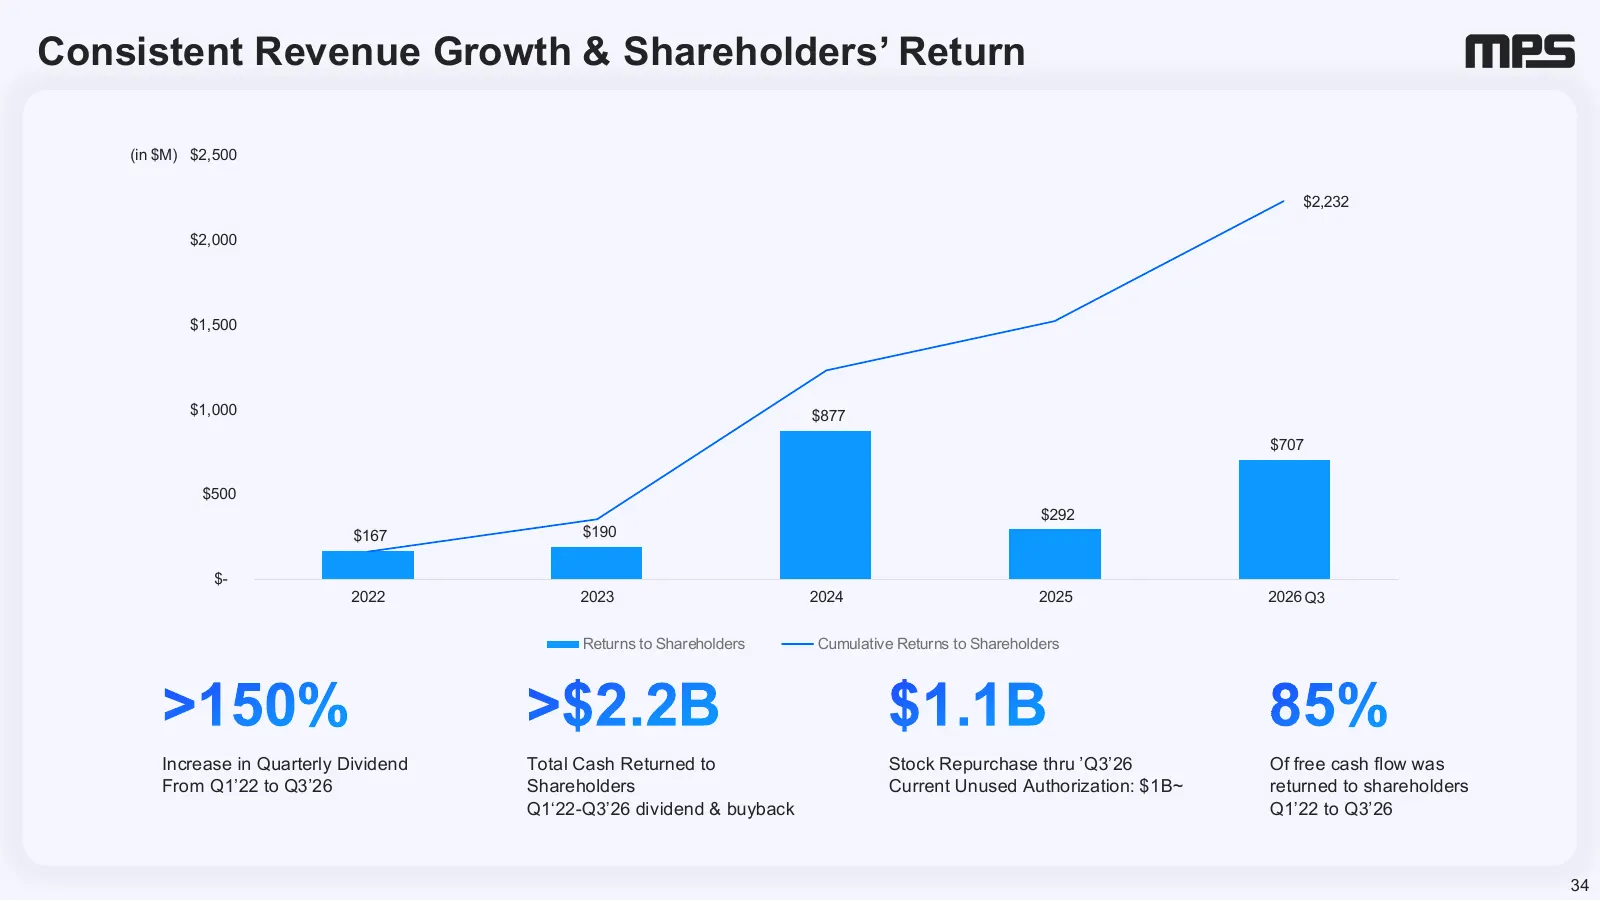
Consistent Revenue Growth & Shareholders’ Return (in $M) $2,500 $2,232 $2,000 $1,500 $1,000 $877 $707 $500 $292 $167 $190 $- 2022 2023 2024 2025 2026 Q3 Returns to Shareholders Cumulative Returns to Shareholders >150% >$2.2B $1.1B 85% Increase in Quarterly Dividend Total Cash Returned to Stock Repur
Slide 35: Corporate Responsibility
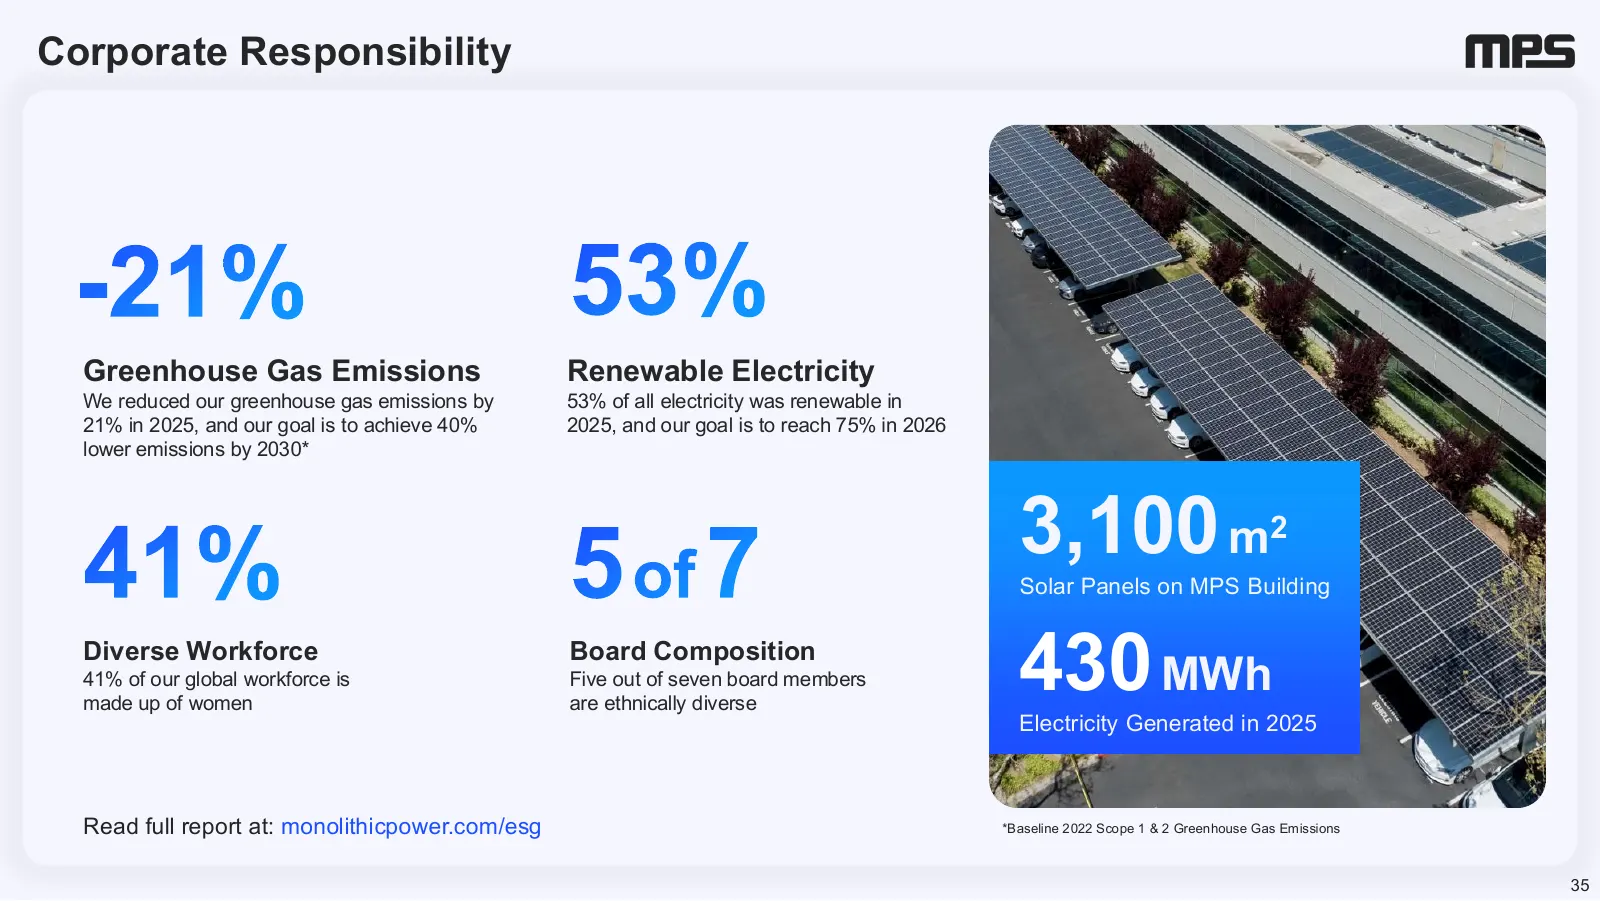
Corporate Responsibility -21% 53% Greenhouse Gas Emissions Renewable Electricity We reduced our greenhouse gas emissions by 53% of all electricity was renewable in 21% in 2025, and our goal is to achieve 40% 2025, and our goal is to reach 75% in 2026 lower emissions by 2030* 3,100 m 41% 5 of 7 2 Sol

Slide 36: Thank You
mrS Thank You
Slide 37: Reconciliation of GAAP to Non-GAAP Measures
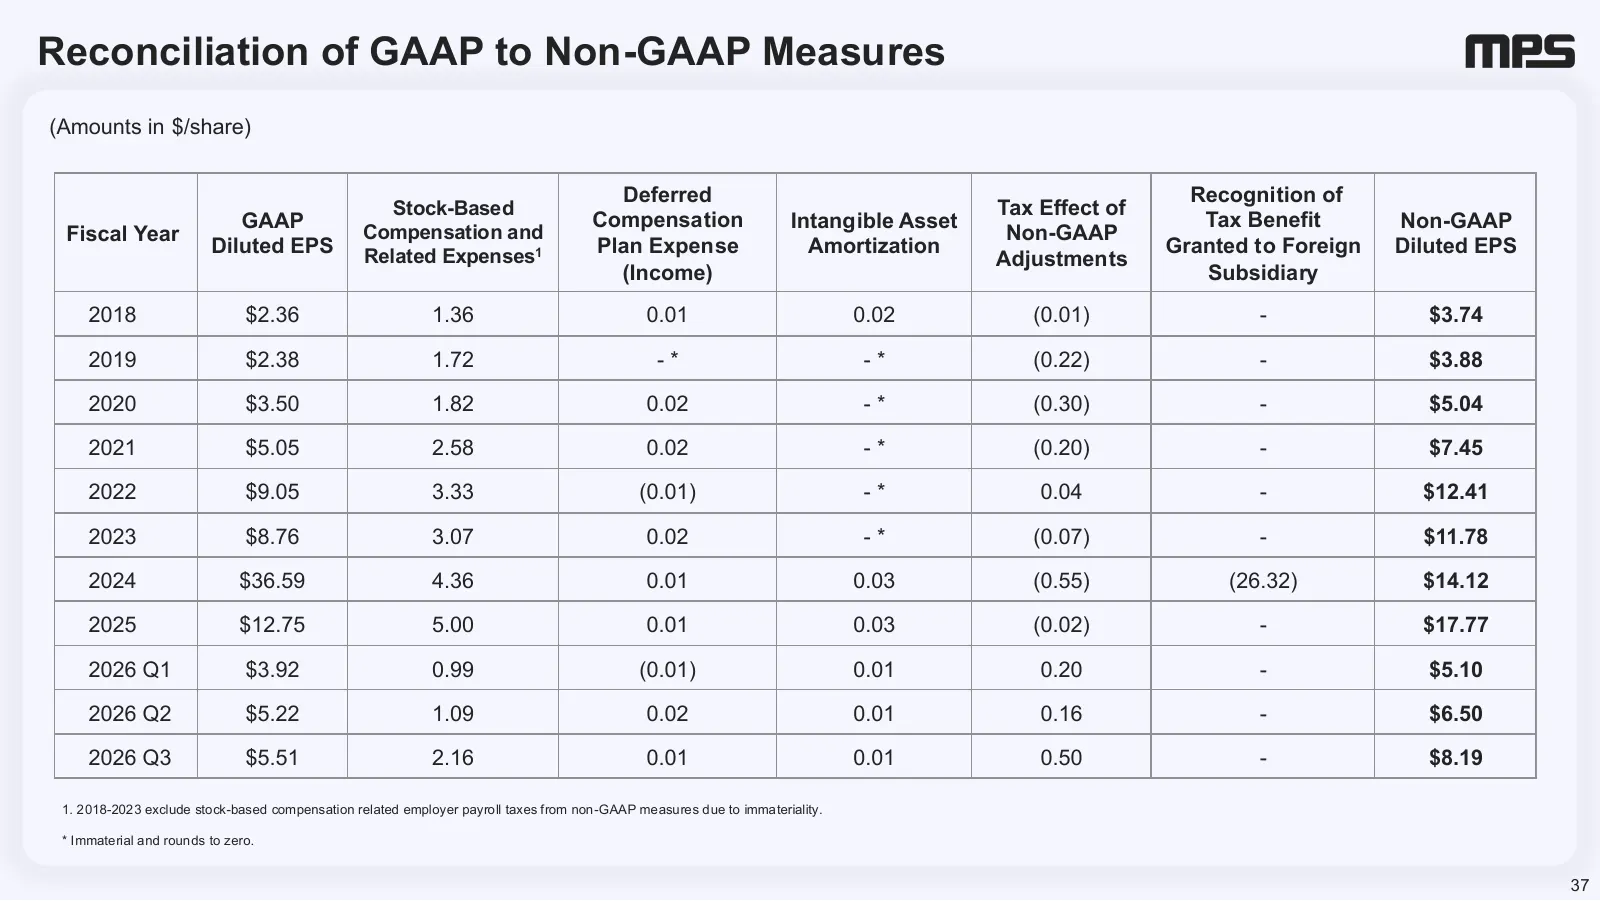
Reconciliation of GAAP to Non-GAAP Measures (Amounts in $/share) Deferred Recognition of Stock-Based Tax Effect of GAAP Compensation Intangible Asset Tax Benefit Non-GAAP Fiscal Year Compensation and Non-GAAP Diluted EPS Related Expenses1 Plan Expense Amortization Granted to Foreign Diluted EPS Adju
Slide 38: Reconciliation of GAAP to Non-GAAP Measures
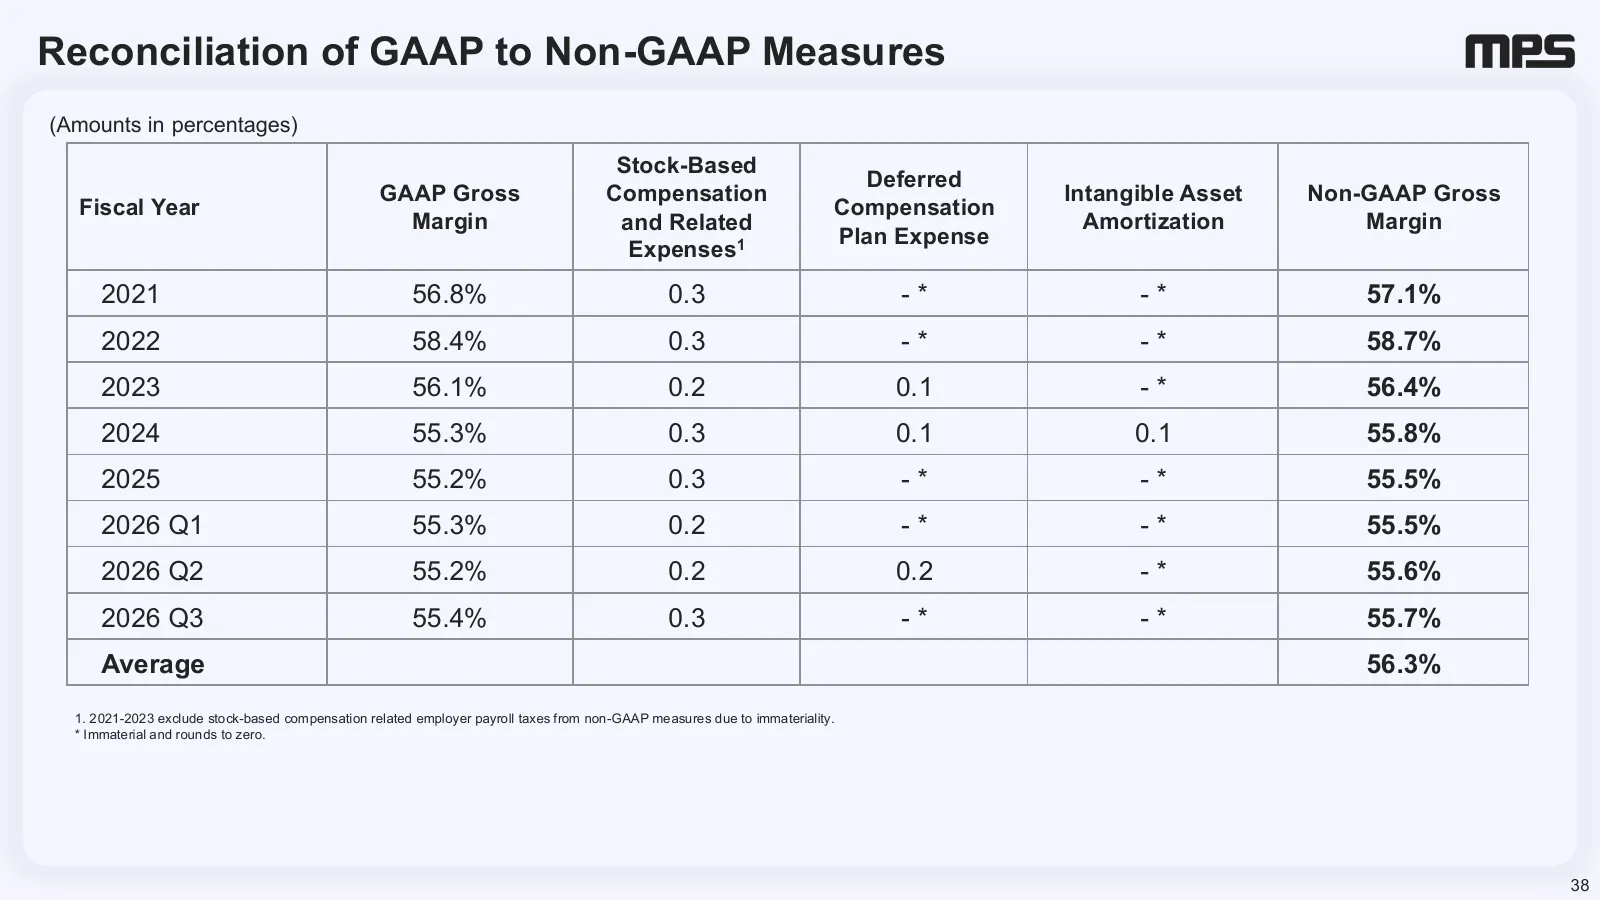
Reconciliation of GAAP to Non-GAAP Measures (Amounts in percentages) Stock-Based Deferred GAAP Gross Compensation Intangible Asset Non-GAAP Gross Fiscal Year Compensation Margin and Related Amortization Margin Plan Expense Expenses1 2021 56.8% 0.3 -* -* 57.1% 2022 58.4% 0.3 -* -* 58.7% 2023 56.1% 0.
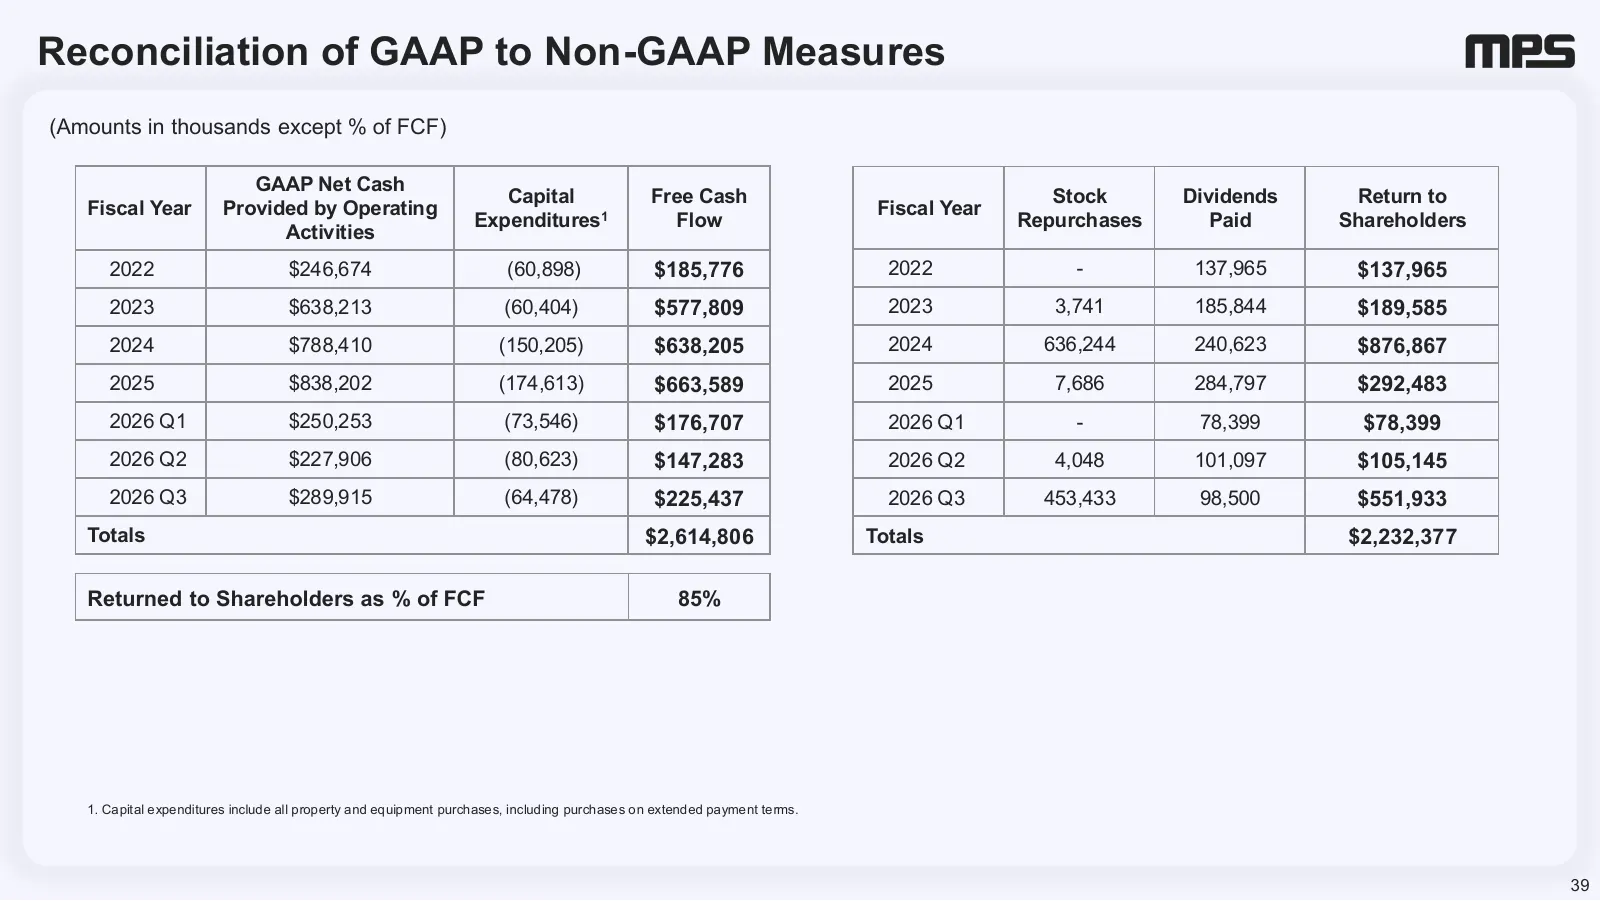
Slide 39: Reconciliation of GAAP to Non-GAAP Measures
Reconciliation of GAAP to Non-GAAP Measures (Amounts in thousands except % of FCF) GAAP Net Cash Capital Free Cash Stock Dividends Return to Fiscal Year Provided by Operating Fiscal Year Expenditures1 Flow Repurchases Paid Shareholders Activities 2022 $246,674 (60,898) $185,776 2022 - 137,965 $137,9
Source: company website
More decks from Monolithic Power Systems, Inc.
 Q1 2026 Earnings Presentation38 slides · Apr 30, 2026
 Q4 2025 Earnings Presentation38 slides · Feb 5, 2026
 Technical Presentation (February 2026)22 slides · February 2026
 Investor Presentation (2026)38 slides · 2026
 Q4 2025 Earnings Presentation42 slides · Dec 11, 2025
 Investor Presentation (2025)38 slides · Nov 6, 2025