Gulfmark Offshore — Coal Energy & Utilities Conferences (May 2013)
27 slides from Gulfmark Offshore's conference presentation, May 14, 2013

Slide 1: GulfMark Offshore, Inc
GulfMark Offshore, Inc oal Energy & Utilities Conferences
Slide 2: Forward Looking Statements
Forward Looking Statements Cautionary Statement Regarding Forward-Looking Statements Certain statements and information in this presentation may constitute “forward-looking statements” within the meaning of the Private Securities Litigation Reform Act of 1995. The words “believe,” “expect,” “anticip
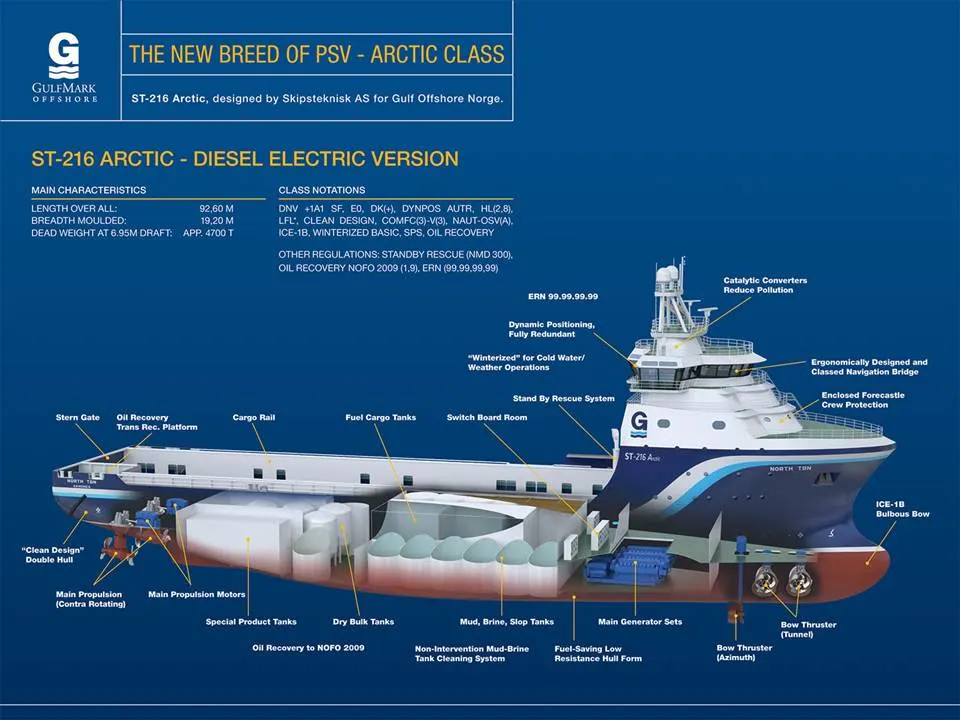
Slide 3: The New Breed of PSV - Arctic Class
THE NEW BREED OF PSV - ARCTIC CLASS. Se ST-216 Arctic, designed by Skipsteknisk AS for Gulf Offshore Norge. ST-216 ARCTIC - DIESEL ELECTRIC VERSION MAIN CHARACTERISTICS (CLASS NOTATIONS LENGTH OVER ALL: 92.60% DNV “IAI SF. ED, OG), DYNPOS AUTR, HLZS. ‘BREADTH MOULDED: 190M LFL, CLEAN DESIGN, COMFC®)
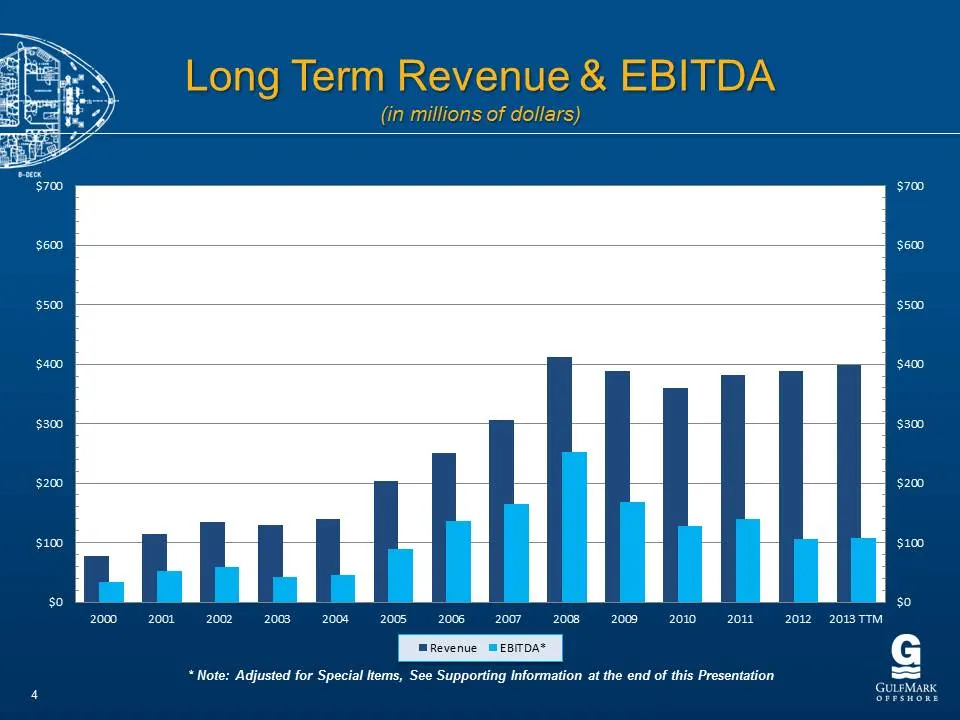
Slide 4: Long Term Revenue & EBITDA
Long Term Revenue & EBITDA (in millions of dollars) $700 $600 $500 $400 cr) $200 $100 2000 2001 ©2002-2003» 2004 ~=«« 20052006. «2007 «2008.» 2009 «2010-2011.» «2012 -2013TTM G * Note: Adjusted for Special Items, See Supporting Information at the end of this Presentation a GULEMARK 4 OFFSHORE
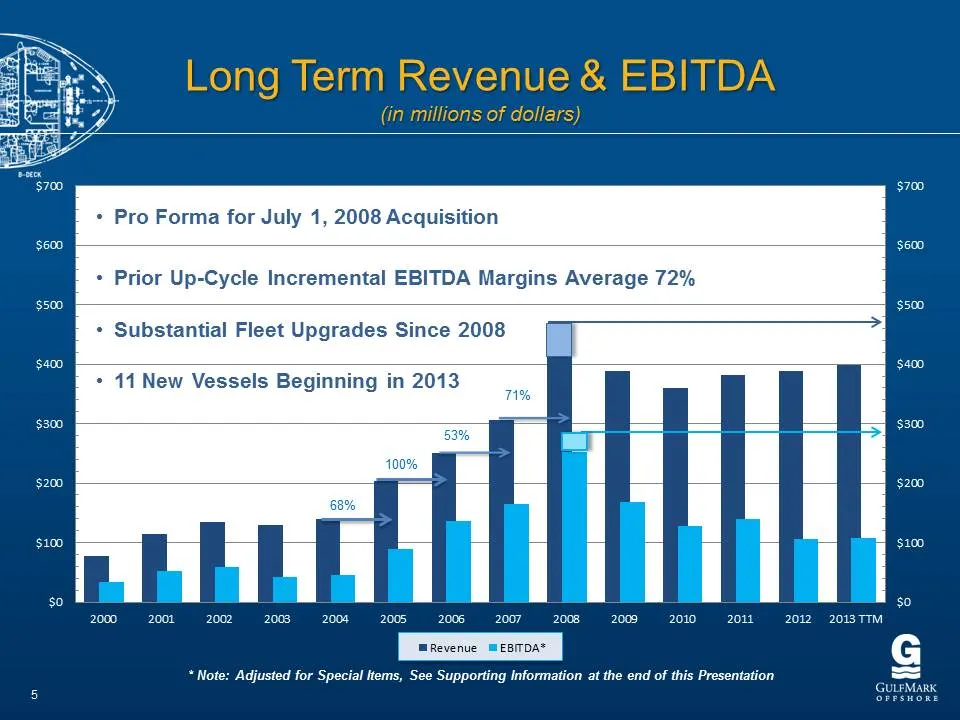
Slide 5: Long Term Revenue & EBITDA
Long Term Revenue & EBITDA (in millions of dollars) $700 Pro Forma for July 1, 2008 Acq $600 Prior Up-Cycle Incremental EBITDA Margins Average 72% $500 Substantial Fleet Upgrades Since 2008 $400 11 New Vessels Beginning in 2013 cr) $200 $100 2000 2001 «2002, 2008-2004 += 2005-2006. 2007 2010 2011. «
Slide 6: Total Revenue in Backlog
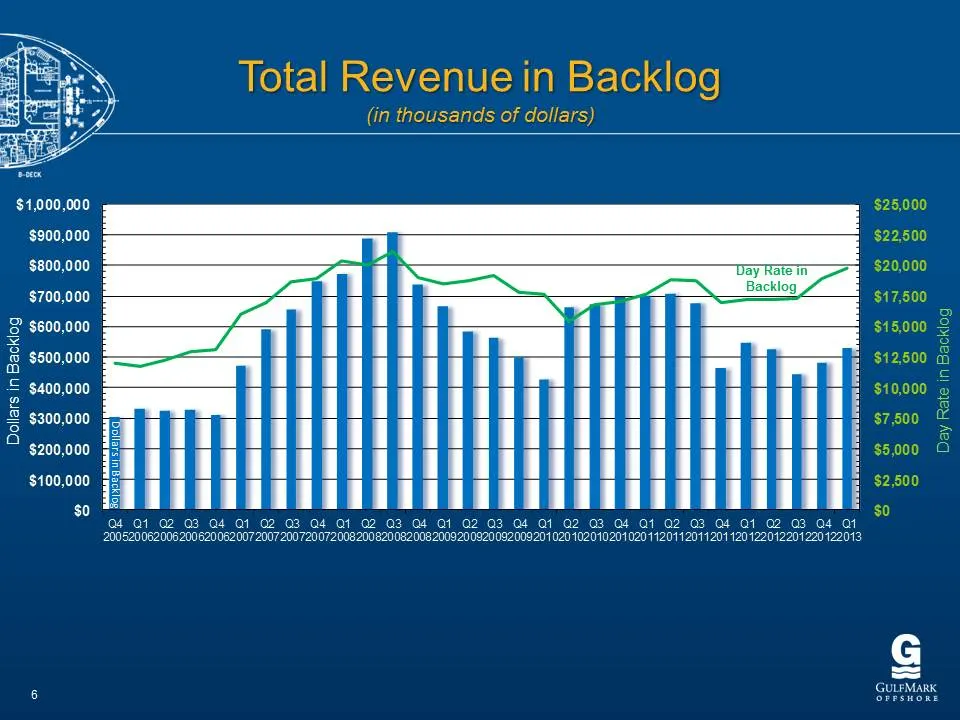
Total Revenue in Backlog (in thousands of dollars) $25,000 $1,000,000 $900,000 $800,000 $700,000 8 $600,000 $500,000 $400,000 000 <n $200,000 EPP PELL| a 4 01 @ 3 o4 O1 @ O3 a4 Q2 03 Ot a1 a2 03 G4 a1 @ a3 a4 at -200520062006200.82000820072007200720072008200820 082008.2009200920082009201 020 1020102
Slide 7: Revenue Breakout by Region
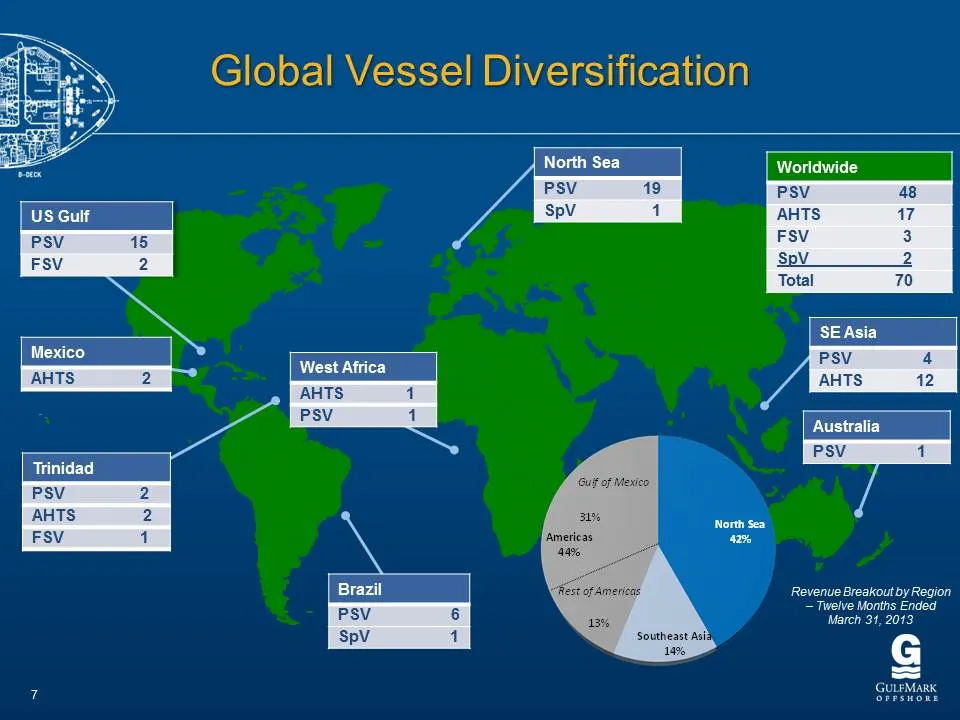
Revenue Breakoutby Region = Twelve Months Ended March 31, 2013

Slide 8: The GulfMark Fleet
The GulfMark Fleet
Slide 9: Number of Vessels GulfMark Built Per Year
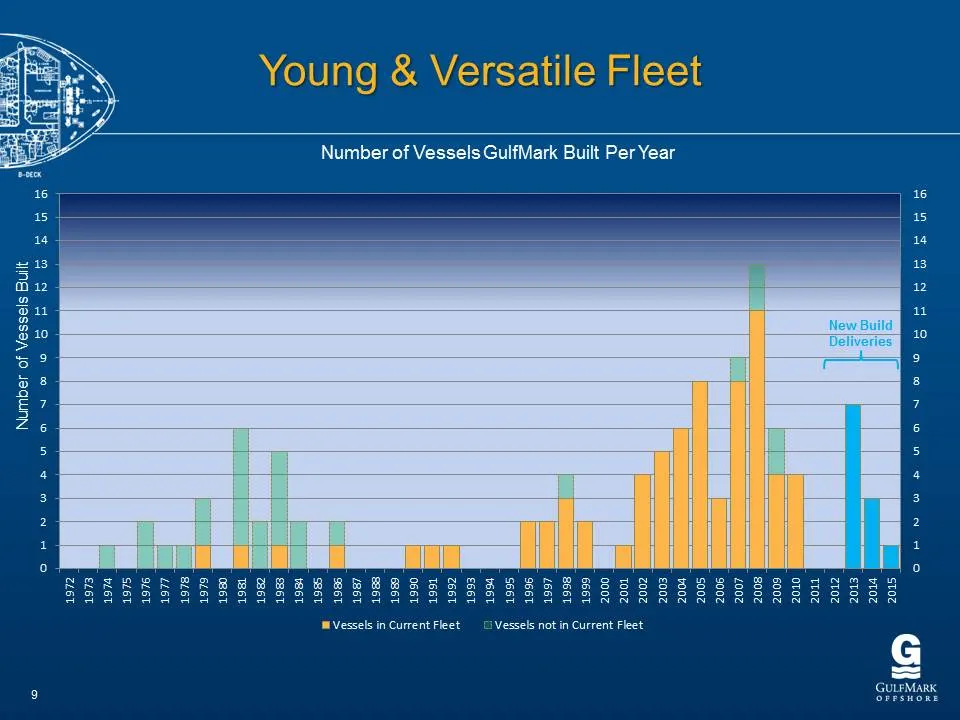
Number of Vessels GulfMark Built Per Year SY gd Qaaenoner anno ying slessep Jo Jequinn, Vessels not in Current Fleet Vessels in Current Fleet GULEMARK
Slide 10: Building For Our Future
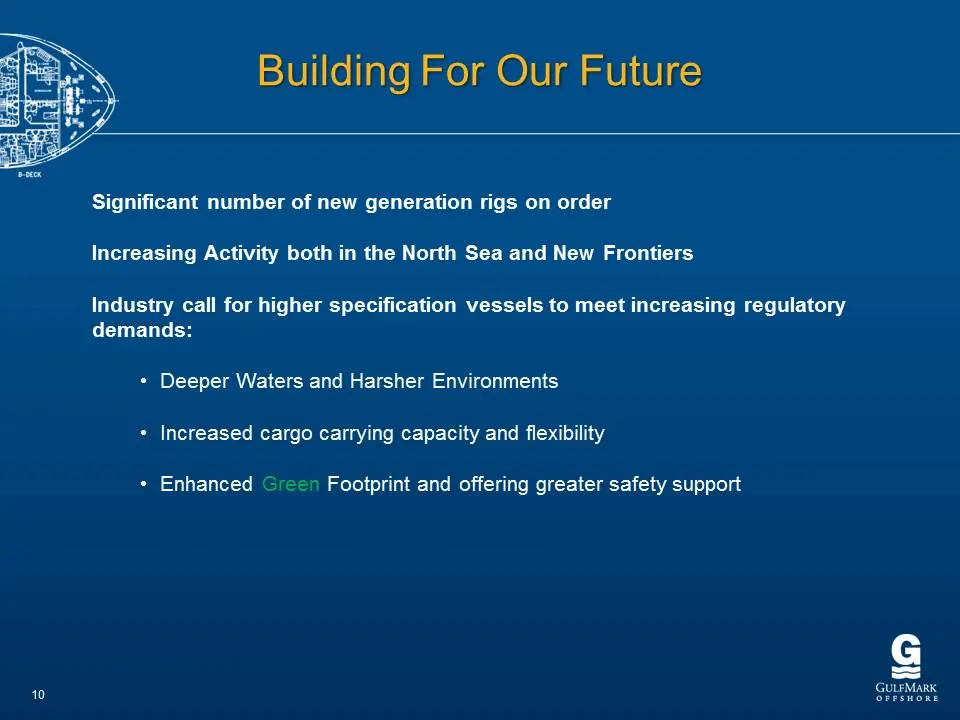
Building For Our Future Significant number of new generation rigs on order Increasing Activity both in the North Sea and New Frontiers Industry call for higher specification vessels to meet increasing regulatory demands: + Deeper Waters and Harsher Environments + Increased cargo carrying capacity an
Slide 11: New Build Program Overview
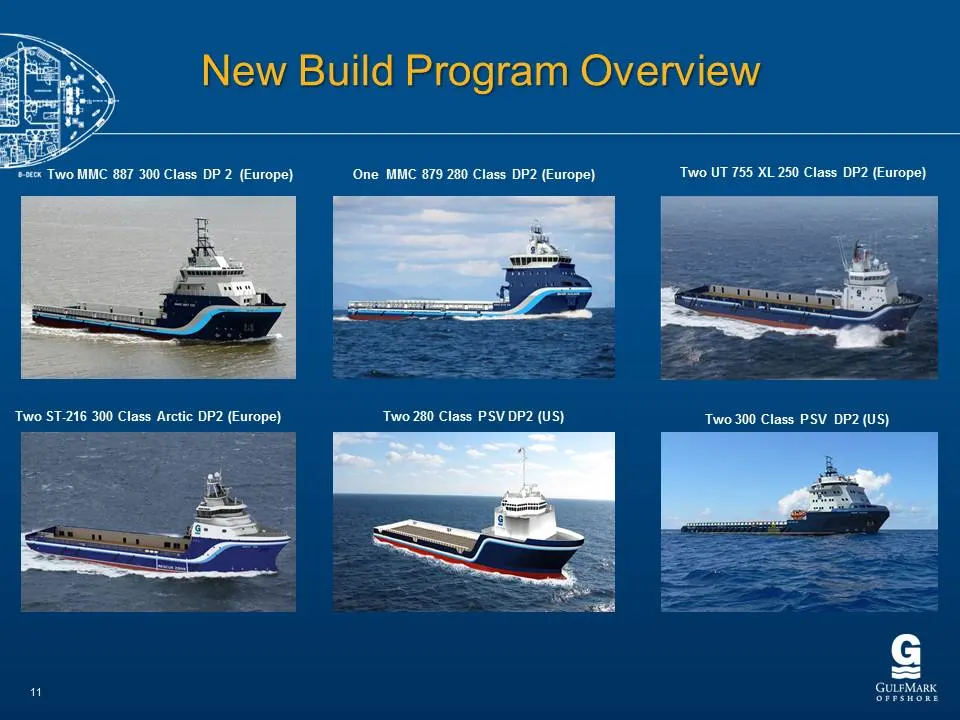
New Build Program Overview One MMC 879 280 Class DP2 (Europe) ‘Two UT 755 XL 250 Class DP2 (Europe) Two ST-216 300 Class Arctic DP2 (Europe) Two 280 Class PSV DP2 (US) Two 300 Class PSV DP2 (US) ee Se " easy
Slide 12: New Build and Vessel Enhancement
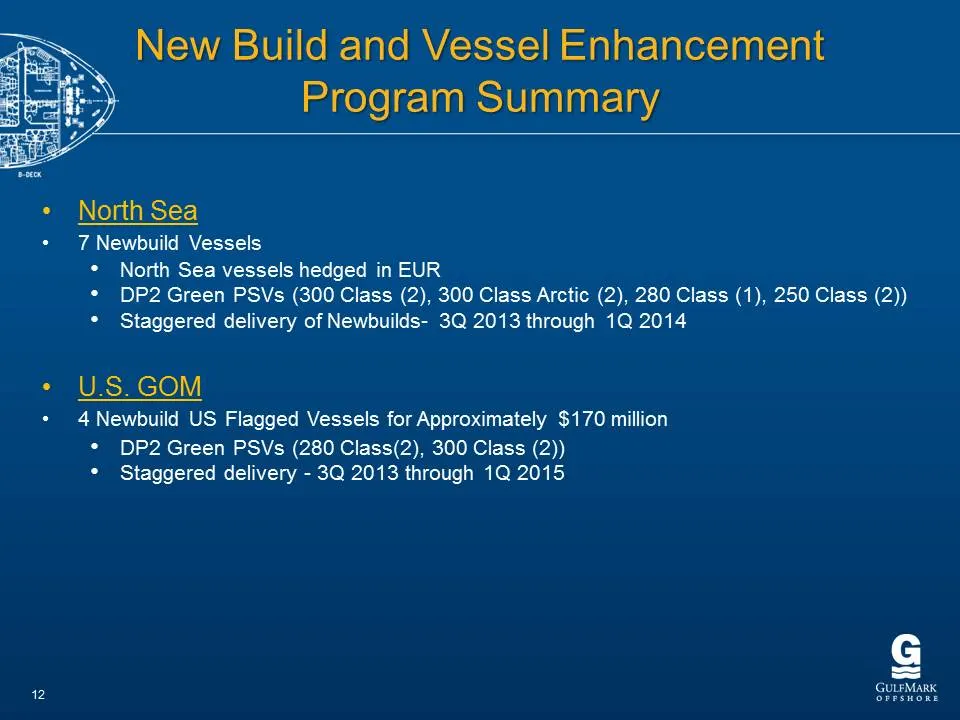
New Build and Vessel Enhancement Program Summary + North Sea + 7 Newbuild Vessels ° North Sea vessels hedged in EUR * DP2 Green PSVs (300 Class (2), 300 Class Arctic (2), 280 Class (1), 250 Class (2)) * Staggered delivery of Newbuilds- 3Q 2013 through 1Q 2014 * U.S.GOM + 4Newbuild US Flagged Vessels
Slide 13: New Build and Vessel Enhancement
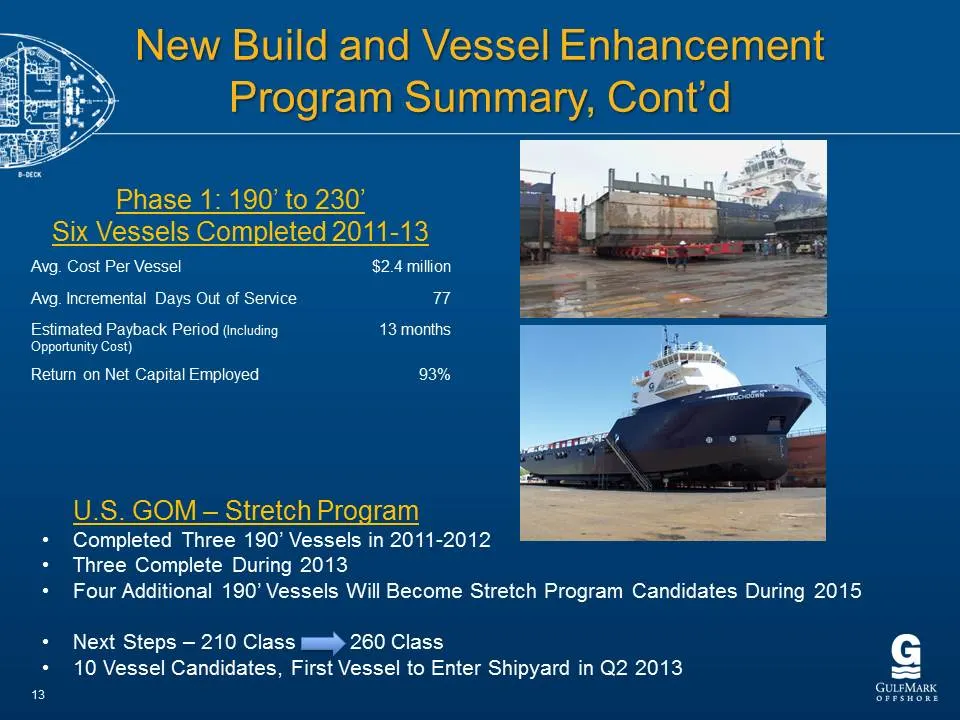
New Build and Vessel Enhancement Program Summary, Cont'd Phase 1: 190’ to 230’ Six Vessels Completed 2011-13 Avg. Cost Per Vessel $2.4 million ‘Avg. Incremental Days Out of Service 7 Estimated Payback Period (Including 43 months Opportunity Cost) Return on Net Capital Employed 93% U.S. GOM — Stretch
Slide 14: Building For Our Future: 2013 & Beyond
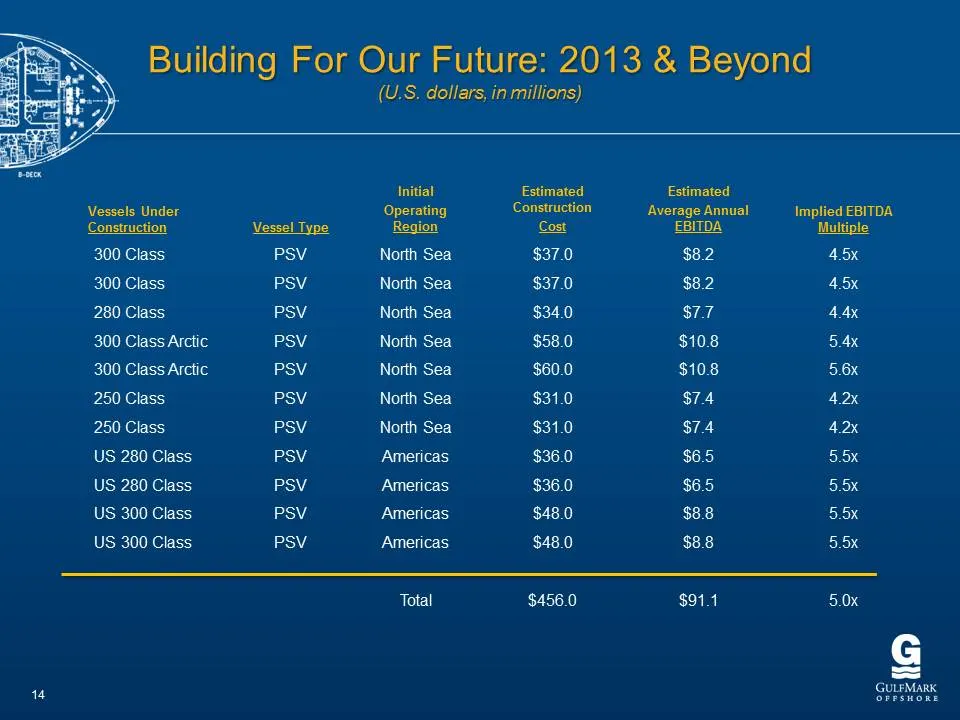
4 Building For Our Future: 2013 & Beyond (U.S. dollars, in millions) Estimated Estimated Vessels Under Construction Average Annual Construction Vessel Type Cost EBITDA 300 Class PSV $37.0 $8.2 300 Class PSV $37.0 $8.2 280 Class PSV $34.0 $77 300 Class Arctic PSV $58.0 $10.8 300 Class Arctic PSV $60.
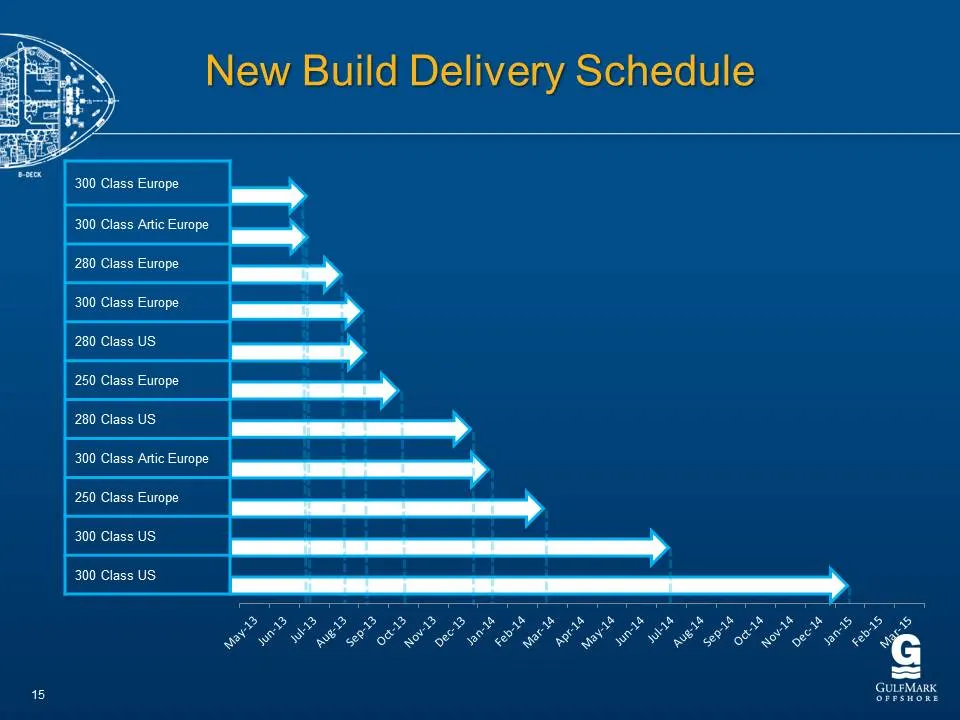
Slide 15: New Build Delivery Schedule
New Build Delivery Schedule 250 Class Europe 280 Class US 300 Class Artic Europe 250 Class Europe 300 Class US 300 Class US ‘5 Sie
Slide 16: Market Drivers
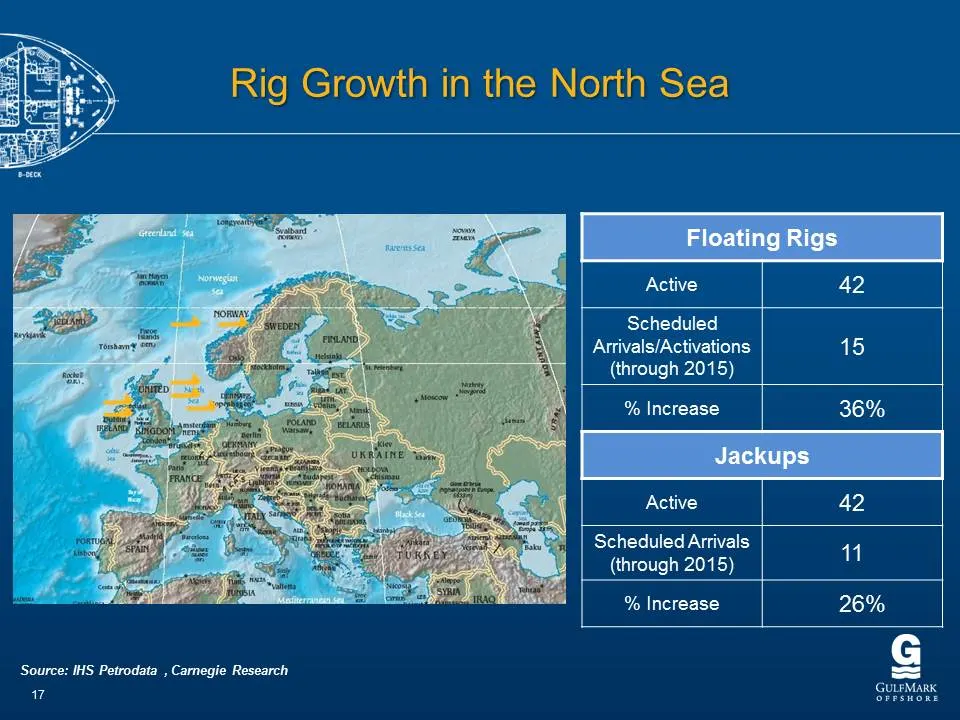
Slide 17: Rig Arrivals and Activations
‘Source: IHS Petrodata , Camegie Research 7 Active 42 Scheduled Arrivals/Activations 15 (through 2015) % Increase 36% Active 42 Scheduled Arrivals 1 (through 2015) % Increase 26% G GULEMARK
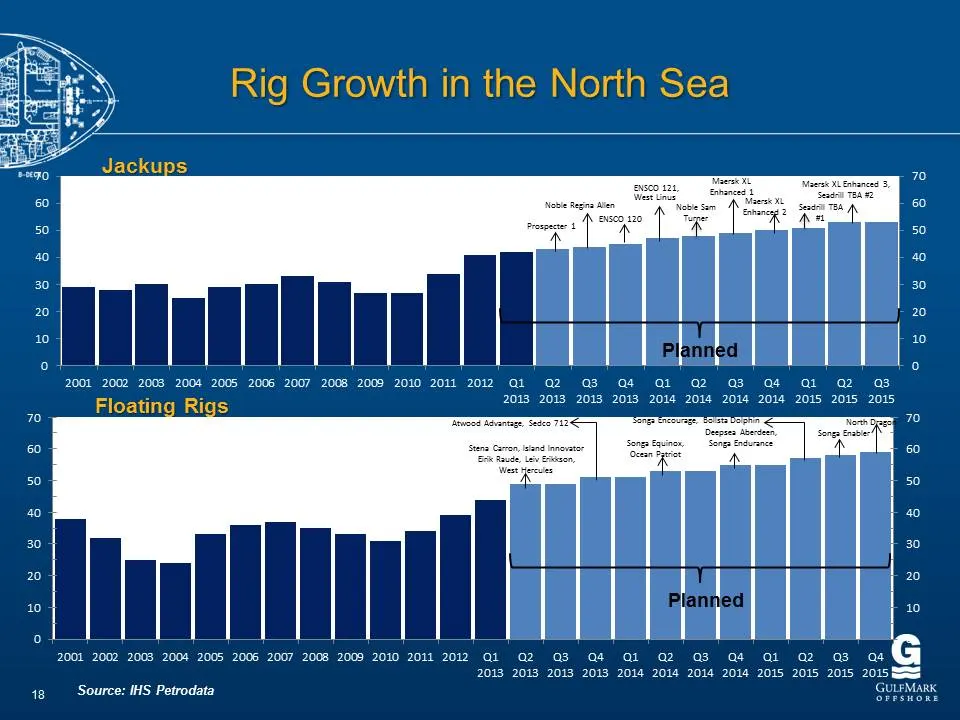
Slide 18: Floating Rigs
2001 2002 2003 2004 2005 2006 2007 2008 2009 2010 2011 2012 Qi a2 a3 a4 Qi @2 a3 a4 at a2 a3 2013 2013 2013 2013 2014 2014 2014 2014 2015 2015 2015 Floating Rigs 70 70 co so 0 } 50 40 } 20 _ 20 | | | | 20 10 | 0 ; | 2001 2002 2003 200 2005 2006 2007 2008 2009 2010 2011 20122 G1 a2 G3 a4 Ql Q2 G3 a4
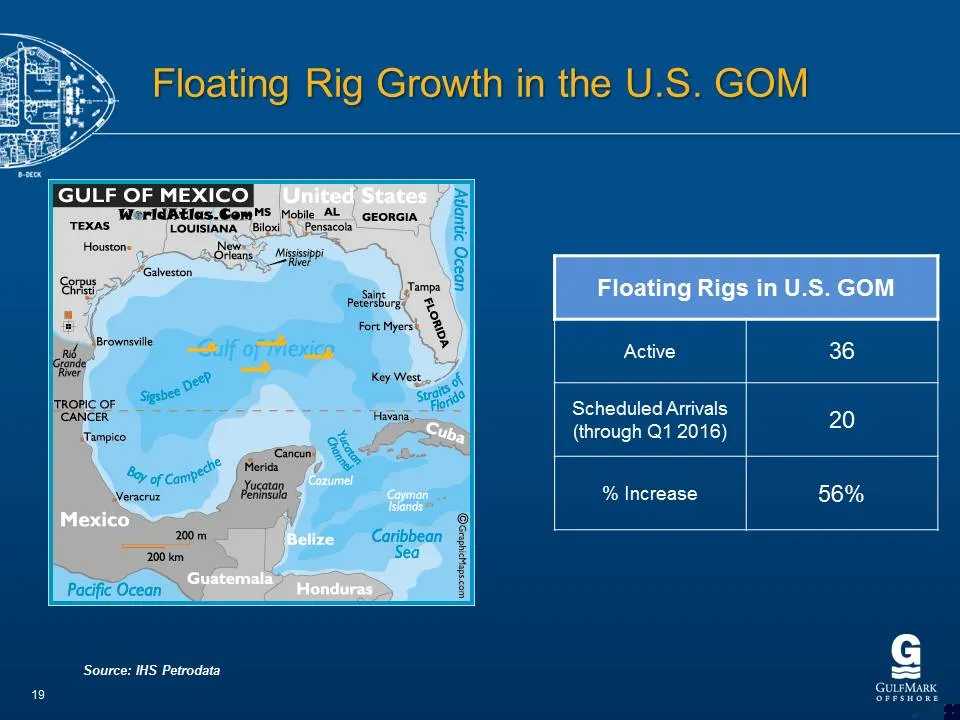
Slide 19: Active and Scheduled Rig Arrivals
19 Source: IHS Petrodata Active 36 Scheduled Arrivals 20 (through Q1 2016) % Increase 56% GULEMARK
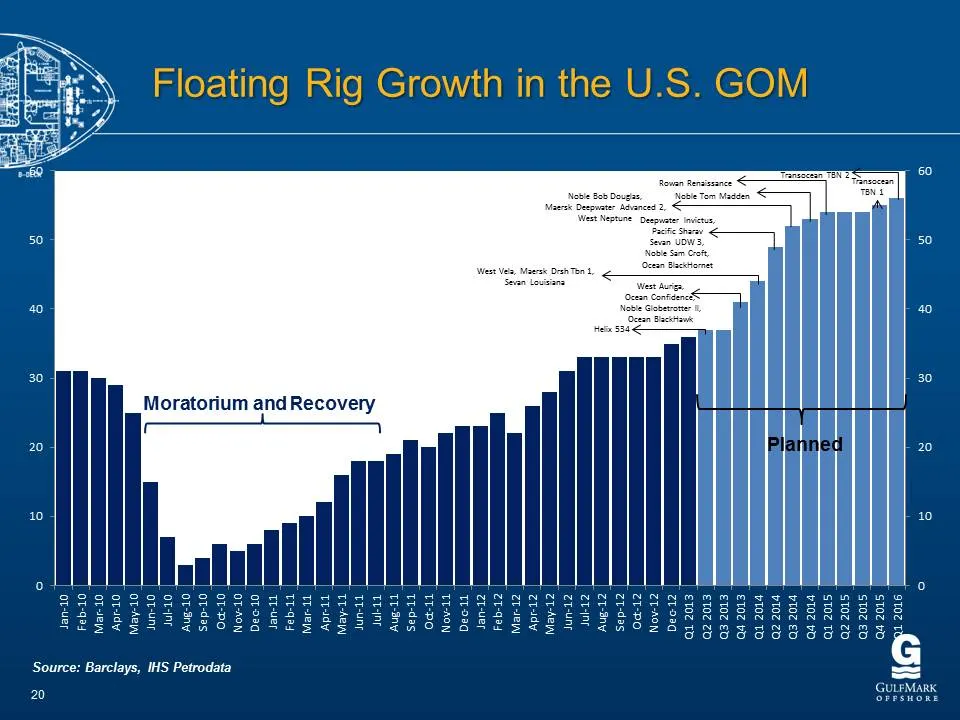
Slide 20: Floating Rig Growth in the U.S. GOM
Floating Rig Growth in the U.S. GOM Moratorium and Recovery Source: Barclays, IHS Petrodata 20 60 50 30 20 10 ad c- =
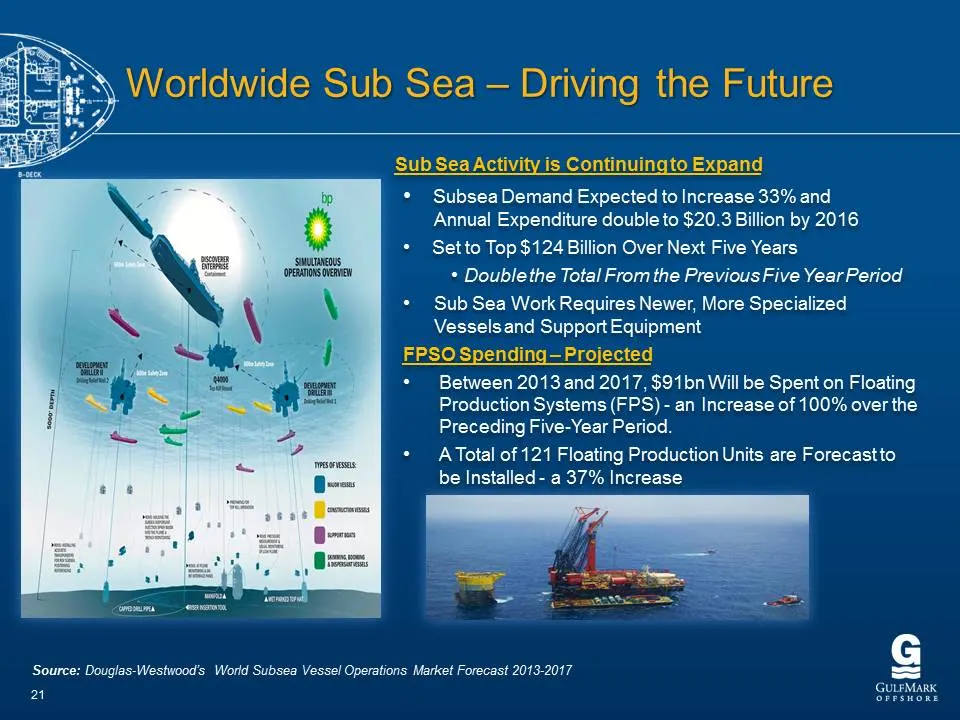
Slide 21: Subsea Demand Expected to Increase 33%
* Subsea Demand Expected to Increase 33% and Annual Expenditure double to $20.3 Billion by 2016 * Setto Top $124 Billion Over Next Five Years + Double the Total From the Previous Five Year Period * Sub Sea Work Requires Newer, More Specialized Vessels and Support Equipment + Between 2013 and 2017, $
Slide 22: Financial Information
Financial Information
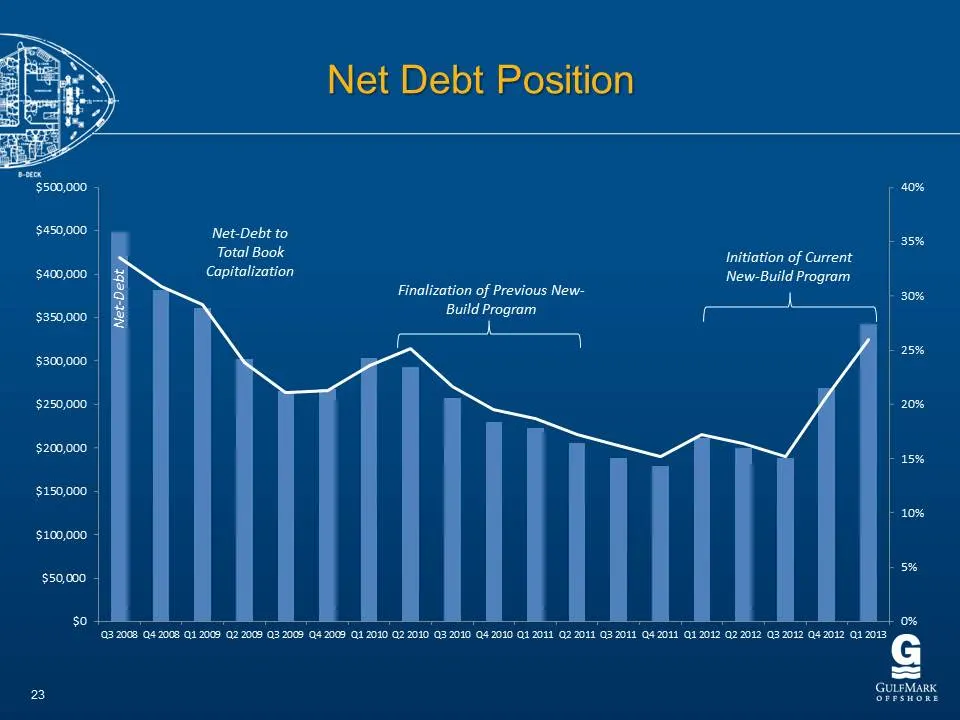
Slide 23: Net Debt Position
Net Debt Position 40% $450,000 Net-Debt to 35% Total Book Initiation of Current ‘$400,000 Capitalization New-Build Program Finalization of Previous New- eee — Build Program -—_—__ 25% $300,000 $250,000 20% $200,000 15% $150,000 10% $100,000 5% $50,000 $0 0% ‘22 2008 4 2008 Q1 209 G2 2008 G3 2009 a4
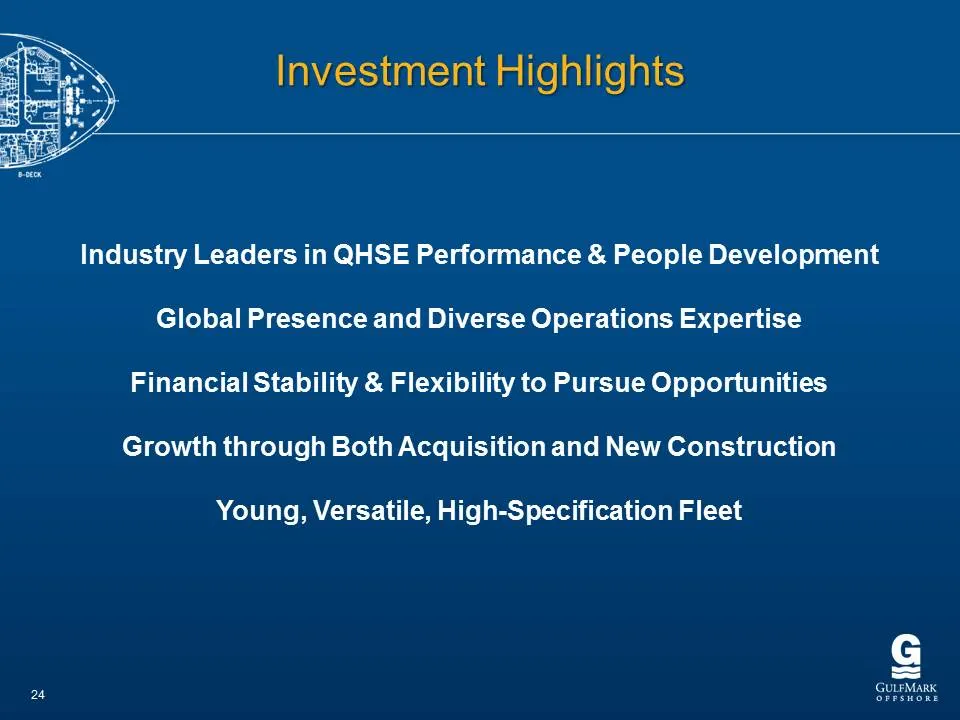
Slide 24: Investment Highlights
Investment Highlights Industry Leaders in QHSE Performance & People Development Global Presence and Diverse Operations Expertise Financial Stability & Flexibility to Pursue Opportunities Growth through Both Acquisition and New Construction Young, Versatile, High-Specification Fleet 24 easy
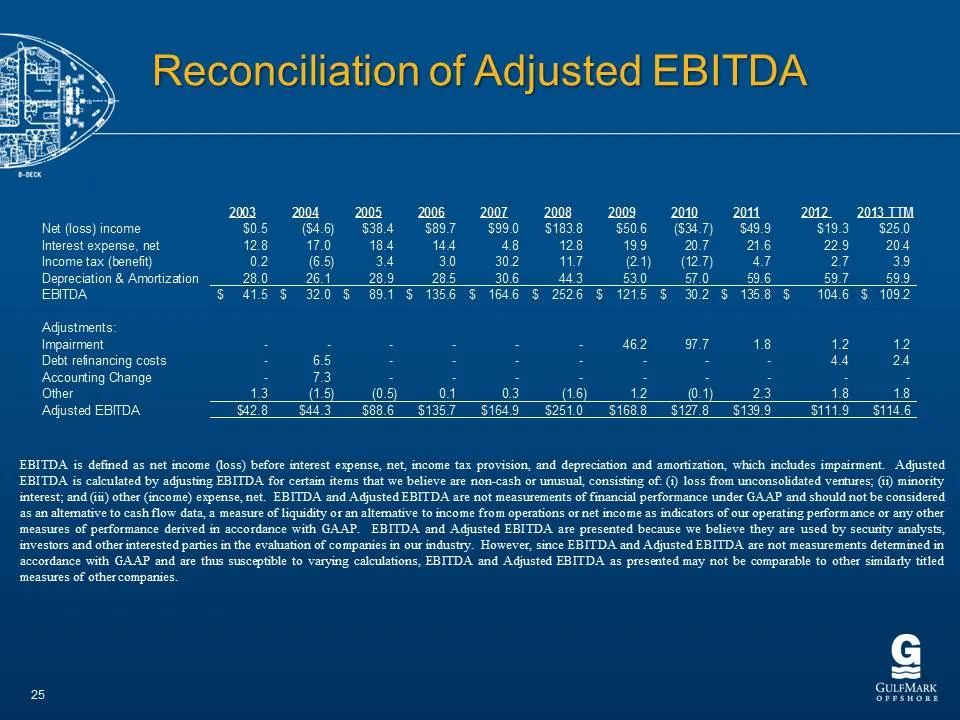
Slide 25: Reconciliation of Adjusted EBITDA
Reconciliation of Adjusted EBITDA Net (loss) income Interest expense, net Income tax (benefit) Depreciation & Amortization EBITDA Adjustments: Impairment Debt refinancing costs Accounting Change Other Agusted EBTDA 2003. «2004 = 2005 2006S 2007S 2008 «2009-0201 222 TIM $05 ($4.6) $384 S897 $990 $183

Slide 26: easy
26 easy

Slide 27: ar easy
ar easy
Source: SEC EDGAR · 8-K filed May 14, 2013
More decks from Gulfmark Offshore Inc
 Merger or Acquisition (July 2018)11 slides · Jul 16, 2018
 Merger or Acquisition (July 2018)15 slides · Jul 16, 2018
 Investor Presentation (March 2018)22 slides · Mar 6, 2018
 Debt Investor Presentation (October 2017)16 slides · Oct 2, 2017
 Debt Investor Presentation (May 2017)41 slides · May 18, 2017
 Debt Investor Presentation (November 2016)28 slides · Nov 28, 2016