Auna SA · NYSE:AUNA
Auna SA — Investor Presentation (October 2025)
33 slides from Auna SA's investor presentation, October 2025

Slide 1: Auna Presentation
October 2025 Auna Presentation
Slide 2: Disclaimer
Disclaimer This presentation has been prepared by Auna S.A. (“Auna” or the “Company”) solely for use at this presentation. This presentation is confidential to the recipient. Accordingly, any attempt to copy, summarize or distribute this presentation or any portion hereof in any form to any other pa

Slide 3: Today's Speakers
Today’s Speakers +30 +20 +25 Jesus Zamora Gisele Remy Lorenzo Massart Executive Chairman of the Board and Chief Financial Officer and Executive Vice President, Strategy and President Executive Vice President Equity Capital Markets • Member of the Board since 2008 and President • Chief Financial Offi
Slide 4: Growth company with a long runway and an attractive opportunity in Latin America
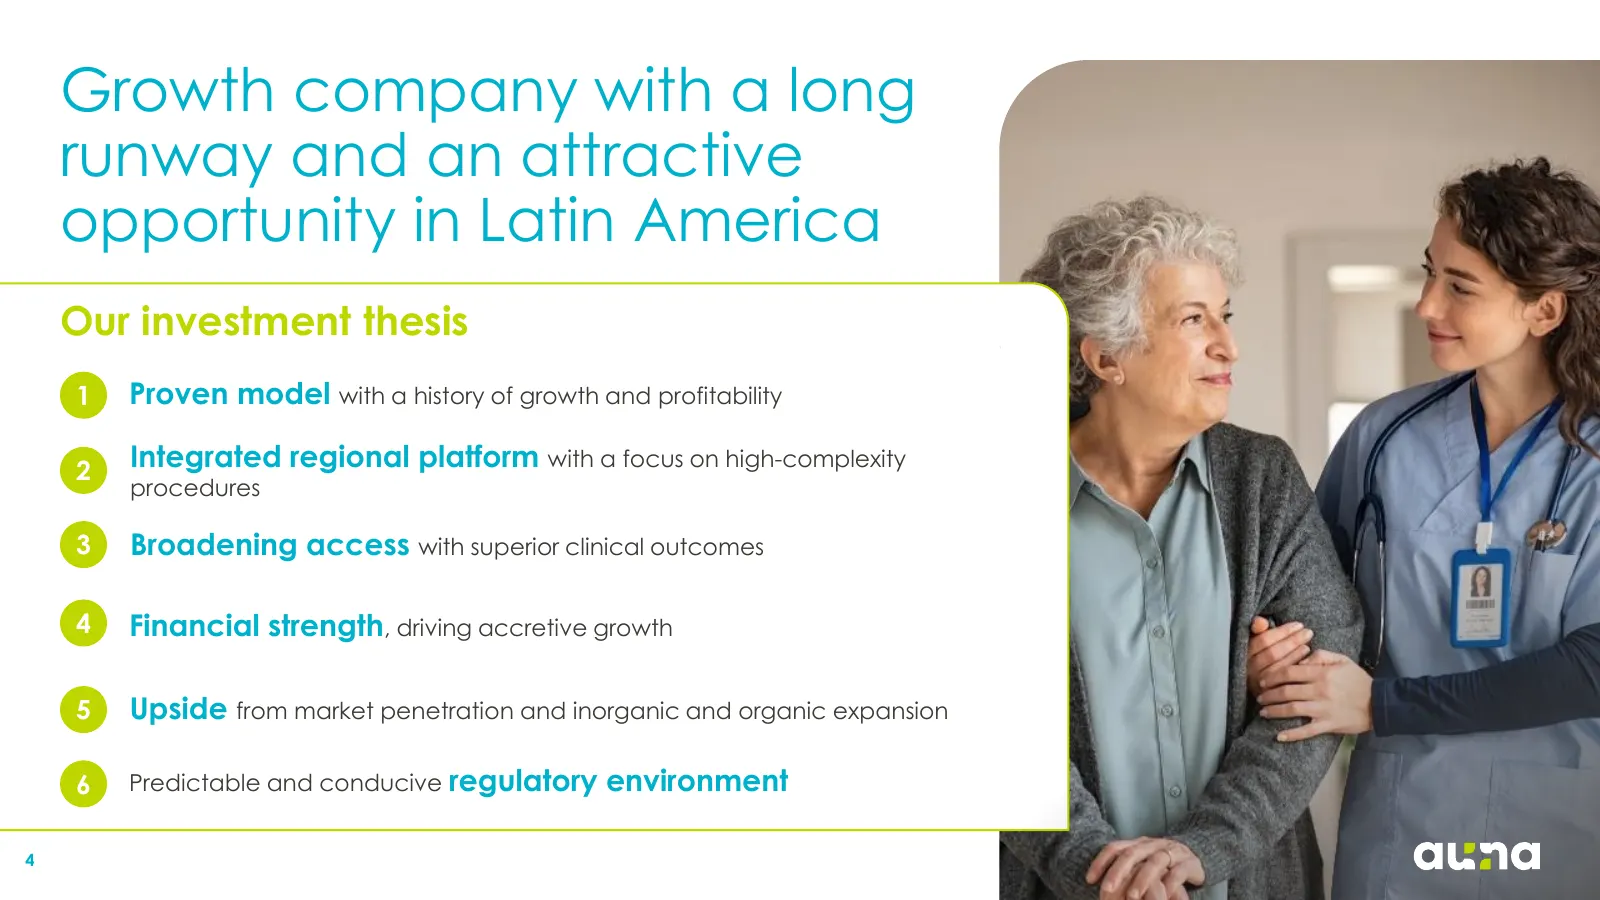
Growth company with a long runway and an attractive opportunity in Latin America Our investment thesis 1 Proven model with a history of growth and profitability 2 Integrated regional platform with a focus on high-complexity procedures 3 Broadening access with superior clinical outcomes 4 Financial s
Slide 5: Auna at a glance
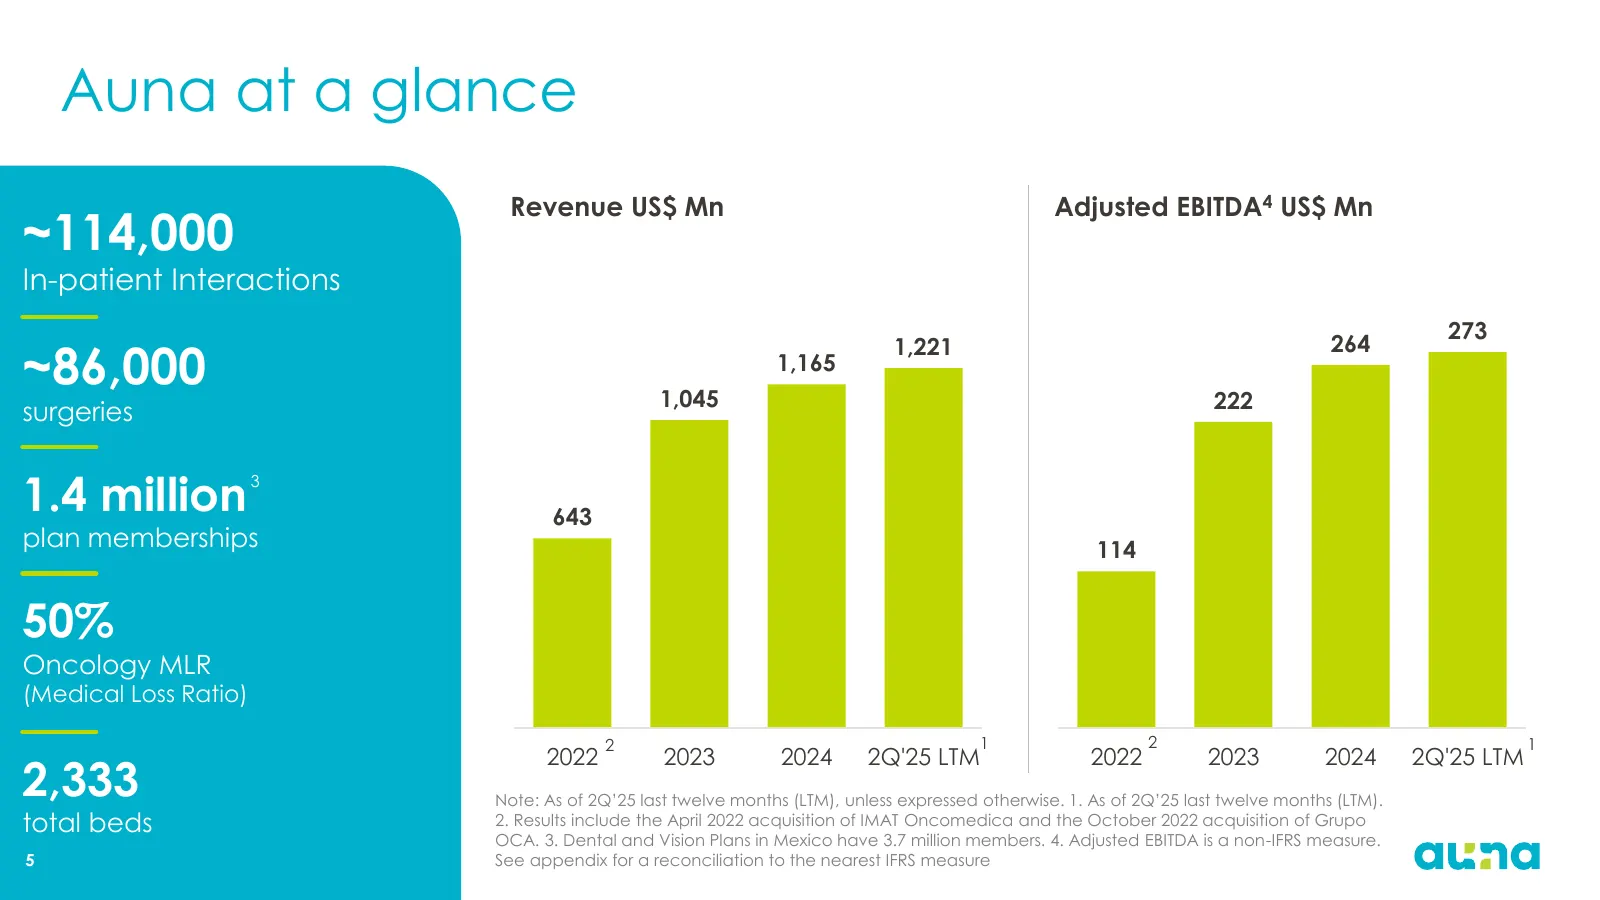
Auna at a glance Revenue US$ Mn Adjusted EBITDA4 US$ Mn ~114,000 In-patient Interactions 273 1,221 264 ~86,000 1,045 1,165 222 surgeries 1.4 million 3 643 plan memberships 114 50% Oncology MLR (Medical Loss Ratio) 2 1 2 1 2022 2023 2024 2Q'25 LTM 2022 2023 2024 2Q'25 LTM 2,333 Note: As of 2Q’25 last
Slide 6: We provide healthcare services and integrated healthcare plans
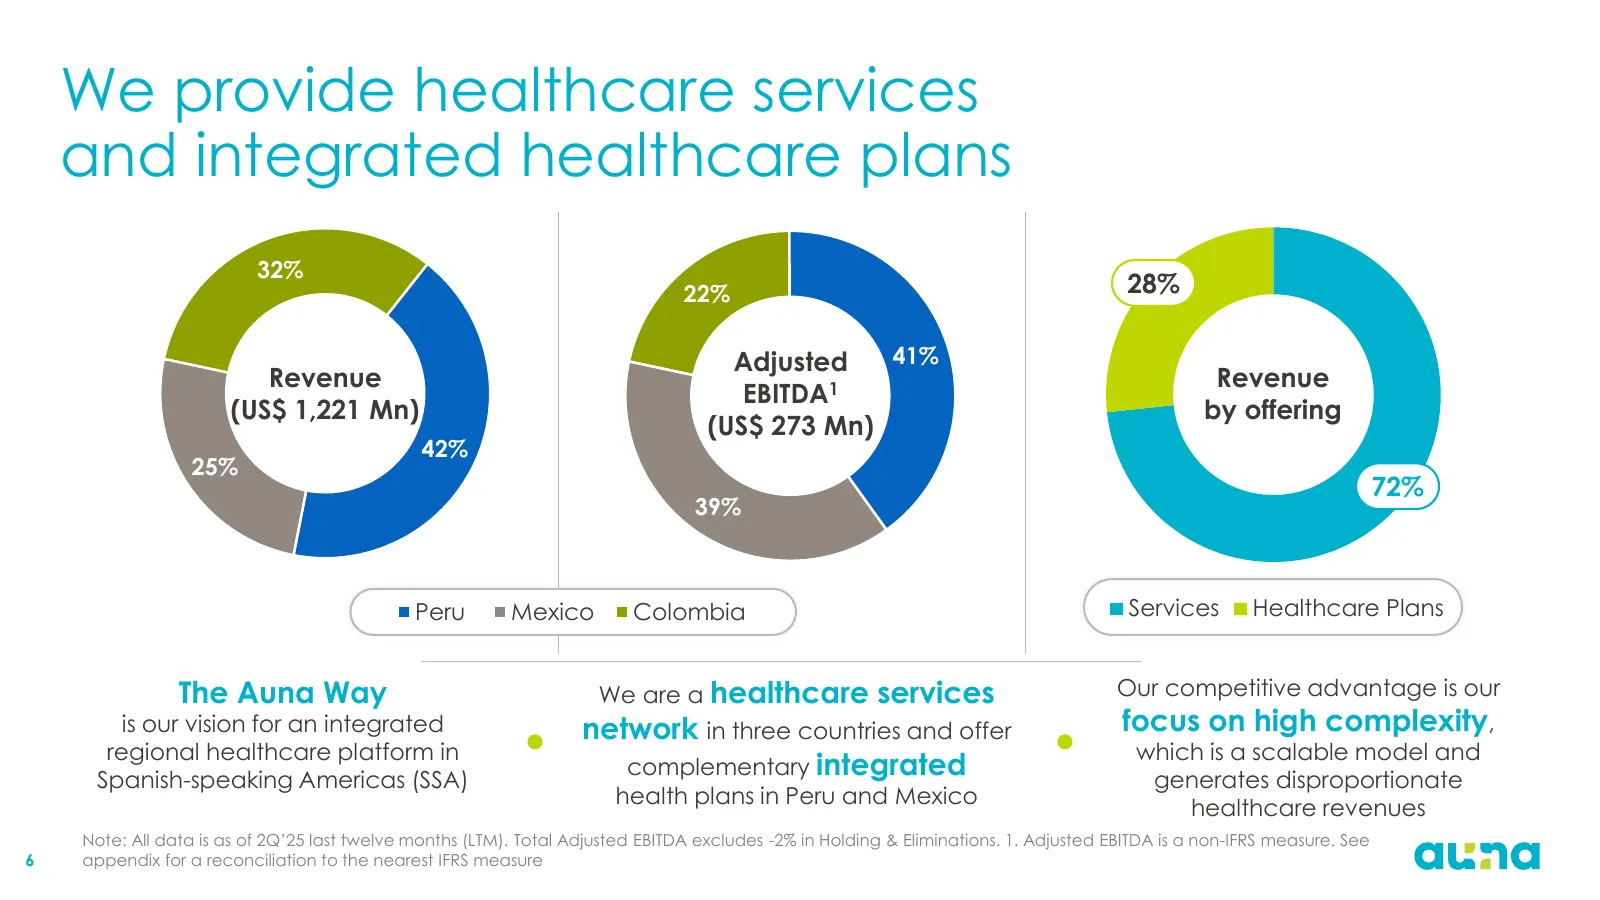
We provide healthcare services and integrated healthcare plans 32% 22% 28% Adjusted 41% Revenue Revenue EBITDA1 (US$ 1,221 Mn) by offering (US$ 273 Mn) 42% 25% 72% 39% Peru Mexico Colombia Services Healthcare Plans The Auna Way We are a healthcare services Our competitive advantage is our is our vis
Slide 7: Leaders with 30+ years of healthcare experience
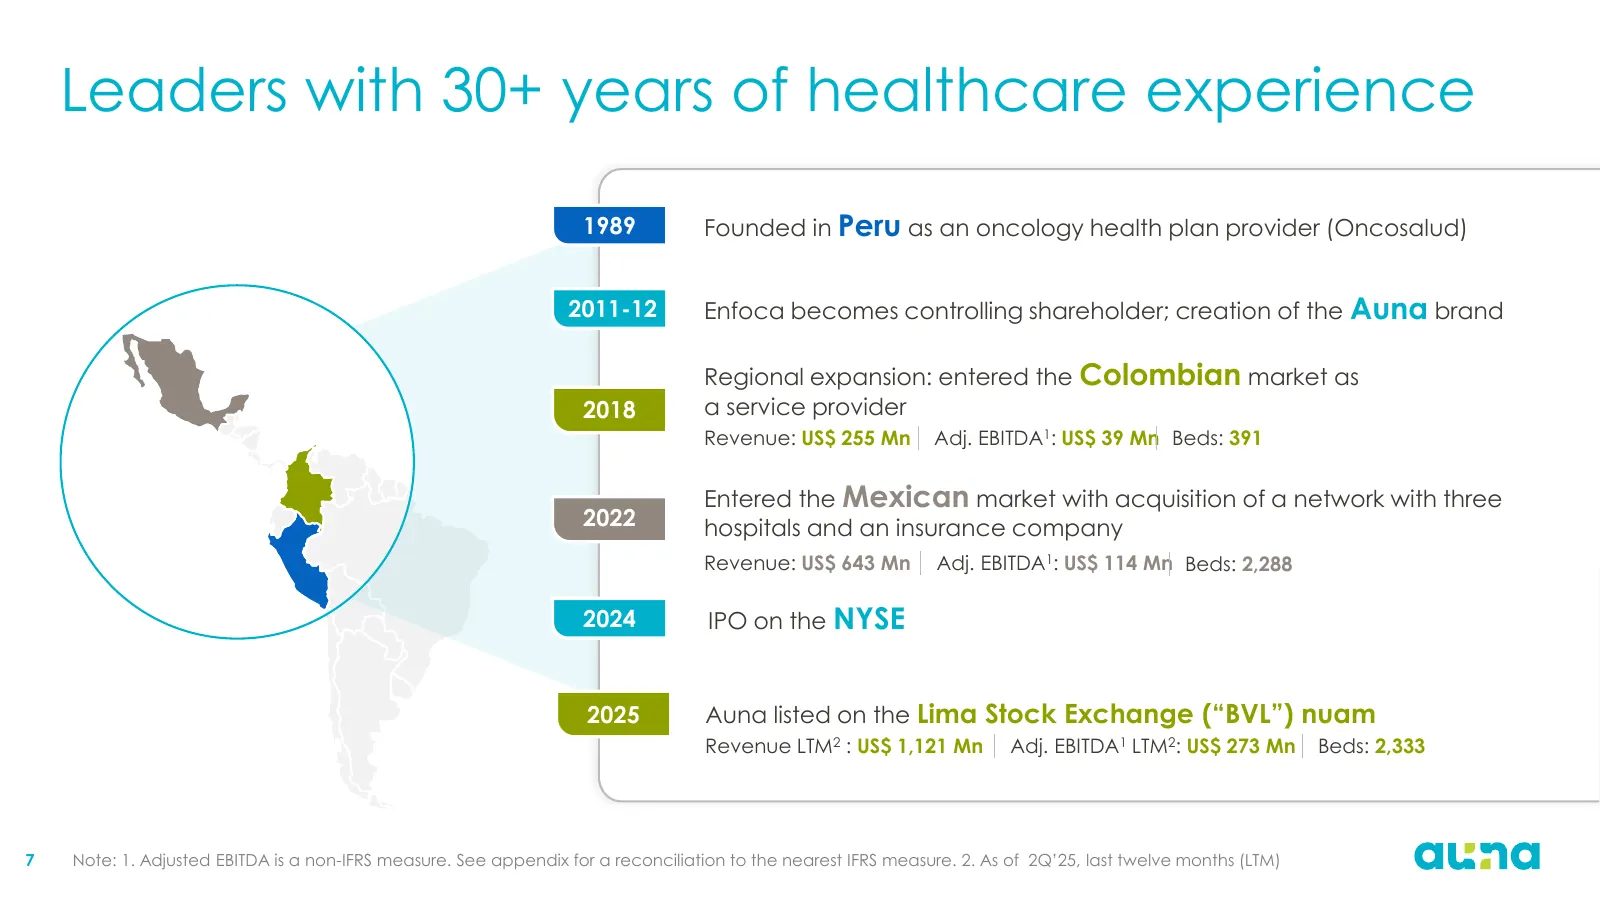
Leaders with 30+ years of healthcare experience 1989 Founded in Peru as an oncology health plan provider (Oncosalud) 2011-12 Enfoca becomes controlling shareholder; creation of the Auna brand Regional expansion: entered the Colombian market as 2018 a service provider Revenue: US$ 255 Mn Adj. EBITDA1
Slide 8: The Auna Way
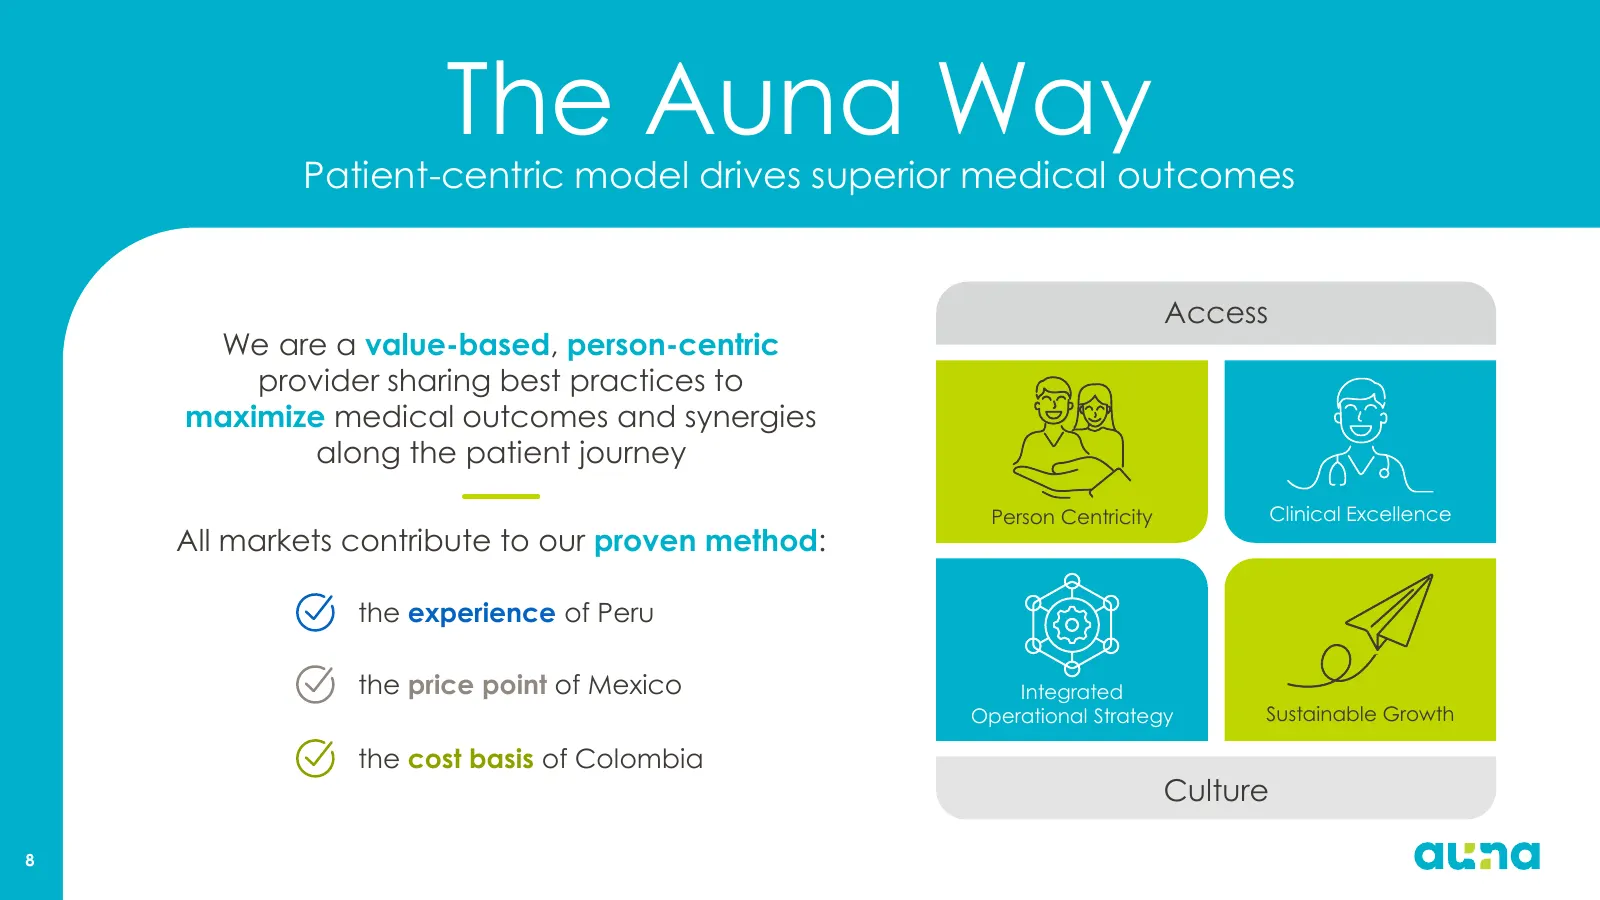
The Auna Way Patient-centric model drives superior medical outcomes Access We are a value-based, person-centric provider sharing best practices to maximize medical outcomes and synergies along the patient journey Person Centricity Clinical Excellence All markets contribute to our proven method: the
Slide 9: The benefits of vertical integration
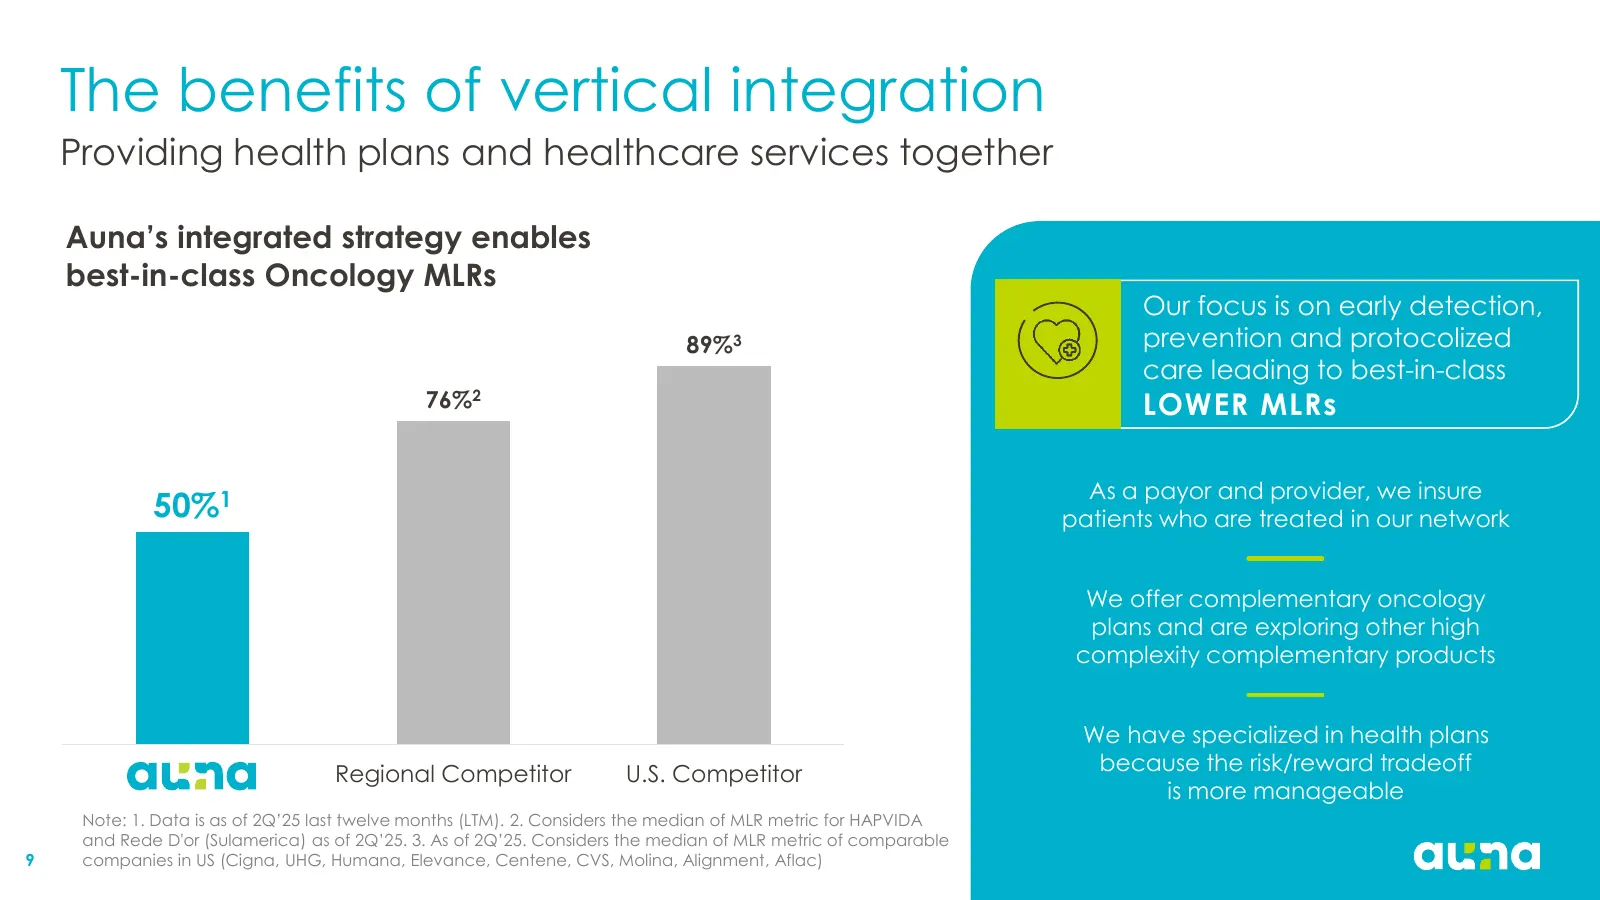
The benefits of vertical integration Providing health plans and healthcare services together Auna’s integrated strategy enables best-in-class Oncology MLRs Our focus is on early detection, 89%3 prevention and protocolized care leading to best-in-class 76%2 LOWER MLRs As a payor and provider, we insu
Slide 10: The benefits of horizontal integration
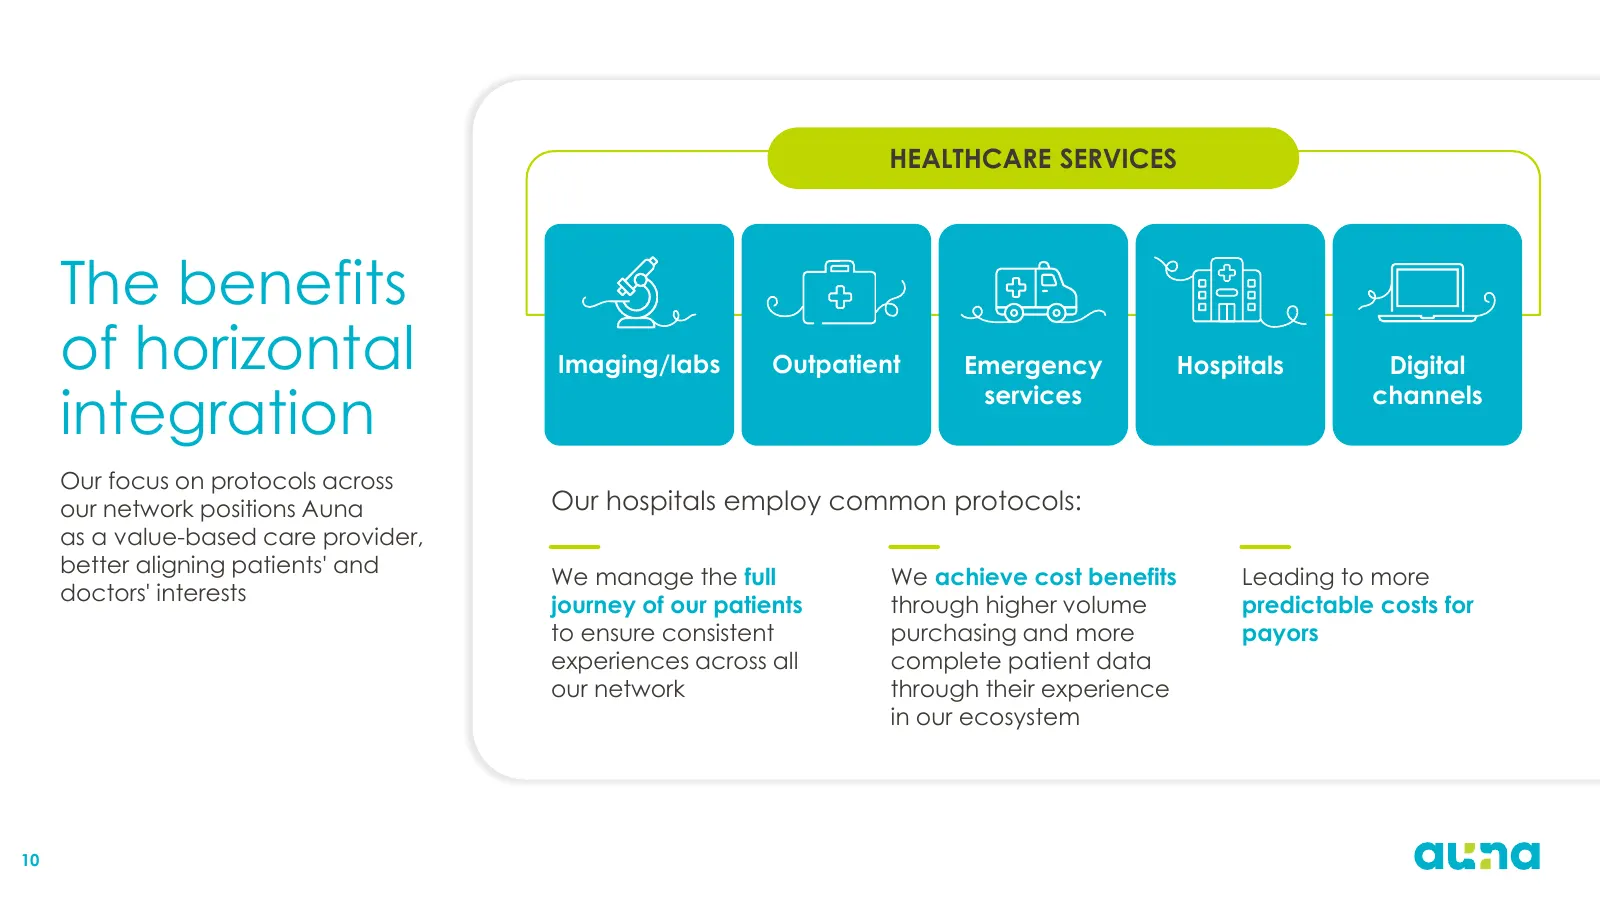
HEALTHCARE SERVICES The benefits of horizontal Imaging/labs Outpatient Emergency Hospitals Digital integration services channels Our focus on protocols across our network positions Auna Our hospitals employ common protocols: as a value-based care provider, better aligning patients' and We manage the
Slide 11: We're solving the problem of access
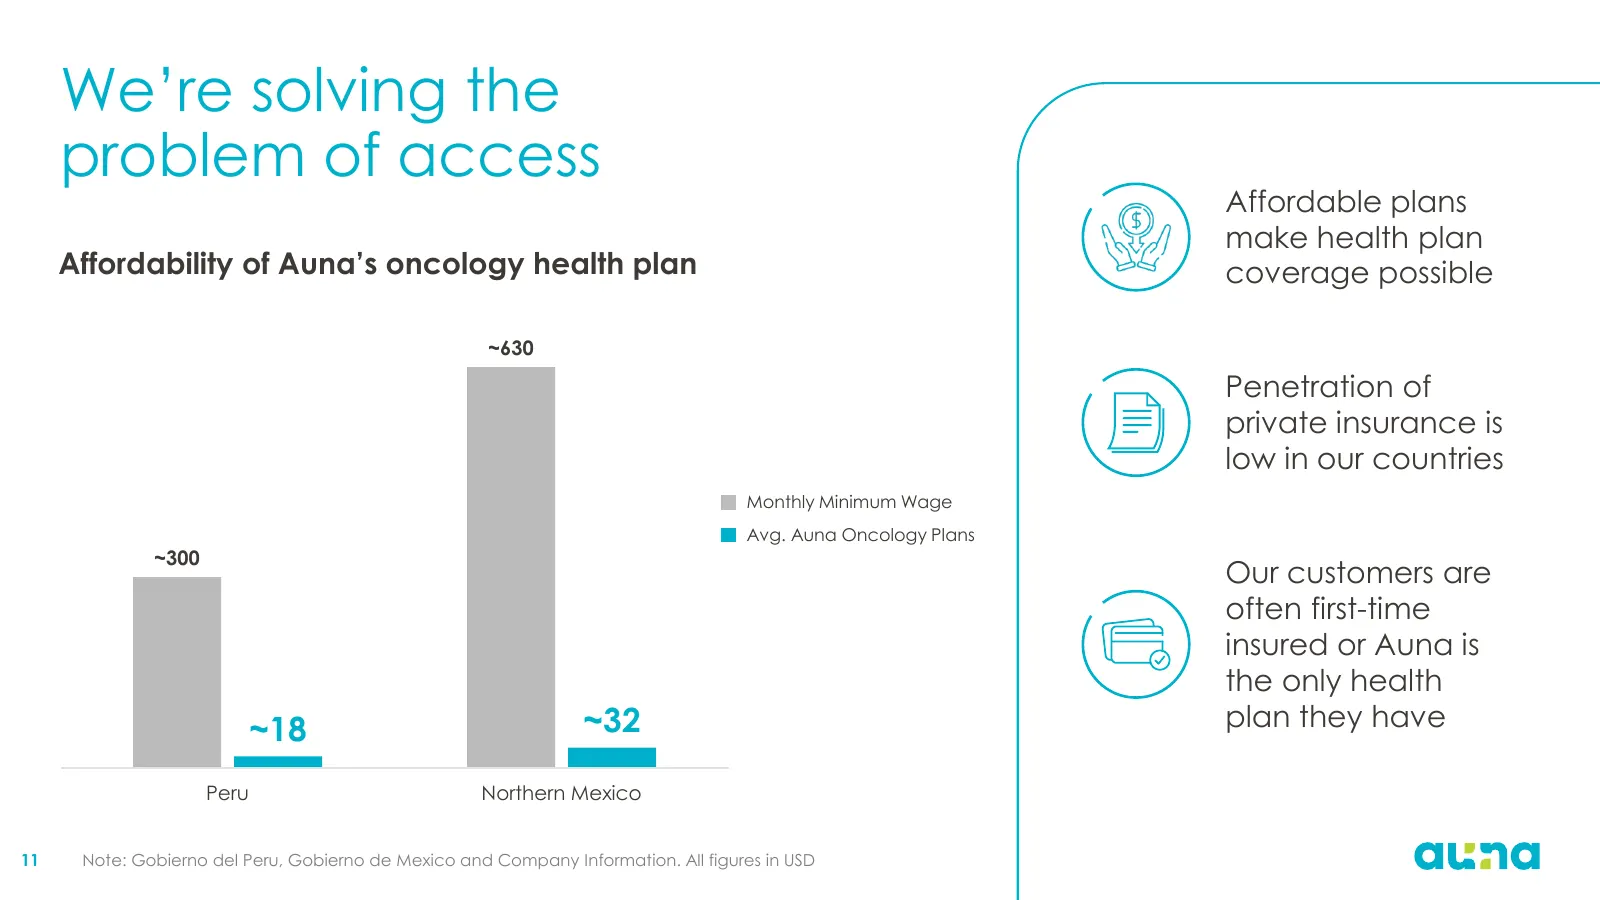
We’re solving the problem of access Affordable plans make health plan Affordability of Auna’s oncology health plan coverage possible ~630 Penetration of private insurance is low in our countries Monthly Minimum Wage Avg. Auna Oncology Plans ~300 Our customers are often first-time insured or Auna is
Slide 12: We execute a consistent strategy across the region
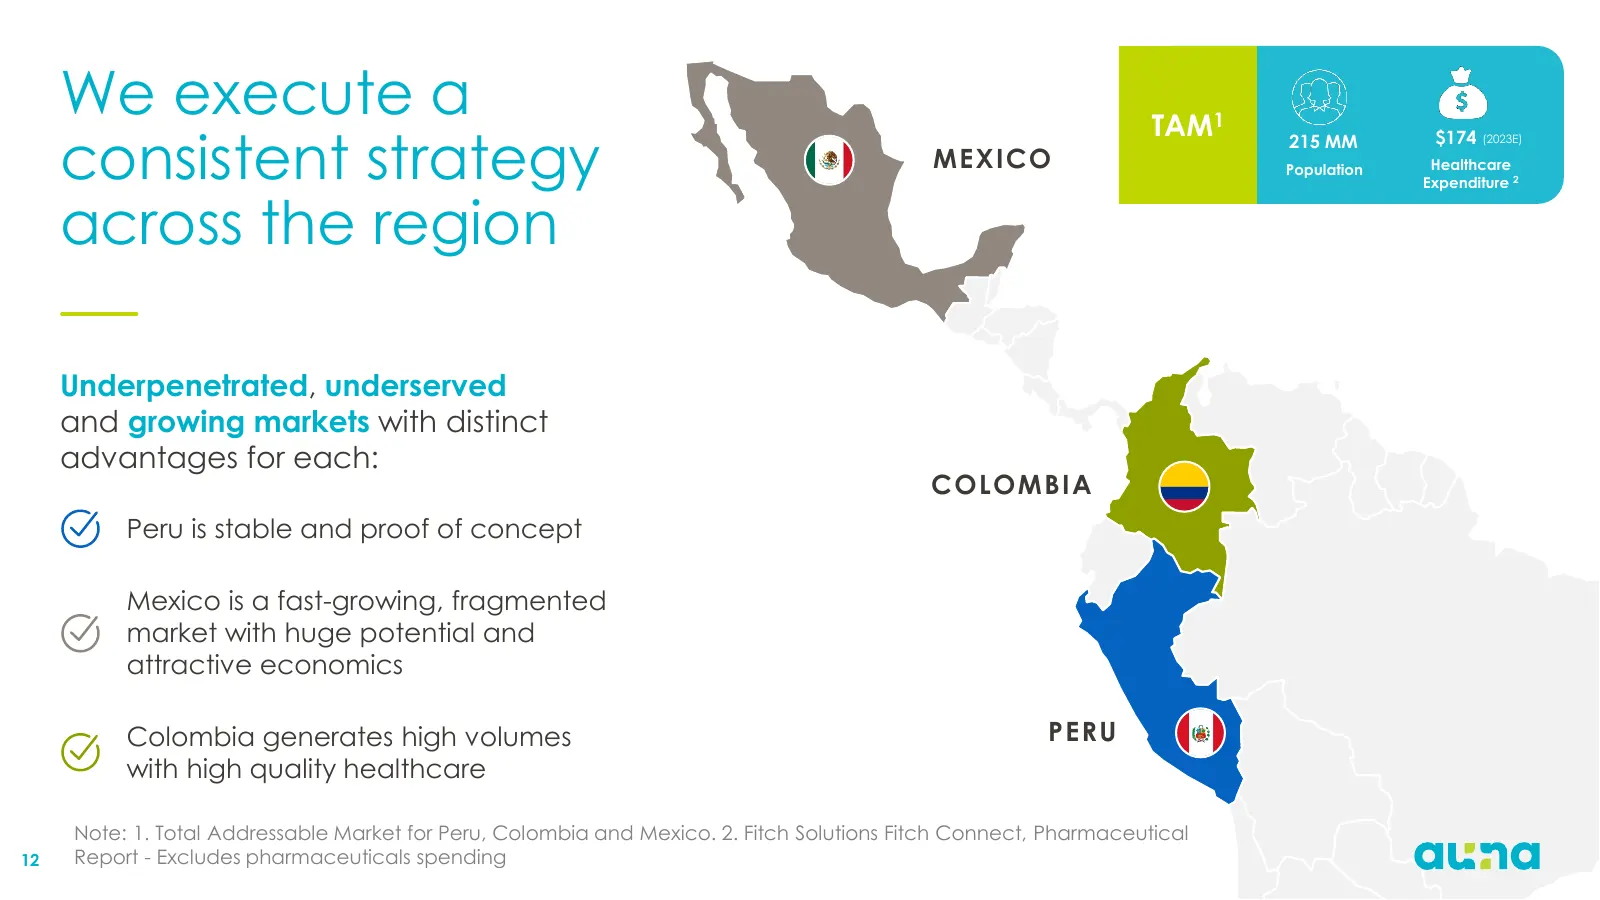
We execute a TAM1 consistent strategy 215 MM $174 (2023E) MEXICO Population Healthcare Expenditure 2 across the region Underpenetrated, underserved and growing markets with distinct advantages for each: COLOMBIA Peru is stable and proof of concept Mexico is a fast-growing, fragmented market with hug
Slide 13: Peru
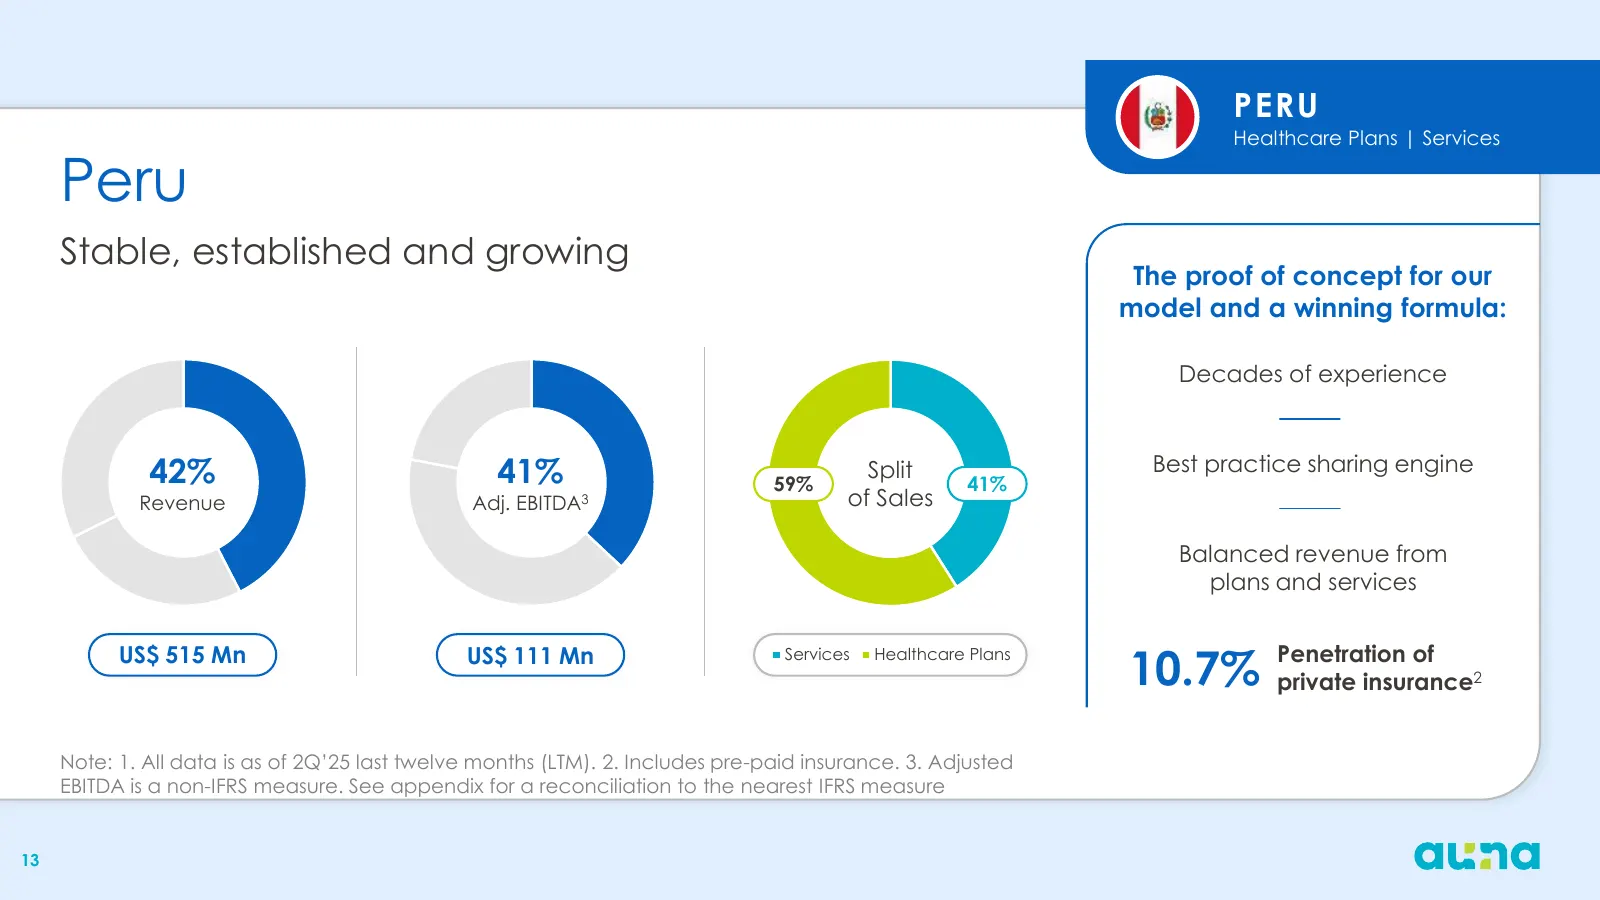
PERU Healthcare Plans | Services Peru Stable, established and growing The proof of concept for our model and a winning formula: Decades of experience 42% 41% Split Best practice sharing engine 59% 41% Revenue Adj. EBITDA3 of Sales Balanced revenue from plans and services US$ 515 Mn US$ 111 Mn 10.7%
Slide 14: Serving as a model for other markets
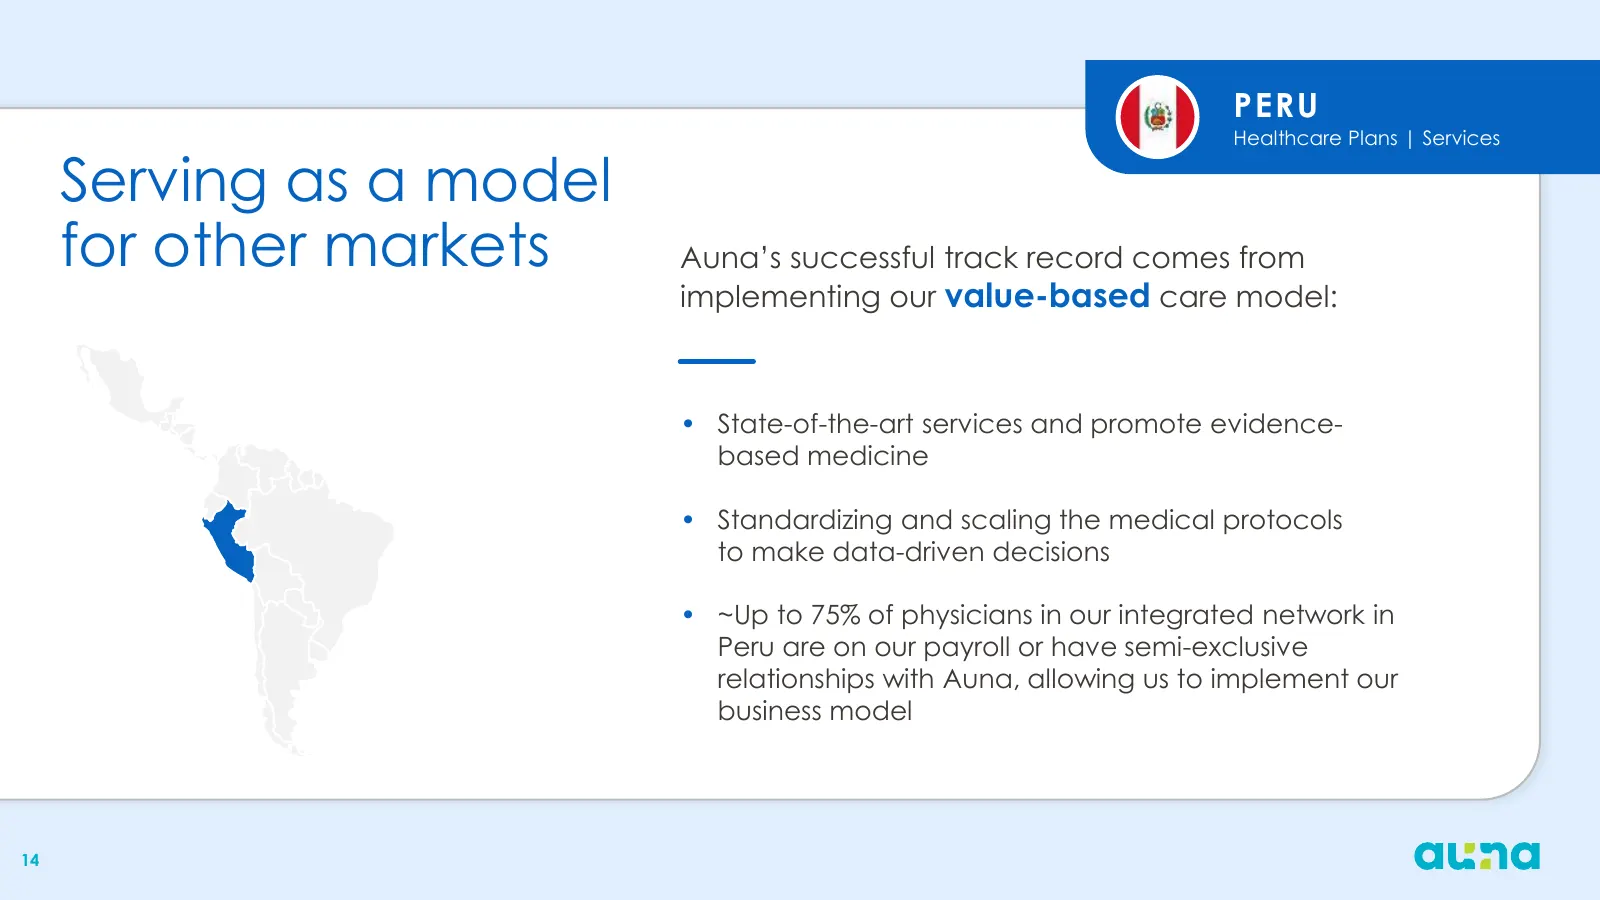
PERU Healthcare Plans | Services Serving as a model for other markets Auna’s successful track record comes from implementing our value-based care model: • State-of-the-art services and promote evidence- based medicine • Standardizing and scaling the medical protocols to make data-driven decisions •
Slide 15: Mexico
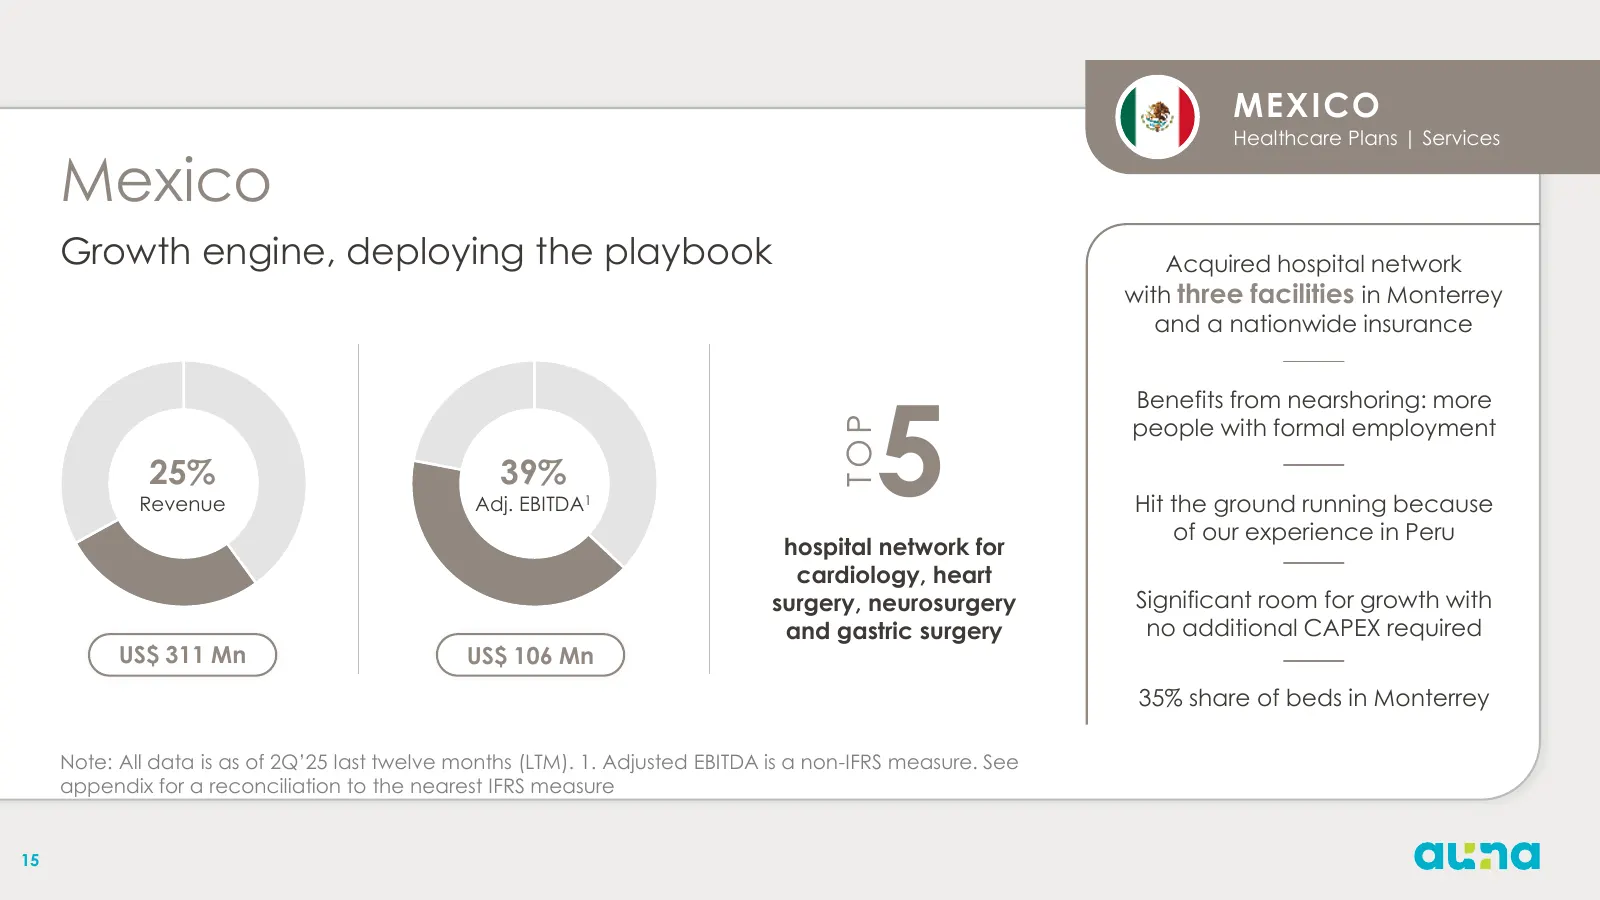
MEXICO Healthcare Plans | Services Mexico Growth engine, deploying the playbook Acquired hospital network with three facilities in Monterrey and a nationwide insurance 5 Benefits from nearshoring: more people with formal employment TOP 25% 39% Revenue Adj. EBITDA1 Hit the ground running because of o
Slide 16: OncoMexico Ecosystem
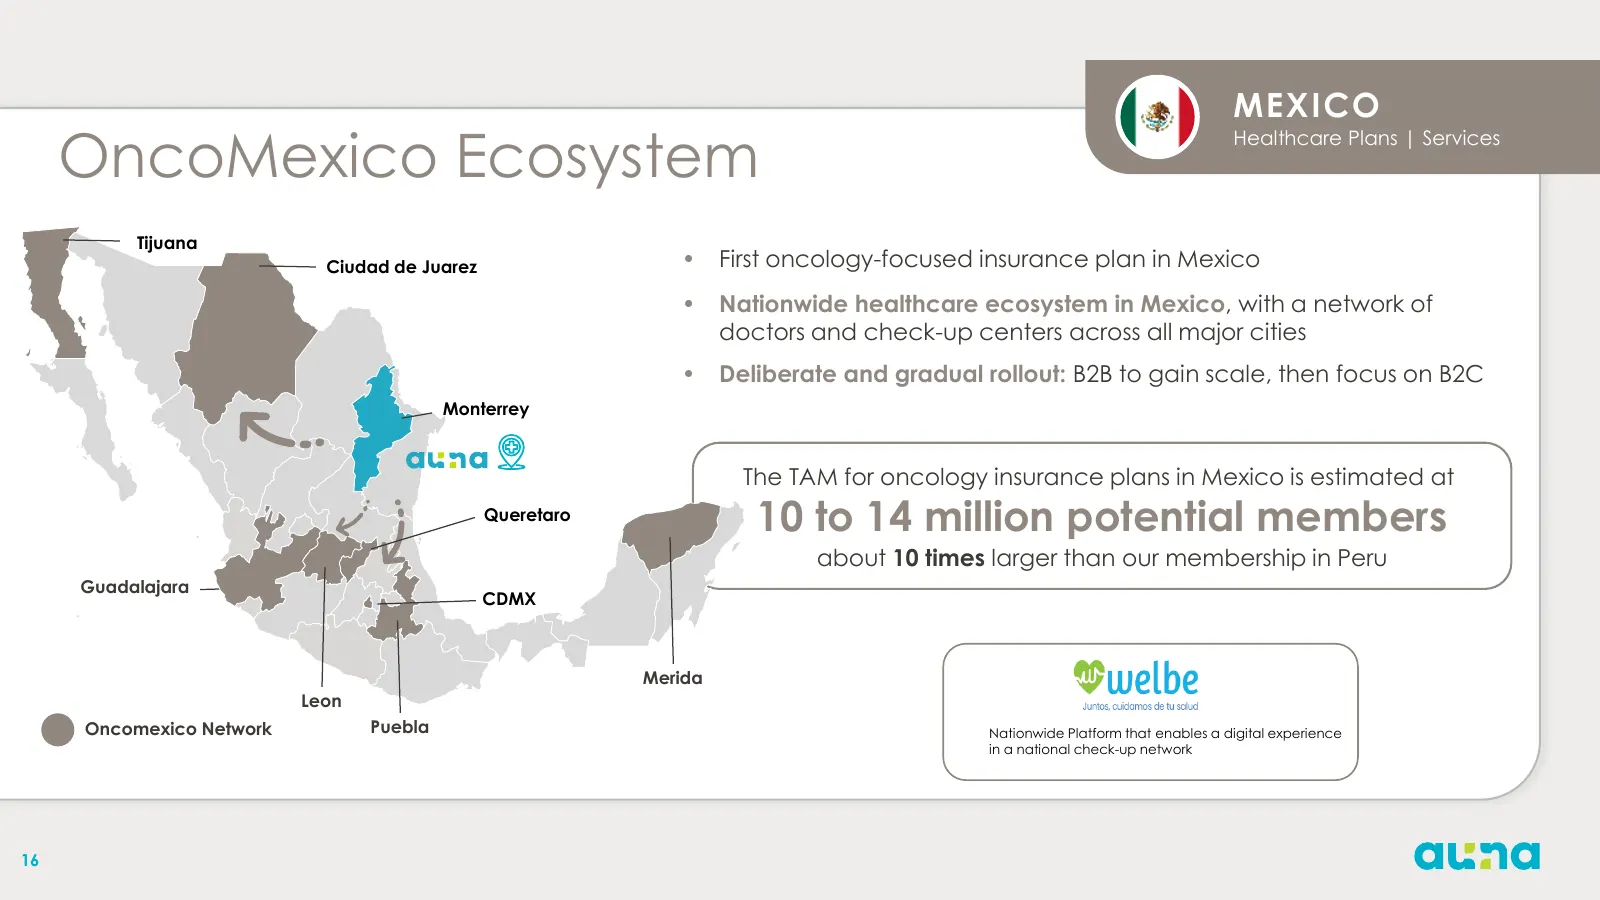
MEXICO OncoMexico Ecosystem Healthcare Plans | Services Tijuana Ciudad de Juarez • First oncology-focused insurance plan in Mexico • Nationwide healthcare ecosystem in Mexico, with a network of doctors and check-up centers across all major cities • Deliberate and gradual rollout: B2B to gain scale,
Slide 17: Colombia
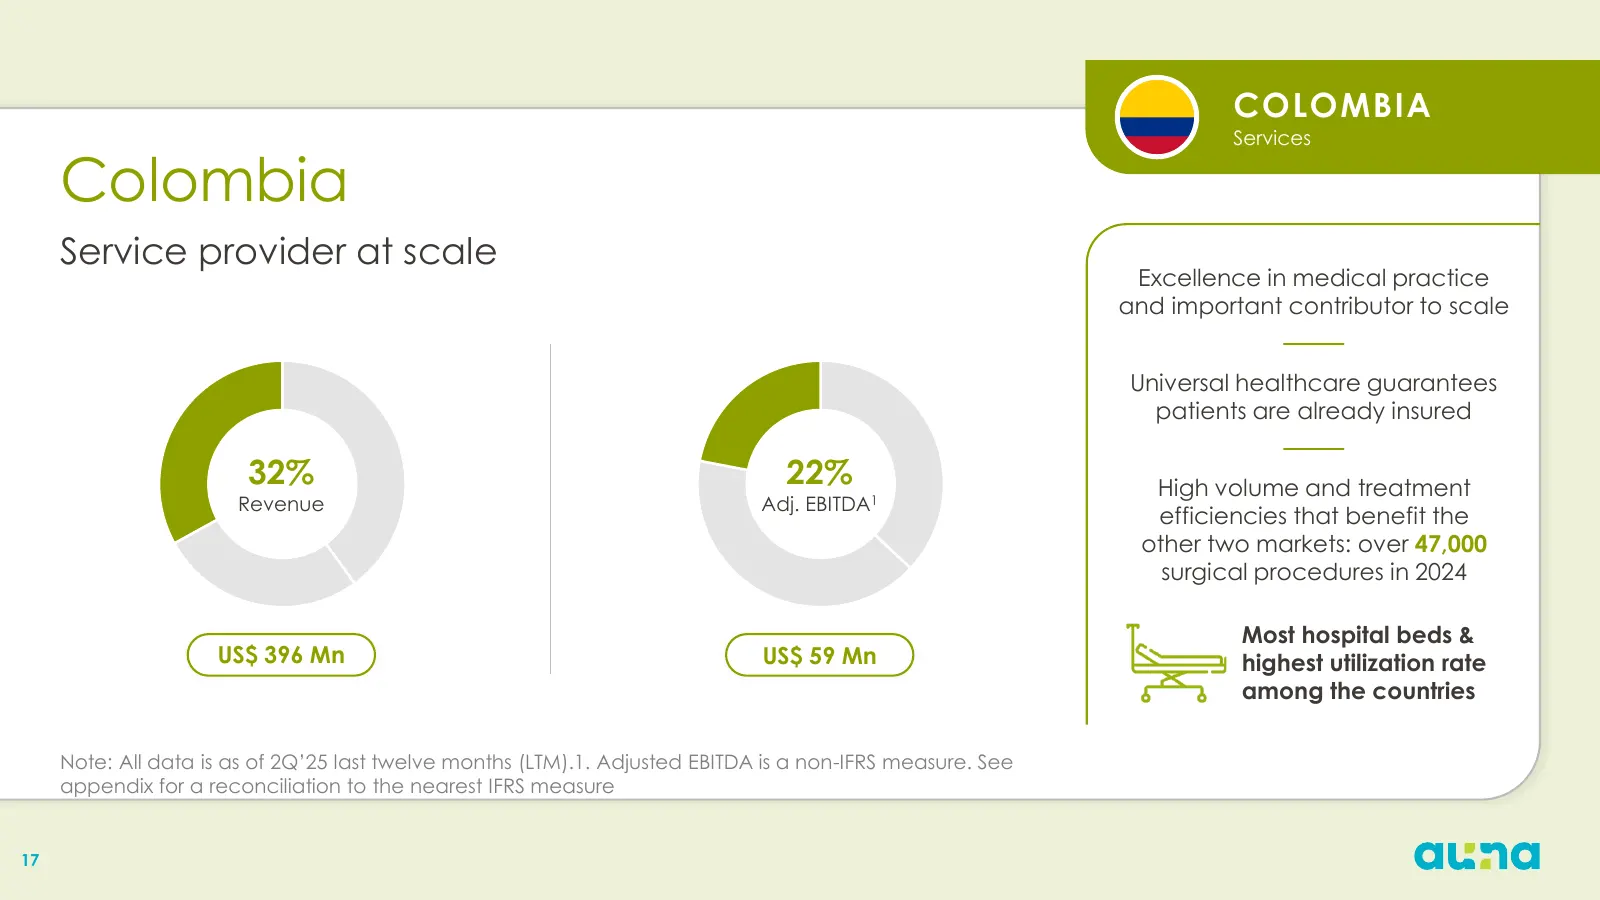
COLOMBIA Services Colombia Service provider at scale Excellence in medical practice and important contributor to scale Universal healthcare guarantees patients are already insured 32% 22% High volume and treatment Revenue Adj. EBITDA1 efficiencies that benefit the other two markets: over 47,000 surg
Slide 18: Stable, profitable operations
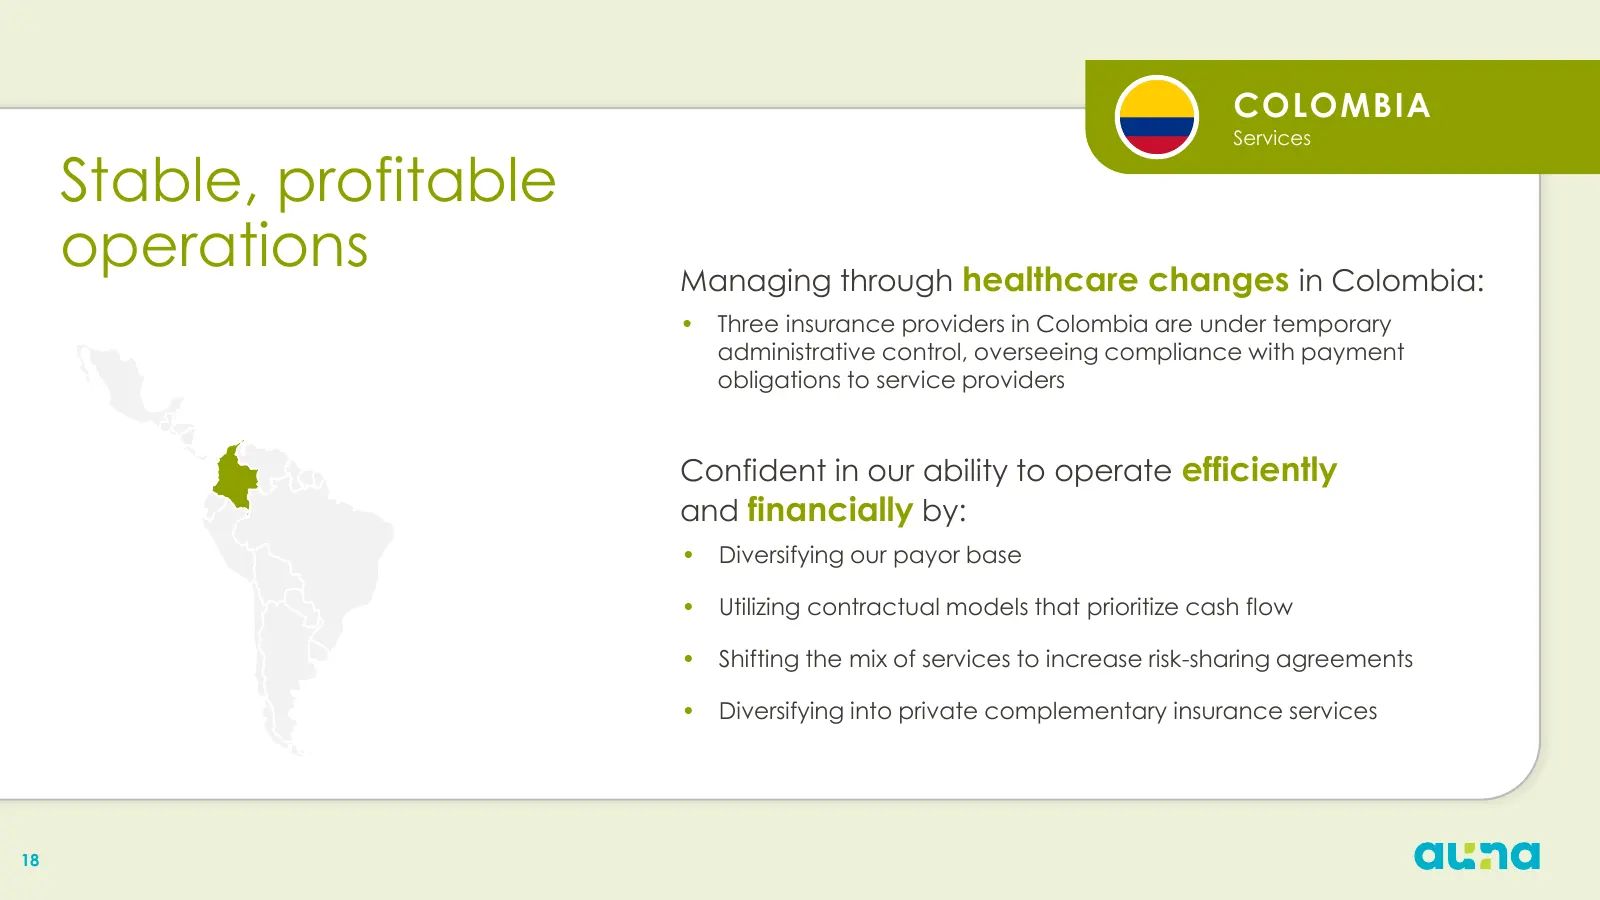
COLOMBIA Services Stable, profitable operations Managing through healthcare changes in Colombia: • Three insurance providers in Colombia are under temporary administrative control, overseeing compliance with payment obligations to service providers Confident in our ability to operate efficiently and
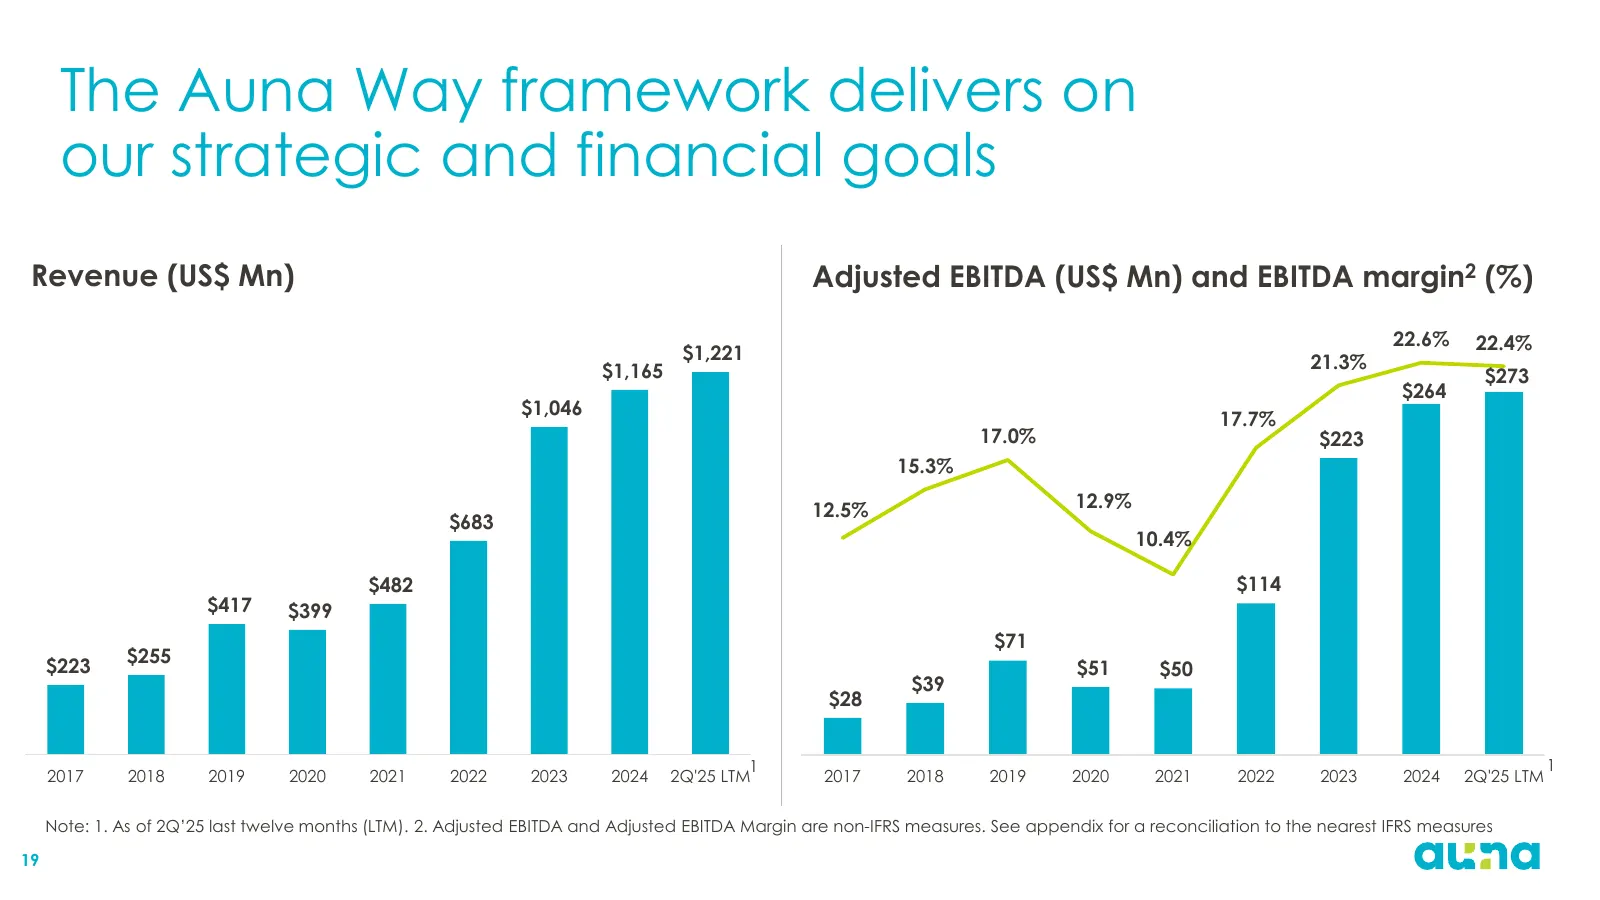
Slide 19: The Auna Way framework delivers on our strategic and financial goals
The Auna Way framework delivers on our strategic and financial goals Revenue (US$ Mn) Adjusted EBITDA (US$ Mn) and EBITDA margin2 (%) 22.6% 22.4% $1,221 $300 21.3% $1,165 $273 22% $264 $1,046 20% $250 17.7% 17.0% $223 18% 15.3% 16% $200 12.5% 12.9% $683 14% $150 10.4% 12% $482 $114 10% $417 $399 8%
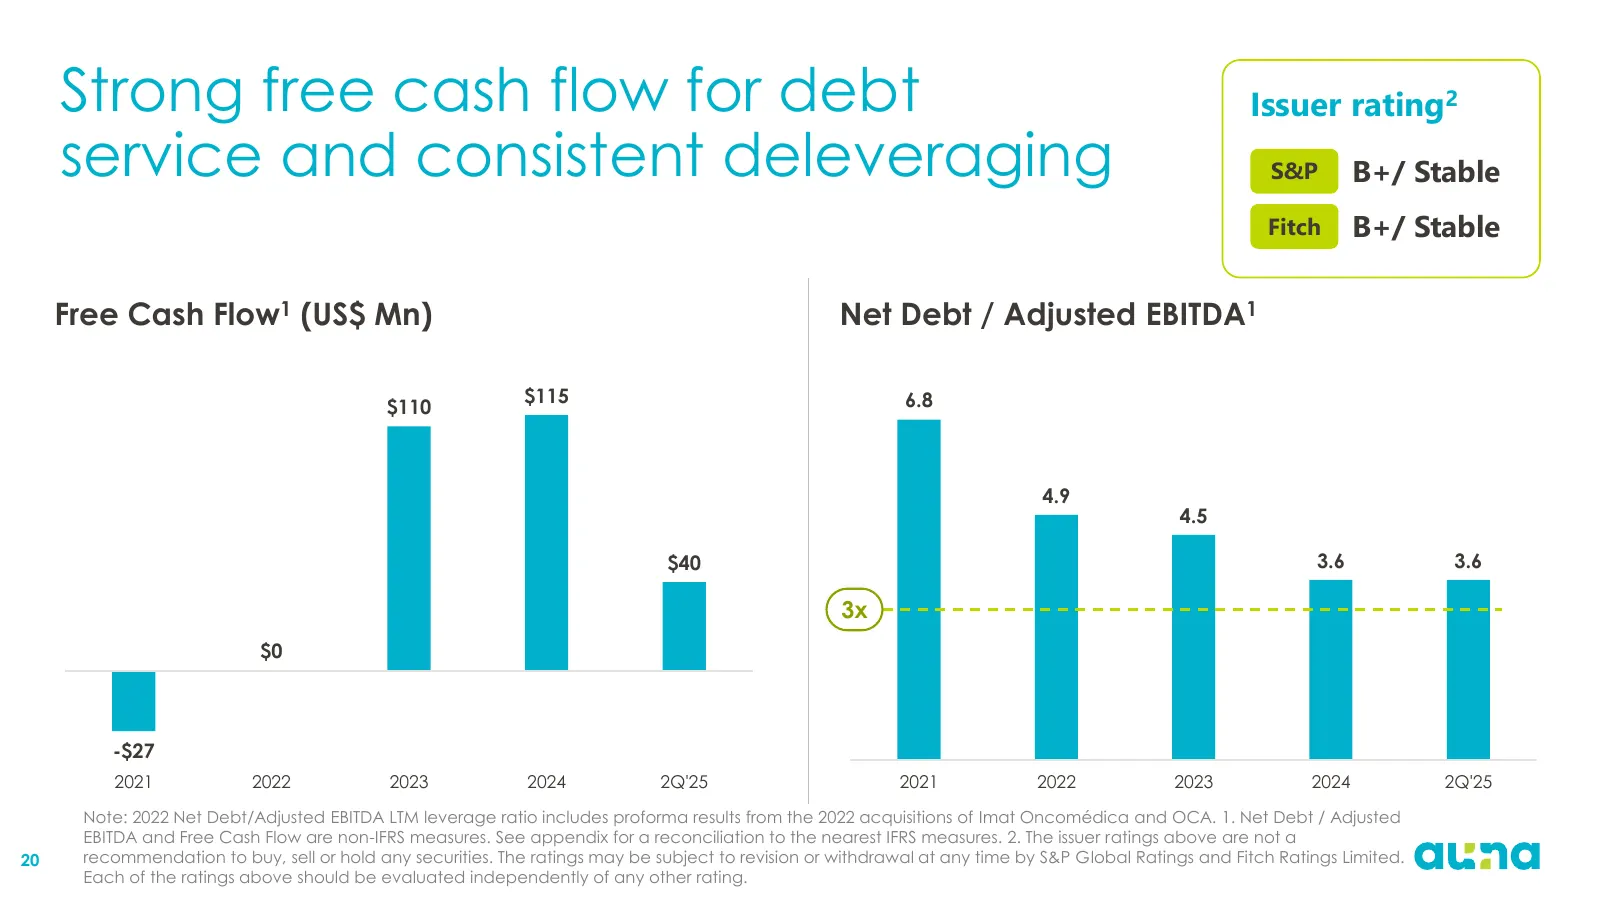
Slide 20: Strong free cash flow for debt service and consistent deleveraging
Strong free cash flow for debt Issuer rating2 service and consistent deleveraging S&P B+/ Stable Fitch B+/ Stable Free Cash Flow1 (US$ Mn) Net Debt / Adjusted EBITDA1 $115 6.8 $110 4.9 4.5 $40 3.6 3.6 3x $0 -$27 2021 2022 2023 2024 2Q'25 2021 2022 2023 2024 2Q'25 Note: 2022 Net Debt/Adjusted EBITDA
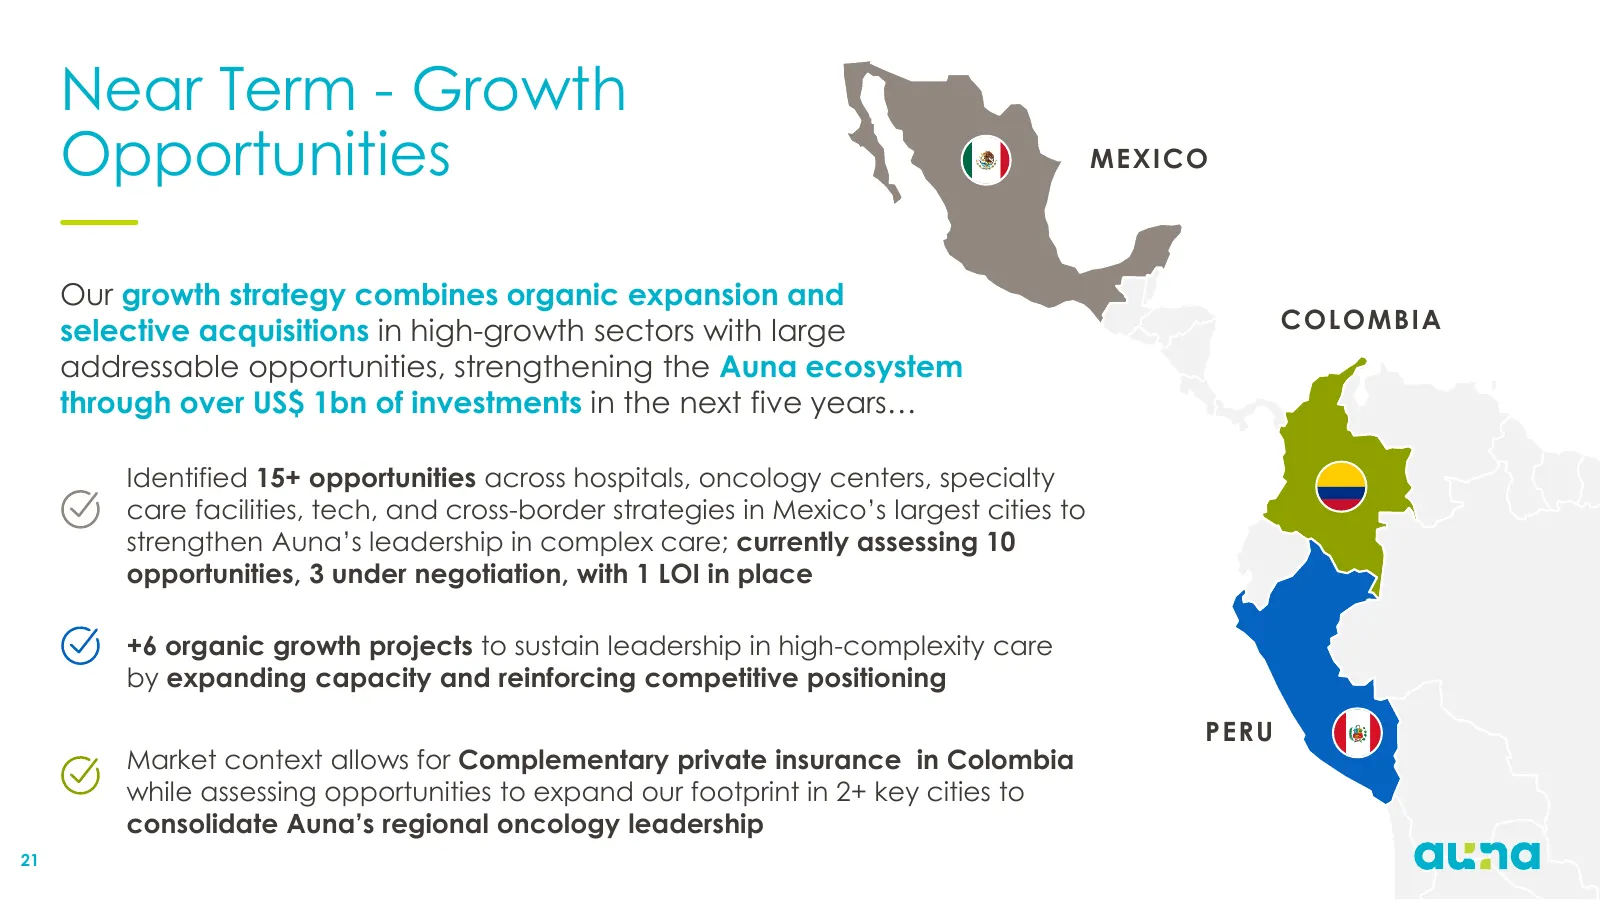
Slide 21: Near Term - Growth Opportunities
Near Term - Growth Opportunities MEXICO Our growth strategy combines organic expansion and selective acquisitions in high-growth sectors with large COLOMBIA addressable opportunities, strengthening the Auna ecosystem through over US$ 1bn of investments in the next five years… Identified 15+ opportun
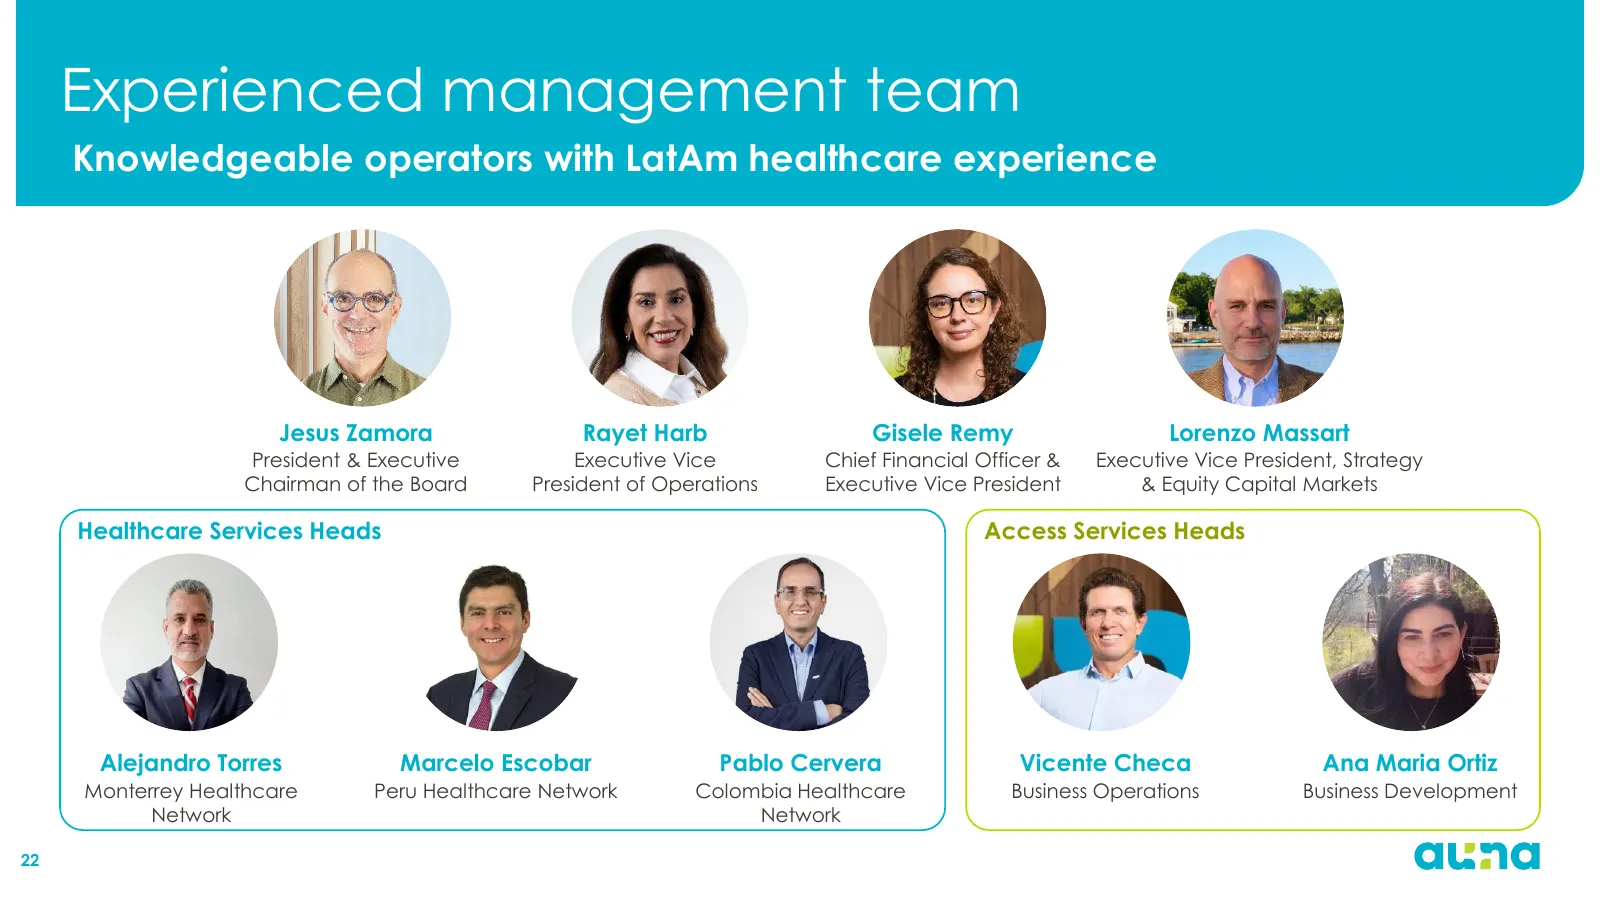
Slide 22: Experienced management team
Experienced management team Knowledgeable operators with LatAm healthcare experience Jesus Zamora Rayet Harb Gisele Remy Lorenzo Massart President & Executive Executive Vice Chief Financial Officer & Executive Vice President, Strategy Chairman of the Board President of Operations Executive Vice Pres

Slide 23: Independent board provides strong governance
Independent board provides strong governance Jesus Zamora Luis Felipe Pinillos Jorge Basadre Leonardo Bacherer Executive Chairman of the Board Vice Chairman of the Board Director Director John Wilton Andrew Soussloff Robert Oberrender Guadalupe Phillips Teresa Gutierrez Independent Director Independ

Slide 24: Appendix
Appendix 24
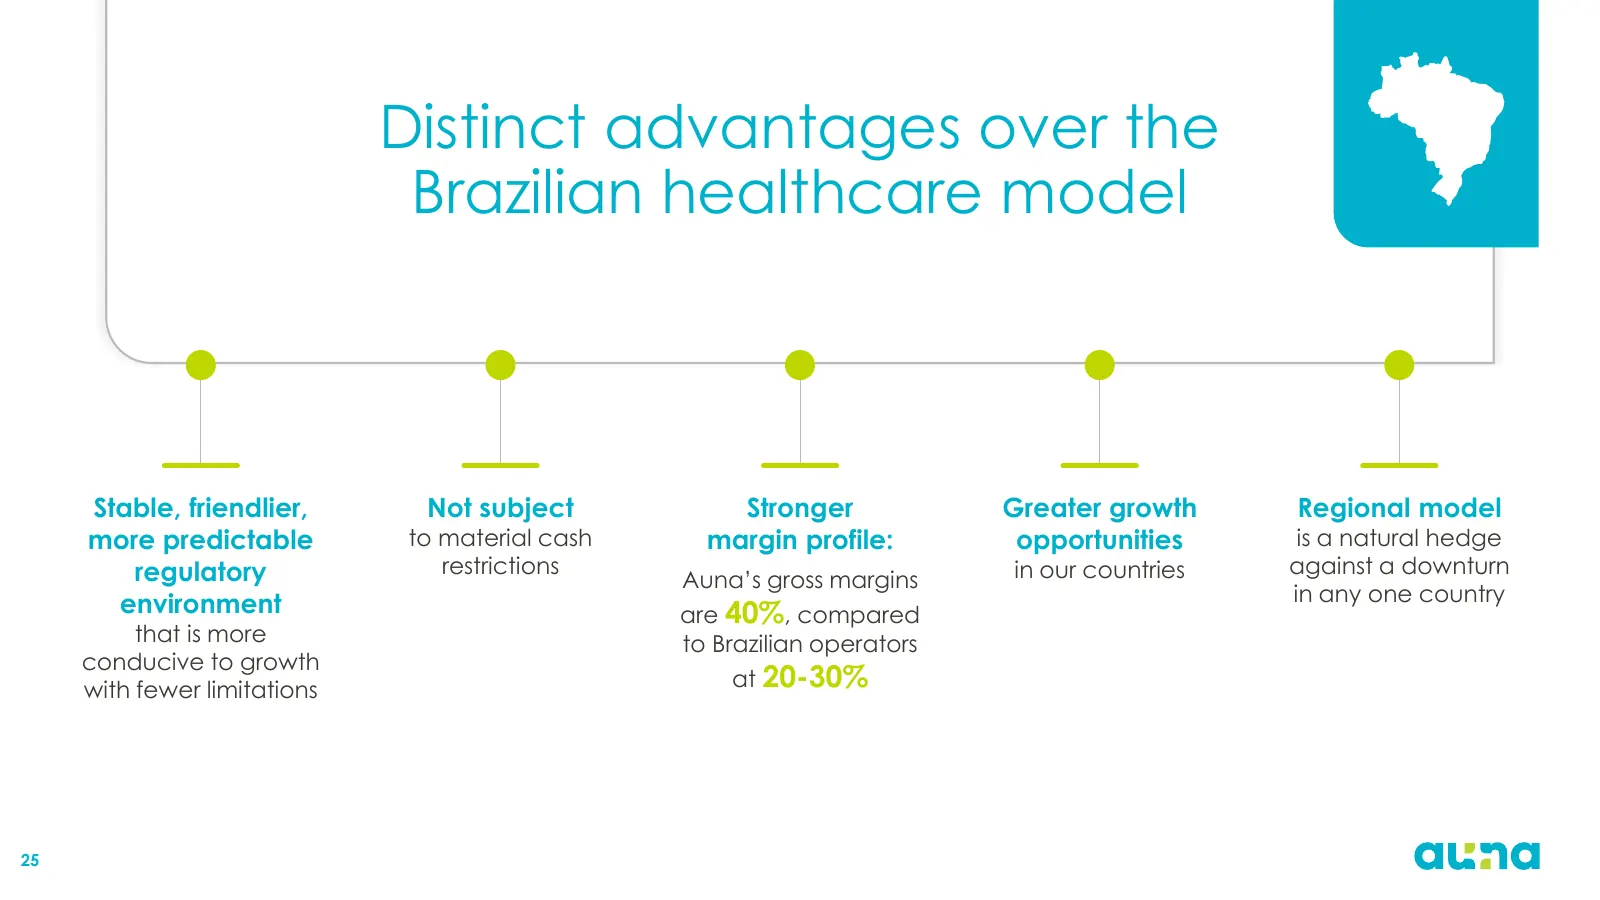
Slide 25: Distinct advantages over the Brazilian healthcare model
Distinct advantages over the Brazilian healthcare model Stable, friendlier, Not subject Stronger Greater growth Regional model more predictable to material cash margin profile: opportunities is a natural hedge regulatory restrictions in our countries against a downturn Auna’s gross margins environme
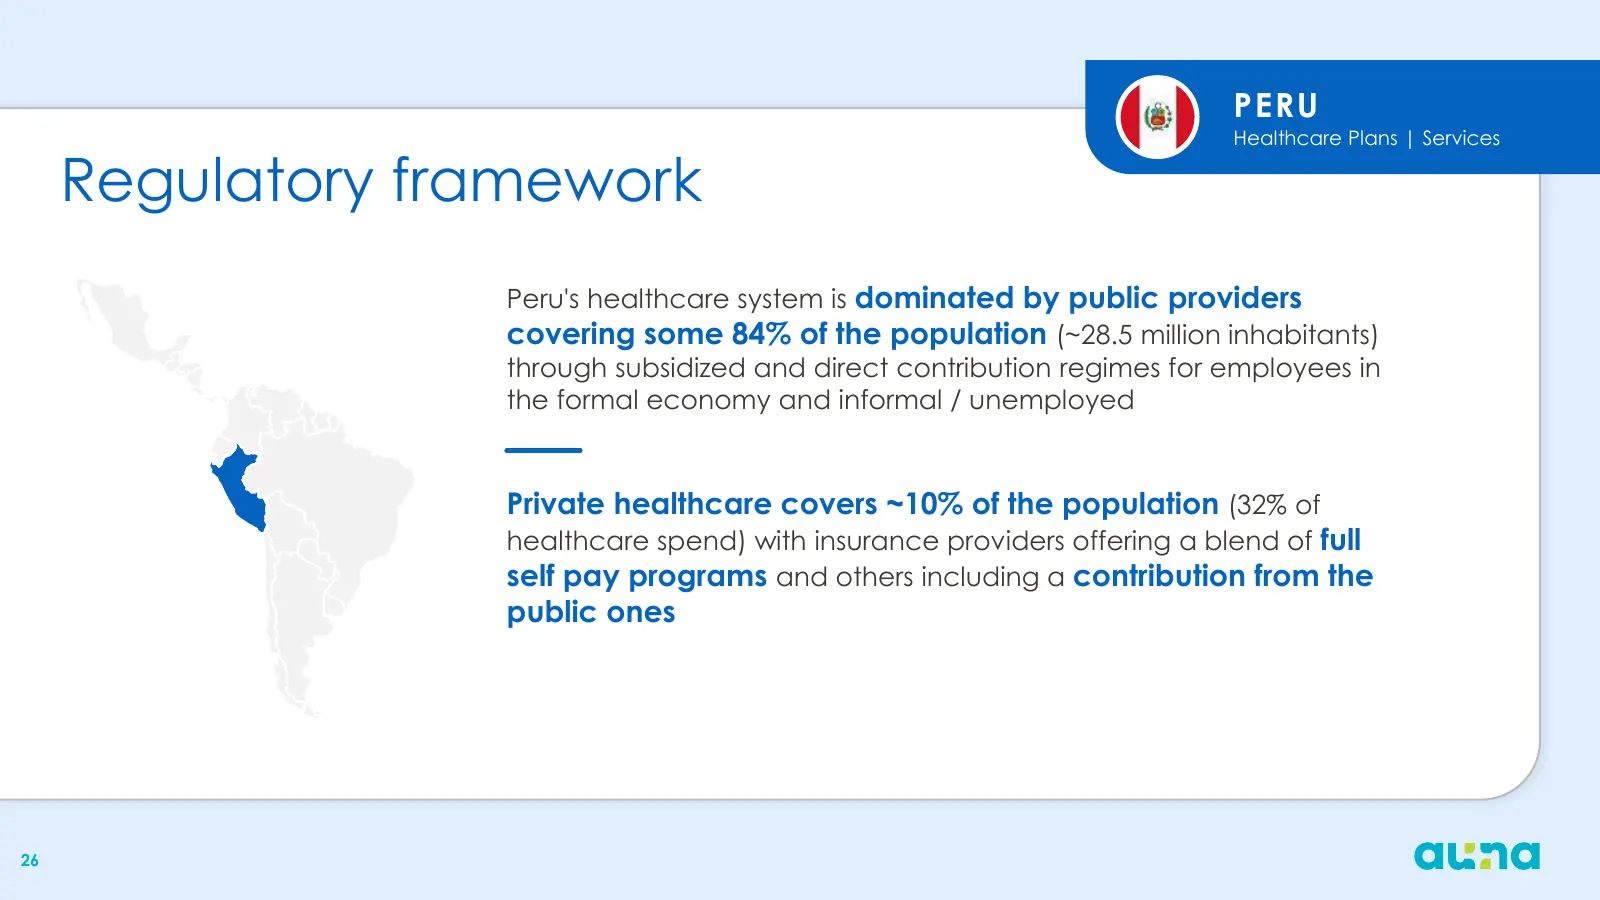
Slide 26: Regulatory framework - Peru
PERU Healthcare Plans | Services Regulatory framework Peru's healthcare system is dominated by public providers covering some 84% of the population (~28.5 million inhabitants) through subsidized and direct contribution regimes for employees in the formal economy and informal / unemployed Private hea
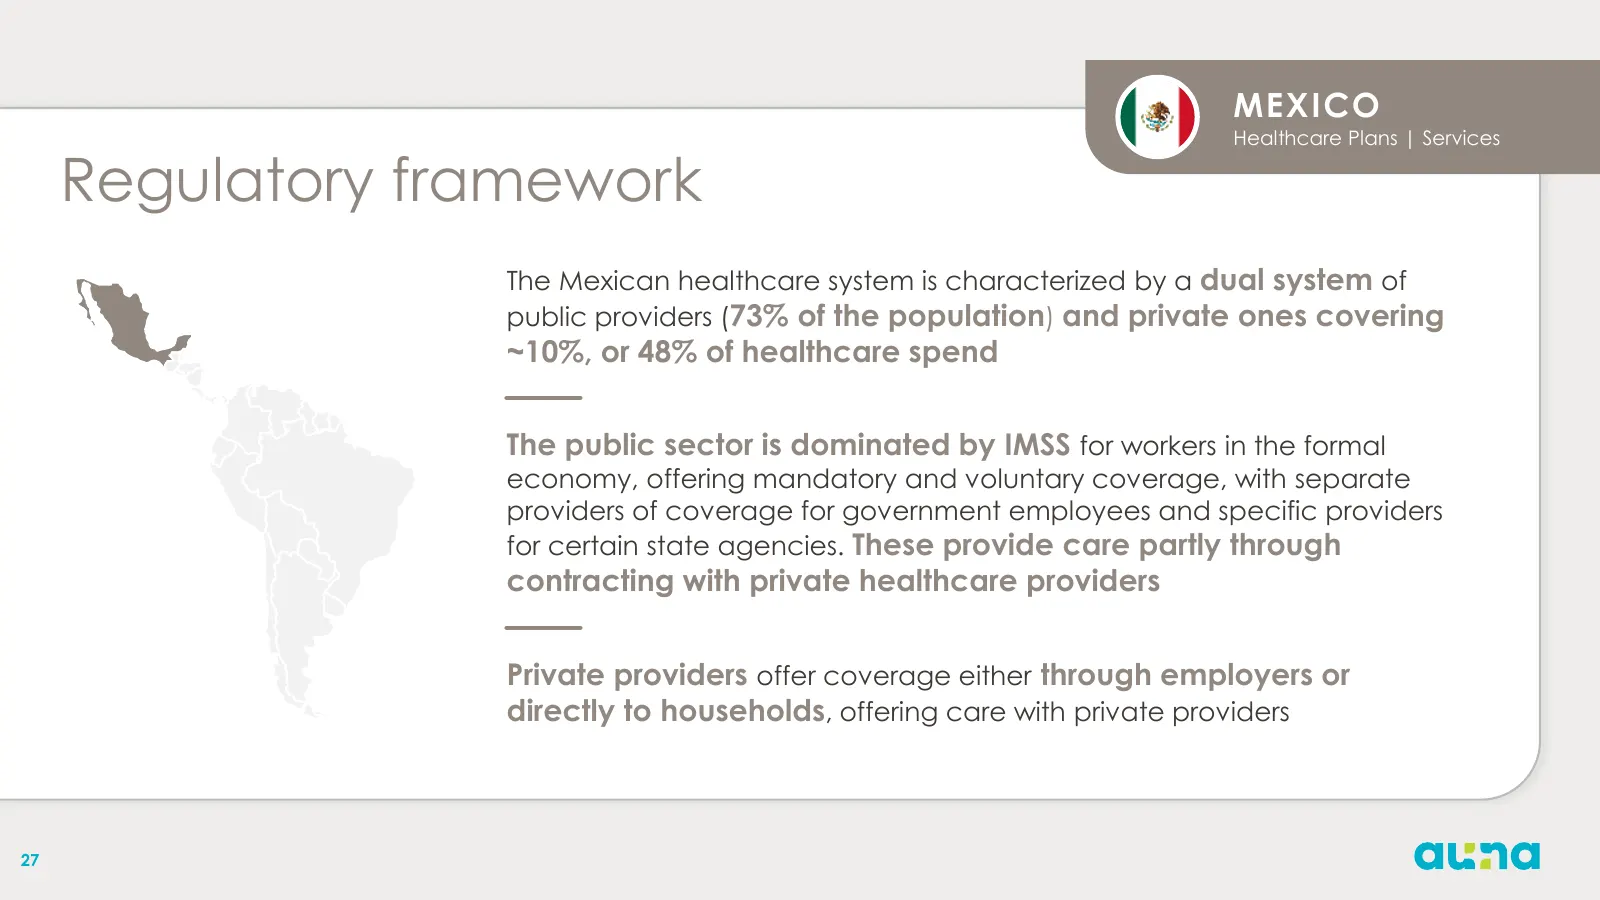
Slide 27: Regulatory framework - Mexico
MEXICO Healthcare Plans | Services Regulatory framework The Mexican healthcare system is characterized by a dual system of public providers (73% of the population) and private ones covering ~10%, or 48% of healthcare spend The public sector is dominated by IMSS for workers in the formal economy, off
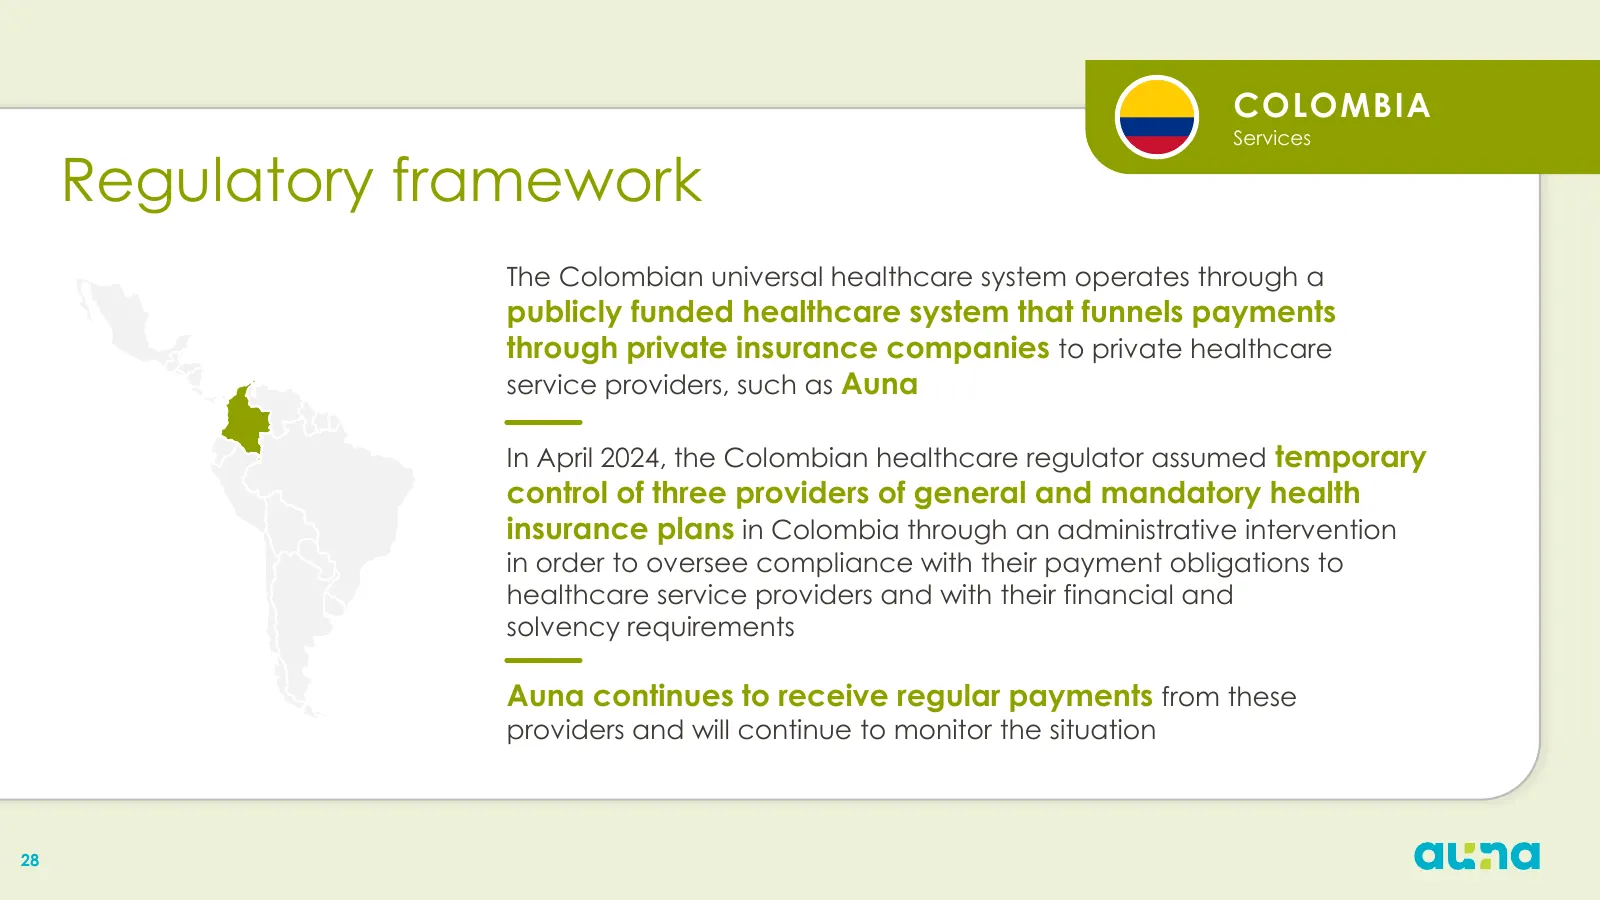
Slide 28: Regulatory framework - Colombia
COLOMBIA Services Regulatory framework The Colombian universal healthcare system operates through a publicly funded healthcare system that funnels payments through private insurance companies to private healthcare service providers, such as Auna In April 2024, the Colombian healthcare regulator assu
Slide 29: Honors and certifications
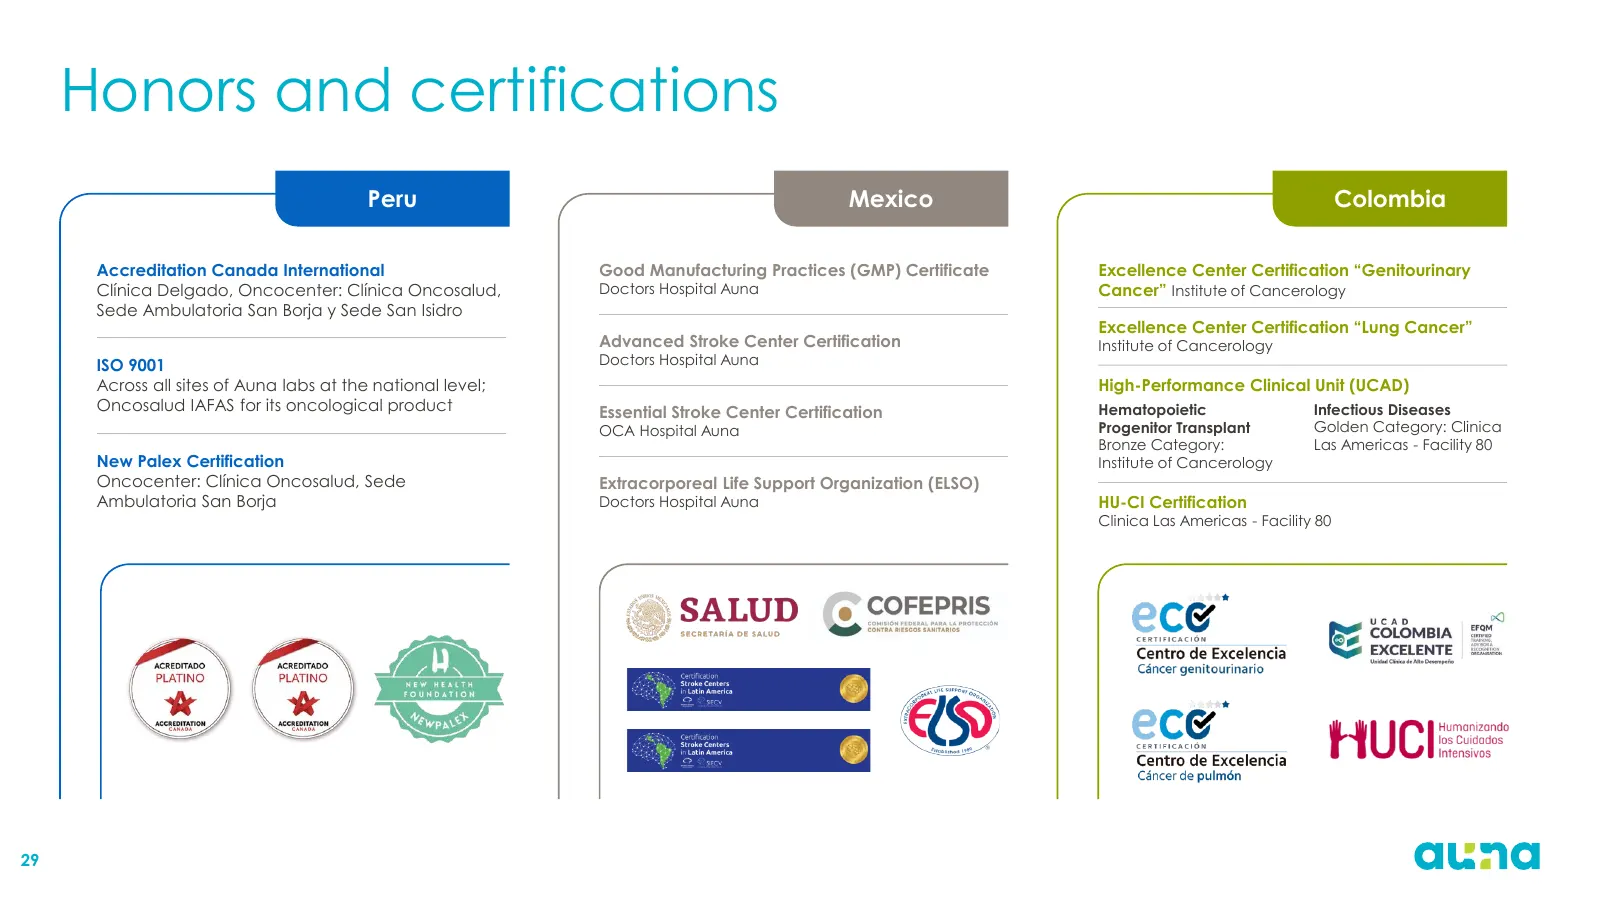
Honors and certifications Peru Mexico Colombia Accreditation Canada International Good Manufacturing Practices (GMP) Certificate Excellence Center Certification “Genitourinary Clínica Delgado, Oncocenter: Clínica Oncosalud, Doctors Hospital Auna Cancer” Institute of Cancerology Sede Ambulatoria San
Slide 30: Non-GAAP reconciliations
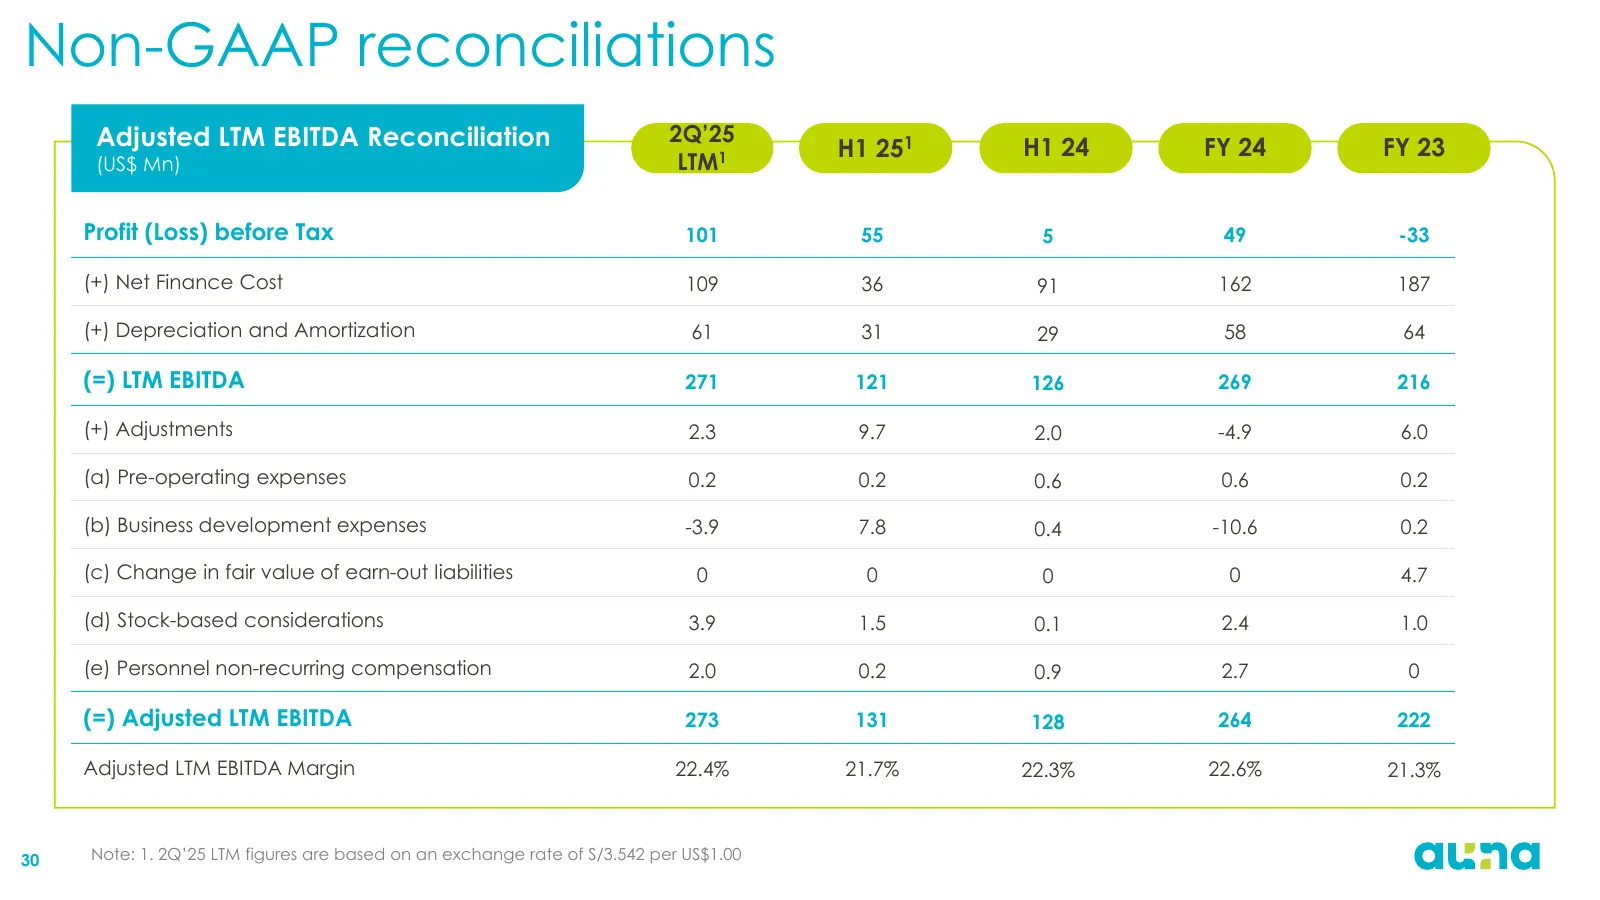
Non-GAAP reconciliations Adjusted LTM EBITDA Reconciliation 2Q’25 H1 251 H1 24 FY 24 FY 23 (US$ Mn) LTM1 Profit (Loss) before Tax 101 55 5 49 -33 (+) Net Finance Cost 109 36 91 162 187 (+) Depreciation and Amortization 61 31 29 58 64 (=) LTM EBITDA 271 121 126 269 216 (+) Adjustments 2.3 9.7 2.0 -4.
Slide 31: Non-GAAP reconciliations
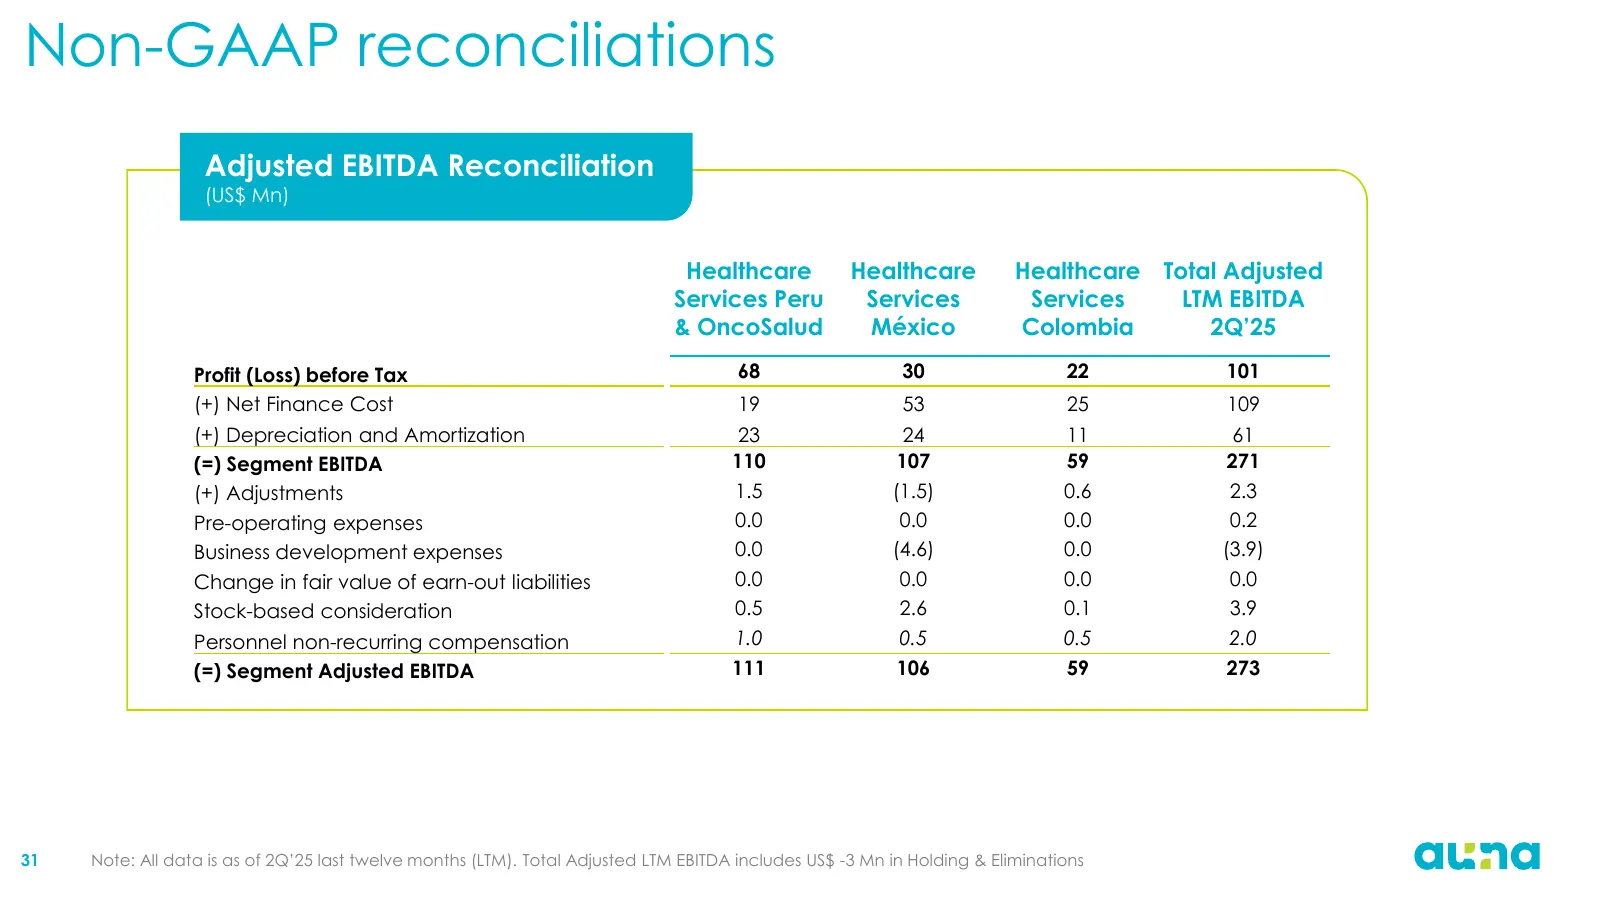
Non-GAAP reconciliations Adjusted EBITDA Reconciliation (US$ Mn) Healthcare Healthcare Healthcare Total Adjusted Services Peru Services Services LTM EBITDA & OncoSalud México Colombia 2Q’25 Profit (Loss) before Tax 68 30 22 101 (+) Net Finance Cost 19 53 25 109 (+) Depreciation and Amortization 23 2
Slide 32: Free cash Flow
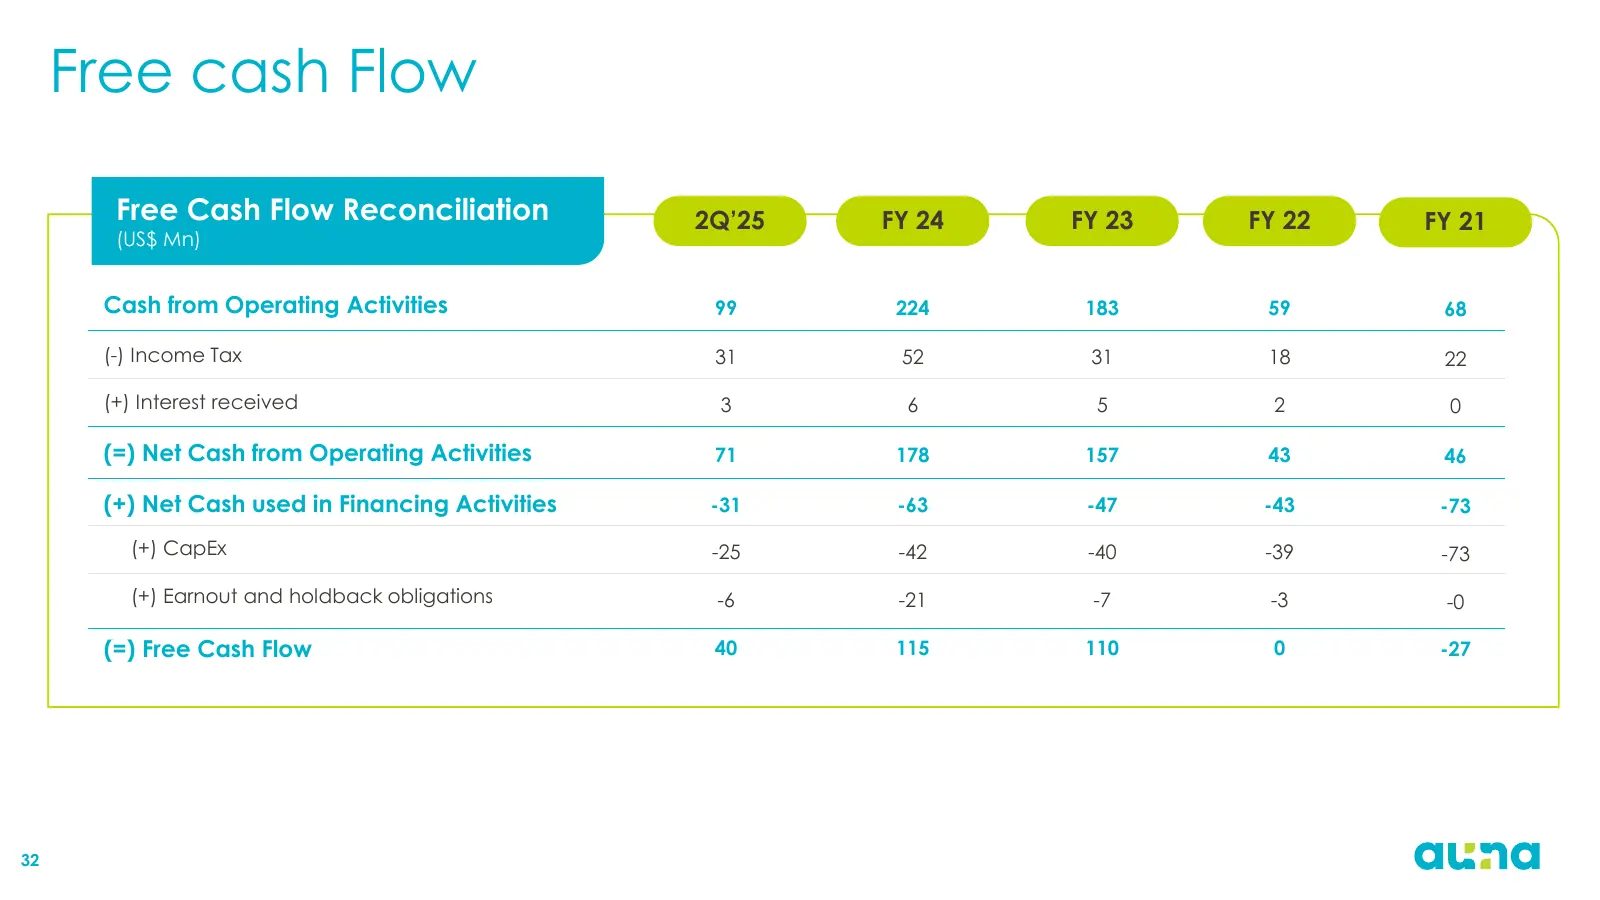
Free cash Flow Free Cash Flow Reconciliation 2Q’25 FY 24 FY 23 FY 22 FY 21 (US$ Mn) Cash from Operating Activities 99 224 183 59 68 (-) Income Tax 31 52 31 18 22 (+) Interest received 3 6 5 2 0 (=) Net Cash from Operating Activities 71 178 157 43 46 (+) Net Cash used in Financing Activities -31 -63
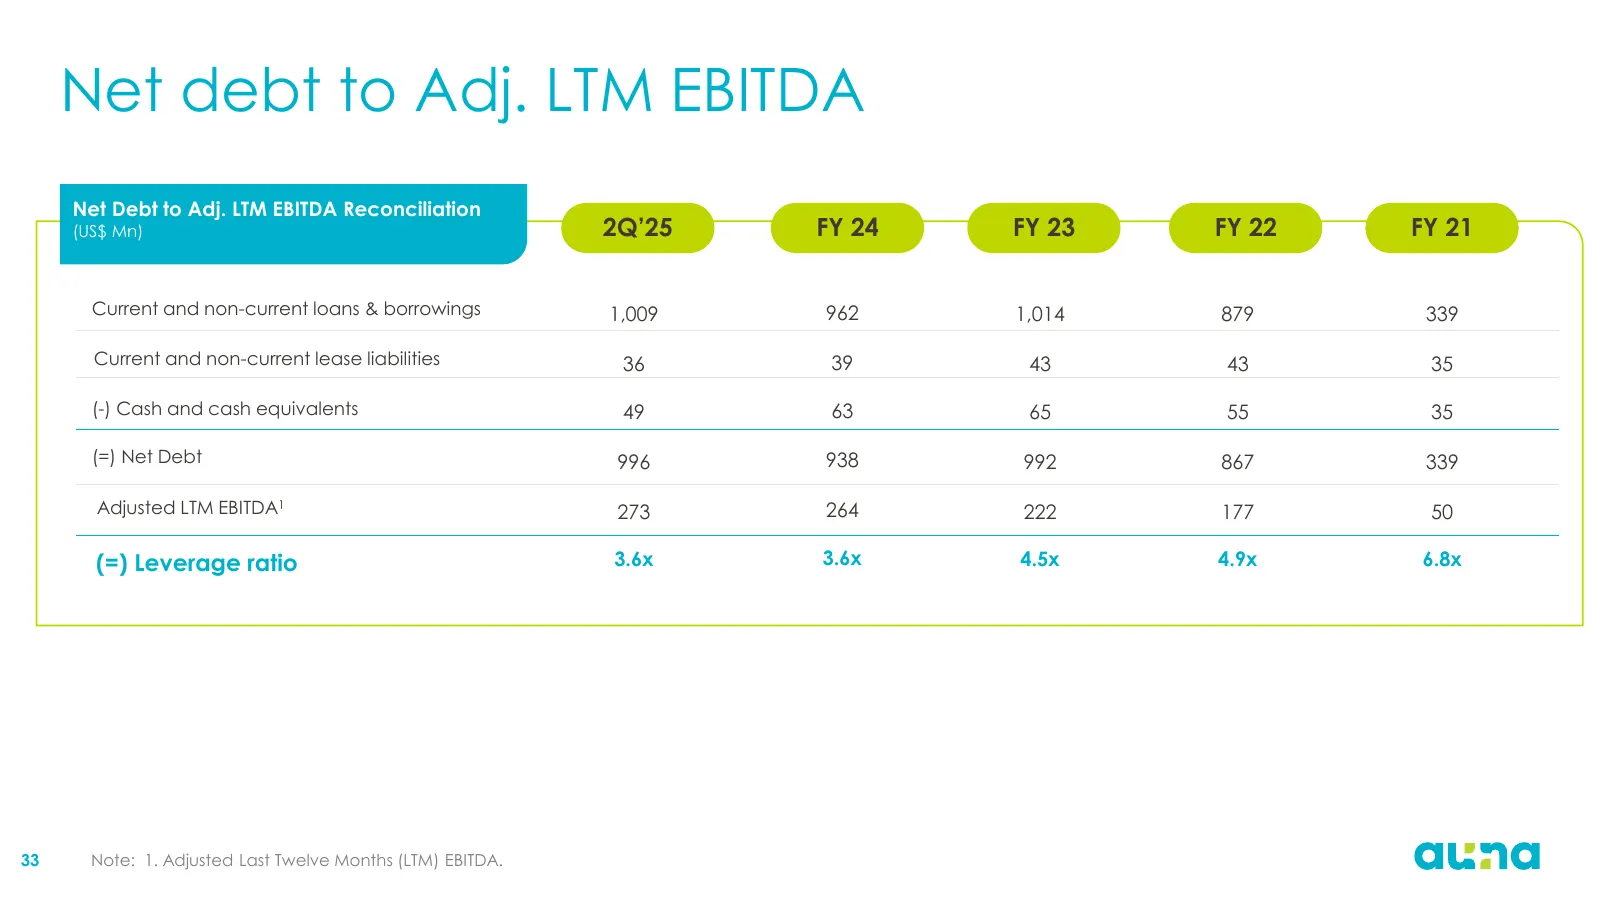
Slide 33: Net debt to Adj. LTM EBITDA
Net debt to Adj. LTM EBITDA Net Debt to Adj. LTM EBITDA Reconciliation (US$ Mn) 2Q’25 FY 24 FY 23 FY 22 FY 21 Current and non-current loans & borrowings 1,009 962 1,014 879 339 Current and non-current lease liabilities 36 39 43 43 35 (-) Cash and cash equivalents 49 63 65 55 35 (=) Net Debt 996 938
Source: Internet Archive copy of s203.q4cdn.com
More decks from Auna SA
 Q3 2026 Earnings Presentation34 slides · Nov 18, 2026
 Q2 2026 Earnings Presentation34 slides · Aug 19, 2026
 Q1 2026 Earnings Presentation33 slides · May 20, 2026
 Q4 2025 Earnings Presentation38 slides · Mar 11, 2026
 Q3 2025 Earnings Presentation35 slides · Nov 21, 2025
 Q2 2025 Earnings Presentation33 slides · Aug 20, 2025