Epigral Ltd · NSE:EPIGRAL
Epigral — Meghmani Finechem — Q3 FY2022 Earnings Presentation
21 slides from Epigral's earnings presentation, Jan 24, 2022
Slide 1: Cover letter to stock exchanges
MEGHMANI FINECHEM LTD. Regd. Office: CH/1, CH/2, GIDC Industrial Estate, Dahej, Tai. Vagra, Bharuch - 392 130. Gujarat, (INDIA) Phone: +91- 635 9953661/62/63/64/65, E-mail: helpdesk@meghmanifinechem.com, URL: www.meghmanifinechem.com GIN: U241 OOGJ2007PLC051717 24 th January, 2022 To, National Stock
Slide 2: Q3FY22 Earnings Presentation
MEGHMANI FINECHEM LIMITED Q3FY22 Earnings Presentation 24th January, 2022
Slide 3: Disclaimer
tJ Disclaimer lrwFL Your ('>Stntial~. Ou r c,q,e rti se. This presentation and the accompanying slides (the “Presentation”), which have been prepared by Meghmani Finechem Limited (the “Company”) solely for the information purposes and do not constitute any offer, recommendation or invitation to purc
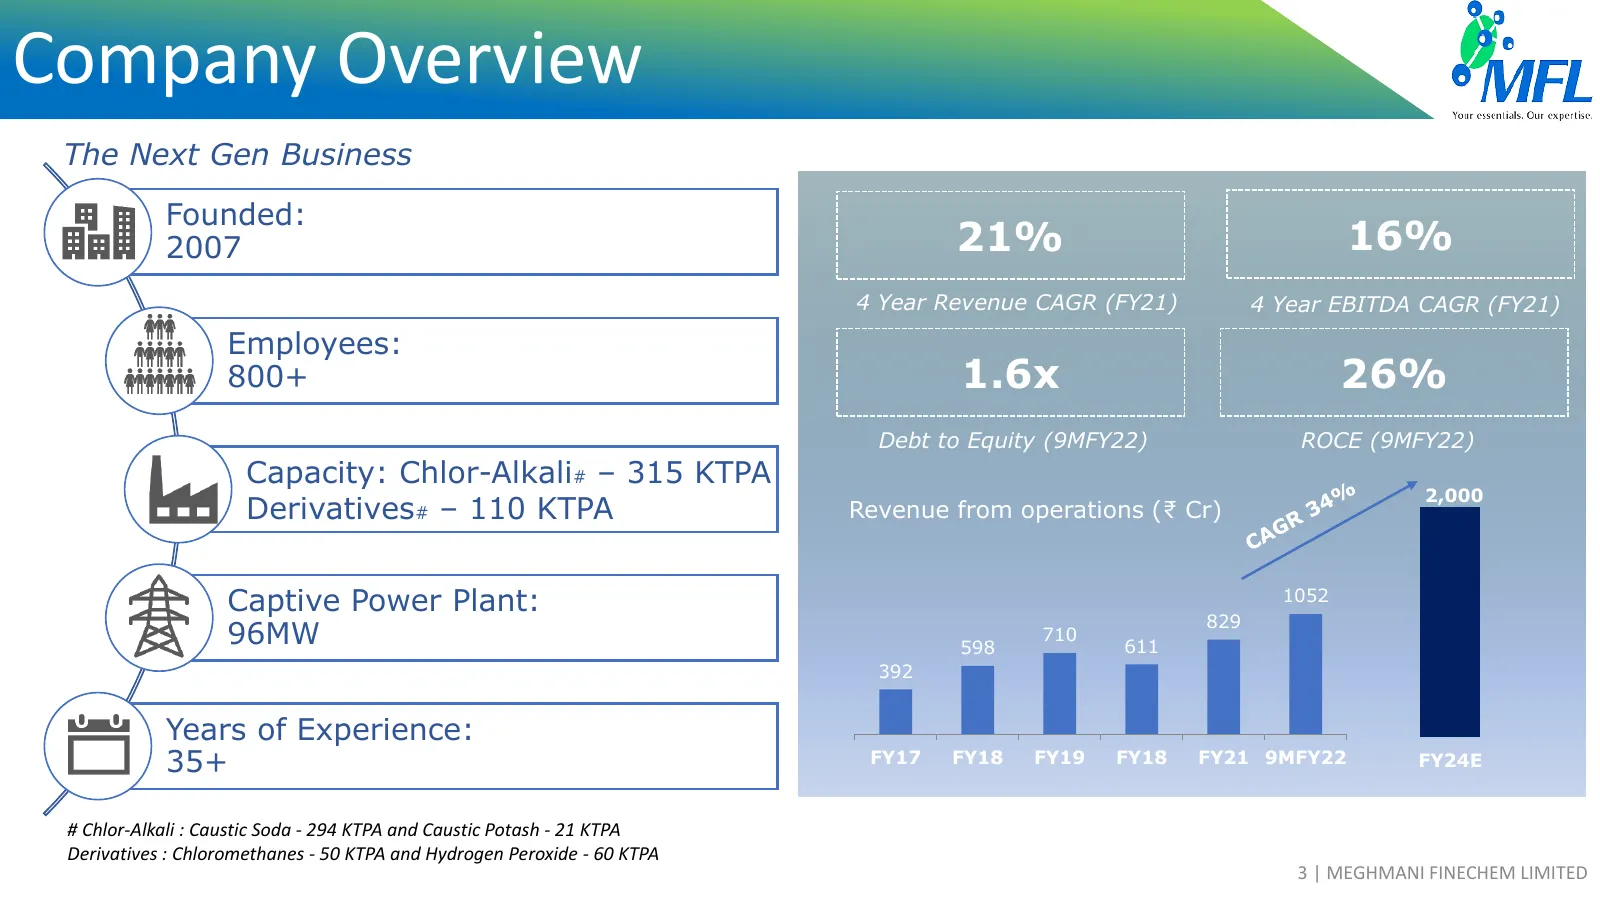
Slide 4: Company Overview
Company Overview The Next Gen Business l:----------------- ----------------------------- !i----------- ----------------------------- Founded: 1 21% 16% I , I 2007 I I I ' I I _____ ,I ------------------------------ l ---------------------------- ------•! I 4 Year Revenue CAGR (FY21) 4 Year EBITDA CA
Slide 5: Key Highlights – Q3FY22
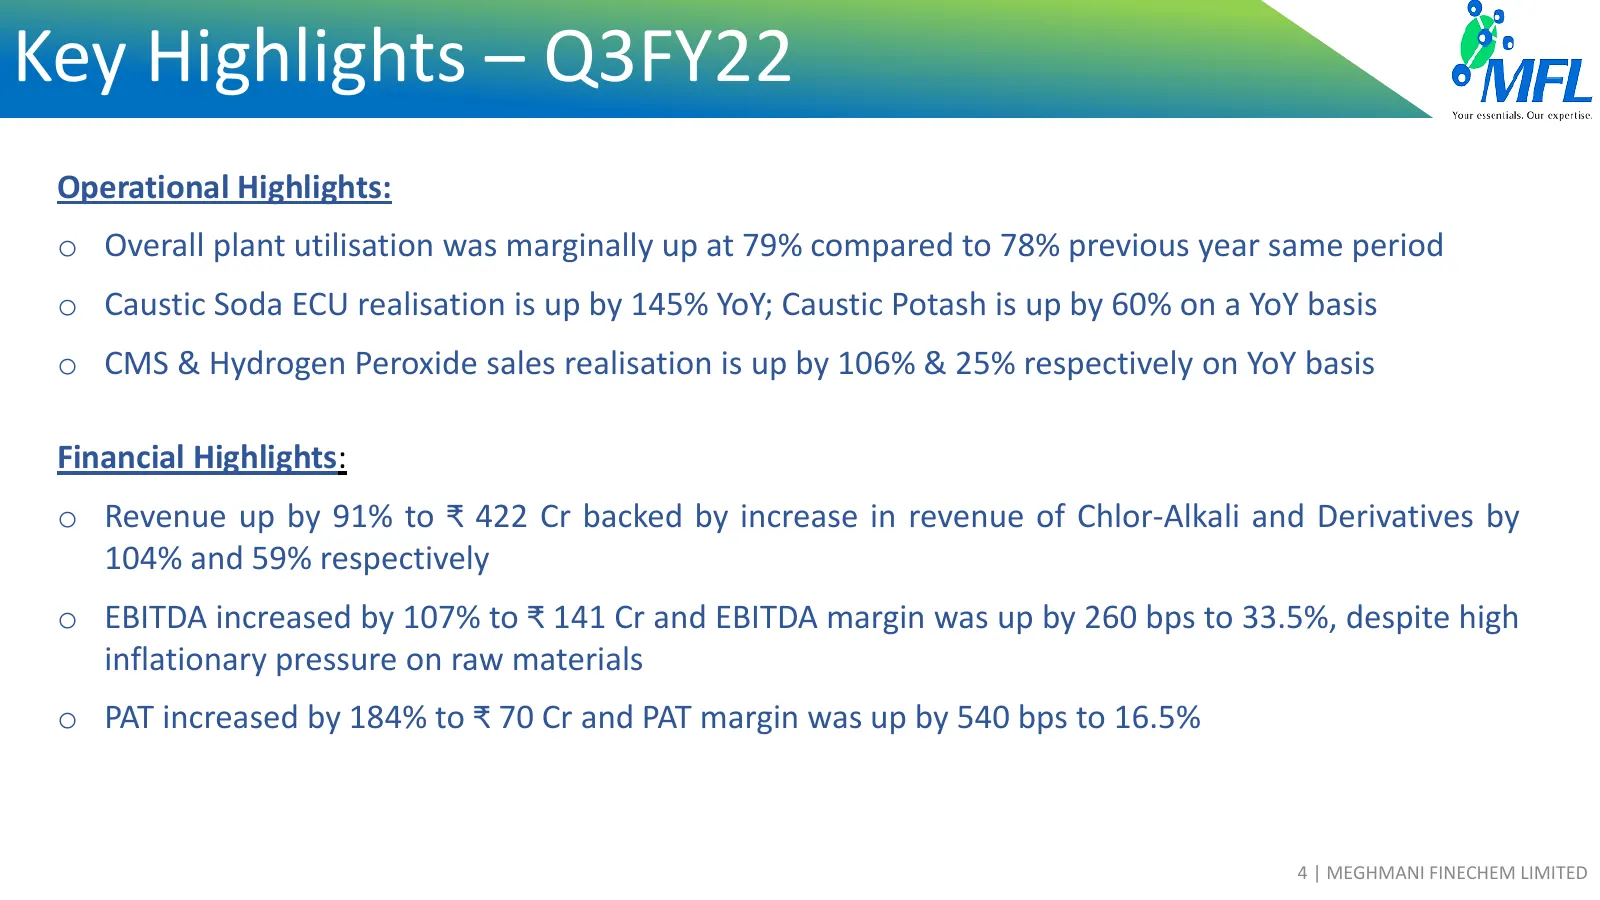
tJ Key Highlights – Q3FY22 lrwFL Your ('>Stntial~. Ou r c,q,e rti se. Operational Highlights: o Overall plant utilisation was marginally up at 79% compared to 78% previous year same period o Caustic Soda ECU realisation is up by 145% YoY; Caustic Potash is up by 60% on a YoY basis o CMS & Hydrogen P
Slide 6: Key Highlights – 9MFY22
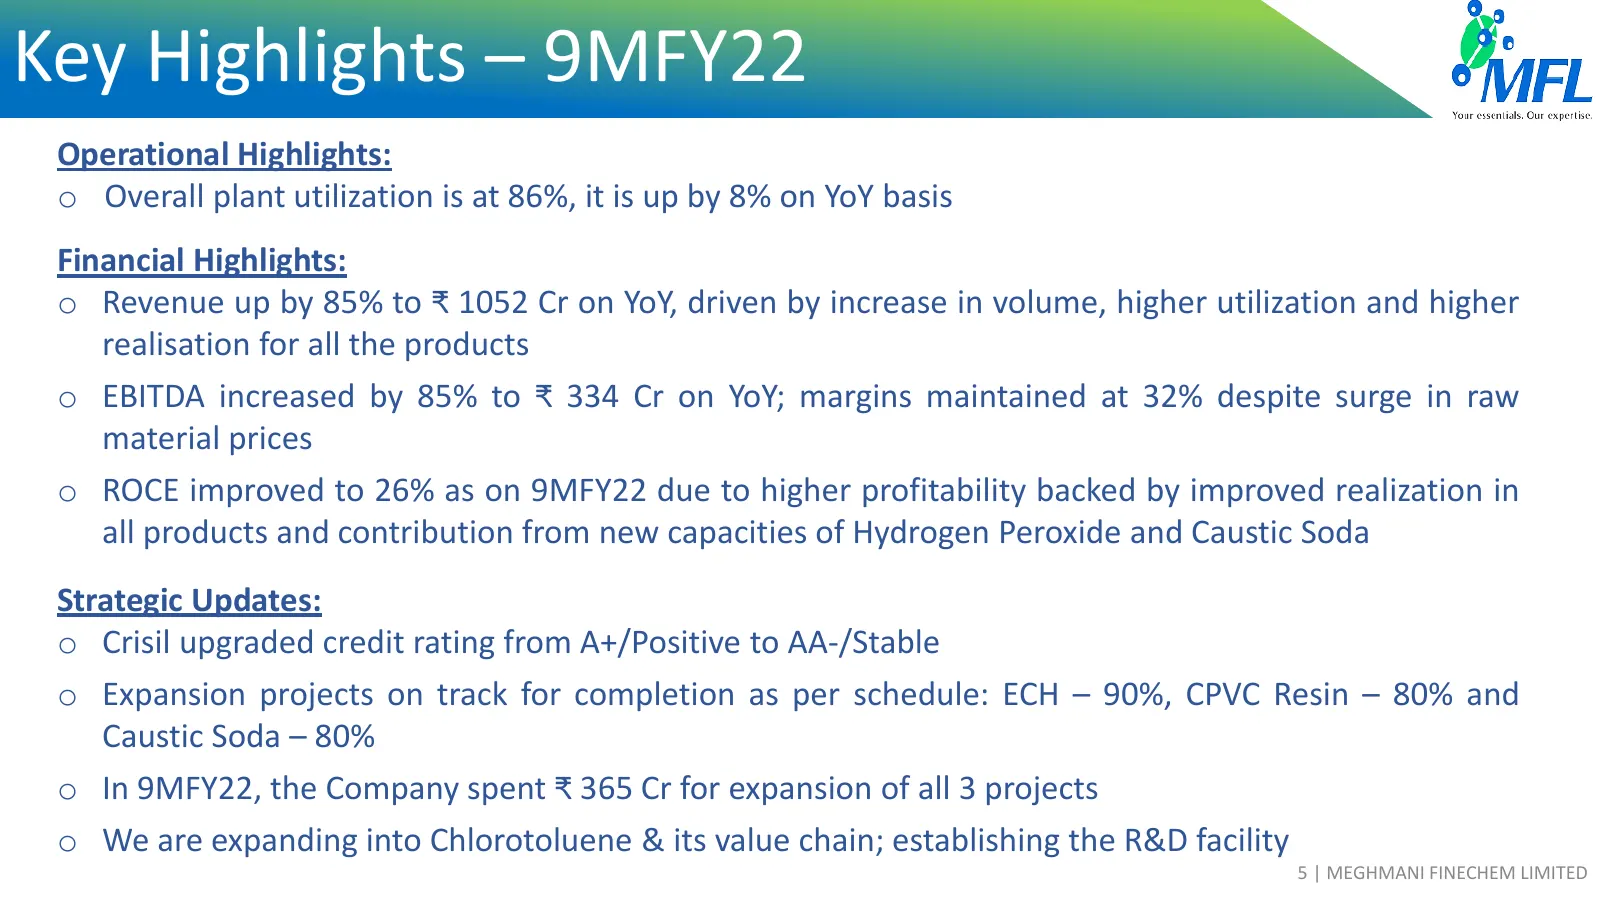
tJ Key Highlights – 9MFY22 lrwFL Your ('>Stntial~. Ou r c,q,e rti se. Operational Highlights: o Overall plant utilization is at 86%, it is up by 8% on YoY basis Financial Highlights: o Revenue up by 85% to ₹ 1052 Cr on YoY, driven by increase in volume, higher utilization and higher realisation for
Slide 7: CMD Message
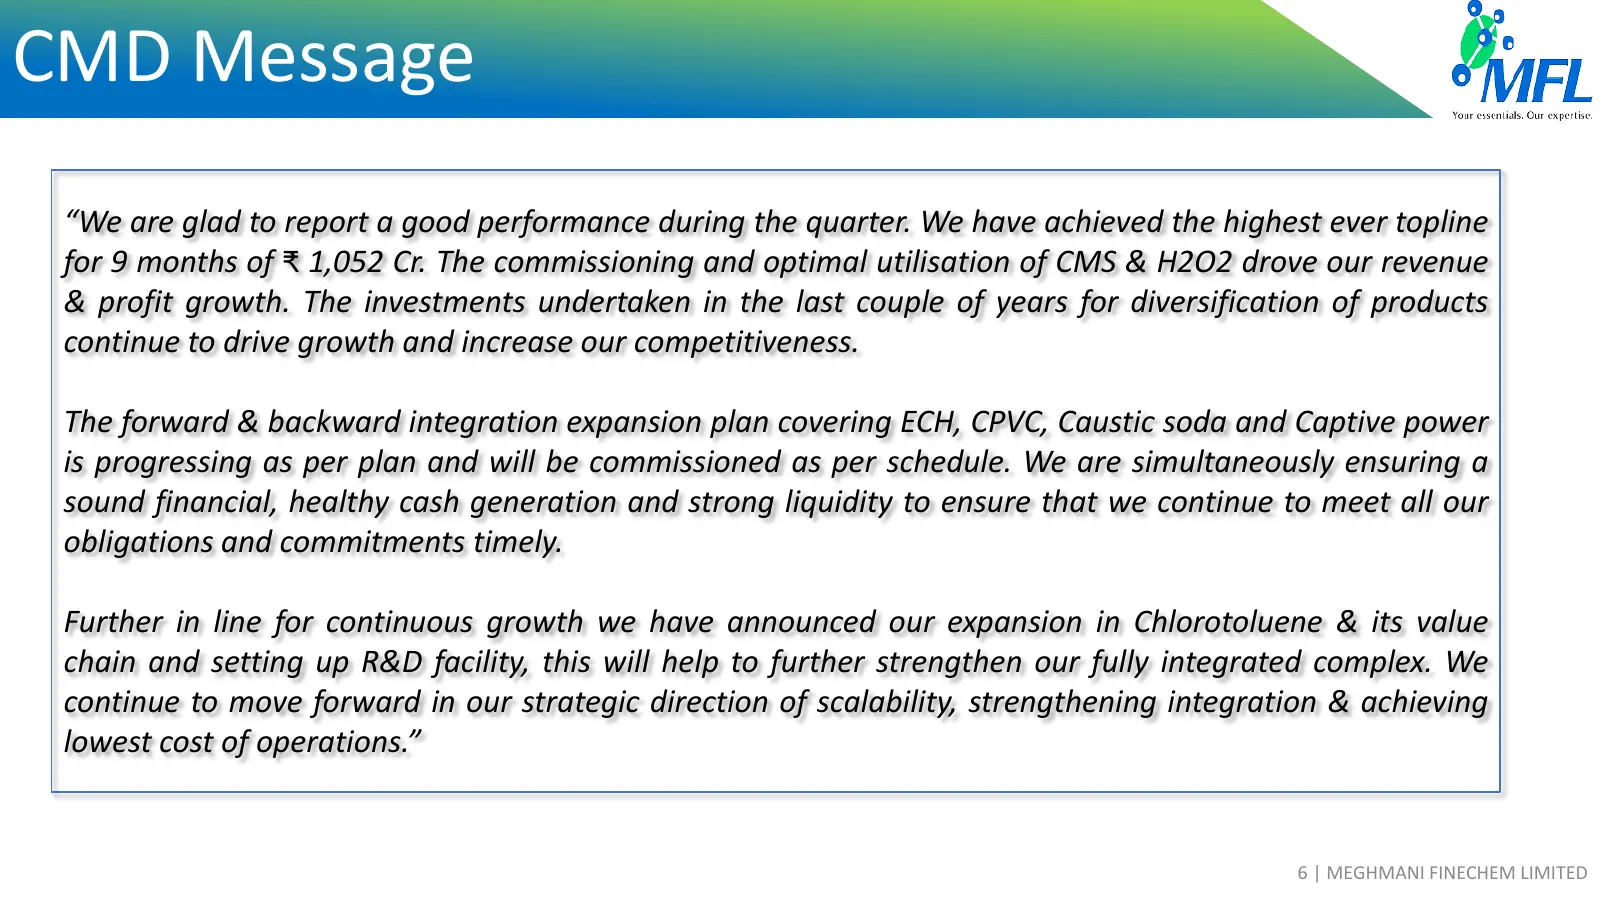
tJ CMD Message lrwFL Your ('>Stntial~. Ou r c,q,e rti se. “We are glad to report a good performance during the quarter. We have achieved the highest ever topline for 9 months of ₹ 1,052 Cr. The commissioning and optimal utilisation of CMS & H2O2 drove our revenue & profit growth. The investments und
Slide 8: Q3FY22 Operational Overview
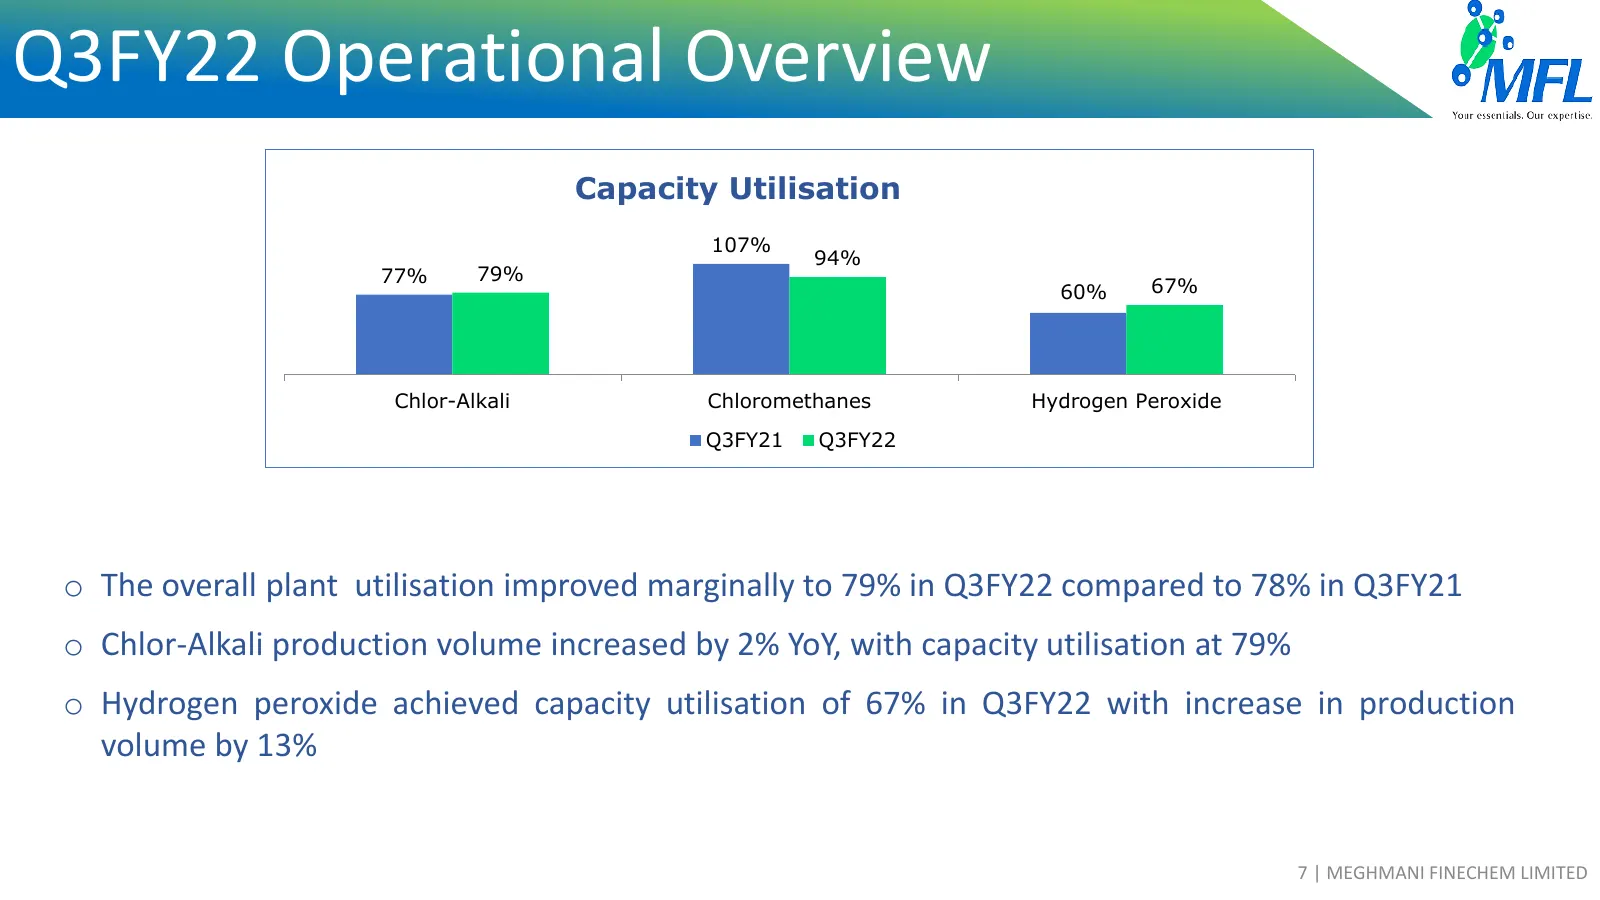
tJ Q3FY22 Operational Overview lrwFL Your ('>Stntial~. Ou r c,q,e rti se. Capacity Utilisation 107% 94% 77% 79% 60% 67% Chlor-Alkali Chloromethanes Hydrogen Peroxide ■ Q3FY21 ■ Q3FY22 o The overall plant utilisation improved marginally to 79% in Q3FY22 compared to 78% in Q3FY21 o Chlor-Alkali produc
Slide 9: Operational overview
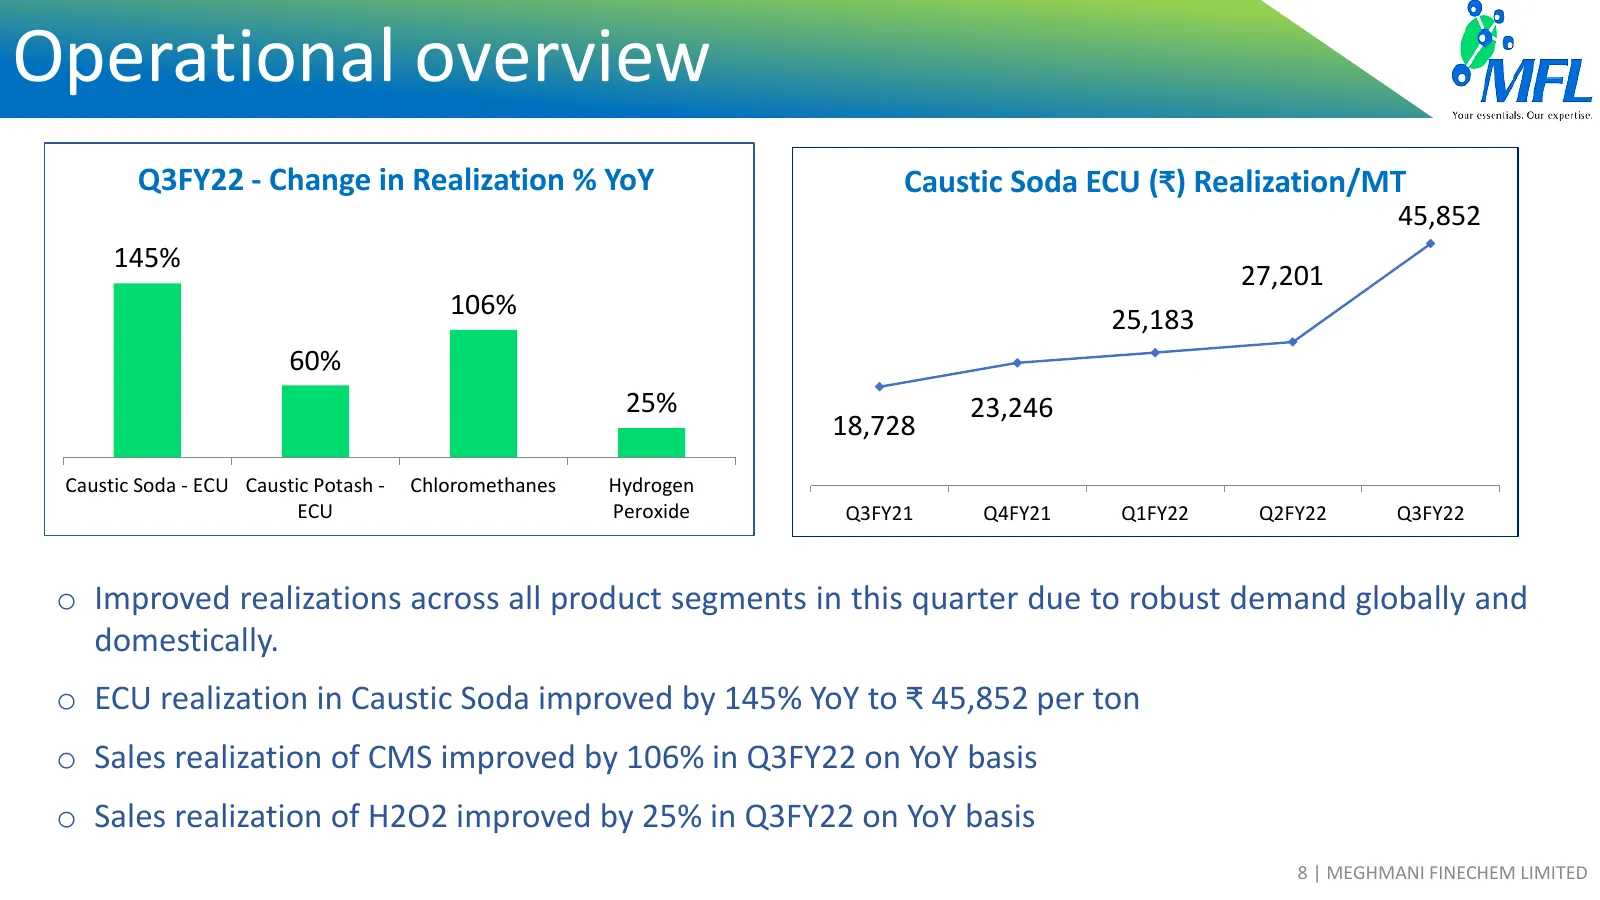
tJ Operational overview lrwFL Your ('>Stntial~. Ou r c,q,e rti se. Q3FY22 - Change in Realization % YoY Caustic Soda ECU (₹) Realization/MT 45,852 145% 27,201 106% 25,183 60% 25% 23,246 18,728 Caustic Soda - ECU Caustic Potash - Chloromethanes Hydrogen ECU Peroxide Q3FY21 Q4FY21 Q1FY22 Q2FY22 Q3FY22
Slide 10: Q3FY22 Financial Highlights
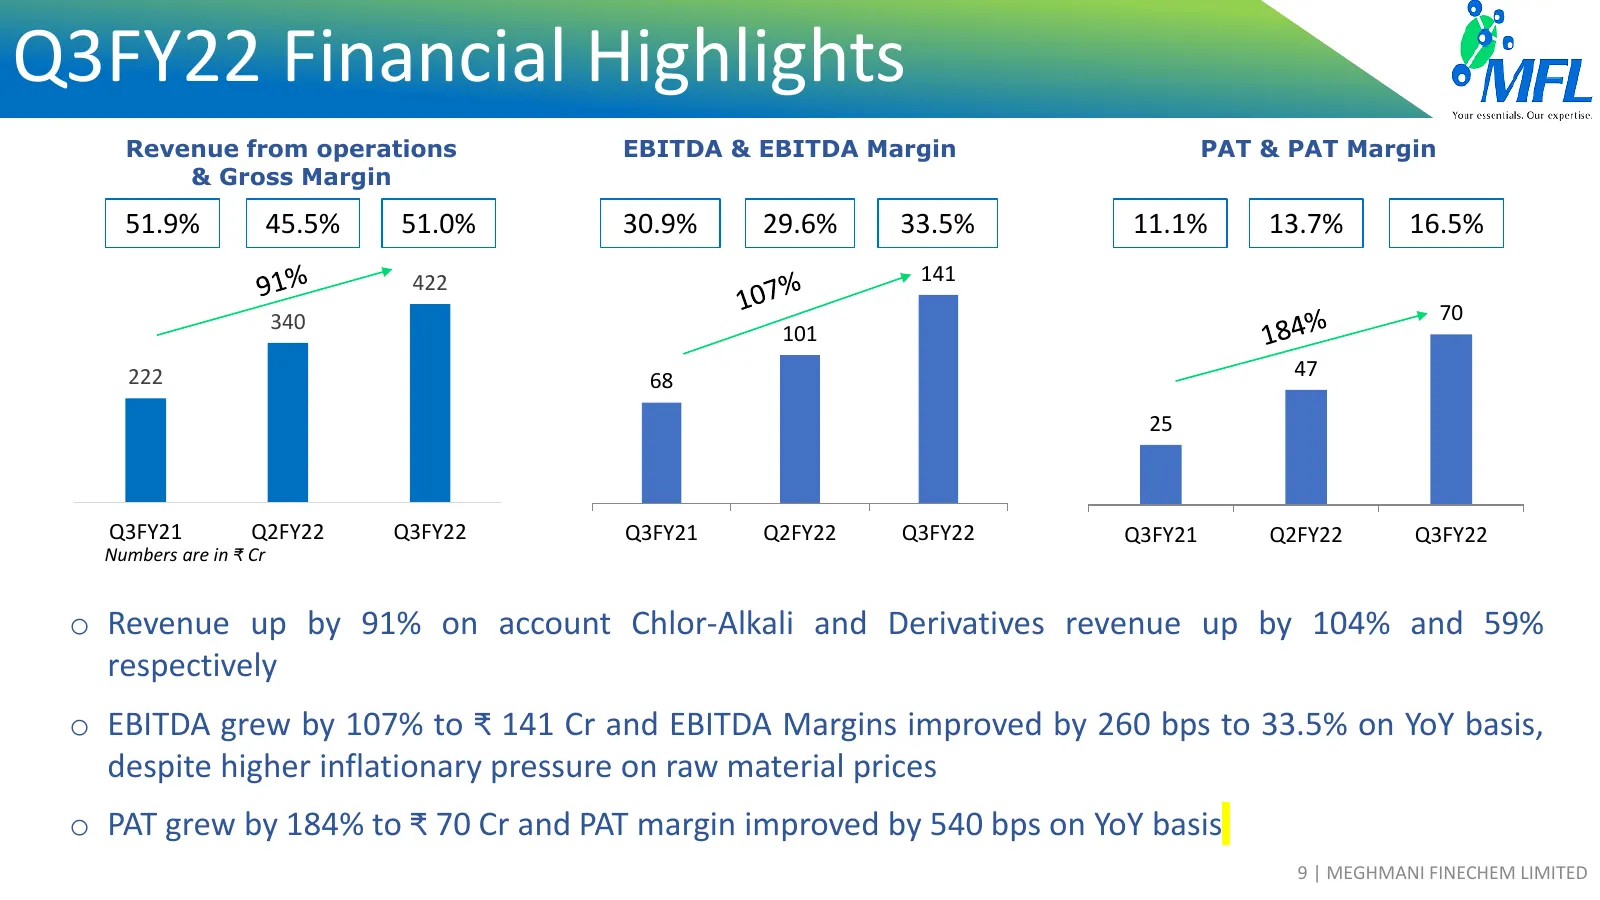
Q3FY22 Financial Highlights Your ('>Stntial~. Ou r ('J,q,e rti se. Revenue from operations EBITDA & EBITDA Margin PAT & PAT Margin & Gross Margin 51.9% I I 45.5% I .______ 51.0% . _ _ _ _ I- 30.9% I I 29.6% I c...____ 33.5% . _ _ _ _ I- 11.1% .______11 13.7% I 16.5% . _ _ _ _ I- 422 141 340 70 101 2
Slide 11: 9MFY22 Operational Overview
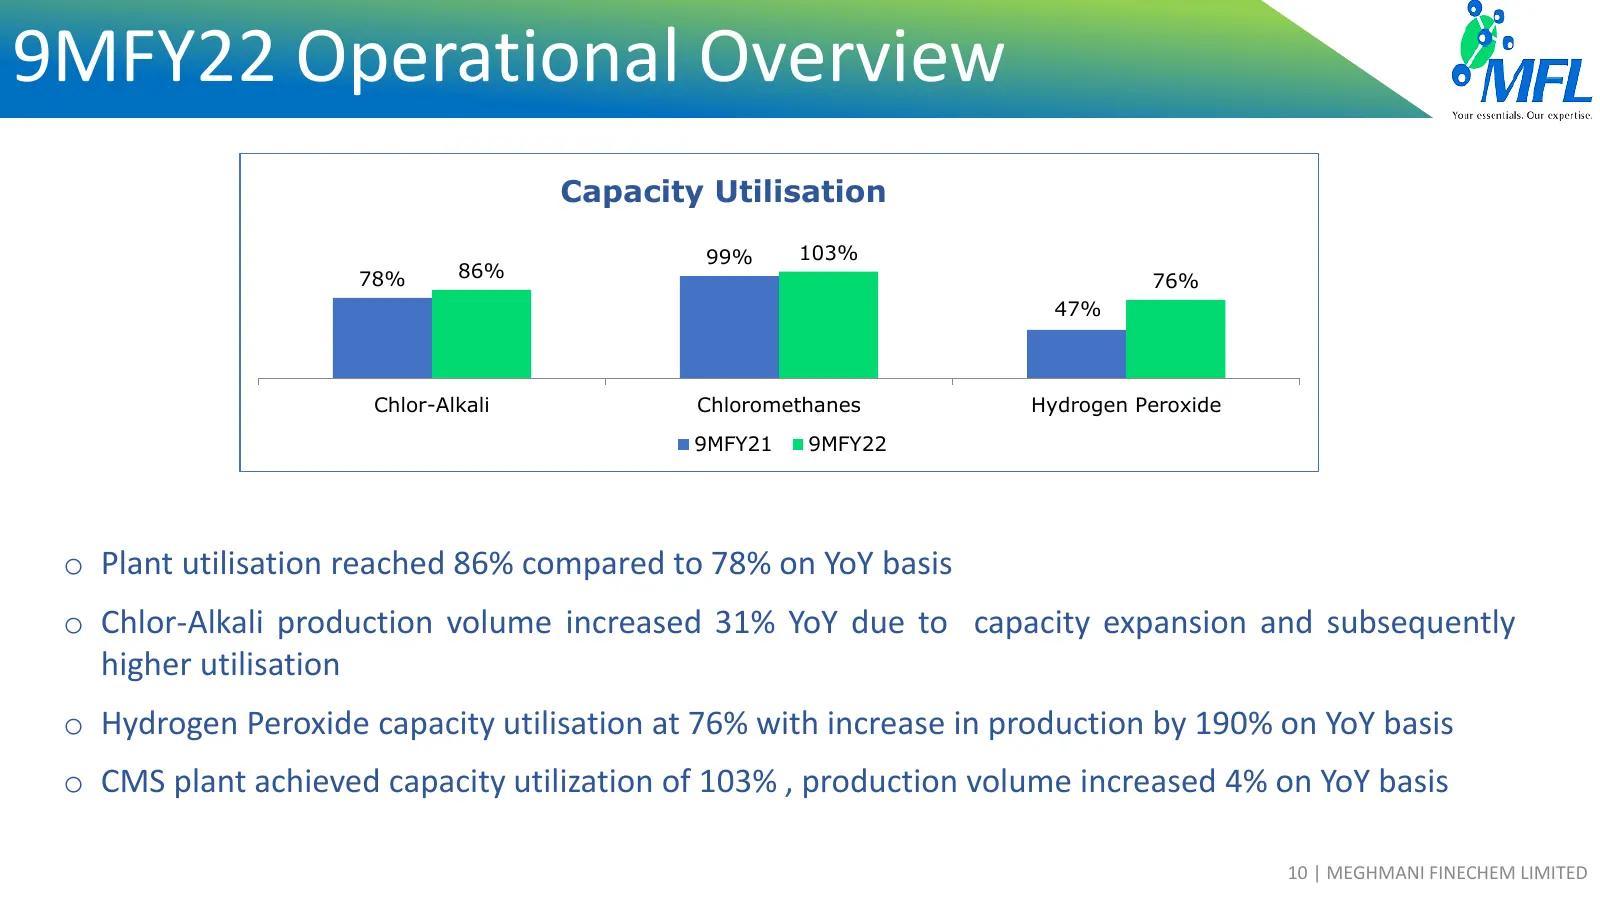
tJ 9MFY22 Operational Overview lrwFL Your ('>Stntial~. Ou r c,q,e rti se. Capacity Utilisation 99% 103% 78% 86% 76% 47% Chlor-Alkali Chloromethanes Hydrogen Peroxide ■ 9MFY21 ■ 9MFY22 o Plant utilisation reached 86% compared to 78% on YoY basis o Chlor-Alkali production volume increased 31% YoY due
Slide 12: 9MFY22 Financial Highlights
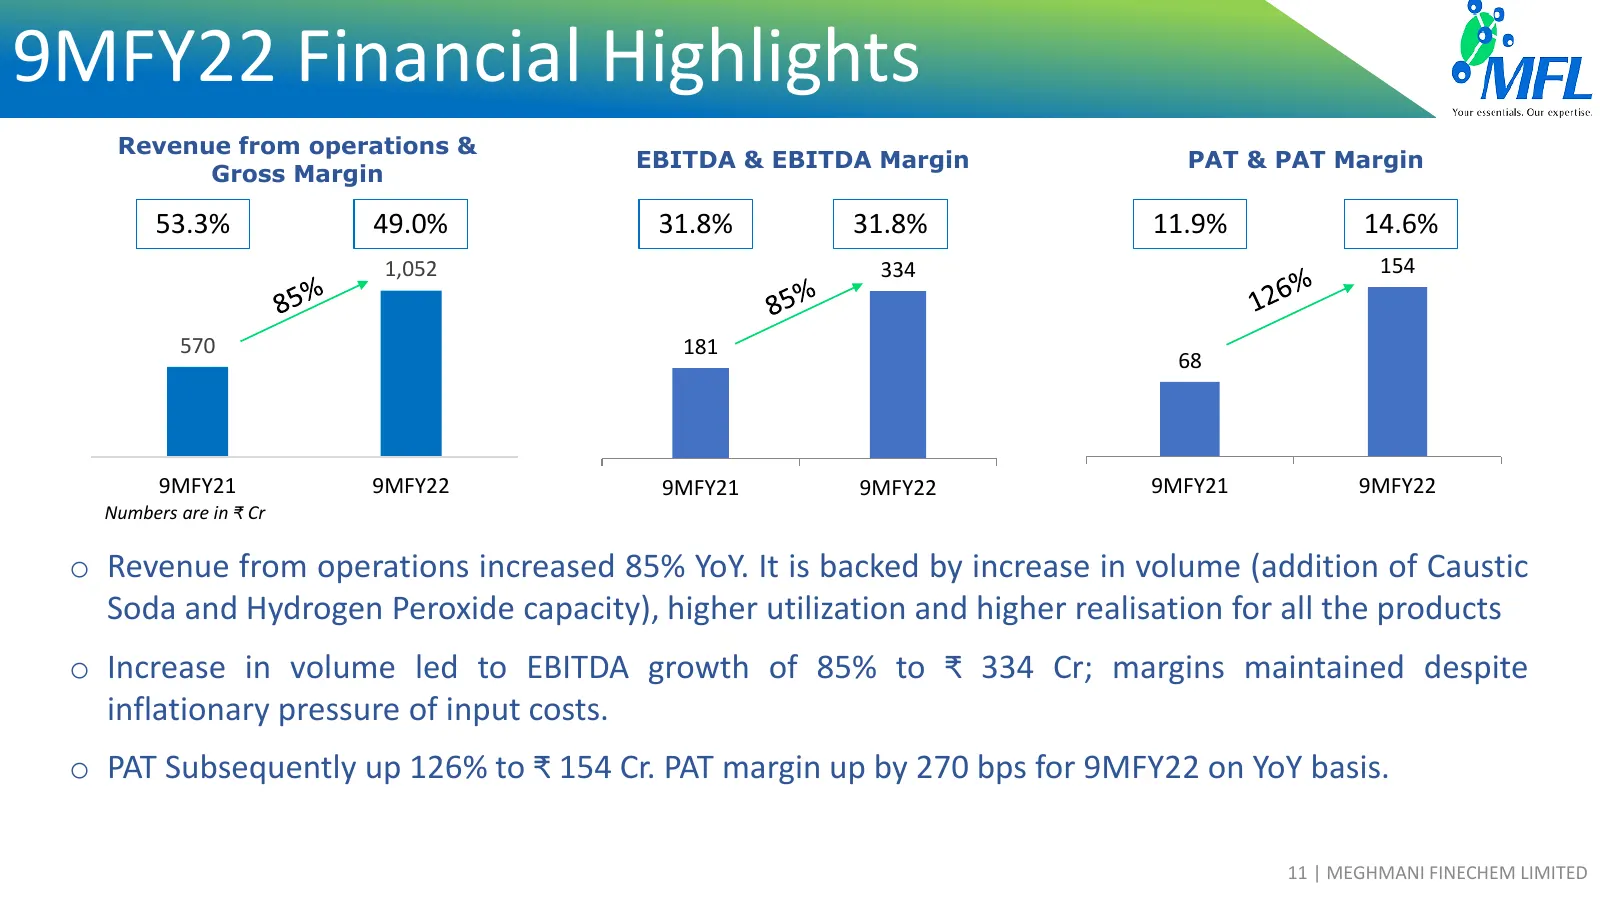
9MFY22 Financial Highlights Yo ur (•~St'nlidl'.), Our c.11. r,c: rt isr. Revenue from operations & EBITDA & EBITDA Margin PAT & PAT Margin Gross Margin 53.3% 49.0% 31.8% 31.8% 11.9% 14.6% 1,052 334 154 570 181 68 9MFY21 9MFY22 9MFY21 9MFY22 9MFY21 9MFY22 Numbers are in ₹ Cr o Revenue from operations
Slide 13: 9MFY22 Key Ratios
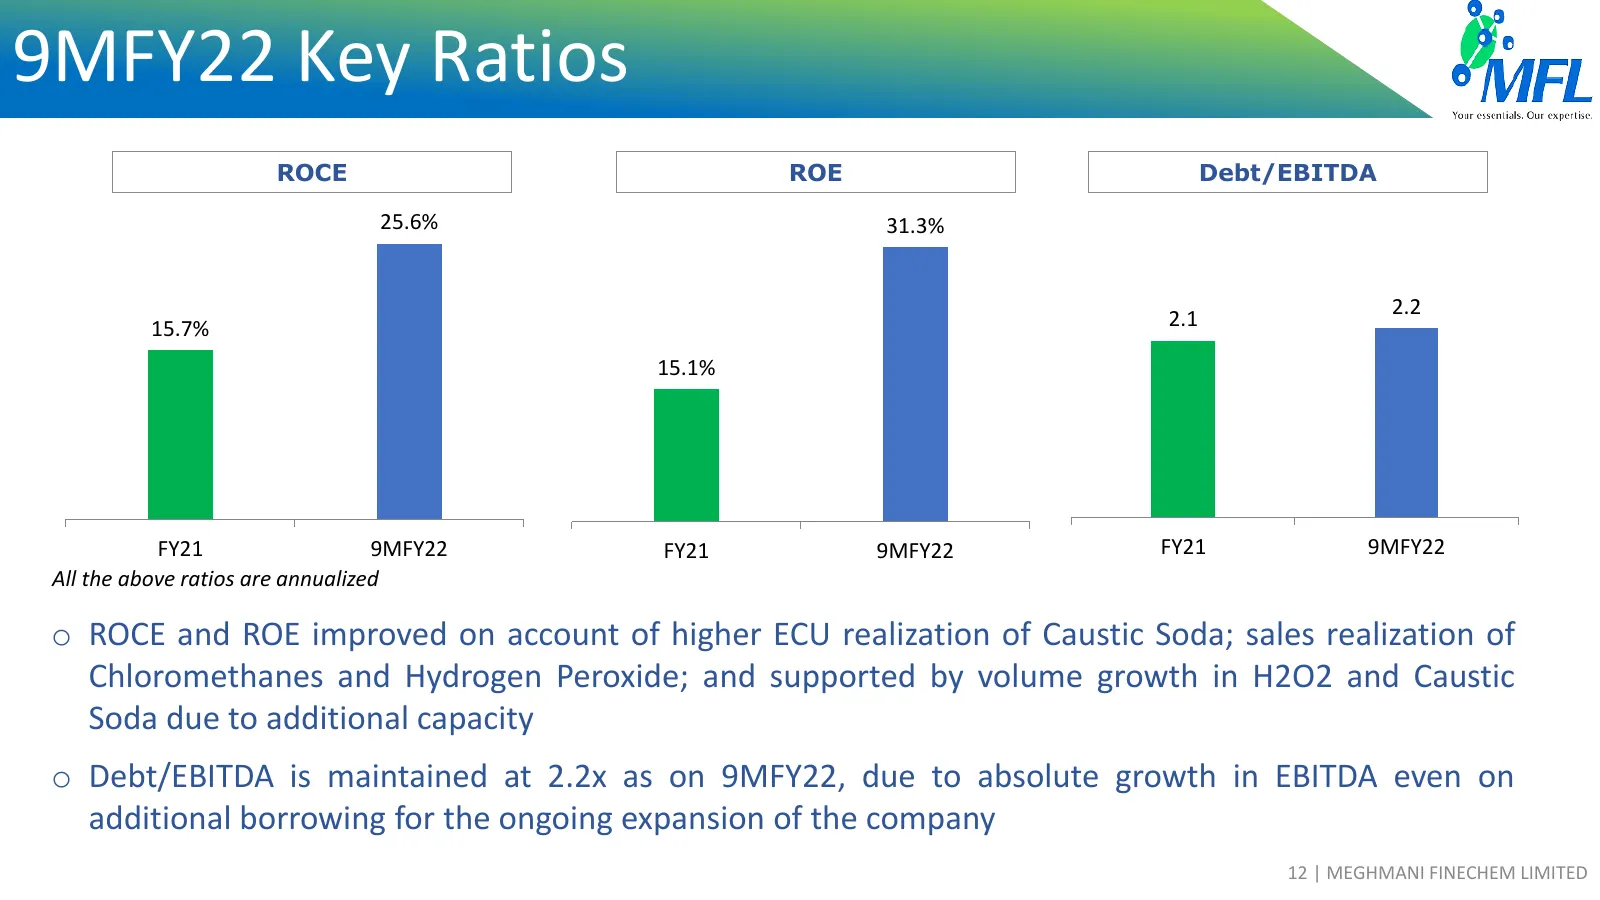
tJ 9MFY22 Key Ratios lrwFL Your ('>Stntial~. Ou r c,q,e rti se. ROCE ROE Debt/EBITDA 25.6% 31.3% 2.2 15.7% 2.1 15.1% FY21 9MFY22 FY21 9MFY22 FY21 9MFY22 All the above ratios are annualized o ROCE and ROE improved on account of higher ECU realization of Caustic Soda; sales realization of Chloromethan
Slide 14: Debt Maturity Profile as on 31-12-2021
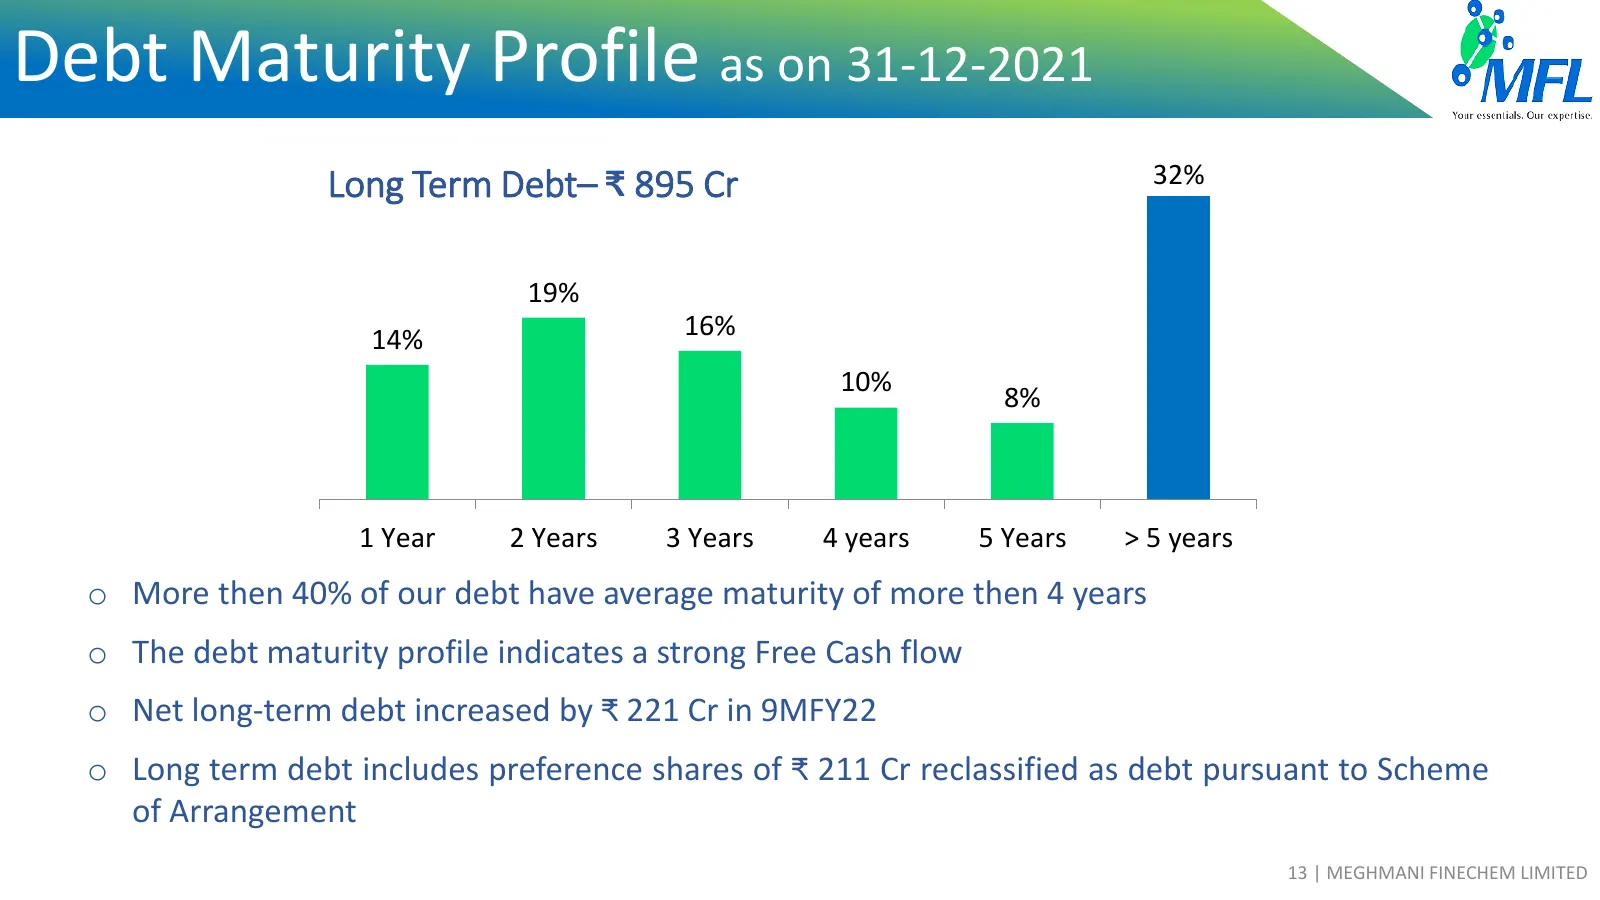
tJ Debt Maturity Profile as on 31-12-2021 lrwFL Your ('>Stntial~. Ou r c,q,e rti se. Long Term Debt– ₹ 895 Cr 32% 19% 14% 16% 10% 8% 1 Year 2 Years 3 Years 4 years 5 Years > 5 years o More then 40% of our debt have average maturity of more then 4 years o The debt maturity profile indicates a strong
Slide 15: Chlor-Alkali vs Derivatives
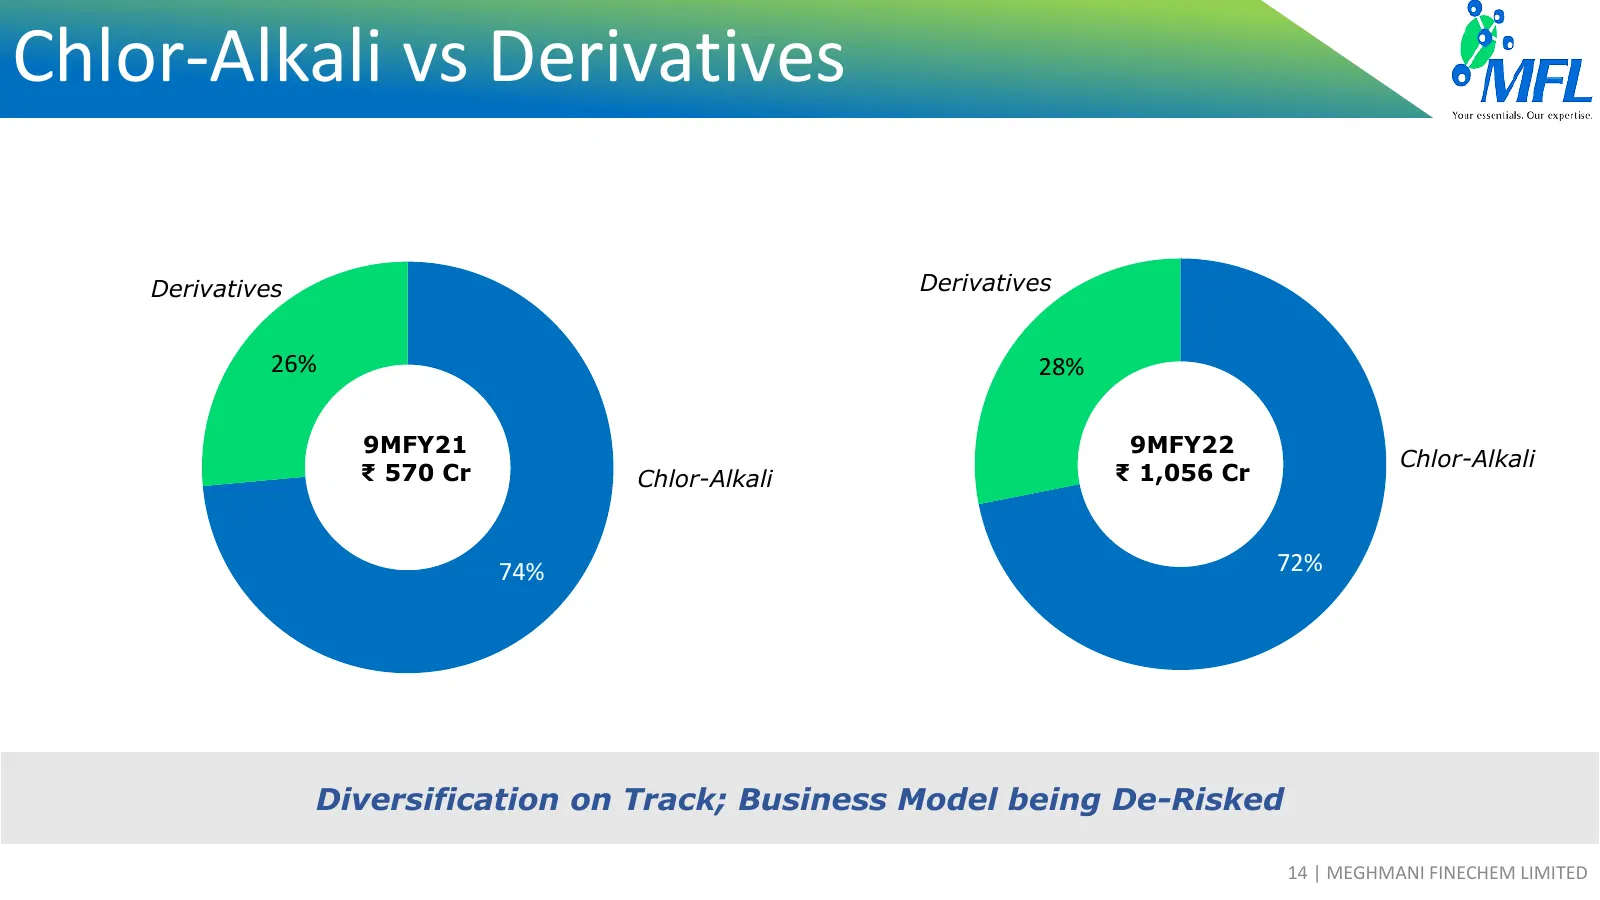
tJ Chlor-Alkali vs Derivatives lrwFL Your ('>Stntial~. Ou r c,q,e rti se. Derivatives Derivatives 26% 28% 9MFY21 9MFY22 Chlor-Alkali ₹ 570 Cr Chlor-Alkali ₹ 1,056 Cr 74% 72% Diversification on Track; Business Model being De-Risked 14 | MEGHMANI FINECHEM LIMITED
Slide 16: Projects Update
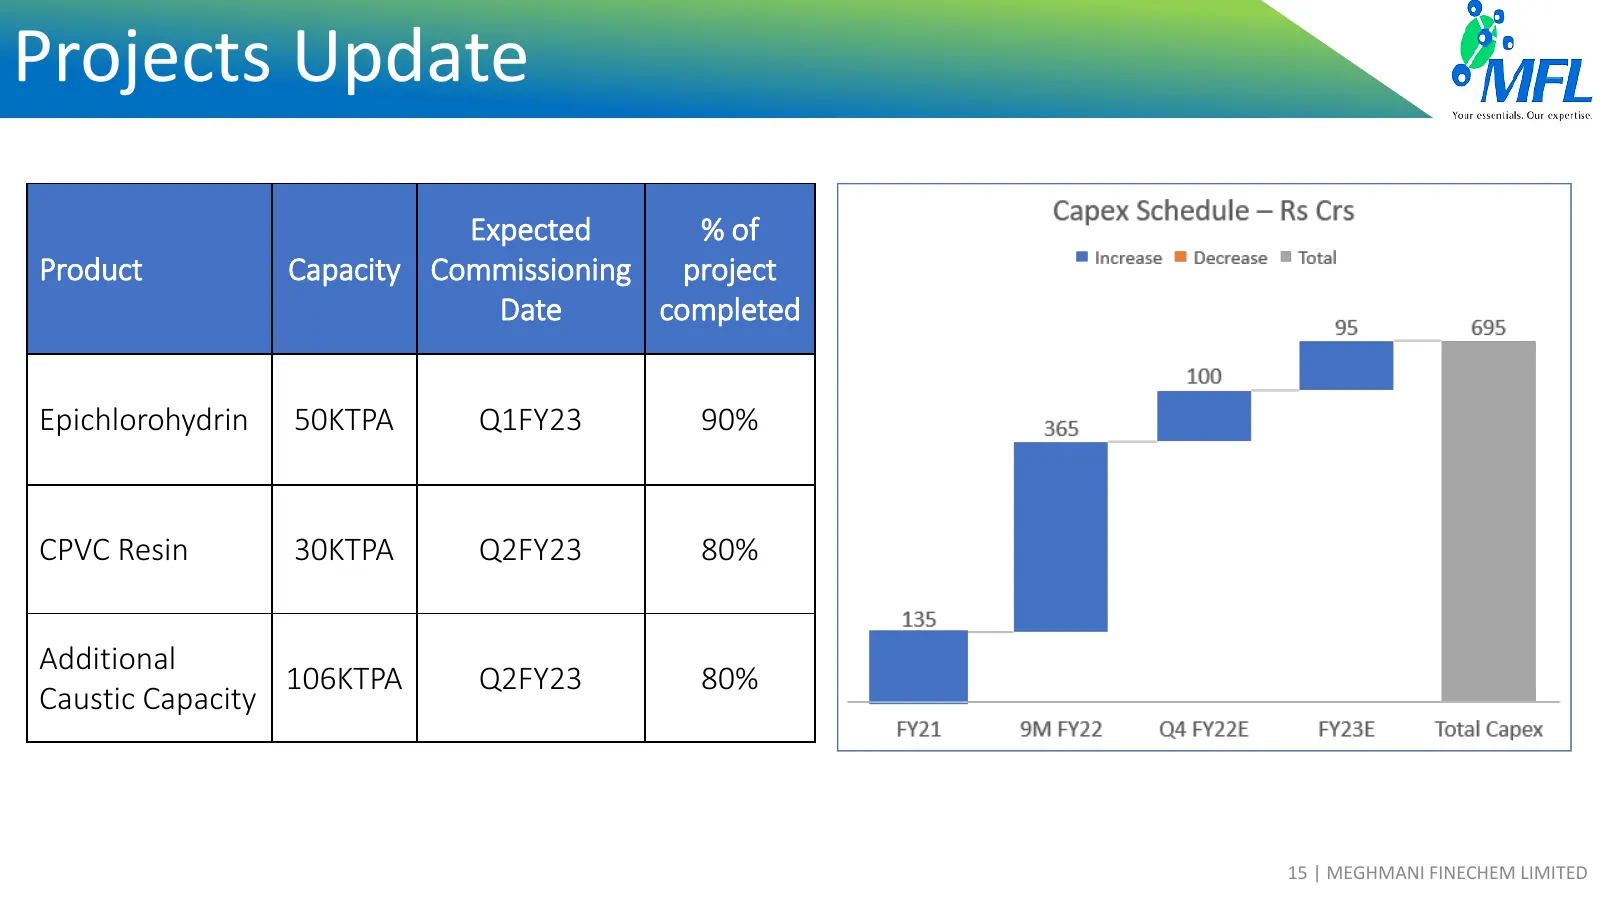
tJ Projects Update lrwFL Your ('>Stntial~. Ou r c,q,e rti se. Capex Schedu le - Rs Crs Expected % of ■ Increase ■ Decrease ■ Total Product Capacity Commissioning project Date completed 95 695 100 Epichlorohydrin 50KTPA Q1FY23 90% 36.S CPVC Resin 30KTPA Q2FY23 80% 135 Additional 106KTPA Q2FY23 80% Ca
Slide 17: Focused on ESG
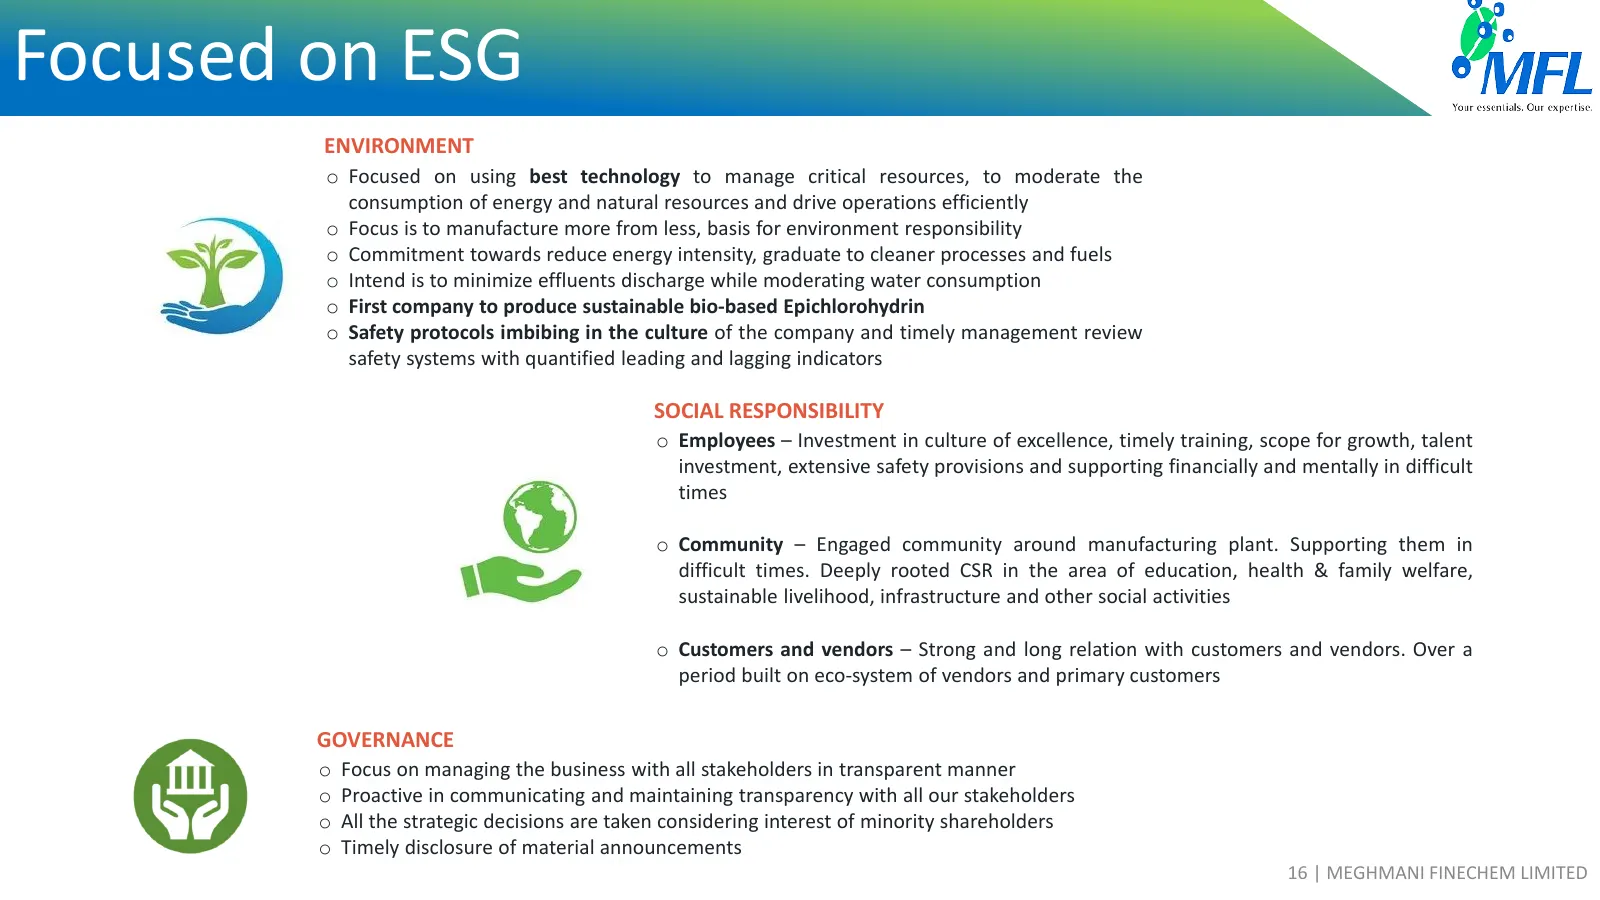
Focused on ESG ENVIRONMENT o Focused on using best technology to manage critical resources, to moderate the consumption of energy and natural resources and drive operations efficiently o Focus is to manufacture more from less, basis for environment responsibility o Commitment towards reduce energy i
Slide 18: Income Statement
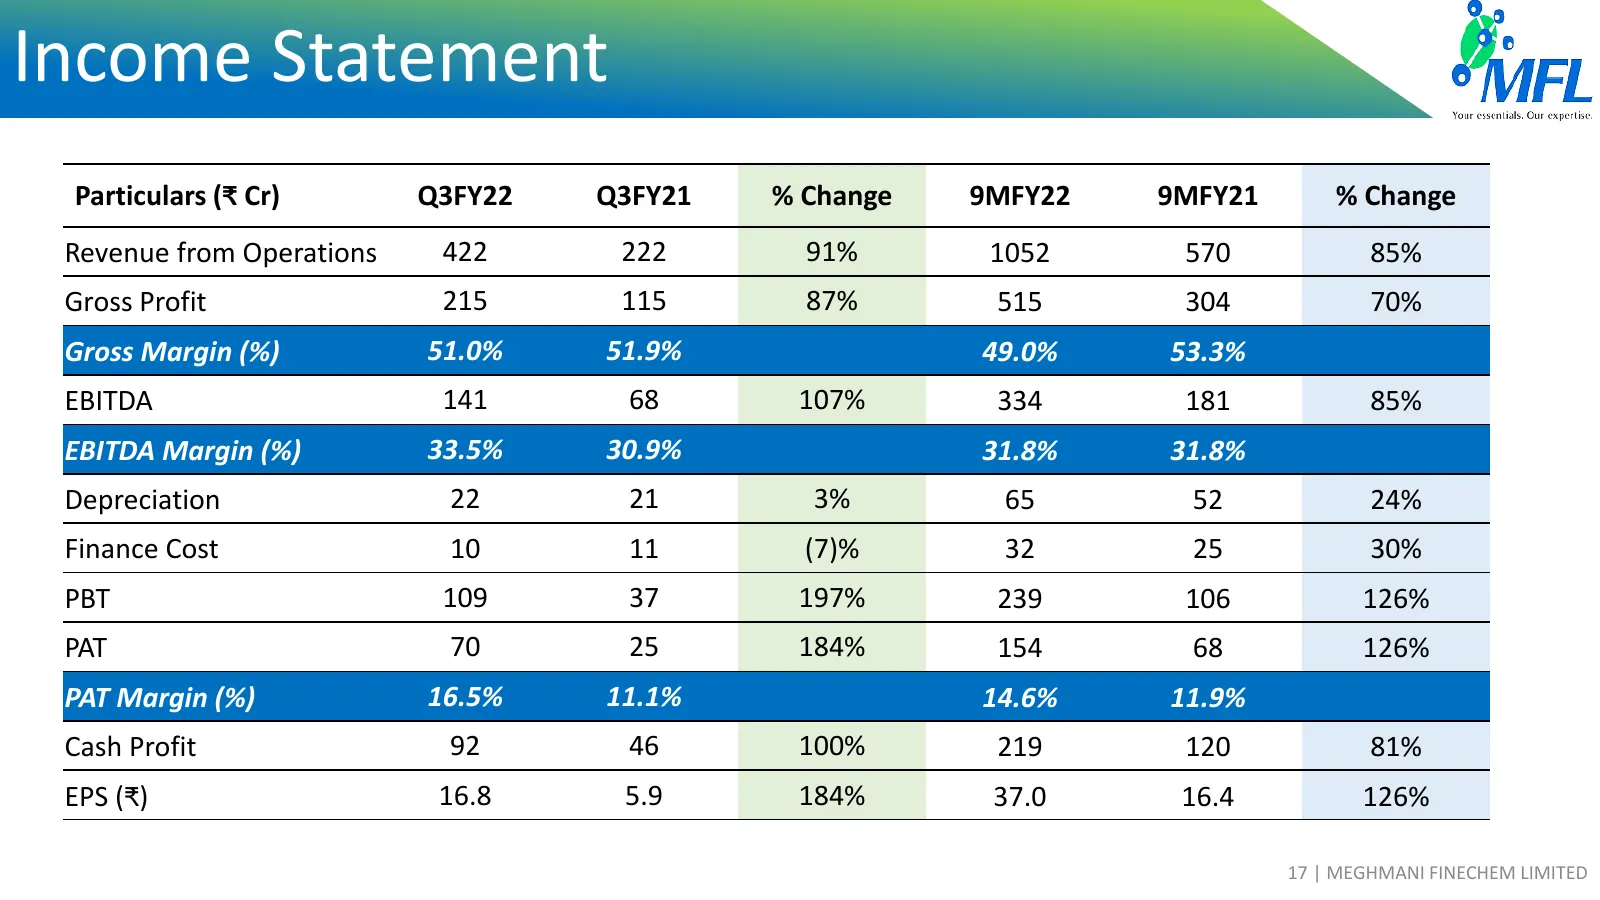
Income Statement Your ('>Stntial~. Ou r ('J,q,e rti se. Particulars (₹ Cr) Q3FY22 Q3FY21 % Change 9MFY22 9MFY21 % Change Revenue from Operations 422 222 91% 1052 570 85% Gross Profit 215 115 87% 515 304 70% Gross Margin (%) 51.0% 51.9% 49.0% 53.3% EBITDA 141 68 107% 334 181 85% EBITDA Margin (%) 33.
Slide 19: Historic Income Statement
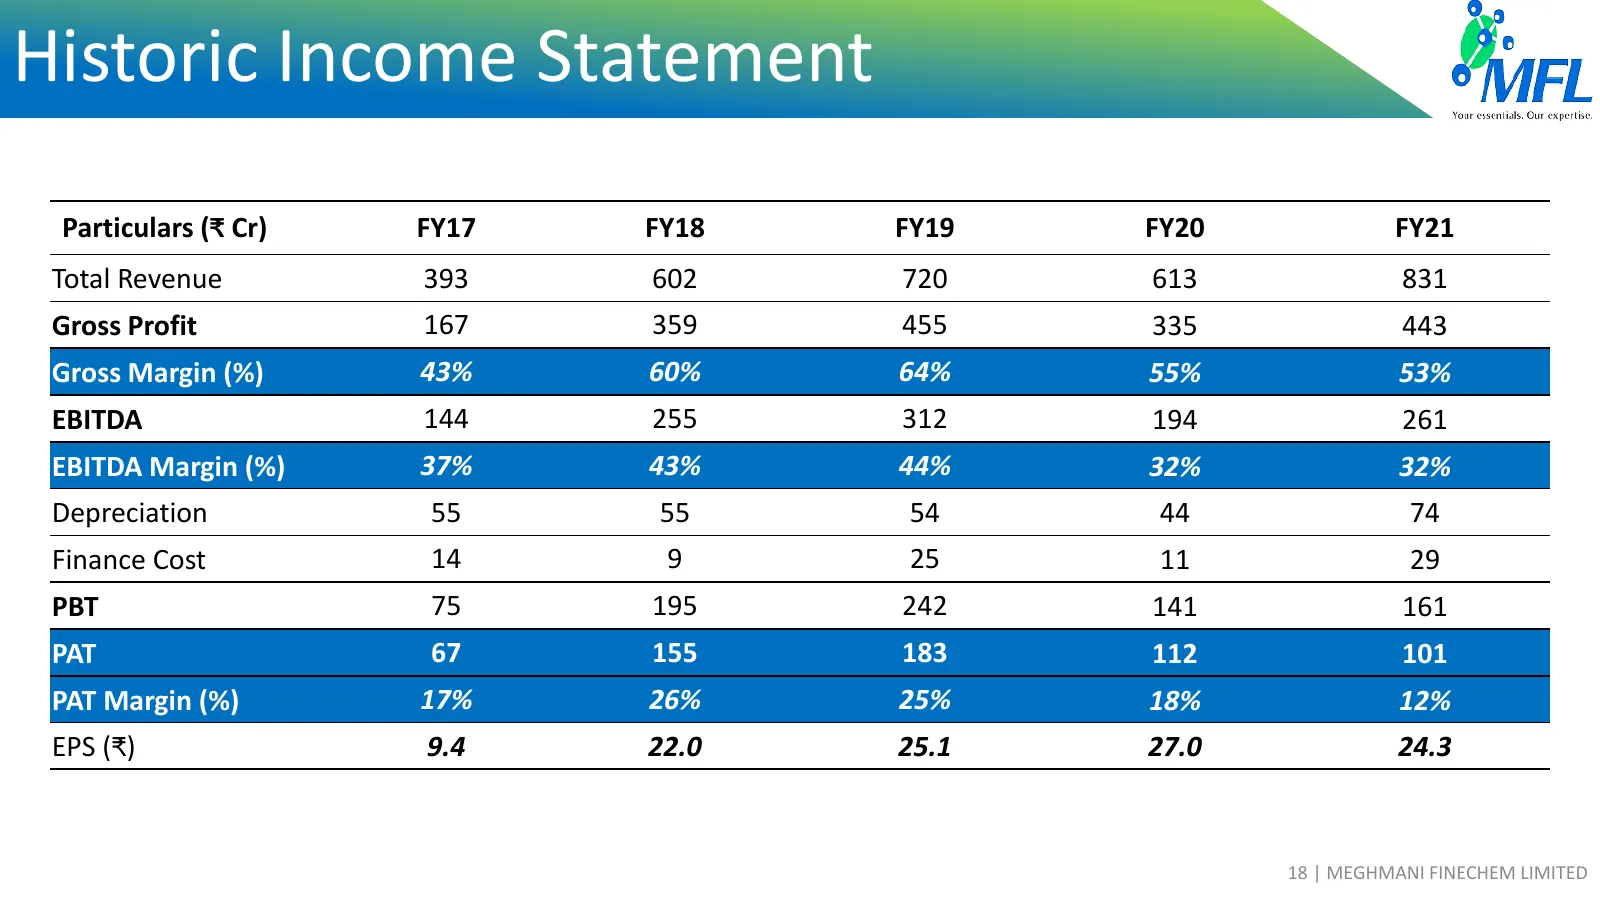
Historic Income Statement Your ('>Stntial~. Ou r ('J,q,e rti se. Particulars (₹ Cr) FY17 FY18 FY19 FY20 FY21 Total Revenue 393 602 720 613 831 Gross Profit 167 359 455 335 443 Gross Margin (%) 43% 60% 64% 55% 53% EBITDA 144 255 312 194 261 EBITDA Margin (%) 37% 43% 44% 32% 32% Depreciation 55 55 54
Slide 20: Historic Balance Sheet
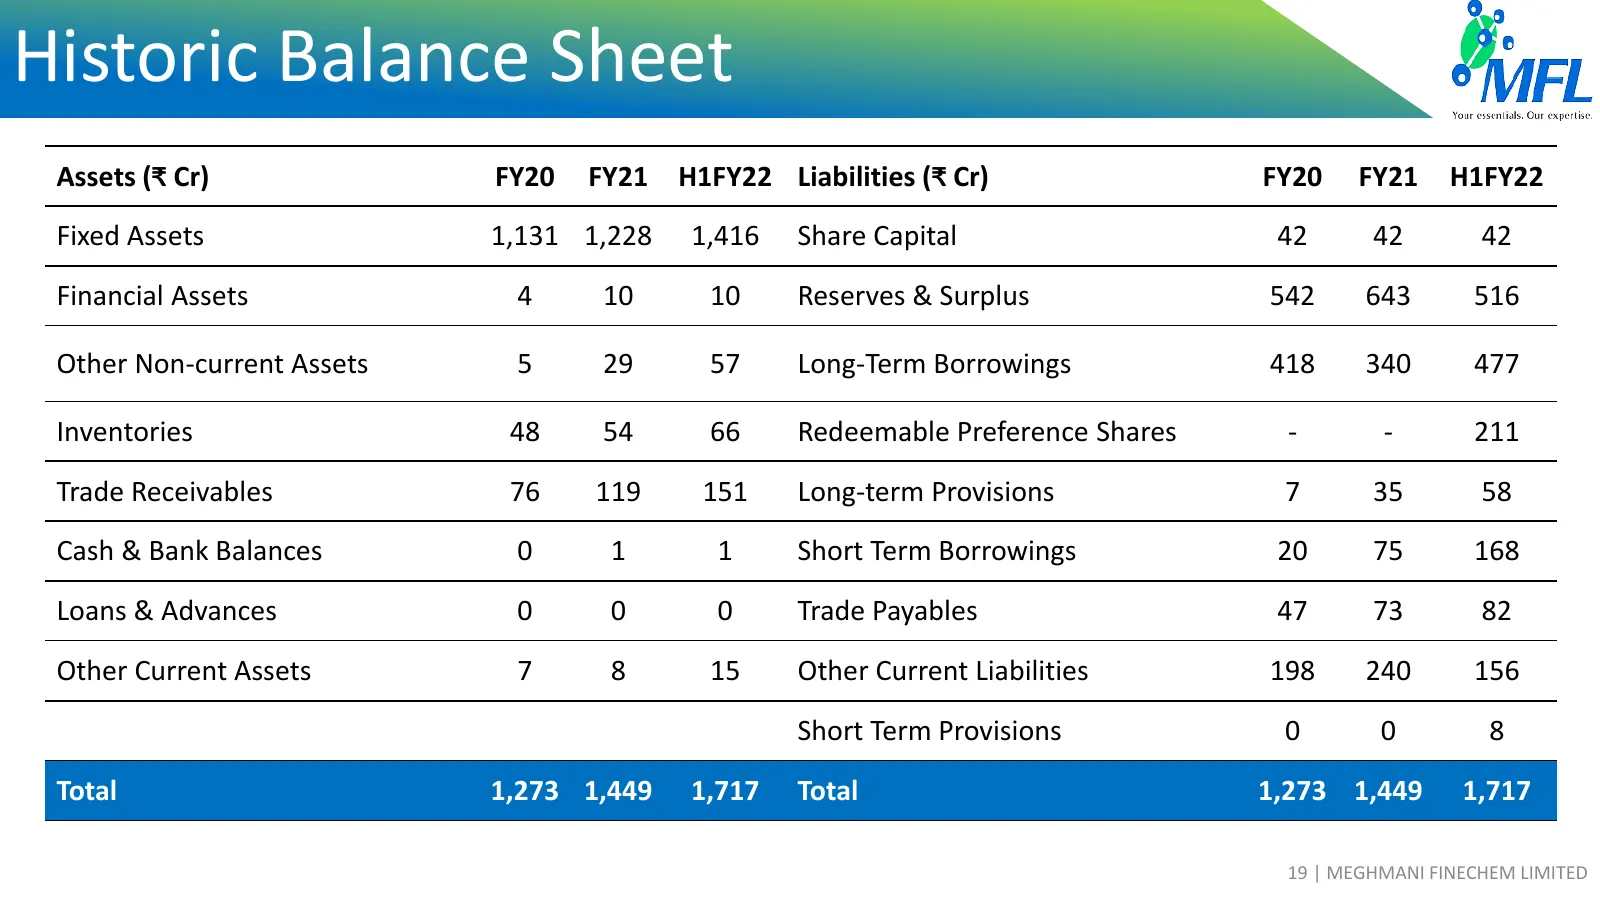
Historic Balance Sheet Your ('>Stntial~. Ou r ('J,q,e rti se. Assets (₹ Cr) FY20 FY21 H1FY22 Liabilities (₹ Cr) FY20 FY21 H1FY22 Fixed Assets 1,131 1,228 1,416 Share Capital 42 42 42 Financial Assets 4 10 10 Reserves & Surplus 542 643 516 Other Non-current Assets 5 29 57 Long-Term Borrowings 418 340
Slide 21: About Us & Investor Contact
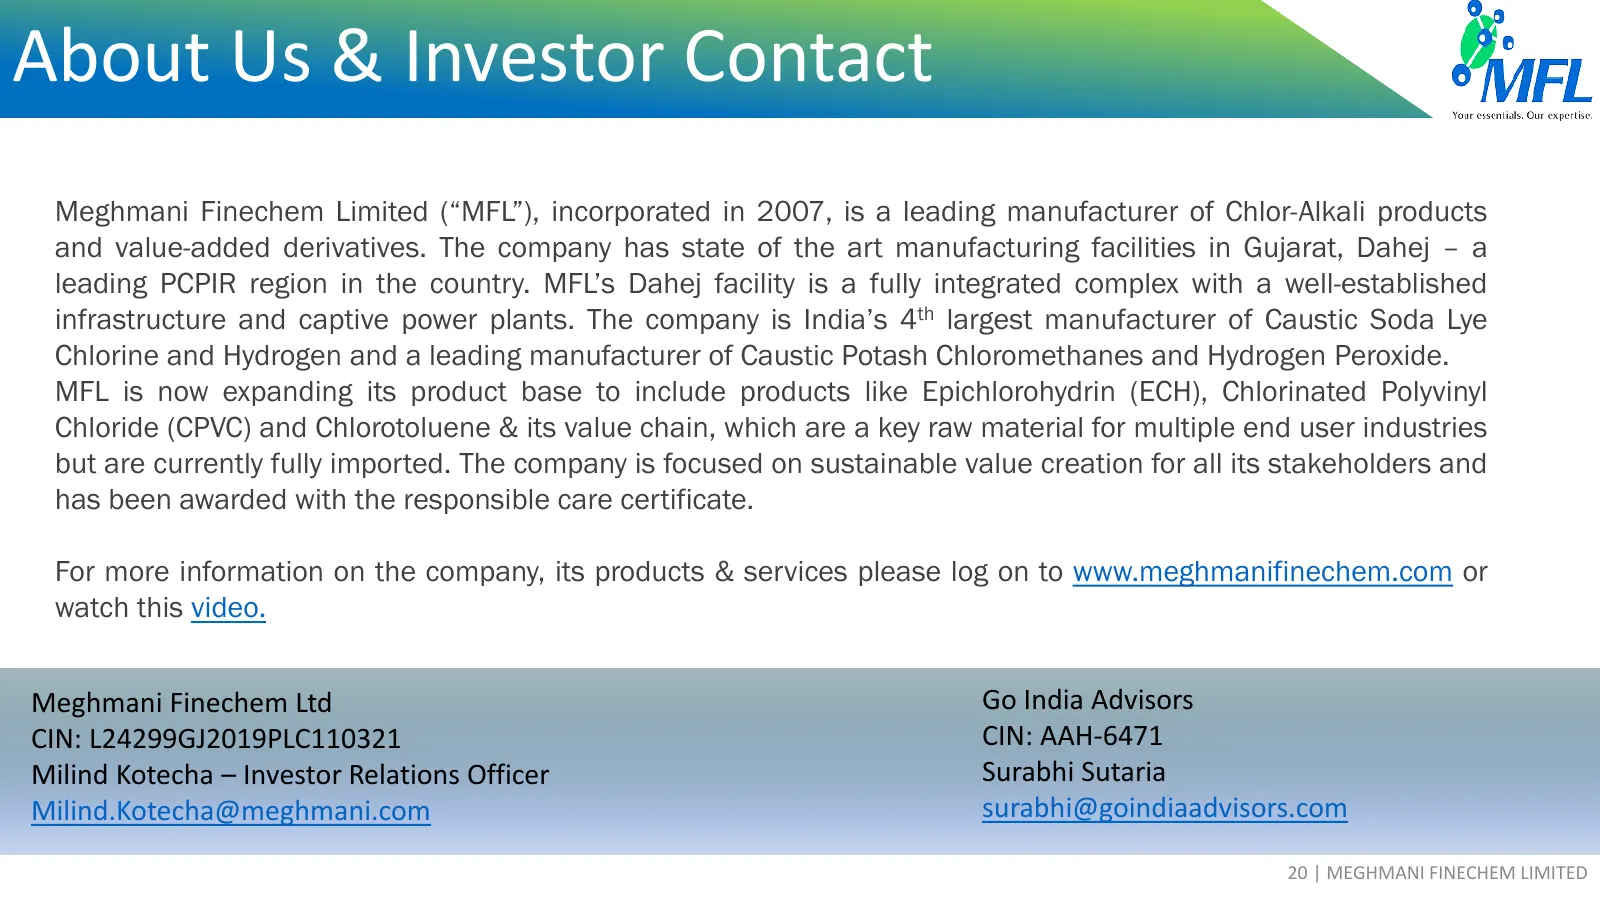
About Us & Investor Contact Meghmani Finechem Limited (“MFL”), incorporated in 2007, is a leading manufacturer of Chlor-Alkali products and value-added derivatives. The company has state of the art manufacturing facilities in Gujarat, Dahej – a leading PCPIR region in the country. MFL’s Dahej facili
Source: company website
More decks from Epigral Ltd
 Q2 FY2027 Earnings Presentation42 slides · Nov 2, 2026
 Q1 FY2027 Earnings Presentation38 slides · Jul 27, 2026
 Q4 FY2026 Earnings Presentation39 slides · May 2, 2026
 Q3 FY2026 Earnings Presentation39 slides · Jan 30, 2026
 Q2 FY2026 Earnings Presentation39 slides · Nov 10, 2025
 Q1 FY2026 Earnings Presentation37 slides · Aug 2, 2025