Fauquier Bankshares — Shareholder Meeting (May 2014)
18 slides from Fauquier Bankshares's shareholder meeting presentation, May 21, 2014
Slide 1: Annual Shareholders' Meeting
_____________________FAUQUIER BANKSHARES, INC.ANNUAL SHAREHOLDERS’ MEETING Deeply rooted in our community. May 20, 2014
Slide 2: Safe Harbor Statement
Safe Harbor Statement Today’s presentations may include forward-looking statements. These statements represent the company's beliefs regarding future events that, by their nature, are uncertain and outside of the company’s control. The company’s actual results and financial condition may differ, pos
Slide 3: Financial Condition
Financial Condition FAUQUIER BANKSHARES, INC. *
Slide 4: Total Assets
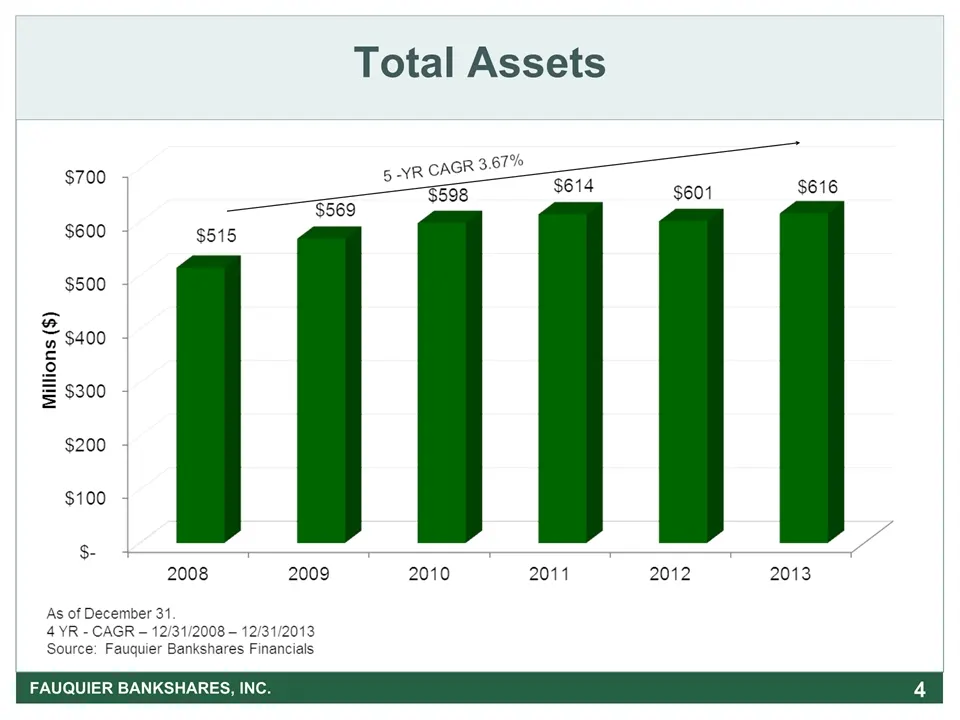
* Total Assets FAUQUIER BANKSHARES, INC.
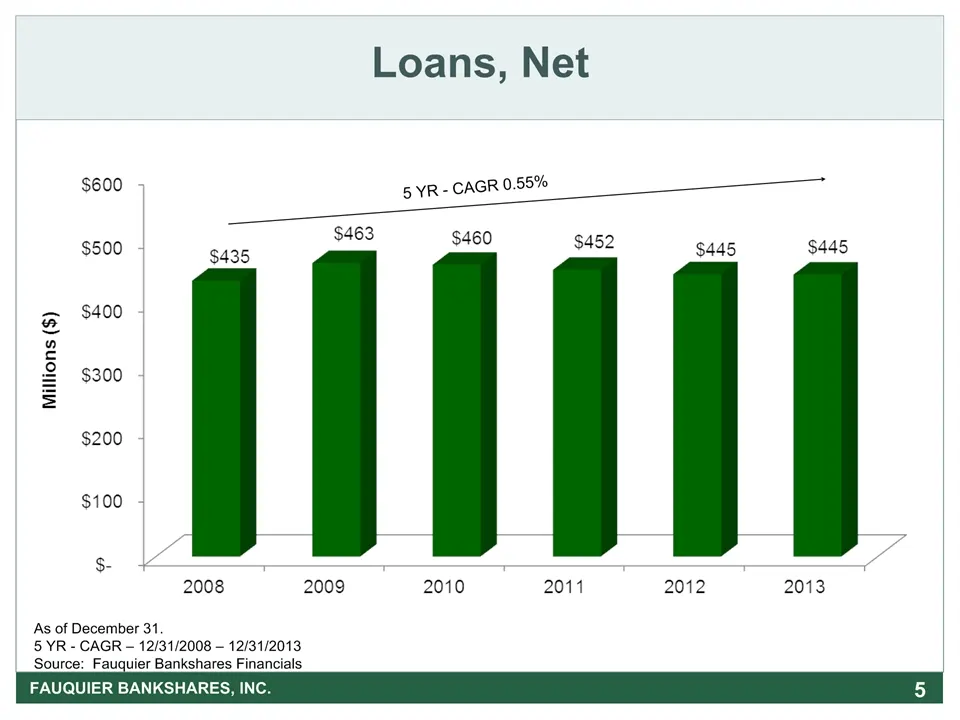
Slide 5: Loans, Net
* Loans, Net FAUQUIER BANKSHARES, INC. As of December 31.5 YR - CAGR – 12/31/2008 – 12/31/2013Source: Fauquier Bankshares Financials 5 YR - CAGR 0.55%
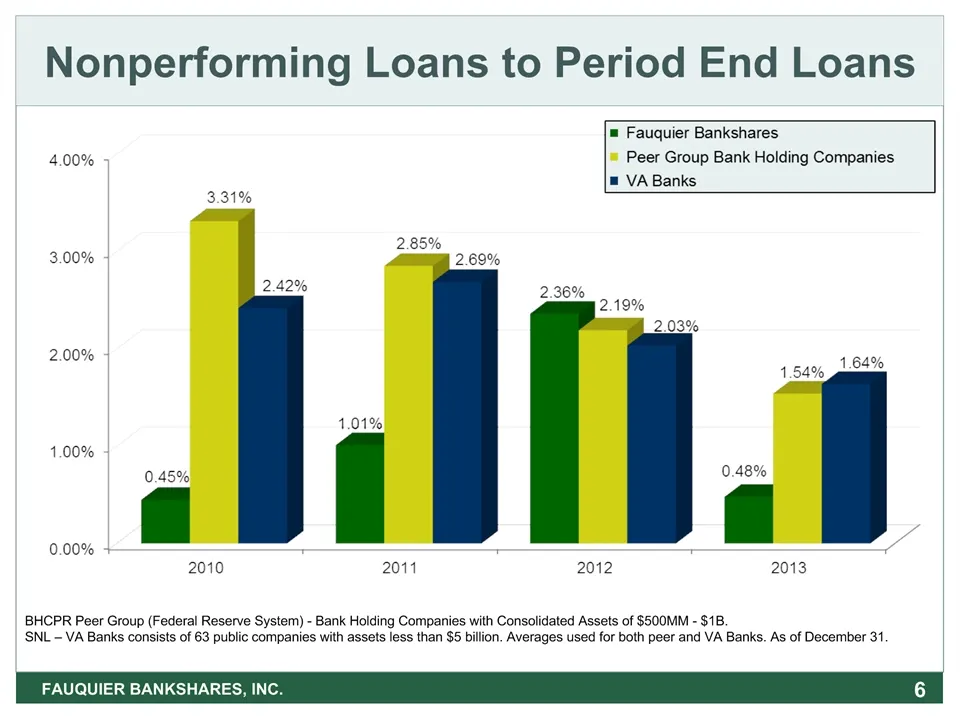
Slide 6: Nonperforming Loans to Period End Loans
* Nonperforming Loans to Period End Loans FAUQUIER BANKSHARES, INC. BHCPR Peer Group (Federal Reserve System) - Bank Holding Companies with Consolidated Assets of $500MM - $1B.SNL – VA Banks consists of 63 public companies with assets less than $5 billion. Averages used for both peer and VA Banks. A
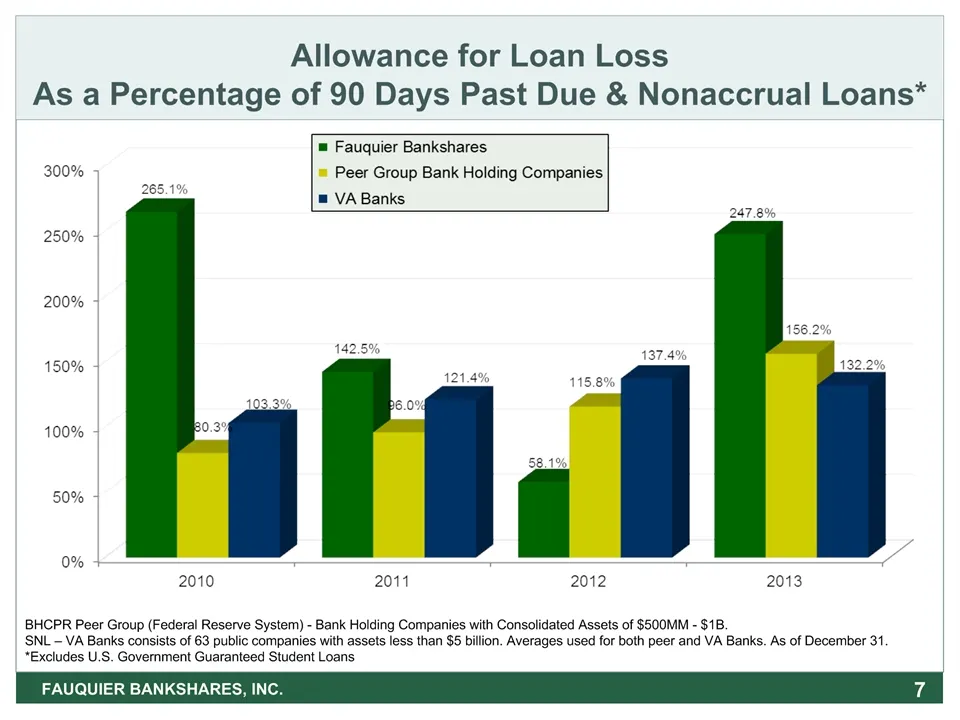
Slide 7: Allowance for Loan Loss
* FAUQUIER BANKSHARES, INC. Allowance for Loan LossAs a Percentage of 90 Days Past Due & Nonaccrual Loans* BHCPR Peer Group (Federal Reserve System) - Bank Holding Companies with Consolidated Assets of $500MM - $1B.SNL – VA Banks consists of 63 public companies with assets less than $5 billion. Aver
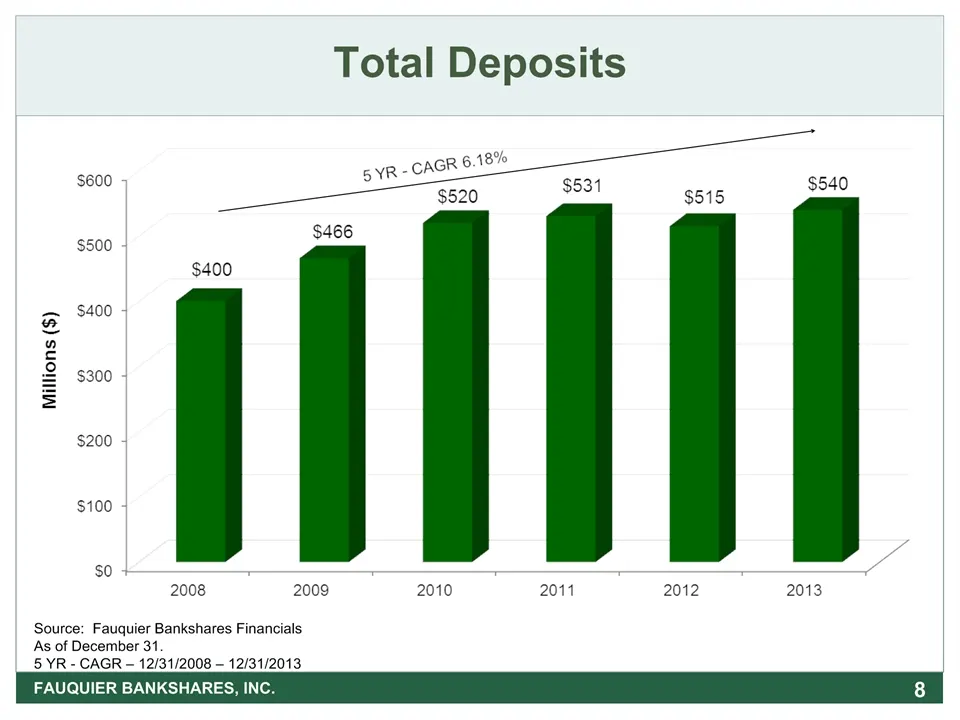
Slide 8: Total Deposits
* Total Deposits FAUQUIER BANKSHARES, INC. Source: Fauquier Bankshares FinancialsAs of December 31.5 YR - CAGR – 12/31/2008 – 12/31/2013
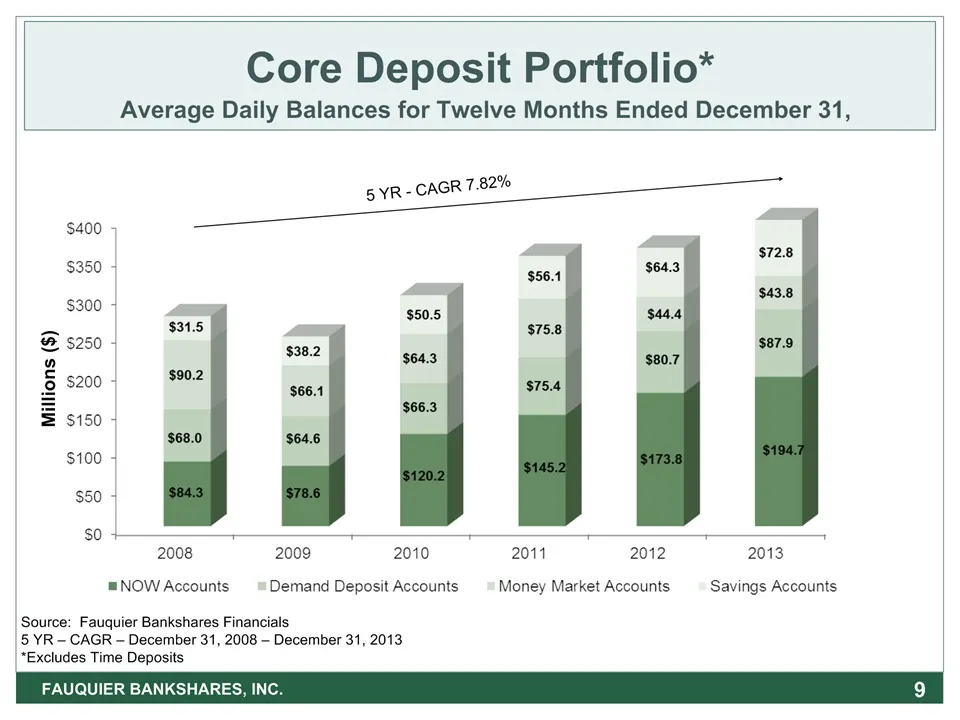
Slide 9: Core Deposit Portfolio
Core Deposit Portfolio* FAUQUIER BANKSHARES, INC. Average Daily Balances for Twelve Months Ended December 31, Source: Fauquier Bankshares Financials5 YR – CAGR – December 31, 2008 – December 31, 2013*Excludes Time Deposits * 5 YR - CAGR 7.82% Millions ($)
Slide 10: Financial Performance and Goals
Financial Performance and Goals FAUQUIER BANKSHARES, INC. *
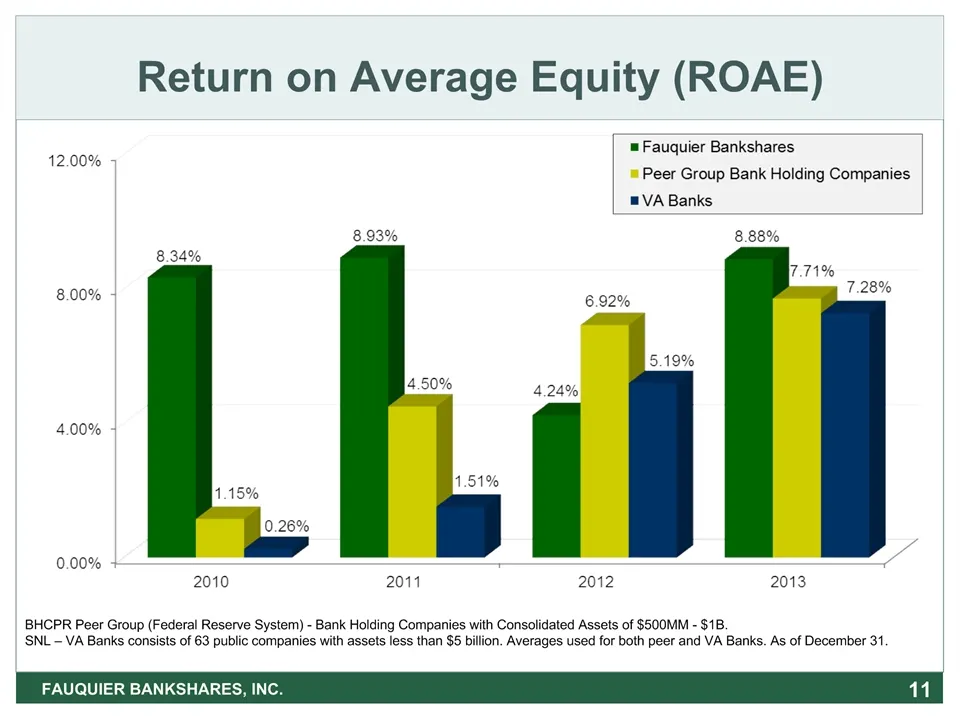
Slide 11: Return on Average Equity (ROAE)
Return on Average Equity (ROAE) FAUQUIER BANKSHARES, INC. * BHCPR Peer Group (Federal Reserve System) - Bank Holding Companies with Consolidated Assets of $500MM - $1B.SNL – VA Banks consists of 63 public companies with assets less than $5 billion. Averages used for both peer and VA Banks. As of Dec
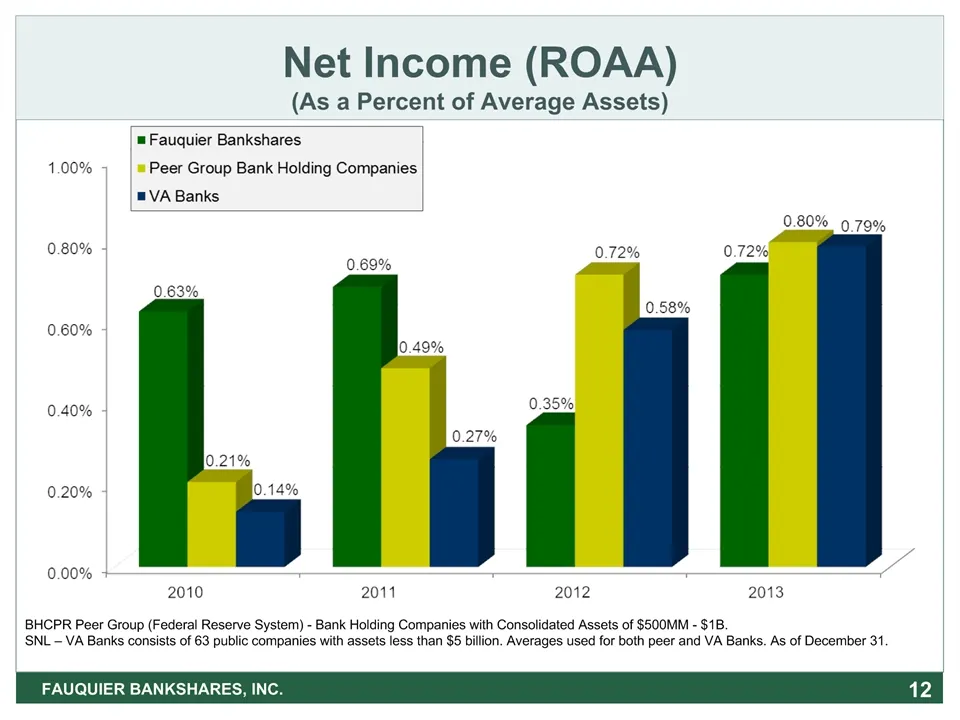
Slide 12: Net Income (ROAA)
* Net Income (ROAA)(As a Percent of Average Assets) FAUQUIER BANKSHARES, INC. BHCPR Peer Group (Federal Reserve System) - Bank Holding Companies with Consolidated Assets of $500MM - $1B.SNL – VA Banks consists of 63 public companies with assets less than $5 billion. Averages used for both peer and V
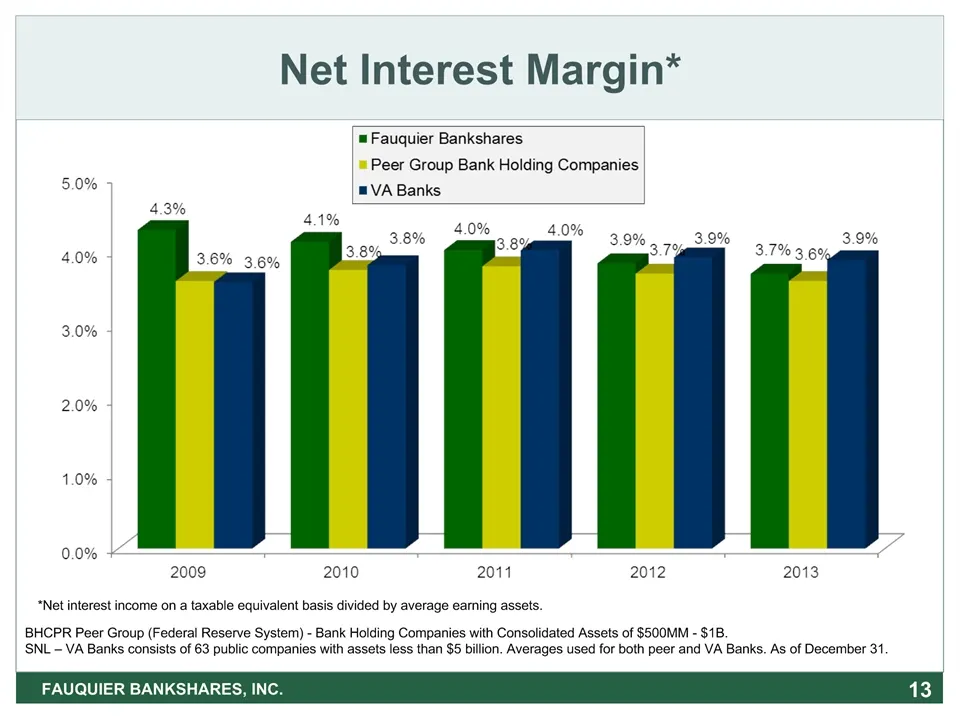
Slide 13: Net Interest Margin
Net Interest Margin* * FAUQUIER BANKSHARES, INC. *Net interest income on a taxable equivalent basis divided by average earning assets. BHCPR Peer Group (Federal Reserve System) - Bank Holding Companies with Consolidated Assets of $500MM - $1B.SNL – VA Banks consists of 63 public companies with asset
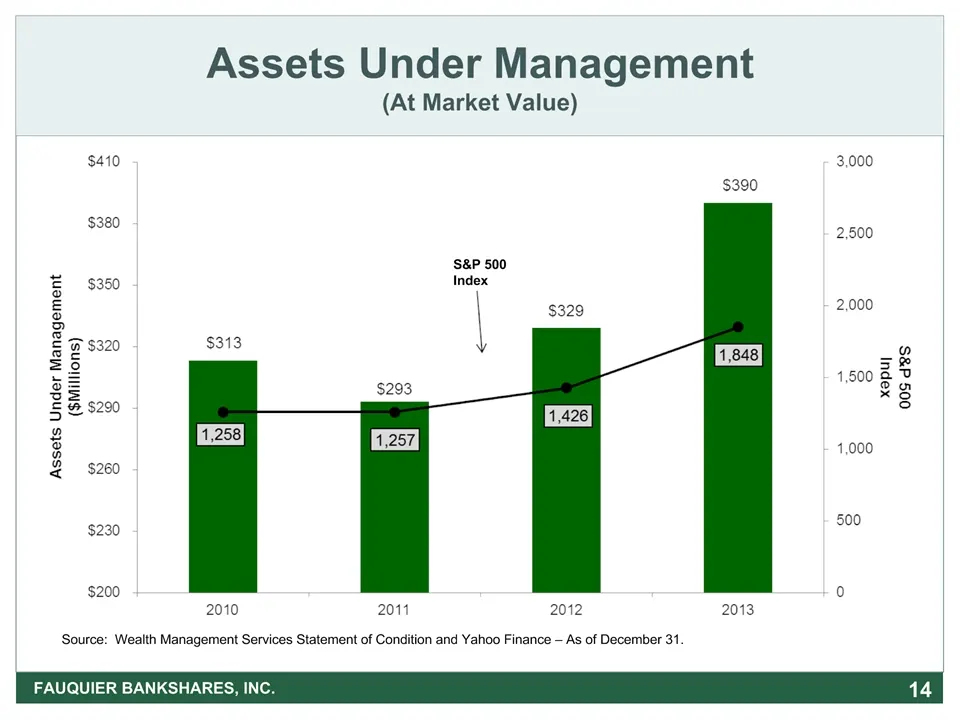
Slide 14: Assets Under Management
* Assets Under Management(At Market Value) FAUQUIER BANKSHARES, INC. Source: Wealth Management Services Statement of Condition and Yahoo Finance – As of December 31. S&P 500 Index
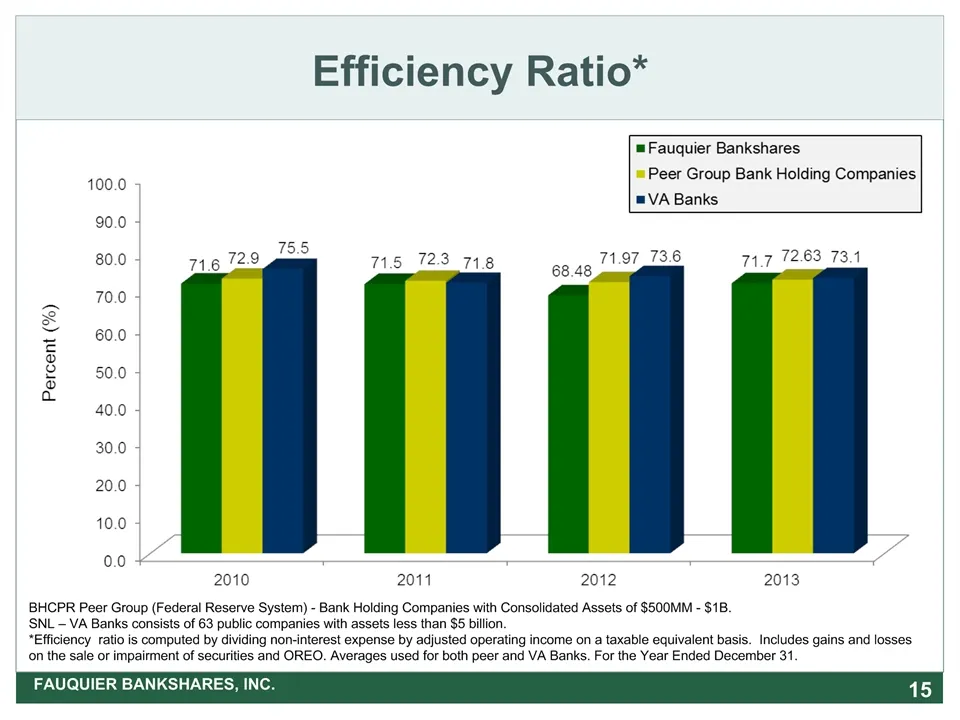
Slide 15: Efficiency Ratio
Efficiency Ratio* FAUQUIER BANKSHARES, INC. * BHCPR Peer Group (Federal Reserve System) - Bank Holding Companies with Consolidated Assets of $500MM - $1B.SNL – VA Banks consists of 63 public companies with assets less than $5 billion.*Efficiency ratio is computed by dividing non-interest expense by
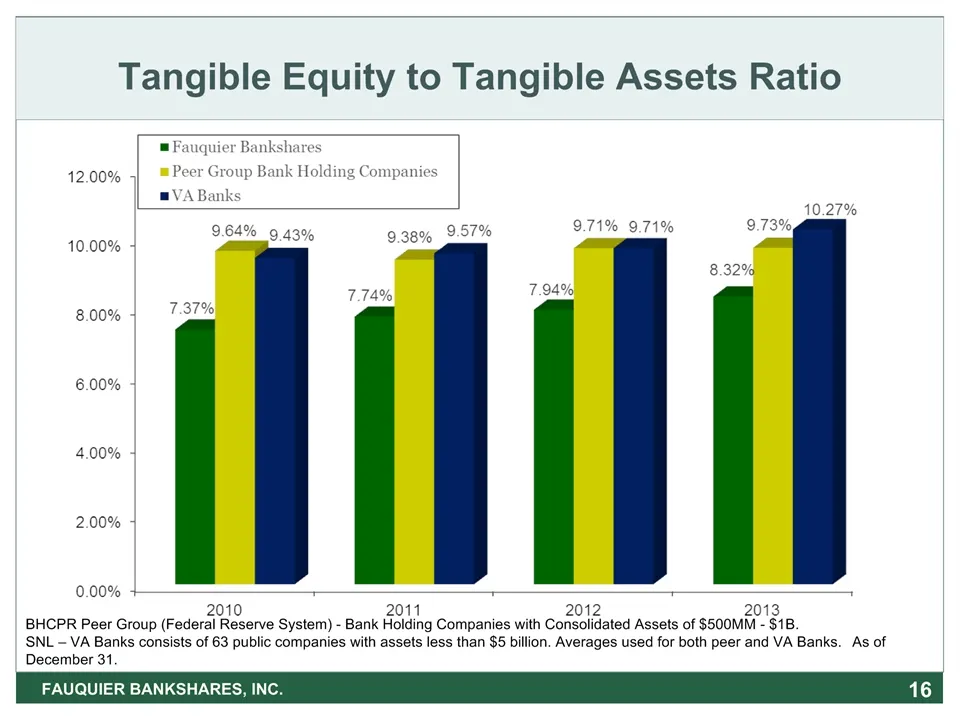
Slide 16: Tangible Equity to Tangible Assets Ratio
* Tangible Equity to Tangible Assets Ratio FAUQUIER BANKSHARES, INC. BHCPR Peer Group (Federal Reserve System) - Bank Holding Companies with Consolidated Assets of $500MM - $1B.SNL – VA Banks consists of 63 public companies with assets less than $5 billion. Averages used for both peer and VA Banks.
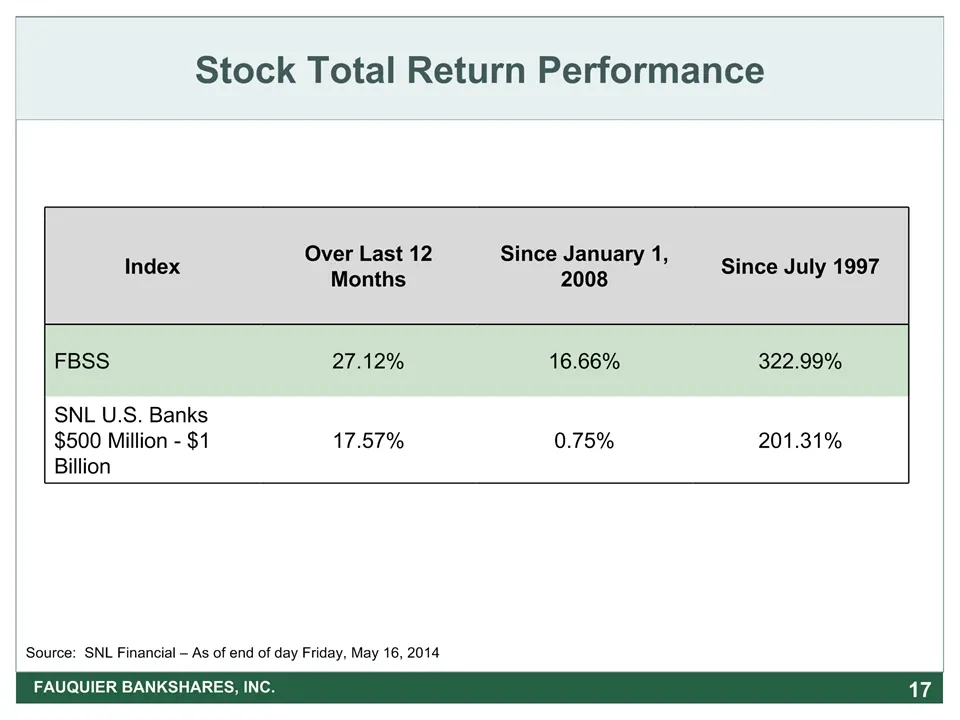
Slide 17: Stock Total Return Performance
Stock Total Return Performance Index Over Last 12 Months Since January 1, 2008 Since July 1997 FBSS 27.12% 16.66% 322.99% SNL U.S. Banks $500 Million - $1 Billion 17.57% 0.75% 201.31% * FAUQUIER BANKSHARES, INC. Source: SNL Financial – As of end of day Friday, May 16, 2014
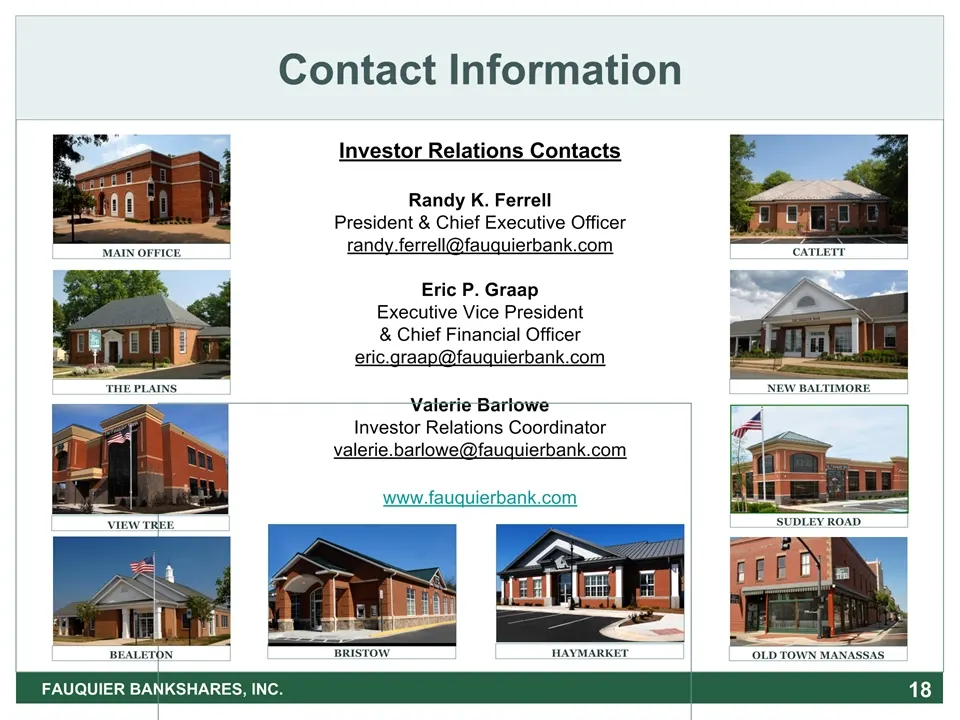
Slide 18: Contact Information
Contact Information Investor Relations ContactsRandy K. FerrellPresident & Chief Executive Officer randy.ferrell@fauquierbank.comEric P. GraapExecutive Vice President& Chief Financial Officereric.graap@fauquierbank.comValerie BarloweInvestor Relations Coordinatorvalerie.barlowe@fauquierbank.comwww.f
Source: SEC EDGAR · 8-K filed May 21, 2014
More decks from Fauquier Bankshares Inc
 Merger or Acquisition (October 2020)20 slides · Oct 1, 2020
 Shareholder Meeting (May 2020)30 slides · May 19, 2020
 Investor Presentation (August 2019)20 slides · Aug 7, 2019
 Shareholder Meeting (May 2019)31 slides · May 21, 2019
 Investor Presentation (October 2018)18 slides · Oct 22, 2018
 Shareholder Meeting (May 2018)33 slides · May 15, 2018