Krispy Kreme Doughnuts — CIBC World Markets 7th Annual Consumer Growth Conference (July 2007)
38 slides from Krispy Kreme Doughnuts's conference presentation, Jul 12, 2007
Slide 1: CIBC World Markets 7th Annual Consumer Growth Conference
CIBC World Markets 7 th Annual Consumer Growth Conference July 10, 2007

Slide 2: Safe Harbor
Safe Harbor Information contained in this presentation, other than historical information, should be considered forward-looking. Forward-looking statements are subject to various risks, uncertainties and assumptions. Should one or more of these risks or uncertainties materialize, or should underlyin

Slide 3: Investment Highlights
Investment Highlights £ Great Brand £ Attractive Category Growth £ Portfolio of Revenue Streams £ Progress on The Turnaround £ Business Potential and Plans
Slide 4: Great Brand
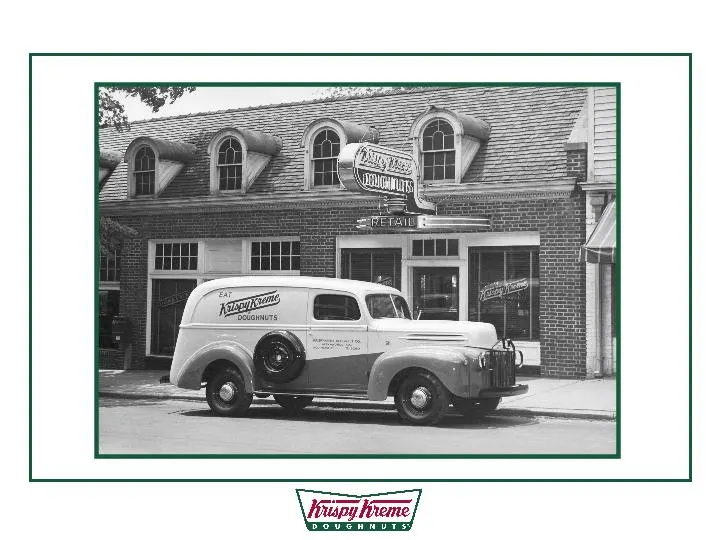
Great Brand - 70 Years
Slide 5: Attractive Category Growth
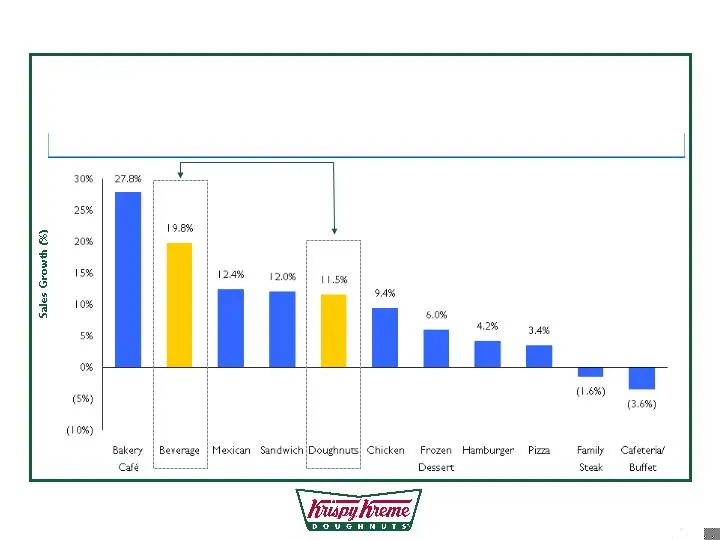
Attractive Category Growth Krispy Kreme’s QSR Segment Sales Growth (%) Current Focus Non-traditional QSR segments such as Bakery Café, Beverage and Doughnuts have grown more quickly than traditional segments such as Hamburgers and Pizza. Higher Growth in Non-Traditional QSR Segments Source: Technomi

Slide 6: Portfolio of Revenue Streams
Portfolio of Revenue Streams (1) As defined in the Company’s 2007 Secured Credit Facilities. FY07 Results Systemwide Shops 395 Company Shops 113 Total Revenue $461MM Net (Loss) $(42MM) Adjusted EBITDA (1) $38MM
Slide 7: Portfolio of Revenue Streams: Revenue Mix
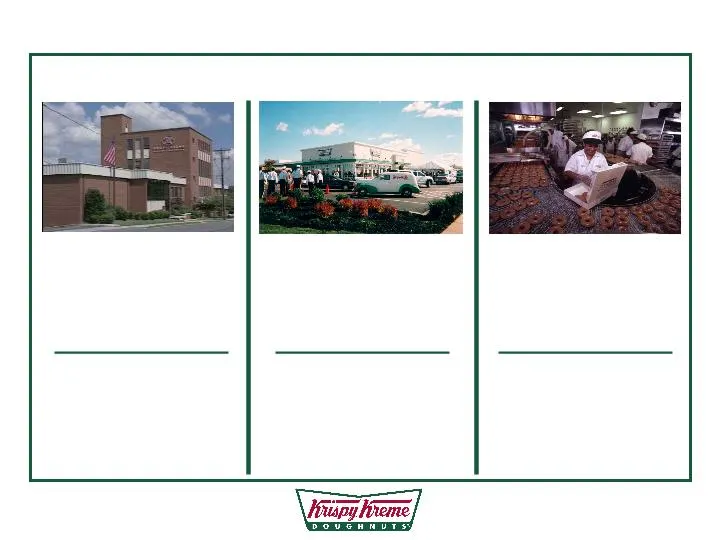
Franchise Operations 5% of Revenue Domestic International Company Stores 70% of Revenue Retail Convenience Store Grocery Store Supply Chain 25% of Revenue Mix Components As of FY07 Portfolio of Revenue Streams

Slide 8: Portfolio of Revenue Streams: Supply Chain
Percent of Revenue Relative Margins Growth Drivers Shops Same Shop Sales Portfolio of Revenue Streams As of FY07 Supply Chain Mix 35% +++ ü ü Other Ingredients 60% + ü ü and Supplies Equipment 5% + ü

Slide 9: Portfolio of Revenue Streams: Franchise Operations
Number of Shops as of 4/29/07 Portfolio of Revenue Streams Royalties Franchise Operations Domestic Franchisees Associates 1% - 3% Area Developers 109 4.5% International Franchisees 129 6%

Slide 10: Portfolio of Revenue Streams: Company Shops
Percent of FY07 Revenue Relative Margins Growth Drivers N Shops ew Same Shop Sales Portfolio of Revenue Streams Company Shops Factory Retail 40% +++ ü Off Premises C-Store 28% ++ ü ü G/Mass 31% + ü Satellite Retail 1% ++++ ü ü

Slide 11: Progress On The Turnaround
Progress On The Turnaround £ Issues We’ve Resolved £ Long-Standing Challenges We’re Addressing £ Plan For Sustained Growth
Slide 12: Issues We've Resolved
FY06 Today Issues We’ve Resolved · Rebuilt Cash Flow $2MM $22MM · Restated FY01-FY05 Financials Delayed Completed · Reported Financials 5 Years “Open” Current · Resolved Critical Legal Matters $1.7B Exposure · Reduced Guarantees $34MM $17MM Settlements · Restructured Troubled Franchisees ~10 2-3 · R

Slide 13: Experienced Leadership Team
Daryl Brewster Chief Executive Officer 25+ Doug Muir Chief Financial Officer 30+ Jeff Jervik U.S. Operations 25+ Sandy Michel General Counsel 25+ Ken Hudson Human Resources 25+ Jeff Welch International Ops. & Dev. 22+ Brad Wall Supply Chain 11+ Stan Strategic Marketing 19+ Steve Lineberger Strategic

Slide 14: Challenges We're Addressing
Challenges We’re Addressing £ Re-set Underperforming U.S. Expansion Markets £ Improve System Economics · Shop Margins/Commodities · Cost Structure £ Drive Growth Model · Same Shop Sales: HQSC, Product News · Small Shop Expansion: Flexible Market Plans
Slide 15: Vision
Vision Sharing Sweet Smiles Worldwide Efficient Business System (Costs & Assets) Proprietary Mix Company Shops Franchisee Royalties £ Doughnuts & Complementary Products £ Franchise-Driven Growth £ Focused Channel Strategies · Focus on Smaller Retail Units
Slide 16: Goals
FY07 3+ Years Sales Same Shop Sales ~Flat % Complementary Items 10% % Retail (Systemwide) ~55% Shops Total 395 500+ Smaller Shops (<2000 sg.ft.) ~25% Franchise Owned ~75% Savings Company Shop Margins 1% 10% G&A (excluding special charges) 9% Asset Base Assets Deployed $349MM Cash From Operating $22M
Slide 17: Strategies
Strategies £ K eep Klean £ Run Great Krispy Kreme Shops · Same Shop Sales £ Ignite Innovation & Growth · Small Shop Expansion £ Save Money Everywhere · Savings £ P ower the Organization £ Y ou - The Owners

Slide 18: Same Shop Sales
Same Shop Sales £ Retail Execution £ Product News · Doughnuts and Complementary Products £ Marketing and Messaging £ Focused Channel Strategies
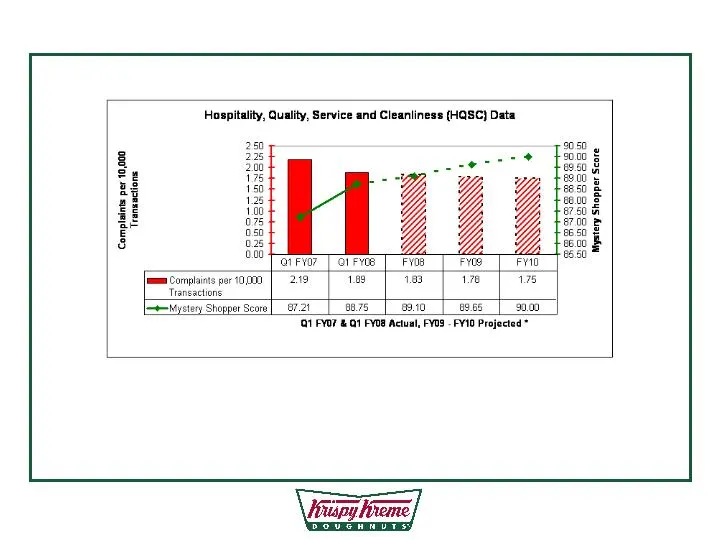
Slide 19: Focus on the Areas that Drive Revenue
Focus on the Areas that Drive Revenue • In and out within 5 minutes • Friendly Sales People • Clean and Inviting Surroundings Retail Execution Same Shop Sales
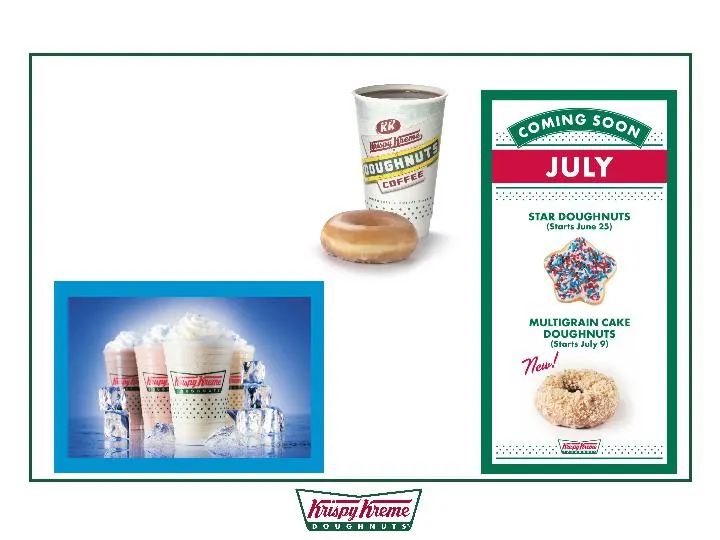
Slide 20: Retail Execution
Retail Execution Get Consumers In! Trade Them Up! Get Them Back! Same Shop Sales
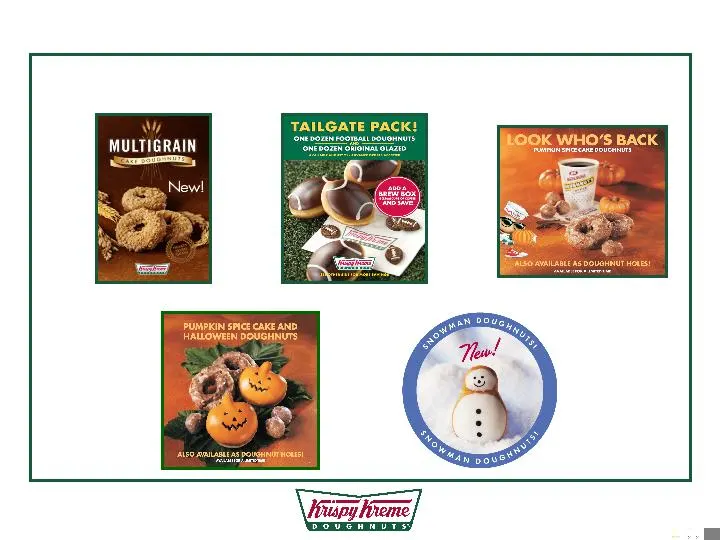
Slide 21: Monthly News
August September Monthly News November/December July October Same Shop Sales
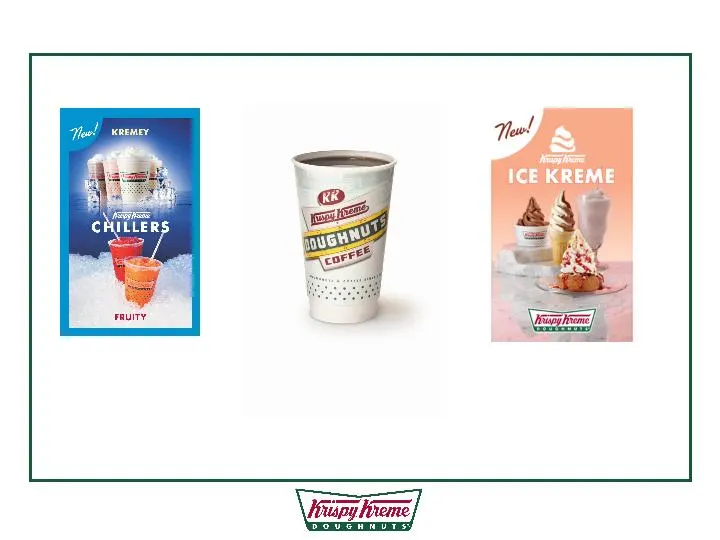
Slide 22: Complementary Products
Coffee • Simplified Program • New Combos • Improved Merchandising (Q3) Chillers • New/Improved Program • Q2 Launch Systemwide • Fruity and Kremey Blends Ice Kreme (Test) • Company, Franchise • Beginning Q2 • Doughnut Sundaes, Shakes, Cones & Cups Same Shop Sales Complementary Products
Slide 23: Marketing and Messaging
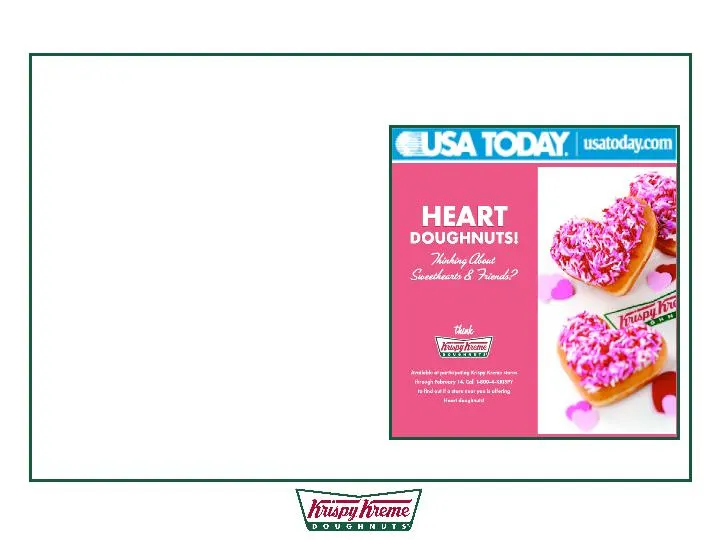
Same Shop Sales New Image Here Marketing and Messaging £ Increasing Product Media Mentions £ Restoring Local Shop Marketing £ Advertising Test · Retail Sales - Same Shop Sales Growth · Expanding into New Markets
Slide 24: Focused Channel Strategy
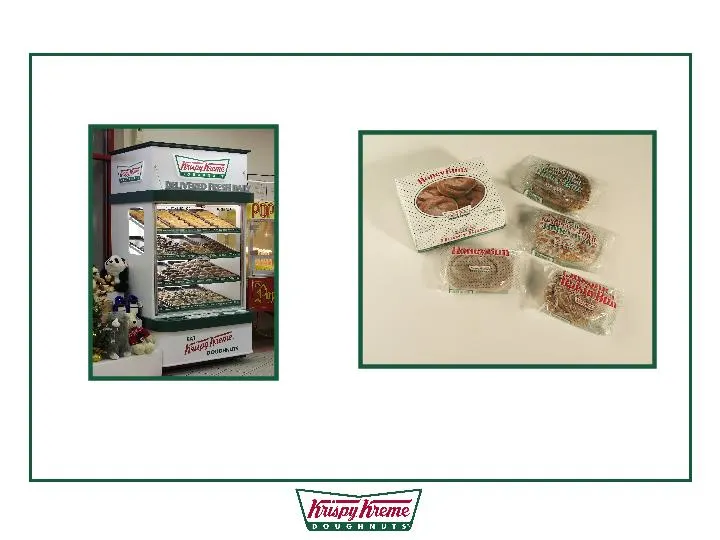
Focused Channel Strategy Lever C-Store Strength Same Shop Sales More Doors £ HQSC to the Case £ C-store Solution Program £ Recently Approved Doors Raise Average per Door £ Add Packaged Product £ Expand Hispanic Products £ Test PM Day Part Products

Slide 25: Small Shop Expansion
Small Shop Expansion £ International Expansion £ Domestic Small Retail Shops · Flexible Market Plans

Slide 26: Small Shop Expansion: Store Breakdown
Small Shop Expansion Store Breakdown - As of 4/29/07 Domestic Int’l Total Company 108 6 114 Franchise 161 129 290 Large Factory 235 43 278 Small Factory 1 22 23 Satellites 33 70 103
Slide 27: Systemwide Store Breakdown
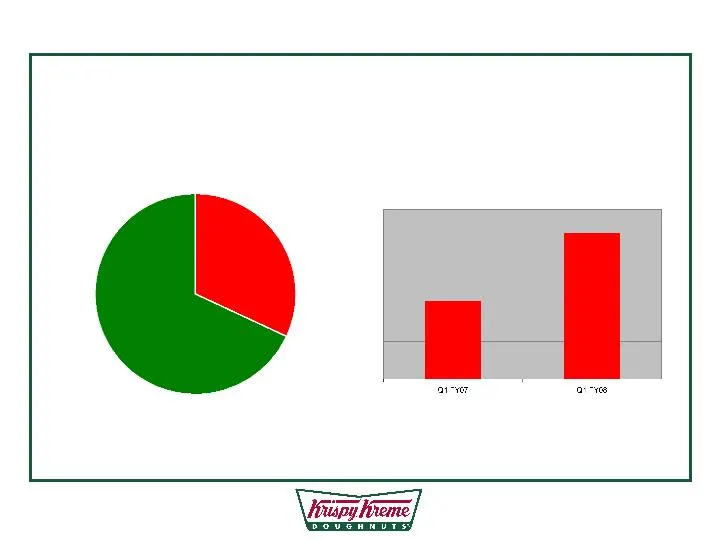
33% International 67% Domestic Systemwide Store Breakdown International Sales Increase Small Shop Expansion + 87% increase Q1 FY08 International
Slide 28: International Krispy Kreme Shops
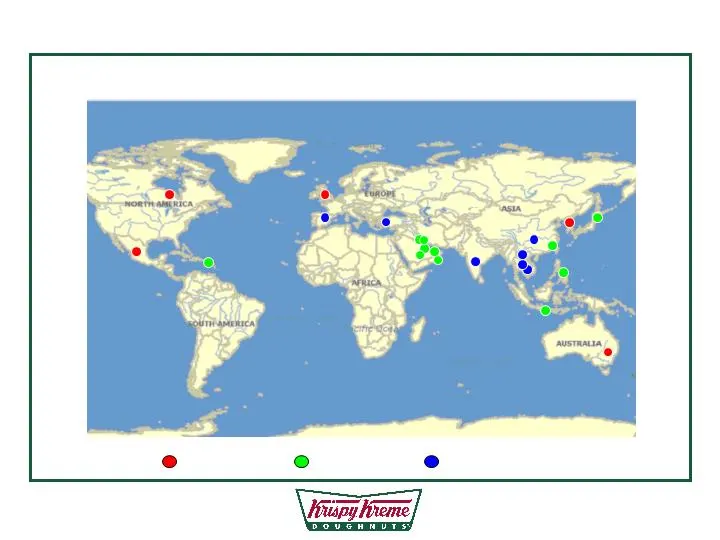
135 International Krispy Kreme Shops Phase Phase Phase 3 Small Shop Expansion
Slide 29: Small Retail Shops
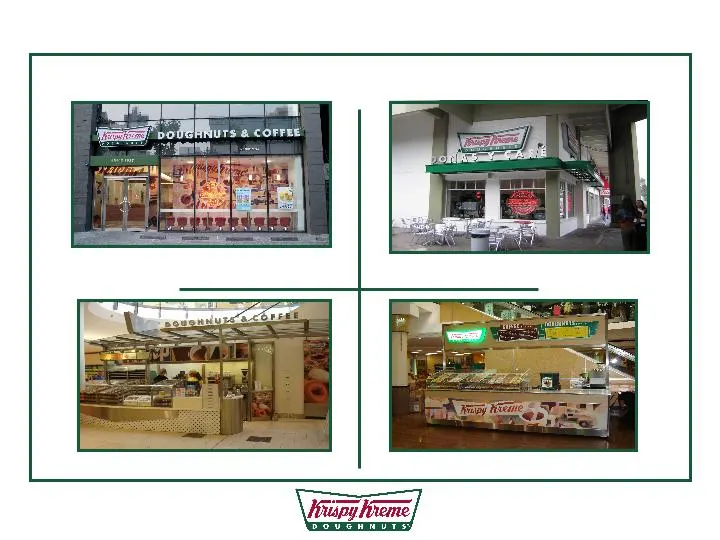
Kiosk Fresh Shop Hot Shop Small Factory Store Small Shop Expansion Small Retail Shops

Slide 30: Small Shop Expansion: International
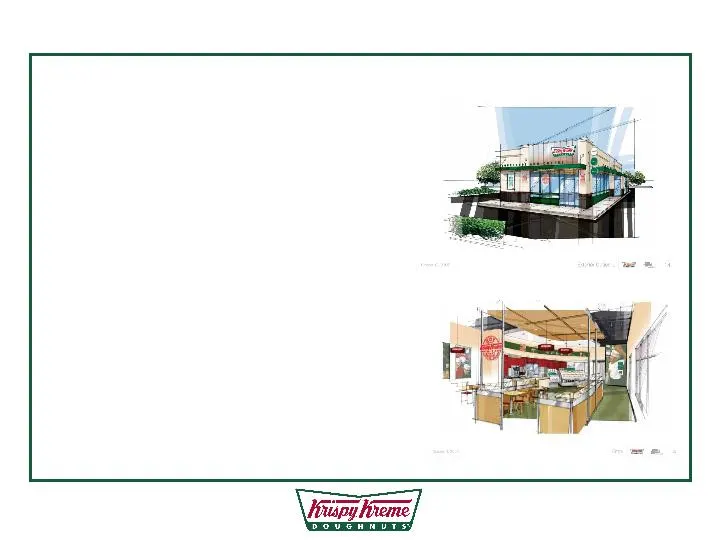
Small Shop Expansion International £ Utilize International Franchise Model · Well-Capitalized Proven Operators · Generally Shared Infrastructure £ Focus on Operating vs. Just Opening · Small Retail Concepts · Flexible Market Plans £ Important Learning for Domestic Operations
Slide 31: Small Shop Expansion: Domestic
Small Shop Expansion Domestic Status £ International Learning ü £ SRC Designs ü · Back of the House ü · Front of the House ü £ Flexible Market Planning ü £ Economics ü
Slide 32: Small Retail Shops
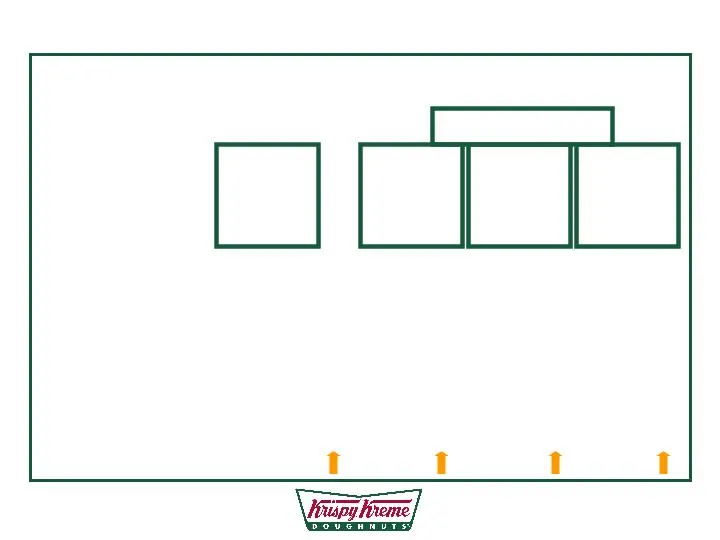
Current International: Number of shops 22 23 28 19 Average Size (Sq.Ft.) 1300 850 500 200 Domestic: Number of shops 1 15 17 1 Average Size (Sq.Ft.) 2000 1500 900 848 Target Sales/Inv. Ratio 1.1 1.5 2.0 2.0 Small Shop Expansion Small Factory Hot Shop Fresh Shop Kiosk - Satellites - Small Retail Shops

Slide 33: Save Money Everywhere
Save Money Everywhere £ Completing Cost Benchmarking £ Only Two Things are Non-Negotiable · The Krispy Kreme Brand · Quality Products £ Focus on What We Do Best
Slide 34: Save Money Everywhere: Cost Categories
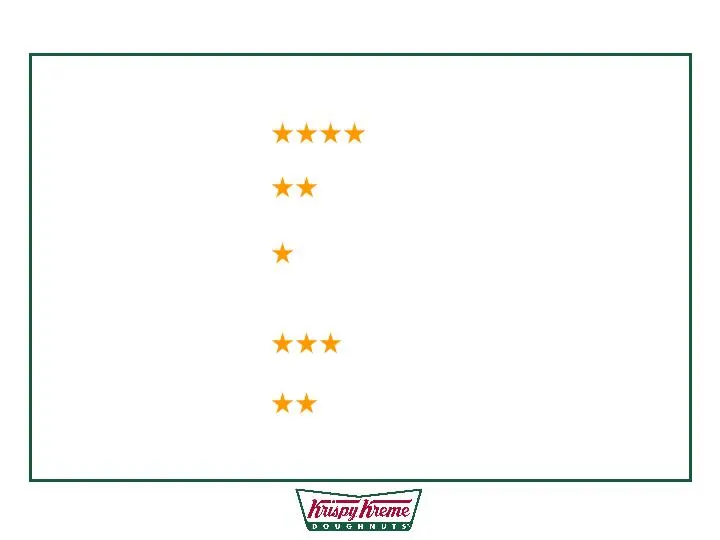
Save Money Everywhere (FIVE STAR RATING) Cost Categories Current Rating Actions To Improve Cost of Goods Supply Chain Production Efficiency Labor Labor Management Shop Operating Small Retail Shops Expenses 10% Margin by FY10 Scale Buying Supply Chain Benchmarking Strategic Sourcing Route Profitabili
Slide 35: Improve Shop Margins
For illustrative purposes Improve Shop Margins FY07 Base 10% Margin by FY10 Under- performing Shops Cost of Goods Labor Savings Cost Saving Initiatives General & Administrative Save Money Everywhere

Slide 36: Turnaround Timeline
· Re-set Underperforming U.S. Assess/Implement ü Expansion Markets · Improve System Economics — Cost Structure Assess/Implement ü — 10% Margin by FY10 Assess/Implement Implement ü · Drive Growth Model — Same Shop Sales, HQSC, Test/ Test/ Test/ Innovation Expand Expand Expand — Small Shop Expansion D

Slide 37: Summary
Summary £ Great Brand £ Attractive Category Growth £ Portfolio of Revenue Streams £ Progress on The Turnaround £ Potential and Plans
Slide 38
Source: SEC EDGAR · 8-K filed Jul 12, 2007
More decks from Krispy Kreme Doughnuts Inc
 Investor Presentation (January 2015)62 slides · Jan 12, 2015
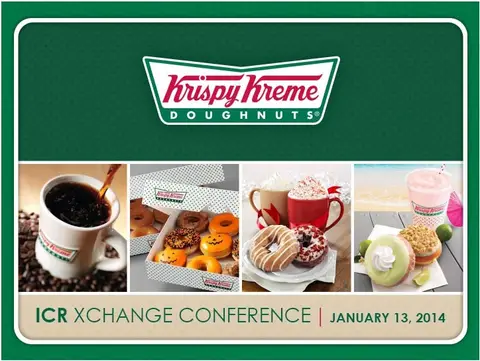 ICR XChange Conference 201438 slides · Jan 13, 2014
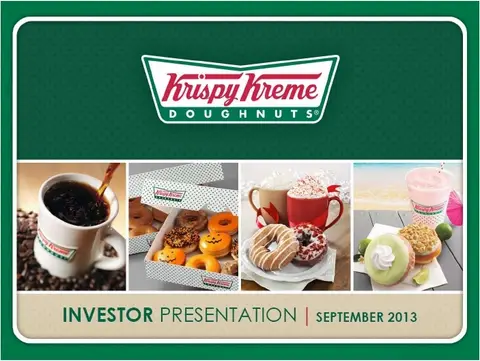 Investor Presentation (September 2013)33 slides · Sep 10, 2013
 Investor Presentation (March 2013)33 slides · Mar 18, 2013
 Investor Presentation (January 2013)35 slides · Jan 16, 2013
 Investor Presentation (September 2012)38 slides · Sep 11, 2012