Canara Bank · NSE:CANBK
Canara Bank — Q4 FY2023-24 Earnings Presentation
47 slides from Canara Bank's earnings presentation, March 2024

Slide 1: Financial Results: Q4 (FY 2023-24)
Inspired by Customers driven by Digital ee₹ Financial Results: Q4 (FY 2023-24) Page 1
Slide 2: Performance Highlights
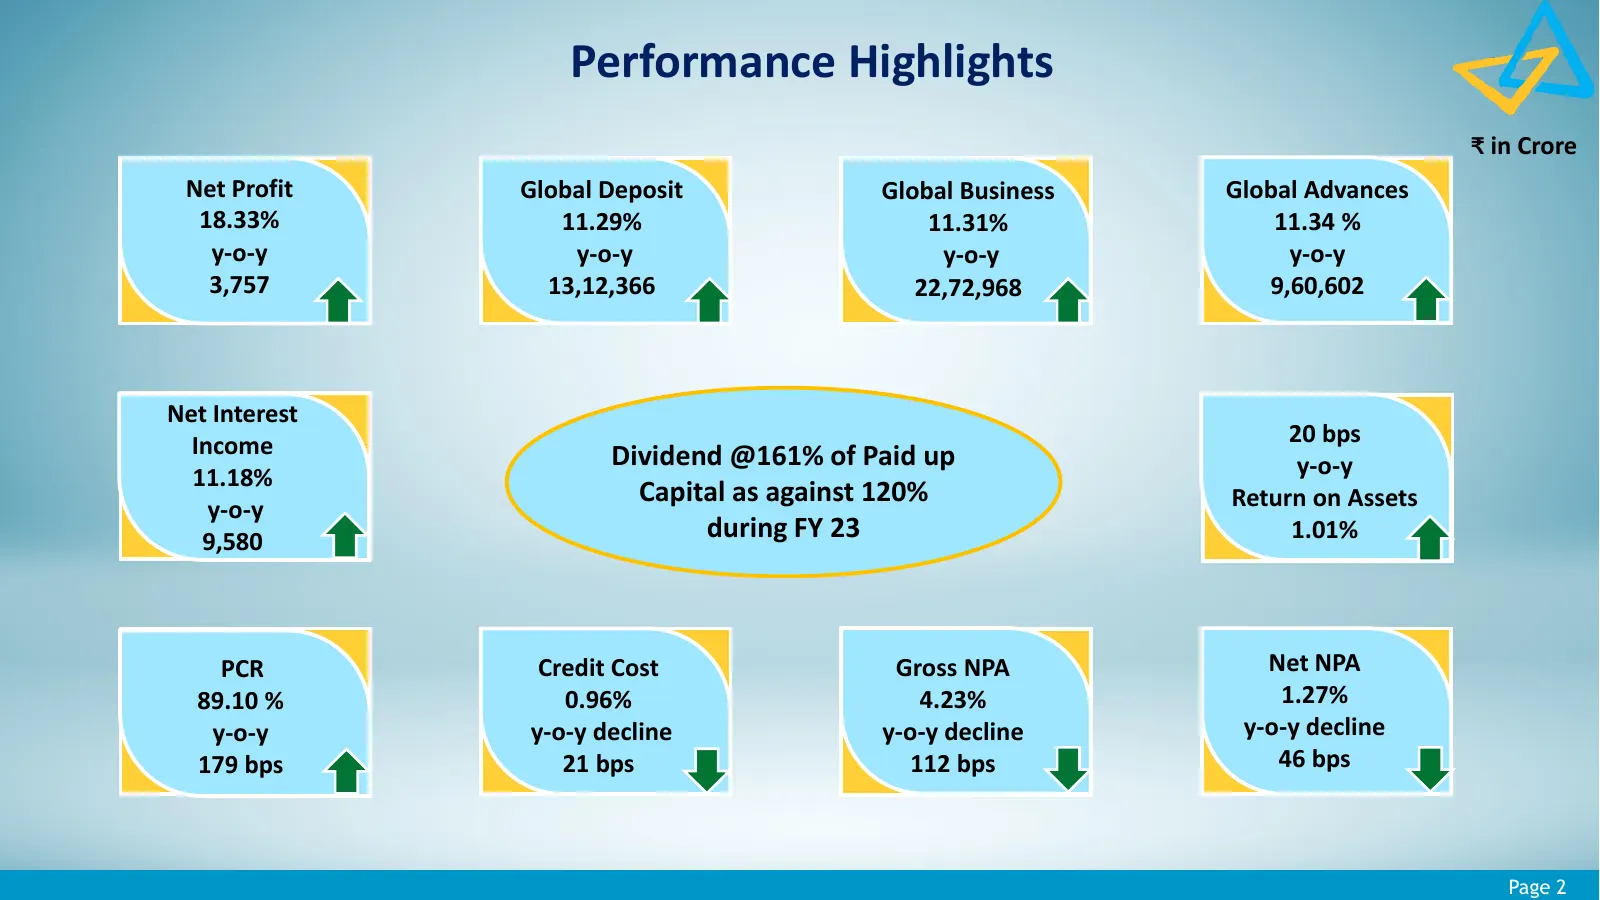
Performance Highlights ₹ in Crore Net Profit Global Deposit Global Business Global Advances 18.33% 11.29% 11.31% 11.34 % y-o-y y-o-y y-o-y y-o-y 3,757 13,12,366 22,72,968 9,60,602 Net Interest Income 20 bps Dividend @161% of Paid up y-o-y 11.18% Capital as against 120% Return on Assets y-o-y 9,580 d
Slide 3: Key Highlights
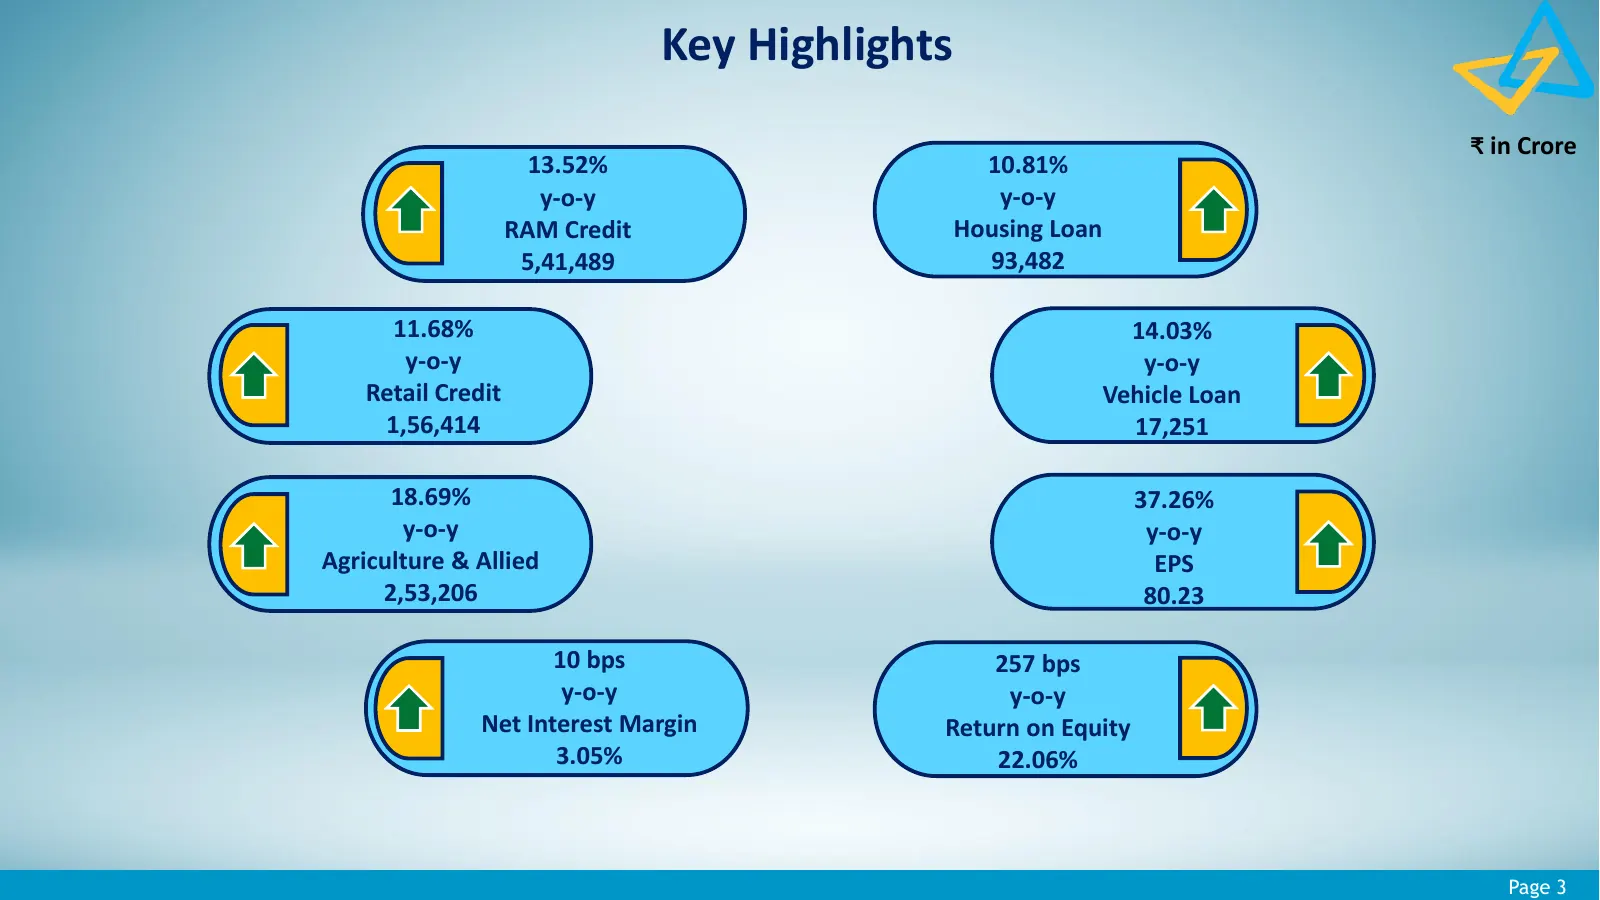
Key Highlights ₹ in Crore 13.52% 10.81% y-o-y y-o-y RAM Credit Housing Loan 5,41,489 93,482 11.68% 14.03% y-o-y y-o-y Retail Credit Vehicle Loan 1,56,414 17,251 18.69% 37.26% y-o-y y-o-y Agriculture & Allied EPS 2,53,206 80.23 10 bps 257 bps y-o-y y-o-y Net Interest Margin Return on Equity 3.05% 22.
Slide 4: Contents
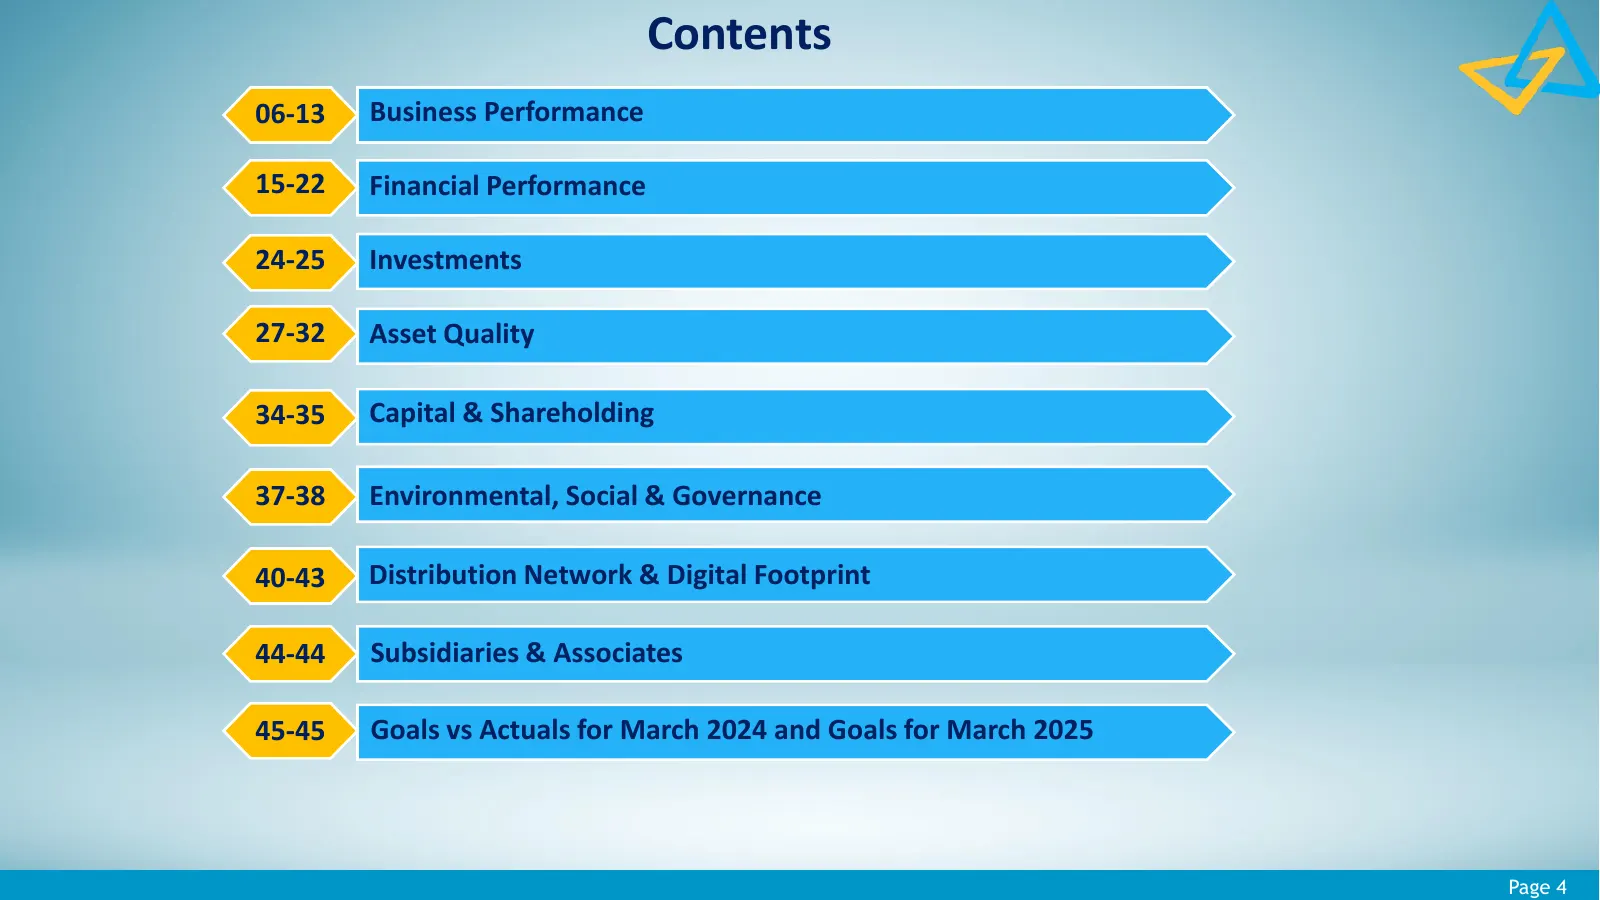
Contents 06-13 Business Performance 15-22 Financial Performance 24-25 Investments 27-32 Asset Quality 34-35 Capital & Shareholding 37-38 Environmental, Social & Governance 40-43 Distribution Network & Digital Footprint 44-44 Subsidiaries & Associates 45-45 Goals vs Actuals for March 2024 and Goals f

Slide 5: Business Performance
Inspired by Customers driven by Digital Business Performance Page 5
Slide 6: Business Performance
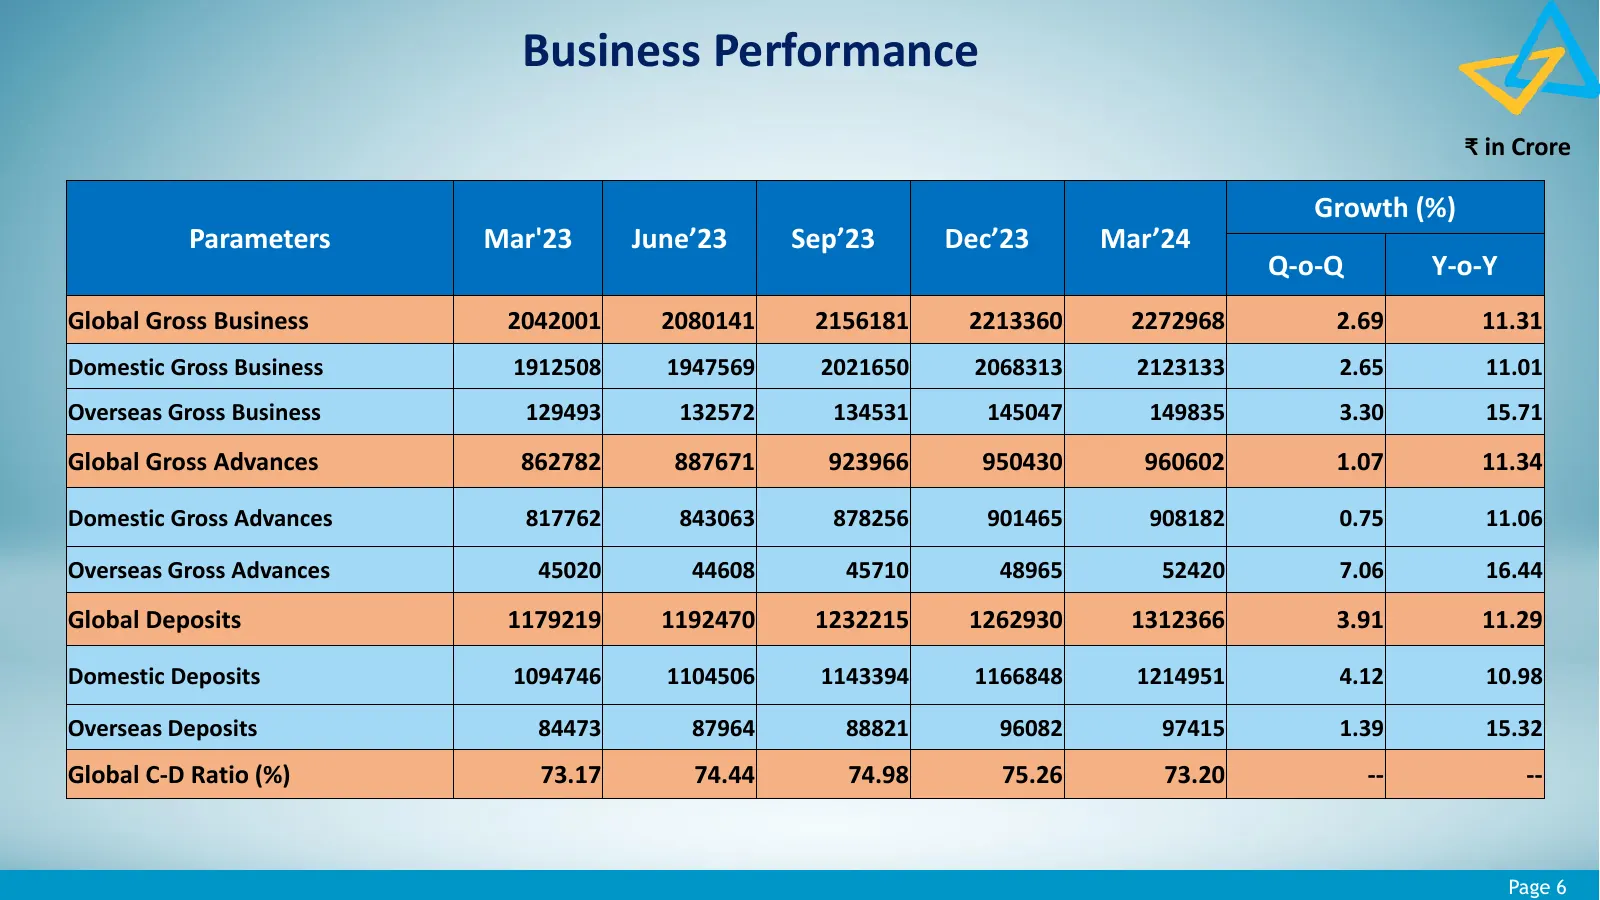
Business Performance ₹ in Crore Growth (%) Parameters Mar'23 June’23 Sep’23 Dec’23 Mar’24 Q-o-Q Y-o-Y Global Gross Business 2042001 2080141 2156181 2213360 2272968 2.69 11.31 Domestic Gross Business 1912508 1947569 2021650 2068313 2123133 2.65 11.01 Overseas Gross Business 129493 132572 134531 14504
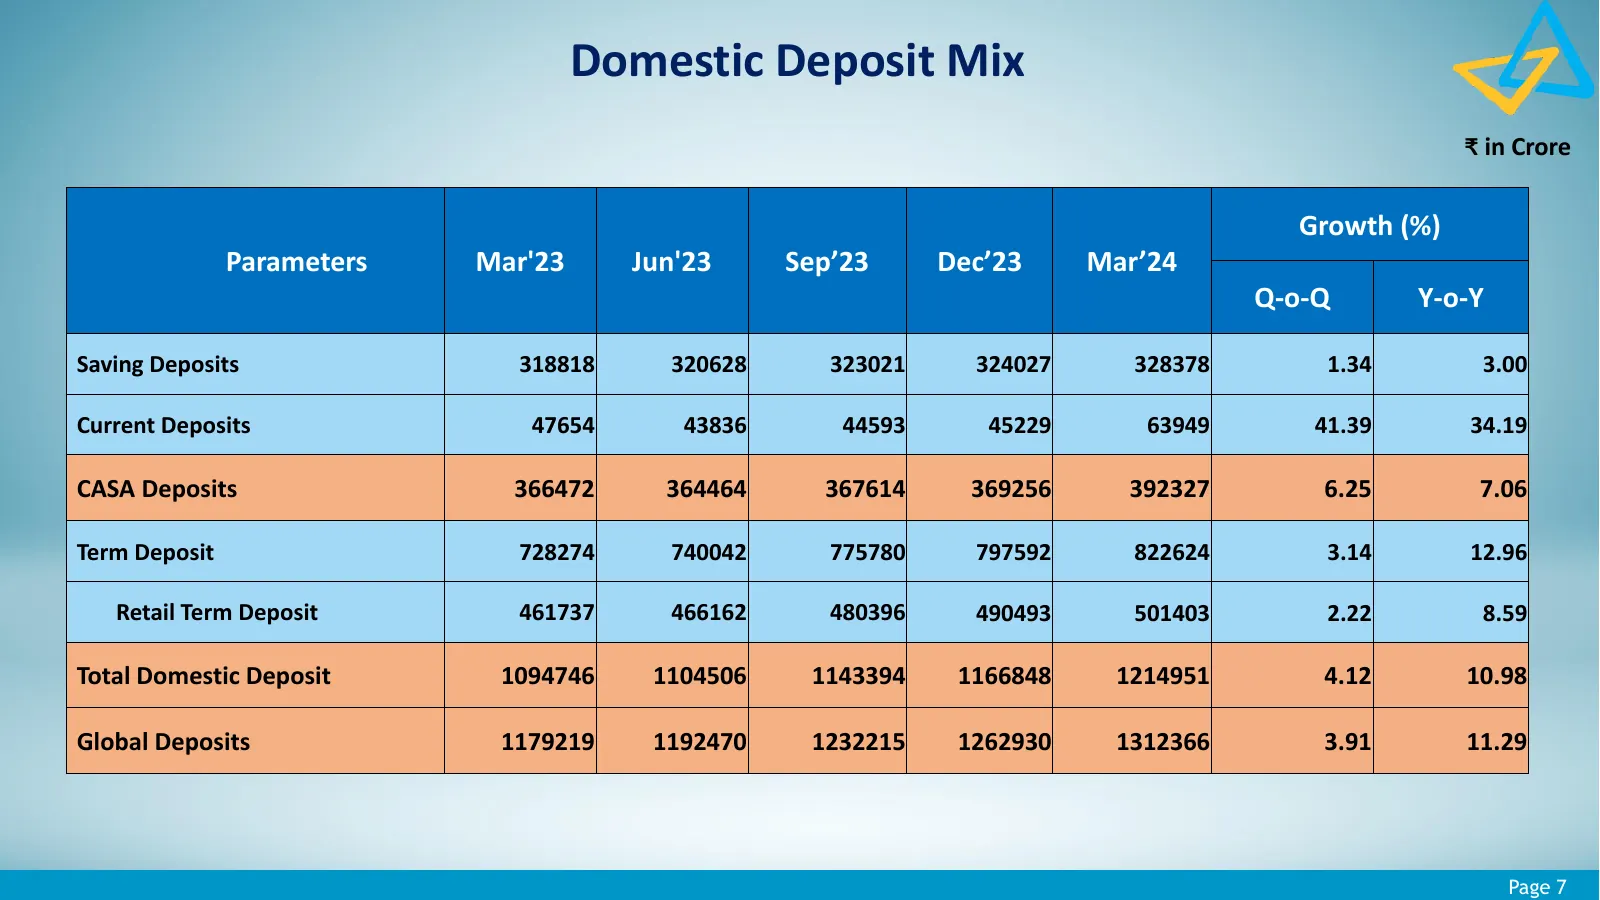
Slide 7: Domestic Deposit Mix
Domestic Deposit Mix ₹ in Crore Growth (%) Parameters Mar'23 Jun'23 Sep’23 Dec’23 Mar’24 Q-o-Q Y-o-Y Saving Deposits 318818 320628 323021 324027 328378 1.34 3.00 Current Deposits 47654 43836 44593 45229 63949 41.39 34.19 CASA Deposits 366472 364464 367614 369256 392327 6.25 7.06 Term Deposit 728274
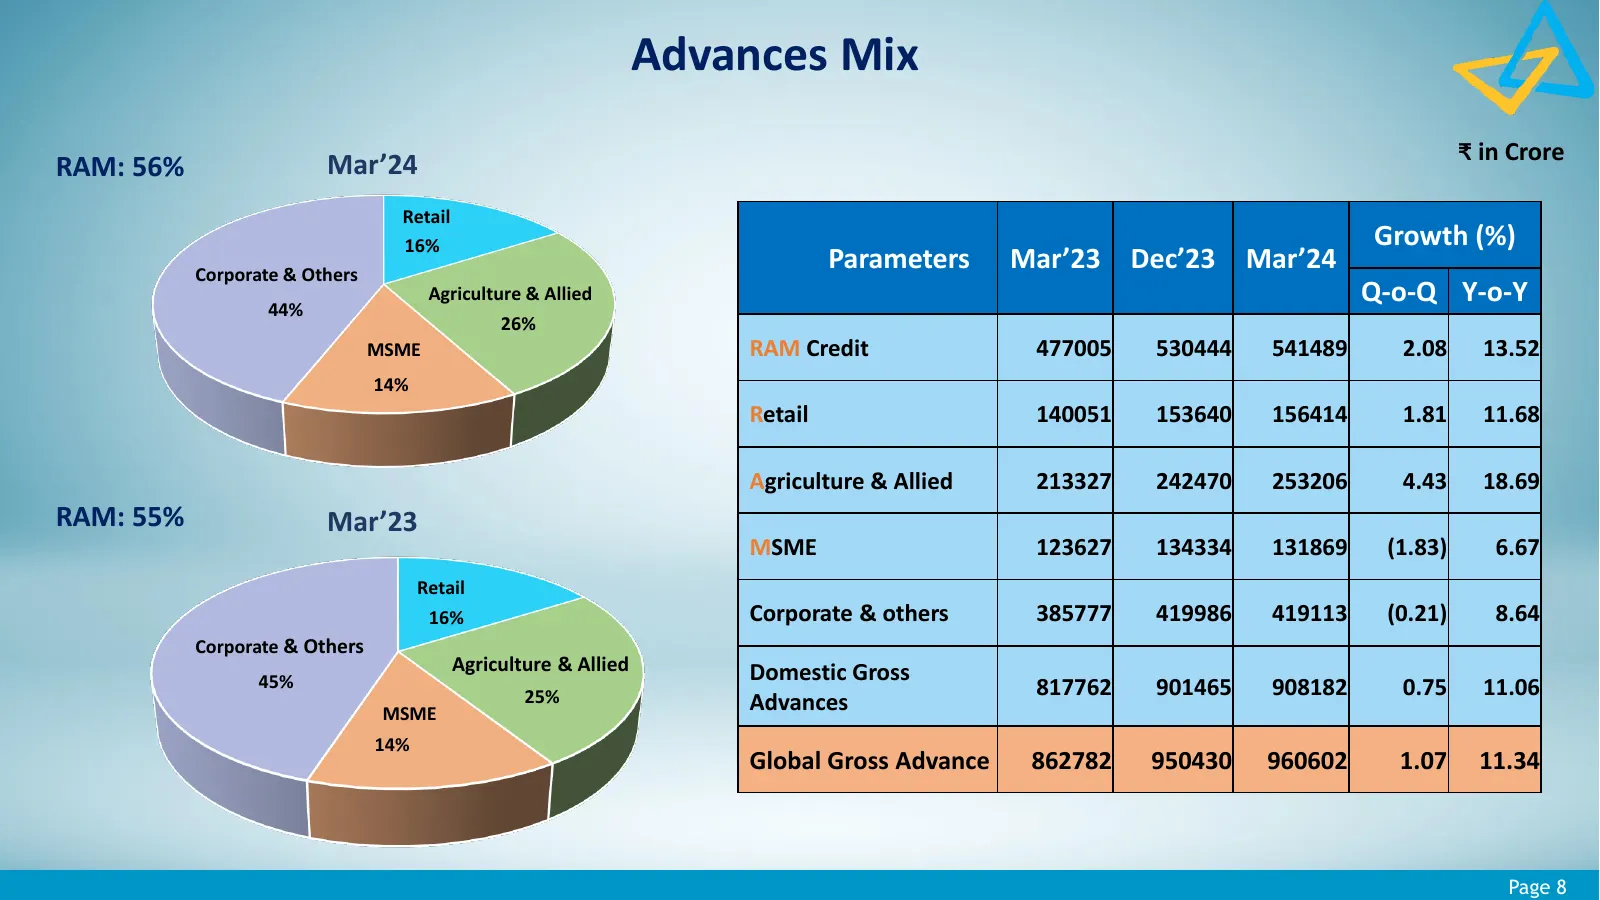
Slide 8: Advances Mix
Advances Mix ₹ in Crore RAM: 56% Mar’24 Retail 16% Growth (%) Corporate & Others Parameters Mar’23 Dec’23 Mar’24 44% Agriculture & Allied Q-o-Q Y-o-Y 26% MSME RAM Credit 477005 530444 541489 2.08 13.52 14% Retail 140051 153640 156414 1.81 11.68 Agriculture & Allied 213327 242470 253206 4.43 18.69 RA
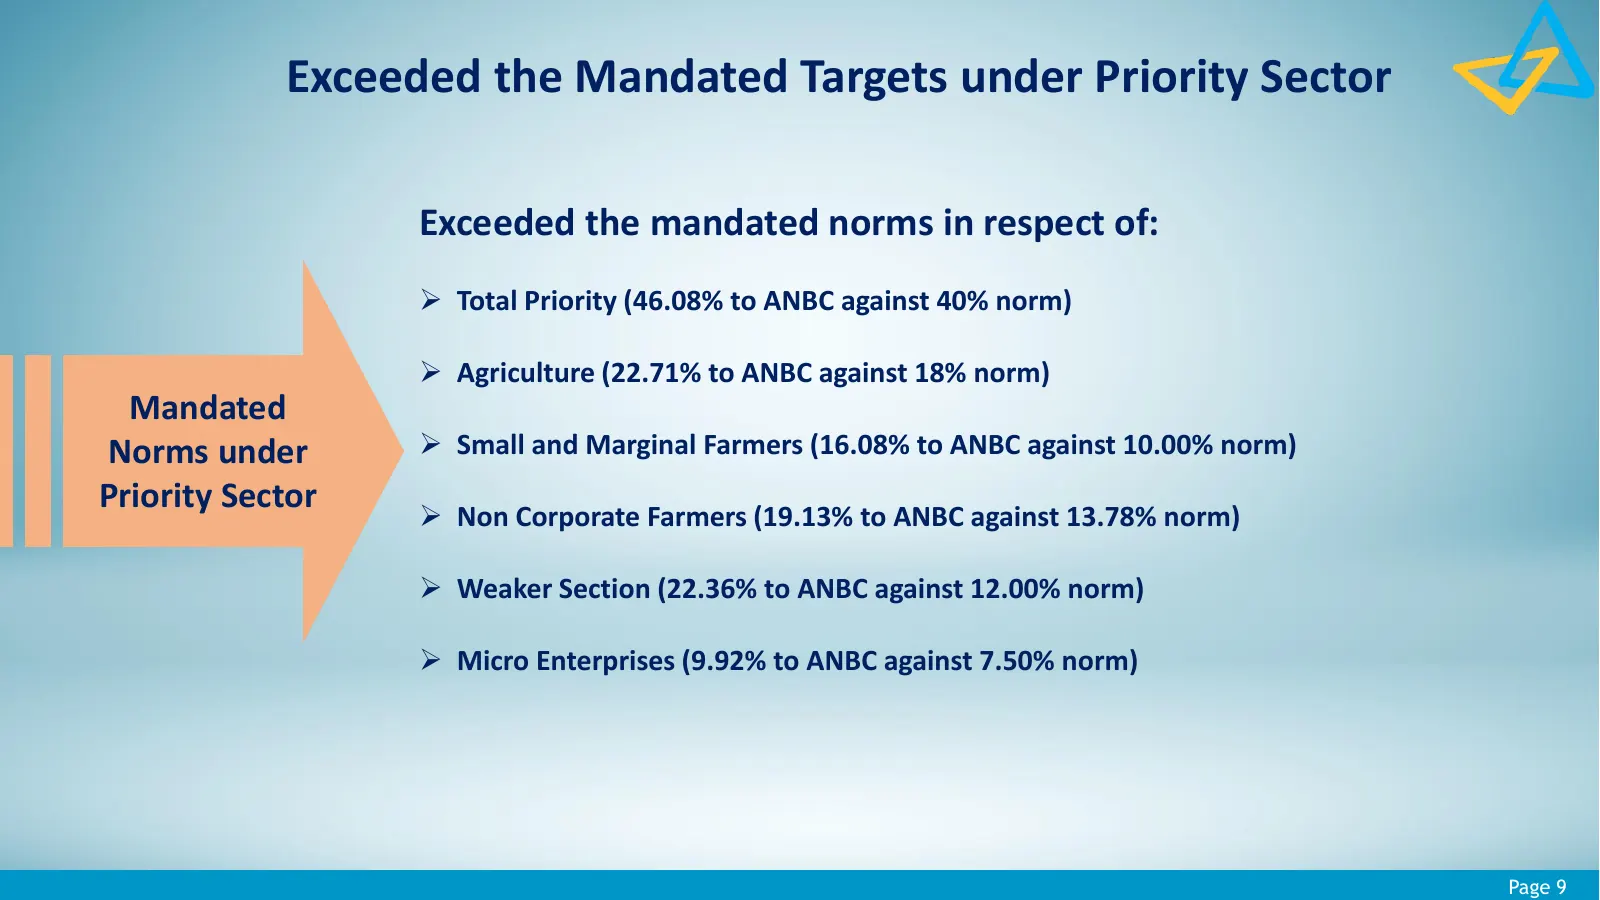
Slide 9: Exceeded the Mandated Targets under Priority Sector
Exceeded the Mandated Targets under Priority Sector Exceeded the mandated norms in respect of: Total Priority (46.08% to ANBC against 40% norm) Agriculture (22.71% to ANBC against 18% norm) Mandated Norms under Small and Marginal Farmers (16.08% to ANBC against 10.00% norm) Priority Sector N
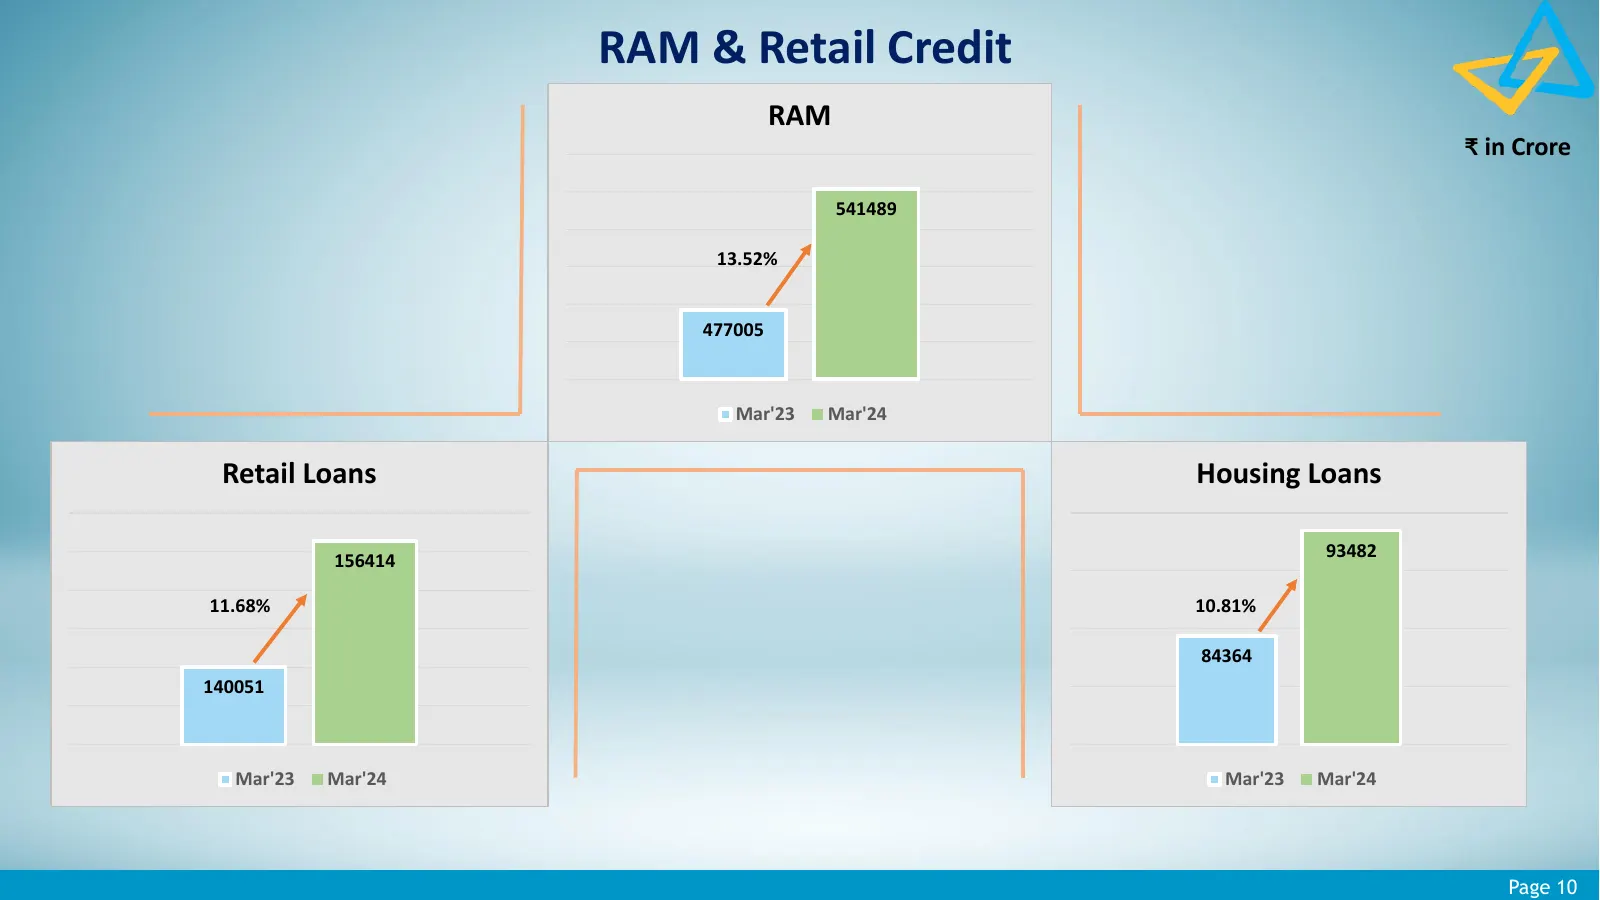
Slide 10: RAM & Retail Credit
RAM & Retail Credit RAM ₹ in Crore 541489 13.52% 477005 Mar'23 Mar'24 Retail Loans Housing Loans 93482 156414 11.68% 10.81% 84364 140051 Mar'23 Mar'24 Mar'23 Mar'24 Page 10
Slide 11: Industry Credit
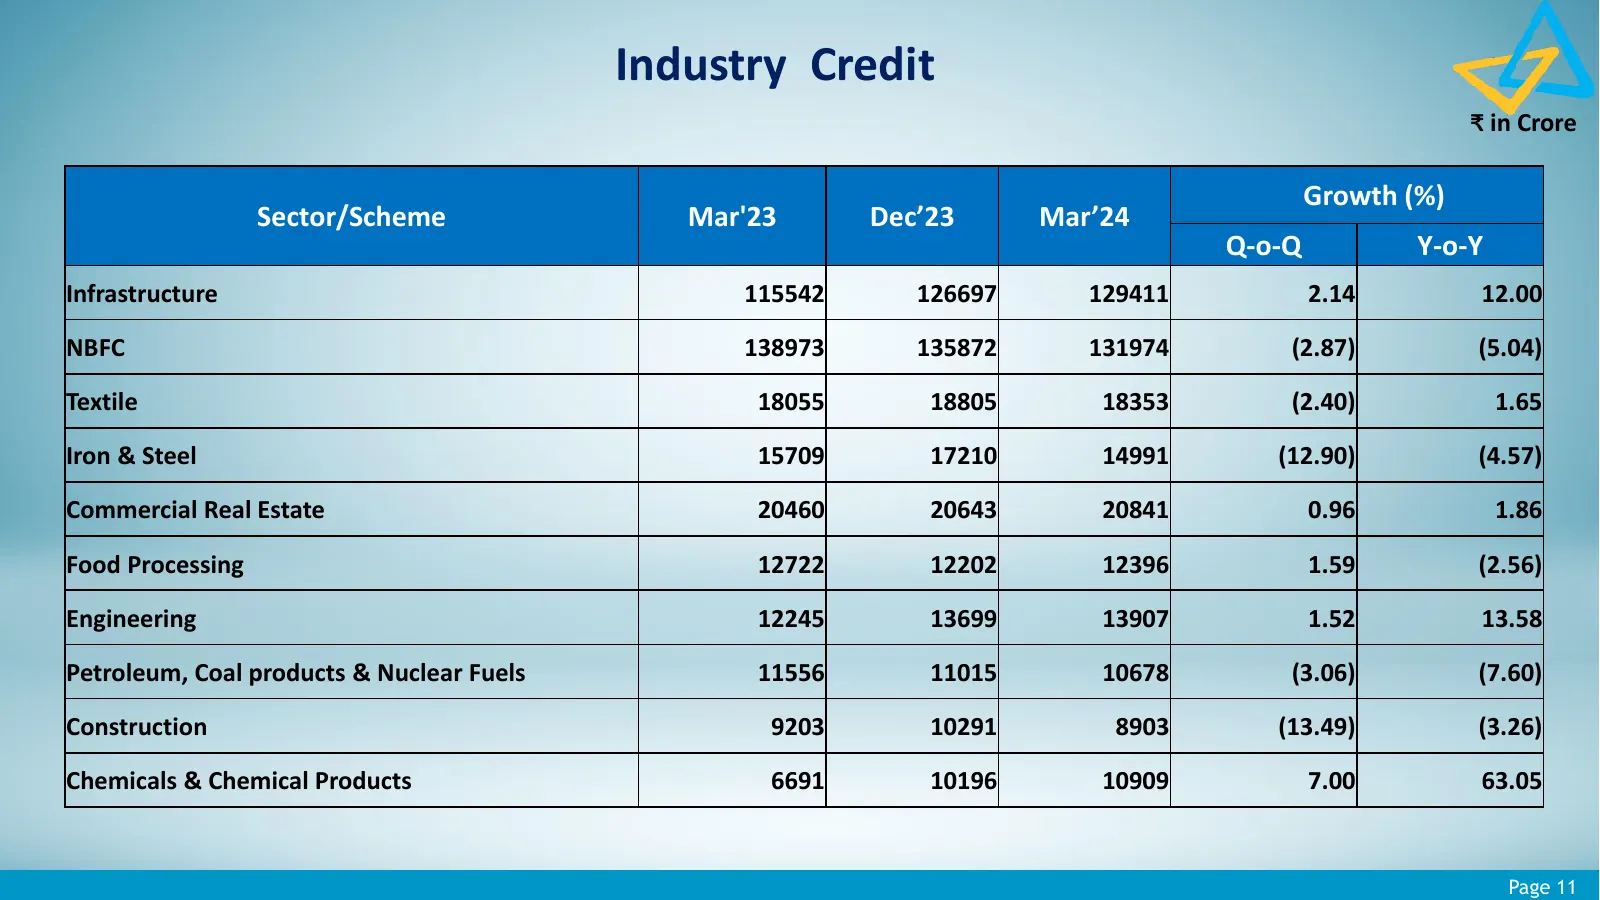
Industry Credit ₹ in Crore Growth (%) Sector/Scheme Mar'23 Dec’23 Mar’24 Q-o-Q Y-o-Y Infrastructure 115542 126697 129411 2.14 12.00 NBFC 138973 135872 131974 (2.87) (5.04) Textile 18055 18805 18353 (2.40) 1.65 Iron & Steel 15709 17210 14991 (12.90) (4.57) Commercial Real Estate 20460 20643 20841 0.9
Slide 12: Rating Profile
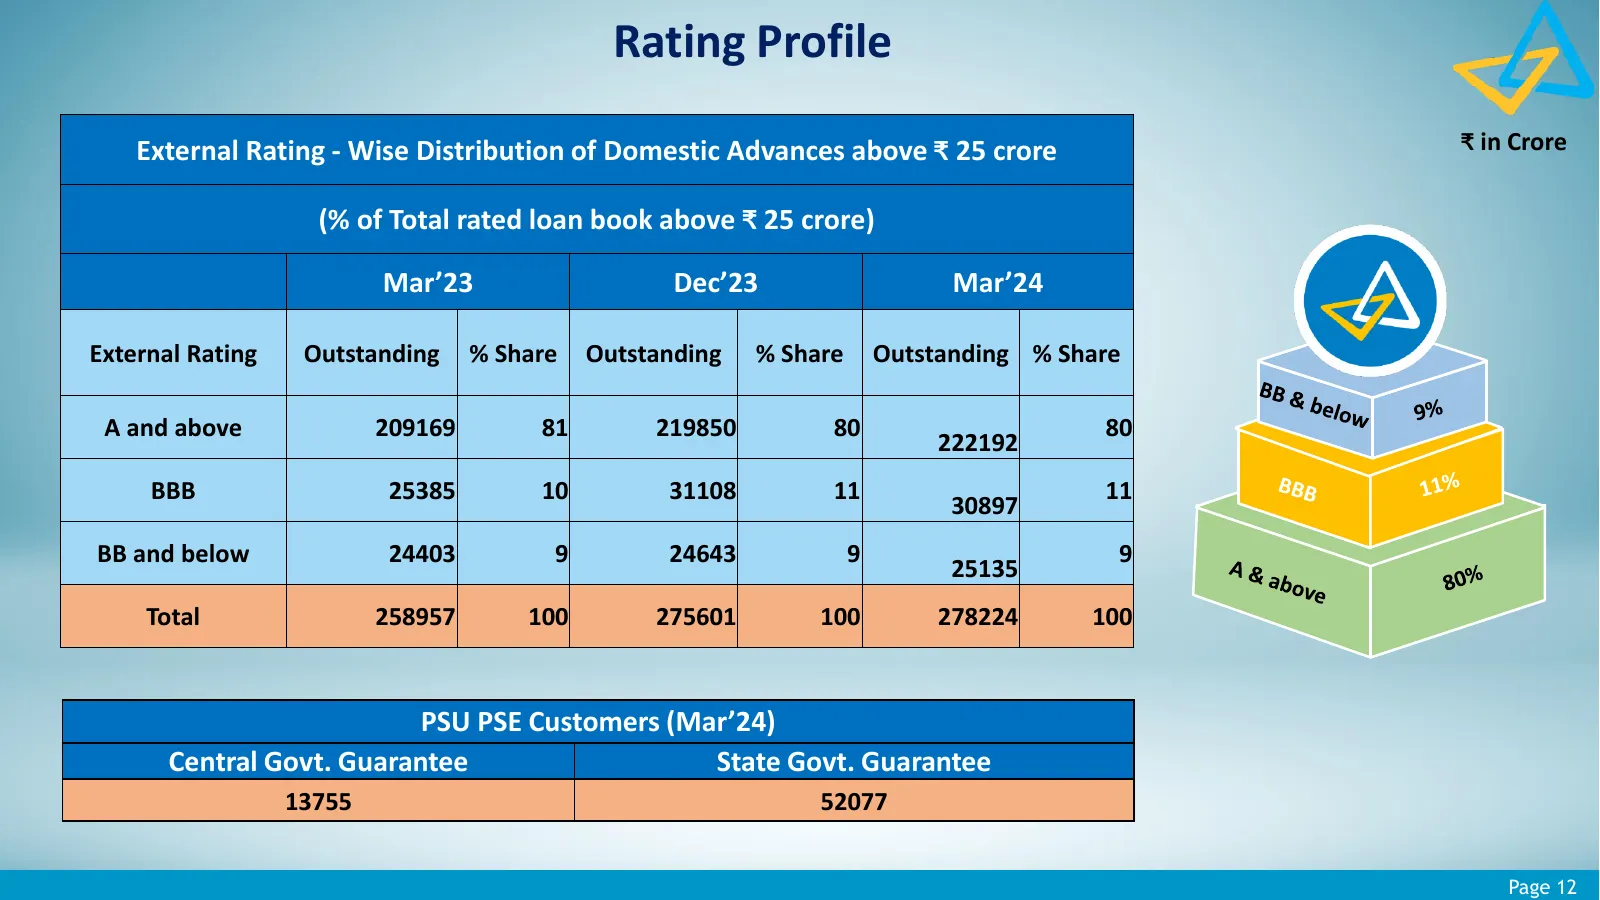
Rating Profile External Rating - Wise Distribution of Domestic Advances above ₹ 25 crore ₹ in Crore (% of Total rated loan book above ₹ 25 crore) Mar’23 Dec’23 Mar’24 External Rating Outstanding % Share Outstanding % Share Outstanding % Share A and above 209169 81 219850 80 80 222192 BBB 25385 10 31
Slide 13: Rating Profile
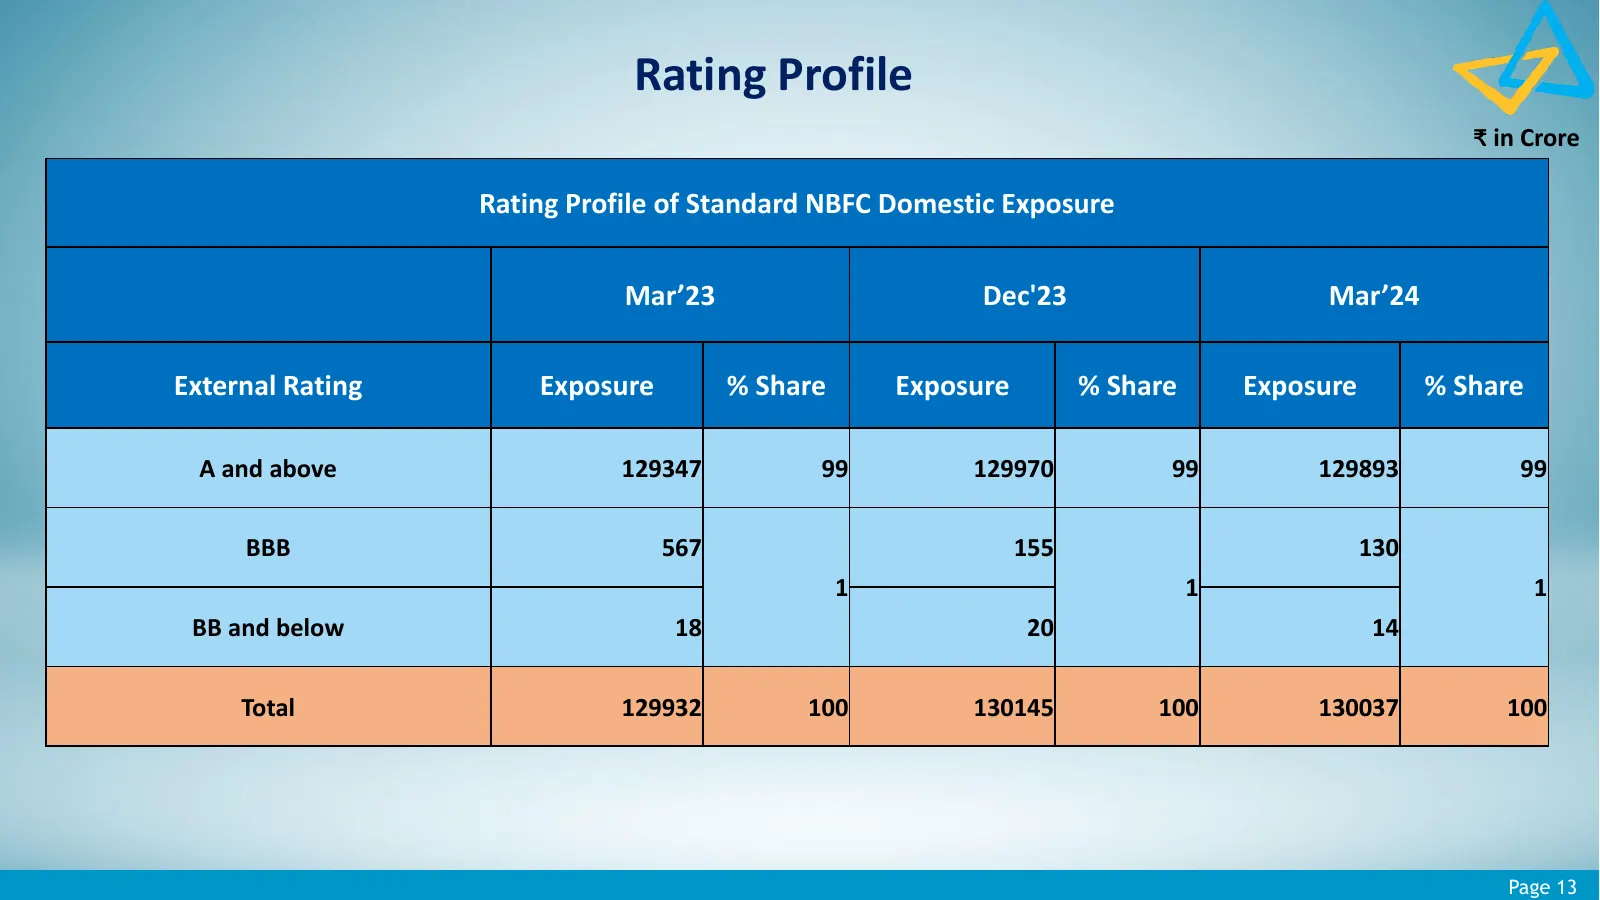
Rating Profile ₹ in Crore Rating Profile of Standard NBFC Domestic Exposure Mar’23 Dec'23 Mar’24 External Rating Exposure % Share Exposure % Share Exposure % Share A and above 129347 99 129970 99 129893 99 BBB 567 155 130 1 1 1 BB and below 18 20 14 Total 129932 100 130145 100 130037 100 Page 13

Slide 14: Financial Performance
Financial Performance Inspired by Customers driven by Digital Page 14
Slide 15: Total Income
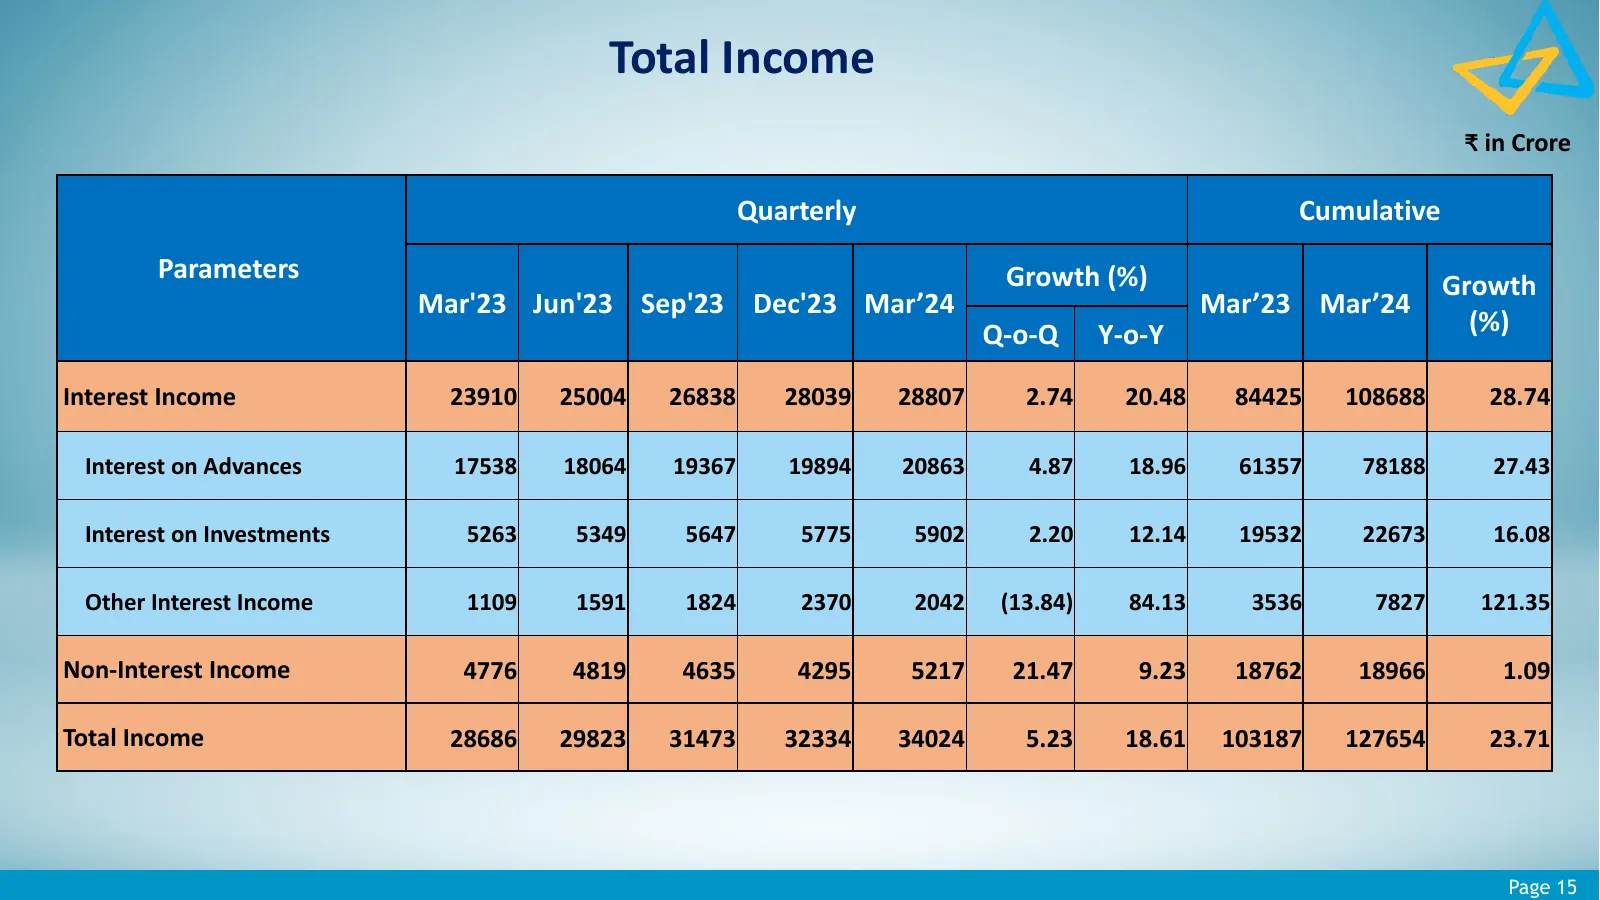
Total Income ₹ in Crore Quarterly Cumulative Parameters Growth (%) Growth Mar'23 Jun'23 Sep'23 Dec'23 Mar’24 Mar’23 Mar’24 Q-o-Q Y-o-Y (%) Interest Income 23910 25004 26838 28039 28807 2.74 20.48 84425 108688 28.74 Interest on Advances 17538 18064 19367 19894 20863 4.87 18.96 61357 78188 27.43 Inter
Slide 16: Non-Interest Income
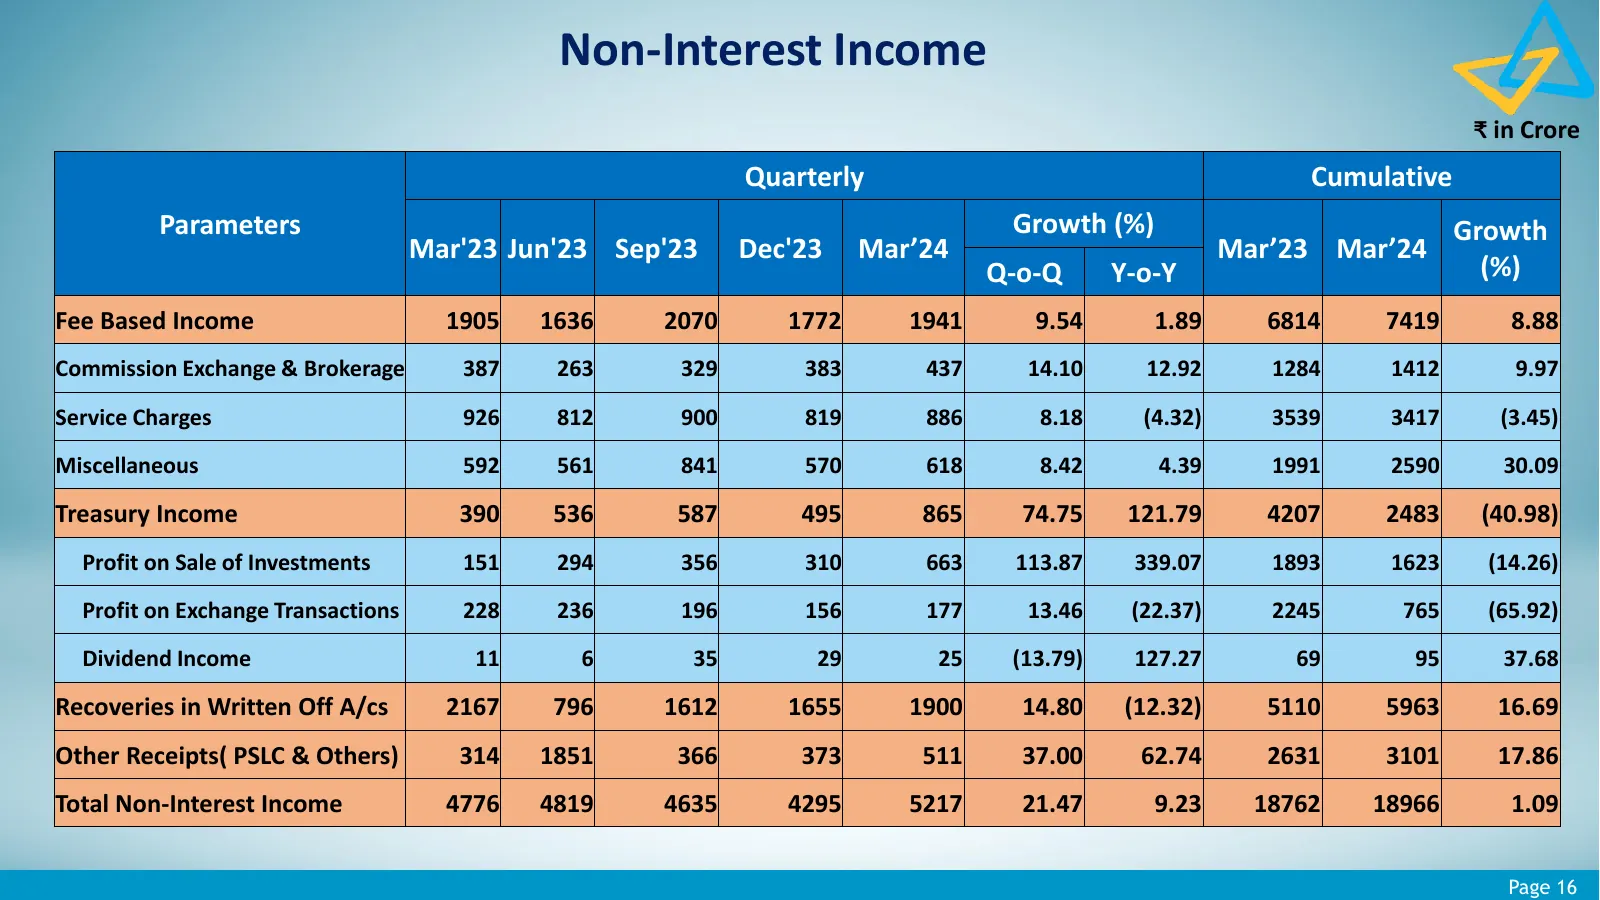
Non-Interest Income ₹ in Crore Quarterly Cumulative Parameters Growth (%) Growth Mar'23 Jun'23 Sep'23 Dec'23 Mar’24 Mar’23 Mar’24 Q-o-Q Y-o-Y (%) Fee Based Income 1905 1636 2070 1772 1941 9.54 1.89 6814 7419 8.88 Commission Exchange & Brokerage 387 263 329 383 437 14.10 12.92 1284 1412 9.97 Service
Slide 17: Total Expenses
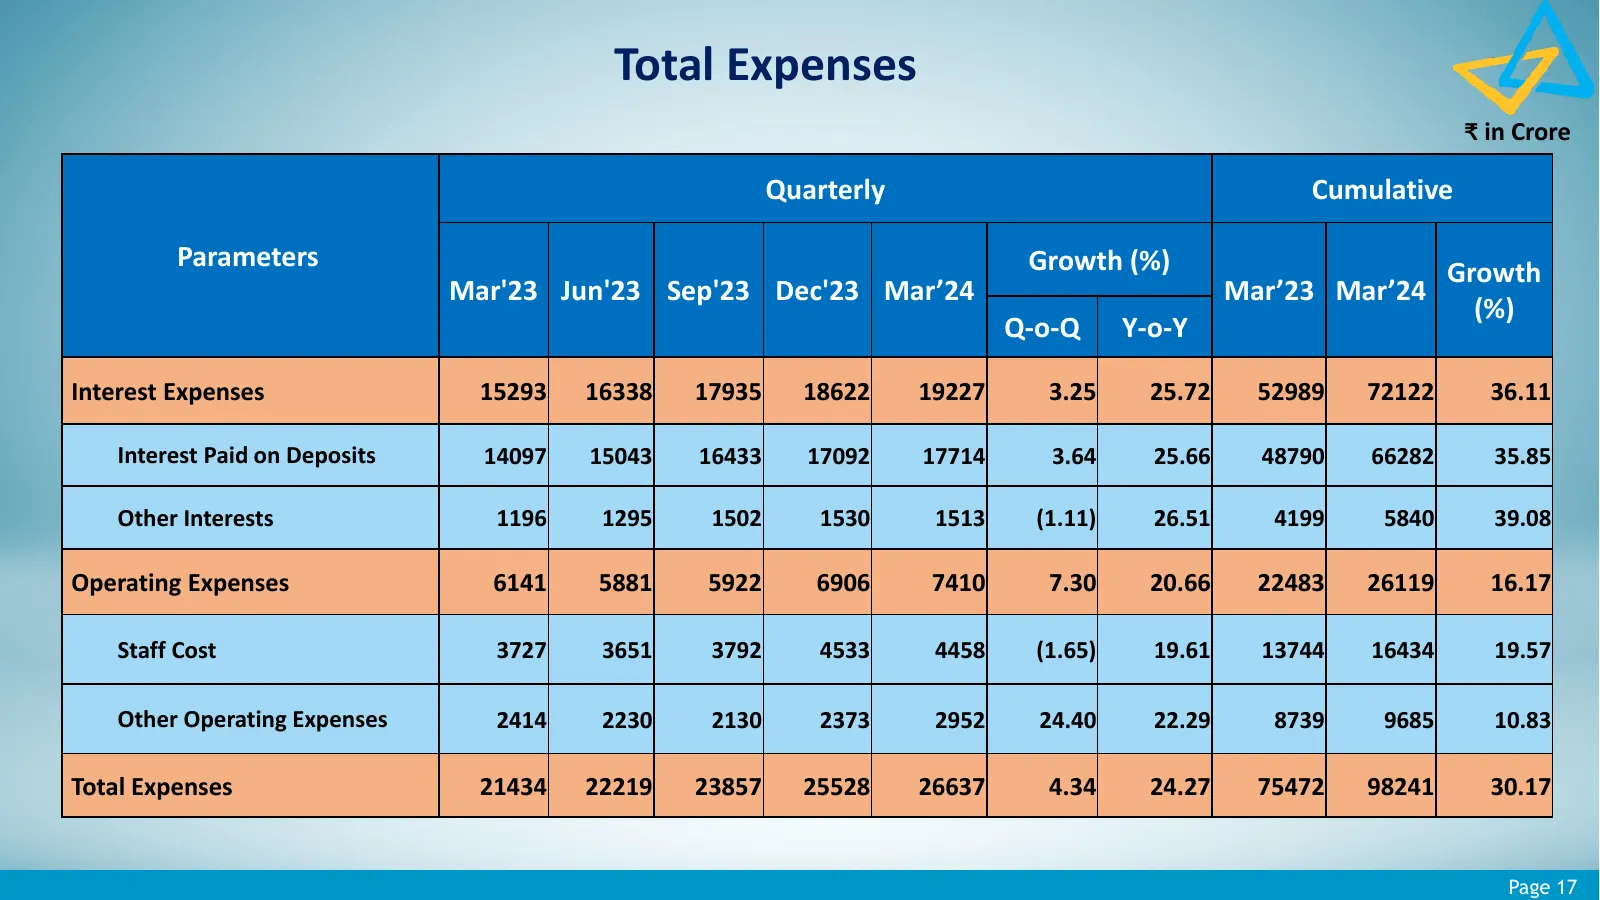
Total Expenses ₹ in Crore Quarterly Cumulative Parameters Growth (%) Growth Mar'23 Jun'23 Sep'23 Dec'23 Mar’24 Mar’23 Mar’24 (%) Q-o-Q Y-o-Y Interest Expenses 15293 16338 17935 18622 19227 3.25 25.72 52989 72122 36.11 Interest Paid on Deposits 14097 15043 16433 17092 17714 3.64 25.66 48790 66282 35.
Slide 18: Financials at a Glance
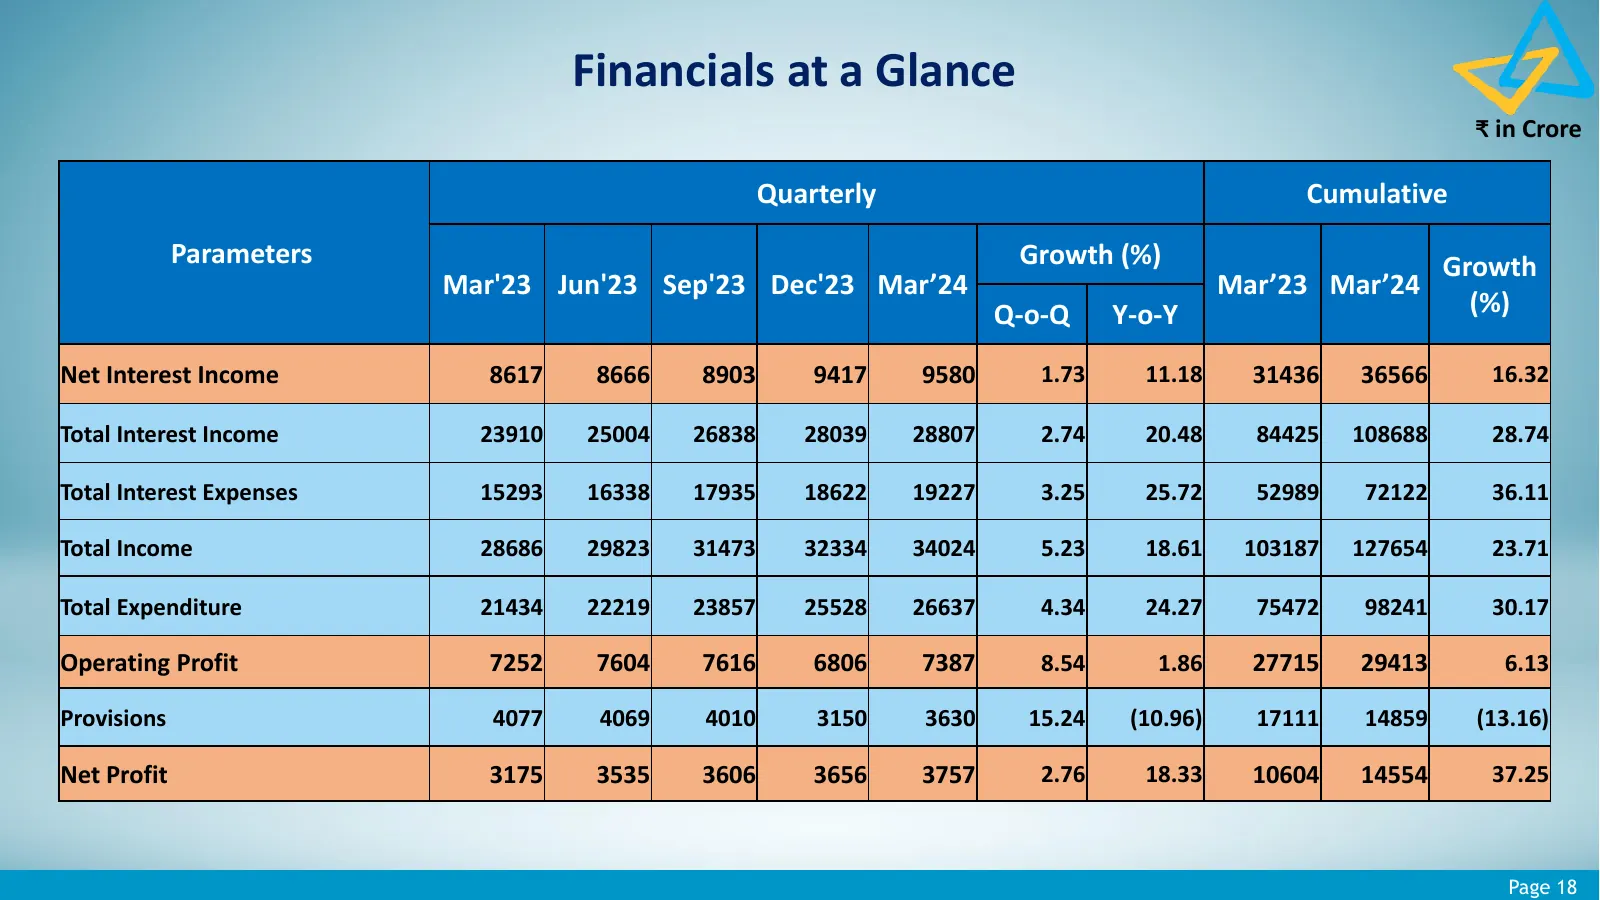
Financials at a Glance ₹ in Crore Quarterly Cumulative Parameters Growth (%) Growth Mar'23 Jun'23 Sep'23 Dec'23 Mar’24 Mar’23 Mar’24 Q-o-Q Y-o-Y (%) Net Interest Income 8617 8666 8903 9417 9580 1.73 11.18 31436 36566 16.32 Total Interest Income 23910 25004 26838 28039 28807 2.74 20.48 84425 108688 2
Slide 19: Continuous & Consistent Growth
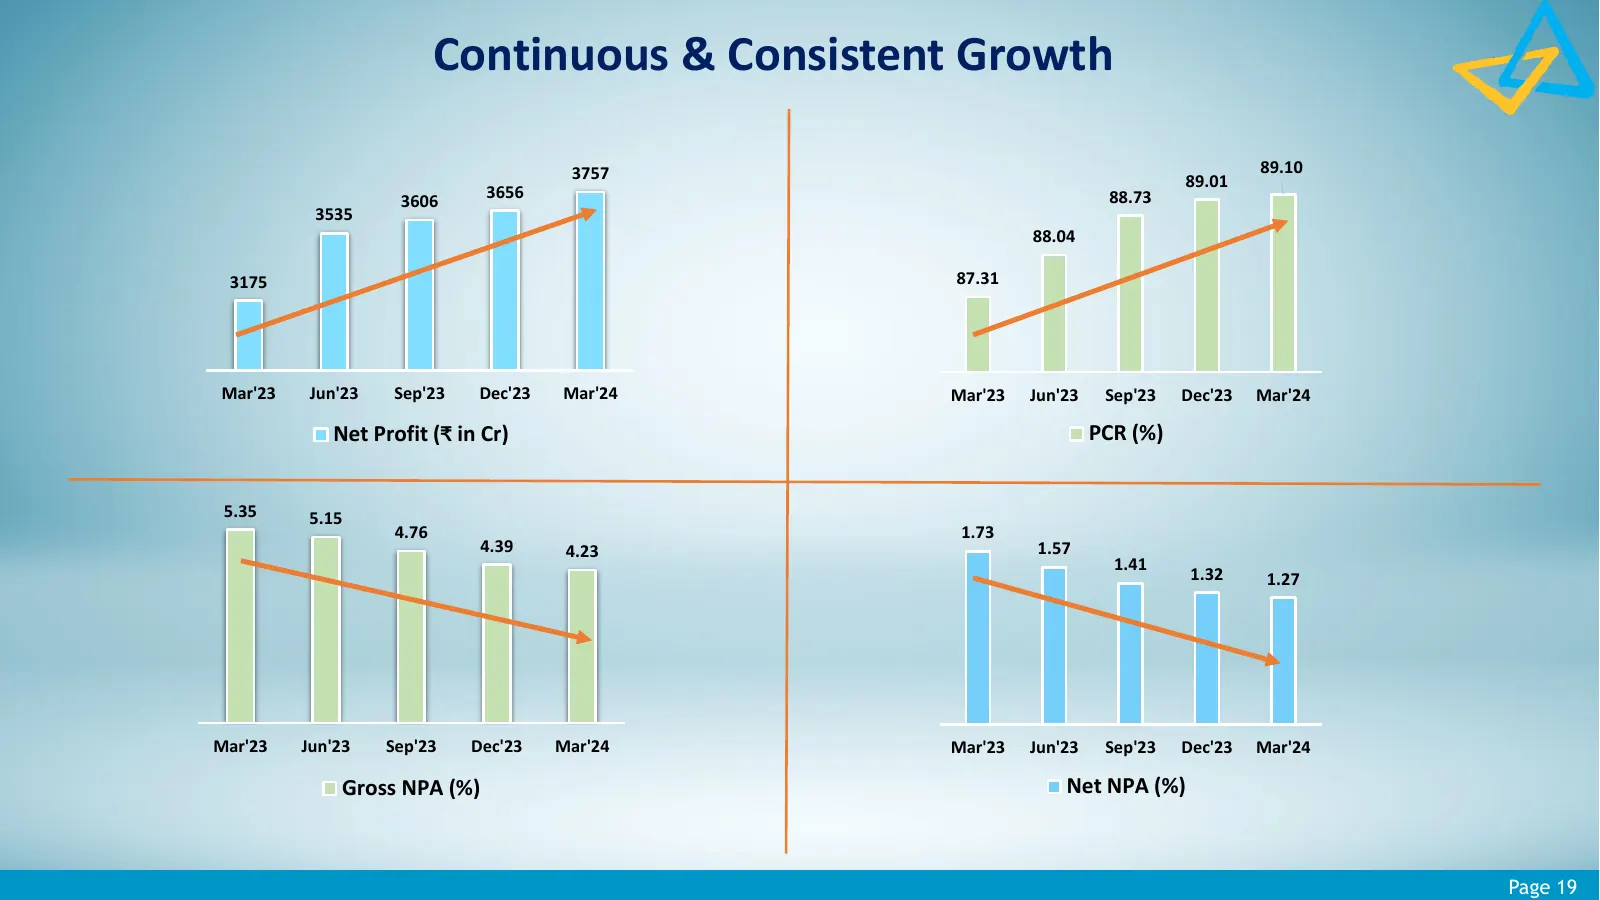
Continuous & Consistent Growth 3757 89.10 89.01 3656 88.73 3606 3535 88.04 3175 87.31 Mar'23 Jun'23 Sep'23 Dec'23 Mar'24 Mar'23 Jun'23 Sep'23 Dec'23 Mar'24 Net Profit (₹ in Cr) PCR (%) 5.35 5.15 4.76 1.73 4.39 4.23 1.57 1.41 1.32 1.27 Mar'23 Jun'23 Sep'23 Dec'23 Mar'24 Mar'23 Jun'23 Sep'23 Dec'23 Ma
Slide 20: Provisions
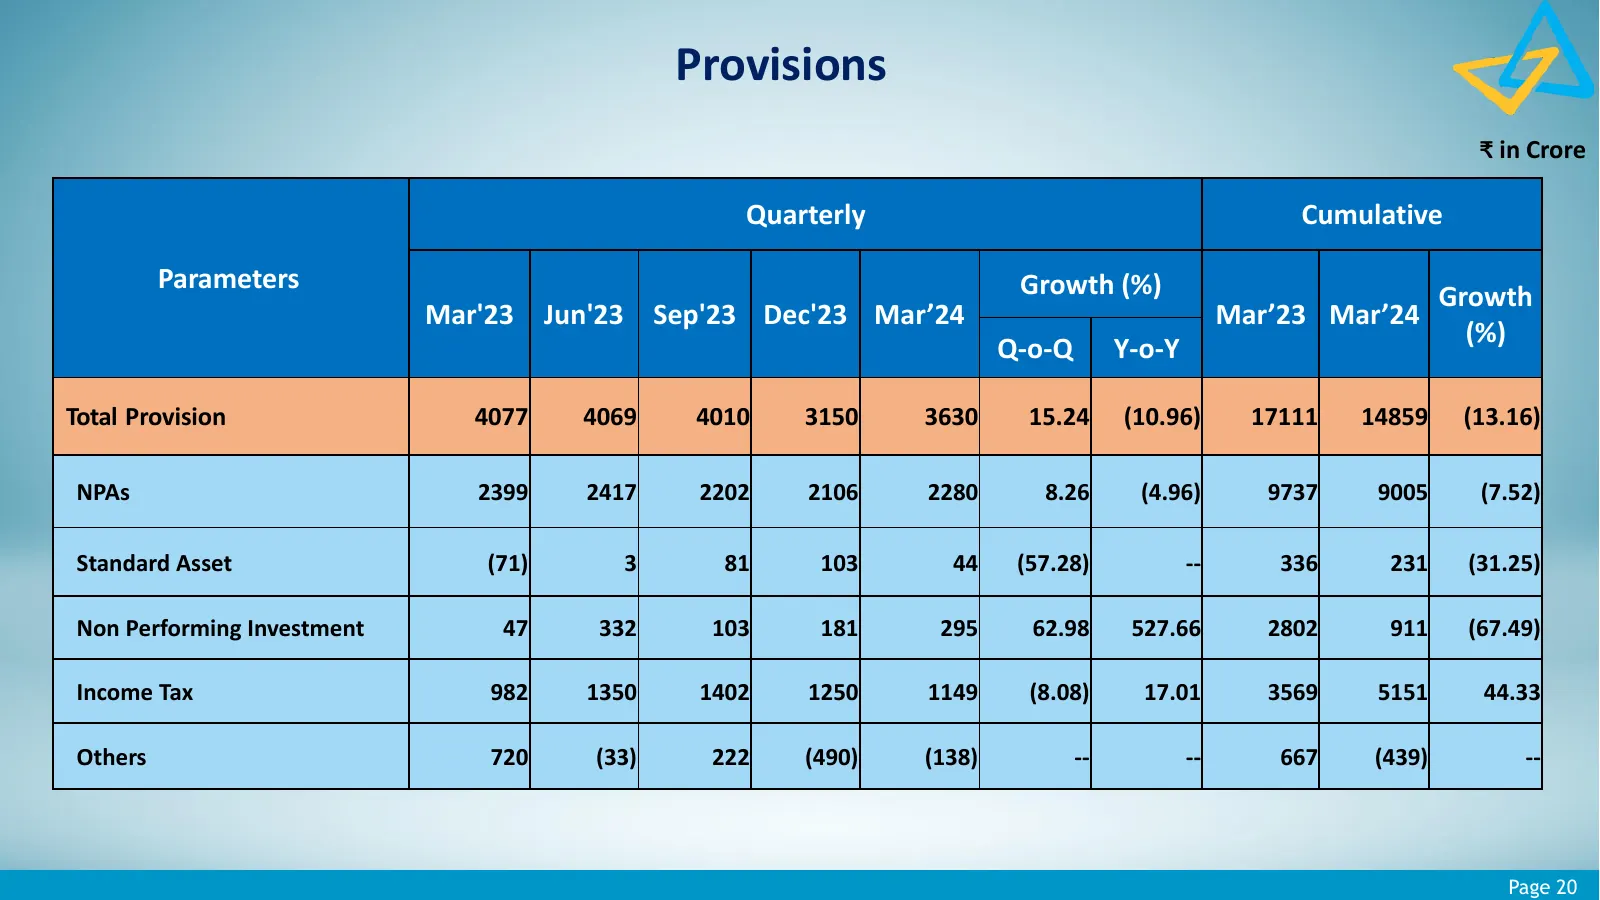
Provisions ₹ in Crore Quarterly Cumulative Parameters Growth (%) Growth Mar'23 Jun'23 Sep'23 Dec'23 Mar’24 Mar’23 Mar’24 (%) Q-o-Q Y-o-Y Total Provision 4077 4069 4010 3150 3630 15.24 (10.96) 17111 14859 (13.16) NPAs 2399 2417 2202 2106 2280 8.26 (4.96) 9737 9005 (7.52) Standard Asset (71) 3 81 103
Slide 21: Key Ratios
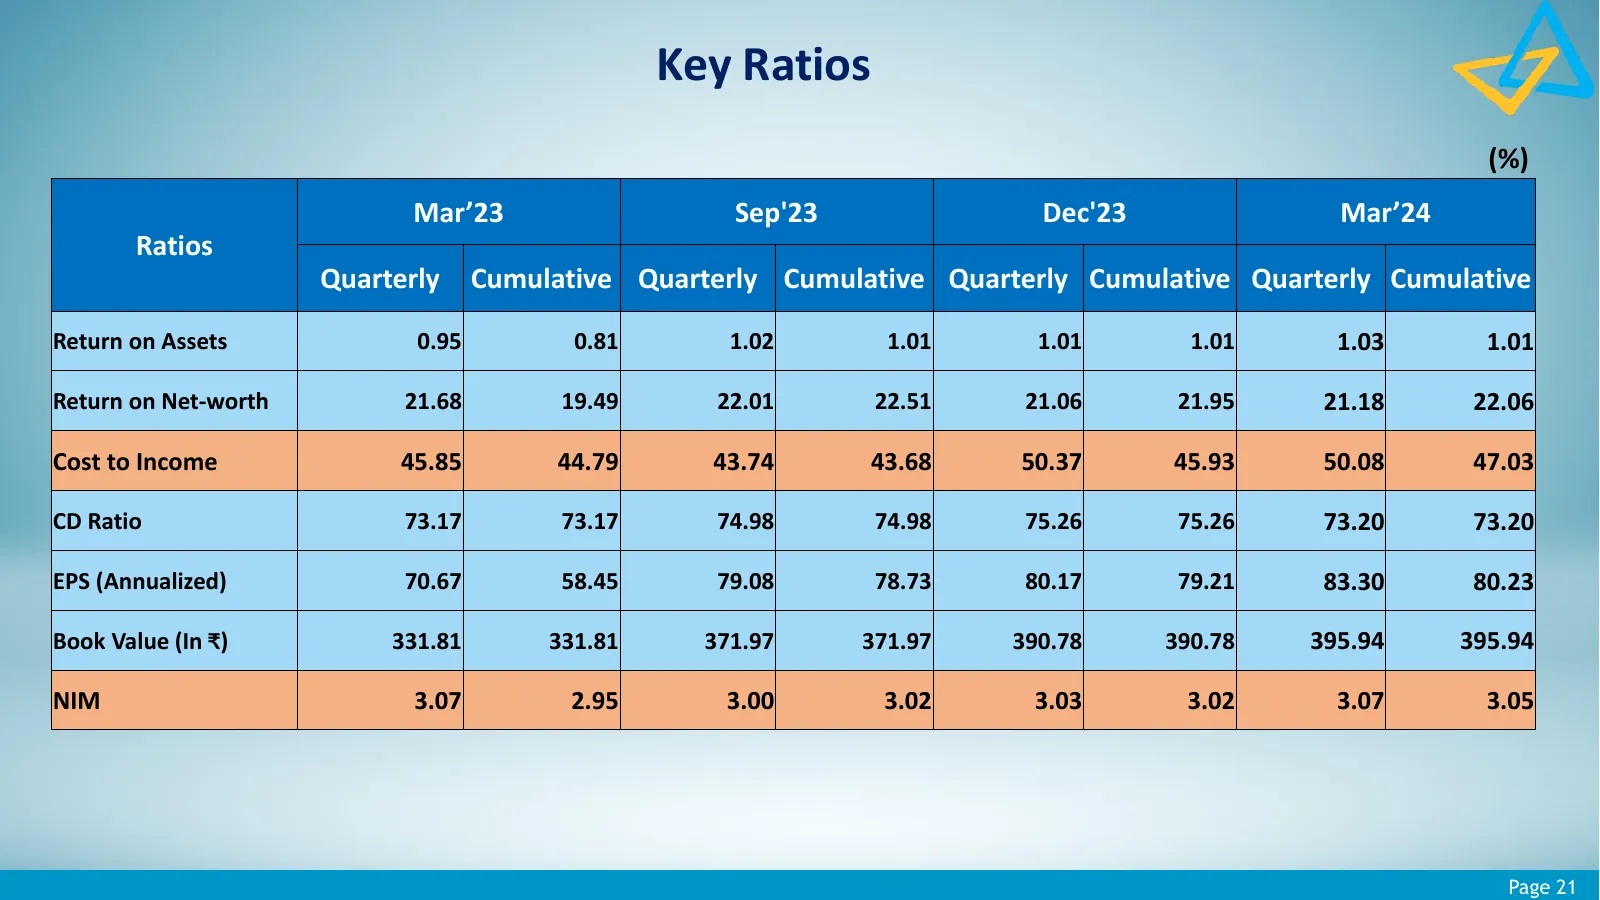
Key Ratios (%) Mar’23 Sep'23 Dec'23 Mar’24 Ratios Quarterly Cumulative Quarterly Cumulative Quarterly Cumulative Quarterly Cumulative Return on Assets 0.95 0.81 1.02 1.01 1.01 1.01 1.03 1.01 Return on Net-worth 21.68 19.49 22.01 22.51 21.06 21.95 21.18 22.06 Cost to Income 45.85 44.79 43.74 43.68 50
Slide 22: Key Ratios
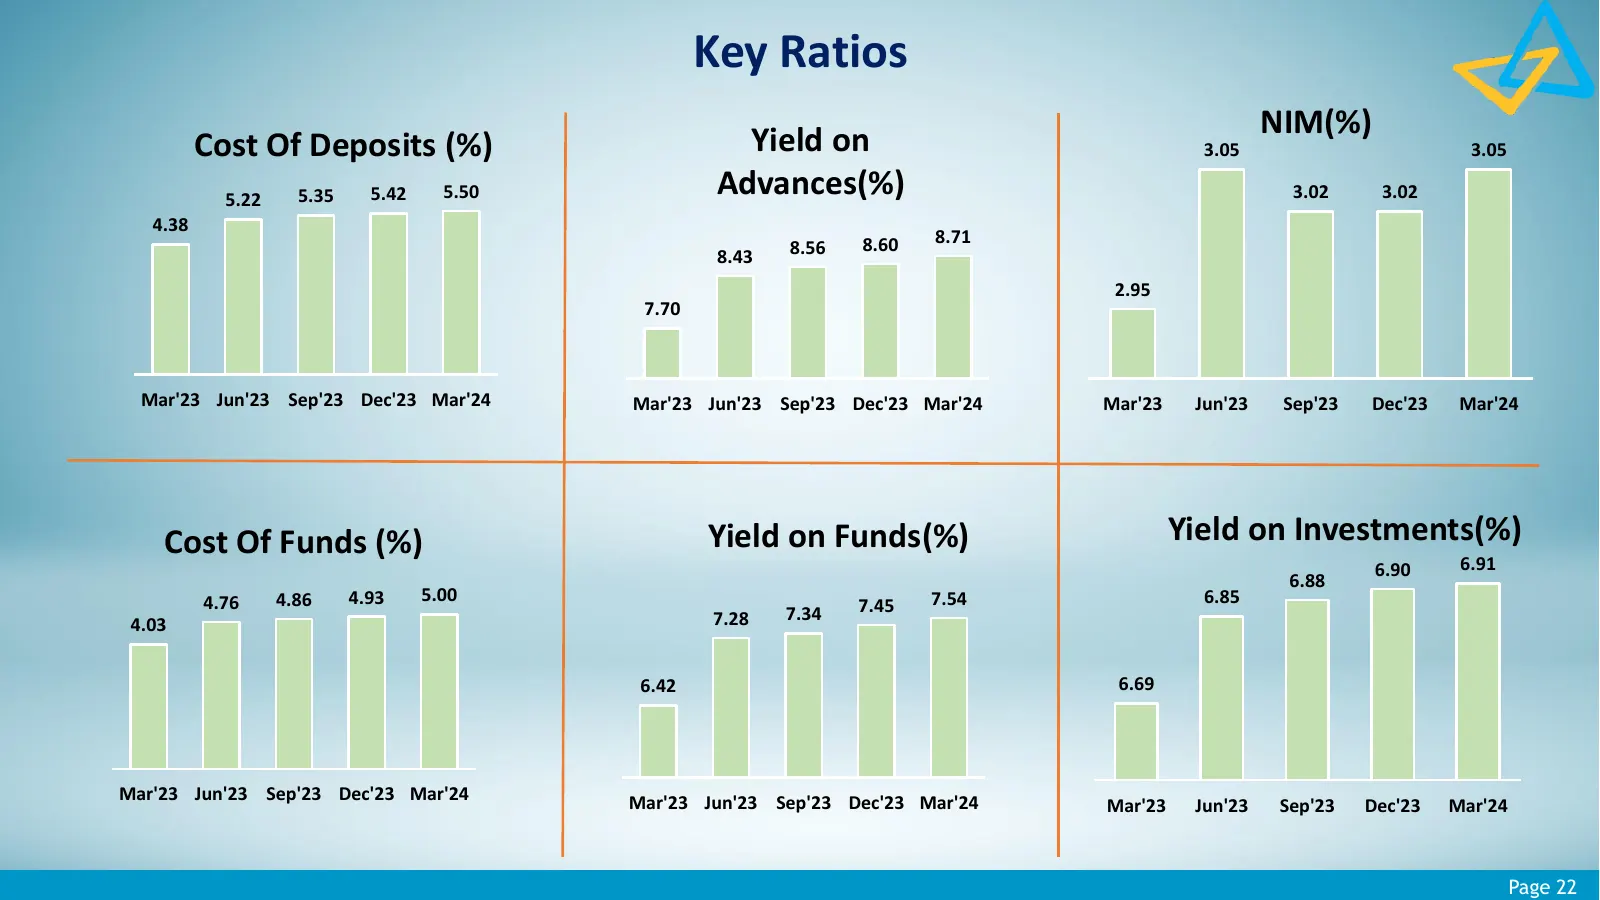
Key Ratios NIM(%) Cost Of Deposits (%) Yield on 3.05 3.05 5.22 5.35 5.42 5.50 Advances(%) 3.02 3.02 4.38 8.60 8.71 8.43 8.56 2.95 7.70 Mar'23 Jun'23 Sep'23 Dec'23 Mar'24 Mar'23 Jun'23 Sep'23 Dec'23 Mar'24 Mar'23 Jun'23 Sep'23 Dec'23 Mar'24 Cost Of Funds (%) Yield on Funds(%) Yield on Investments(%)

Slide 23: Investments
Inspired by Customers driven by Digital INVESTMENTS Page 23
Slide 24: Investment Portfolio
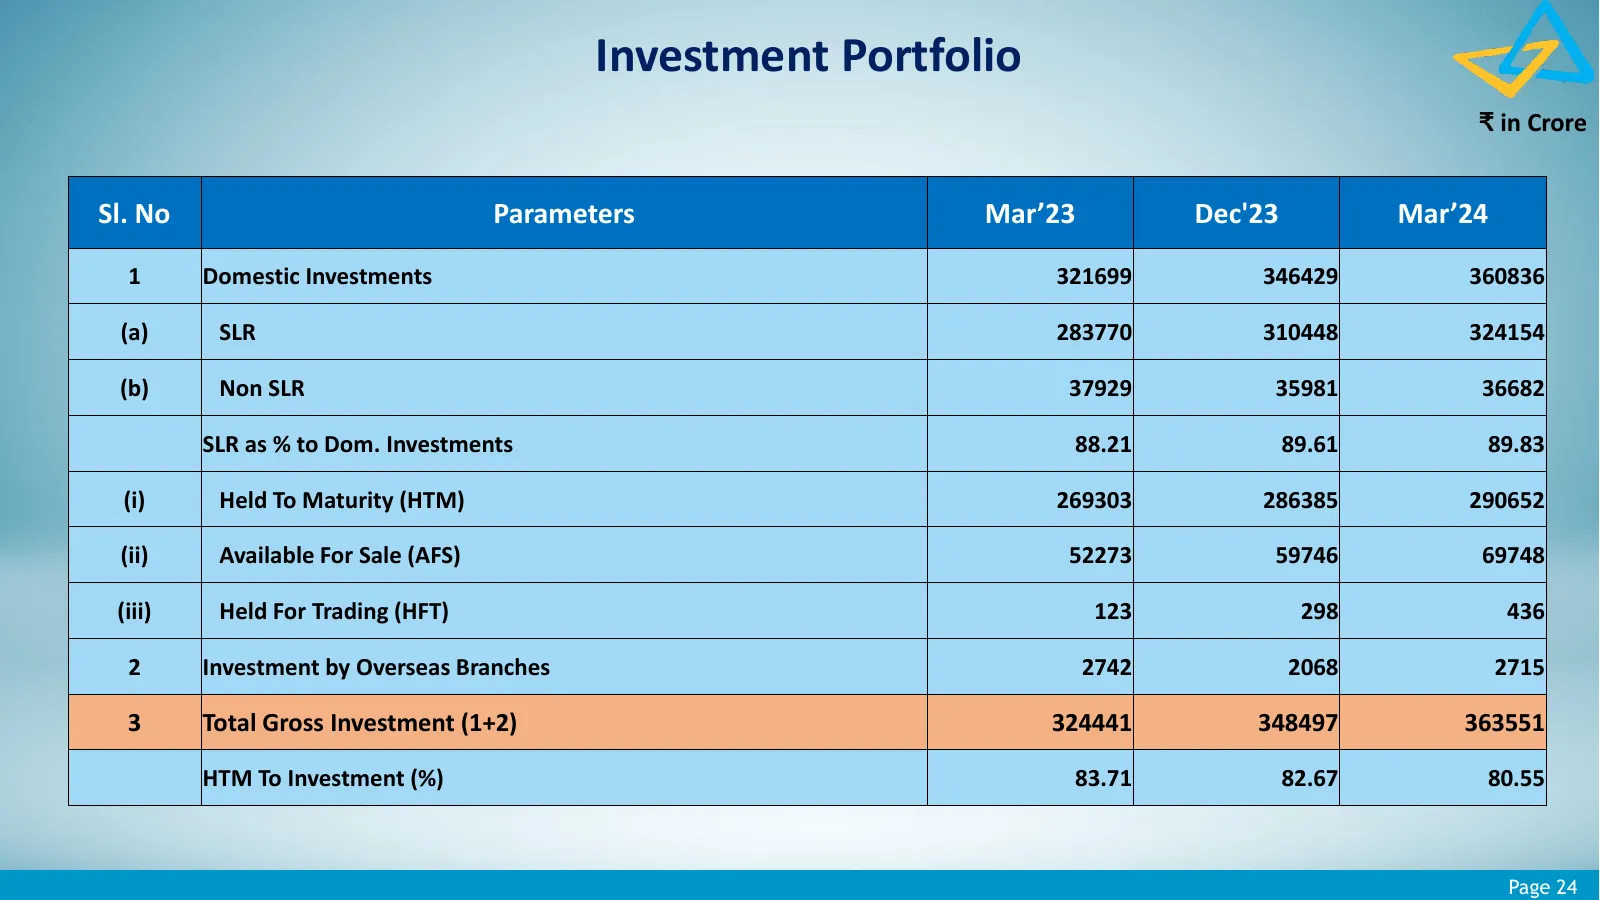
Investment Portfolio ₹ in Crore Sl. No Parameters Mar’23 Dec'23 Mar’24 1 Domestic Investments 321699 346429 360836 (a) SLR 283770 310448 324154 (b) Non SLR 37929 35981 36682 SLR as % to Dom. Investments 88.21 89.61 89.83 (i) Held To Maturity (HTM) 269303 286385 290652 (ii) Available For Sale (AFS) 5
Slide 25: Non SLR Portfolio
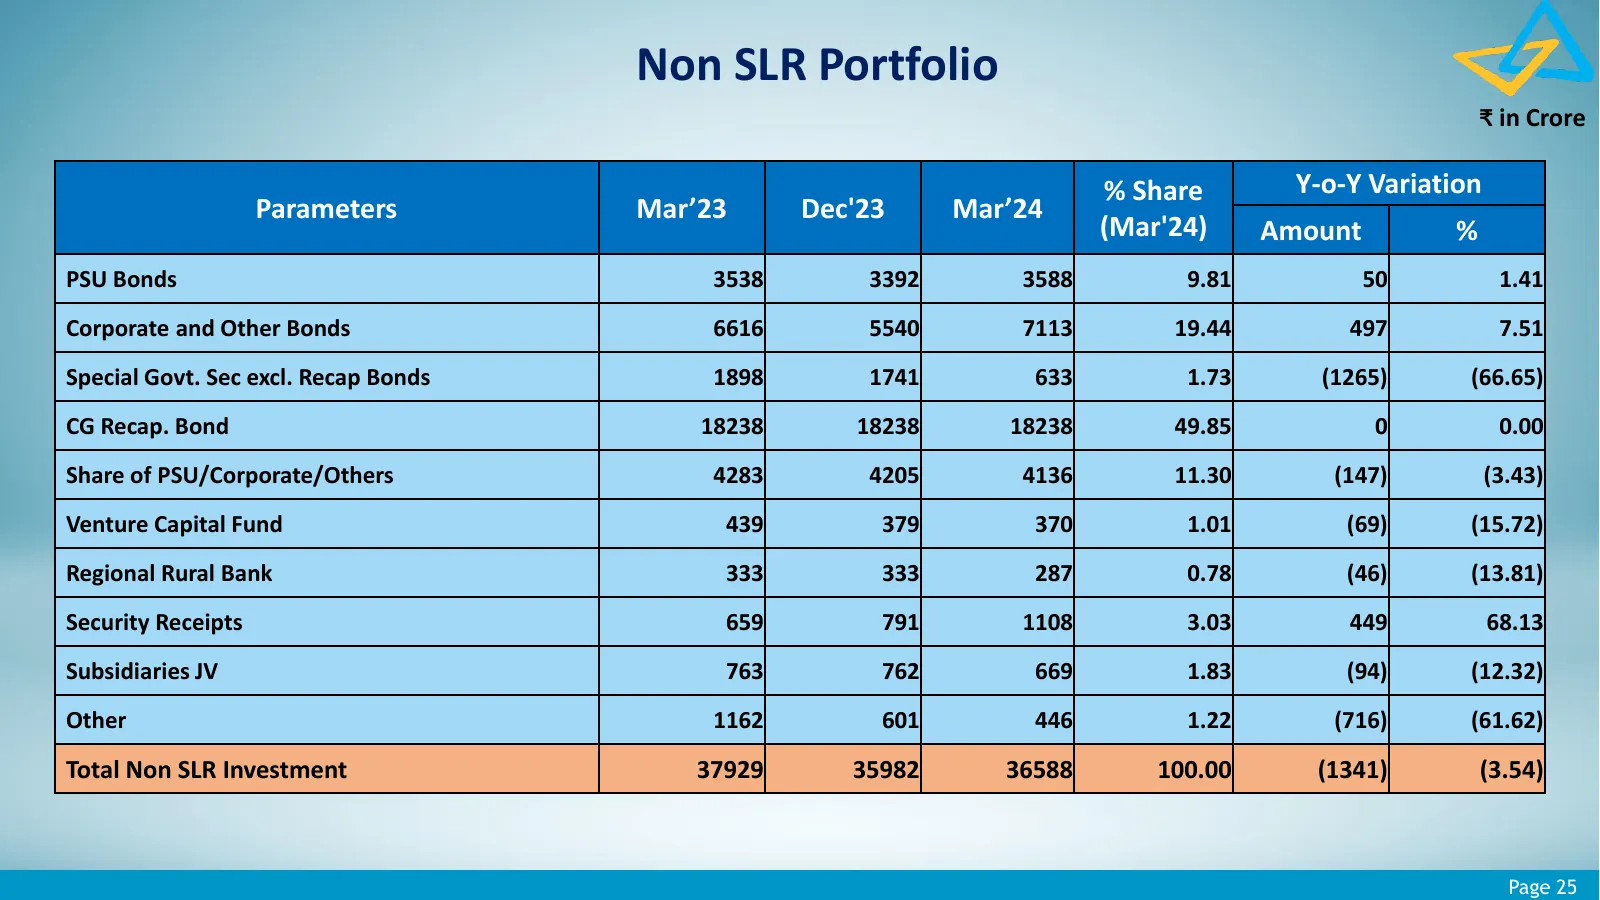
Non SLR Portfolio ₹ in Crore % Share Y-o-Y Variation Parameters Mar’23 Dec'23 Mar’24 (Mar'24) Amount % PSU Bonds 3538 3392 3588 9.81 50 1.41 Corporate and Other Bonds 6616 5540 7113 19.44 497 7.51 Special Govt. Sec excl. Recap Bonds 1898 1741 633 1.73 (1265) (66.65) CG Recap. Bond 18238 18238 18238

Slide 26: Asset Quality
Inspired by Customers driven by Digital Asset Quality Page 26
Slide 27: Asset Quality Ratios
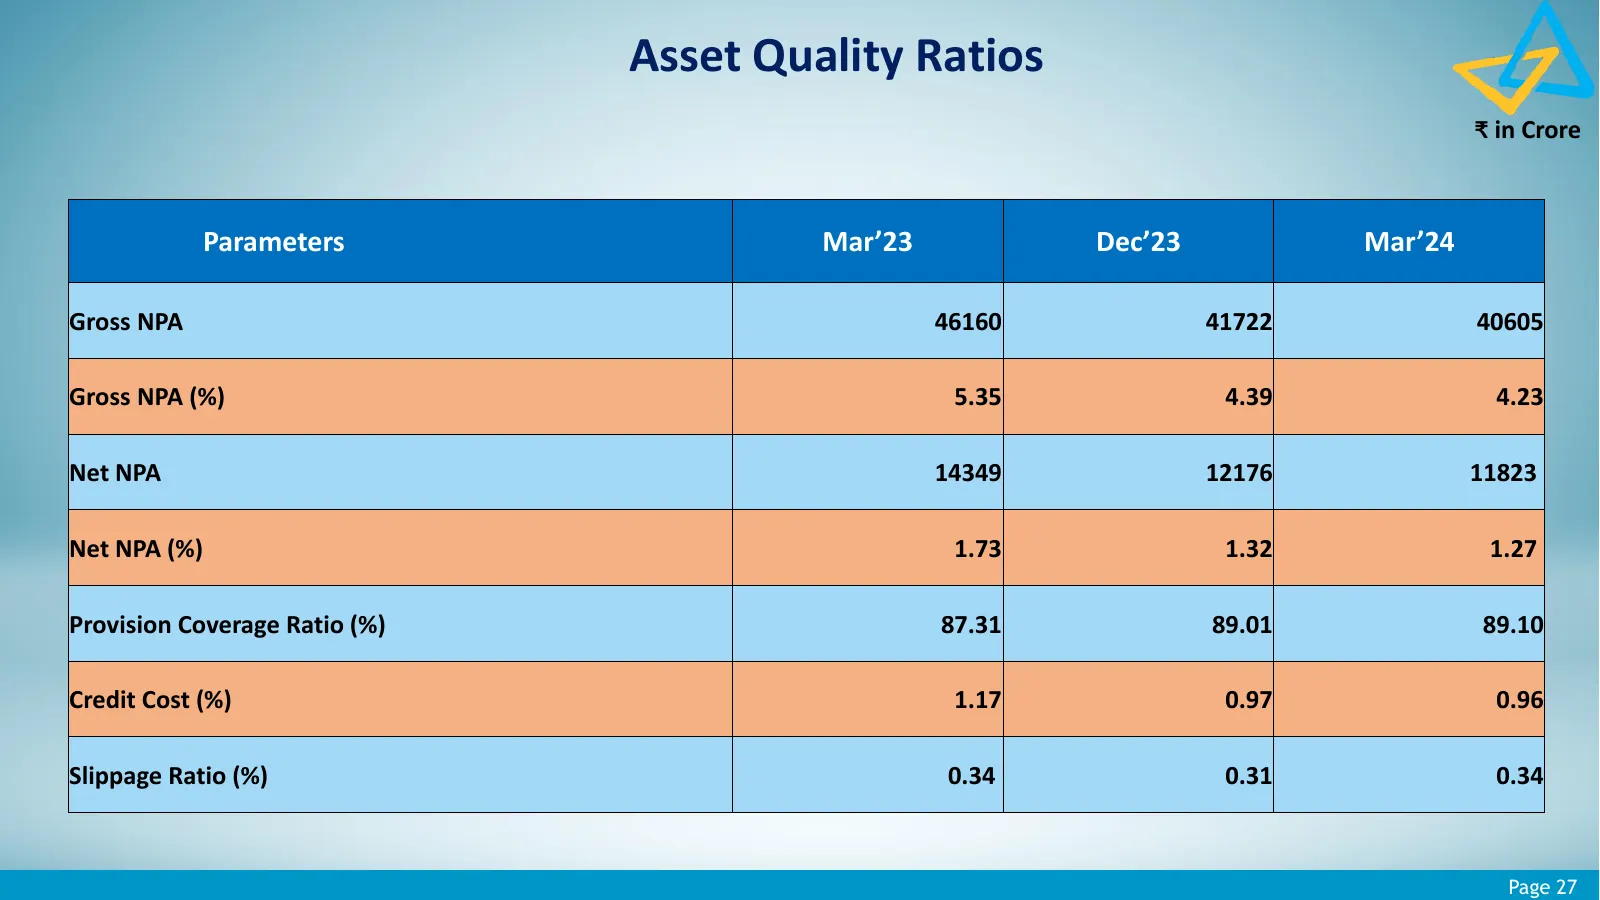
Asset Quality Ratios ₹ in Crore Parameters Mar’23 Dec’23 Mar’24 Gross NPA 46160 41722 40605 Gross NPA (%) 5.35 4.39 4.23 Net NPA 14349 12176 11823 Net NPA (%) 1.73 1.32 1.27 Provision Coverage Ratio (%) 87.31 89.01 89.10 Credit Cost (%) 1.17 0.97 0.96 Slippage Ratio (%) 0.34 0.31 0.34 Page 27
Slide 28: Movement of NPA
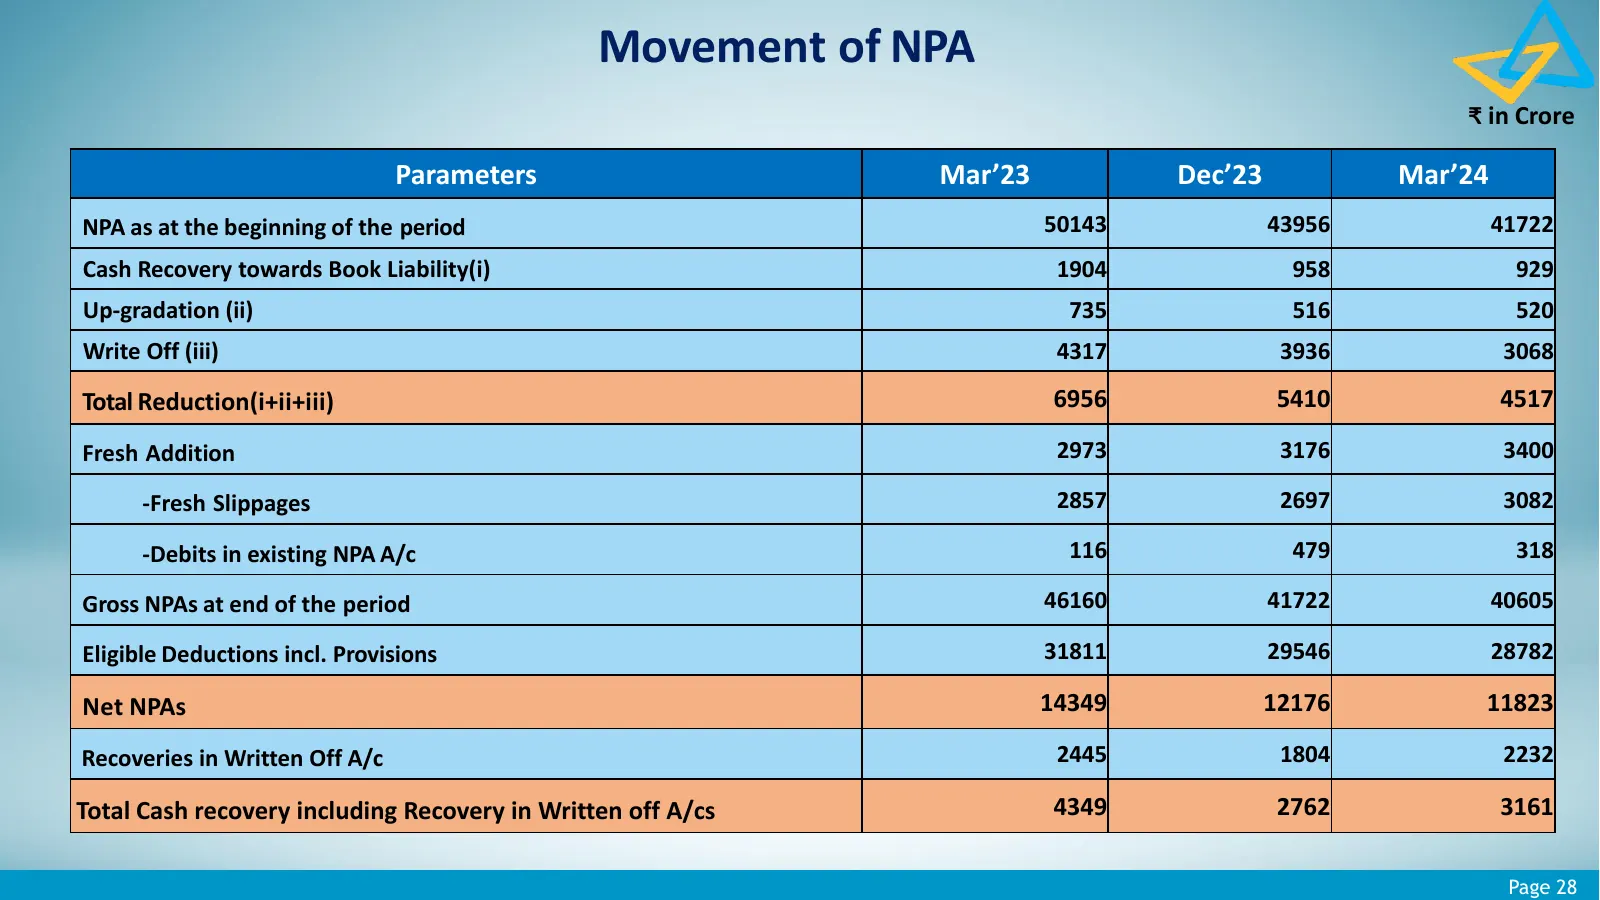
Movement of NPA ₹ in Crore Parameters Mar’23 Dec’23 Mar’24 NPA as at the beginning of the period 50143 43956 41722 Cash Recovery towards Book Liability(i) 1904 958 929 Up-gradation (ii) 735 516 520 Write Off (iii) 4317 3936 3068 Total Reduction(i+ii+iii) 6956 5410 4517 Fresh Addition 2973 3176 3400
Slide 29: NPA Classification: Sector Wise
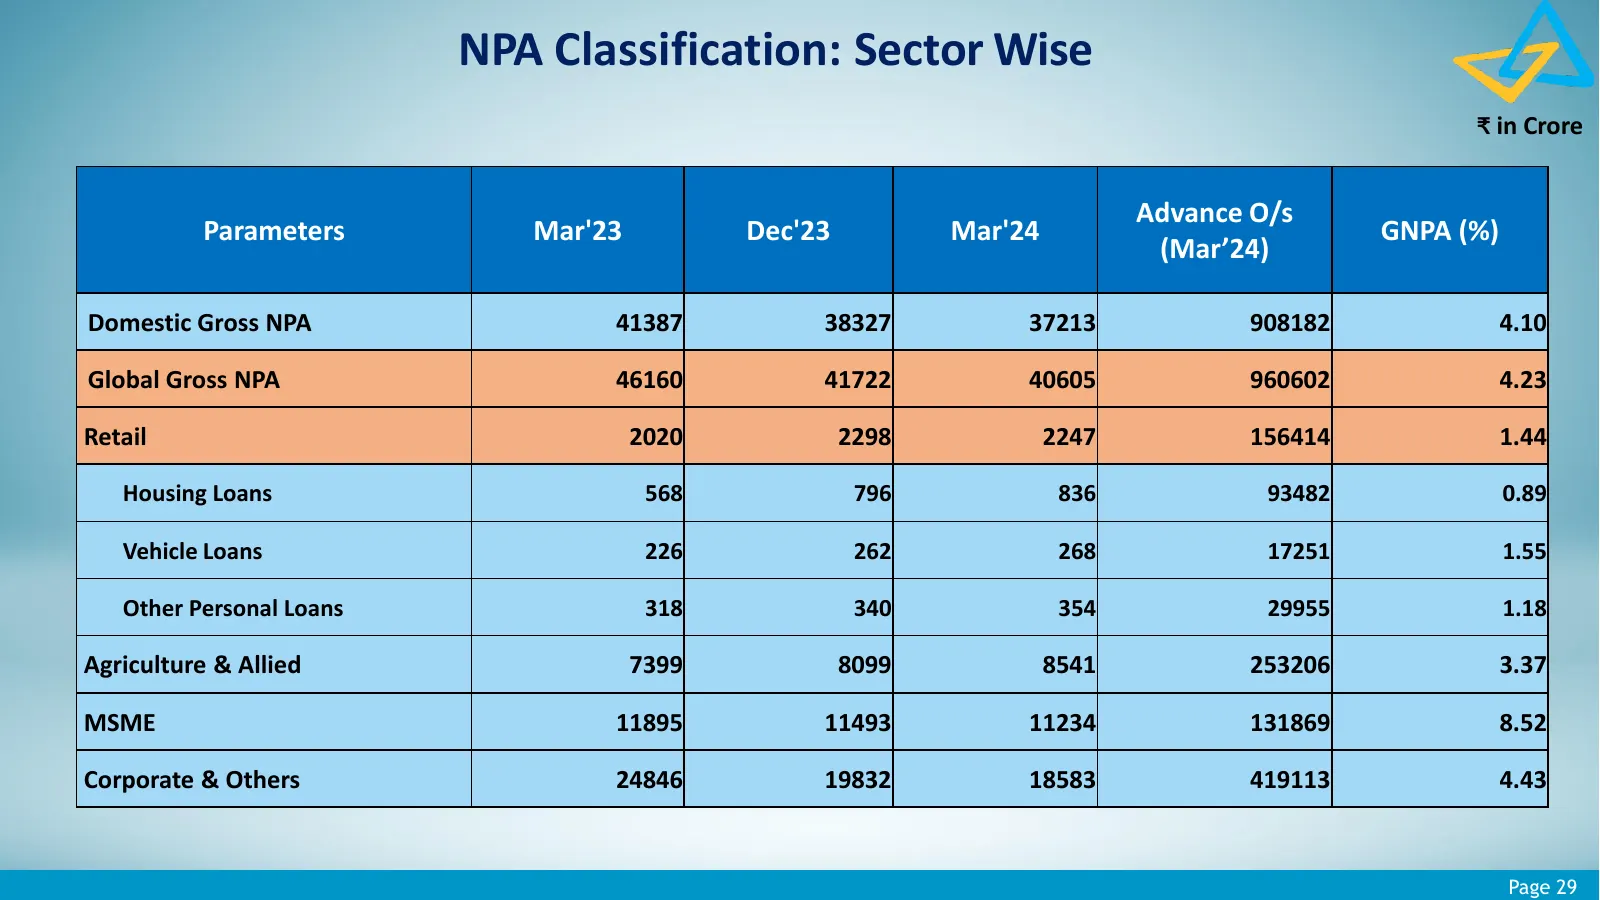
NPA Classification: Sector Wise ₹ in Crore Advance O/s Parameters Mar'23 Dec'23 Mar'24 GNPA (%) (Mar’24) Domestic Gross NPA 41387 38327 37213 908182 4.10 Global Gross NPA 46160 41722 40605 960602 4.23 Retail 2020 2298 2247 156414 1.44 Housing Loans 568 796 836 93482 0.89 Vehicle Loans 226 262 268 17
Slide 30: NPA Classification: Industry wise
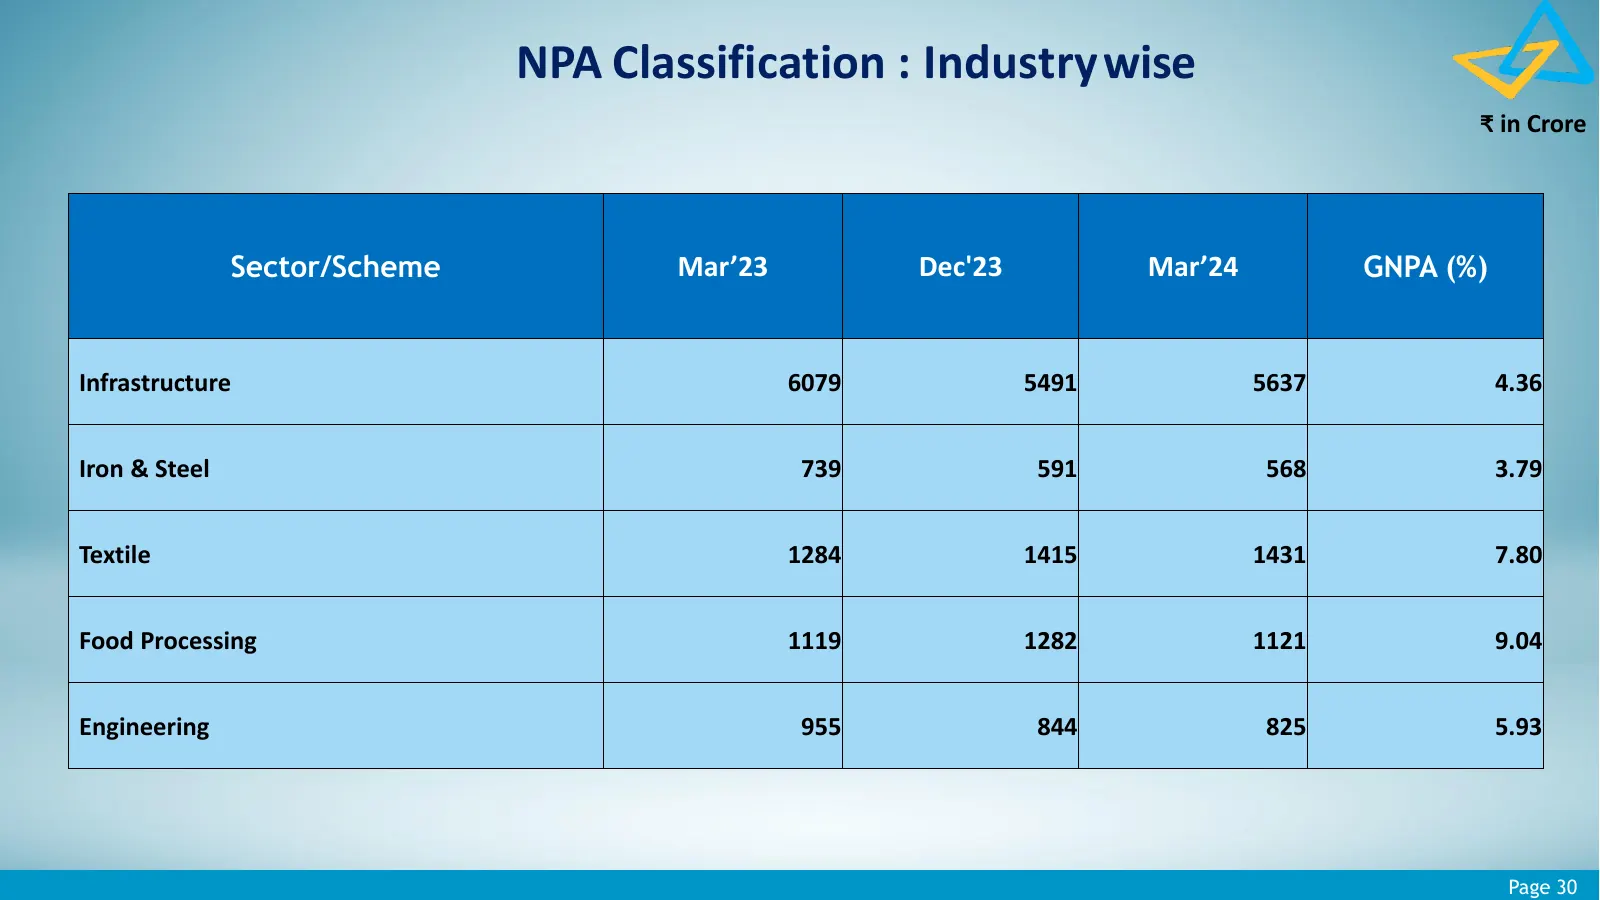
NPA Classification : Industry wise ₹ in Crore Sector/Scheme Mar’23 Dec'23 Mar’24 GNPA (%) Infrastructure 6079 5491 5637 4.36 Iron & Steel 739 591 568 3.79 Textile 1284 1415 1431 7.80 Food Processing 1119 1282 1121 9.04 Engineering 955 844 825 5.93 Page 30
Slide 31: Special Mention Accounts (SMA)
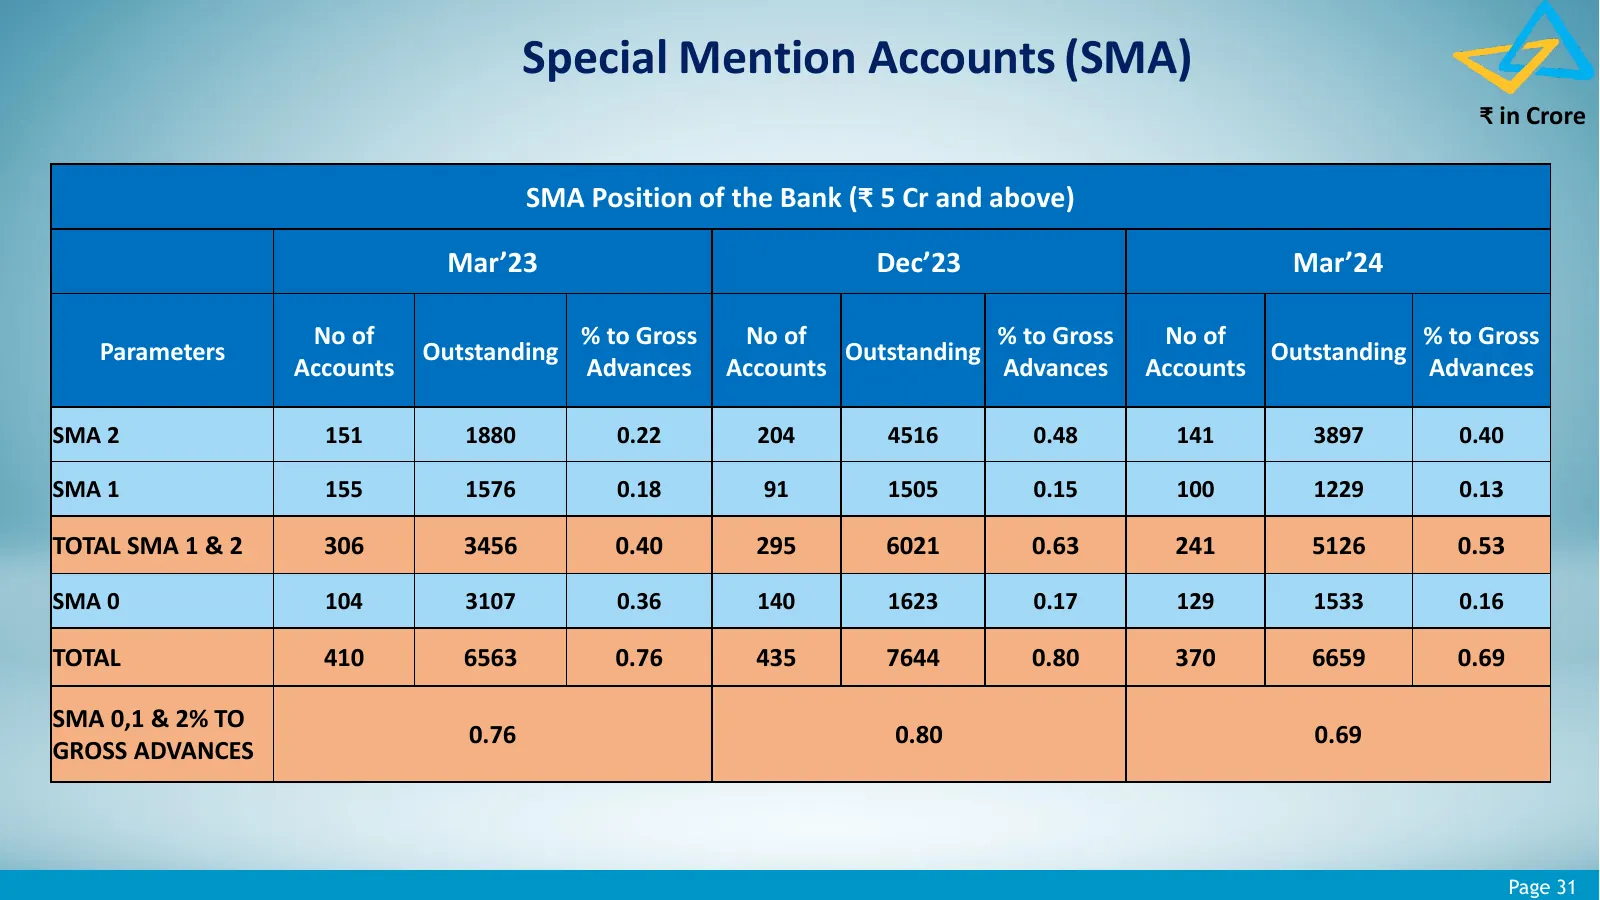
Special Mention Accounts (SMA) ₹ in Crore SMA Position of the Bank (₹ 5 Cr and above) Mar’23 Dec’23 Mar’24 No of % to Gross No of % to Gross No of % to Gross Parameters Outstanding Outstanding Outstanding Accounts Advances Accounts Advances Accounts Advances SMA 2 151 1880 0.22 204 4516 0.48 141 389
Slide 32: Accounts referred to NCLT / NCLT Resolution Status
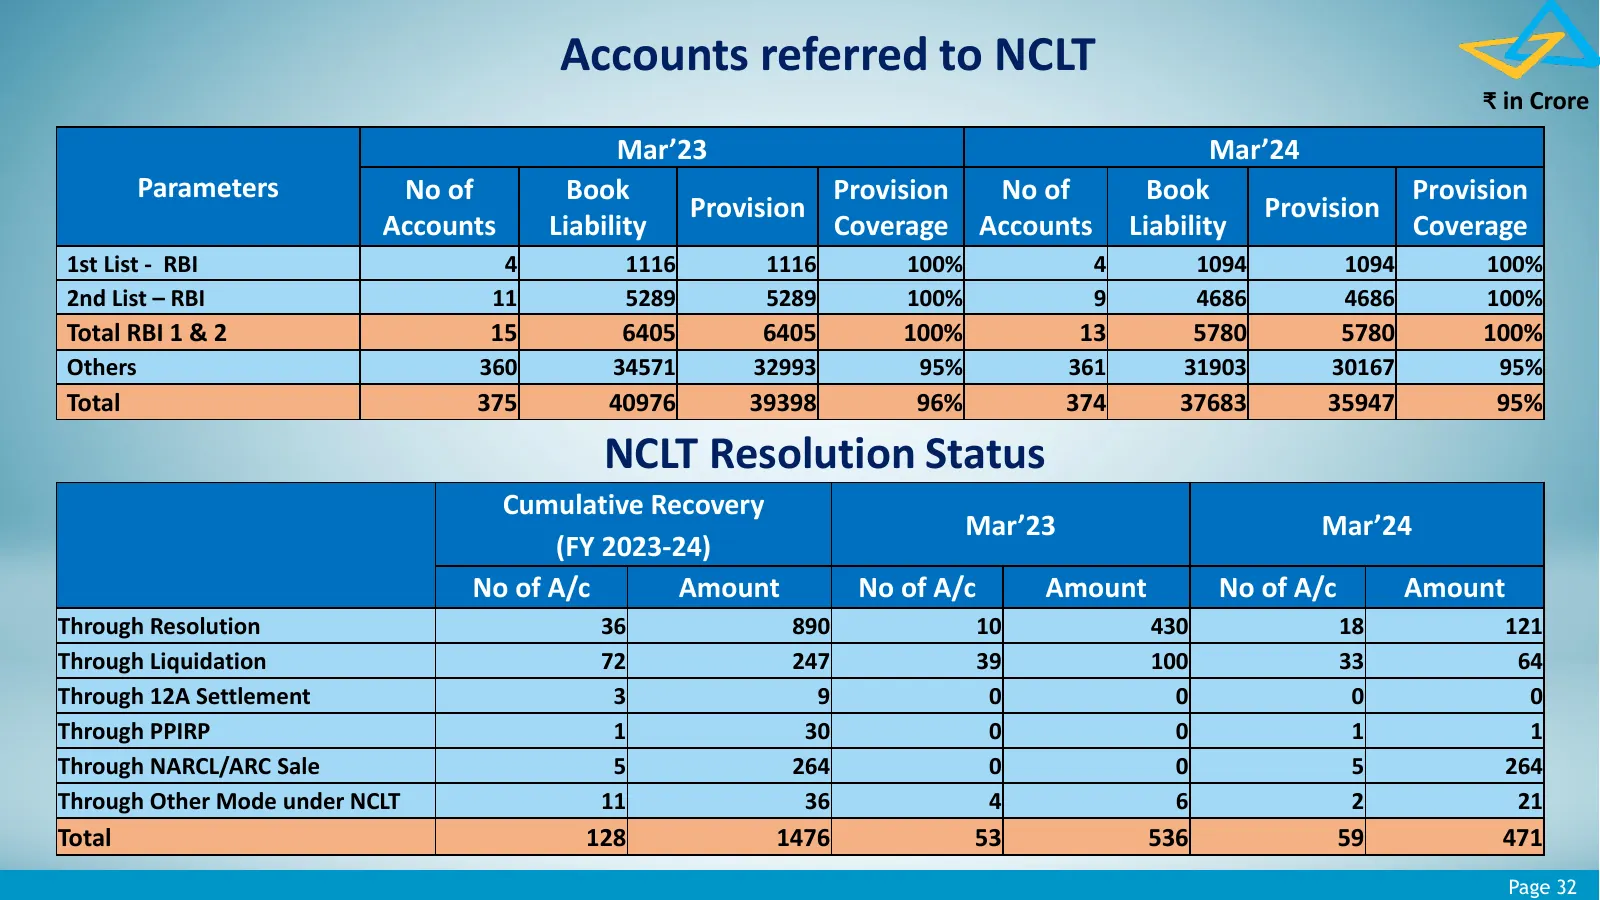
Accounts referred to NCLT ₹ in Crore Mar’23 Mar’24 Parameters No of Book Provision No of Book Provision Provision Provision Accounts Liability Coverage Accounts Liability Coverage 1st List - RBI 4 1116 1116 100% 4 1094 1094 100% 2nd List – RBI 11 5289 5289 100% 9 4686 4686 100% Total RBI 1 & 2 15 64

Slide 33: Capital & Shareholding
Capital & Shareholding Inspired by Customers driven by Digital Page 33
Slide 34: Capital Funds (Basel III)
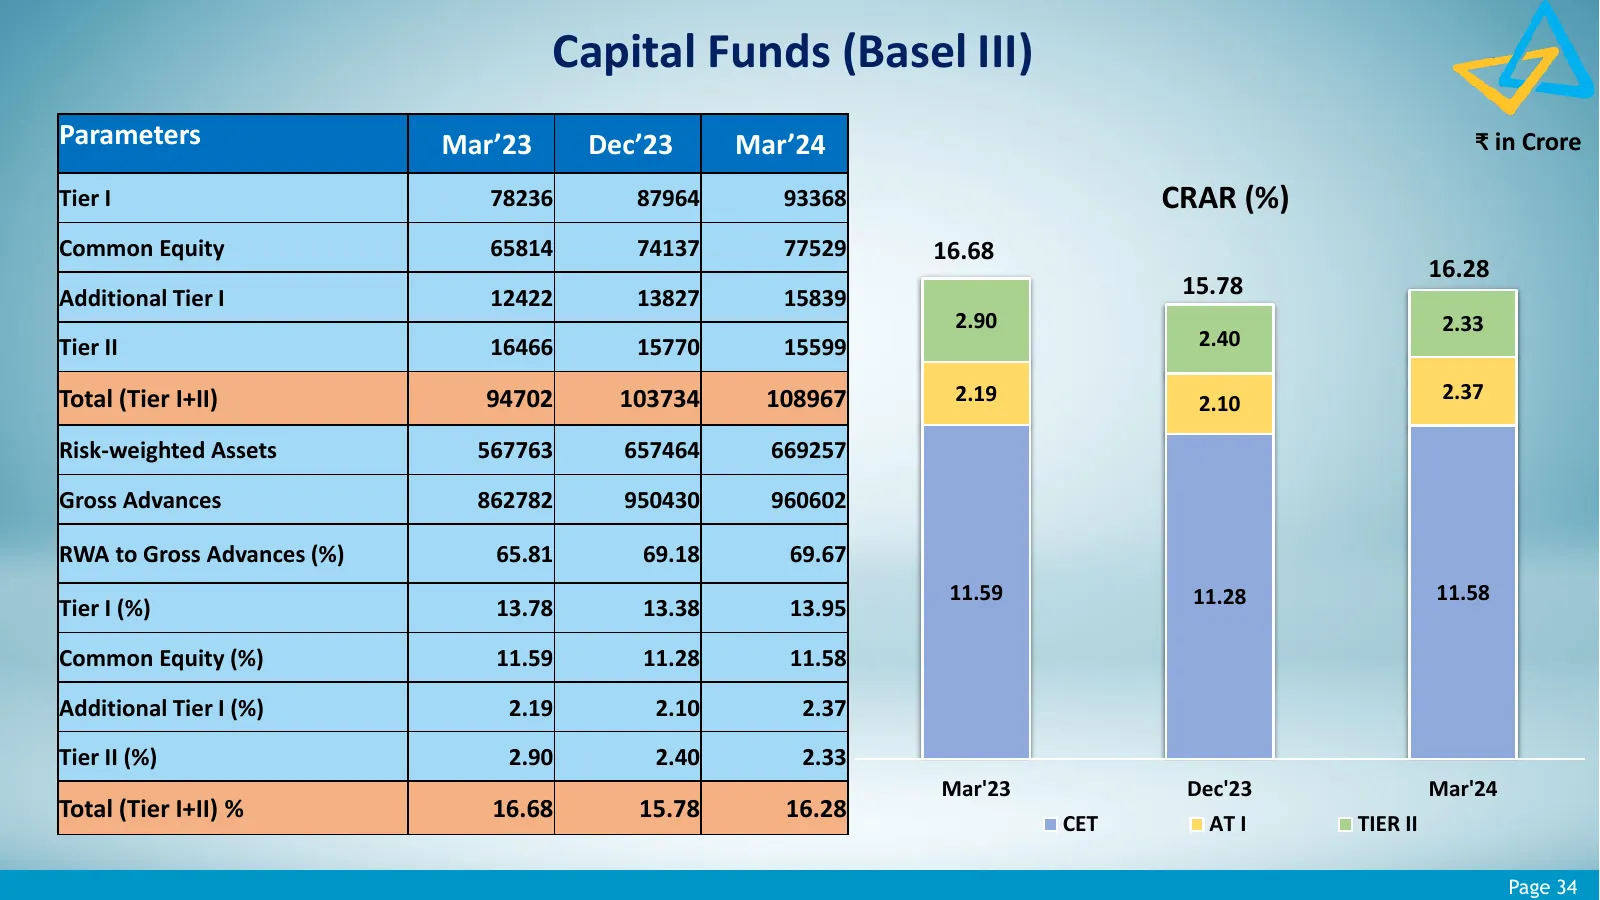
Capital Funds (Basel III) Parameters Mar’23 Dec’23 Mar’24 ₹ in Crore Tier I 78236 87964 93368 CRAR (%) Common Equity 65814 74137 77529 16.68 16.28 Additional Tier I 12422 13827 15839 15.78 2.90 2.33 Tier II 16466 15770 15599 2.40 Total (Tier I+II) 94702 103734 108967 2.19 2.37 2.10 Risk-weighted Ass
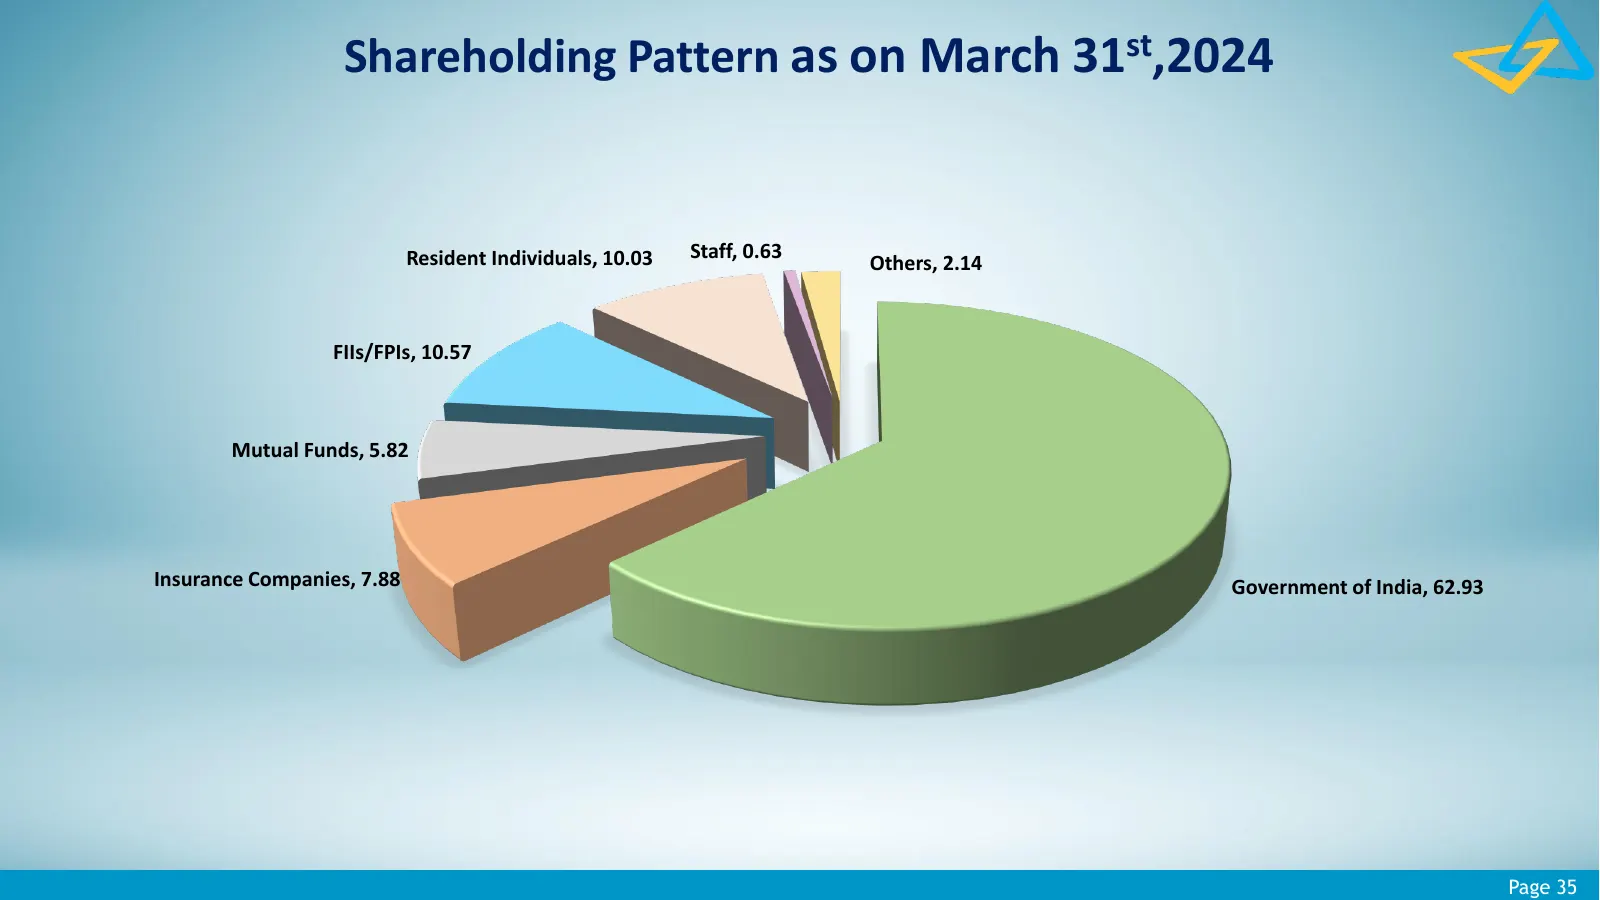
Slide 35: Shareholding Pattern as on March 31st, 2024
Shareholding Pattern as on March 31st,2024 Resident Individuals, 10.03 Staff, 0.63 Others, 2.14 FIIs/FPIs, 10.57 Mutual Funds, 5.82 Insurance Companies, 7.88 Government of India, 62.93 Page 35

Slide 36: Environmental, Social & Governance
Inspired by Customers driven by Digital Environmental, Social & Governance Page 36
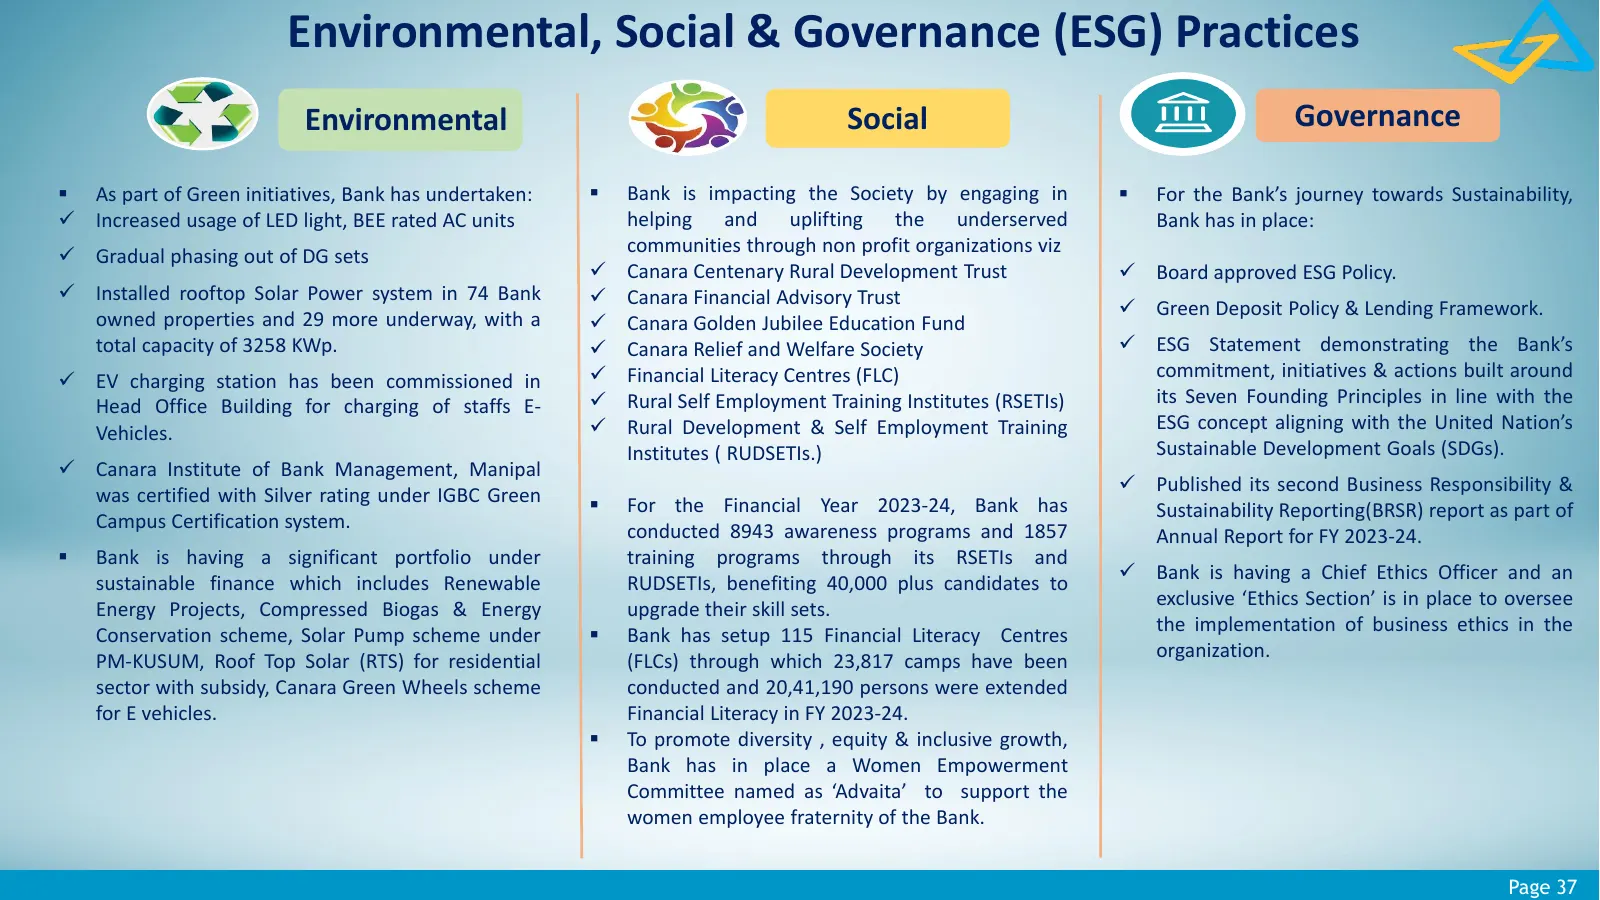
Slide 37: Environmental, Social & Governance (ESG) Practices
Environmental, Social & Governance (ESG) Practices Environmental Social Governance As part of Green initiatives, Bank has undertaken: Bank is impacting the Society by engaging in For the Bank’s journey towards Sustainability, Increased usage of LED light, BEE rated AC units helping and uplif
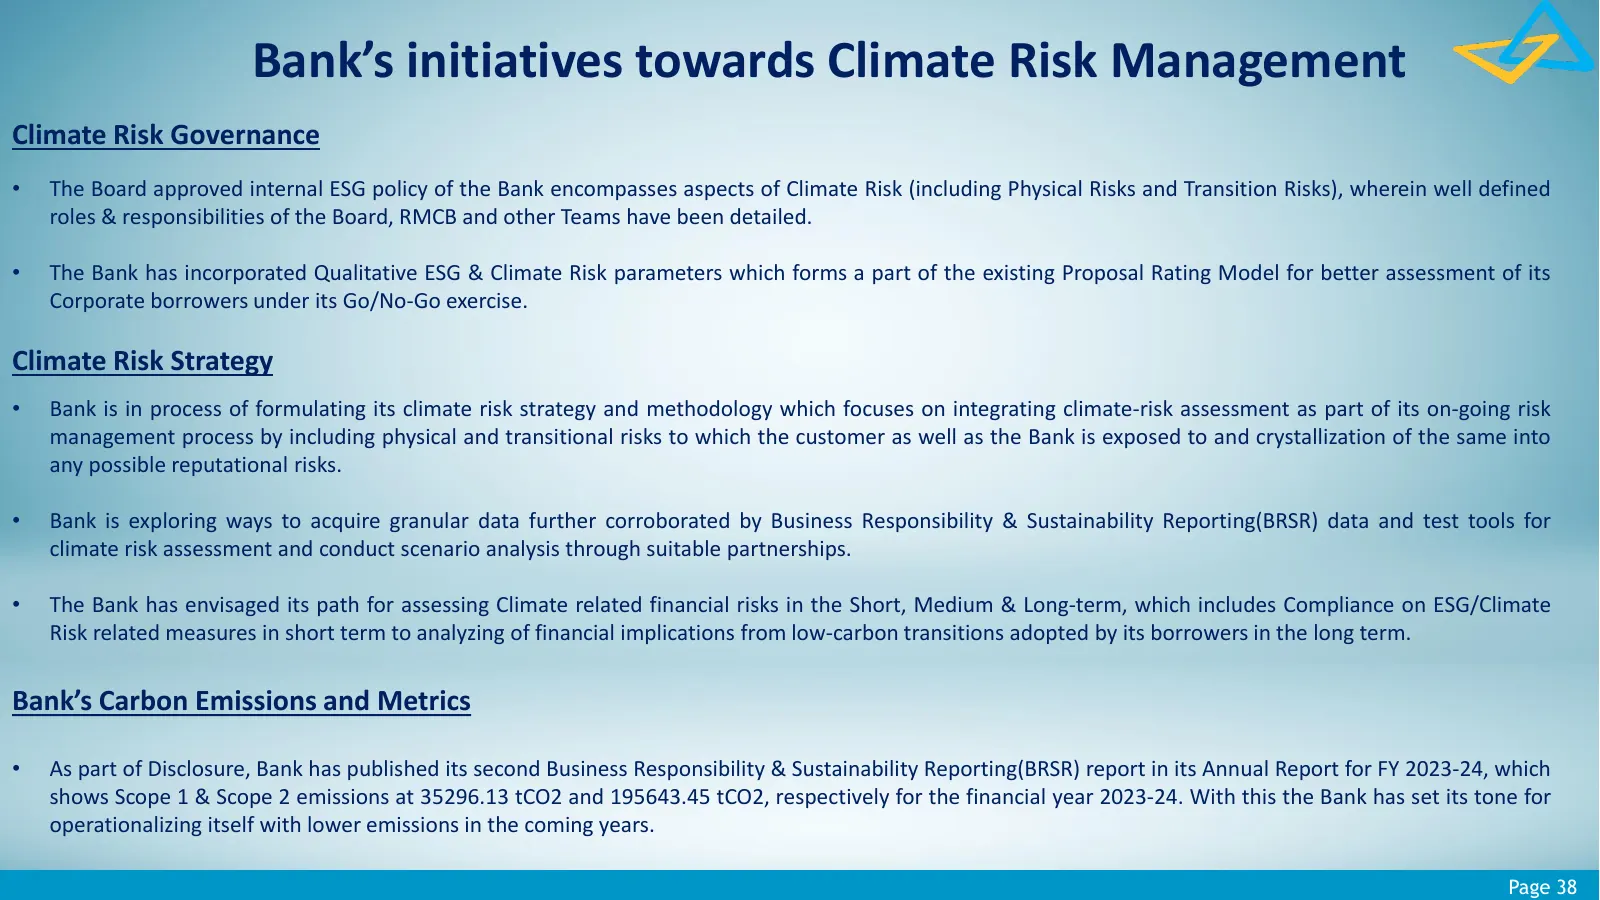
Slide 38: Bank's initiatives towards Climate Risk Management
Bank’s initiatives towards Climate Risk Management Climate Risk Governance • The Board approved internal ESG policy of the Bank encompasses aspects of Climate Risk (including Physical Risks and Transition Risks), wherein well defined roles & responsibilities of the Board, RMCB and other Teams have b

Slide 39: Distribution Network
Inspired by Customers driven by Digital Distribution Network Page 39
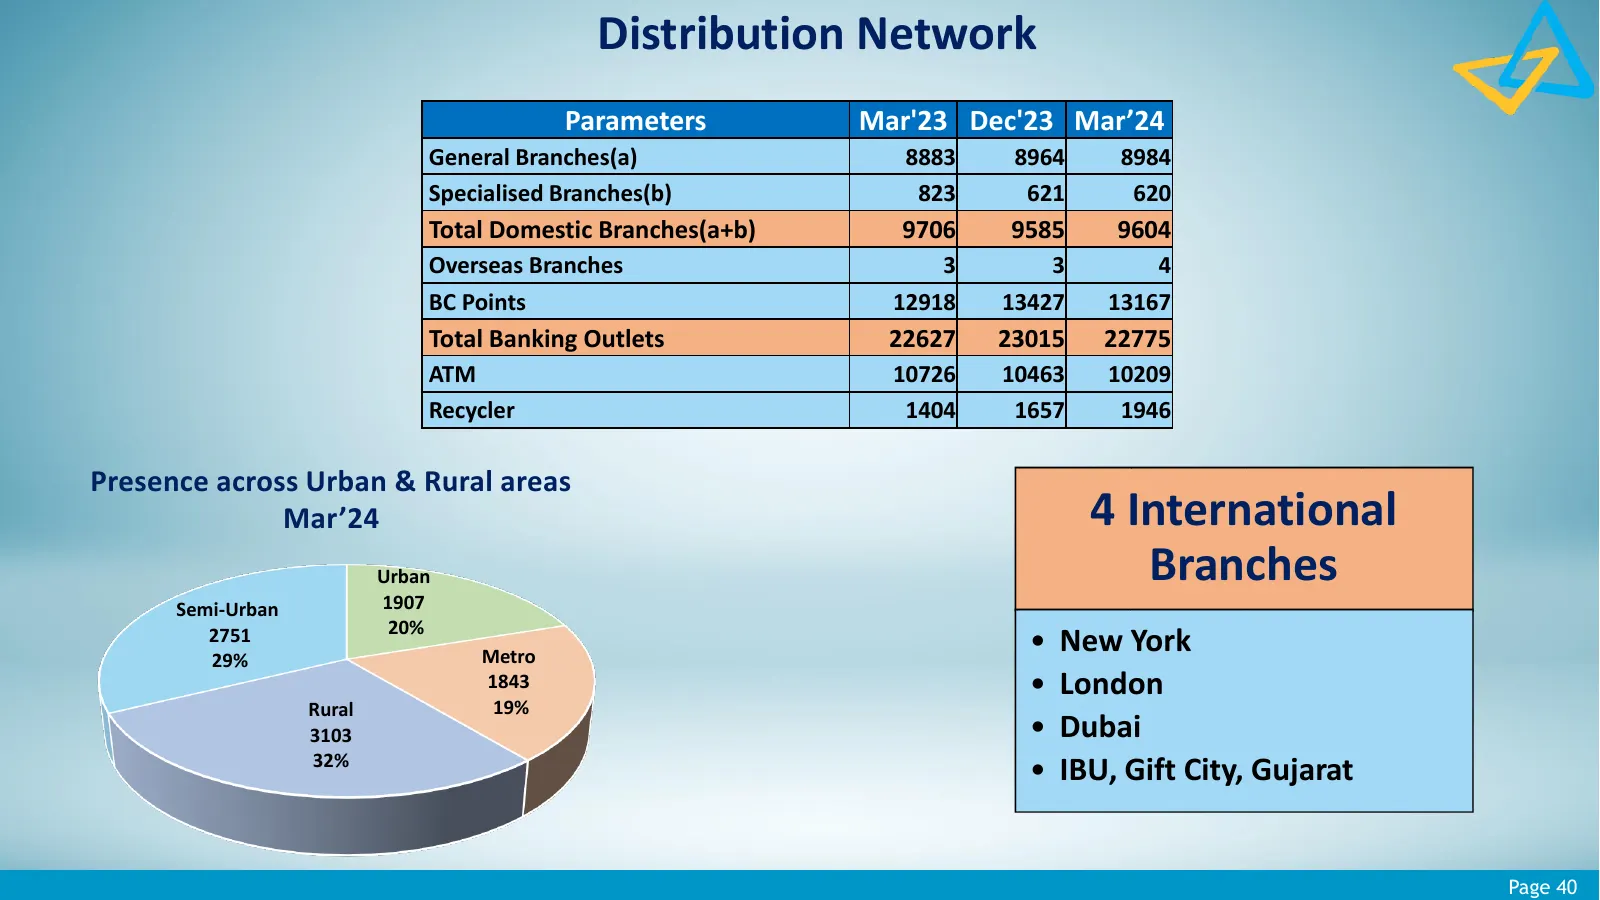
Slide 40: Distribution Network
Distribution Network Parameters Mar'23 Dec'23 Mar’24 General Branches(a) 8883 8964 8984 Specialised Branches(b) 823 621 620 Total Domestic Branches(a+b) 9706 9585 9604 Overseas Branches 3 3 4 BC Points 12918 13427 13167 Total Banking Outlets 22627 23015 22775 ATM 10726 10463 10209 Recycler 1404 1657

Slide 41: Digital Footprint
Inspired by Customers driven by Digital Digital Footprint Page 41
Slide 42: Digital Footprint
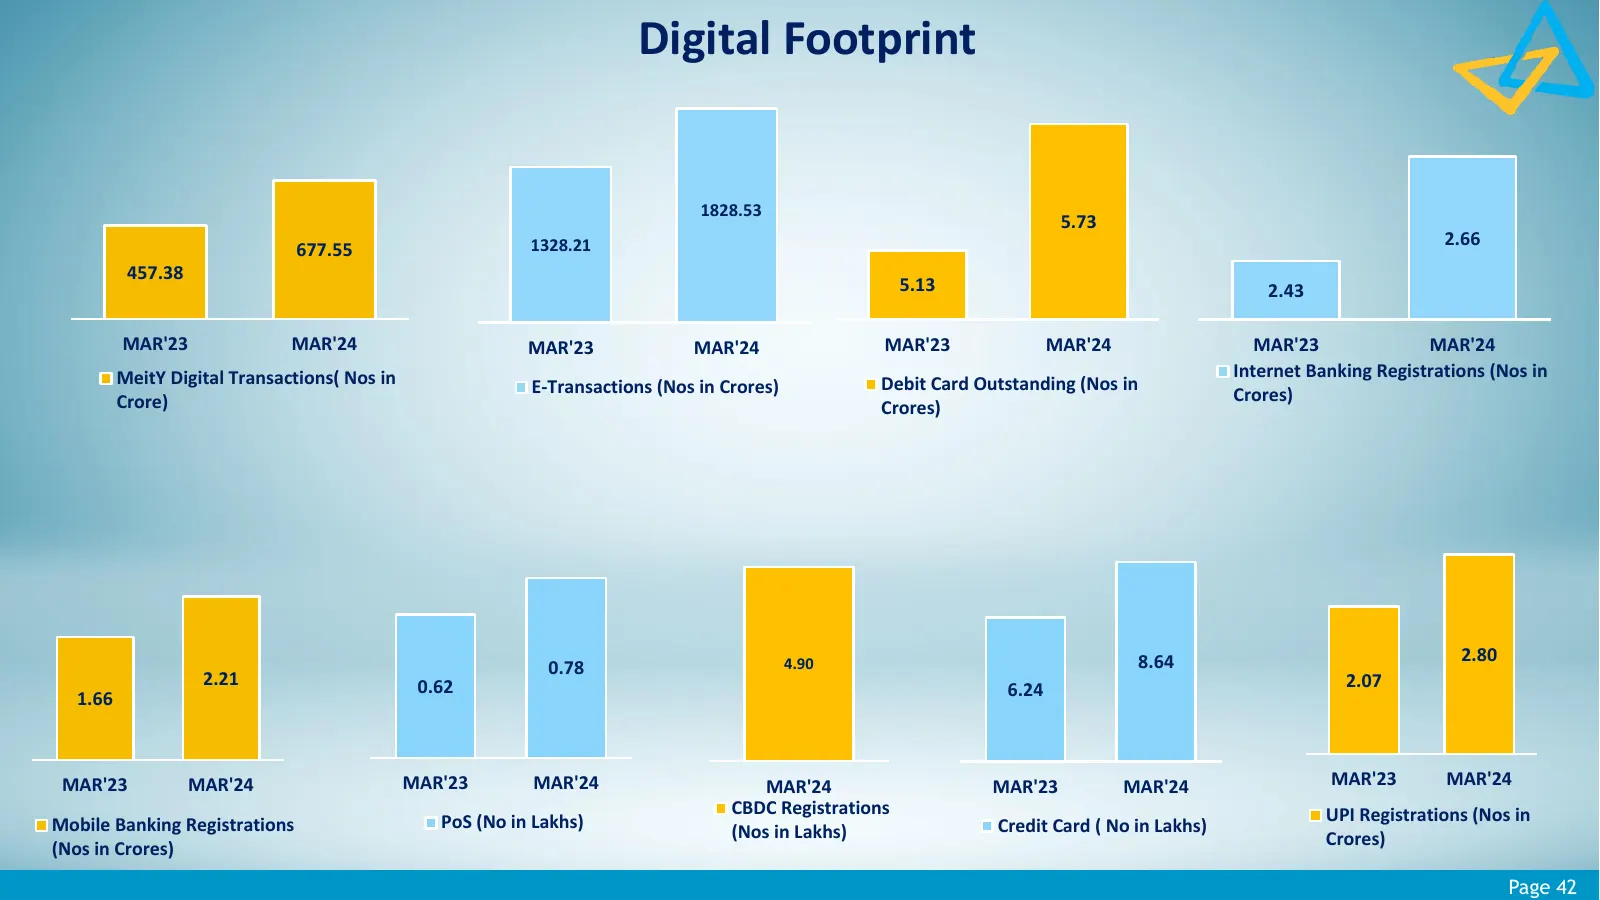
Digital Footprint 1828.53 5.73 1328.21 2.66 677.55 457.38 5.13 2.43 MAR'23 MAR'24 MAR'23 MAR'24 MAR'23 MAR'24 MAR'23 MAR'24 MeitY Digital Transactions( Nos in Internet Banking Registrations (Nos in E-Transactions (Nos in Crores) Debit Card Outstanding (Nos in Crore) Crores) Crores) 4.90 8.64 2.80 0.
Slide 43: New Digital Initiatives
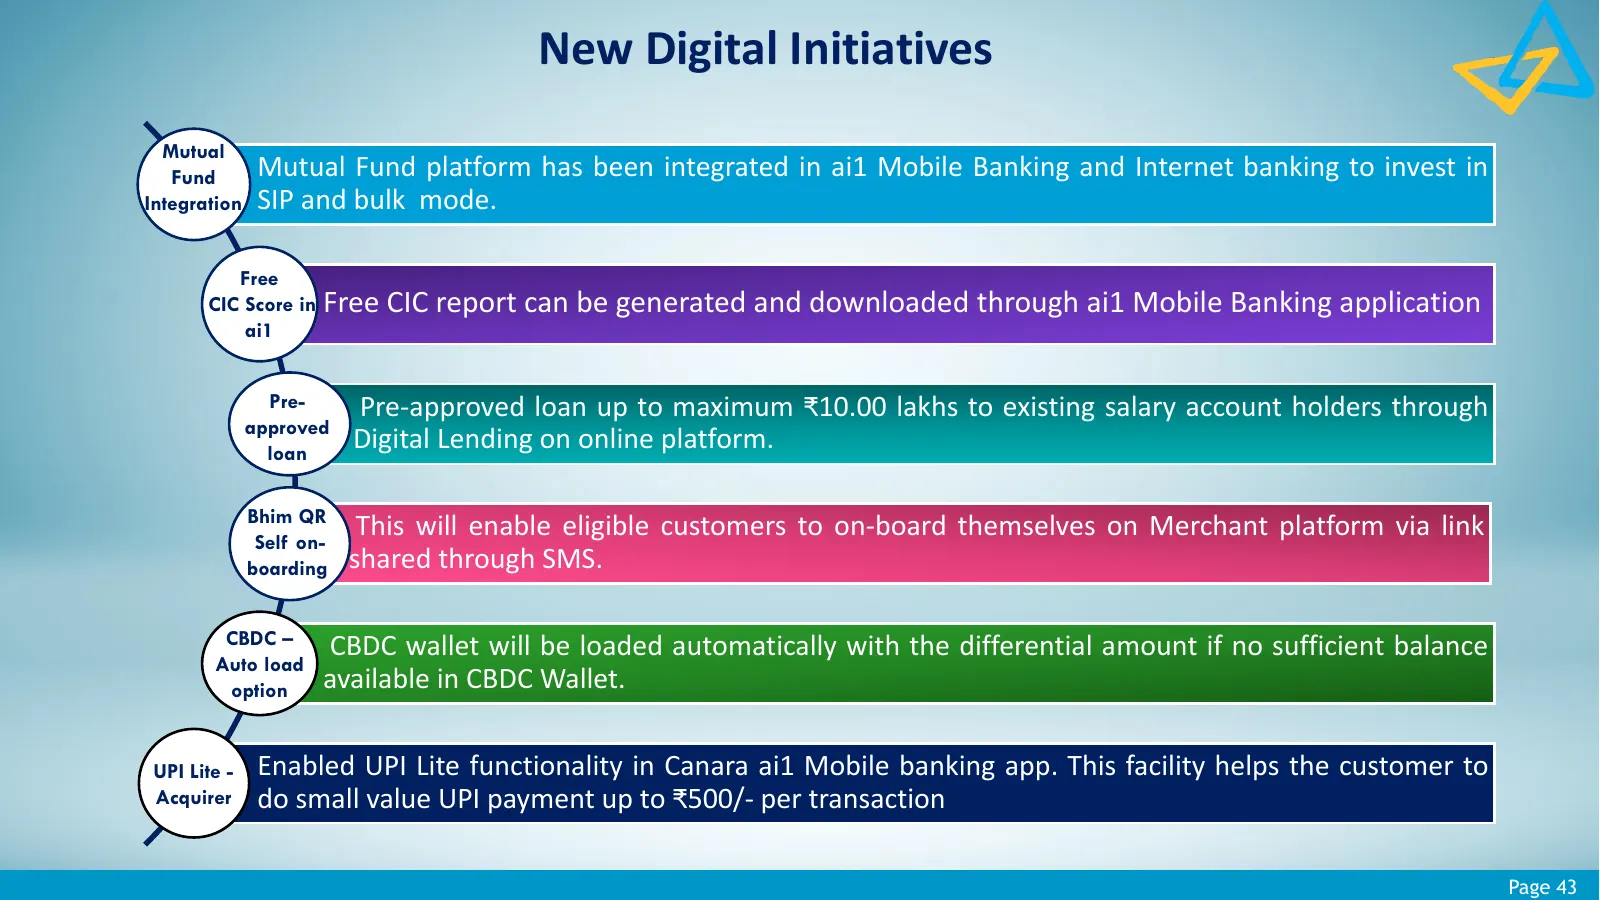
New Digital Initiatives Mutual Fund Mutual Fund platform has been integrated in ai1 Mobile Banking and Internet banking to invest in Integration SIP and bulk mode. Free CIC Score in Free CIC report can be generated and downloaded through ai1 Mobile Banking application ai1 Pre- Pre-approved loan up t
Slide 44: Subsidiaries & Associates
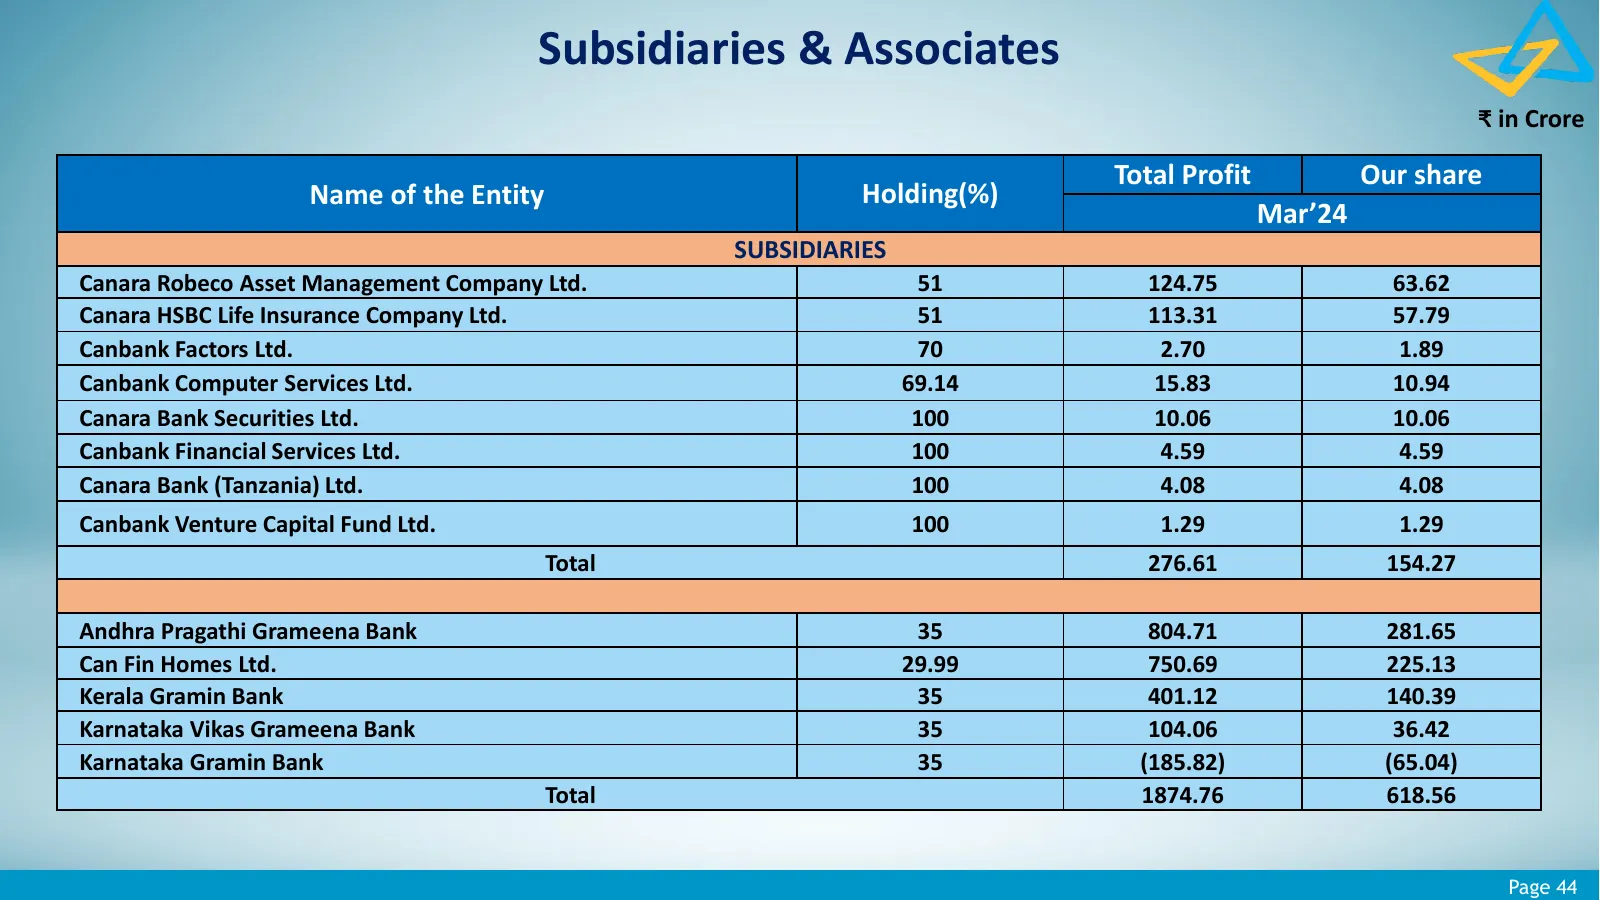
Subsidiaries & Associates ₹ in Crore Total Profit Our share Name of the Entity Holding(%) Mar’24 SUBSIDIARIES Canara Robeco Asset Management Company Ltd. 51 124.75 63.62 Canara HSBC Life Insurance Company Ltd. 51 113.31 57.79 Canbank Factors Ltd. 70 2.70 1.89 Canbank Computer Services Ltd. 69.14 15.
Slide 45: Goals vs Actuals for March 2024 and Goals for March 2025
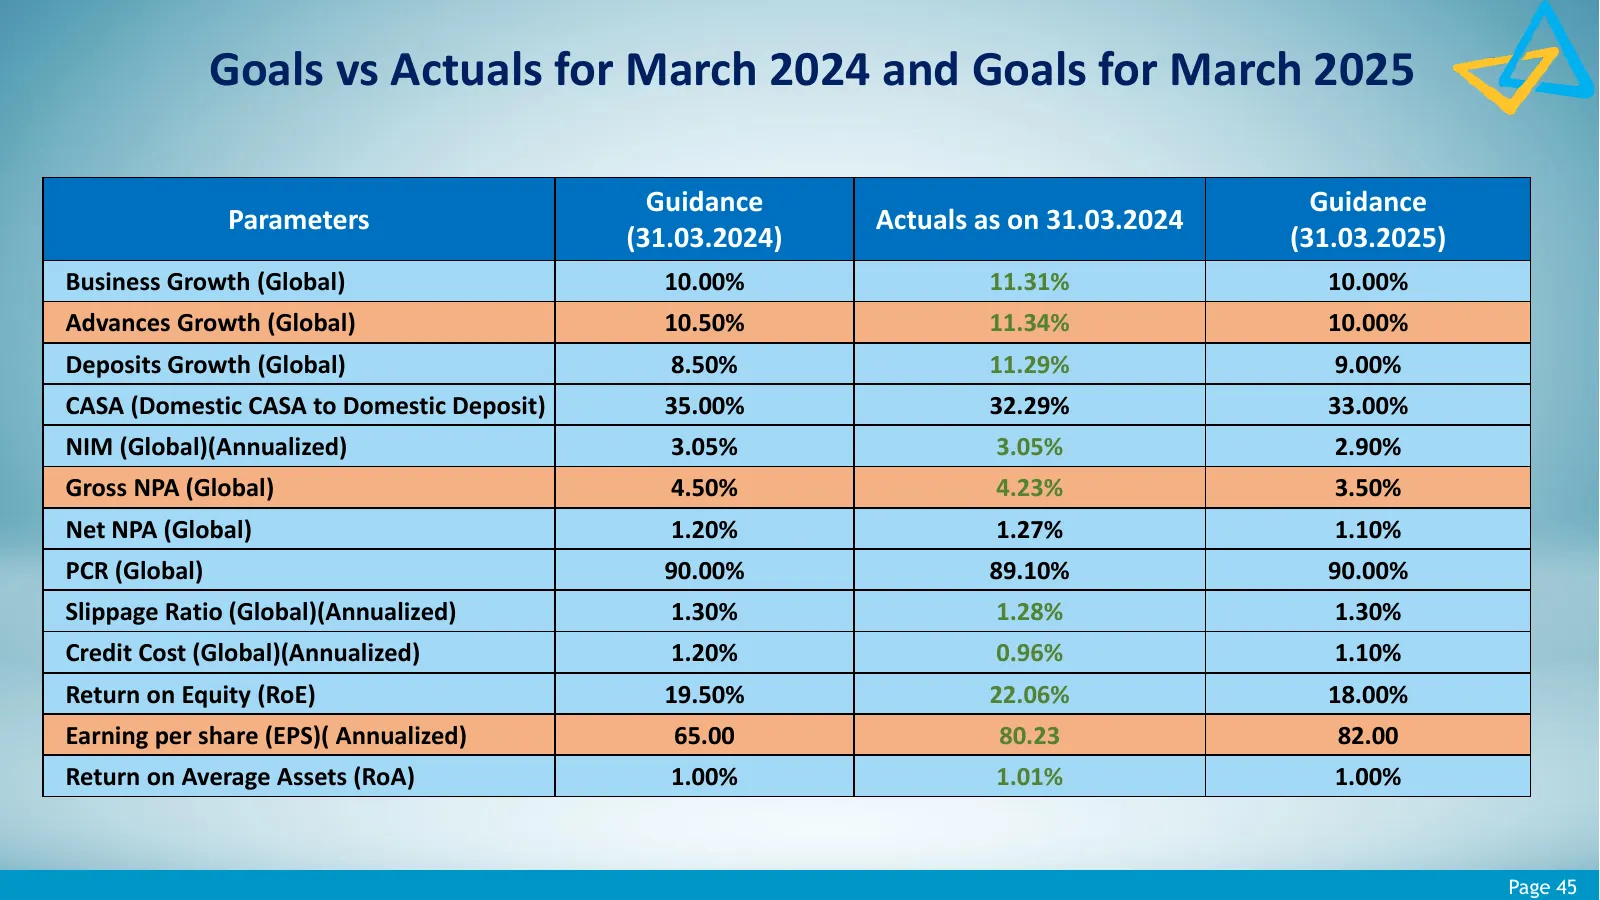
Goals vs Actuals for March 2024 and Goals for March 2025 Guidance Guidance Parameters Actuals as on 31.03.2024 (31.03.2024) (31.03.2025) Business Growth (Global) 10.00% 11.31% 10.00% Advances Growth (Global) 10.50% 11.34% 10.00% Deposits Growth (Global) 8.50% 11.29% 9.00% CASA (Domestic CASA to Dome
Slide 46: Disclaimer
Disclaimer This presentation has been prepared solely for information purposes only. It has no regard to any financial situations or informational needs of any particular reason. The forward looking statements involve a number of risk, uncertainties and other factors that could cause actual results

Slide 47: Thank You
Together We Can Thank You We express our heartfelt gratitude to all our stakeholders for their support & trust and solicit their continued patronage to make our beloved Bank grow exponentially in the coming years. Page 47
Source: Internet Archive copy of canarabank.com
More decks from Canara Bank
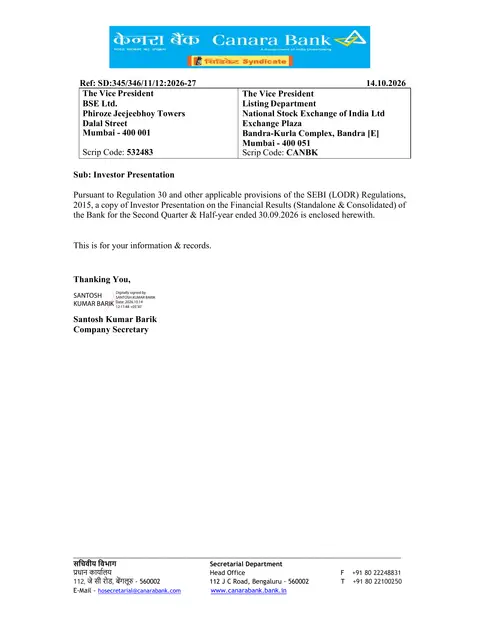 Q2 FY2026-27 Earnings Presentation47 slides · Oct 14, 2026
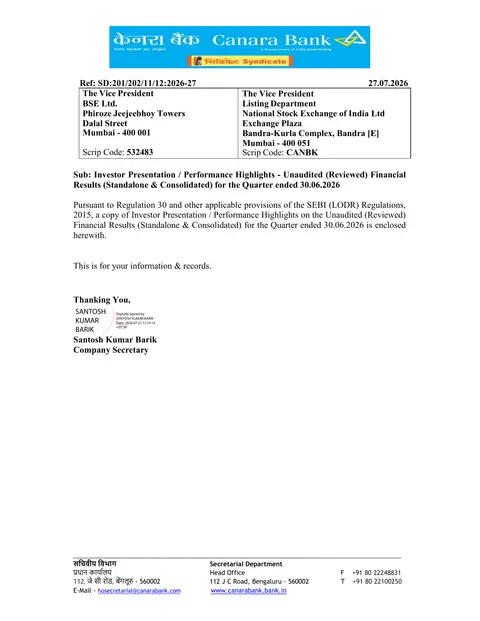 Q1 FY2026-27 Earnings Presentation47 slides · Jul 27, 2026
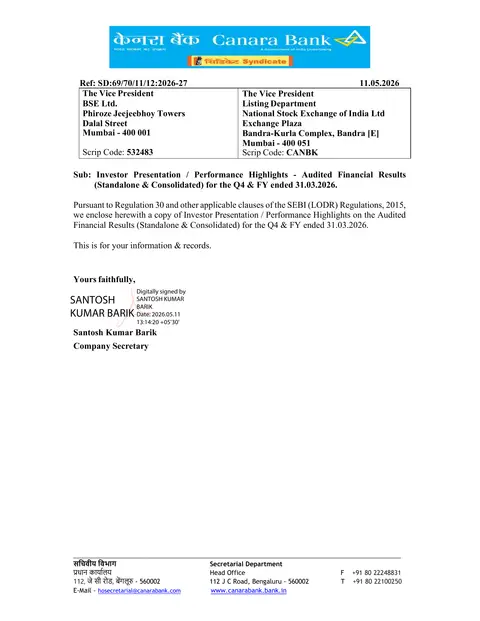 Q4 FY2026 Earnings Presentation47 slides · May 11, 2026
 Q3 FY2025-26 Earnings Presentation47 slides · Jan 29, 2026
 Q2 FY2025-26 Earnings Presentation47 slides · Oct 30, 2025
 Q1 FY2025-26 Earnings Presentation47 slides · Jul 24, 2025