Discovery Silver Corp · TSX:DSV
Discovery Silver — Q3 2026 Earnings Presentation
22 slides from Discovery Silver's earnings presentation, Nov 10, 2026
Slide 1: Unsurpassed Growth Potential
Third Quarter 2026 Investor Call | November 10, 2026 TSX:DSV OTCQX: DSVSF Unsurpassed Growth Potential
Slide 2: Forward Looking Statement
FORWARD LOOKING STATEMENT This presentation contains "forward-looking information" within the meaning of applicable Canadian securities legislation. All information, other than statements of historical facts, included in this presentation that address activities, events or developments that Discover
Slide 3: Additional Cautionary Language
ADDITIONAL CAUTIONARY LANGUAGE Third Party Information: This presentation includes market and industry data which was obtained from various publicly available sources and other sources believed by the Company to be true. Although the Company believes it to be reliable, the Company has not independen
Slide 4: Q3 2026 – Key Competitive Strengths
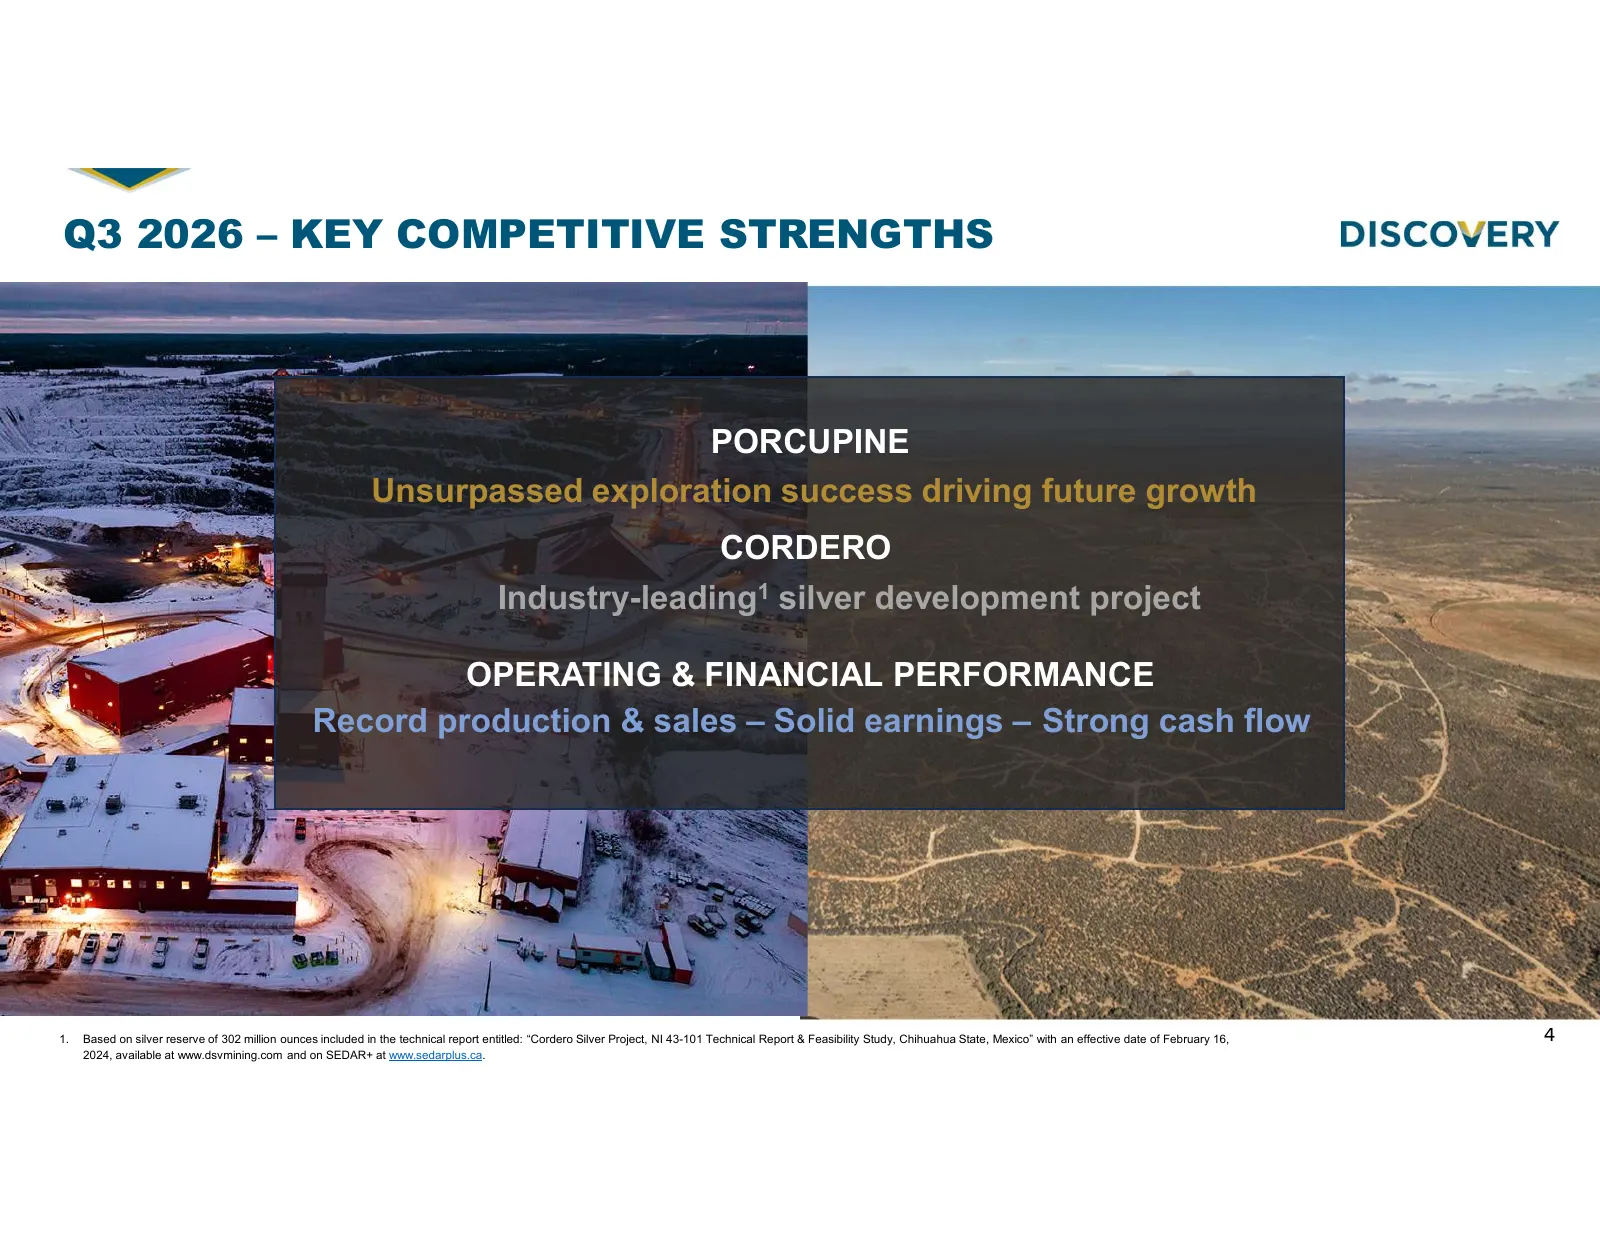
Q3 2026 – KEY COMPETITIVE STRENGTHS Received MIA & Change of Land Use Permits or Cordero PORCUPINE Unsurpassed exploration success driving future growth Outstanding exploration results at Pamour & Dome CORDERO Industry-leading1 silver development project Strong operating & financial results in Q3 20
Slide 5: Pamour & Dome
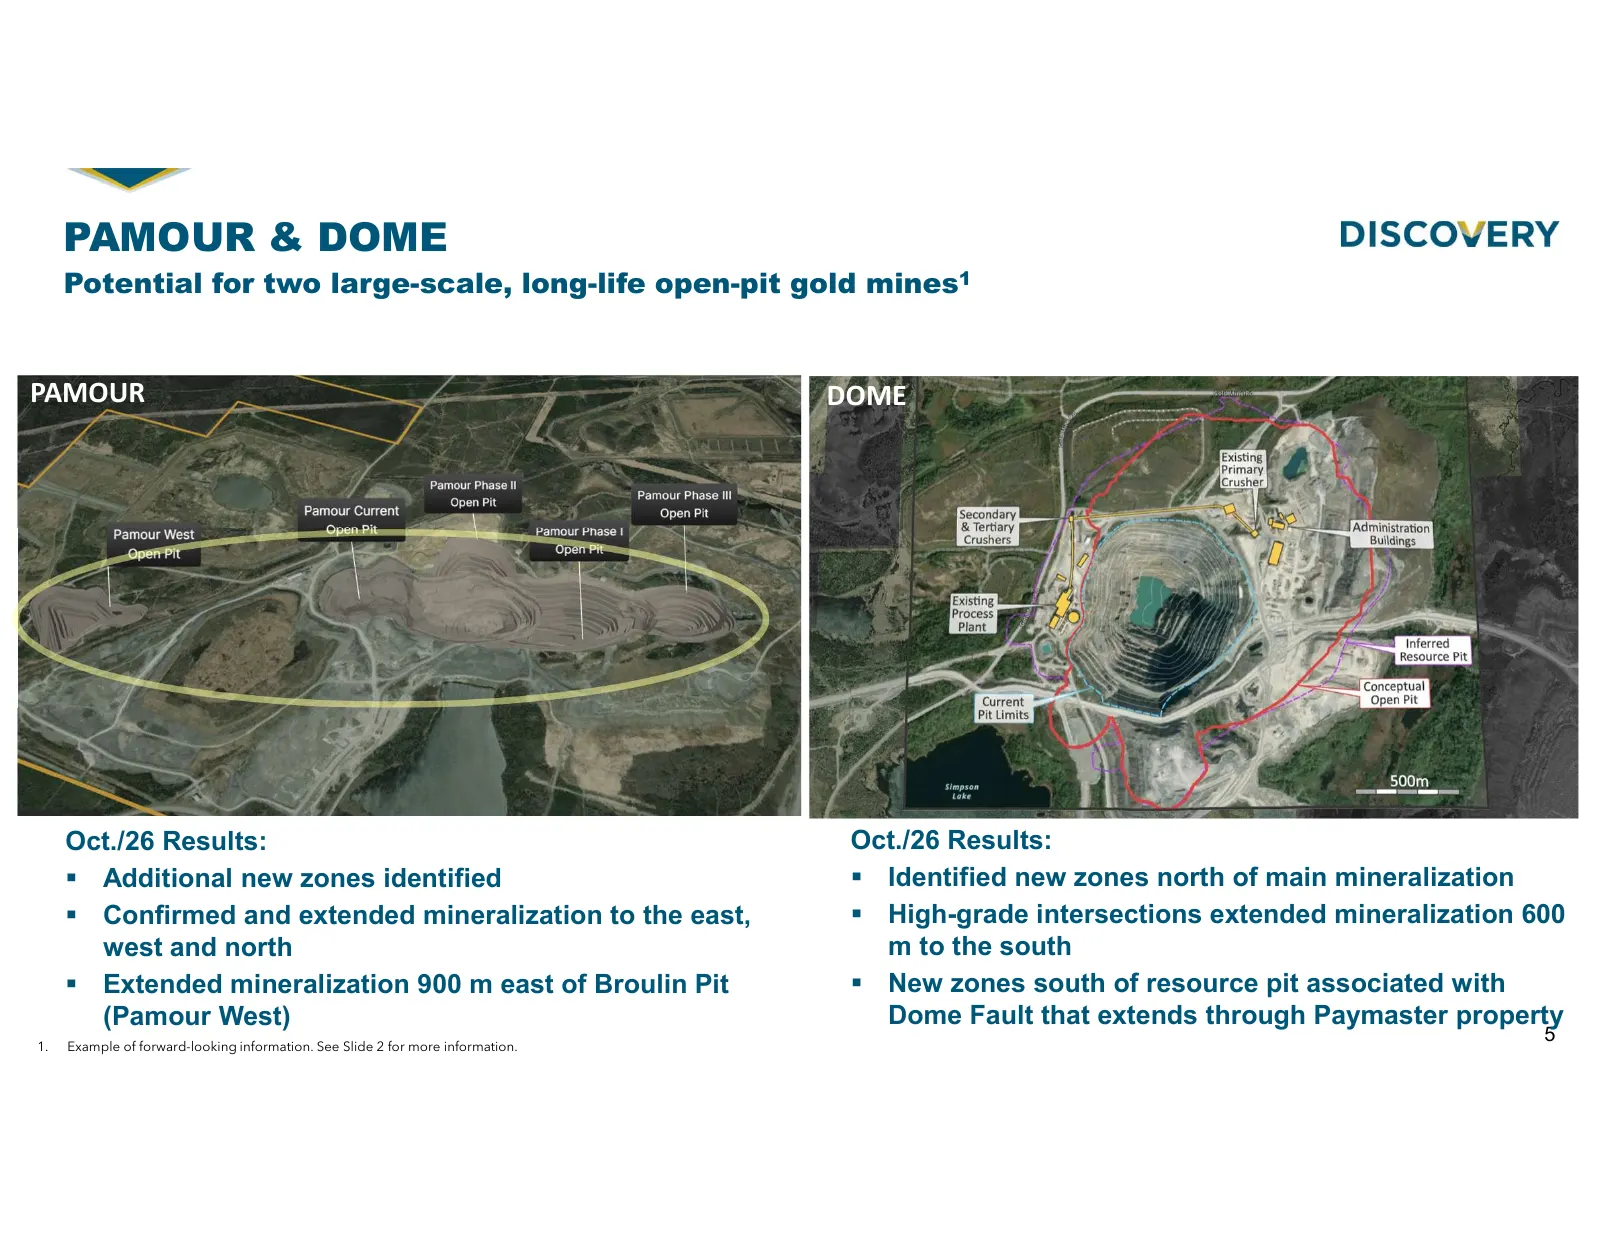
PAMOUR & DOME Potential for two large-scale, long-life open-pit gold mines1 PAMOUR PAMOUR DOME Oct./26 Results: Oct./26 Results: Additional new zones identified Identified new zones north of main mineralization Confirmed and extended mineralization to the east, High-grade intersections exten
Slide 6: Record Gold Production and Sales in Q3 2026
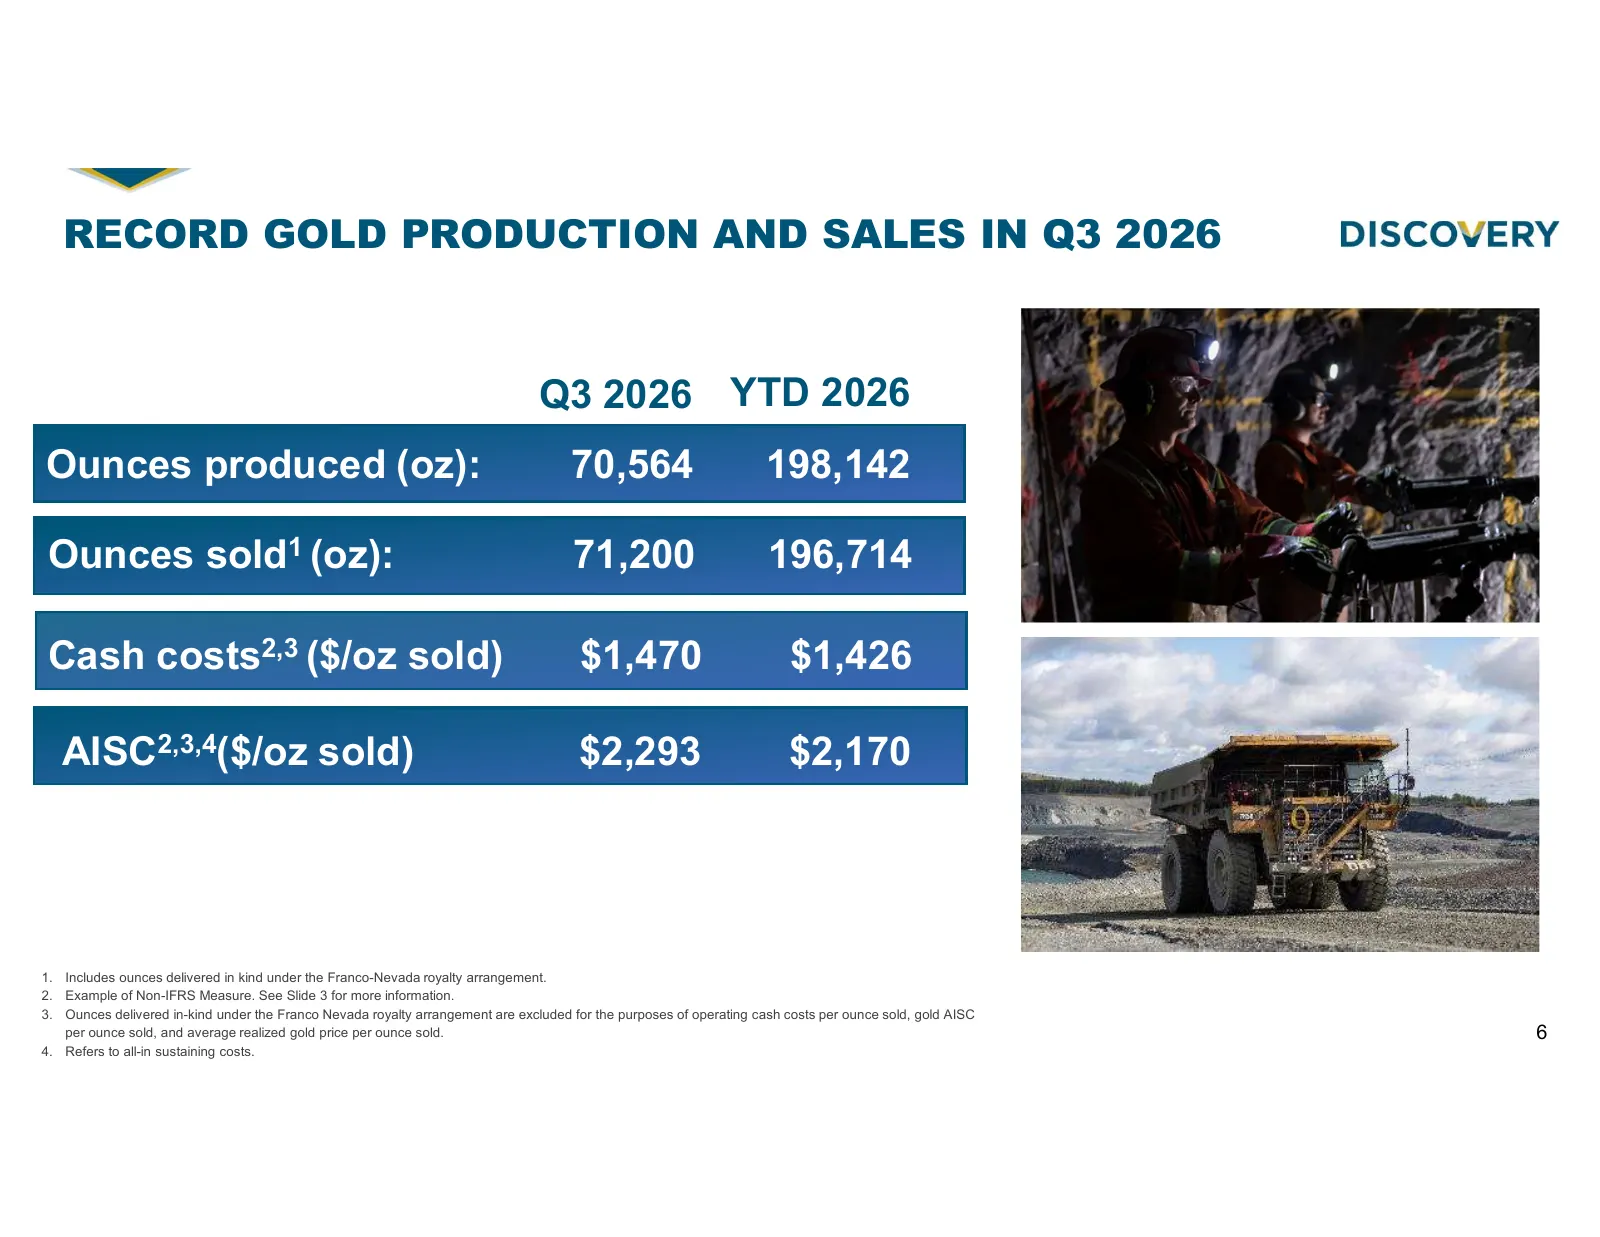
RECORD GOLD PRODUCTION AND SALES IN Q3 2026 Q3 2026 YTD 2026 Ounces produced (oz): 70,564 198,142 Ounces sold1 (oz): 71,200 196,714 Cash costs2,3 ($/oz sold) $1,470 $1,426 AISC2,3,4($/oz sold) $2,293 $2,170 1. Includes ounces delivered in kind under the Franco-Nevada royalty arrangement. 2. Example
Slide 7: Solid Earnings, Strong Cash Flow in Q3 2026
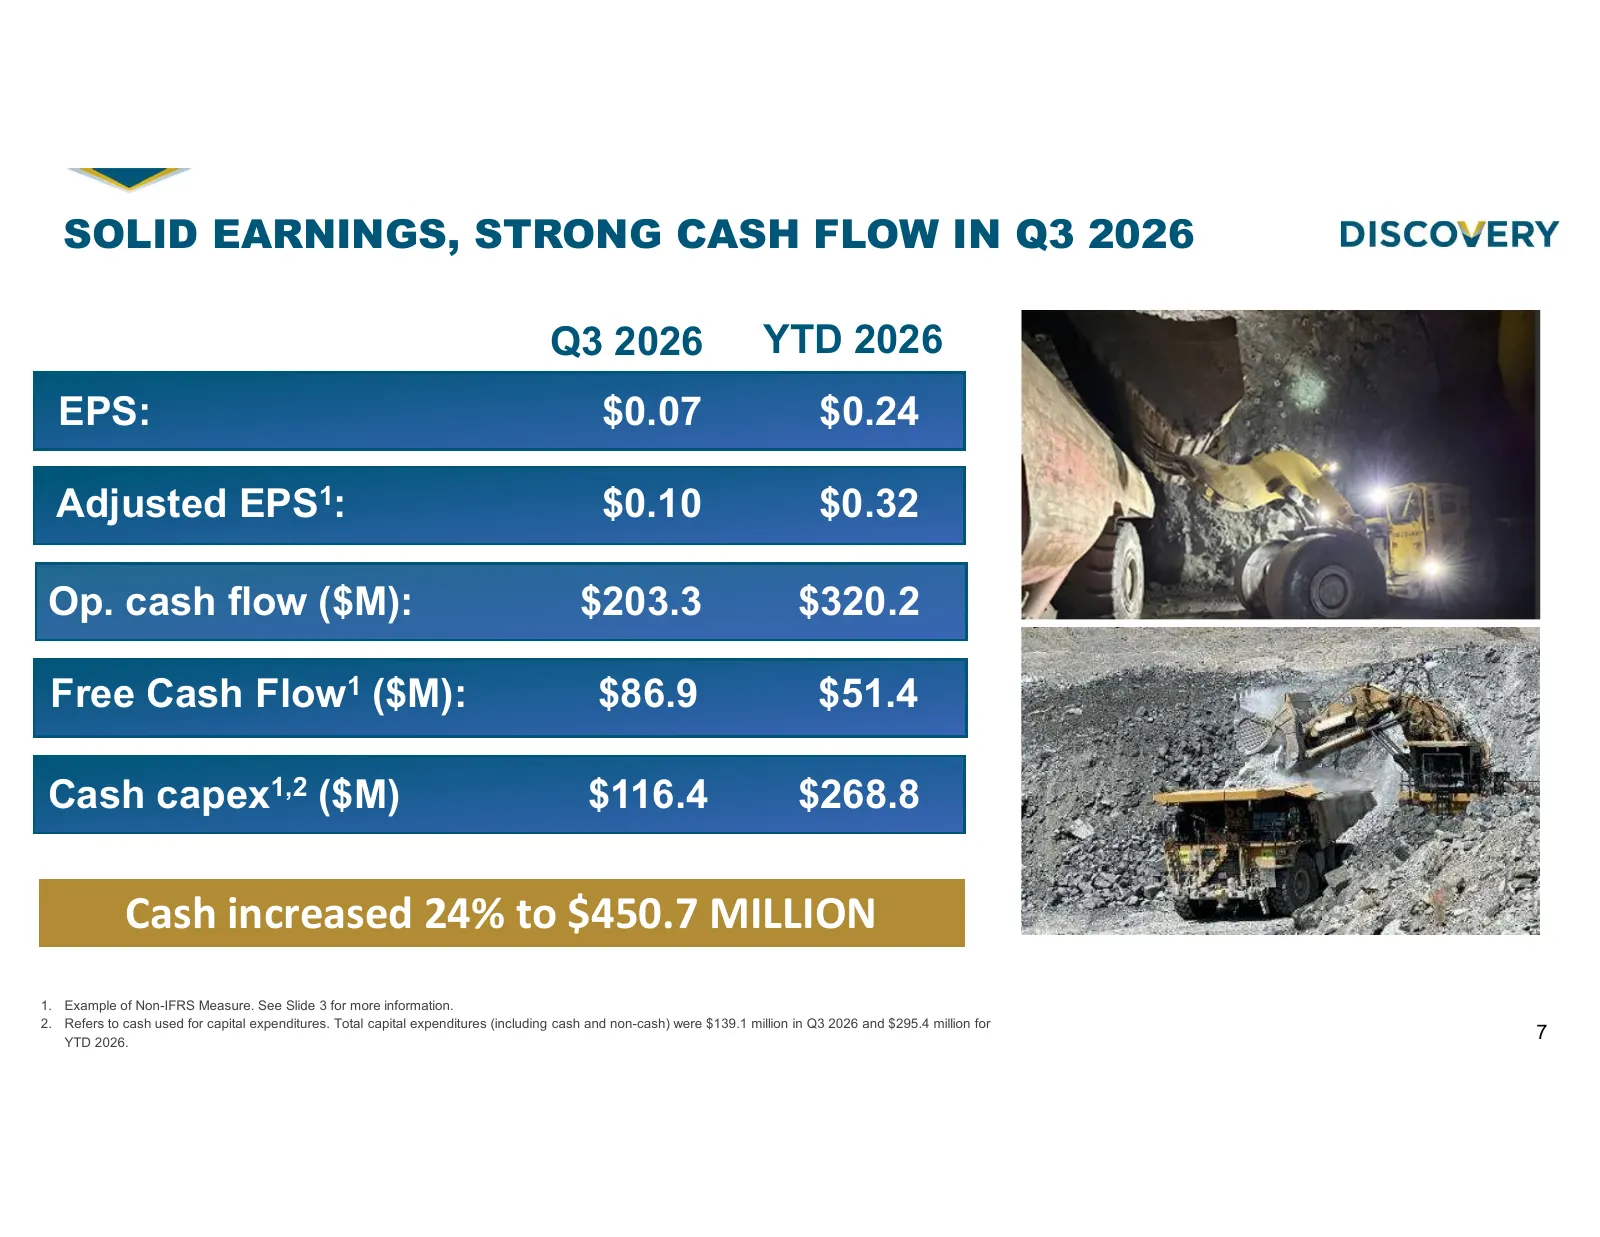
SOLID EARNINGS, STRONG CASH FLOW IN Q3 2026 Q3 2026 YTD 2026 EPS: $0.07 $0.24 Adjusted EPS1: $0.10 $0.32 Op. cash flow ($M): $203.3 $320.2 Free Cash Flow1 ($M): $86.9 $51.4 Cash capex1,2 ($M) $116.4 $268.8 Cash increased 24% to $450.7 MILLION 1. Example of Non-IFRS Measure. See Slide 3 for more info
Slide 8: Financial Highlights
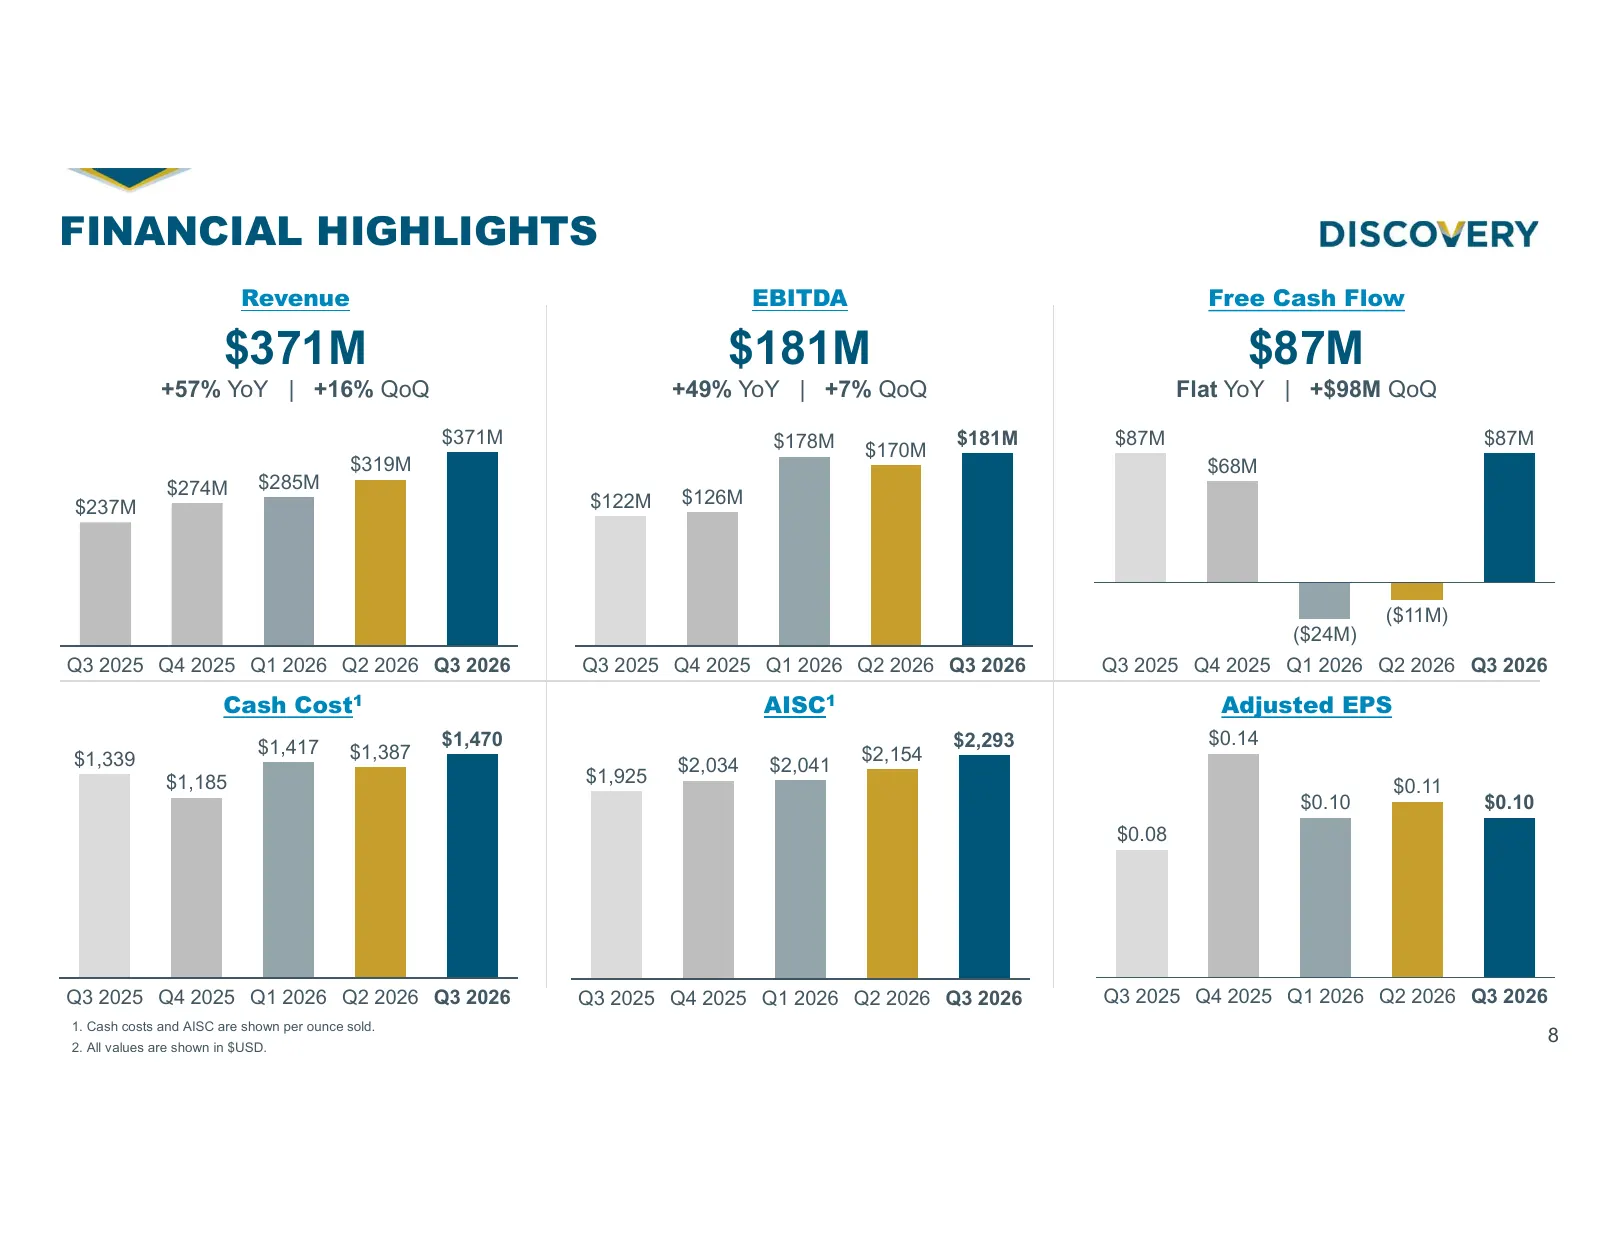
FINANCIAL HIGHLIGHTS Revenue EBITDA Free Cash Flow $371M $181M $87M +57% YoY | +16% QoQ +49% YoY | +7% QoQ Flat YoY | +$98M QoQ $371M $178M $181M $87M $87M $170M $319M $68M $274M $285M $237M $122M $126M ($11M) ($24M) Q3 2025 Q4 2025 Q1 2026 Q2 2026 Q3 2026 Q3 2025 Q4 2025 Q1 2026 Q2 2026 Q3 2026 Q3
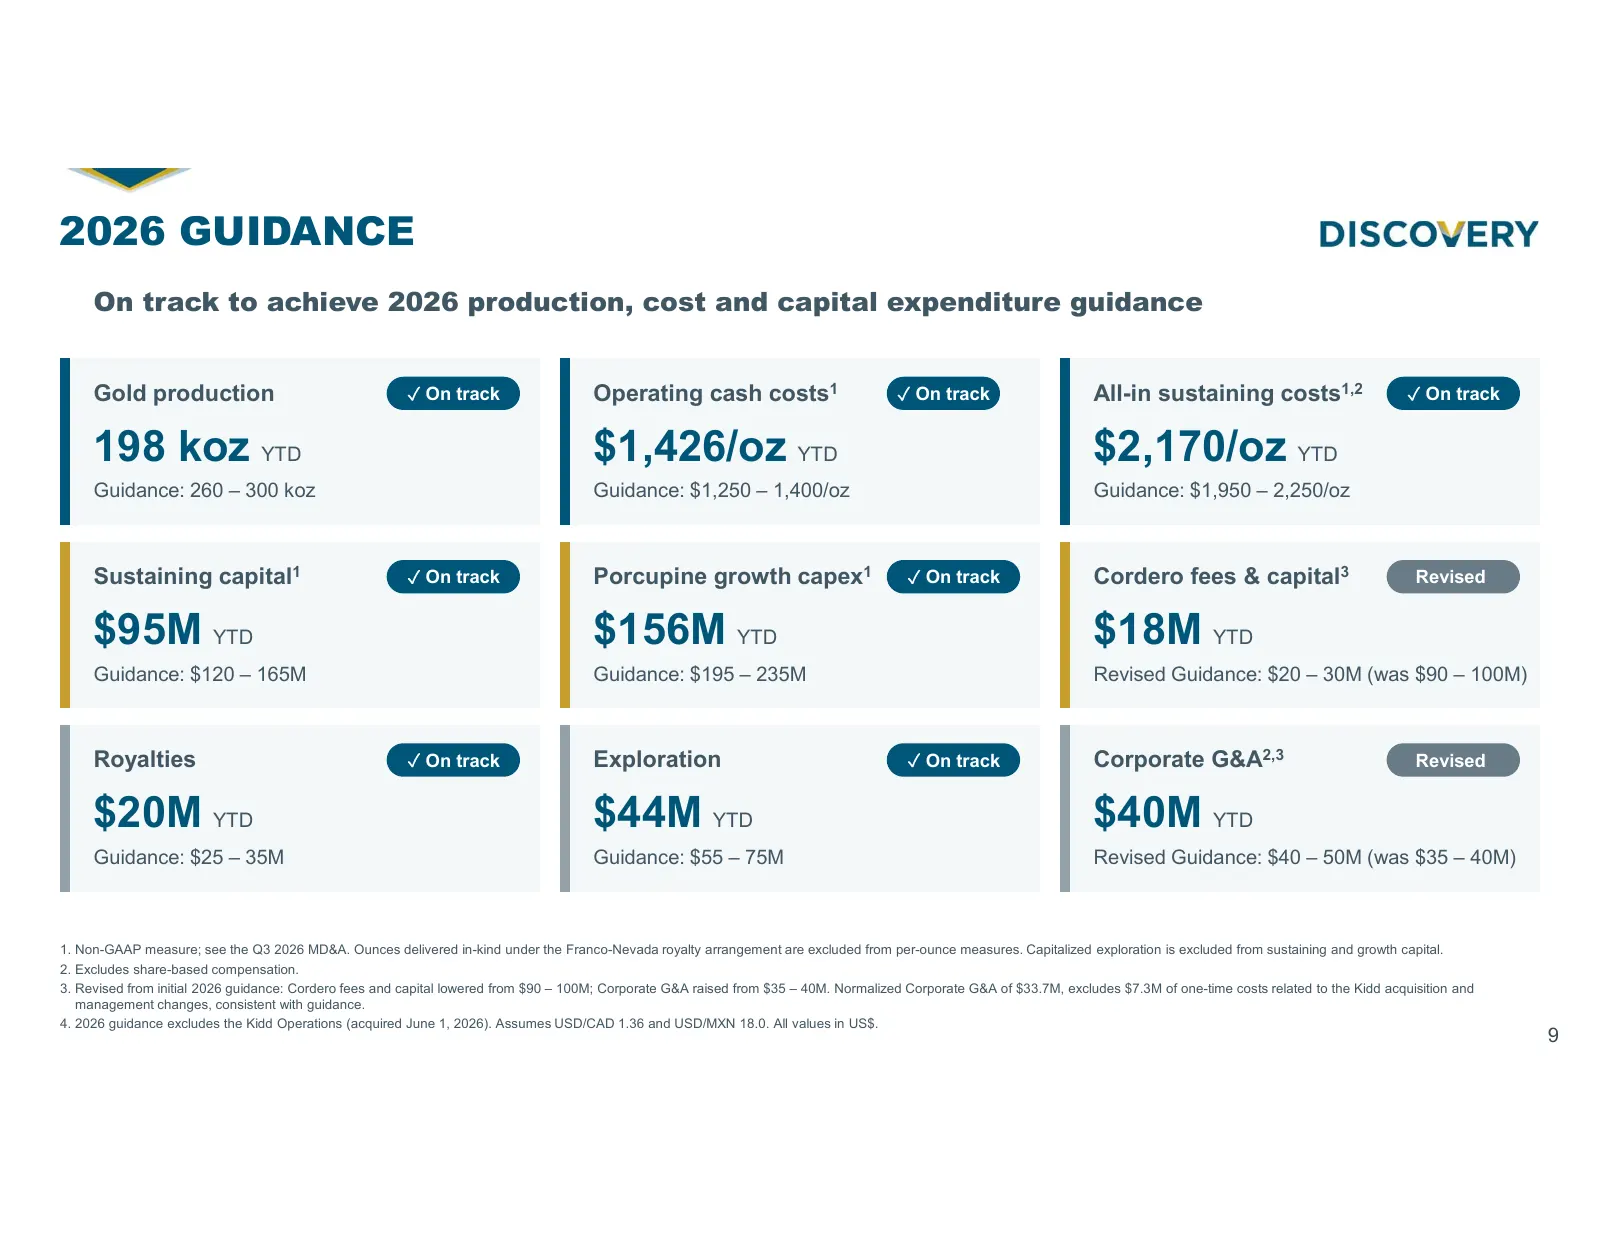
Slide 9: 2026 Guidance
2026 GUIDANCE On track to achieve 2026 production, cost and capital expenditure guidance Gold production ✓ On track Operating cash costs1 ✓ On track All-in sustaining costs1,2 ✓ On track 198 koz YTD $1,426/oz YTD $2,170/oz YTD Guidance: 260 – 300 koz Guidance: $1,250 – 1,400/oz Guidance: $1,950 – 2,
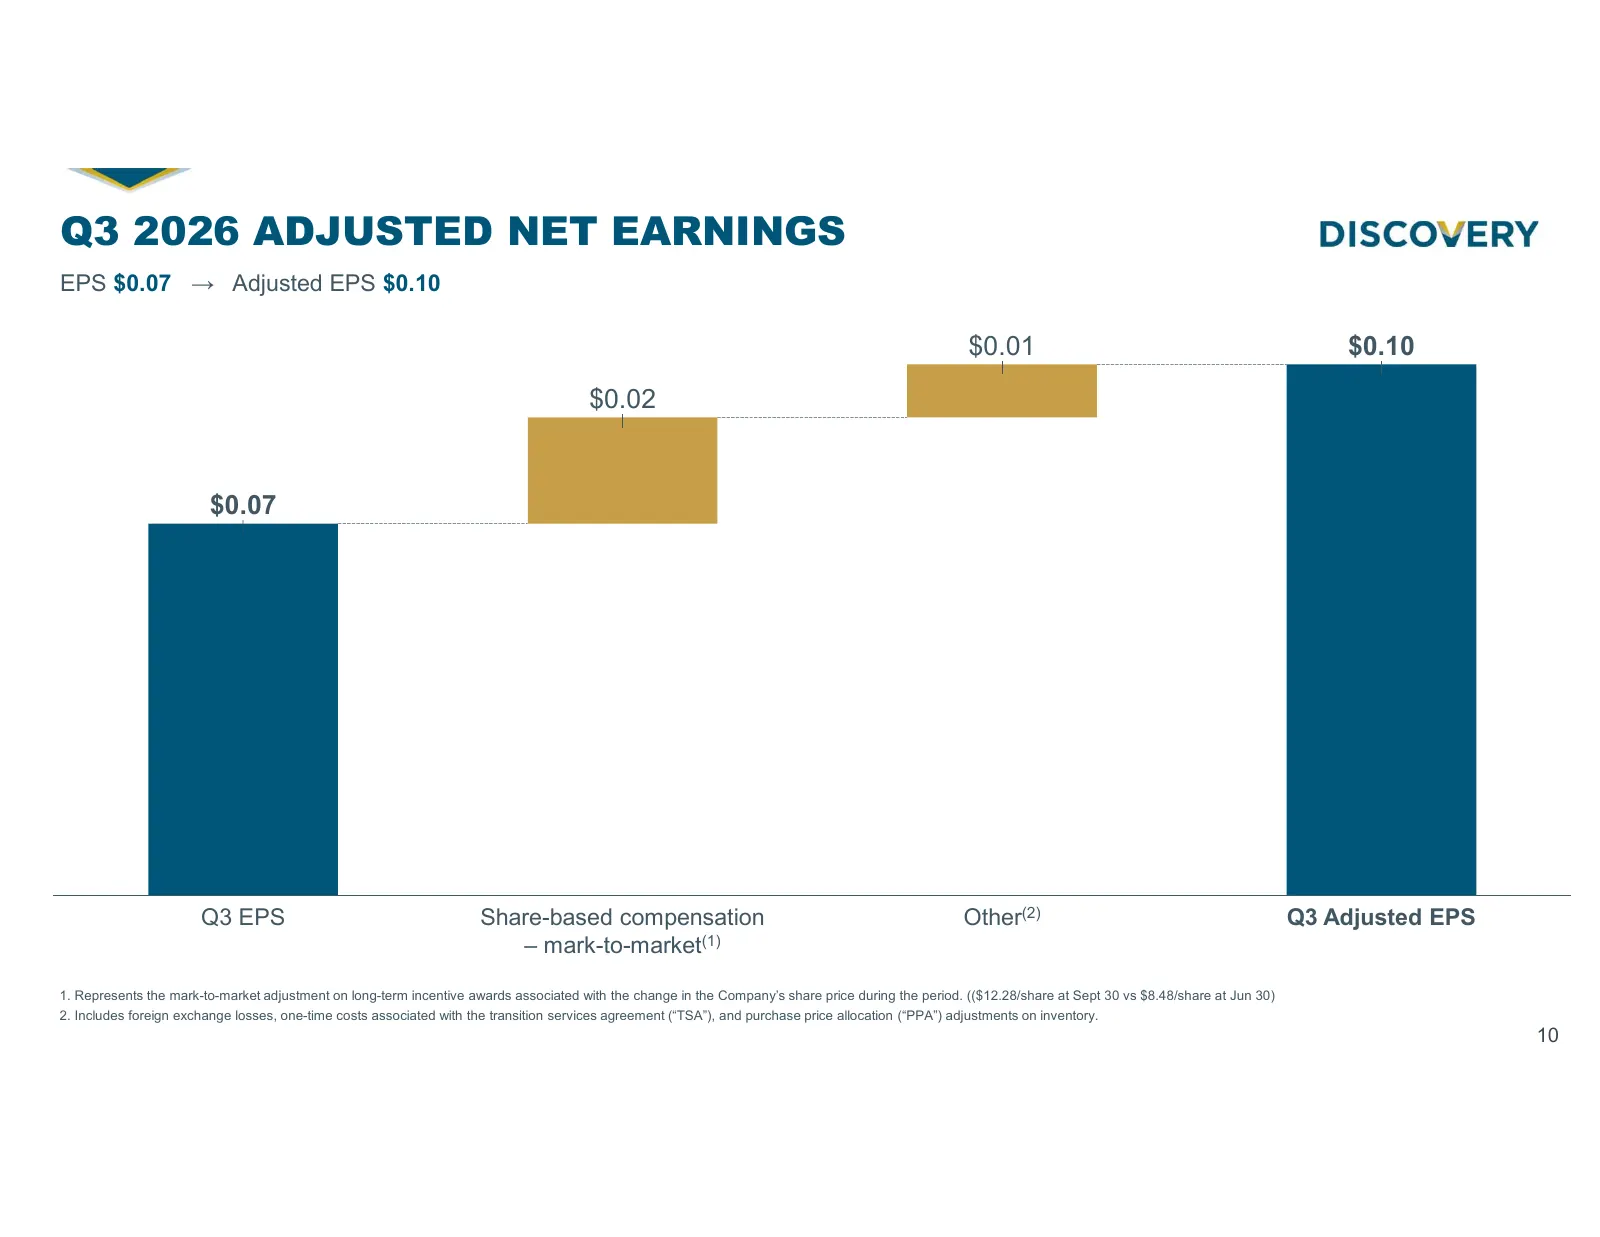
Slide 10: Q3 2026 Adjusted Net Earnings
Q3 2026 ADJUSTED NET EARNINGS EPS $0.07 → Adjusted EPS $0.10 $0.01 $0.10 $0.02 $0.07 Place photo here Q3 EPS Share-based compensation Other(2) Q3 Adjusted EPS – mark-to-market(1) 1. Represents the mark-to-market adjustment on long-term incentive awards associated with the change in the Company’s sha
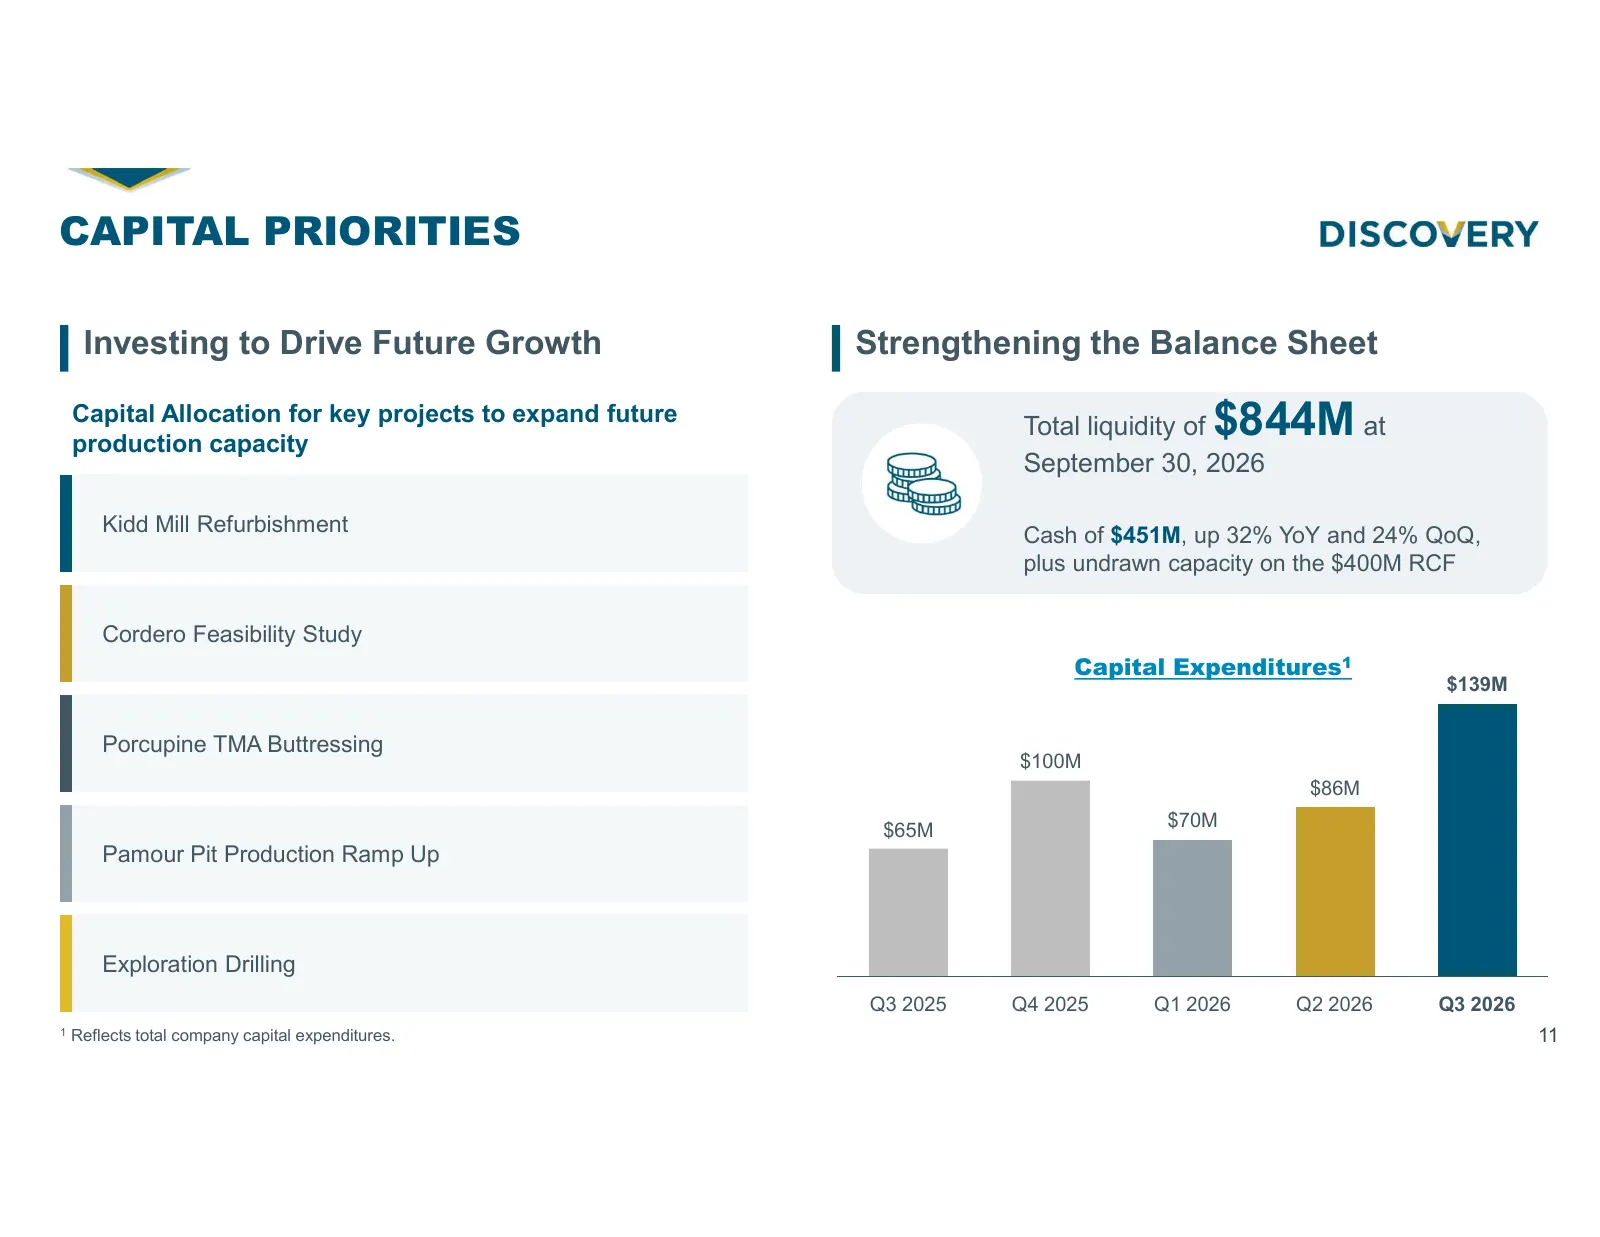
Slide 11: Capital Priorities
CAPITAL PRIORITIES Investing to Drive Future Growth Strengthening the Balance Sheet Capital Allocation for key projects to expand future production capacity $844M at Total liquidity of September 30, 2026 Kidd Mill Refurbishment Cash of $451M, up 32% YoY and 24% QoQ, plus undrawn capacity on the $400
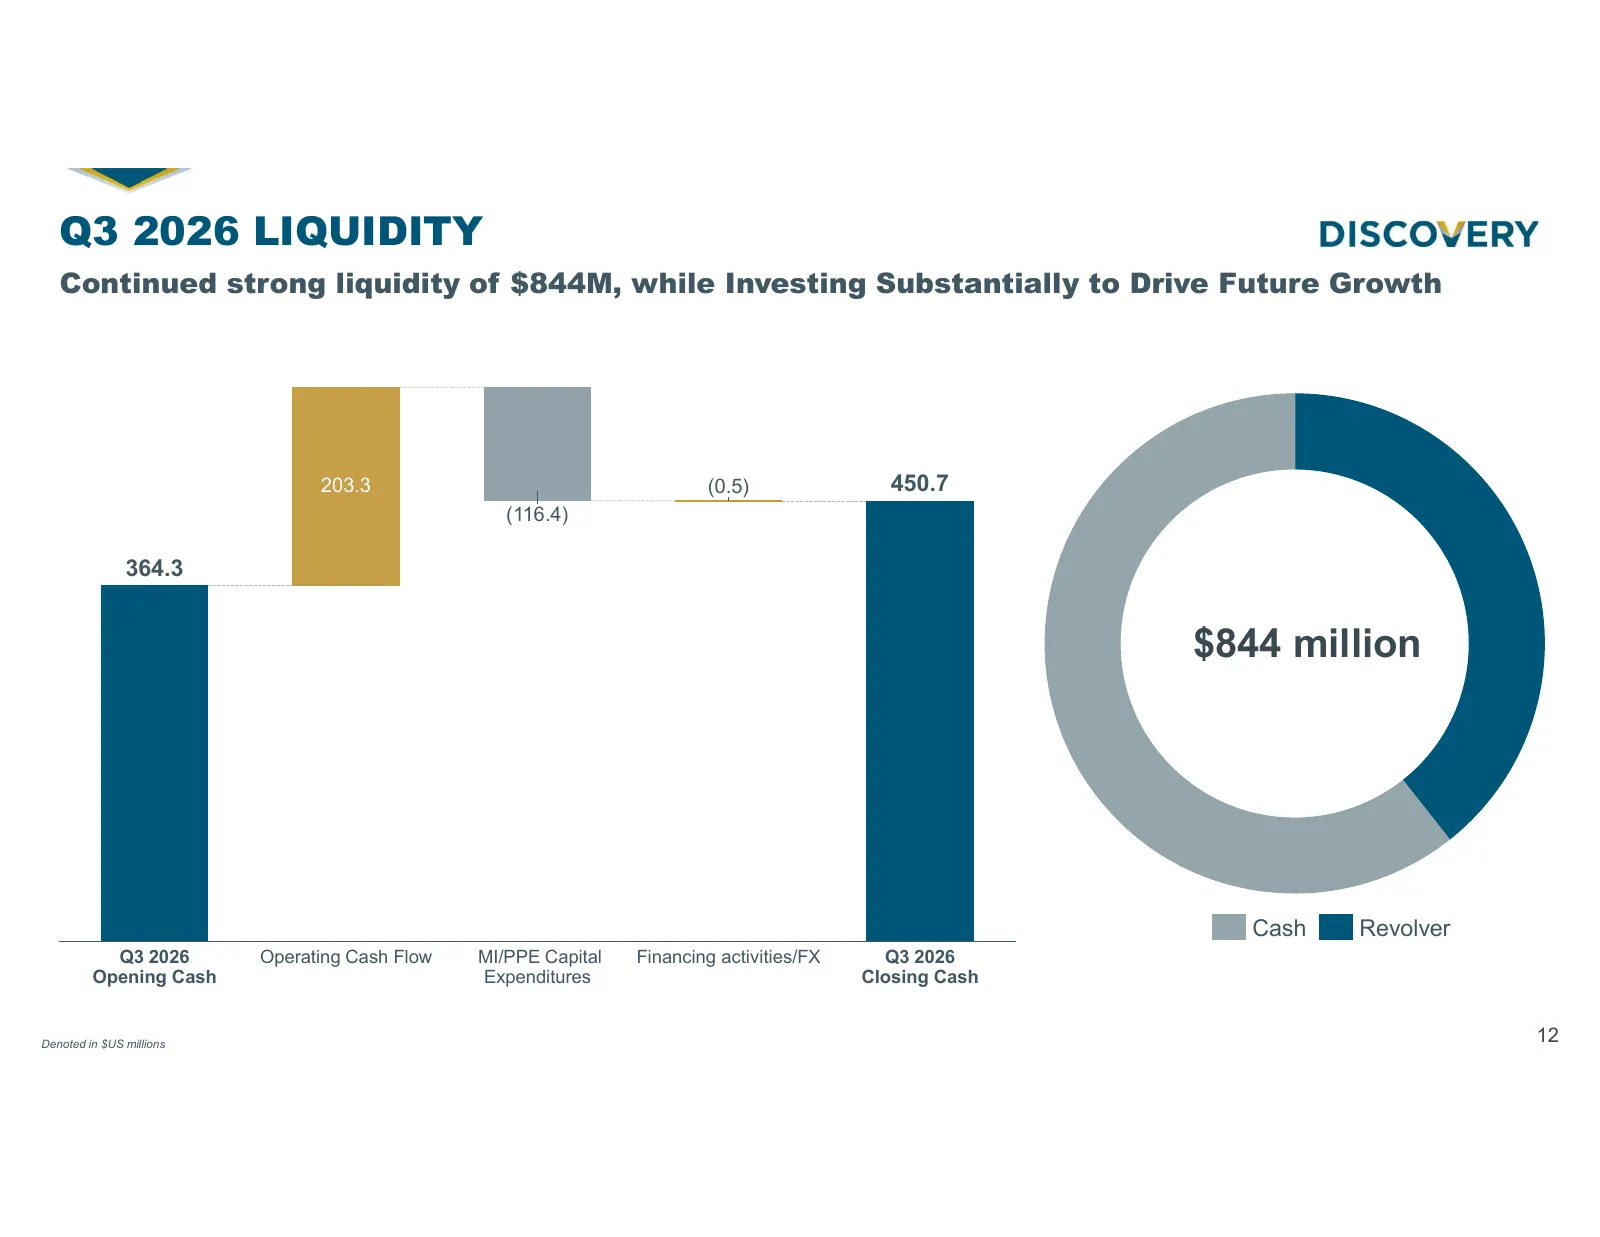
Slide 12: Q3 2026 Liquidity
Q3 2026 LIQUIDITY Continued strong liquidity of $844M, while Investing Substantially to Drive Future Growth 203.3 (0.5) 450.7 (116.4) 364.3 $844 million Cash Revolver Q3 2026 Operating Cash Flow MI/PPE Capital Financing activities/FX Q3 2026 Opening Cash Expenditures Closing Cash Denoted in $US mill
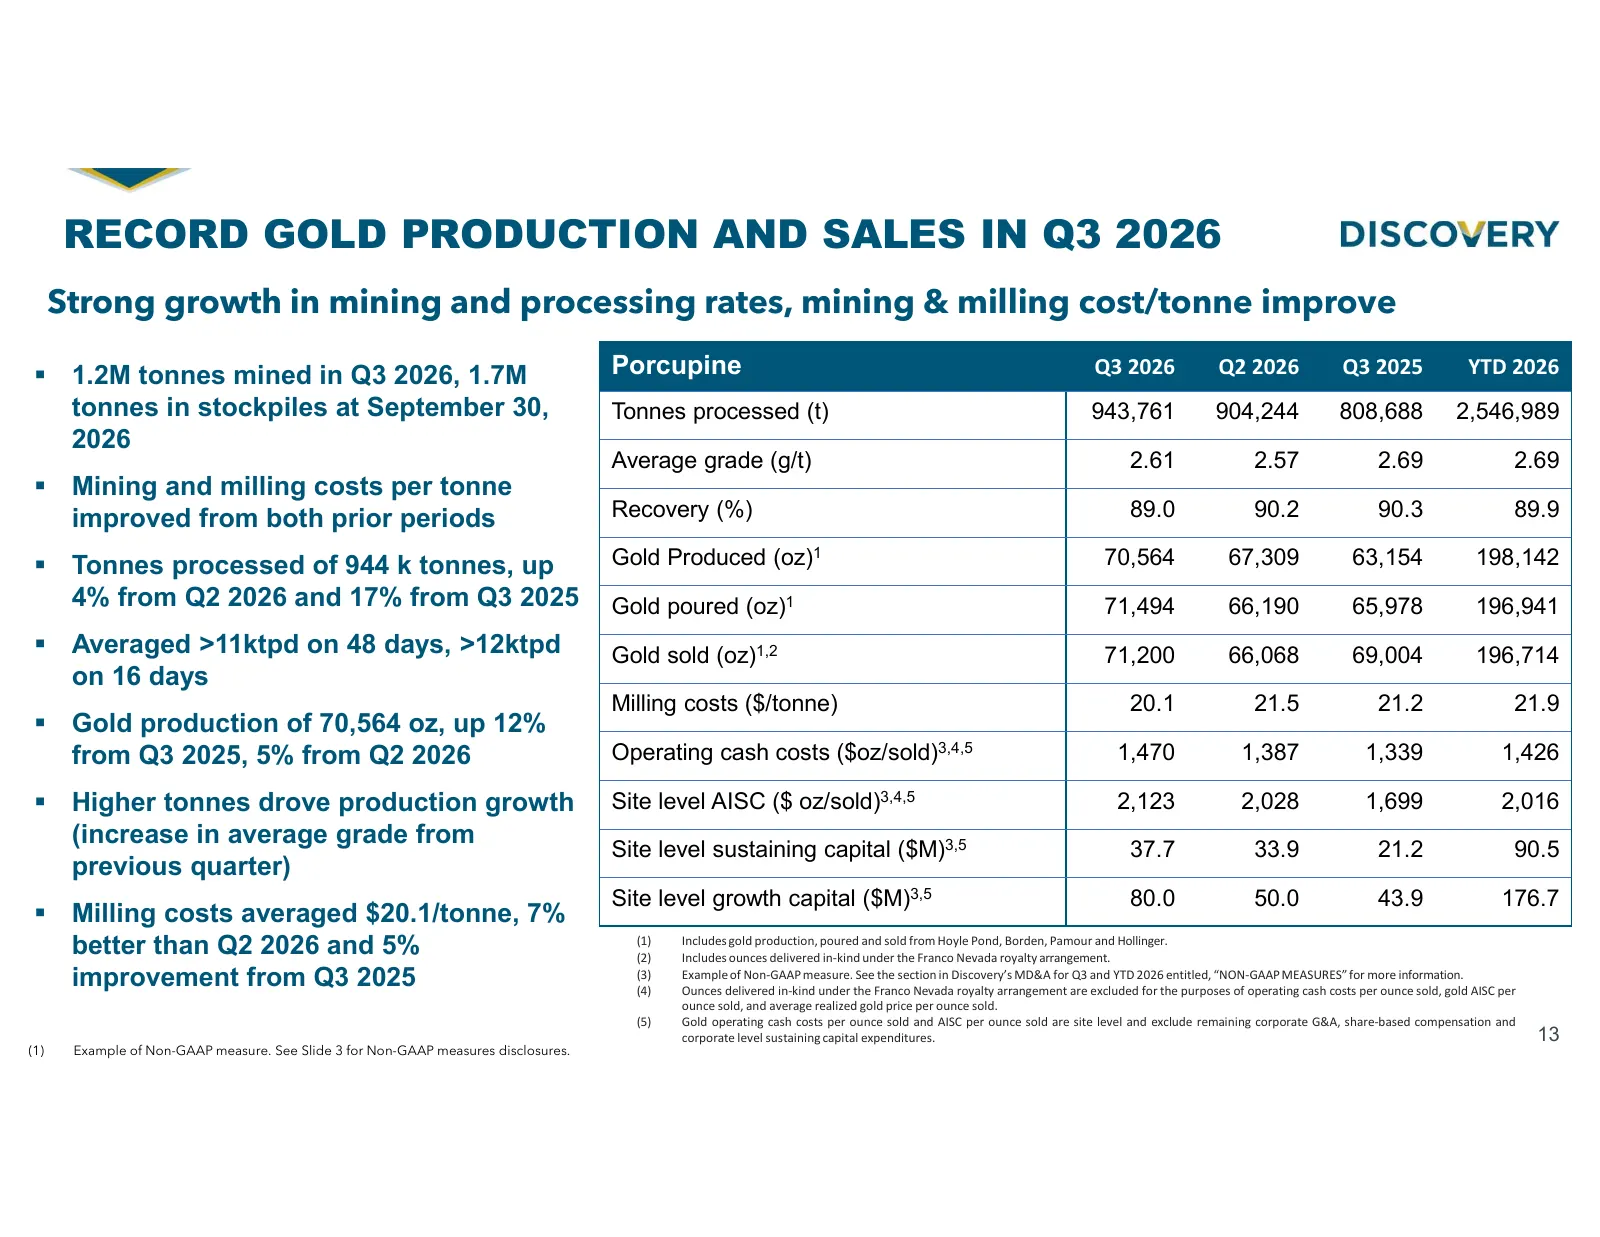
Slide 13: Record Gold Production and Sales in Q3 2026
RECORD GOLD PRODUCTION AND SALES IN Q3 2026 Strong growth in mining and processing rates, mining & milling cost/tonne improve 1.2M tonnes mined in Q3 2026, 1.7M Porcupine Q3 2026 Q2 2026 Q3 2025 YTD 2026 tonnes in stockpiles at September 30, Tonnes processed (t) 943,761 904,244 808,688 2,546,989 2
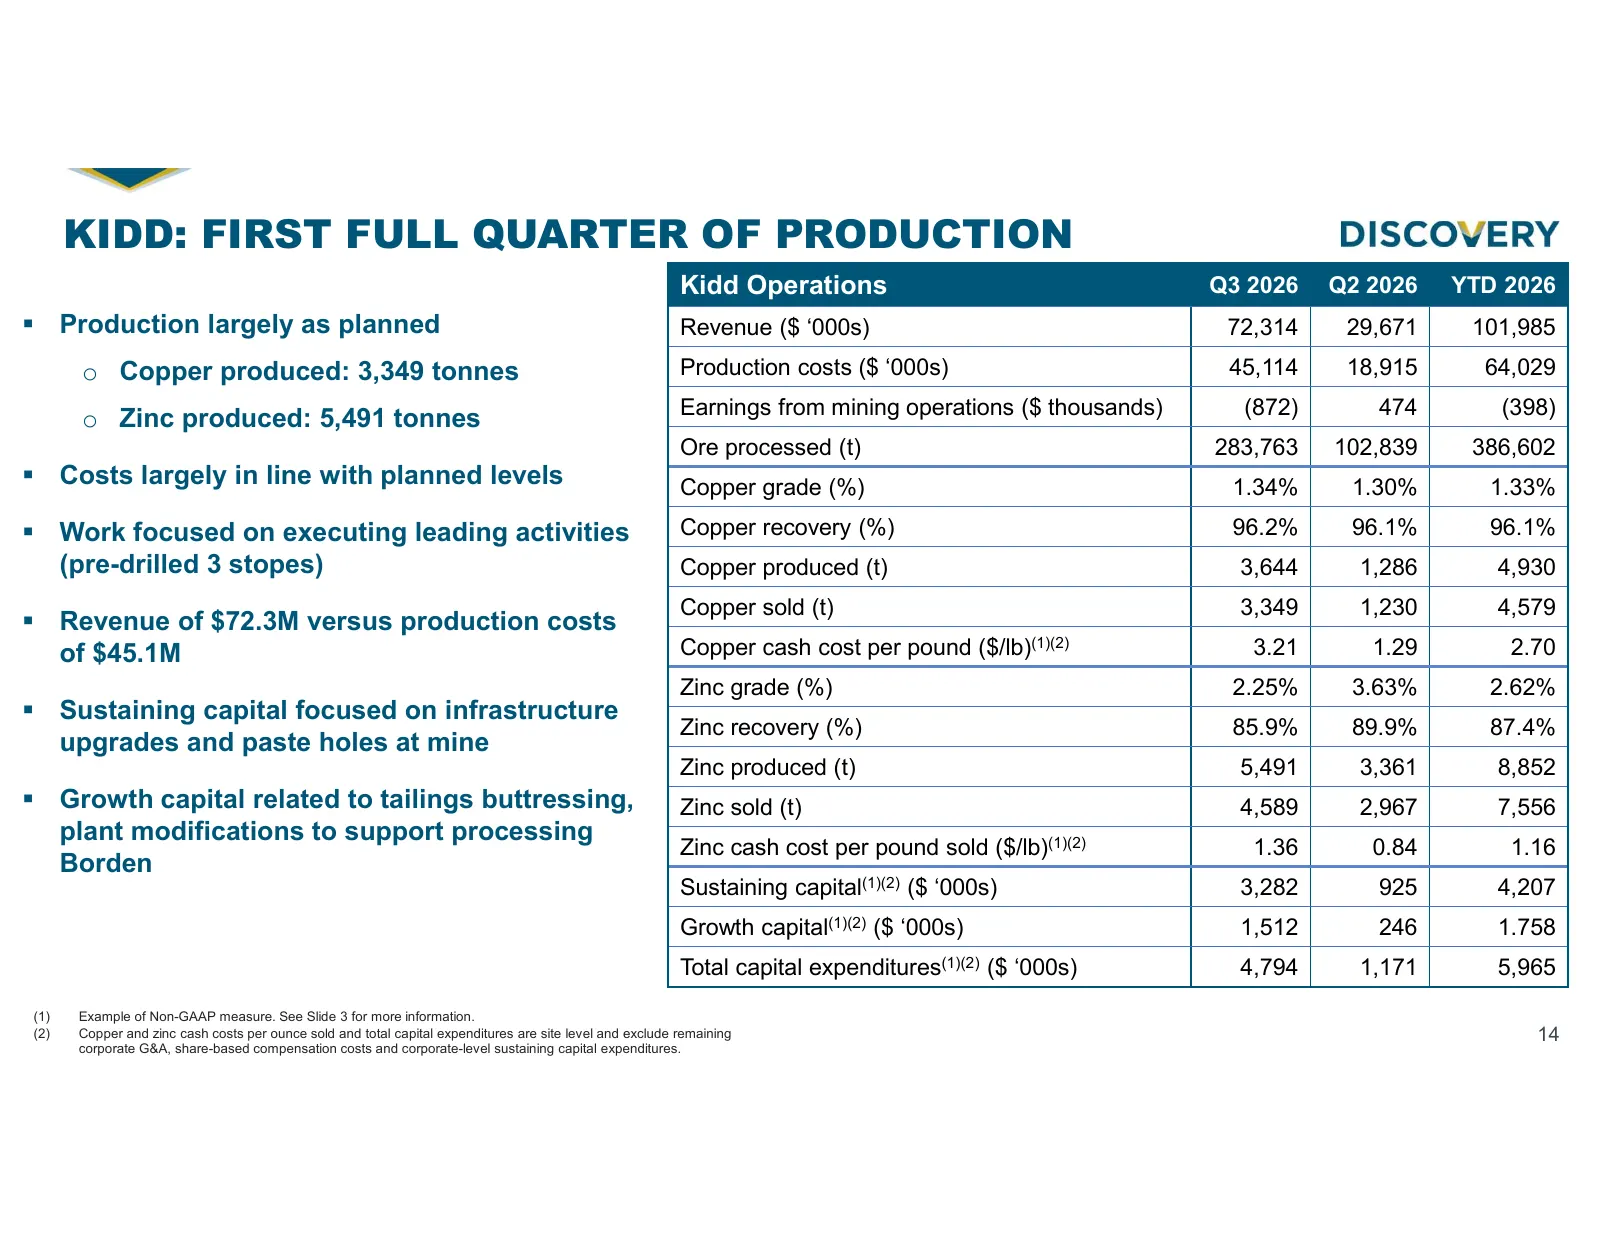
Slide 14: Kidd: First Full Quarter of Production
KIDD: FIRST FULL QUARTER OF PRODUCTION Kidd Operations Q3 2026 Q2 2026 YTD 2026 Production largely as planned Revenue ($ ‘000s) 72,314 29,671 101,985 o Copper produced: 3,349 tonnes Production costs ($ ‘000s) 45,114 18,915 64,029 Earnings from mining operations ($ thousands) (872) 474 (398) o Zinc
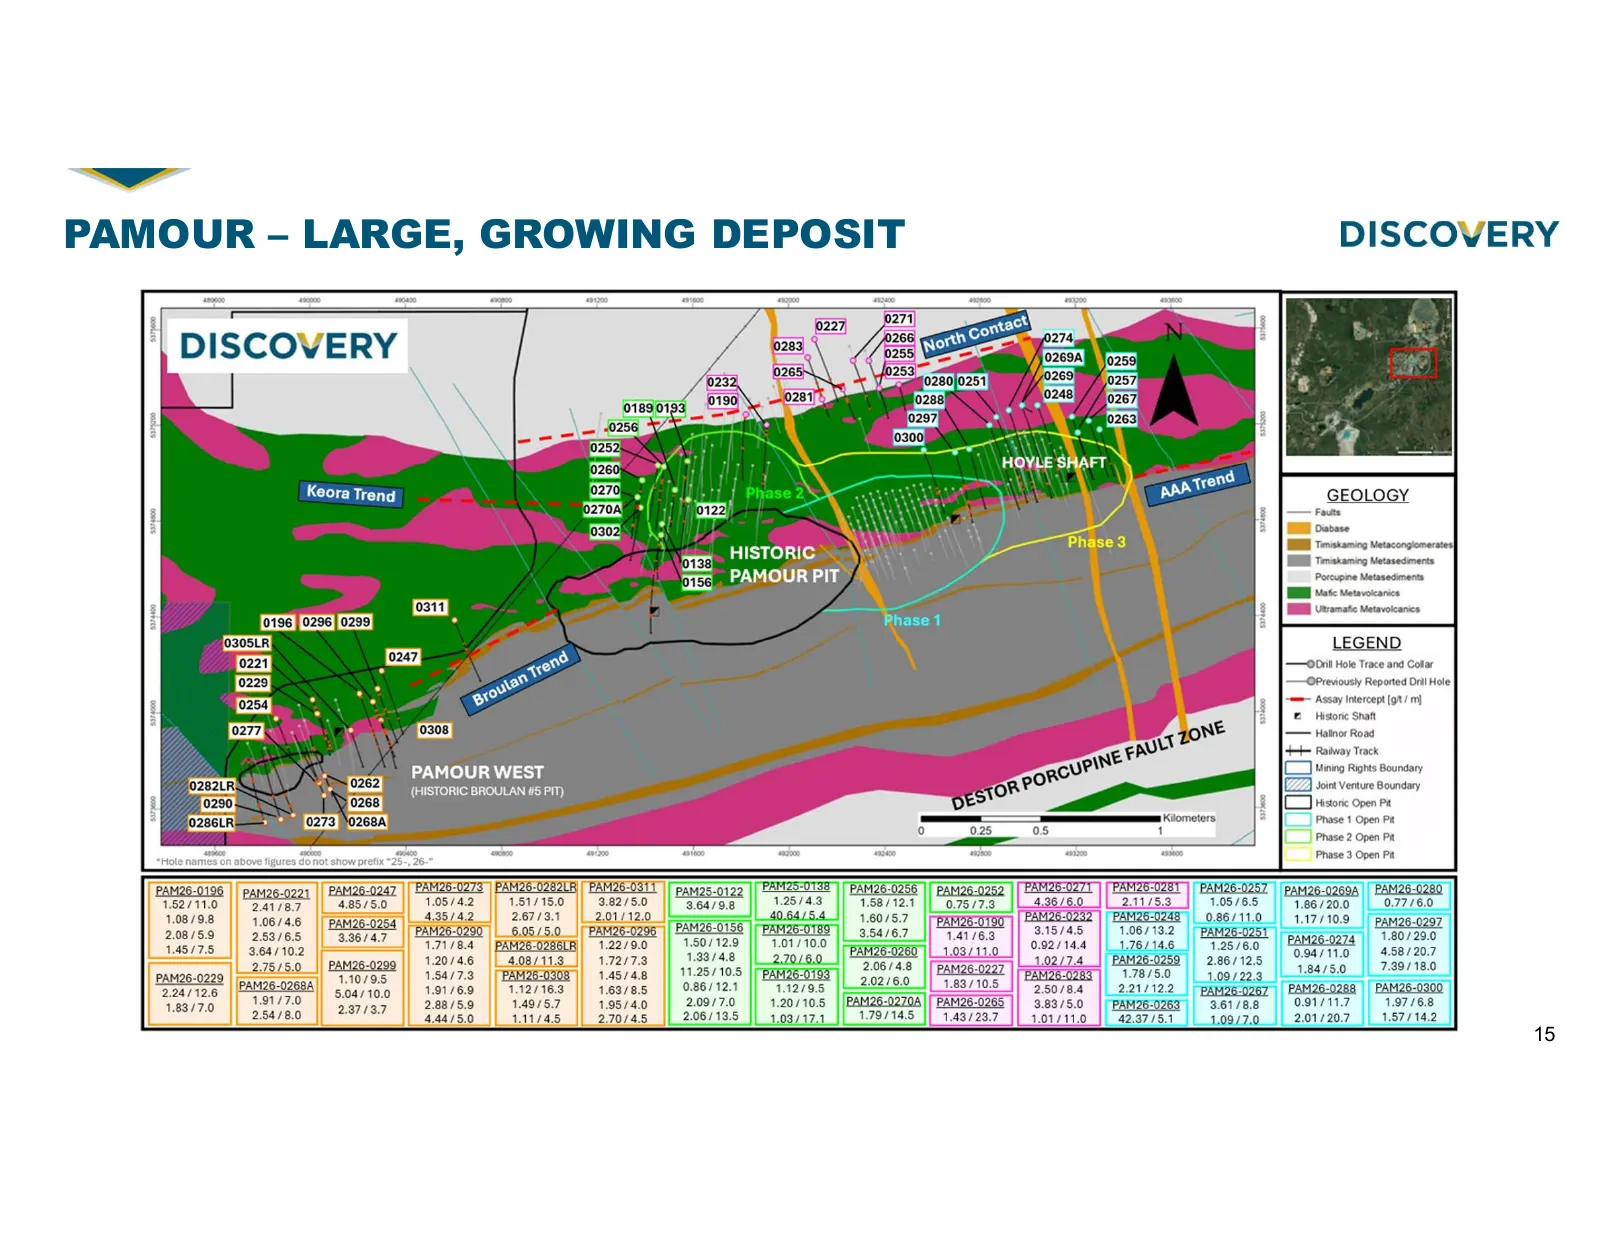
Slide 15: Pamour – Large, Growing Deposit
PAMOUR – LARGE, GROWING DEPOSIT 15
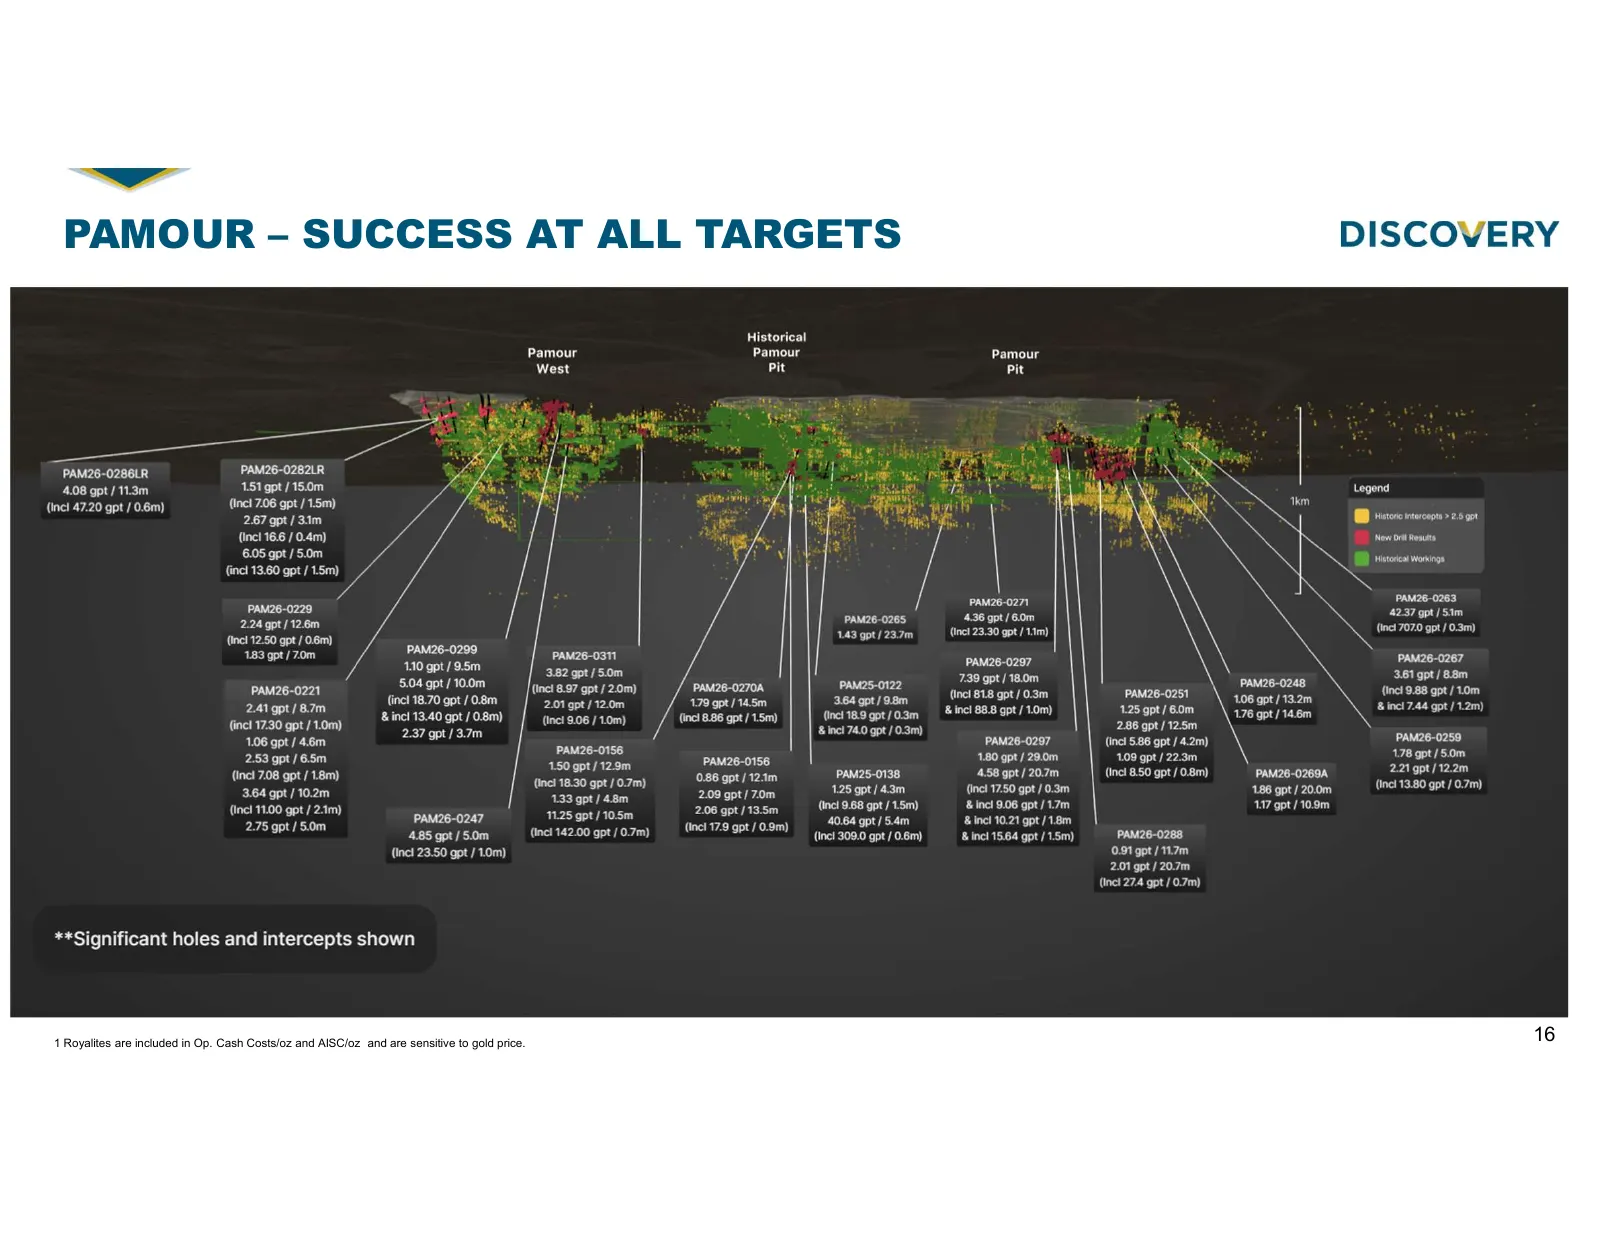
Slide 16: Pamour – Success at All Targets
PAMOUR – SUCCESS AT ALL TARGETS 1 Royalites are included in Op. Cash Costs/oz and AISC/oz and are sensitive to gold price. 16
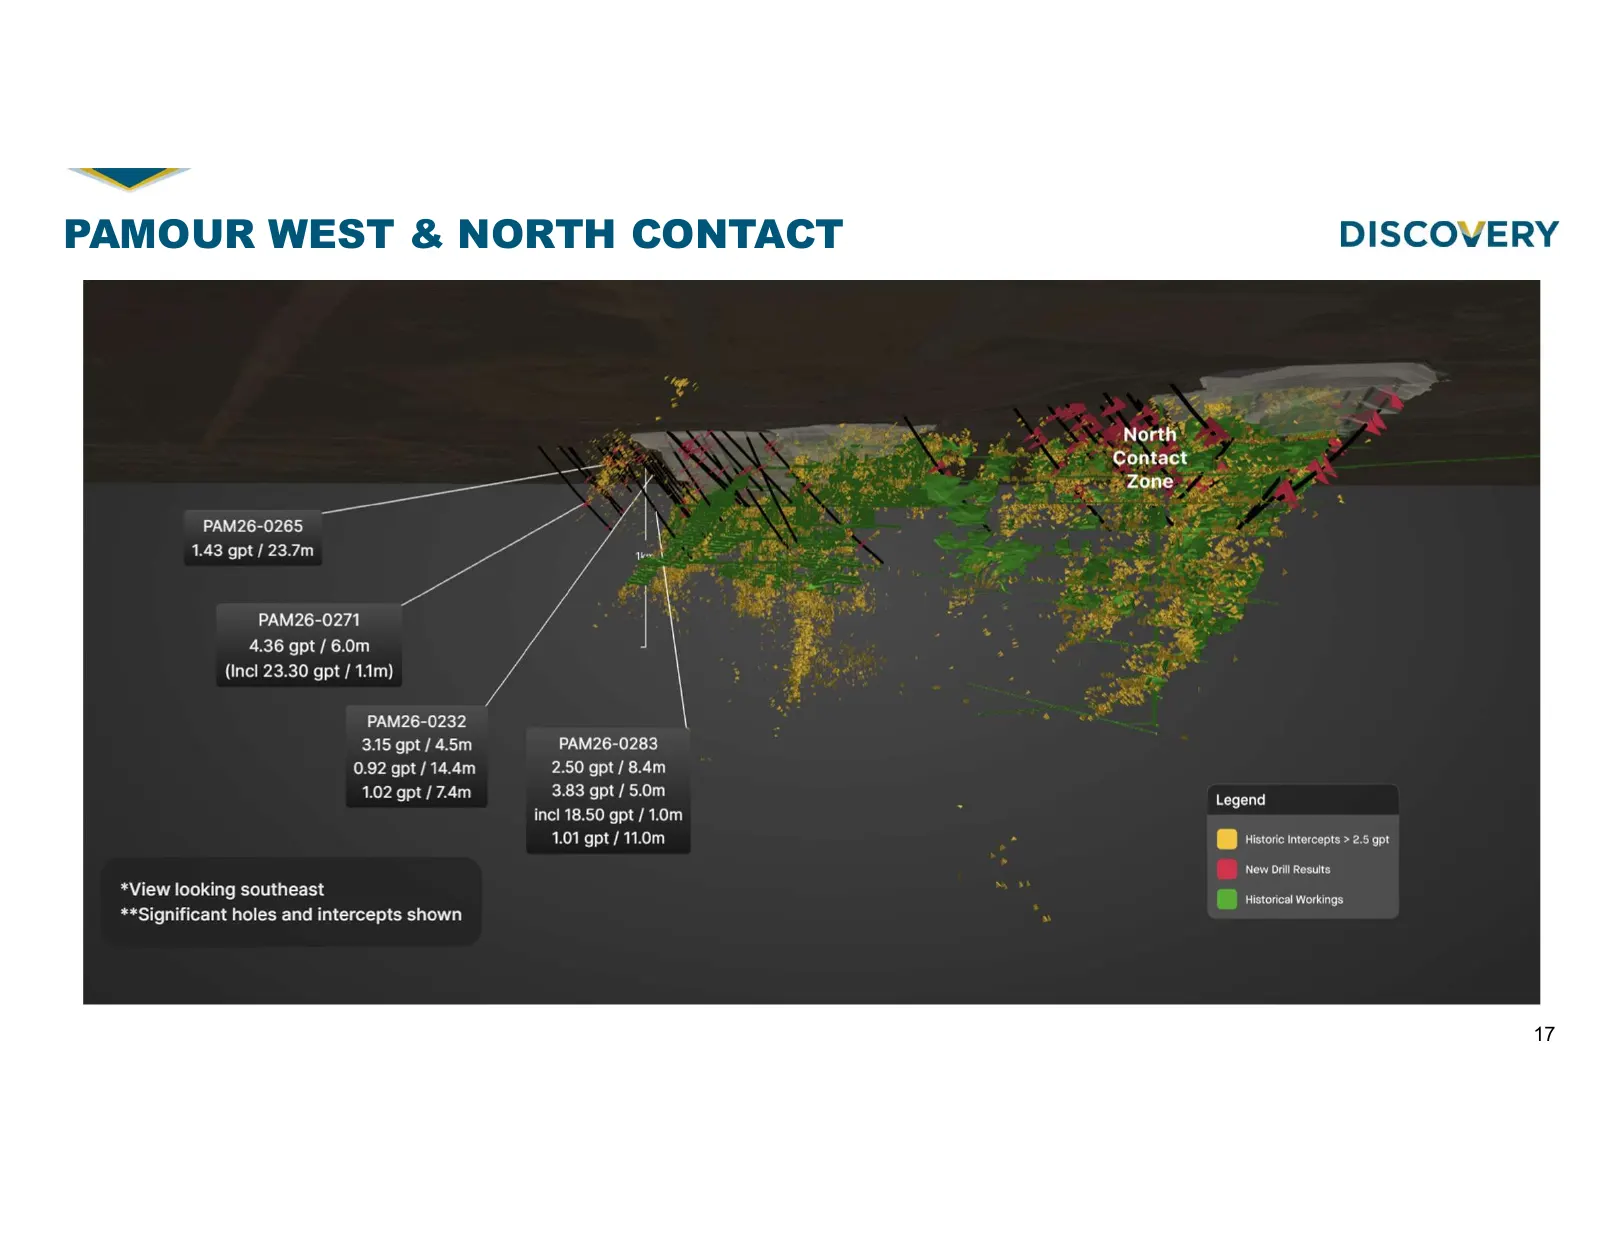
Slide 17: Pamour West & North Contact
PAMOUR WEST & NORTH CONTACT Pamour West 17
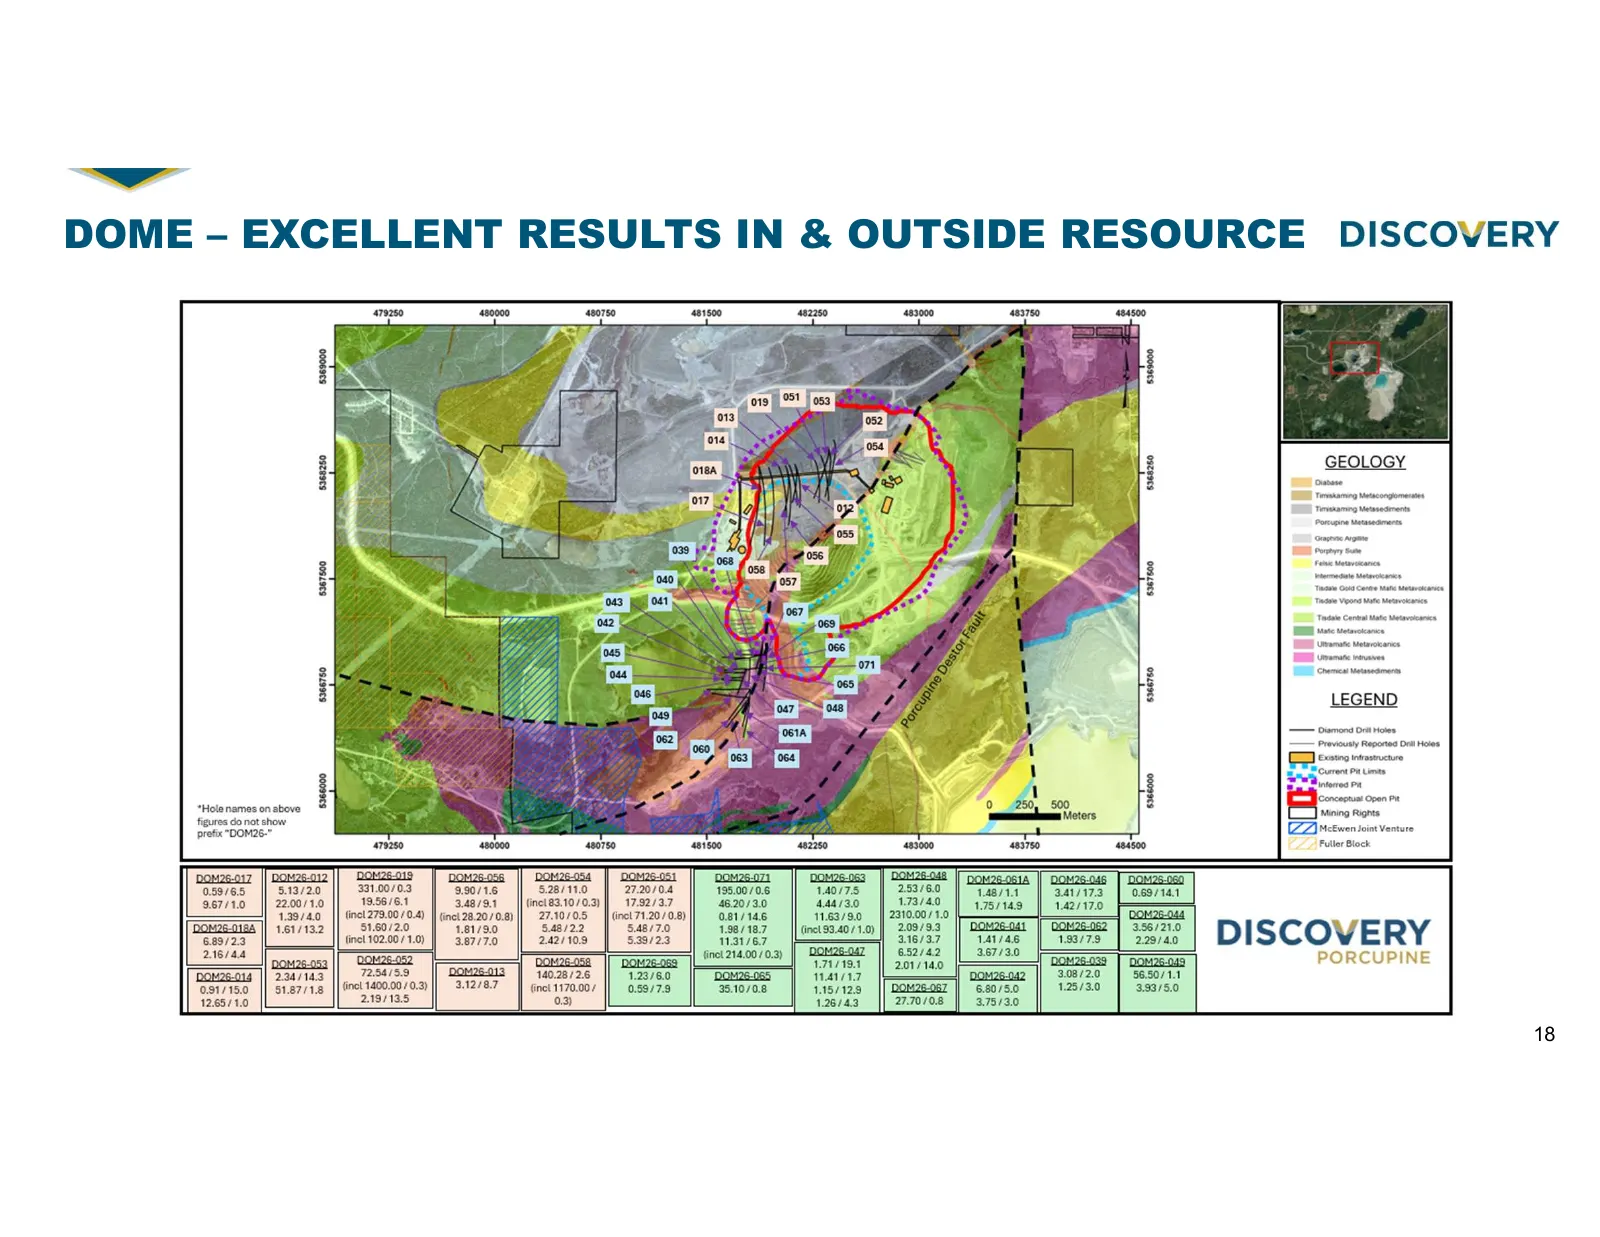
Slide 18: Dome – Excellent Results In & Outside Resource
DOME – EXCELLENT RESULTS IN & OUTSIDE RESOURCE 18
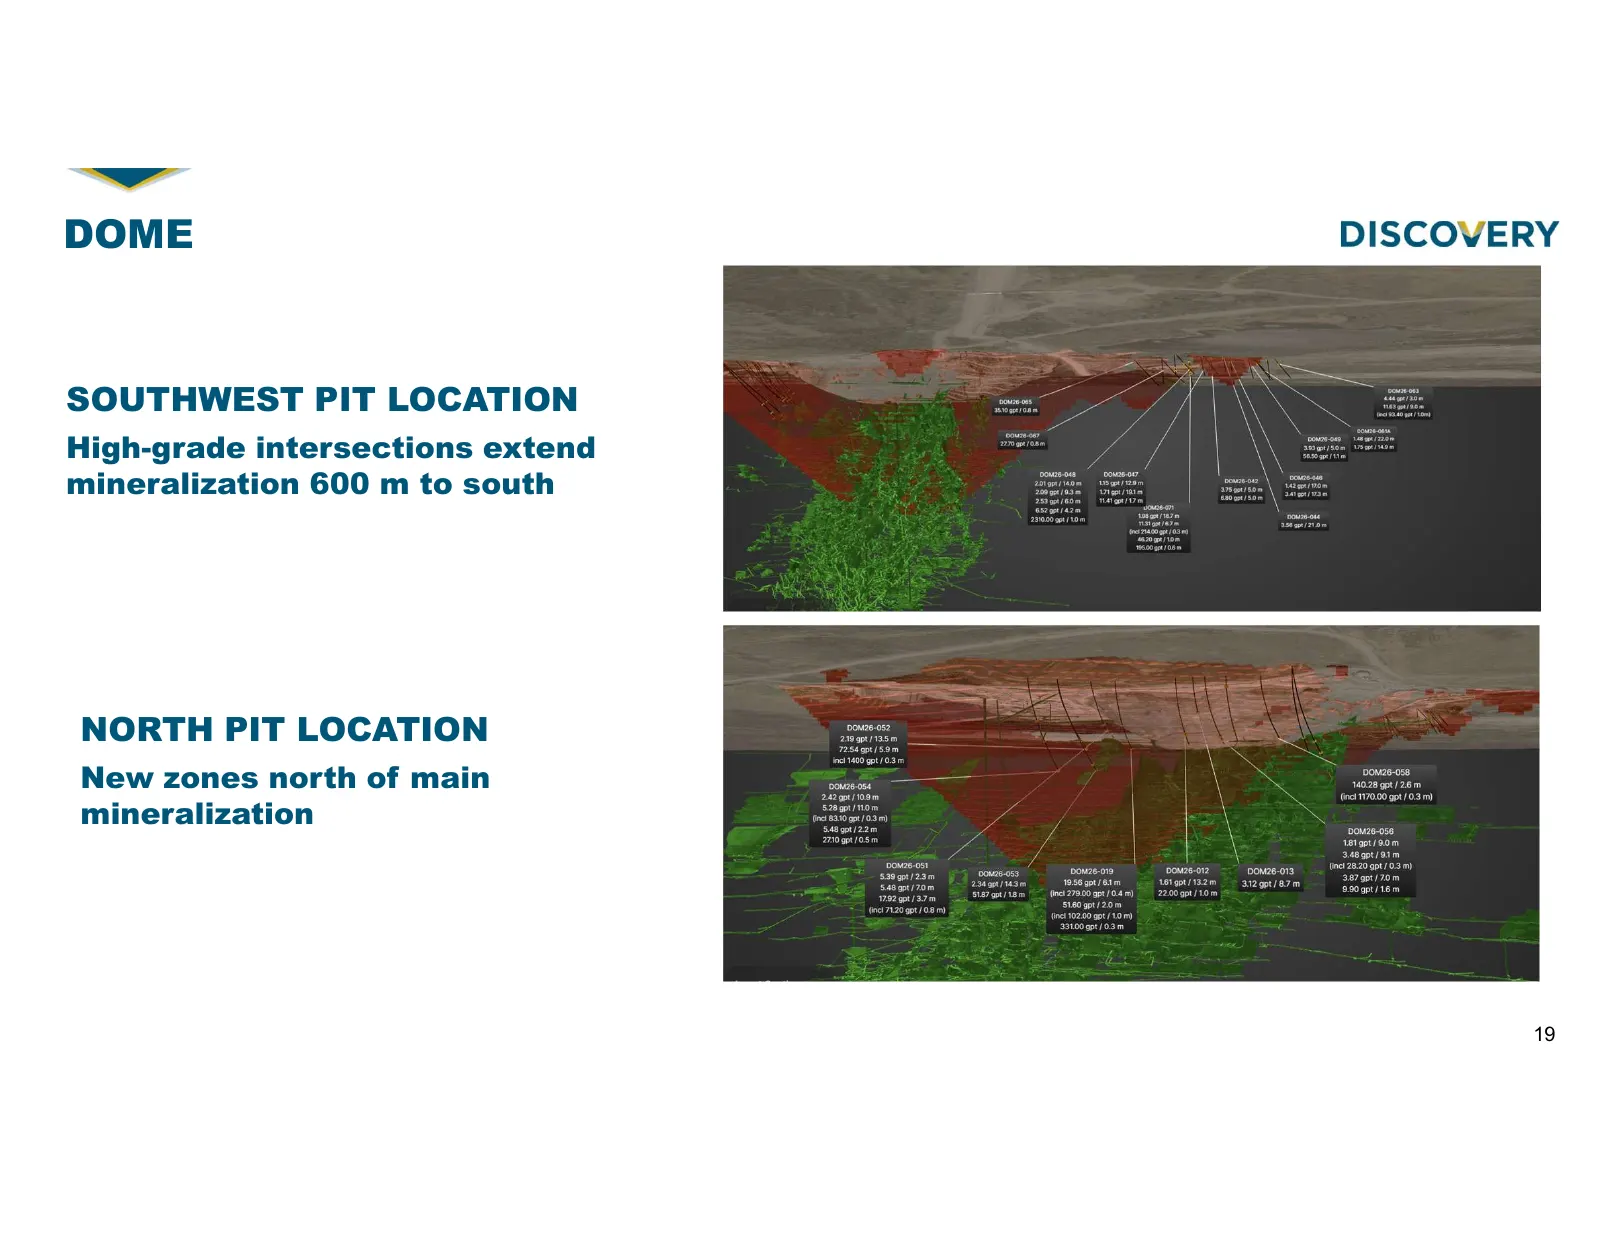
Slide 19: Dome
DOME SOUTHWEST PIT LOCATION High-grade intersections extend mineralization 600 m to south NORTH PIT LOCATION New zones north of main mineralization 19
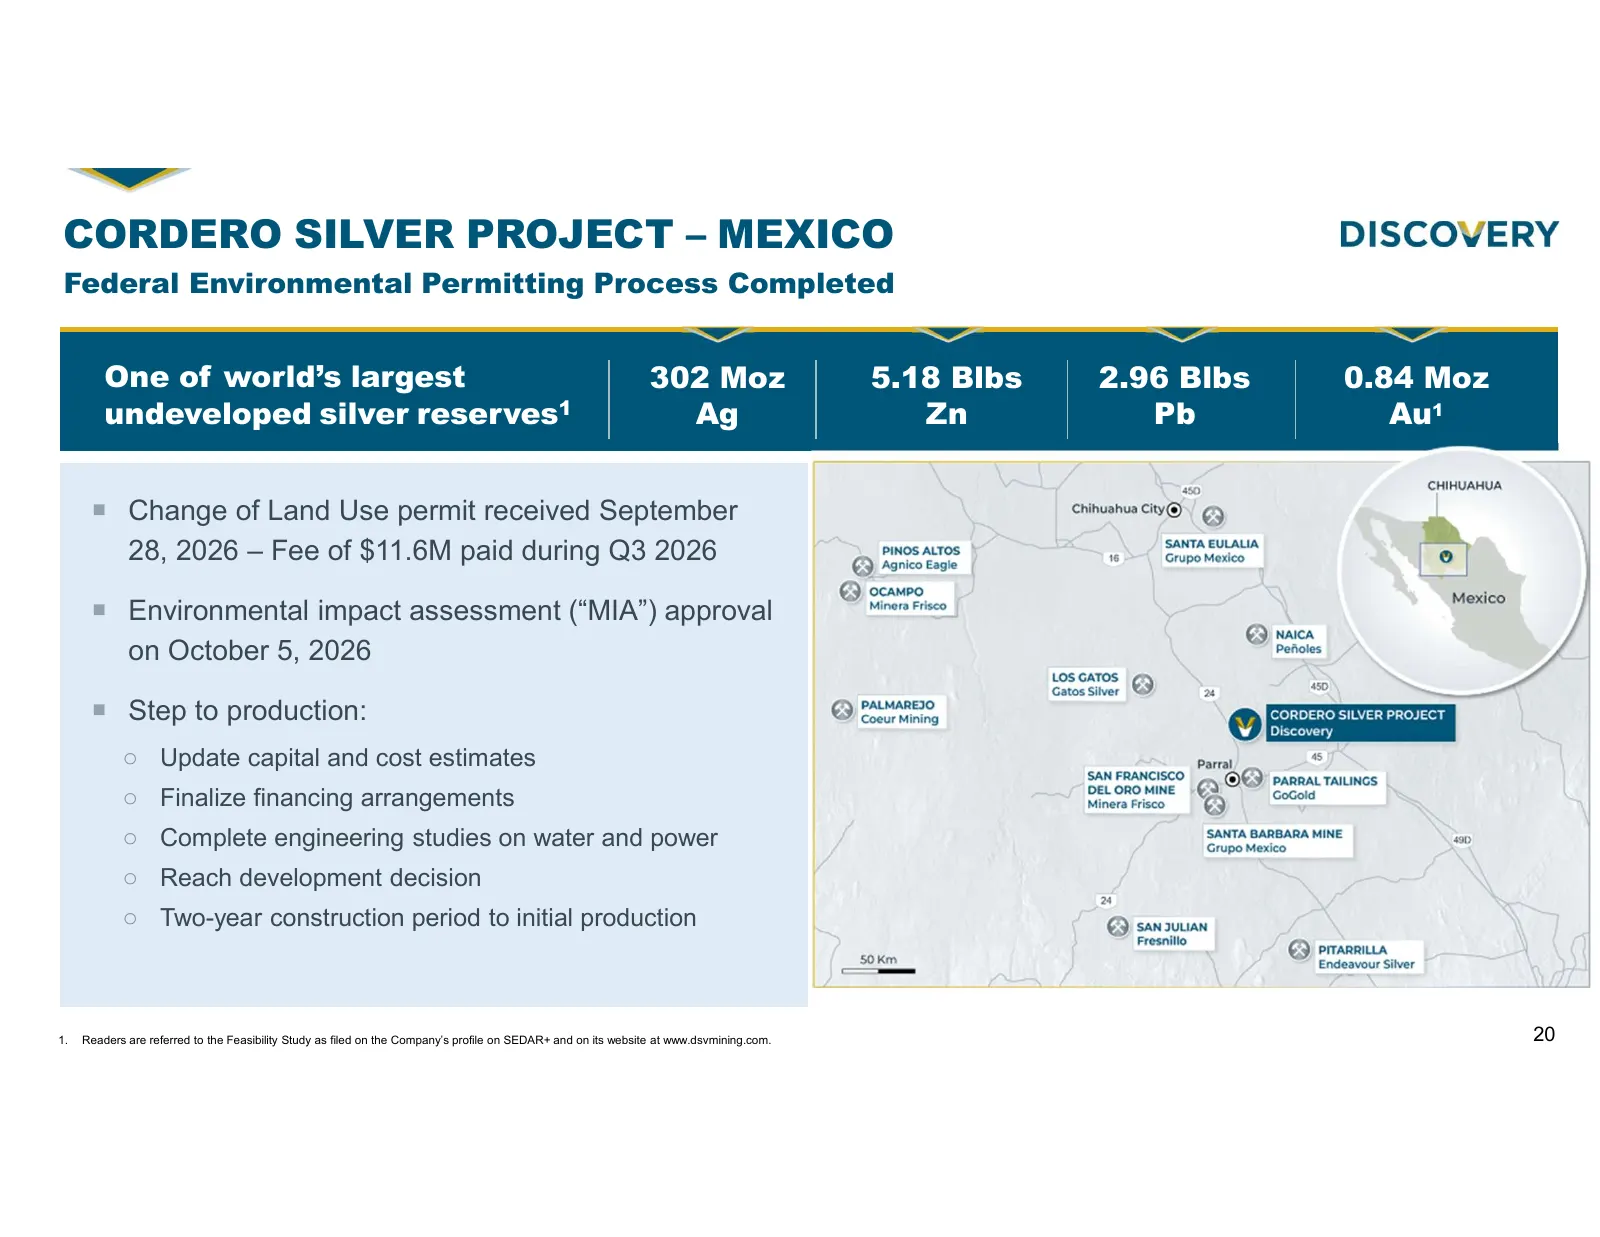
Slide 20: Cordero Silver Project – Mexico
CORDERO SILVER PROJECT – MEXICO Federal Environmental Permitting Process Completed One of world’s largest 302 Moz 5.18 Blbs 2.96 Blbs 0.84 Moz undeveloped silver reserves1 Ag Zn Pb Au1 Change of Land Use permit received September 28, 2026 – Fee of $11.6M paid during Q3 2026 Environmental impact
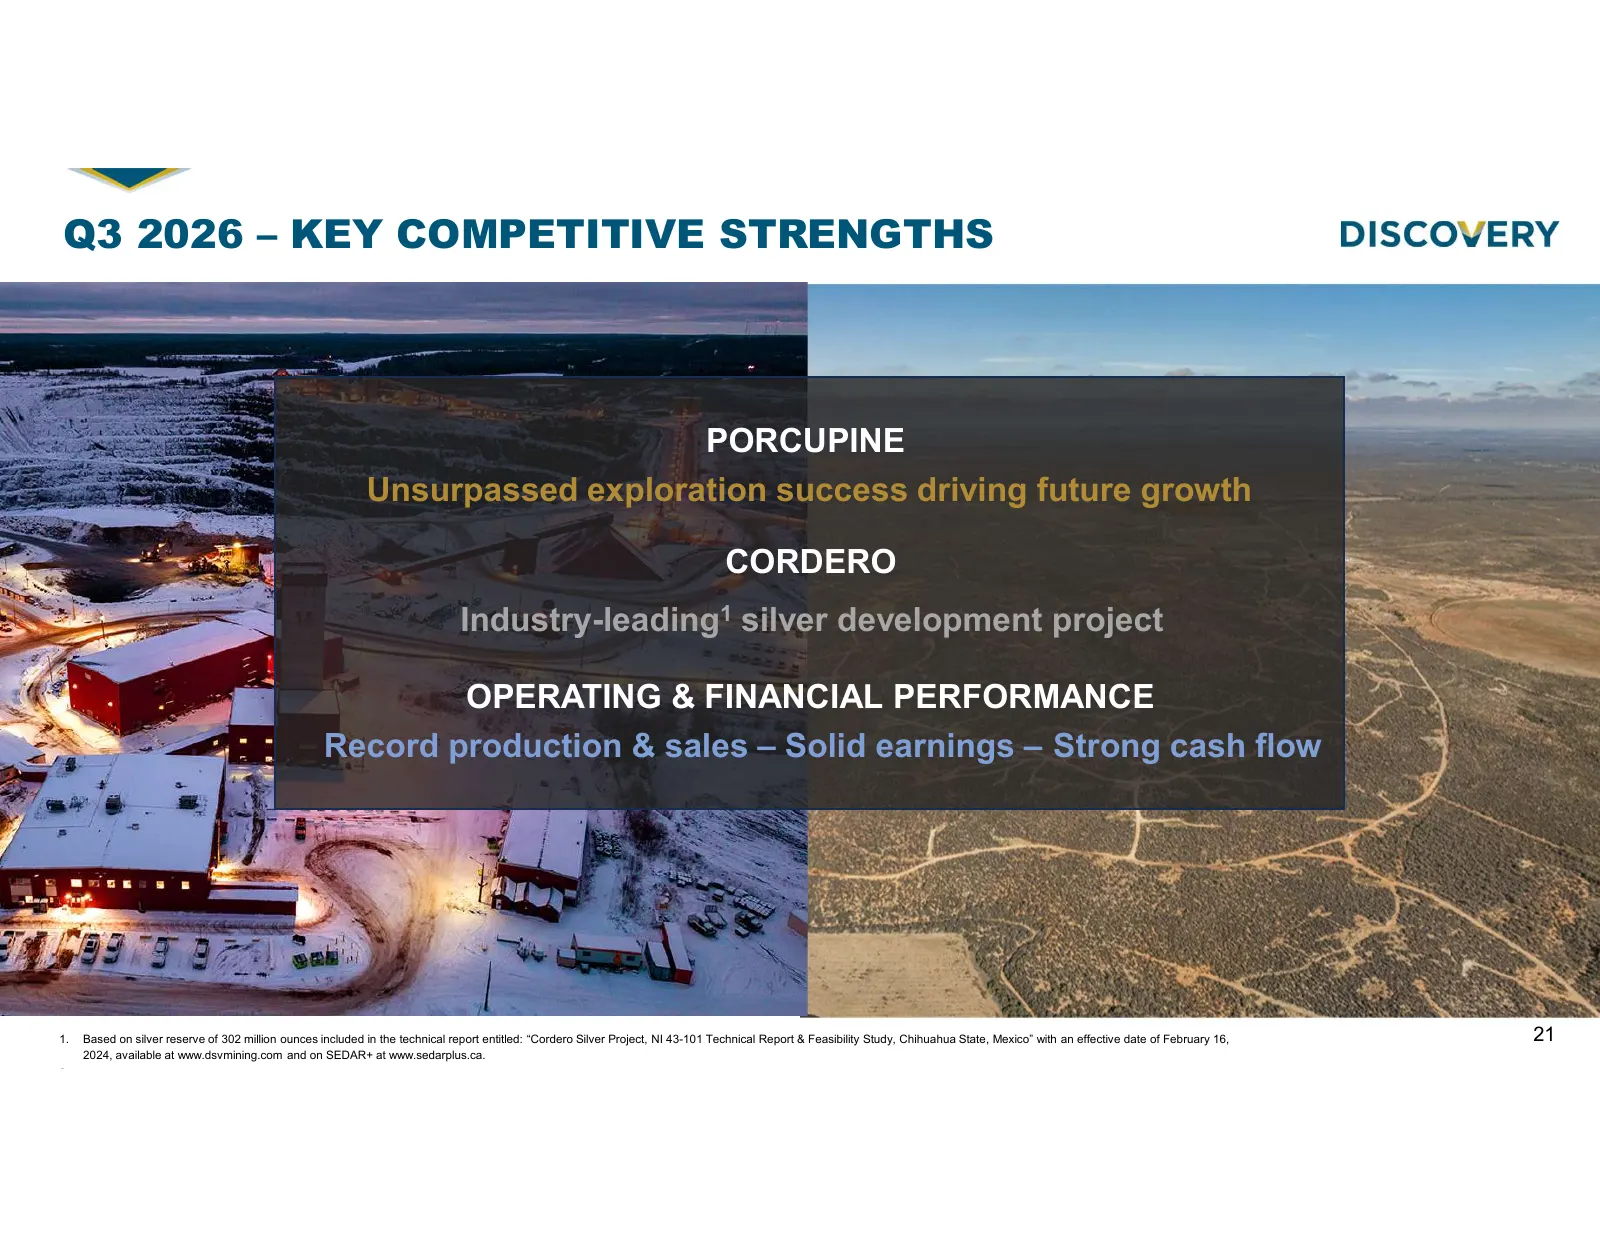
Slide 21: Q3 2026 – Key Competitive Strengths
Q3 2026 – KEY COMPETITIVE STRENGTHS Received MIA & Change of Land Use Permits or Cordero PORCUPINE Unsurpassed exploration success driving future growth Outstanding exploration results at Pamour & Dome CORDERO Industry-leading Strong operating & financial silver results in Q3 development 2026 projec
Slide 22: Unsurpassed Growth Potential
Third Quarter 2026 Investor Call | November 10, 2026 TSX:DSV OTCQX: DSVSF Unsurpassed Growth Potential
Source: company website
More decks from Discovery Silver Corp
 Mining Forum Americas 202640 slides · Sep 27, 2026
 Q2 2026 Earnings Presentation30 slides · Aug 13, 2026
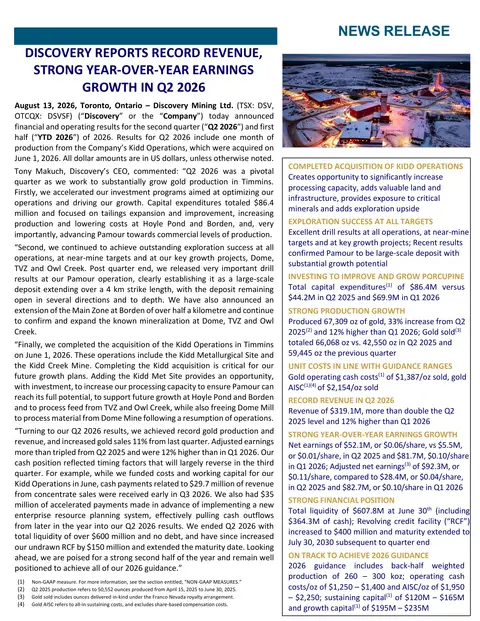 Q2 2026 Earnings Presentation19 slides · Aug 13, 2026
 Canadian Mining Expo 202642 slides · Jun 11, 2026
 CIBC Site Visit June 4-5, 202645 slides · Jun 4, 2026
 Raymond James London Silver Conference 202639 slides · May 27, 2026