First Interstate BancSystem, Inc. · NASDAQ:FIBK
First Interstate BancSystem — Q4 2023 Earnings Presentation
19 slides from First Interstate BancSystem's earnings presentation, Jan 30, 2024
Slide 1: 4Q 2023 Investor Presentation
Exhibit 99.2 4Q 2023 Investor Presentation January 30, 2024
Slide 2: Cautionary Note Regarding Forward-Looking Statements
CAUTIONARY NOTE REGARDING FORWARD-LOOKING STATEMENTS This presentation contains “forward-looking statements” within the meaning of Section 27A of the Securities Act of 1933, as amended, and Rule 175 promulgated thereunder, and Section 21E of the Securities Exchange Act of 1934, as amended, and Rule
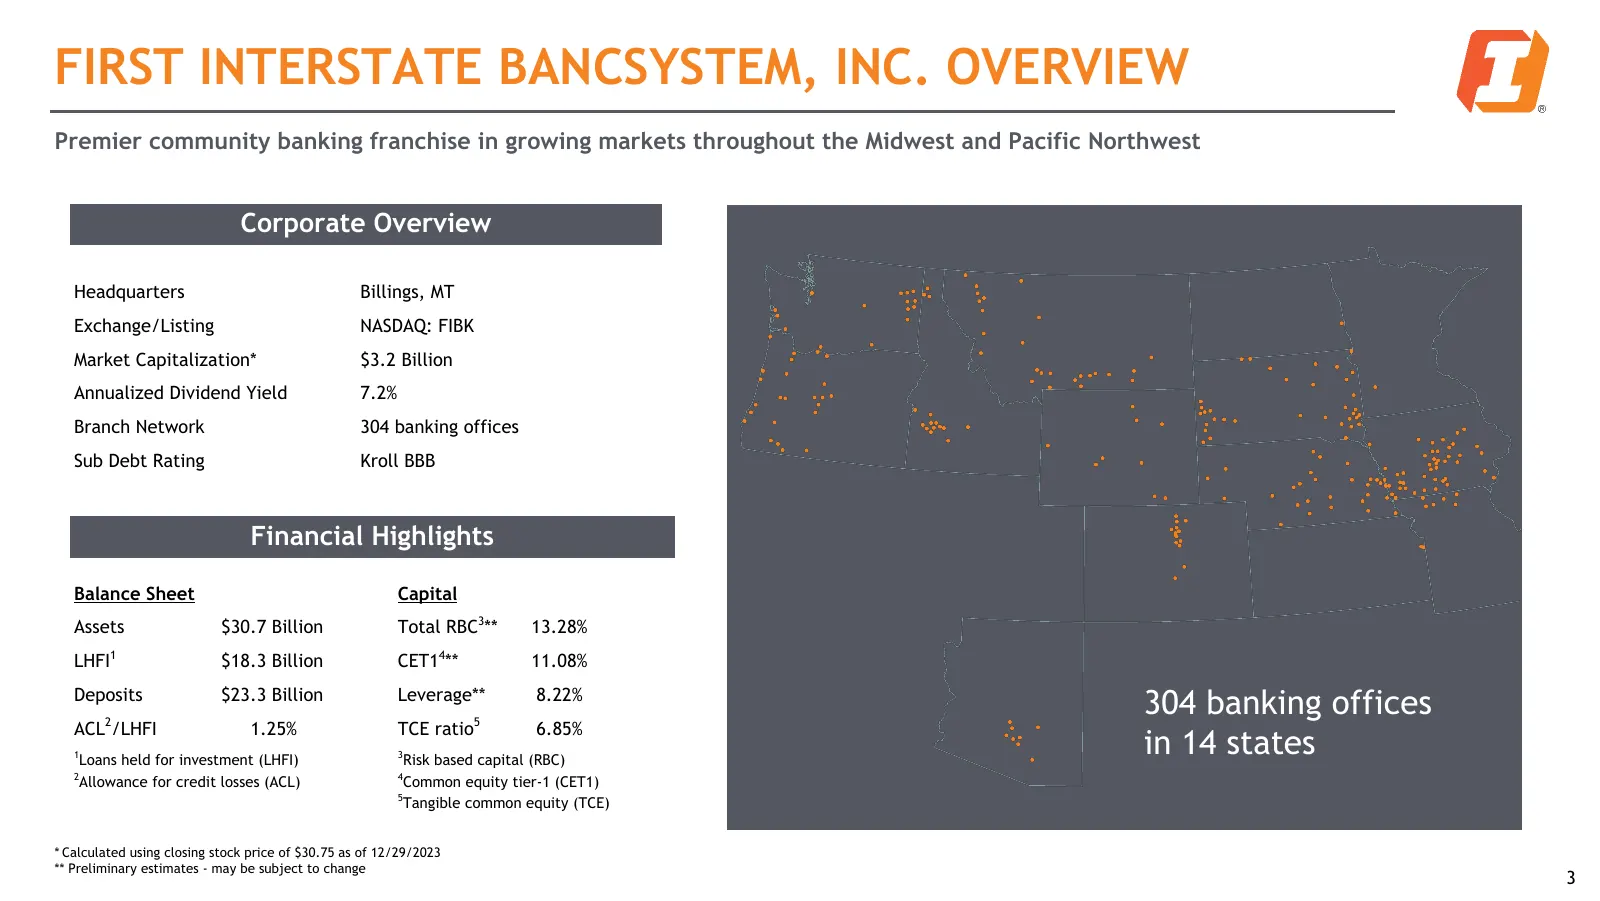
Slide 3: First Interstate BancSystem, Inc. Overview
FIRST INTERSTATE BANCSYSTEM, INC. OVERVIEW Premier community banking franchise in growing markets throughout the Midwest and Pacific Northwest Corporate Overview Headquarters Billings, MT Exchange/Listing NASDAQ: FIBK Market Capitalization* $3.2 Billion Annualized Dividend Yield 7.2% Branch Network
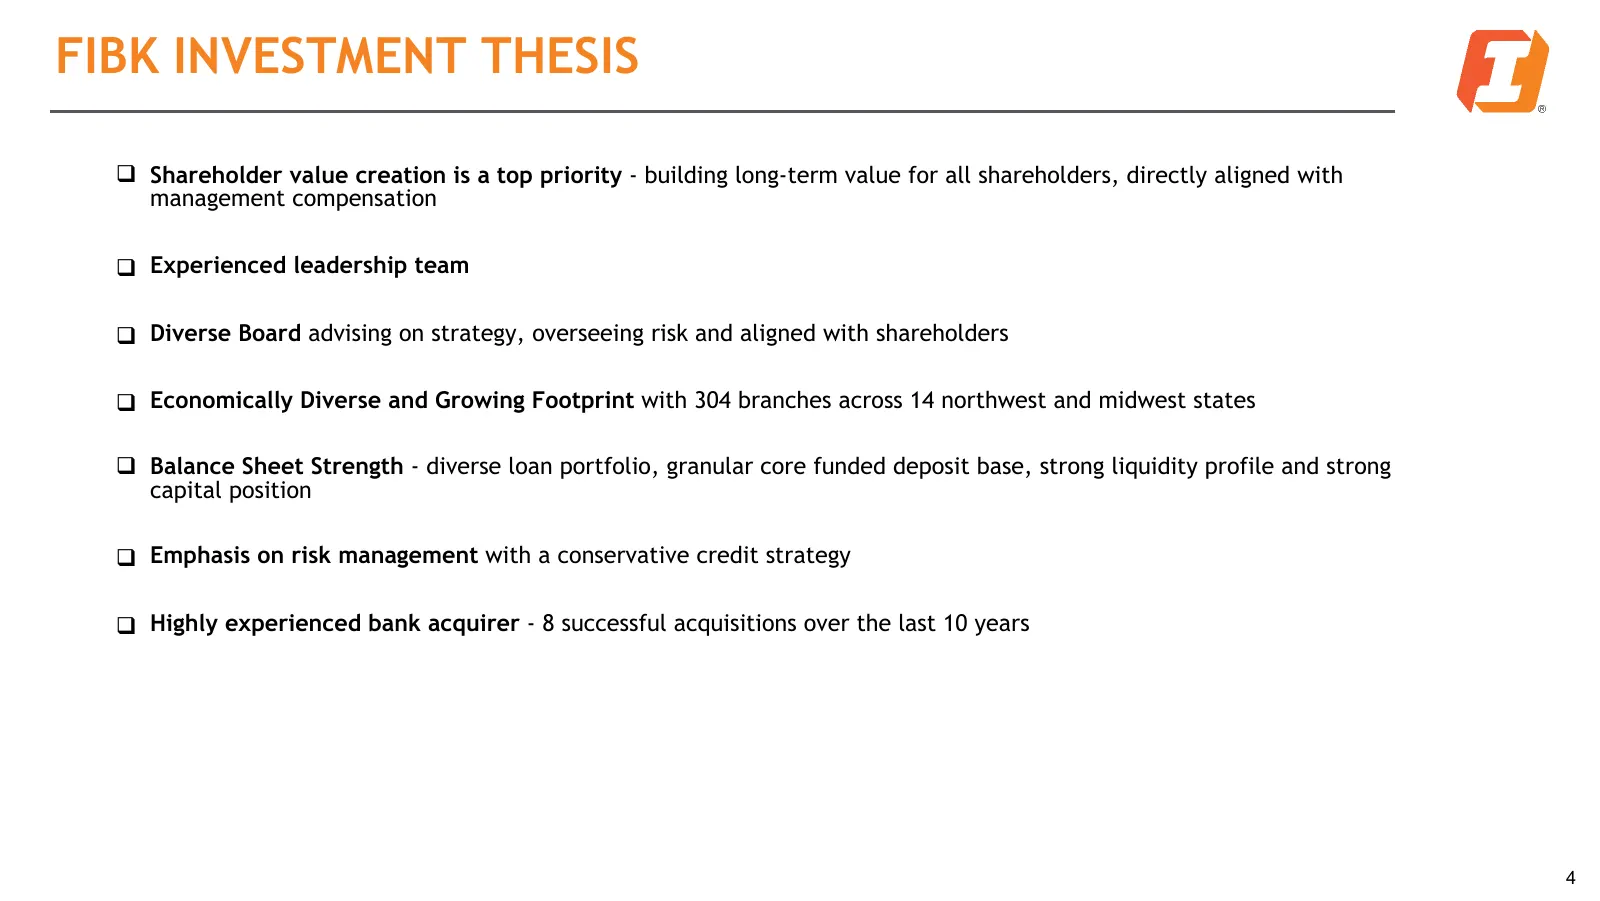
Slide 4: FIBK Investment Thesis
FIBK INVESTMENT THESIS q Shareholder value creation is a top priority - building long-term value for all shareholders, directly aligned with management compensation q Experienced leadership team q Diverse Board advising on strategy, overseeing risk and aligned with shareholders q Economically Divers
Slide 5: Fourth Quarter 2023 Highlights
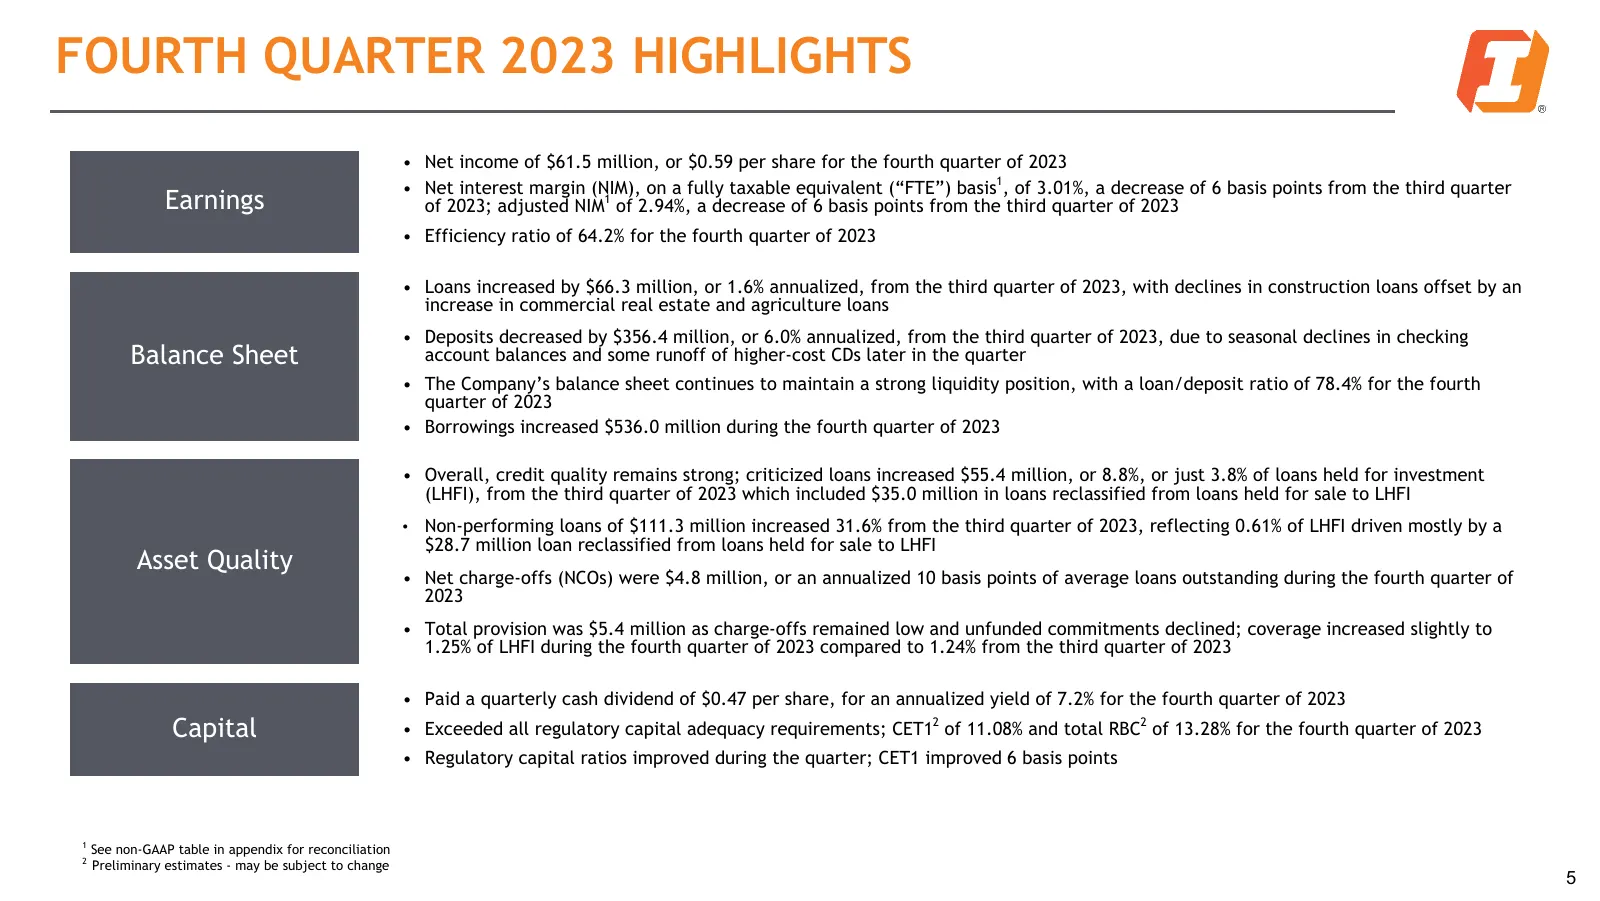
FOURTH QUARTER 2023 HIGHLIGHTS • Net income of $61.5 million, or $0.59 per share for the fourth quarter of 2023 • Net interest margin (NIM), on a fully taxable equivalent (“FTE”) basis1, of 3.01%, a decrease of 6 basis points from the third quarter Earnings of 2023; adjusted NIM1 of 2.94%, a decreas
Slide 6: Diversified Loan Portfolio
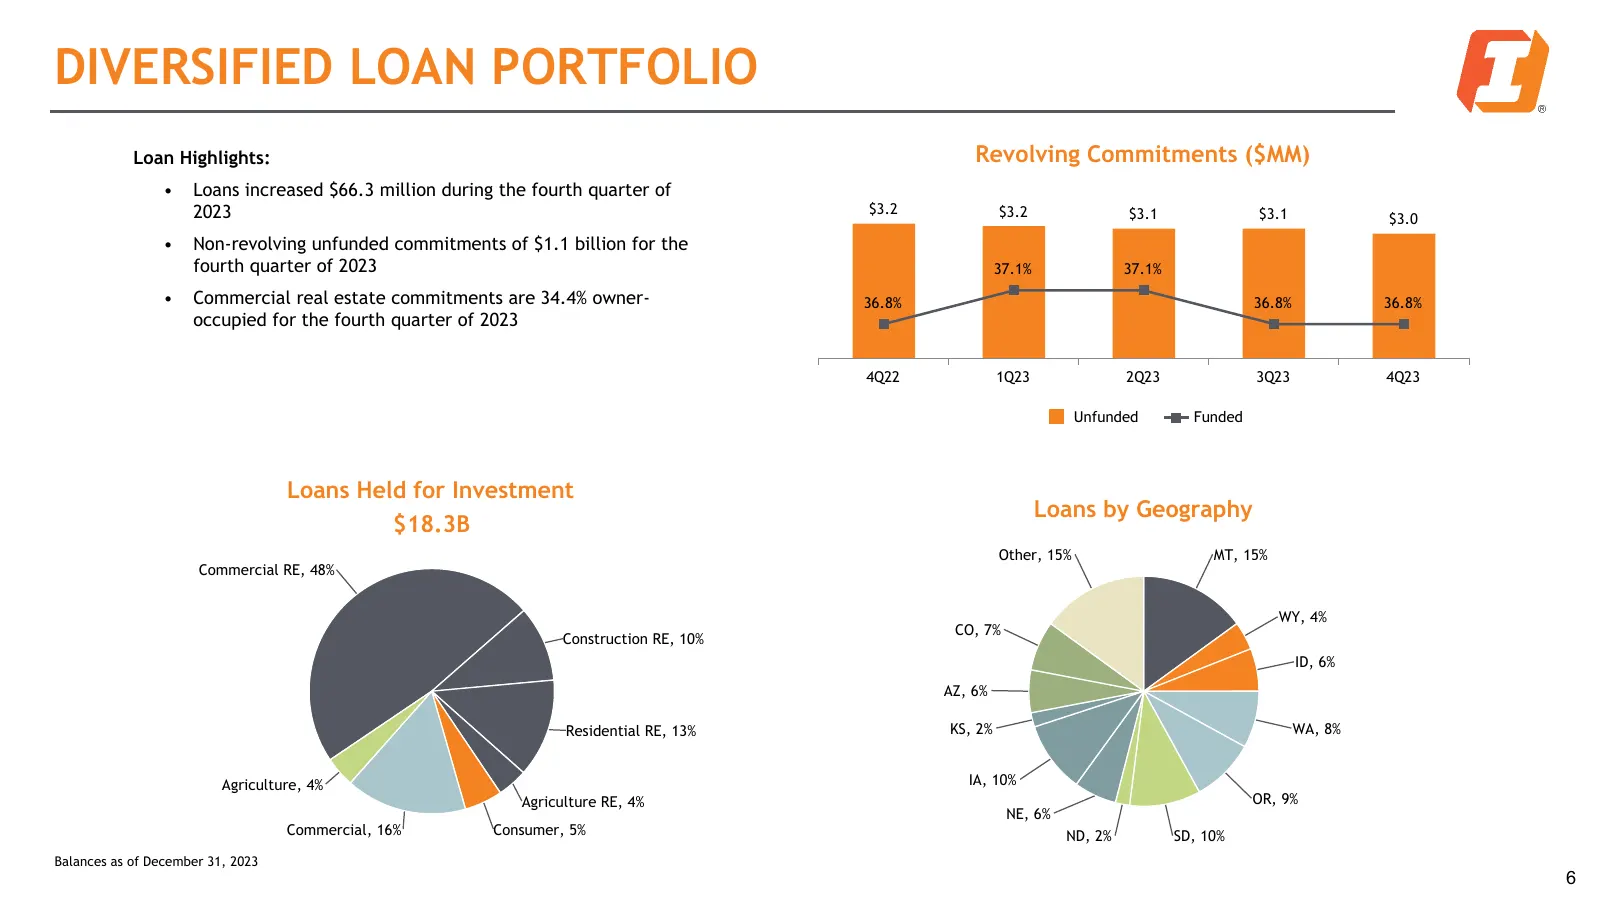
DIVERSIFIED LOAN PORTFOLIO Loan Highlights: Revolving Commitments ($MM) • Loans increased $66.3 million during the fourth quarter of 2023 $3.2 $3.2 $3.1 $3.1 $3.0 • Non-revolving unfunded commitments of $1.1 billion for the fourth quarter of 2023 37.1% 37.1% • Commercial real estate commitments are
Slide 7: Diverse Deposit Base: By Type of Account
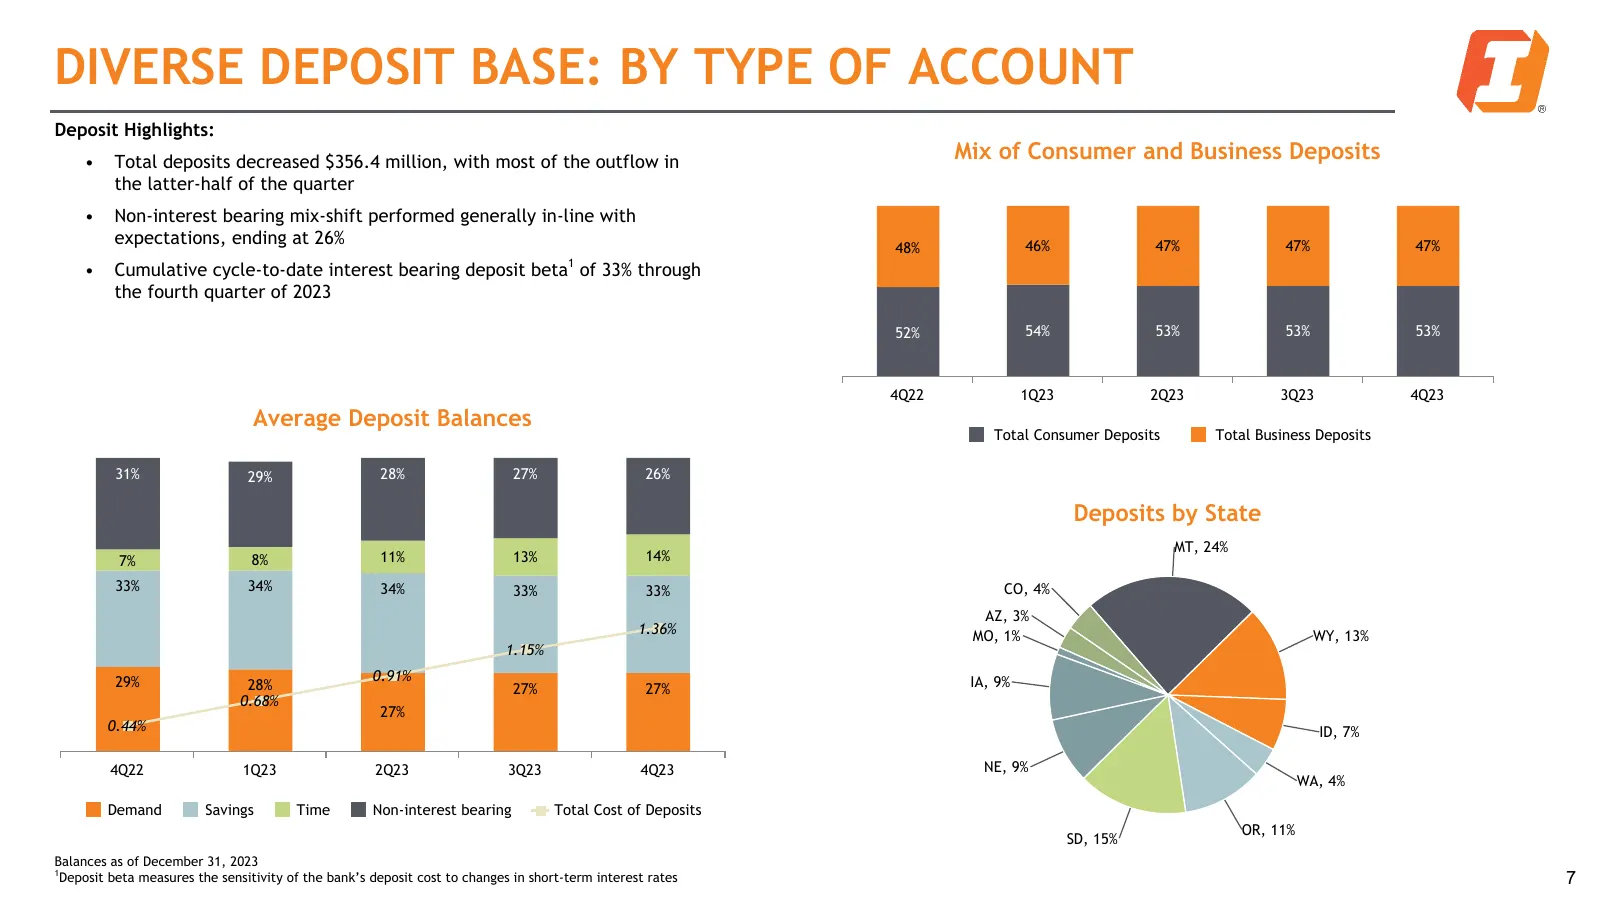
DIVERSE DEPOSIT BASE: BY TYPE OF ACCOUNT Deposit Highlights: • Total deposits decreased $356.4 million, with most of the outflow in Mix of Consumer and Business Deposits the latter-half of the quarter • Non-interest bearing mix-shift performed generally in-line with expectations, ending at 26% 48% 4
Slide 8: Capital and Liquidity
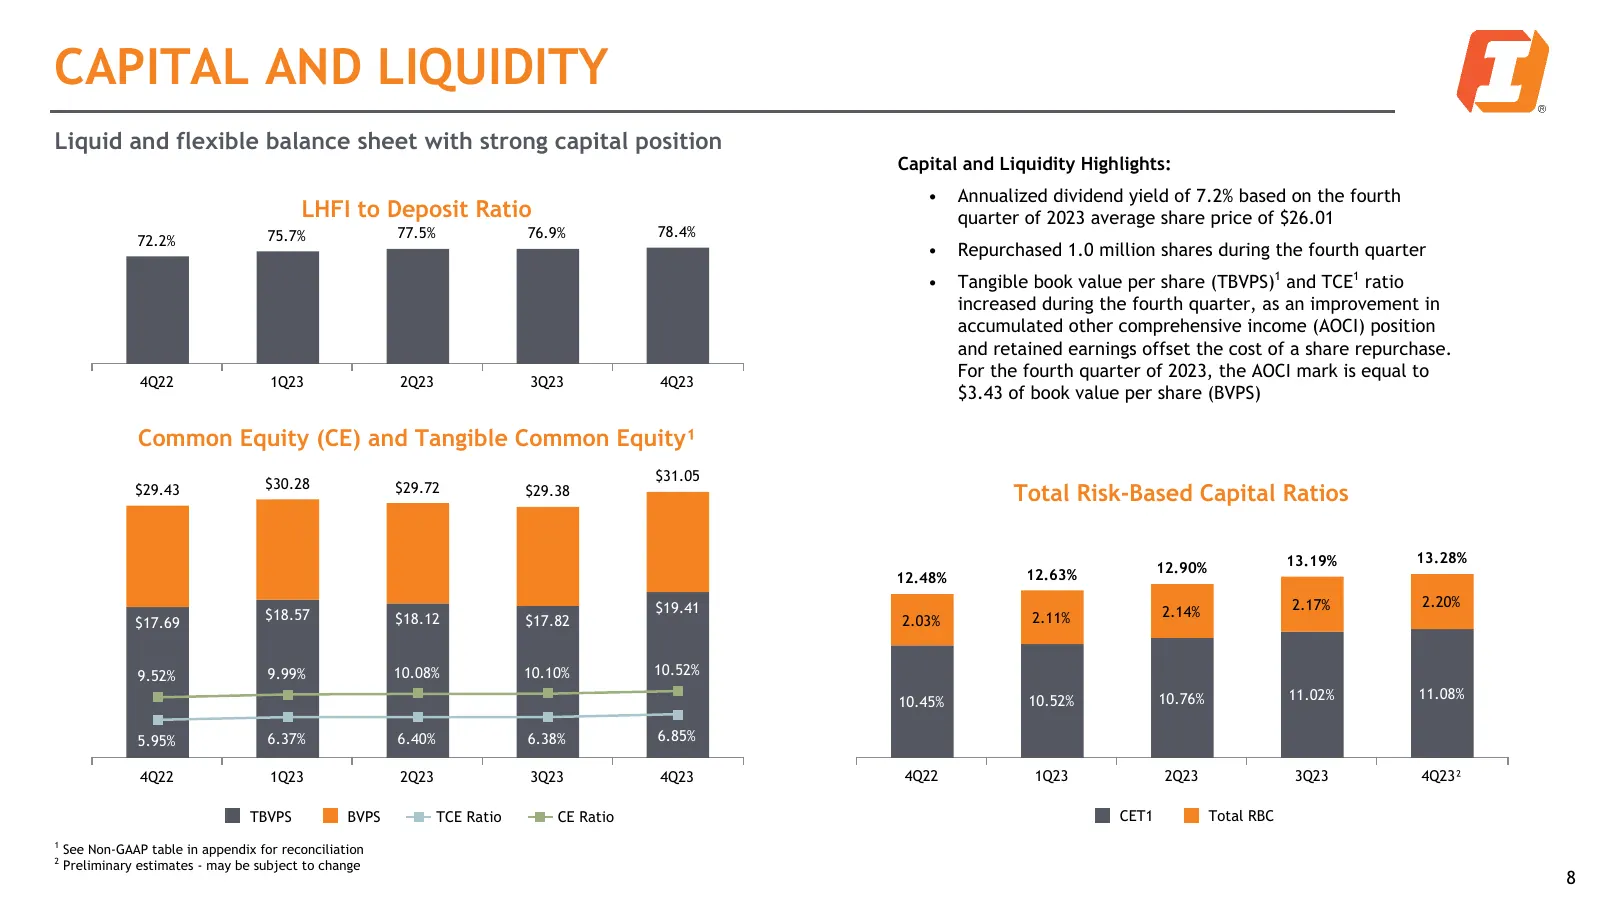
CAPITAL AND LIQUIDITY Liquid and flexible balance sheet with strong capital position Capital and Liquidity Highlights: • Annualized dividend yield of 7.2% based on the fourth LHFI to Deposit Ratio quarter of 2023 average share price of $26.01 75.7% 77.5% 76.9% 78.4% 72.2% • Repurchased 1.0 million s
Slide 9: Allowance for Credit Losses (ACL)
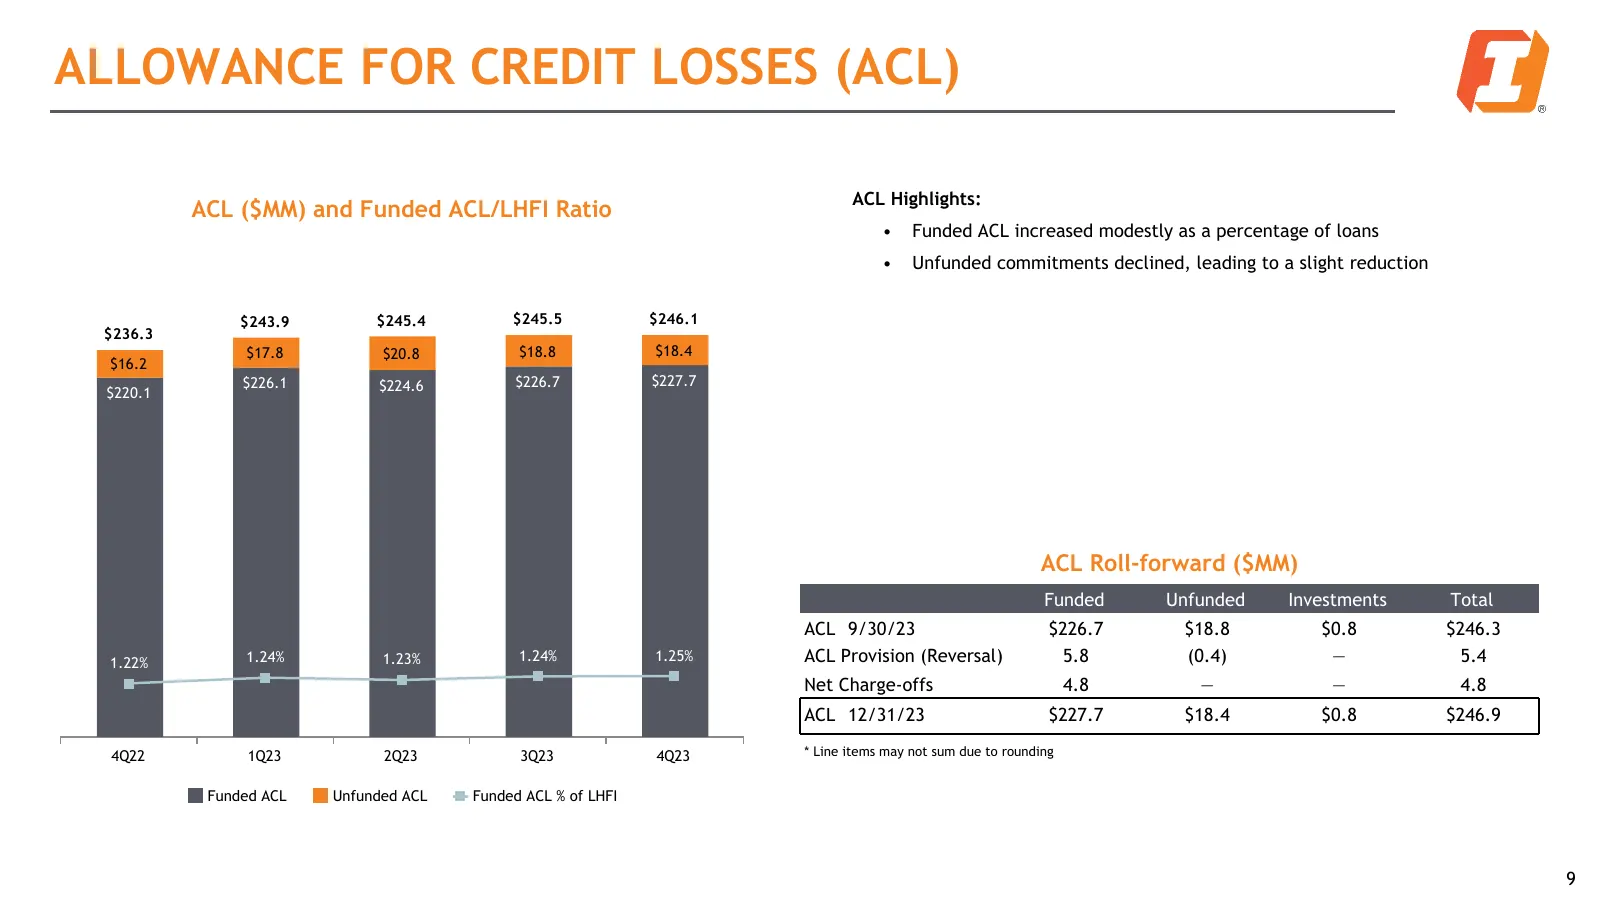
ALLOWANCE FOR CREDIT LOSSES (ACL) ACL Highlights: ACL ($MM) and Funded ACL/LHFI Ratio • Funded ACL increased modestly as a percentage of loans • Unfunded commitments declined, leading to a slight reduction $243.9 $245.4 $245.5 $246.1 $236.3 $17.8 $20.8 $18.8 $18.4 $16.2 $226.1 $224.6 $226.7 $227.7 $
Slide 10: Asset Quality and Reserve Trends
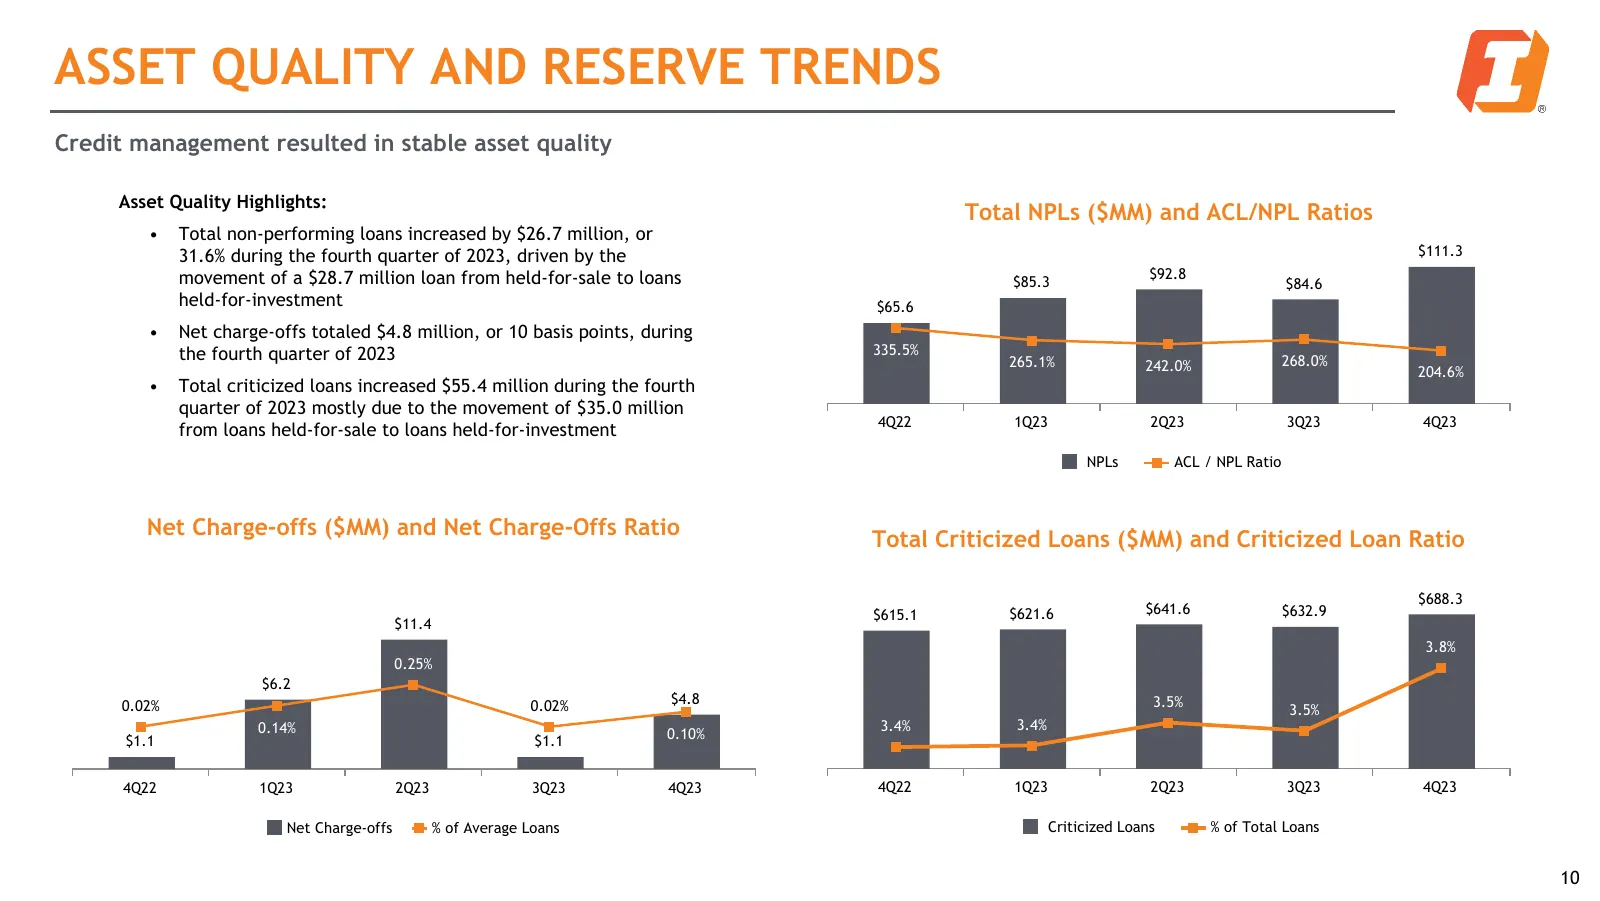
ASSET QUALITY AND RESERVE TRENDS Credit management resulted in stable asset quality Asset Quality Highlights: Total NPLs ($MM) and ACL/NPL Ratios • Total non-performing loans increased by $26.7 million, or 31.6% during the fourth quarter of 2023, driven by the $111.3 movement of a $28.7 million loan
Slide 11: Net Interest Income
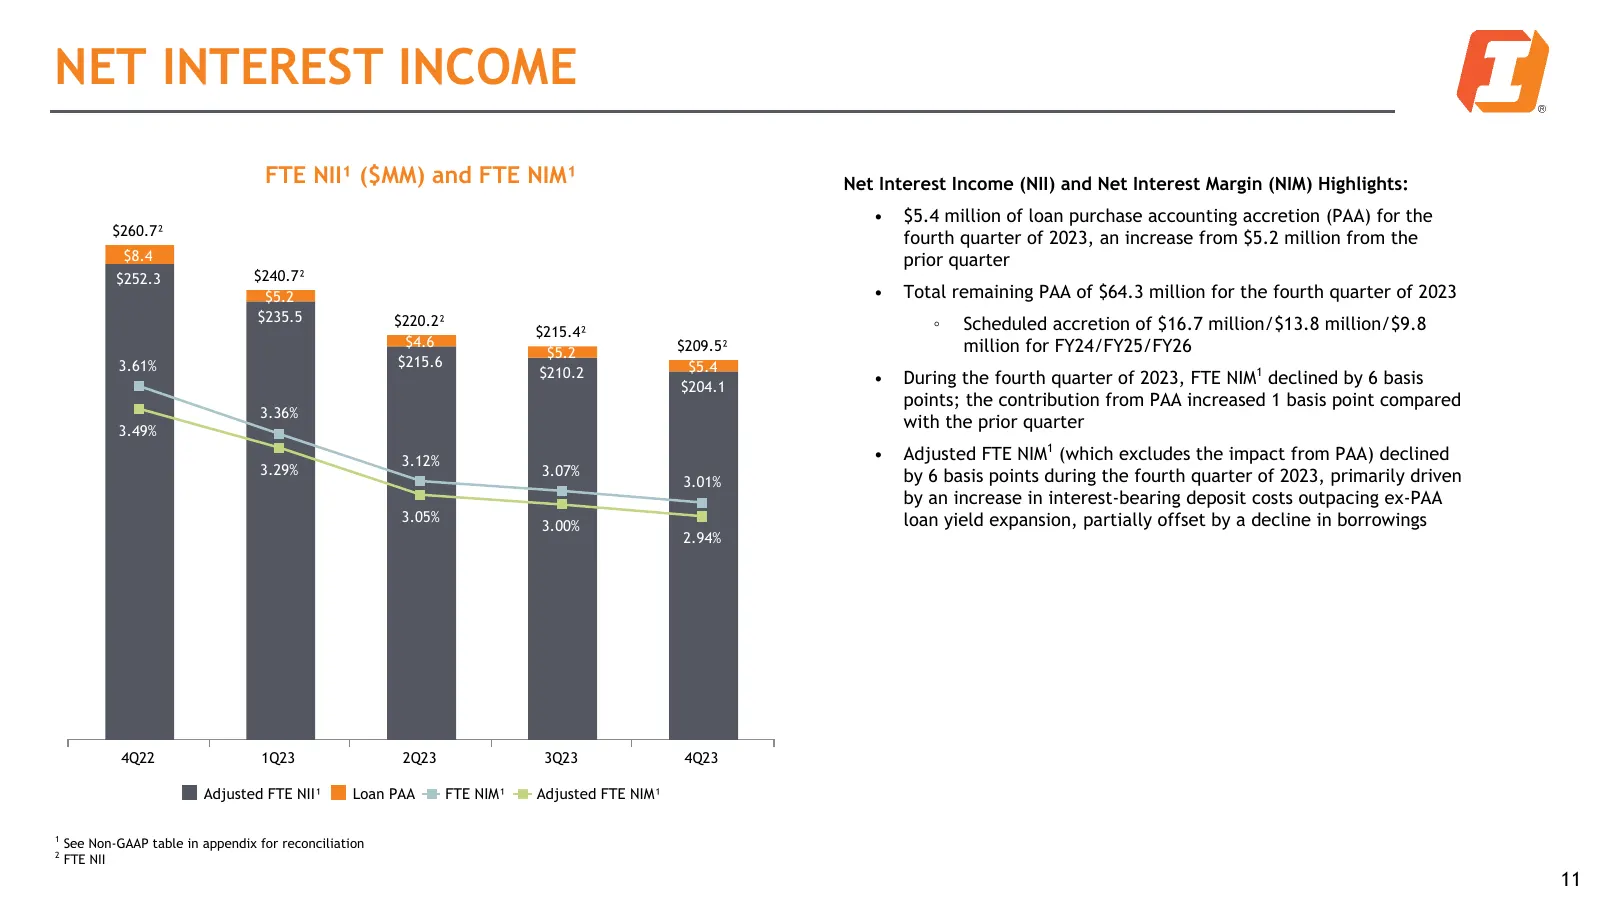
NET INTEREST INCOME FTE NII¹ ($MM) and FTE NIM¹ Net Interest Income (NII) and Net Interest Margin (NIM) Highlights: • $5.4 million of loan purchase accounting accretion (PAA) for the $260.7² fourth quarter of 2023, an increase from $5.2 million from the $8.4 prior quarter $252.3 $240.7² $5.2 • Total
Slide 12: Investment Portfolio
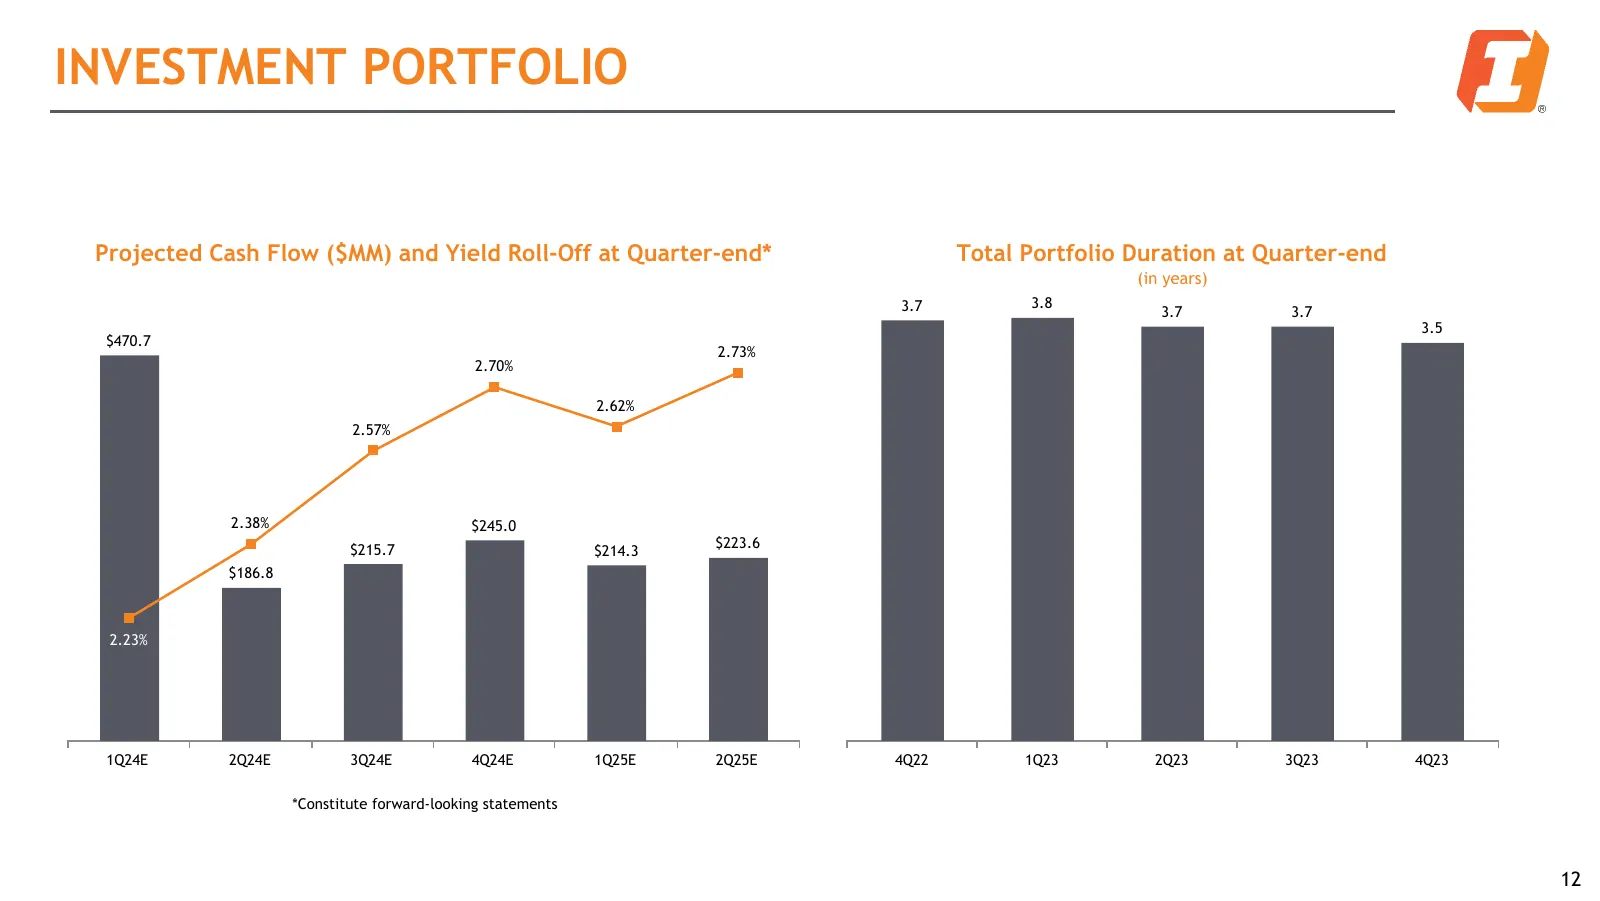
INVESTMENT PORTFOLIO Projected Cash Flow ($MM) and Yield Roll-Off at Quarter-end* Total Portfolio Duration at Quarter-end (in years) 3.7 3.8 3.7 3.7 3.5 $470.7 2.73% 2.70% 2.62% 2.57% 2.38% $245.0 $215.7 $223.6 $214.3 $186.8 2.23% 1Q24E 2Q24E 3Q24E 4Q24E 1Q25E 2Q25E 4Q22 1Q23 2Q23 3Q23 4Q23 *Constit
Slide 13: Non-Interest Income
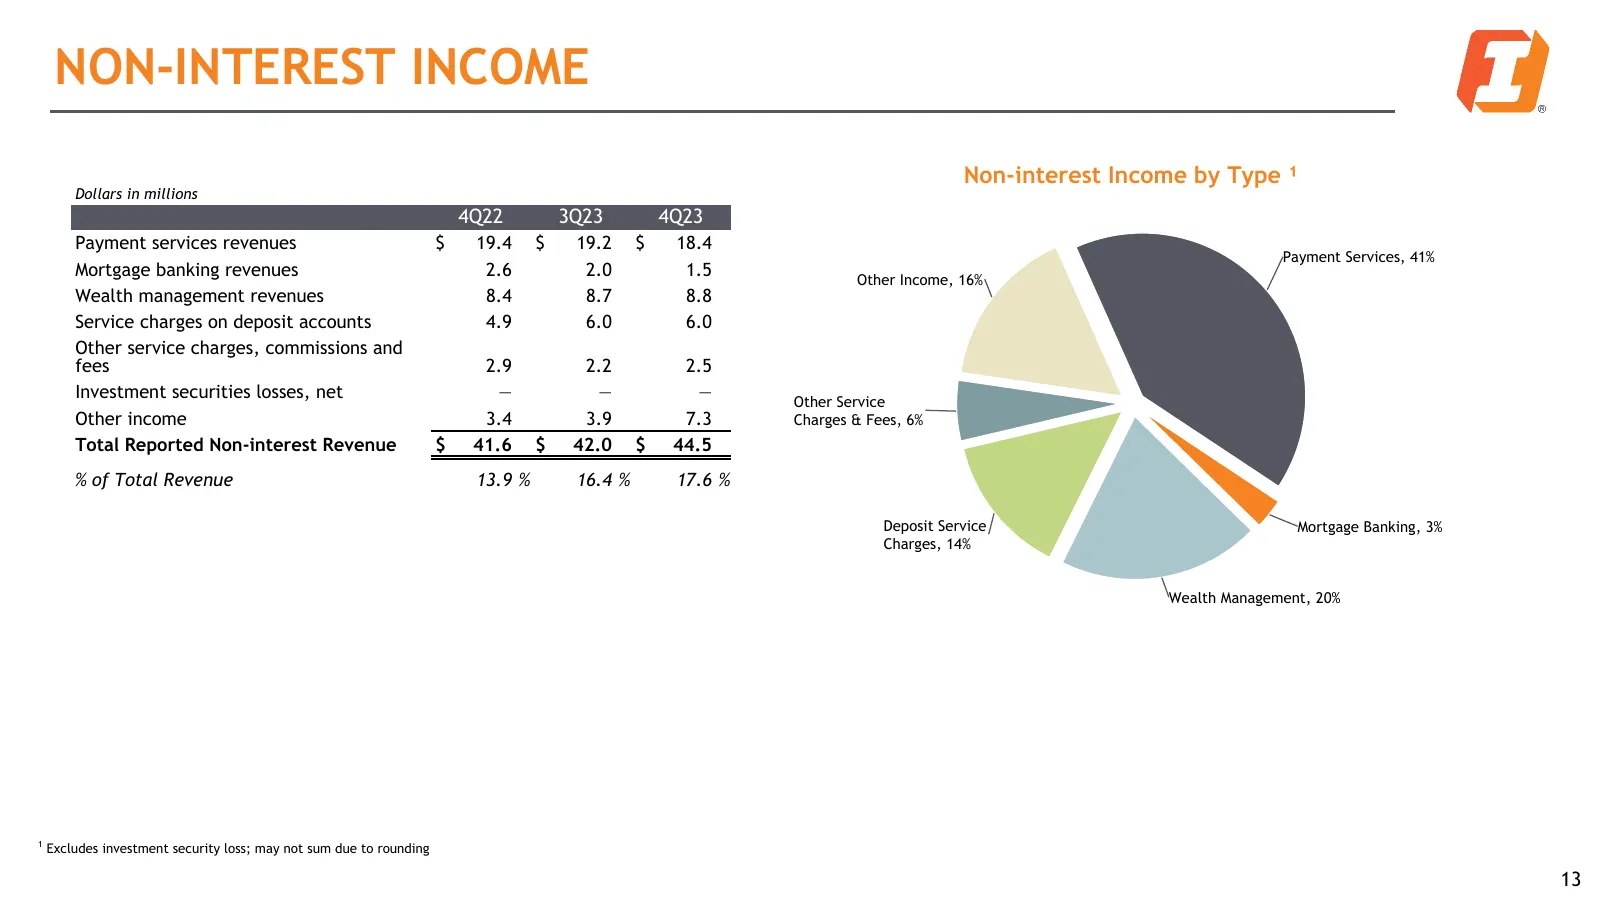
NON-INTEREST INCOME Non-interest Income by Type ¹ Dollars in millions 4Q22 3Q23 4Q23 Payment services revenues $ 19.4 $ 19.2 $ 18.4 Payment Services, 41% Mortgage banking revenues 2.6 2.0 1.5 Other Income, 16% Wealth management revenues 8.4 8.7 8.8 Service charges on deposit accounts 4.9 6.0 6.0 Oth
Slide 14: Non-Interest Expense
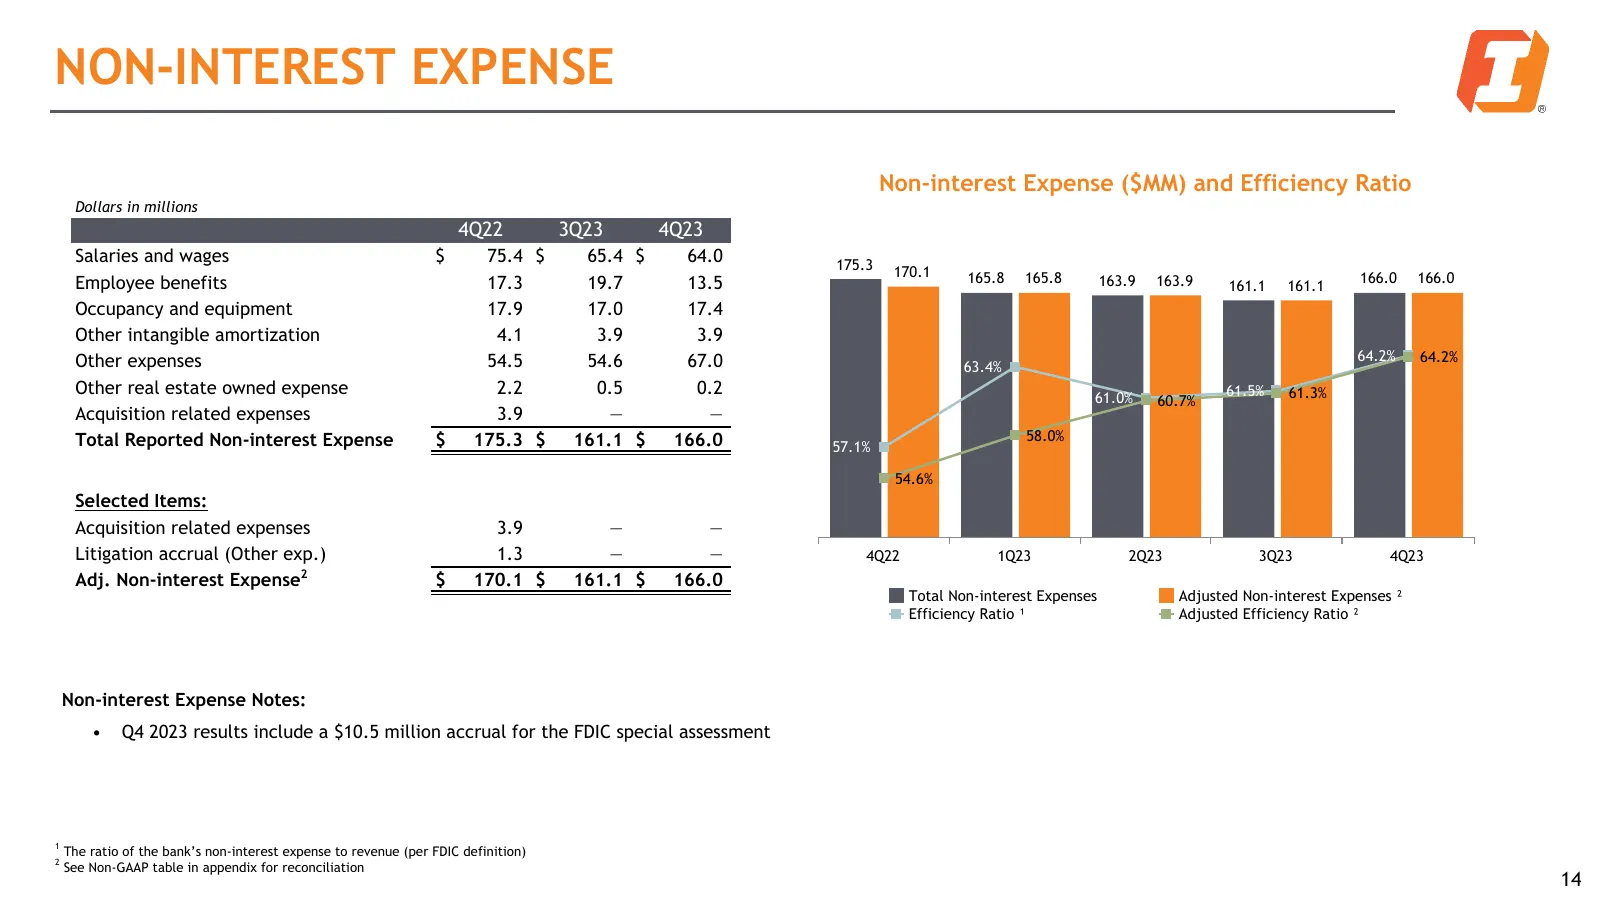
NON-INTEREST EXPENSE Non-interest Expense ($MM) and Efficiency Ratio Dollars in millions 4Q22 3Q23 4Q23 Salaries and wages $ 75.4 $ 65.4 $ 64.0 175.3 170.1 165.8 165.8 166.0 166.0 Employee benefits 17.3 19.7 13.5 163.9 163.9 161.1 161.1 Occupancy and equipment 17.9 17.0 17.4 Other intangible amortiz
Slide 15: 2024 Guidance Summary
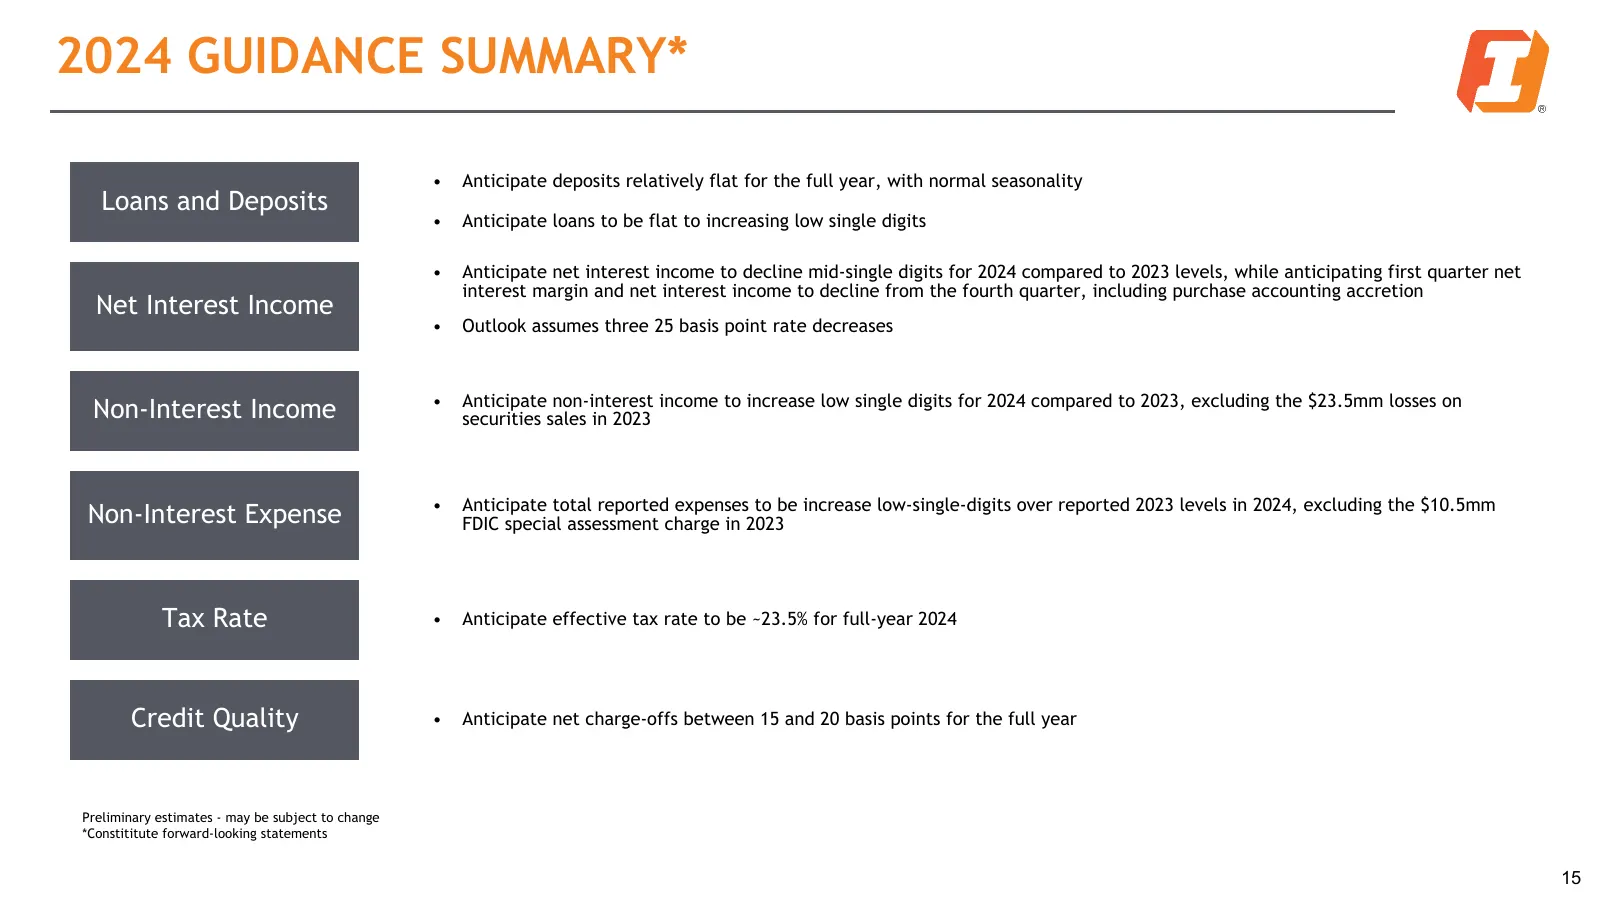
2024 GUIDANCE SUMMARY* • Anticipate deposits relatively flat for the full year, with normal seasonality Loans and Deposits • Anticipate loans to be flat to increasing low single digits • Anticipate net interest income to decline mid-single digits for 2024 compared to 2023 levels, while anticipating
Slide 16: Non-GAAP Financial Measures
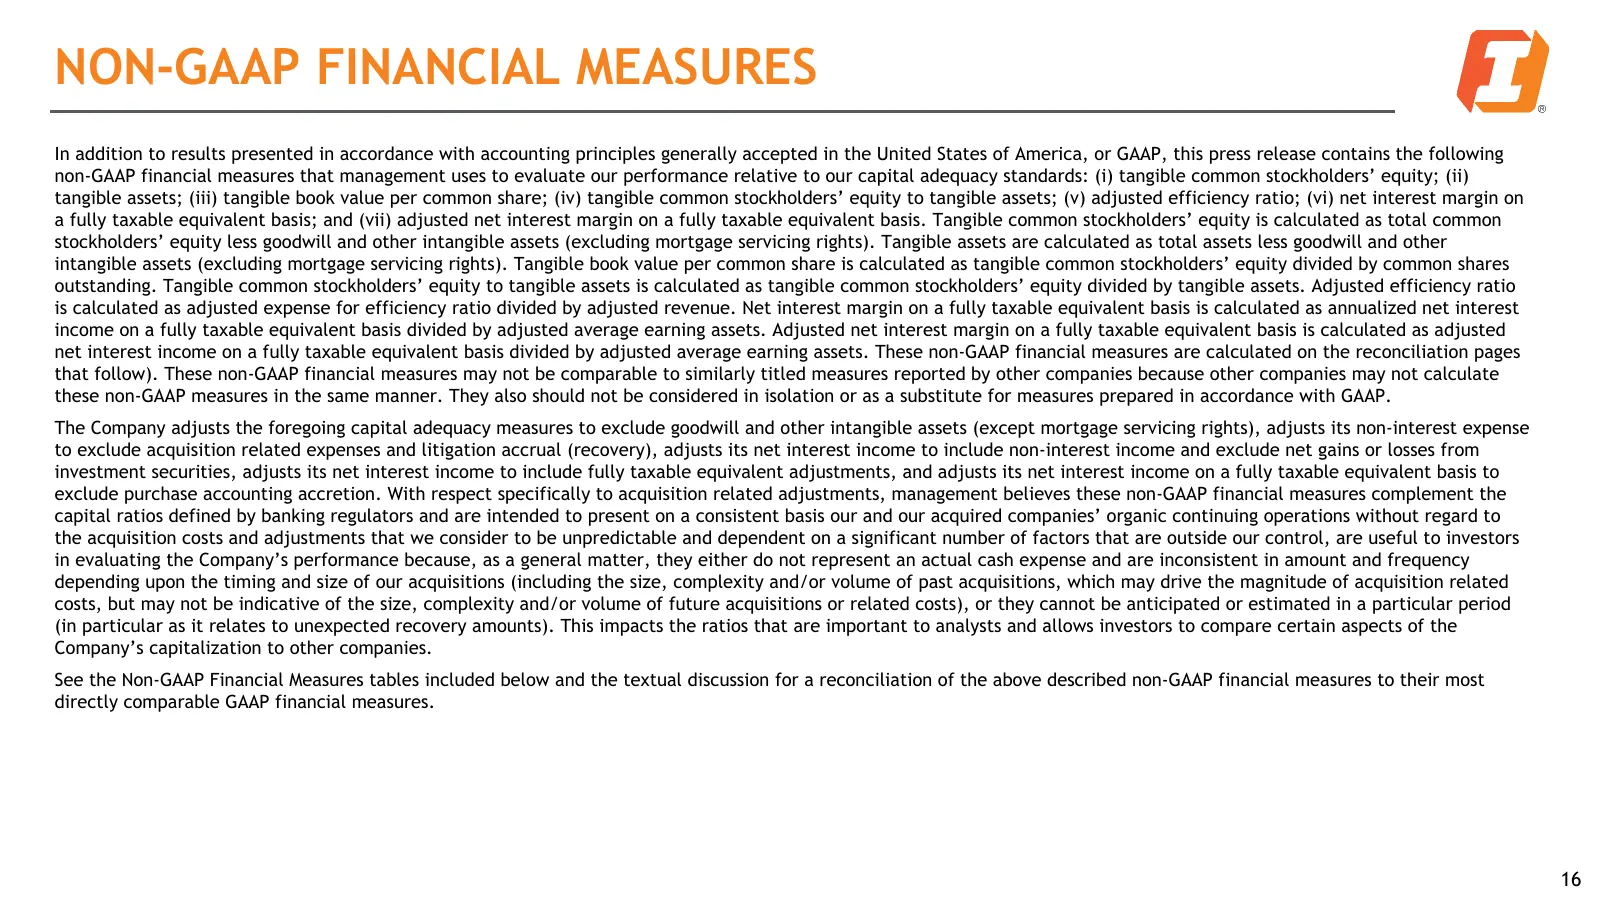
NON-GAAP FINANCIAL MEASURES In addition to results presented in accordance with accounting principles generally accepted in the United States of America, or GAAP, this press release contains the following non-GAAP financial measures that management uses to evaluate our performance relative to our ca
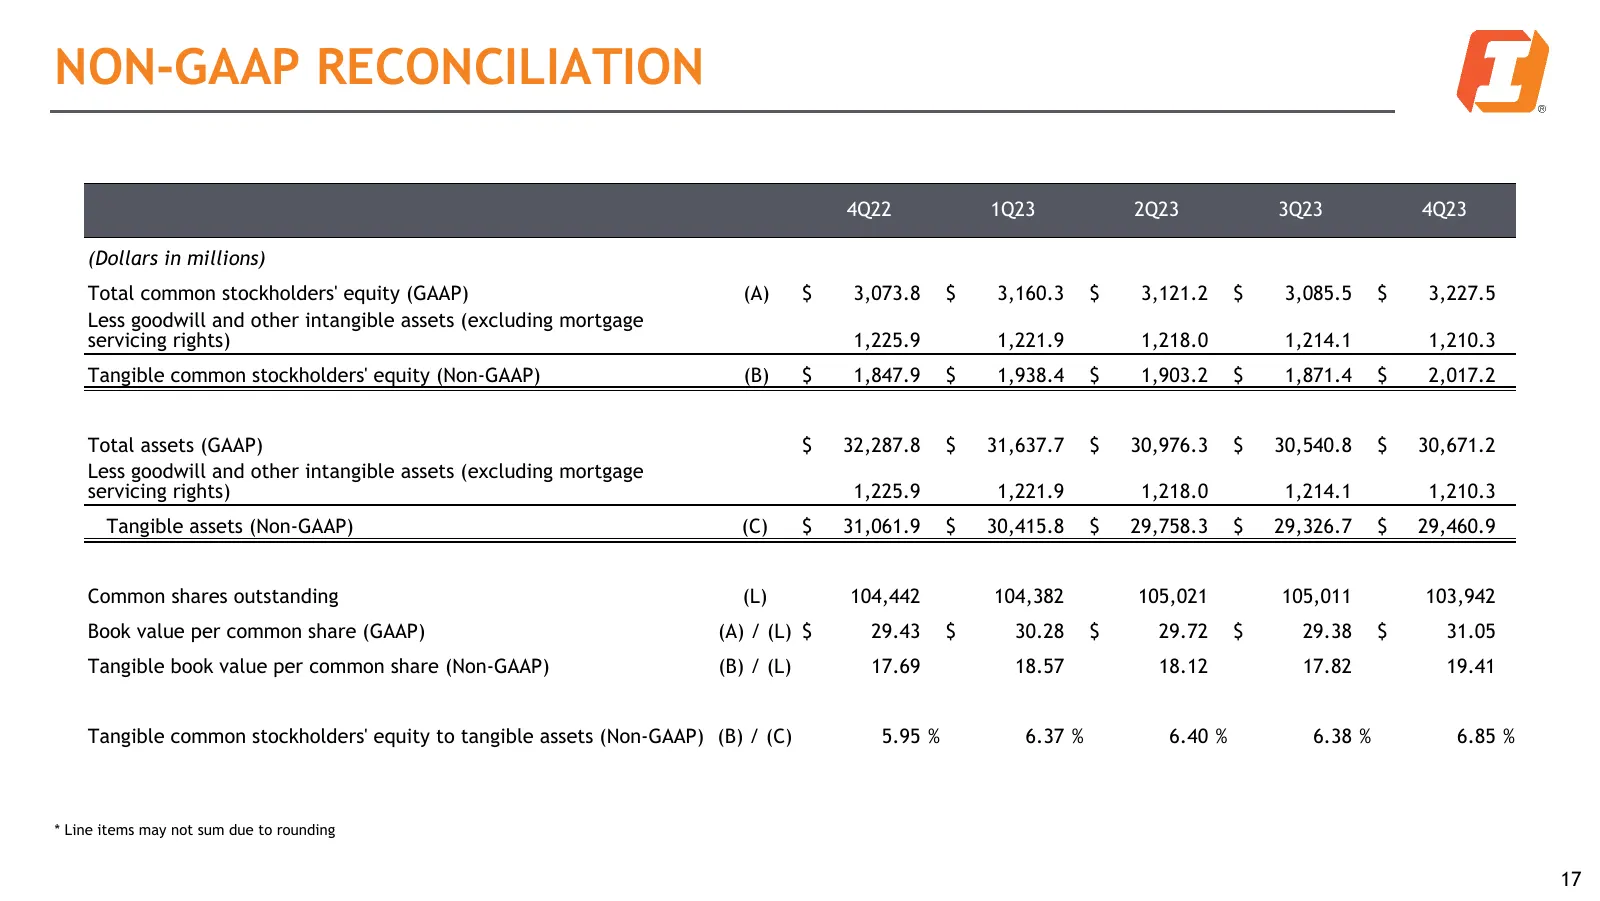
Slide 17: Non-GAAP Reconciliation
NON-GAAP RECONCILIATION 4Q22 1Q23 2Q23 3Q23 4Q23 (Dollars in millions) Total common stockholders' equity (GAAP) (A) $ 3,073.8 $ 3,160.3 $ 3,121.2 $ 3,085.5 $ 3,227.5 Less goodwill and other intangible assets (excluding mortgage servicing rights) 1,225.9 1,221.9 1,218.0 1,214.1 1,210.3 Tangible commo
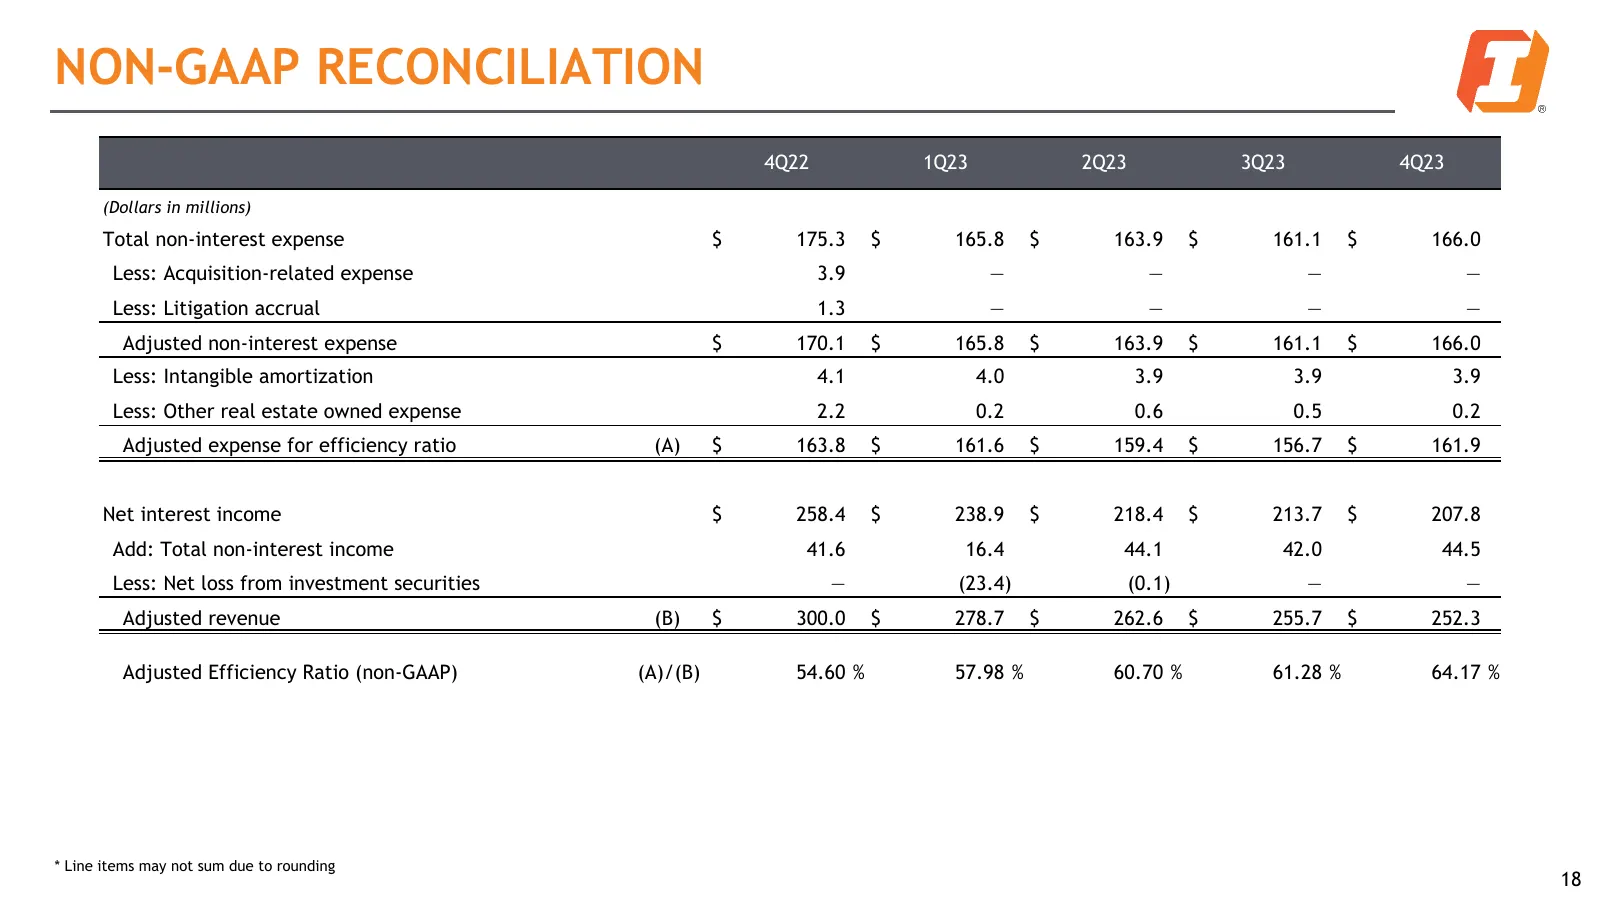
Slide 18: Non-GAAP Reconciliation
NON-GAAP RECONCILIATION 4Q22 1Q23 2Q23 3Q23 4Q23 (Dollars in millions) Total non-interest expense $ 175.3 $ 165.8 $ 163.9 $ 161.1 $ 166.0 Less: Acquisition-related expense 3.9 — — — — Less: Litigation accrual 1.3 — — — — Adjusted non-interest expense $ 170.1 $ 165.8 $ 163.9 $ 161.1 $ 166.0 Less: Int
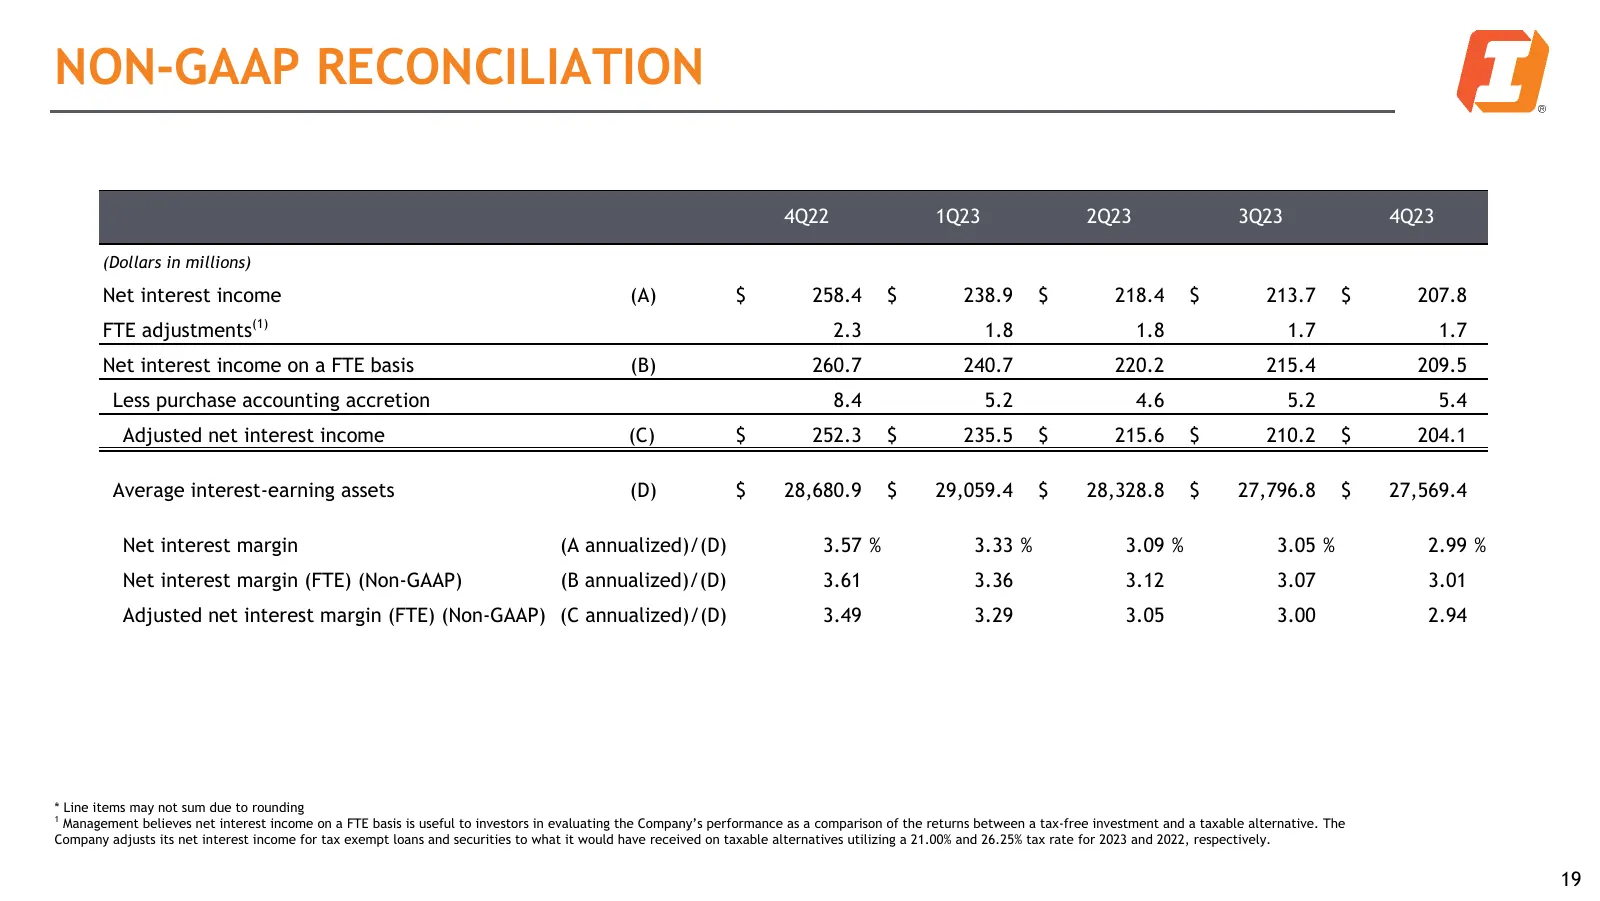
Slide 19: Non-GAAP Reconciliation
NON-GAAP RECONCILIATION 4Q22 1Q23 2Q23 3Q23 4Q23 (Dollars in millions) Net interest income (A) $ 258.4 $ 238.9 $ 218.4 $ 213.7 $ 207.8 FTE adjustments(1) 2.3 1.8 1.8 1.7 1.7 Net interest income on a FTE basis (B) 260.7 240.7 220.2 215.4 209.5 Less purchase accounting accretion 8.4 5.2 4.6 5.2 5.4 Ad
Source: Internet Archive copy of s29.q4cdn.com
More decks from First Interstate BancSystem, Inc.
 Q3 2026 Earnings Presentation21 slides · Oct 22, 2026
 Q2 2026 Earnings Presentation21 slides · Jul 24, 2026
 Q1 2026 Earnings Presentation20 slides · Apr 30, 2026
 Q4 2025 Earnings Presentation21 slides · Jan 29, 2026
 Q3 2025 Earnings Presentation21 slides · Oct 30, 2025
 Q2 2025 Earnings Presentation22 slides · Jul 30, 2025