Sundance Energy — Sundance Energy Australia — Investor Presentation (June 2016)
32 slides from Sundance Energy's investor presentation, Jun 2, 2016
Slide 1: Disclaimers
Disclaimers This presentation has been prepared by Sundance Energy Australia Limited (ABN 76 112 202 883). Summary information This presentation contains summary information about Sundance and its activities current as at 24 May 2016 ("Information"). The Information in this presentation is subject t
Slide 2: Disclaimers (cont'd)
Disclaimers (cont’d) Past performance Past performance information given in this presentation is given for illustrative purposes only and should not be relied upon as (and is not) an indication of the Company’s views on its future financial performance or condition. Investors should note that past p
Slide 3: Disclaimers (cont'd)
Disclaimers (cont’d) The forward-looking statements reflect the Company’s views and assumptions with respect to future events as of the date of this presentation and are subject to a variety of unpredictable risks, uncertainties, and change without notice, as are statements about market and industry
Slide 4: Agenda
1) Executive summary 2) Asset overview 3) Financial overview 4) Appendix 5
Slide 5: Executive summary: Company Overview
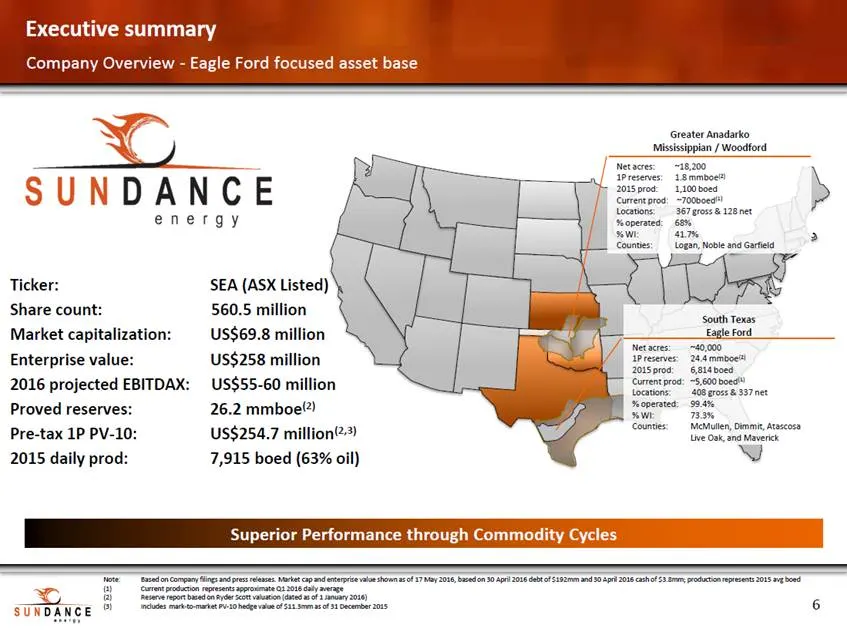
Executive summary Company Overview - Eagle Ford focused asset base Greater Anadarko Mississippian / Woodford Net acres: 1P reserves: 2015 prod: Current prod: Locations: % operated: % WI: Counties: ~18,200 1.8 mmboe(2) 1,100 boed ~700boed(1) 367 gross & 128 net 68% 41.7% Logan, Noble and Garfield Tic
Slide 6: Executive Summary: Equity Raise Overview
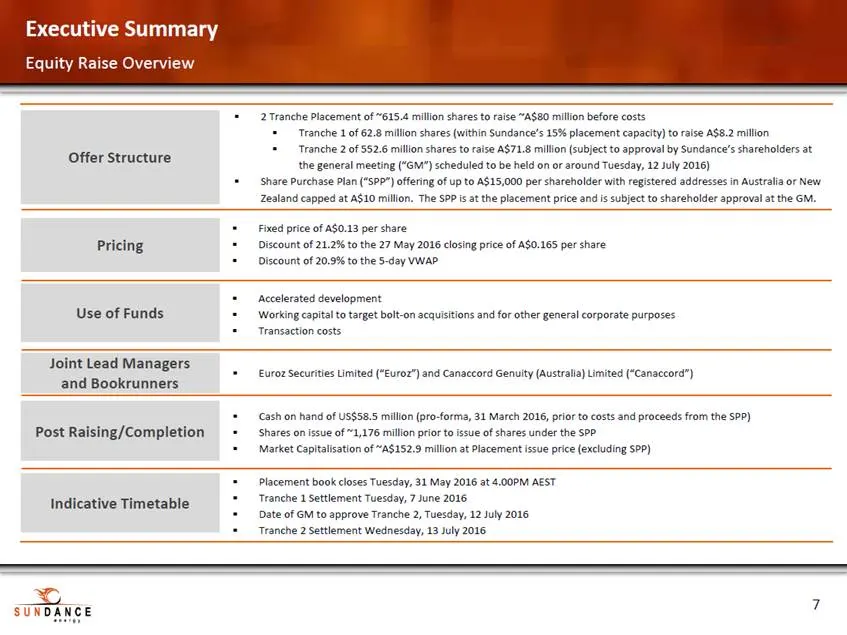
Executive Summary Equity Raise Overview the general meeting (“GM”) scheduled to be held on or around Tuesday, 12 July 2016) Date of GM to approve Tranche 2, Tuesday, 12 July 2016 Tranche 2 Settlement Wednesday, 13 July 2016 7 Offer Structure 2 Tranche Placement of ~615.4 million shares to raise ~A$8
Slide 7: Key investment highlights pro forma for equity raise
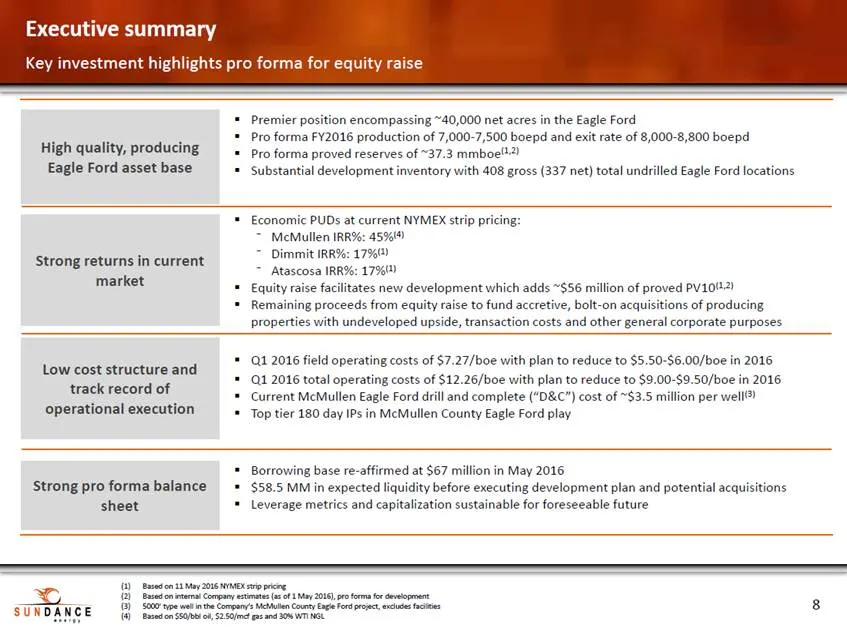
Executive summary Key investment highlights pro forma for equity raise Eagle Ford asset base operational execution (1) (2) (3) (4) Based on 11 May 2016 NYMEX strip pricing Based on internal Company estimates (as of 1 May 2016), pro forma for development 5000’ type well in the Company’s McMullen Coun
Slide 8: Management team
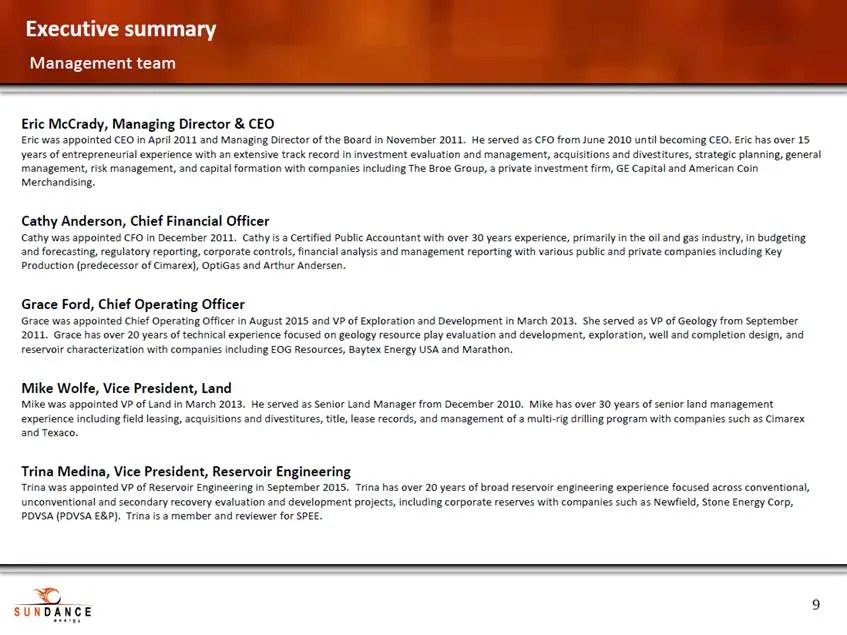
Executive summary Management team Eric McCrady, Managing Director & CEO Eric was appointed CEO in April 2011 and Managing Director of the Board in November 2011. He served as CFO from June 2010 until becoming CEO. Eric has over 15 years of entrepreneurial experience with an extensive track record in
Slide 9: Track Record of Value Creation
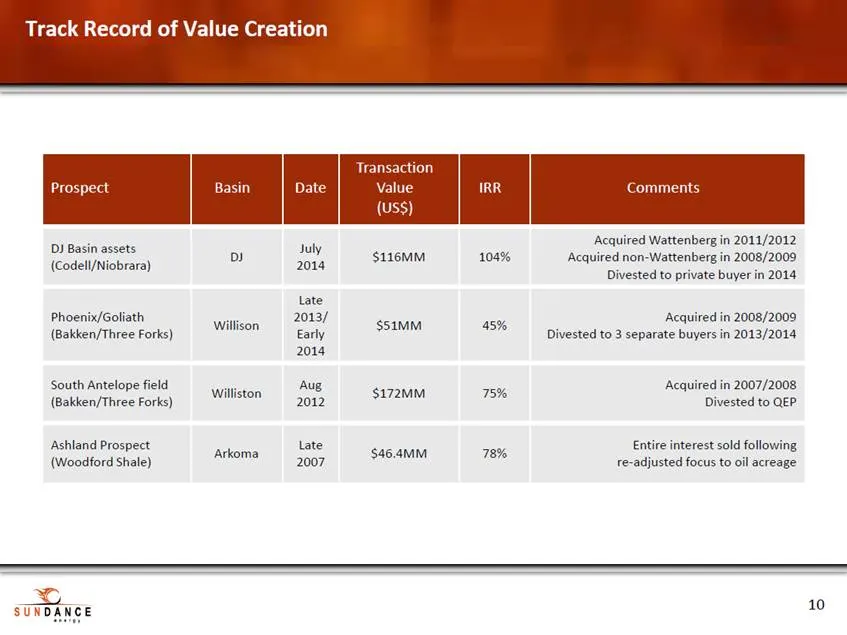
Track Record of Value Creation Acquired non-Wattenberg in 2008/2009 Divested to 3 separate buyers in 2013/2014 Divested to QEP re-adjusted focus to oil acreage 10 Prospect Basin Date Transaction Value (US$) IRR Comments DJ Basin assets (Codell/Niobrara) DJ July 2014 $116MM 104% Acquired Wattenberg i
Slide 10: Agenda
1) Executive summary 2) Asset overview 3) Financial overview 4) Appendix 11
Slide 11: Eagle Ford
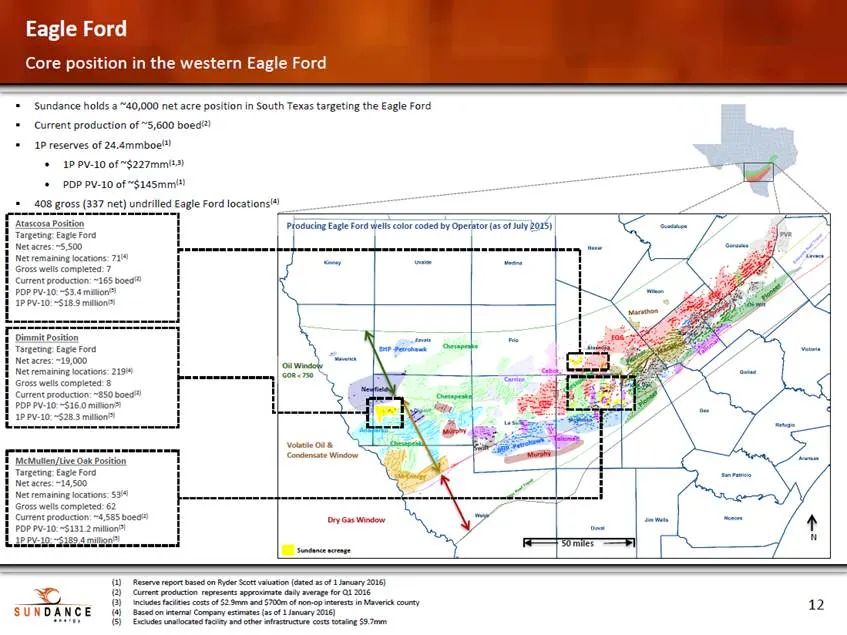
Eagle Ford Core position in the western Eagle Ford Sundance holds a ~40,000 net acre position in South Texas targeting the Eagle Ford Current production of ~5,600 boed(2) 1P reserves of 24.4mmboe(1) •1P PV-10 of ~$227mm(1,3) Targeting: Eagle Ford Oil Window Cabot Newfield Chesapeake Volatile Oil & N
Slide 12: Asset Overview: McMullen, Atascosa and Live Oak Counties
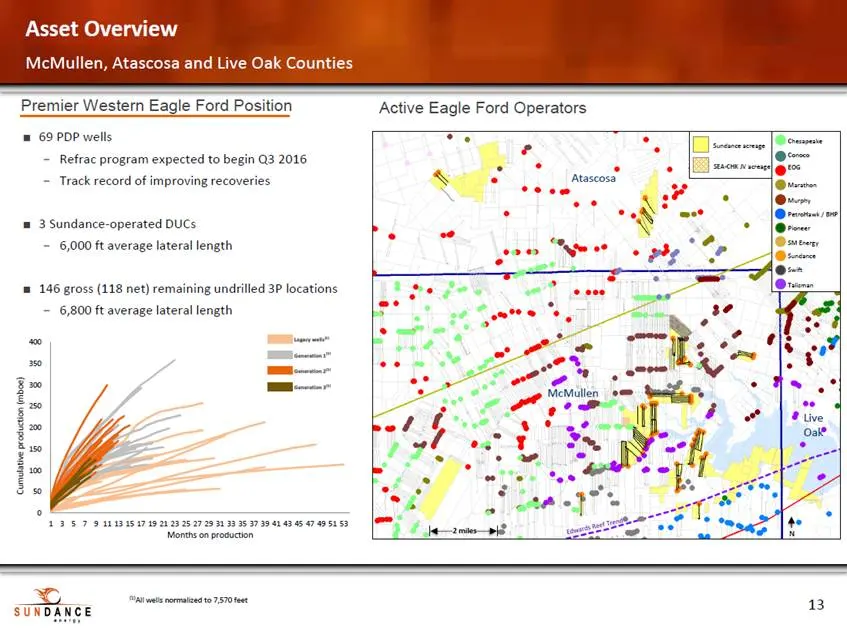
Asset Overview McMullen, Atascosa and Live Oak Counties Premier Western Eagle Ford Position Active Eagle Ford Operators 69 PDP wells Refrac program expected to begin Q3 2016 Track record of improving recoveries Atascosa 3 Sundance-operated DUCs 6,000 ft average lateral length 146 gross (118 net) rem
Slide 13: McMullen County Peer Comparison
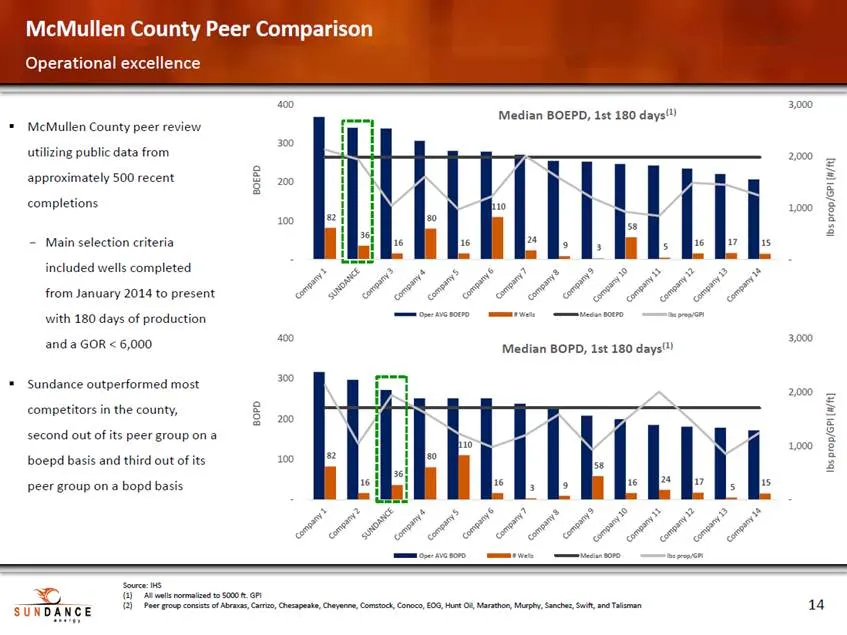
McMullen County Peer Comparison Operational excellence 400 3,000 Median BOEPD, 1st 180 days(1) McMullen County peer review utilizing public data from approximately 500 recent completions 300 2,000 200 1,000 100 Main selection criteria included wells completed from January 2014 to present with 180 da
Slide 14: Eagle Ford – Play Economics McMullen County
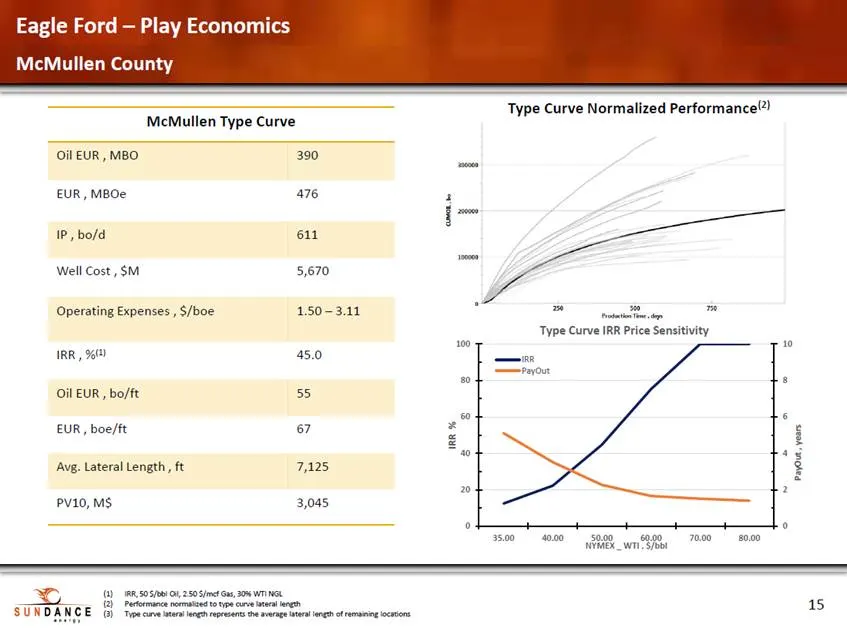
Eagle Ford – Play Economics McMullen County Type Curve Normalized Performance(2) McMullen Type Curve EUR , MBOe 476 Well Cost , $M 5,670 Type Curve IRR Price Sensitivity 100 10 IRR , %(1) 45.0 80 8 60 6 EUR , boe/ft 67 40 4 20 2 PV10, M$ 3,045 0 0 35.00 40.00 50.00 60.00 70.00 80.00 NYMEX _ WTI , $/
Slide 15: Asset Overview Dimmit County
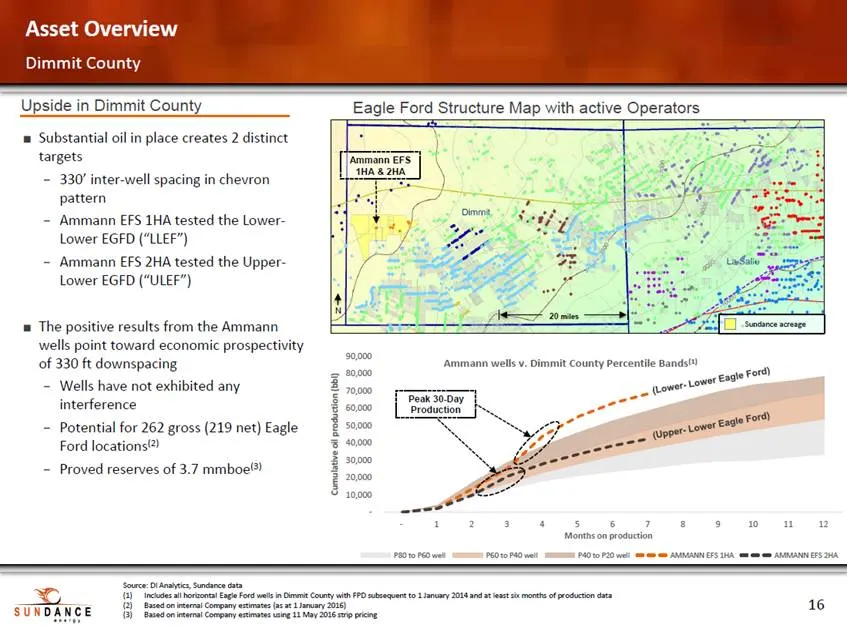
Asset Overview Dimmit County Upside in Dimmit County Eagle Ford Structure Map with active Operators Substantial oil in place creates 2 distinct targets 330’ inter-well spacing in chevron pattern Ammann EFS 1HA tested the Lower-Lower EGFD (“LLEF”) Ammann EFS 2HA tested the Upper-Lower EGFD (“ULEF”) T
Slide 16: Eagle Ford – Play Economics Dimmit County
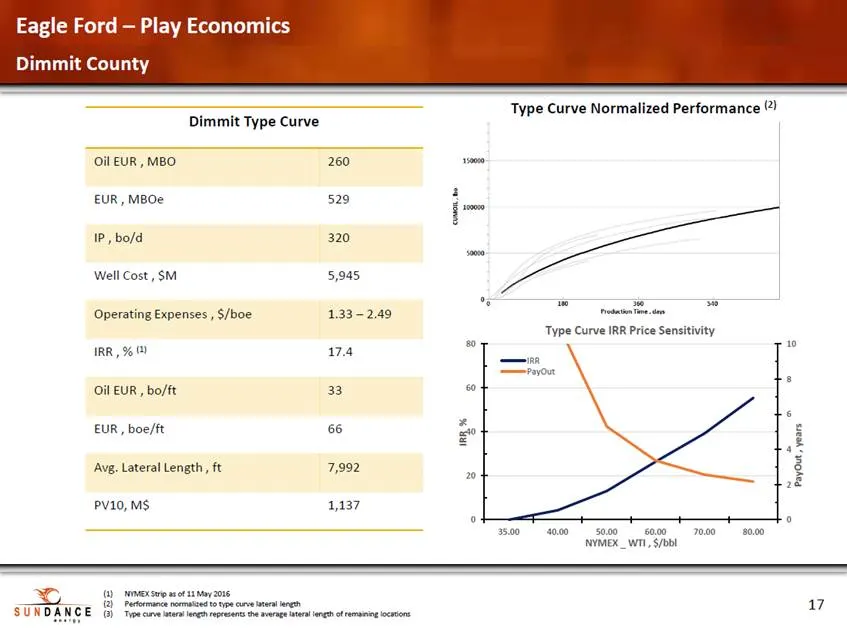
Eagle Ford – Play Economics Dimmit County Type Curve Normalized Performance (2) Dimmit Type Curve EUR , MBOe 529 Well Cost , $M 5,945 Type Curve IRR Price Sensitivity 80 10 IRR , % (1) 17.4 8 60 6 EUR , boe/ft 66 40 4 20 2 PV10, M$ 1,137 0 0 35.00 40.00 50.00 60.00 70.00 80.00 NYMEX _ WTI , $/bbl (1
Slide 17: Agenda
1) Executive summary 2) Asset overview 3) Financial overview 4) Appendix 18
Slide 18: Pro Forma Capitalization
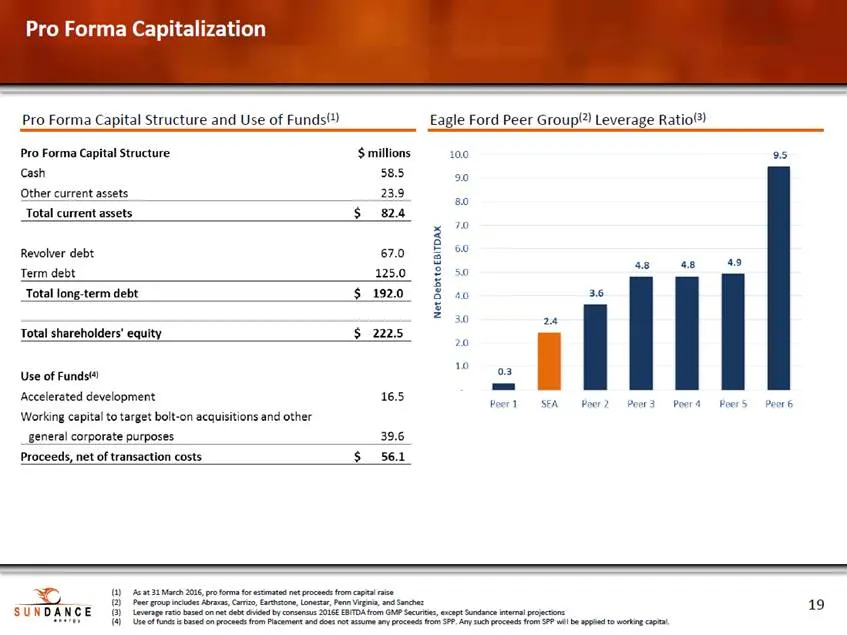
Pro Forma Capitalization Pro Forma Capital Structure and Use of Funds(1) Eagle Ford Peer Group(2) Leverage Ratio(3) (1) (2) (3) (4) As at 31 March 2016, pro forma for estimated net proceeds from capital raise Peer group includes Abraxas, Carrizo, Earthstone, Lonestar, Penn Virginia, and Sanchez Leve
Slide 19: Pro Forma Guidance
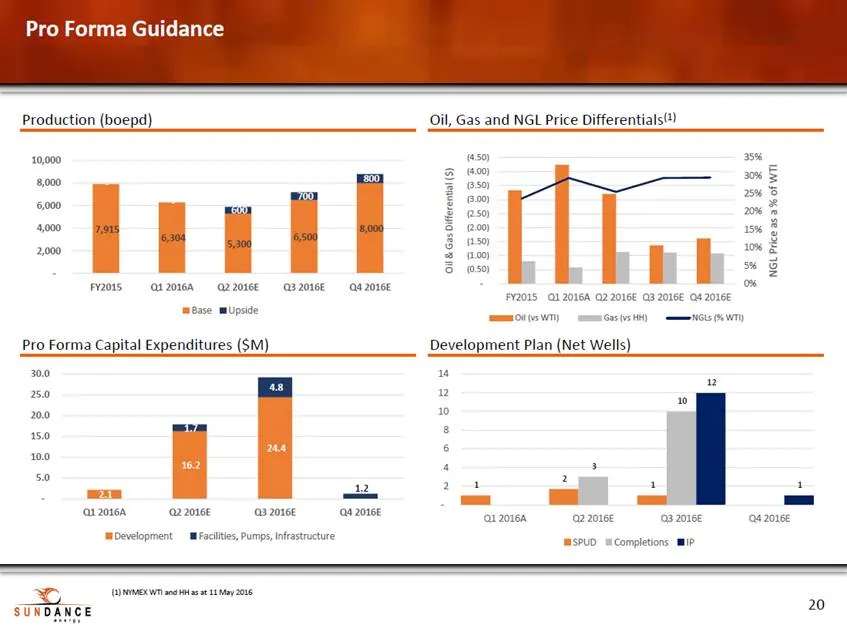
Pro Forma Guidance Production (boepd) Oil, Gas and NGL Price Differentials(1) (4.50) (4.00) (3.50) (3.00) (2.50) (2.00) (1.50) (1.00) (0.50) - 35% 30% 25% 20% 15% 10% 5% 0% 10,000 8,000 6,000 4,000 2,000 - FY2015 Q1 2016A Q2 2016E Q3 2016E Q4 2016E FY2015 Q1 2016A Q2 2016E Q3 2016E Q4 2016E Base Ups
Slide 20: Cost Benchmarking
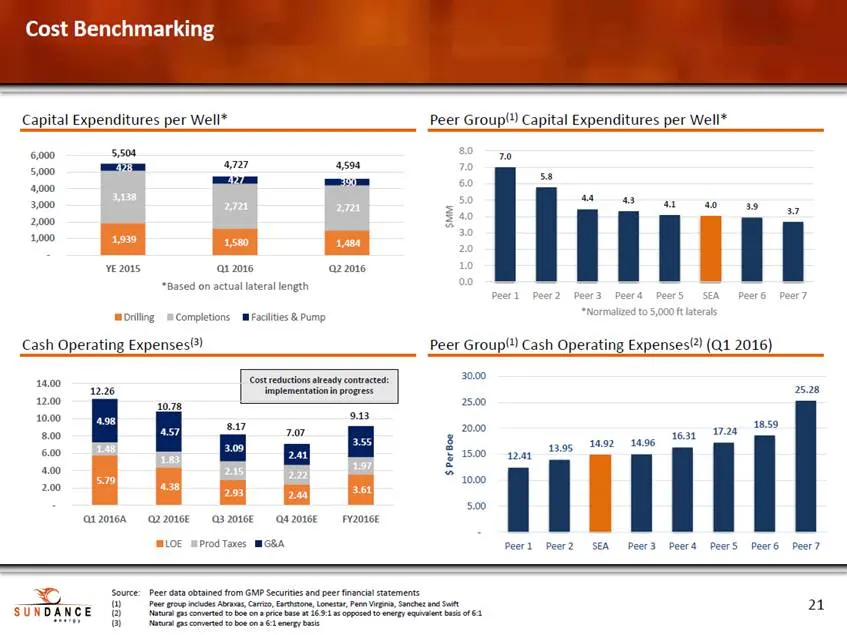
Cost Benchmarking Capital Expenditures per Well* Peer Group(1) Capital Expenditures per Well* 8.0 7.0 6.0 5.0 4.0 3.0 2.0 1.0 0.0 5,504 6,000 5,000 4,000 3,000 2,000 1,000 - 7.0 4,727 4,594 4.4 4.3 4.1 4.0 3.9 3.7 YE 2015 Q1 2016 *Based on actual lateral length Q2 2016 Peer 1Peer 2Peer 3Peer 4Peer 5
Slide 21: Summary
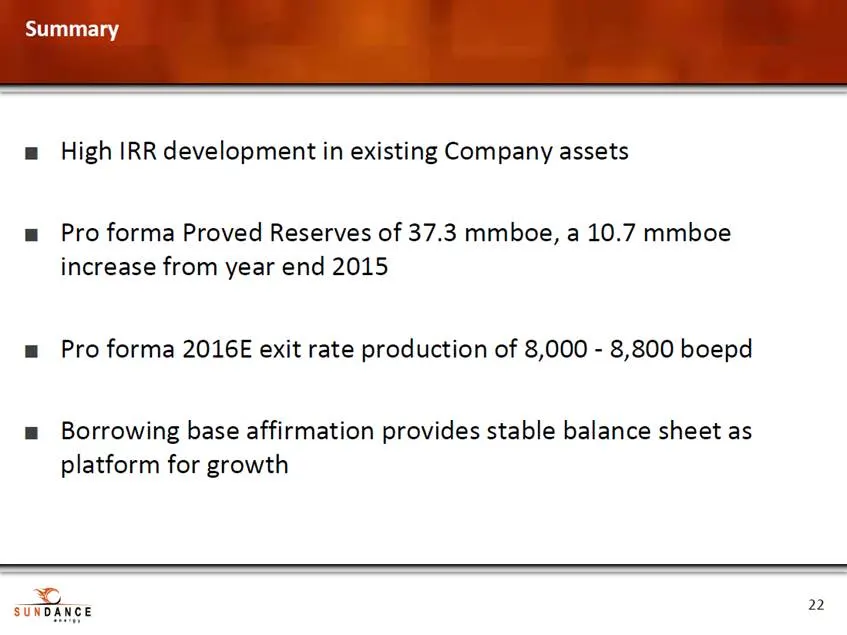
Summary High IRR development in existing Company assets Pro forma Proved Reserves of 37.3 mmboe, a 10.7 mmboe increase from year end 2015 Pro forma 2016E exit rate production of 8,000 - 8,800 boepd Borrowing base affirmation provides stable balance sheet as platform for growth 22
Slide 22: Agenda
1) Executive summary 2) Asset overview 3) Financial overview 4) Appendix 23
Slide 23: Asset overview: Mississippian Lime - Woodford
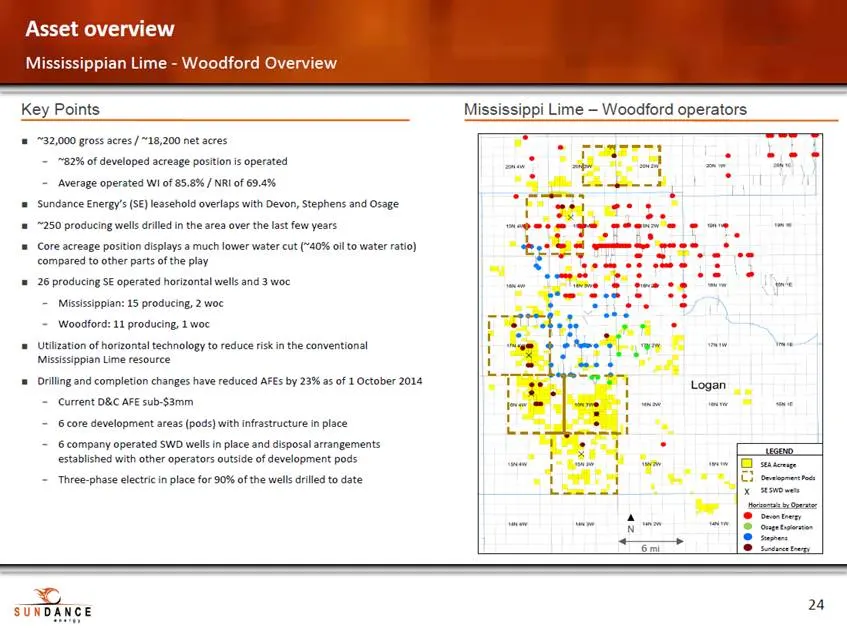
Asset overview Mississippian Lime - Woodford Overview Key Points Mississippi Lime – Woodford operators ~32,000 gross acres / ~18,200 net acres ~82% of developed acreage position is operated Average operated WI of 85.8% / NRI of 69.4% Sundance Energy’s (SE) leasehold overlaps with Devon, Stephens and
Slide 24: Hedge Summary
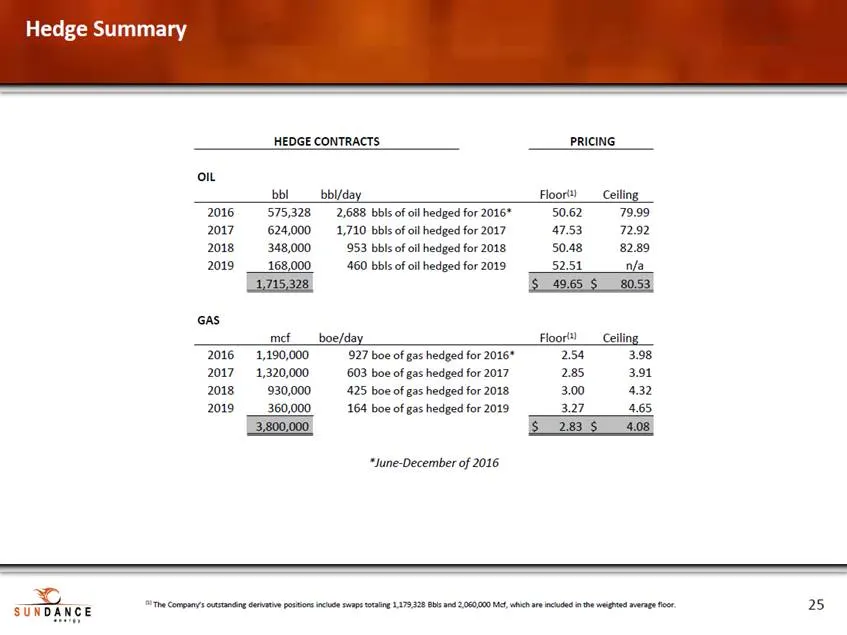
Hedge Summary HEDGE CONTRACTS PRICING OIL bbl bbl/day Floor(1) Ceiling 2016 2017 2018 2019 575,328 624,000 348,000 168,000 2,688 bbls of oil hedged for 2016* 1,710 bbls of oil hedged for 2017 953 bbls of oil hedged for 2018 460 bbls of oil hedged for 2019 50.62 47.53 50.48 52.51 79.99 72.92 82.89 n/
Slide 25: Reserve summary
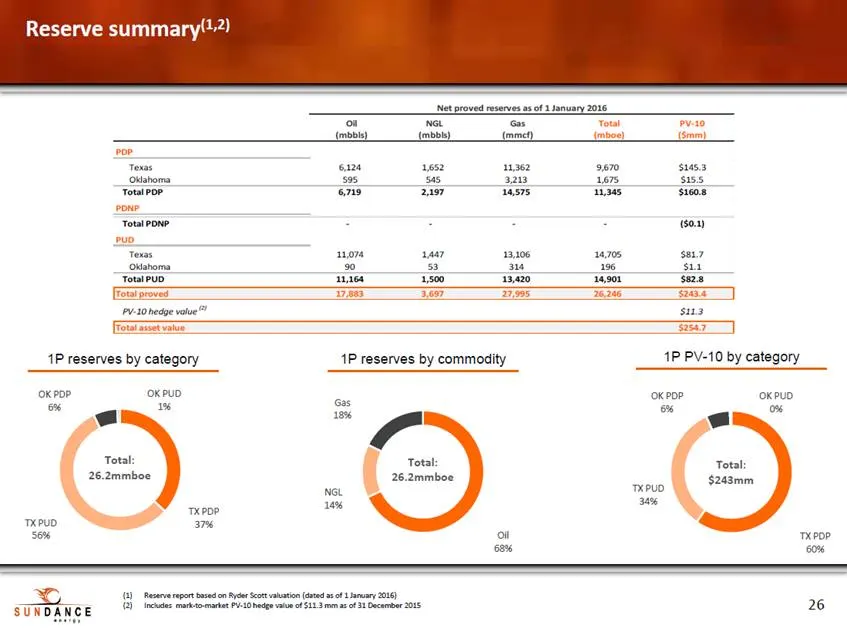
Reserve summary(1,2) Net proved reserves as of 1 January 2016 Oil (mbbls) NGL (mbbls) Gas (mmcf) Total (mboe) PV-10 ($mm) PDP Texas Oklahoma 6,124 595 1,652 545 11,362 3,213 9,670 1,675 $145.3 $15.5 Total PDP PDNP 6,719 2,197 14,575 11,345 $160.8 Total PDNP PUD - - - - ($0.1) Texas Oklahoma 11,074 9
Slide 26: Definitions
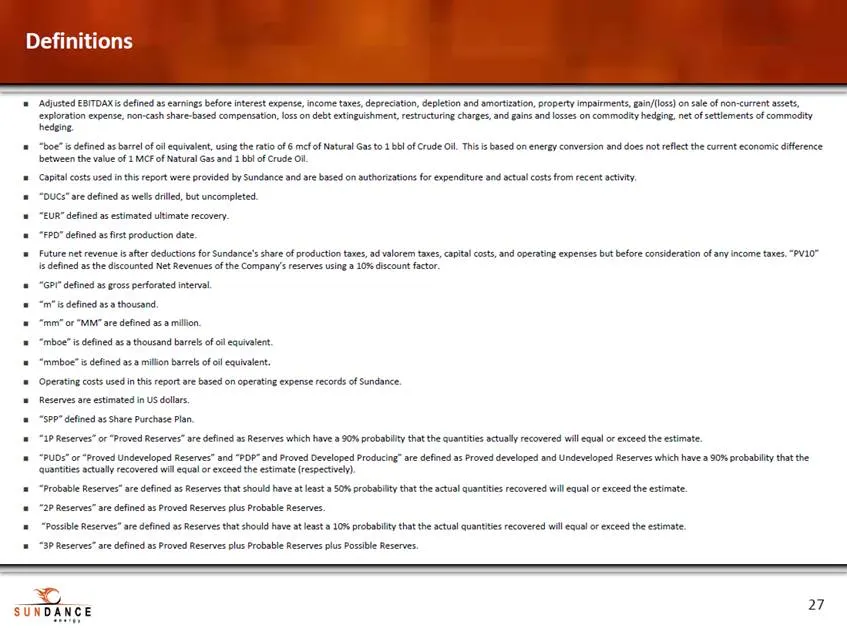
Definitions Adjusted EBITDAX is defined as earnings before interest expense, income taxes, depreciation, depletion and amortization, property impairments, gain/(loss) on sale of non-current assets, exploration expense, non-cash share-based compensation, loss on debt extinguishment, restructuring cha
Slide 27: International Offer Restrictions
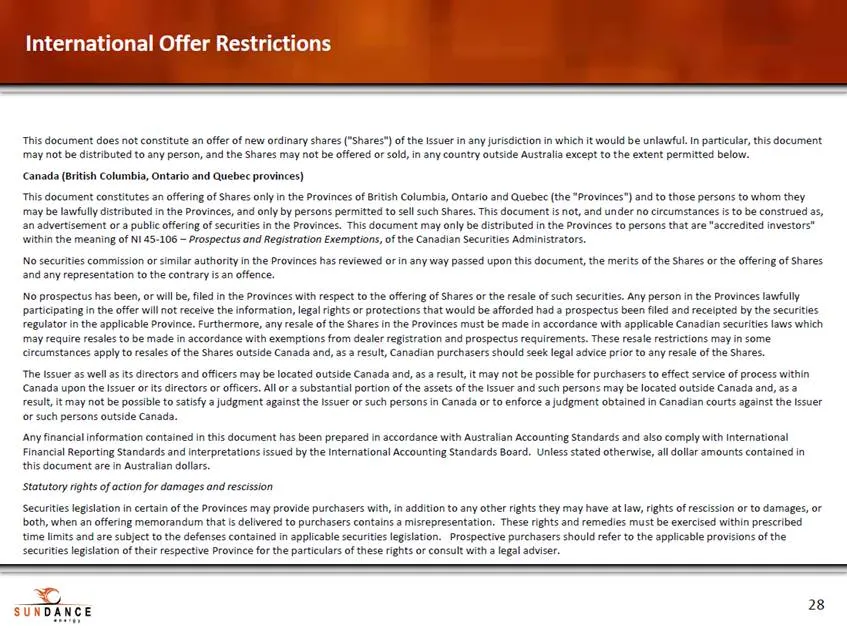
International Offer Restrictions This document does not constitute an offer of new ordinary shares ("Shares") of the Issuer in any jurisdiction in which it would b e unlawful. In particular, this document may not be distributed to any person, and the Shares may not be offered or sold, in any country
Slide 28: International Offer Restrictions (cont'd)
International Offer Restrictions (cont’d) The following is a summary of the statutory rights of rescission or to damages, or both, available to purchasers in Ontario. In Ontario, every purchaser of the Shares purchased pursuant to this document (other than (a) a "Canadian financial institution" or a
Slide 29: International Offer Restrictions (cont'd)
International Offer Restrictions (cont’d) Hong Kong WARNING: This document has not been, and will not be, registered as a prospectus under the Companies (Winding Up and Miscellaneous Provisions) Ordinance (Cap. 32) of Hong Kong, nor has it been authorised by the Securities and Futures Commission in
Slide 30: International Offer Restrictions (cont'd)
International Offer Restrictions (cont’d) Singapore This document and any other materials relating to the Shares have not been, and will not be, lodged or registered as a prospe ctus in Singapore with the Monetary Authority of Singapore. Accordingly, this document and any other document or materials
Slide 31: International Offer Restrictions (cont'd)
International Offer Restrictions (cont’d) United Kingdom Neither the information in this document nor any other document relating to the offer has been delivered for approval to the Financial Conduct Authority in the United Kingdom and no prospectus (within the meaning of section 85 of the Financial
Slide 32: International Offer Restrictions (cont'd)
International Offer Restrictions (cont’d) United Kingdom Nelther the information in this document nor any other document relating to the offer has been delivered for approval to the Financial Conduct Authority in the United {Kingdom and no prospectus (within the meaning of section 85 of the Financia
Source: SEC EDGAR · 6-K filed Jun 2, 2016
More decks from Sundance Energy Inc
 Investor Presentation (February 2020)25 slides · Feb 10, 2020
 Sundance Energy Australia — Q3 2019 Earnings Presentation24 slides · Nov 18, 2019
 Sundance Energy Australia — Q2 2019 Earnings Presentation25 slides · Aug 16, 2019
 Sundance Energy Australia — Investor Presentation (July 2019)19 slides · Jul 24, 2019
 Sundance Energy Australia — Investor Presentation (June 2019)16 slides · Jun 3, 2019
 Sundance Energy Australia — Q1 2019 Earnings Presentation17 slides · May 21, 2019