NuStar Energy LP — 2021 Citi One-on-One Midstream/Energy Infrastructure Conference
71 slides from NuStar Energy LP's conference presentation, Aug 18, 2021
Slide 1: 2021 Citi One-on-One Midstream/Energy Infrastructure Conference
North Beach Corpus Christi, TX 1 2021 Citi One-on-One Midstream/Energy Infrastructure Conference August 18-19, 2021
Slide 2: Forward-Looking Statements
2 Forward-Looking Statements Statements contained in this presentation other than statements of historical fact are forward-looking statements. While these forward-looking statements, and any assumptions upon which they are based, are made in good faith and reflect our current judgment regarding the
Slide 3: Introduction
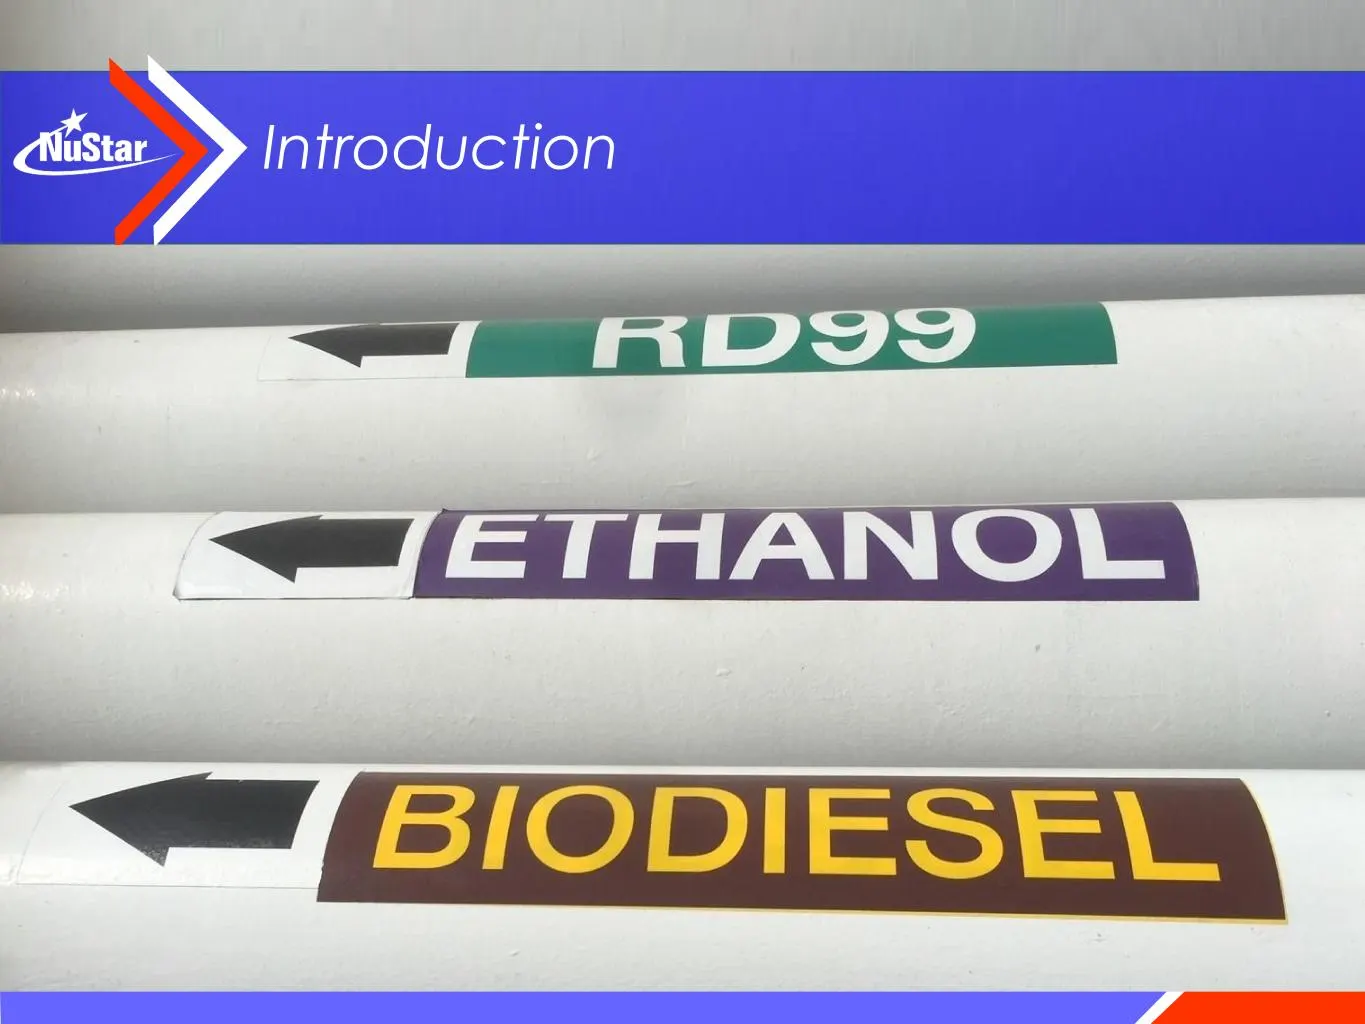
West Coast Renewable Fuel Network 3 Introduction
Slide 4: 2021 Strategic Priorities
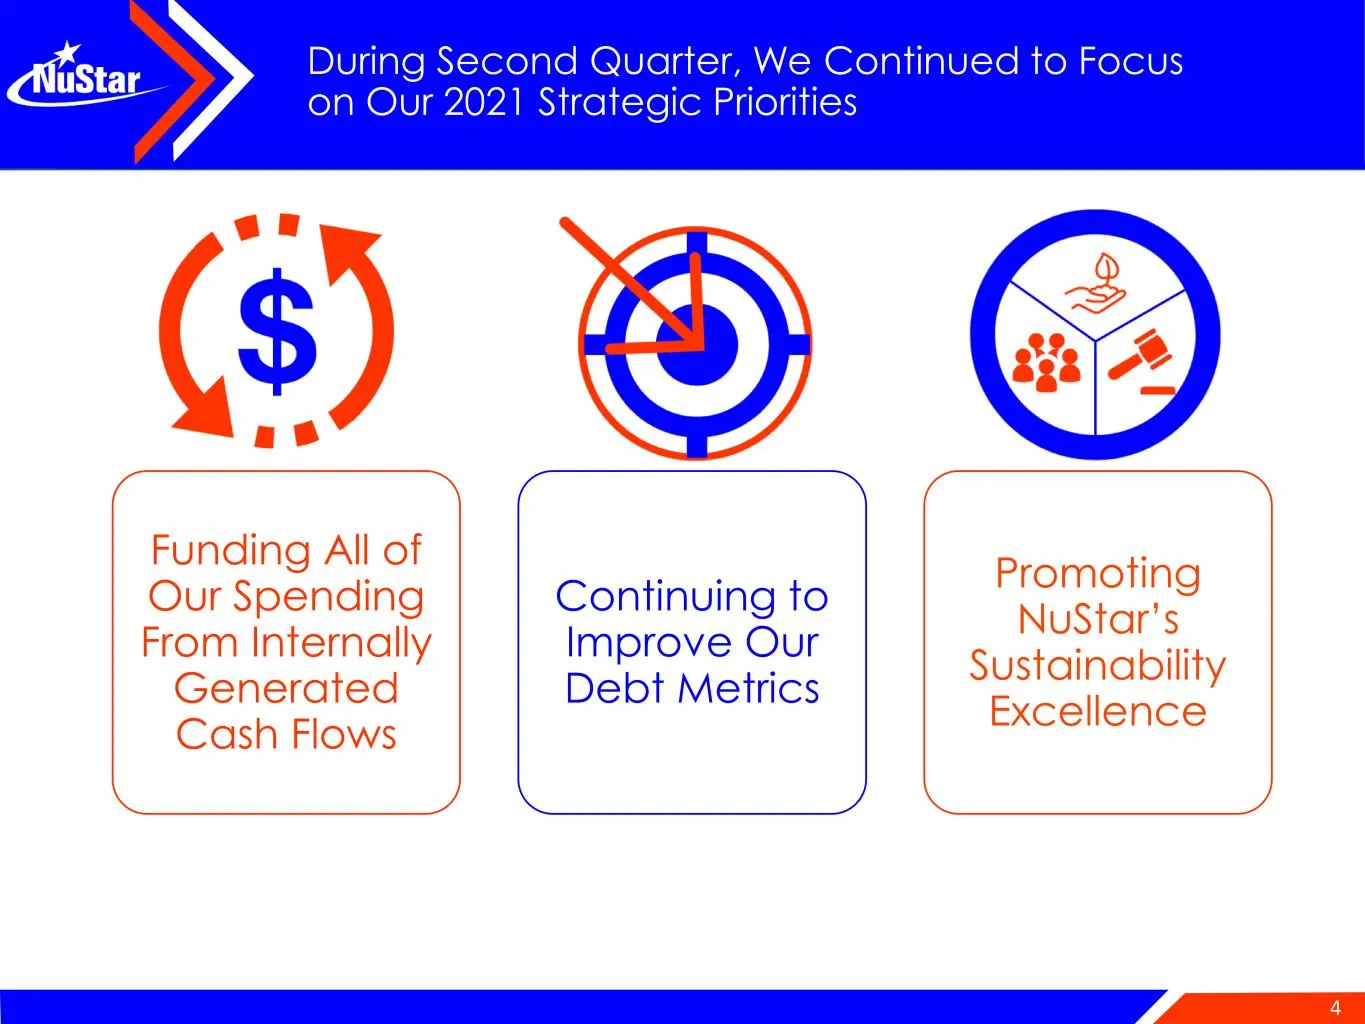
4 During Second Quarter, We Continued to Focus on Our 2021 Strategic Priorities Funding All of Our Spending From Internally Generated Cash Flows Continuing to Improve Our Debt Metrics Promoting NuStar’s Sustainability Excellence
Slide 5: Strong Second Quarter 2021 Results
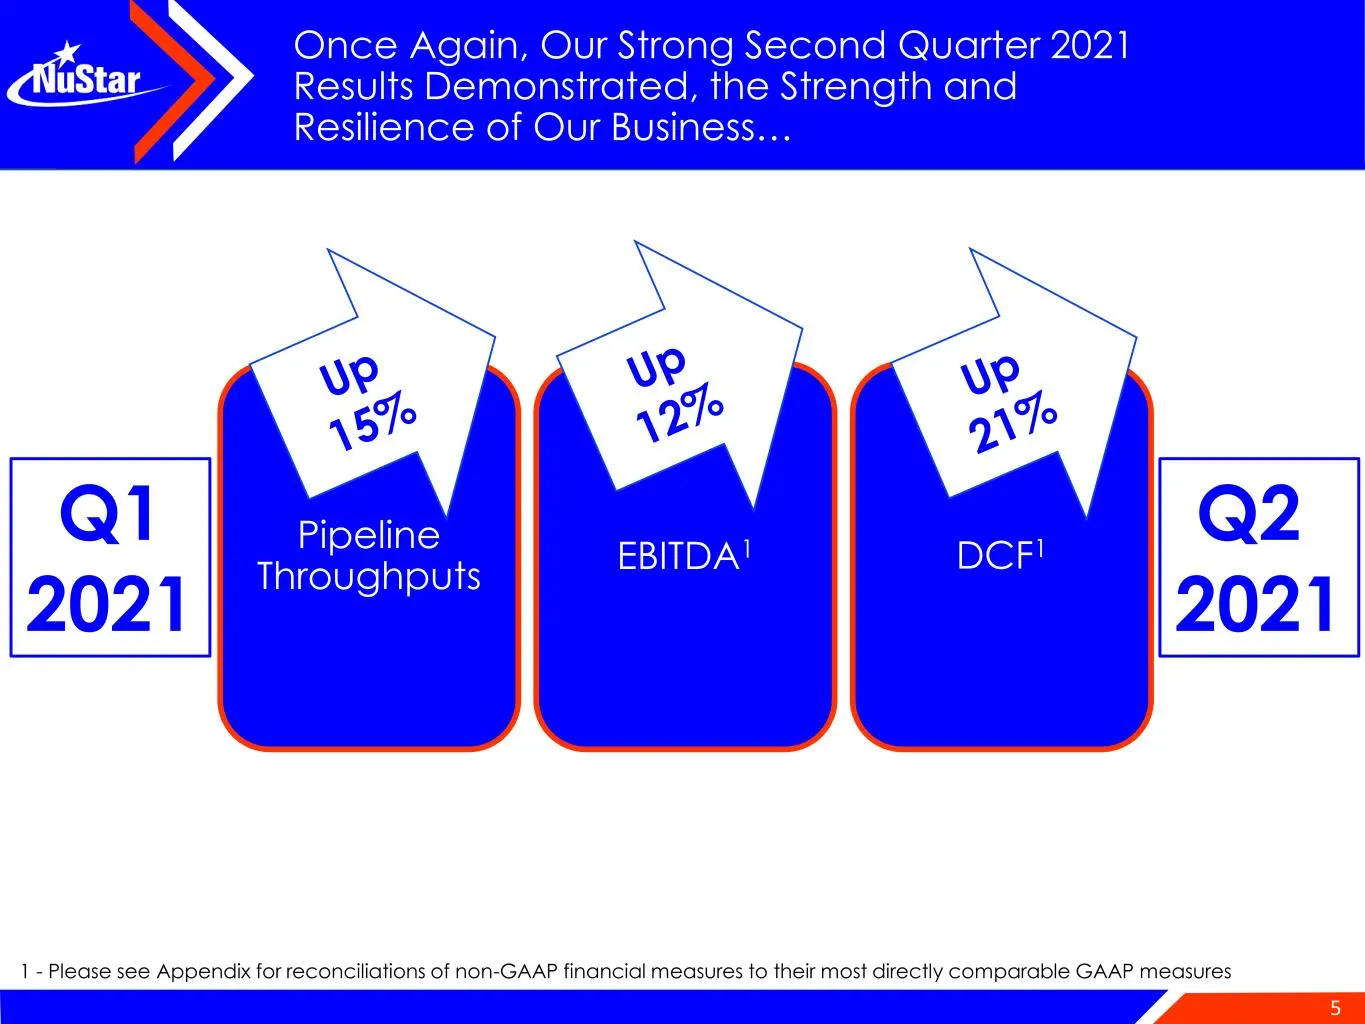
5 Once Again, Our Strong Second Quarter 2021 Results Demonstrated, the Strength and Resilience of Our Business… 1 - Please see Appendix for reconciliations of non-GAAP financial measures to their most directly comparable GAAP measures Pipeline Throughputs EBITDA1 DCF1 Q2 2021 Q1 2021
Slide 6: Asset Sale Strengthens Balance Sheet
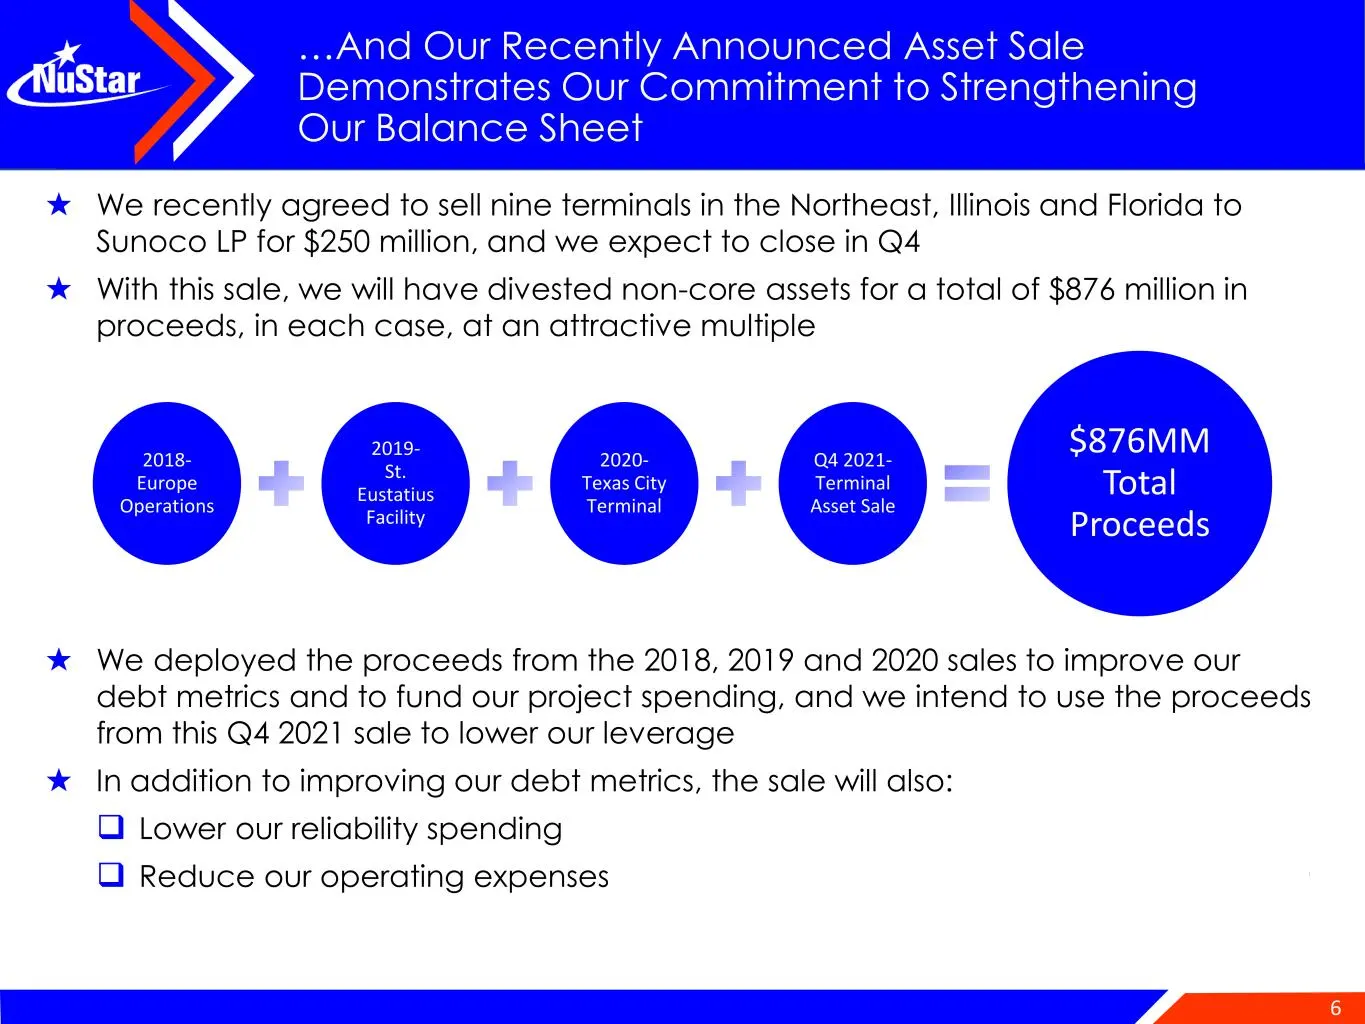
6 …And Our Recently Announced Asset Sale Demonstrates Our Commitment to Strengthening Our Balance Sheet ★ We recently agreed to sell nine terminals in the Northeast, Illinois and Florida to Sunoco LP for $250 million, and we expect to close in Q4 ★ With this sale, we will have divested non-core asse
Slide 7: Full-Year 2021 Expectations
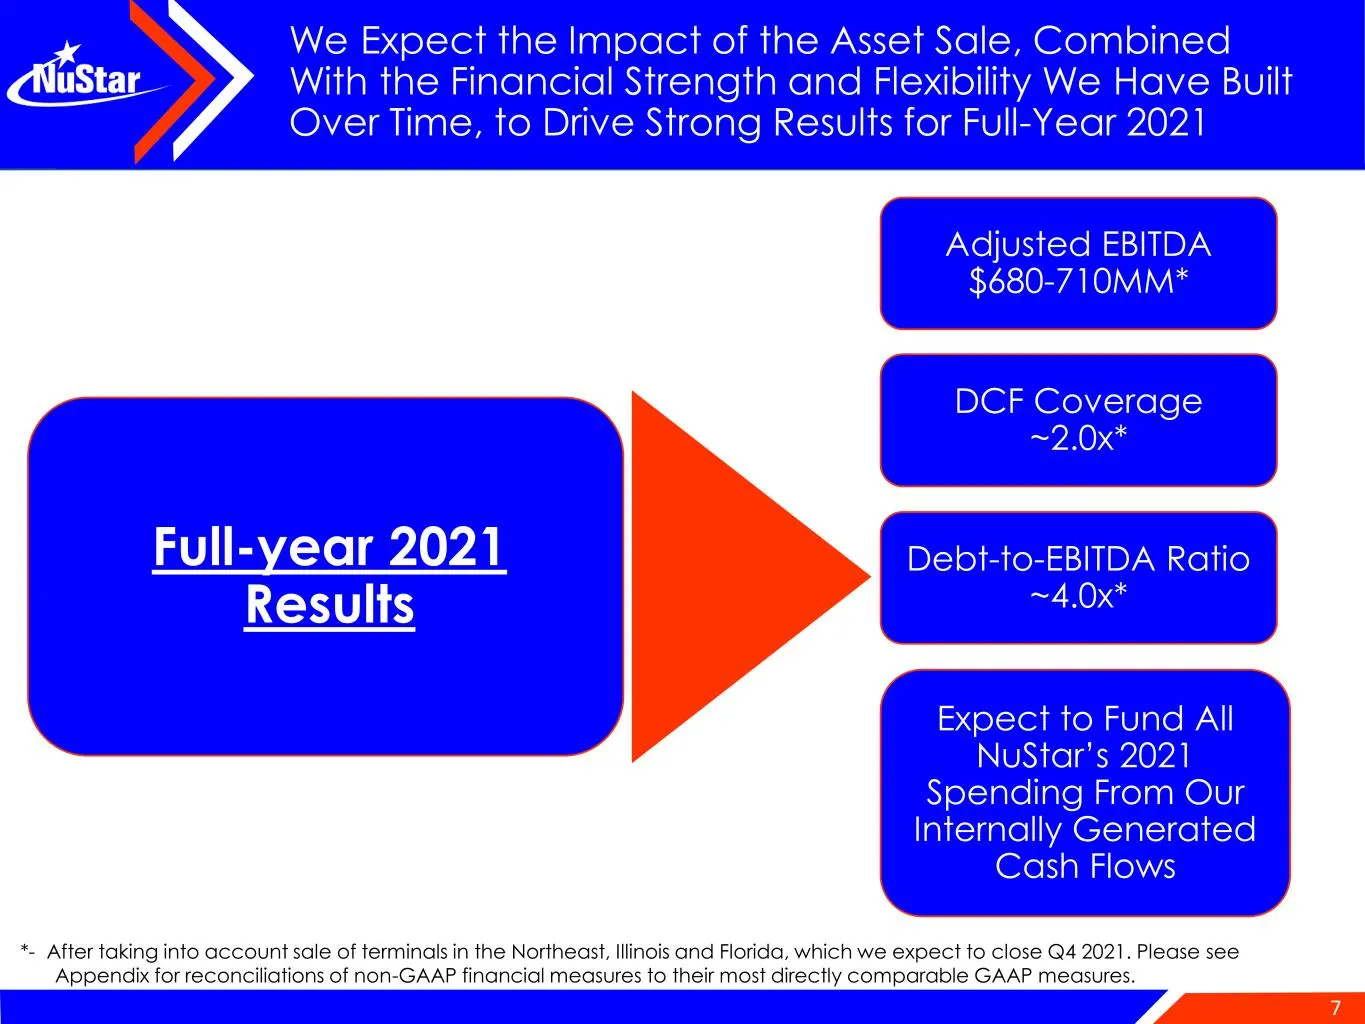
7 We Expect the Impact of the Asset Sale, Combined With the Financial Strength and Flexibility We Have Built Over Time, to Drive Strong Results for Full-Year 2021 Full-year 2021 Results Adjusted EBITDA $680-710MM* Expect to Fund All NuStar’s 2021 Spending From Our Internally Generated Cash Flows *-
Slide 8: Focus on Core Strategic Asset Footprint
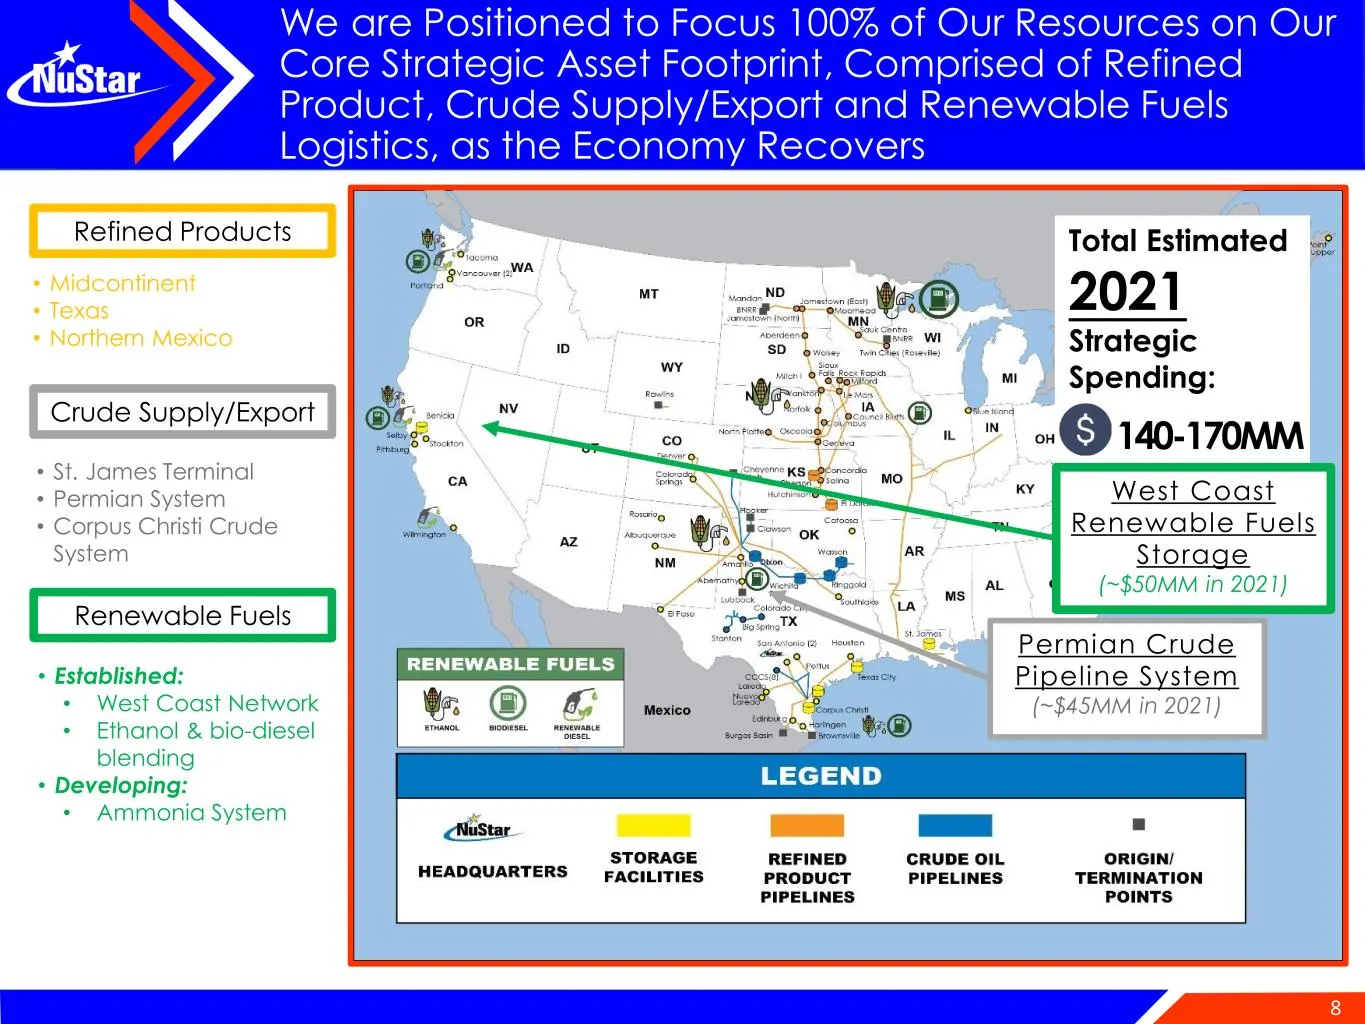
8 We are Positioned to Focus 100% of Our Resources on Our Core Strategic Asset Footprint, Comprised of Refined Product, Crude Supply/Export and Renewable Fuels Logistics, as the Economy Recovers Crude Supply/Export Renewable Fuels Refined Products • St. James Terminal • Permian System • Corpus Chris
Slide 9: U.S. Gasoline and Diesel Demand Rebound
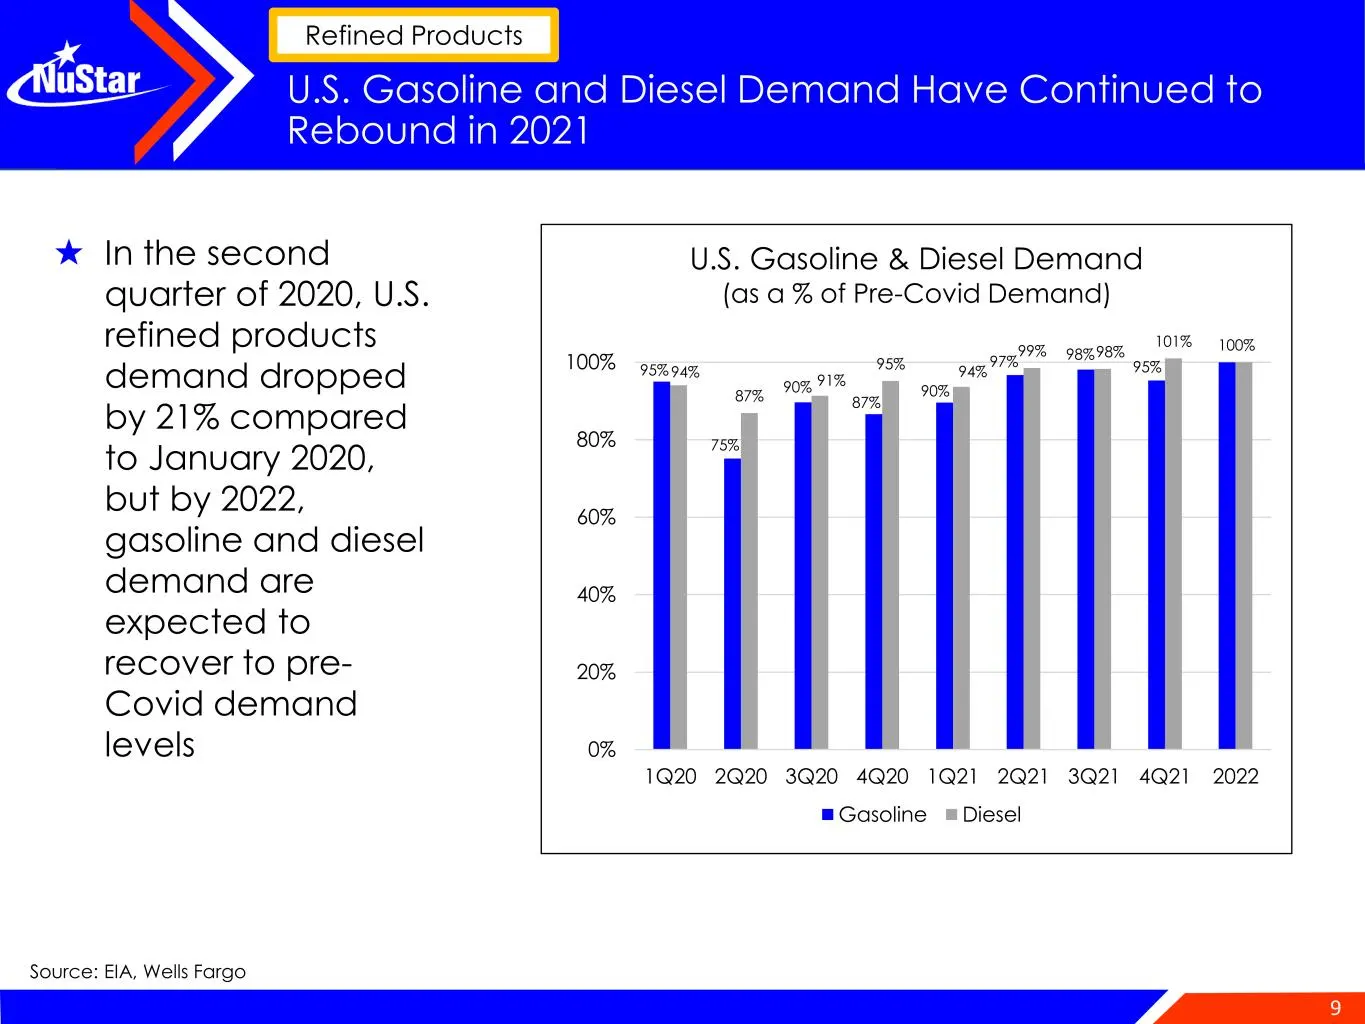
9 U.S. Gasoline and Diesel Demand Have Continued to Rebound in 2021 ★ In the second quarter of 2020, U.S. refined products demand dropped by 21% compared to January 2020, but by 2022, gasoline and diesel demand are expected to recover to pre- Covid demand levels Source: EIA, Wells Fargo 95% 75% 90%
Slide 10: Refined Products Systems Serve Key Markets
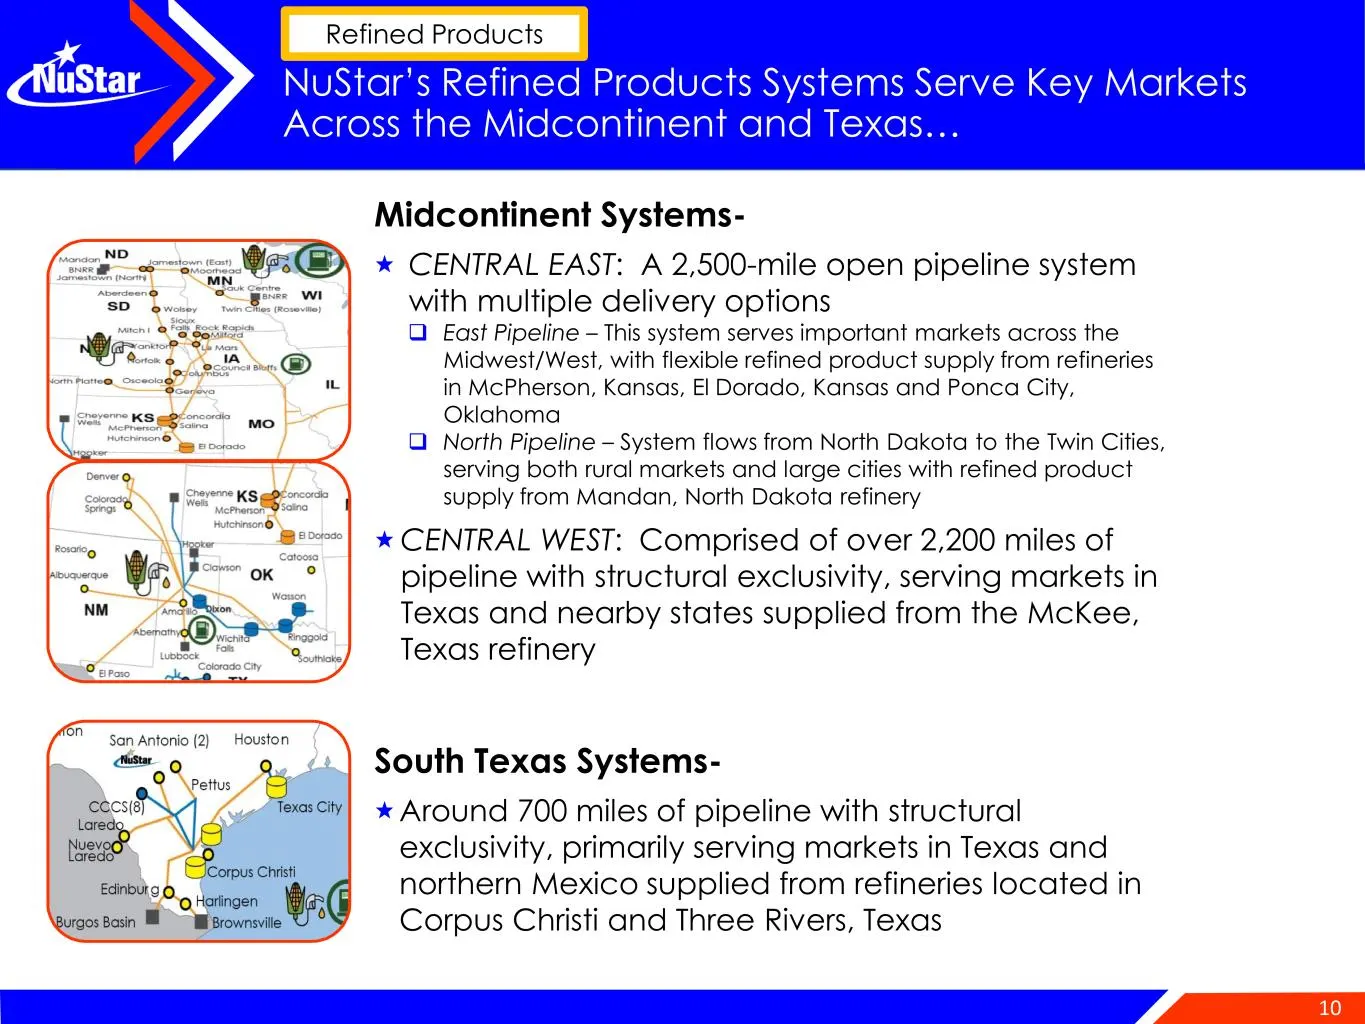
10 NuStar’s Refined Products Systems Serve Key Markets Across the Midcontinent and Texas… Refined Products Midcontinent Systems- CENTRAL EAST: A 2,500-mile open pipeline system with multiple delivery options ❑ East Pipeline – This system serves important markets across the Midwest/West, with flexibl
Slide 11: Resilient Refined Products Demand
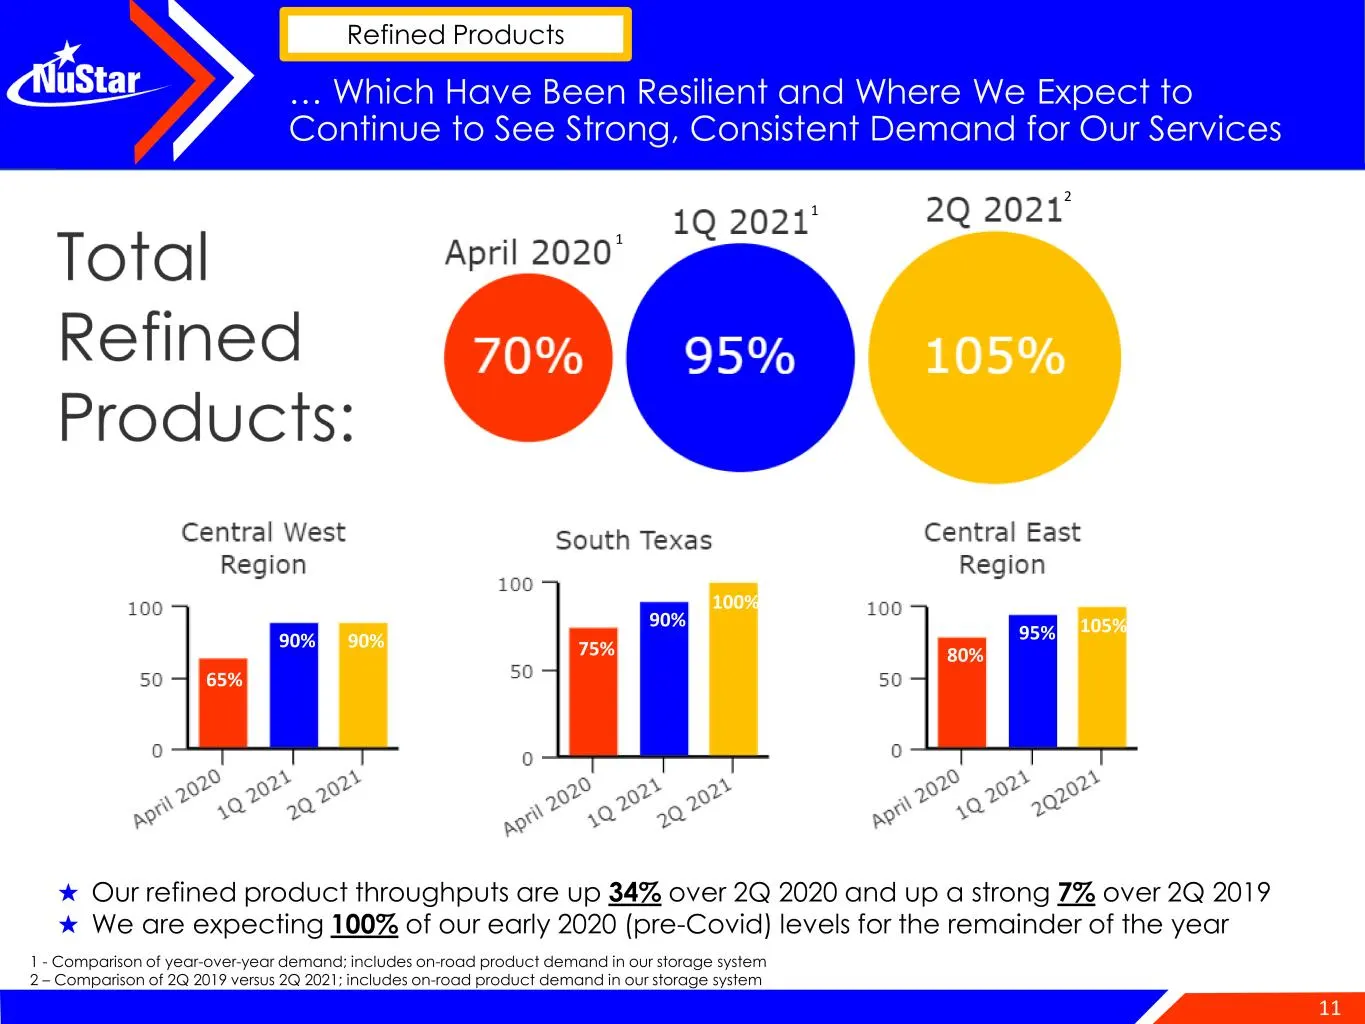
11 … Which Have Been Resilient and Where We Expect to Continue to See Strong, Consistent Demand for Our Services 1 - Comparison of year-over-year demand; includes on-road product demand in our storage system 2 – Comparison of 2Q 2019 versus 2Q 2021; includes on-road product demand in our storage sys
Slide 12: Outlook for U.S. Refinery Utilization
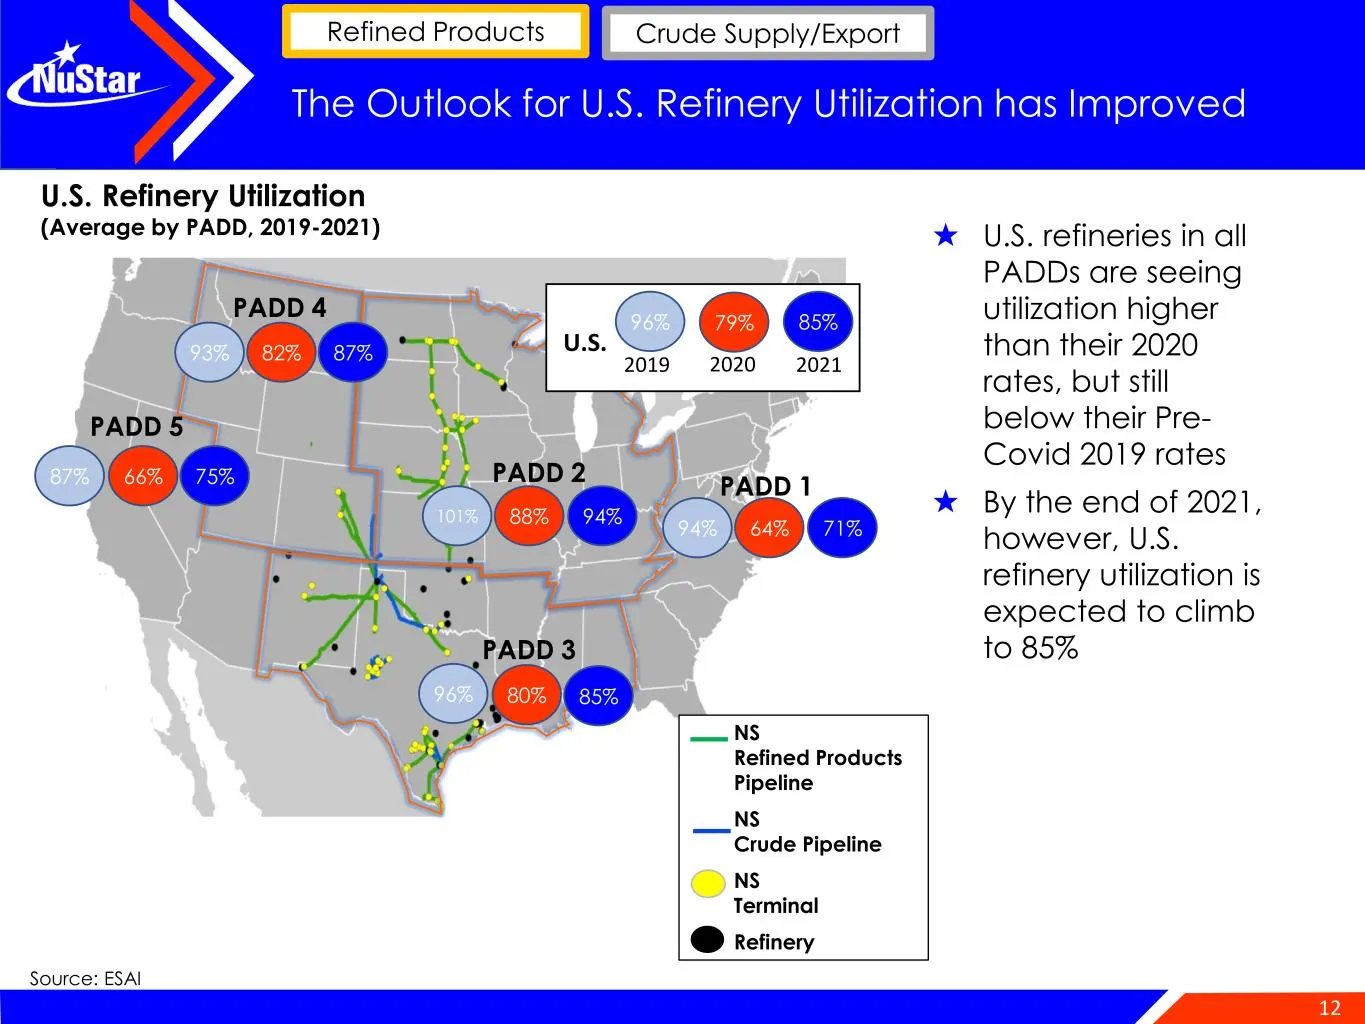
12 The Outlook for U.S. Refinery Utilization has Improved 2019 2020 2021 96% 79% 85% U.S. 94% 64% 71% PADD 1 96% 80% PADD 3 101% 88% 94% PADD 2 93% 82% 87% PADD 4 87% 66% 75% PADD 5 85% Source: ESAI U.S. Refinery Utilization (Average by PADD, 2019-2021) NS Refined Products Pipeline NS Crude Pipeline
Slide 13: Demand Drives Shale Production Growth
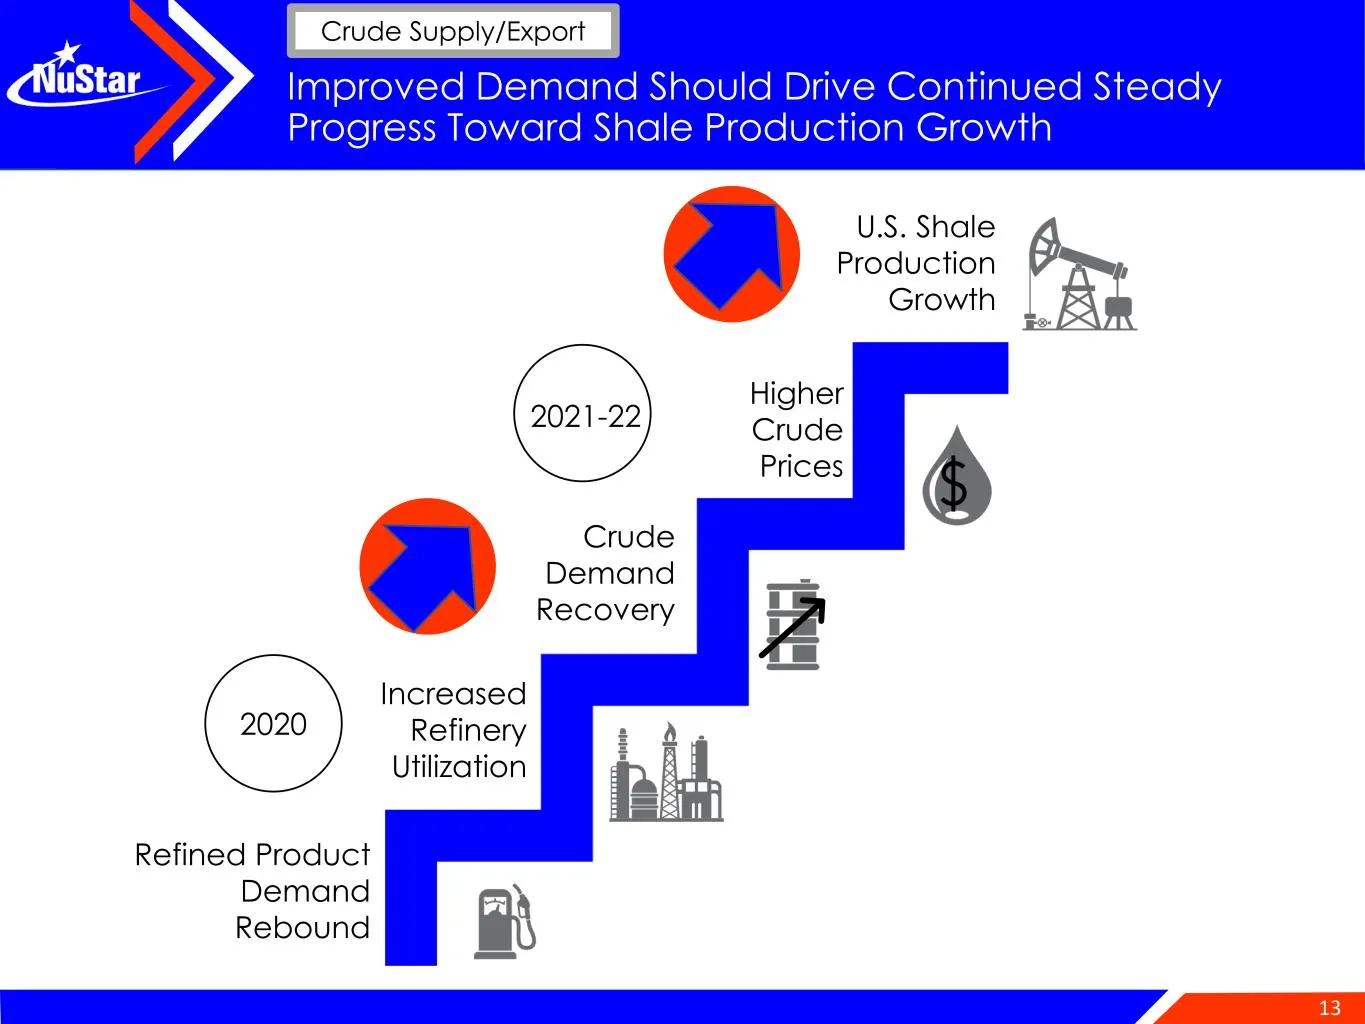
13 Improved Demand Should Drive Continued Steady Progress Toward Shale Production Growth U.S. Shale Production Growth Higher Crude Prices Crude Demand Recovery Increased Refinery Utilization Refined Product Demand Rebound 2020 2021-22 Crude Supply/Export
Slide 14: Permian Basin Leads Shale Rebound
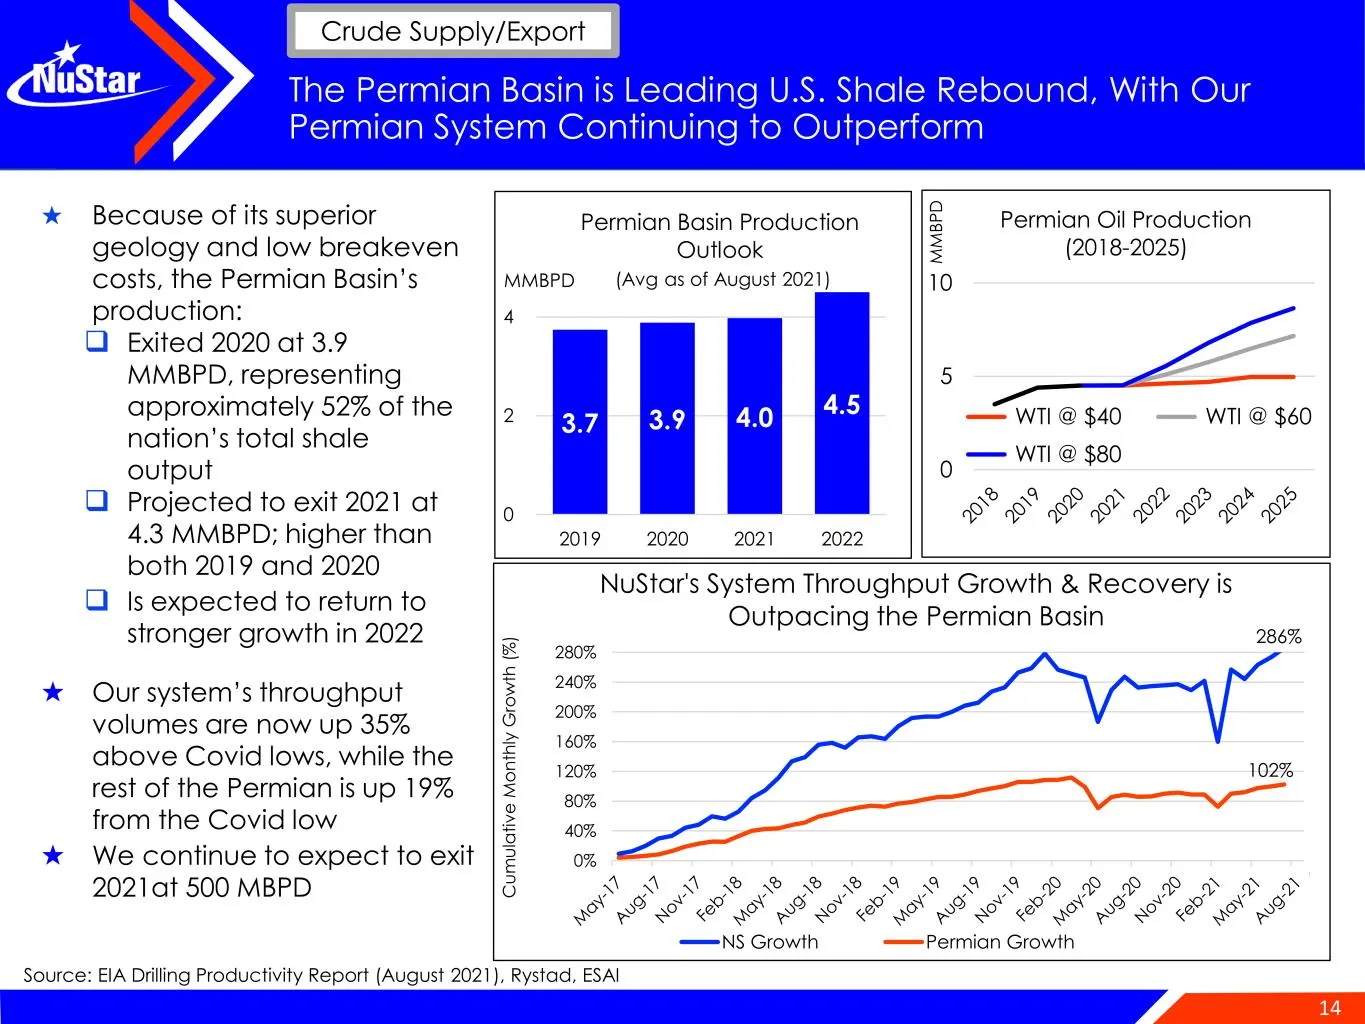
14 The Permian Basin is Leading U.S. Shale Rebound, With Our Permian System Continuing to Outperform ★ Because of its superior geology and low breakeven costs, the Permian Basin’s production: ❑ Exited 2020 at 3.9 MMBPD, representing approximately 52% of the nation’s total shale output ❑ Projected to
Slide 15: Core of the Core Location Attracts Top-Tier Customers
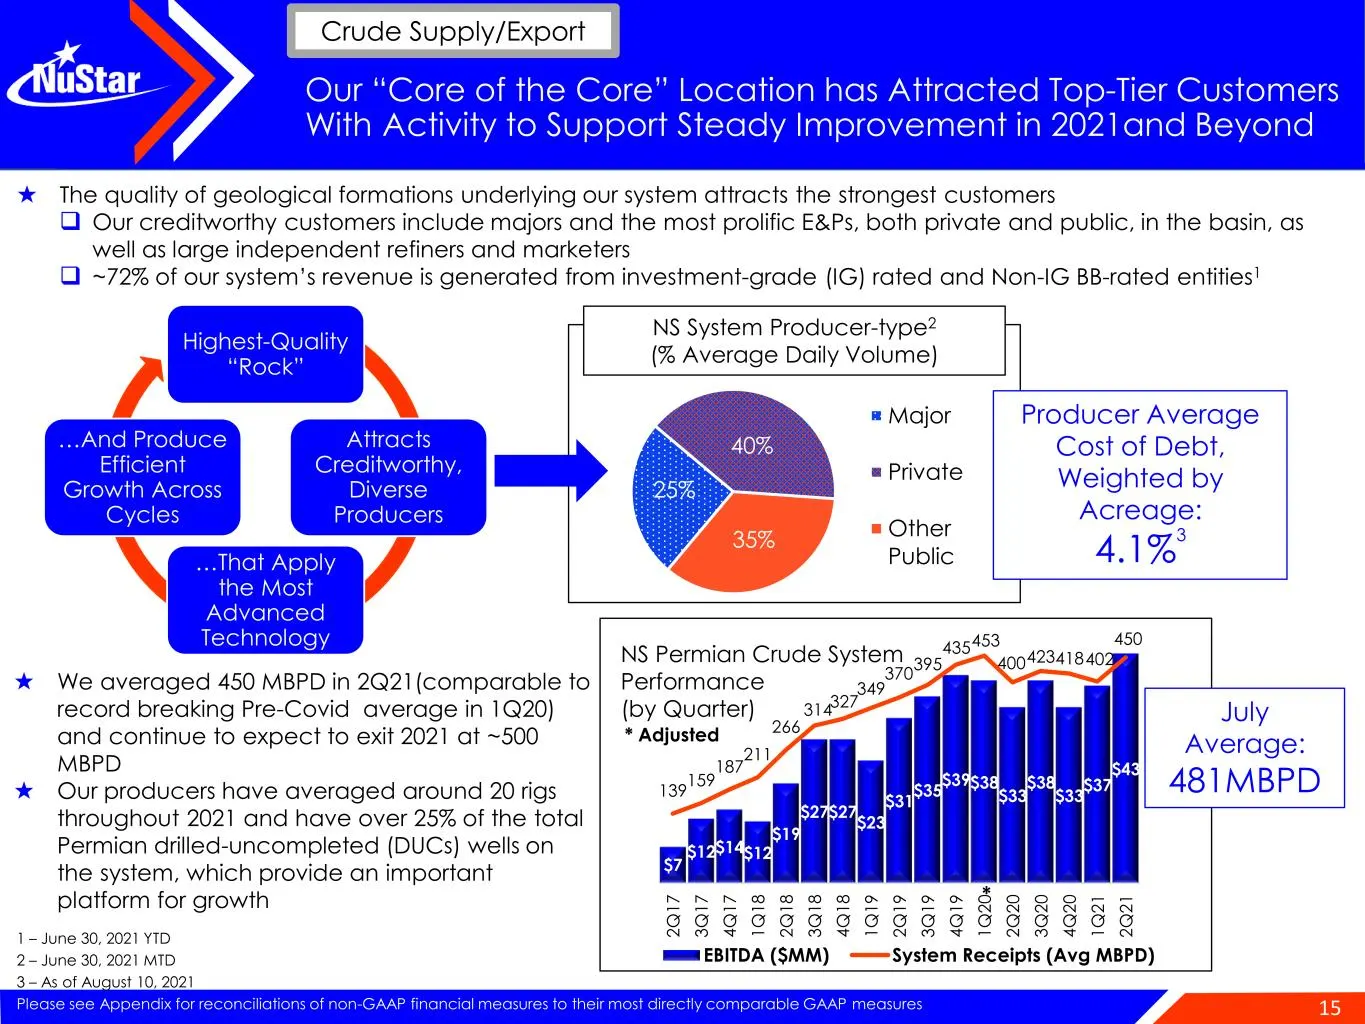
15 $7 $12$14$12 $19 $27$27 $23 $31 $35 $39$38 $33 $38 $33 $37 $43 139 159 187 211 266 314 327 349 370 395 435453 400423418402 450 0 100 200 300 400 500 $0 $10 $20 $30 $40 2 Q 1 7 3 Q 1 7 4 Q 1 7 1 Q 1 8 2 Q 1 8 3 Q 1 8 4 Q 1 8 1 Q 1 9 2 Q 1 9 3 Q 1 9 4 Q 1 9 1 Q 2 0 2 Q 2 0 3 Q 2 0 4 Q 2 0 1 Q 2 1 2
Slide 16: Permian Mainline System Complete
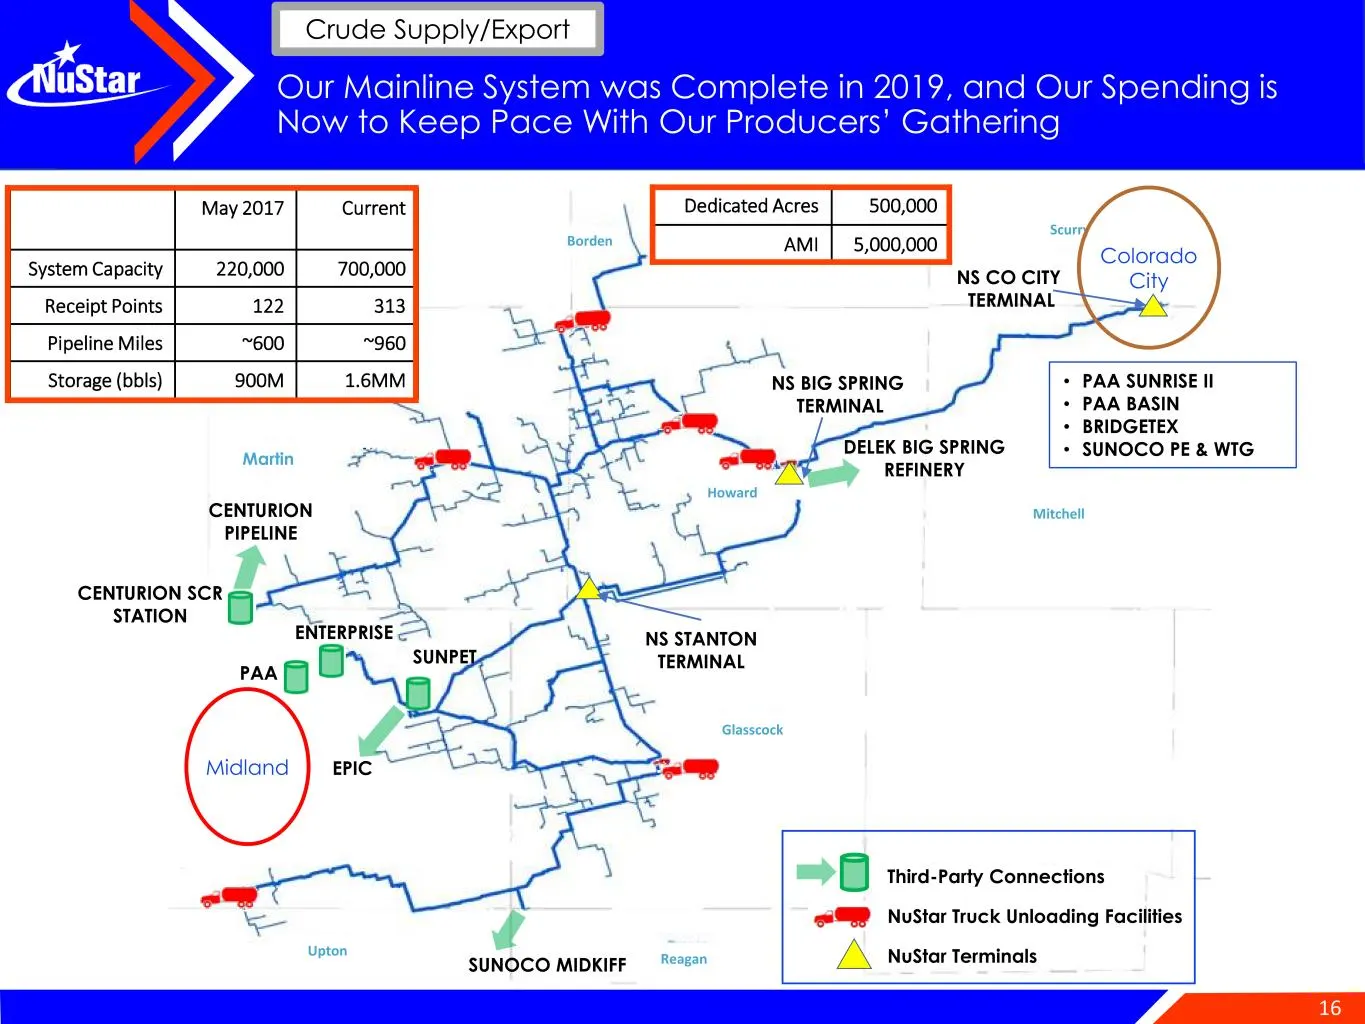
16 May 2017 Current System Capacity 220,000 700,000 Receipt Points 122 313 Pipeline Miles ~600 ~960 Storage (bbls) 900M 1.6MM Third-Party Connections NuStar Truck Unloading Facilities NuStar Terminals • PAA SUNRISE II • PAA BASIN • BRIDGETEX • SUNOCO PE & WTG CENTURION SCR STATION SUNOCO MIDKIFF SUN
Slide 17: U.S. Gulf Coast Crude Exports by Hub
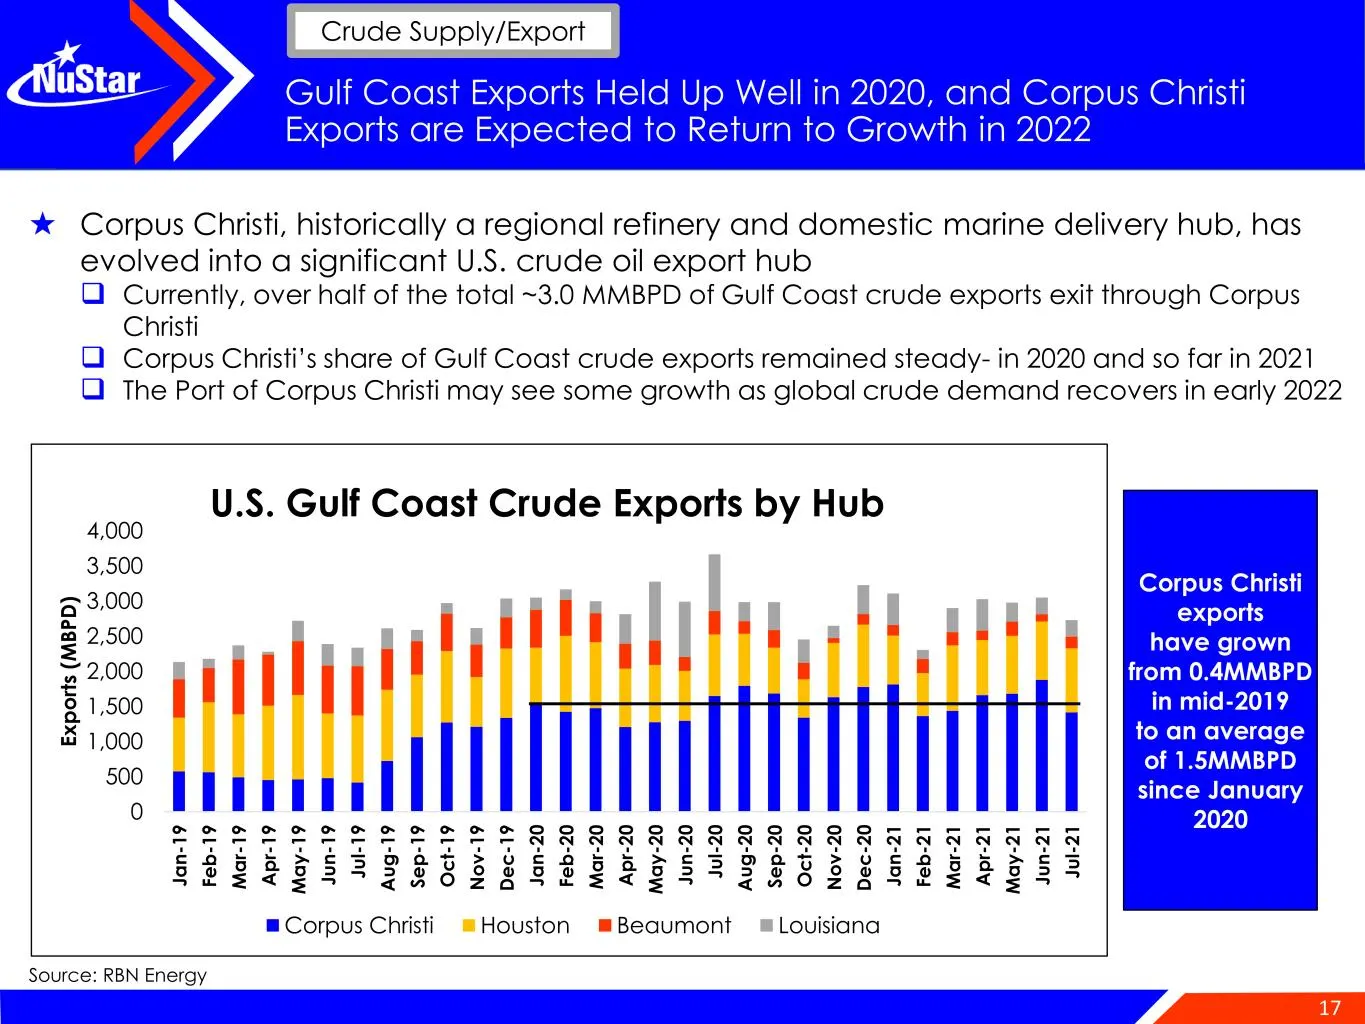
17 0 500 1,000 1,500 2,000 2,500 3,000 3,500 4,000 J a n -1 9 F e b -1 9 M a r- 1 9 A p r- 1 9 M a y -1 9 J u n -1 9 J u l- 1 9 A u g -1 9 S e p -1 9 O c t- 1 9 N o v -1 9 D e c -1 9 J a n -2 0 F e b -2 0 M a r- 2 0 A p r- 2 0 M a y -2 0 J u n -2 0 J u l- 2 0 A u g -2 0 S e p -2 0 O c t- 2 0 N o v -
Slide 18: Corpus Christi Crude System MVCs
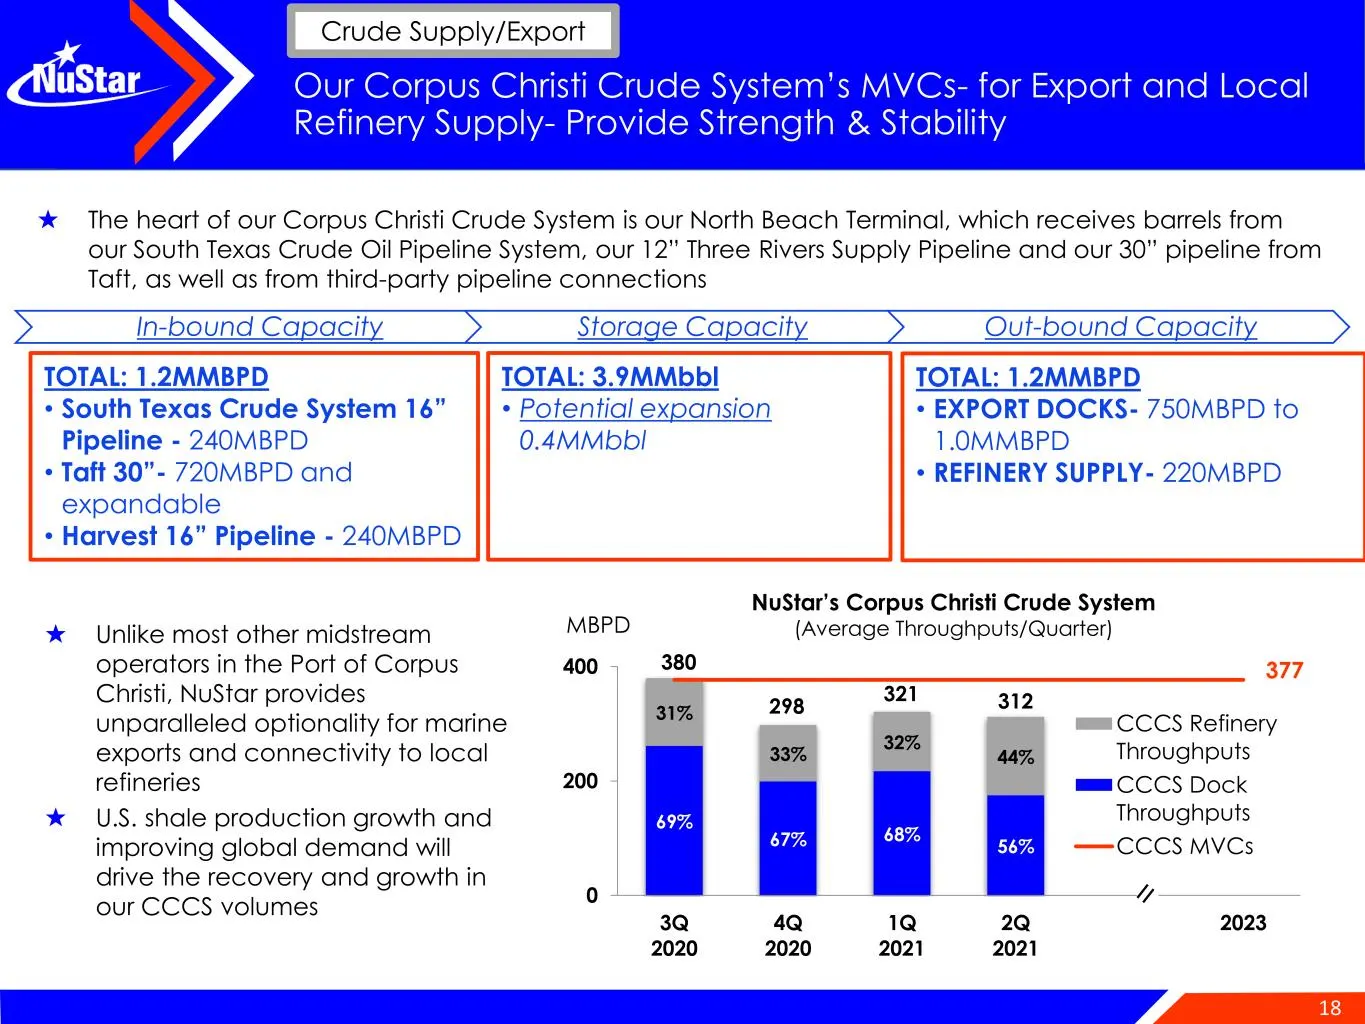
18 69% 67% 68% 56% 31% 33% 32% 44% 0 200 400 3Q 2020 4Q 2020 1Q 2021 2Q 2021 2023 CCCS Refinery Throughputs CCCS Dock Throughputs CCCS MVCs NuStar’s Corpus Christi Crude System (Average Throughputs/Quarter)MBPD 380 Our Corpus Christi Crude System’s MVCs- for Export and Local Refinery Supply- Provide
Slide 19: St. James Facility Connectivity
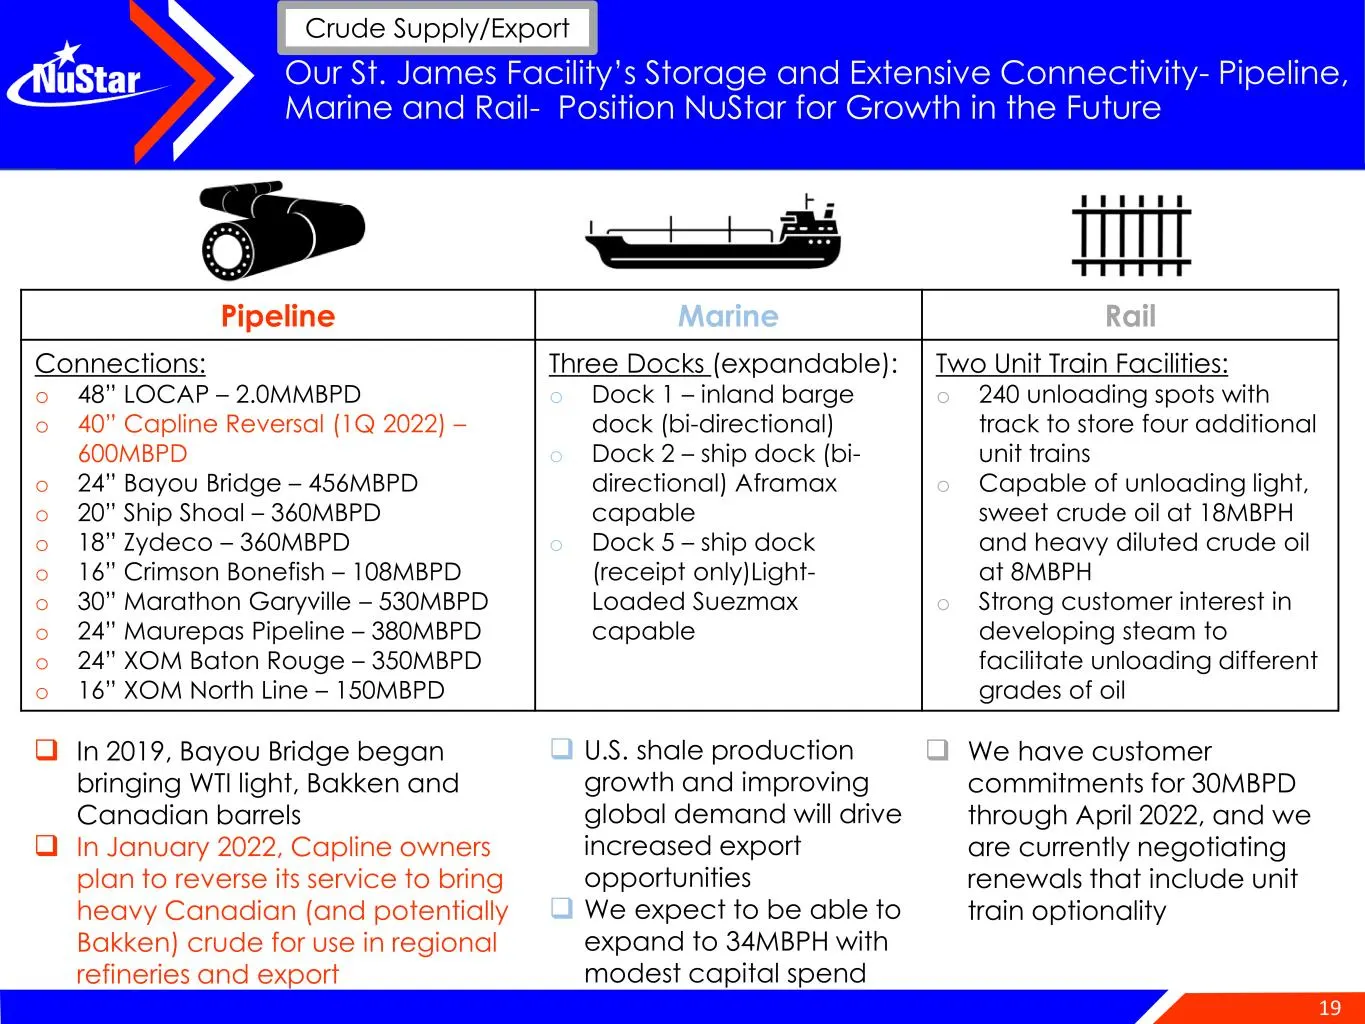
19 ❑ We have customer commitments for 30MBPD through April 2022, and we are currently negotiating renewals that include unit train optionality Our St. James Facility’s Storage and Extensive Connectivity- Pipeline, Marine and Rail- Position NuStar for Growth in the Future ❑ U.S. shale production grow
Slide 20: Carbon Reduction Goals Drive Renewable Fuels Demand
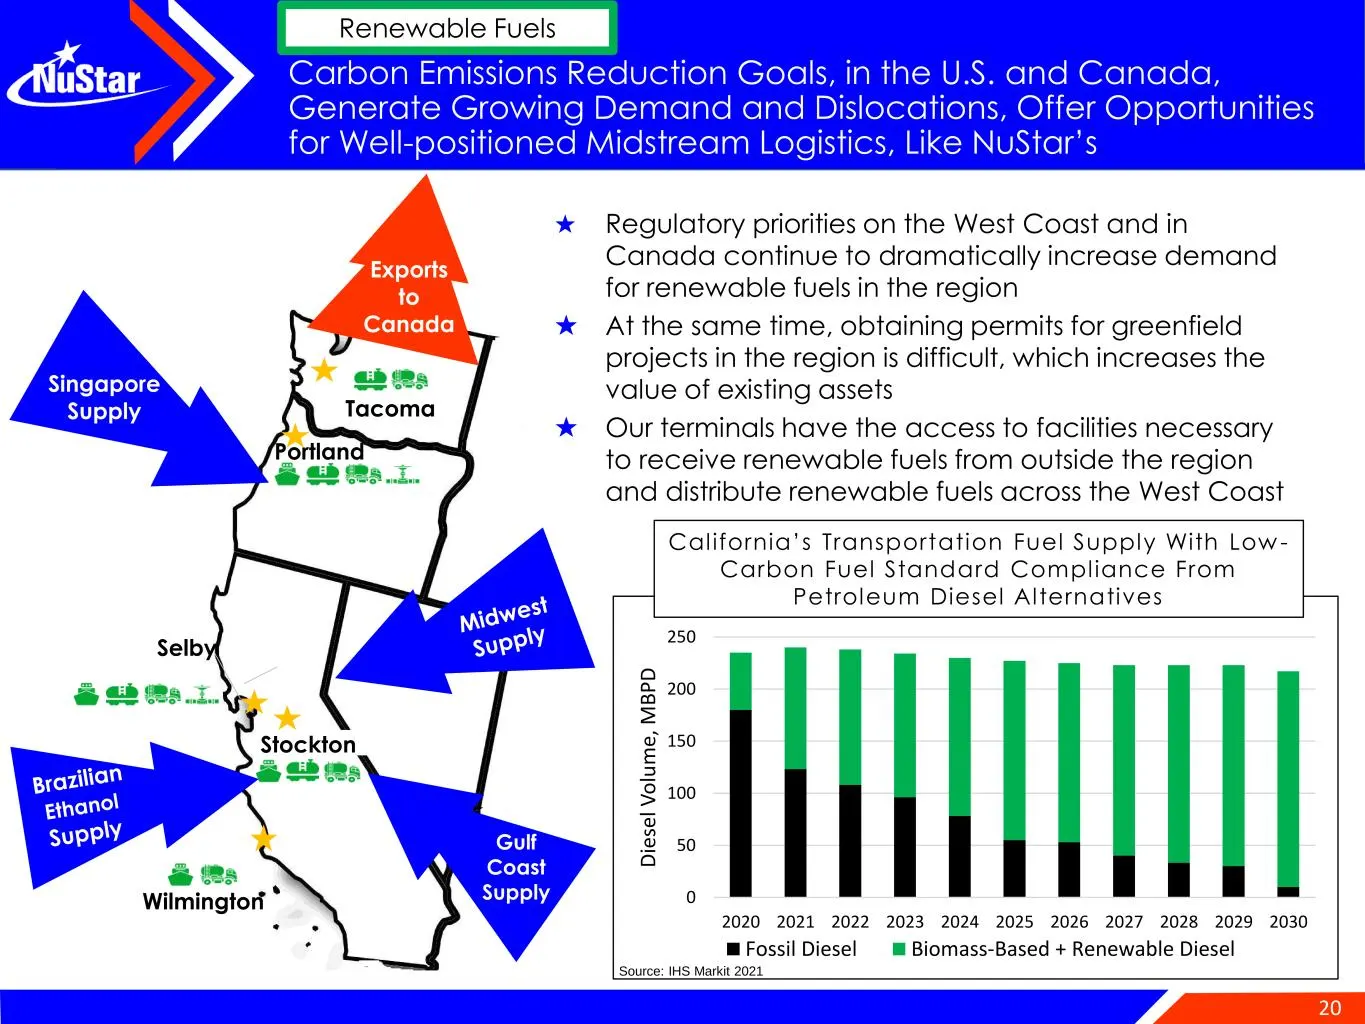
20 Carbon Emissions Reduction Goals, in the U.S. and Canada, Generate Growing Demand and Dislocations, Offer Opportunities for Well-positioned Midstream Logistics, Like NuStar’s Stockton Selby Wilmington Gulf Coast Supply Singapore Supply Exports to Canada Tacoma Portland ★ Regulatory priorities on
Slide 21: Share of California Renewable Fuels Volumes
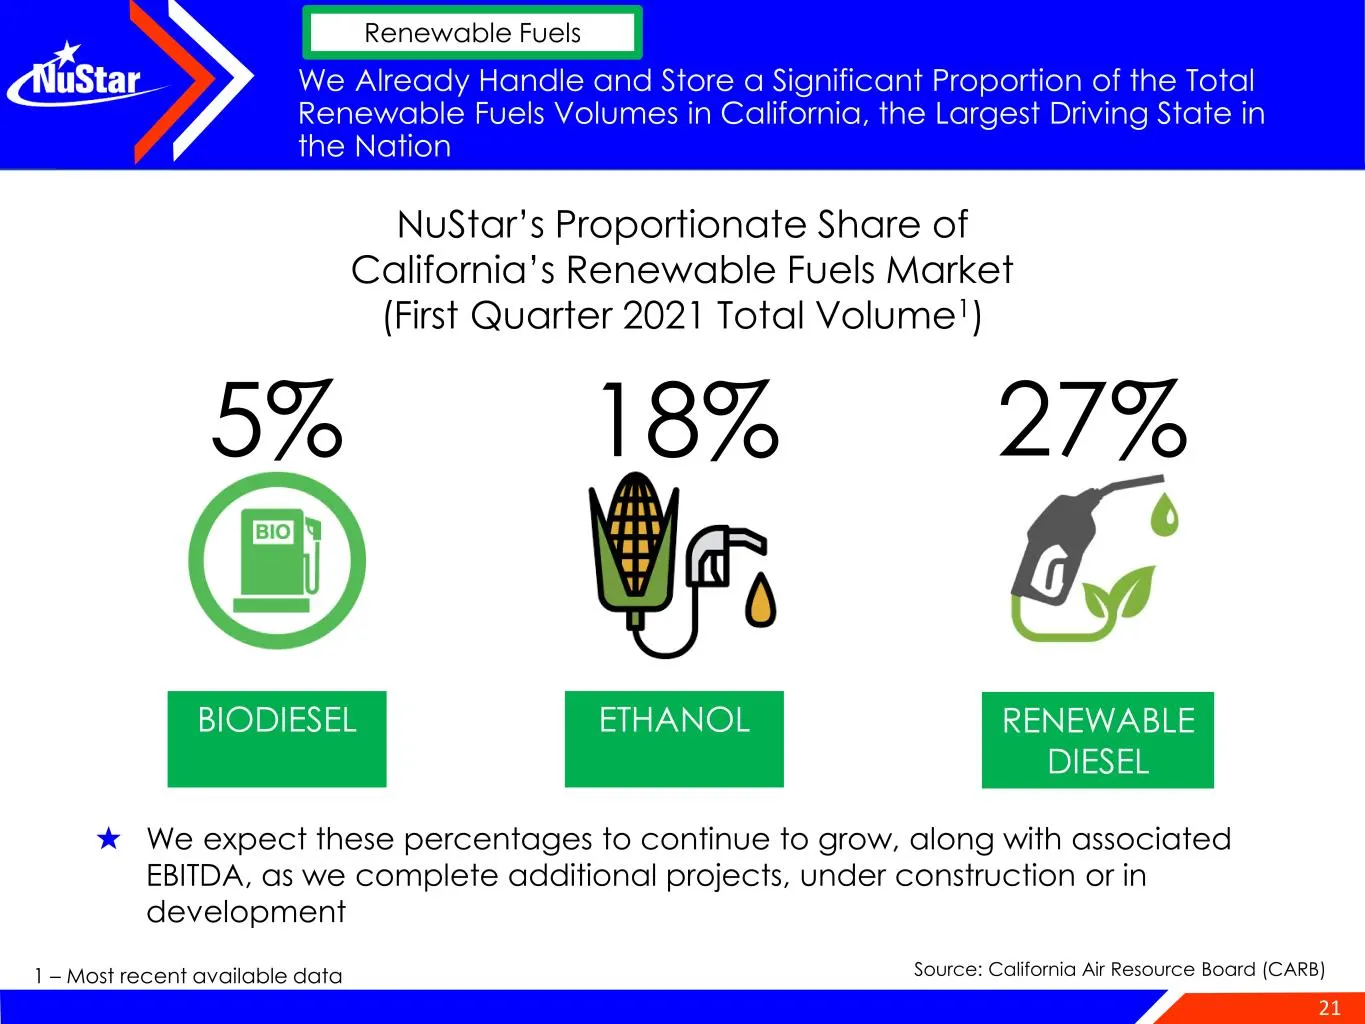
21 We Already Handle and Store a Significant Proportion of the Total Renewable Fuels Volumes in California, the Largest Driving State in the Nation ★ We expect these percentages to continue to grow, along with associated EBITDA, as we complete additional projects, under construction or in developmen
Slide 22: Partnering to Develop Renewable Fuels Network
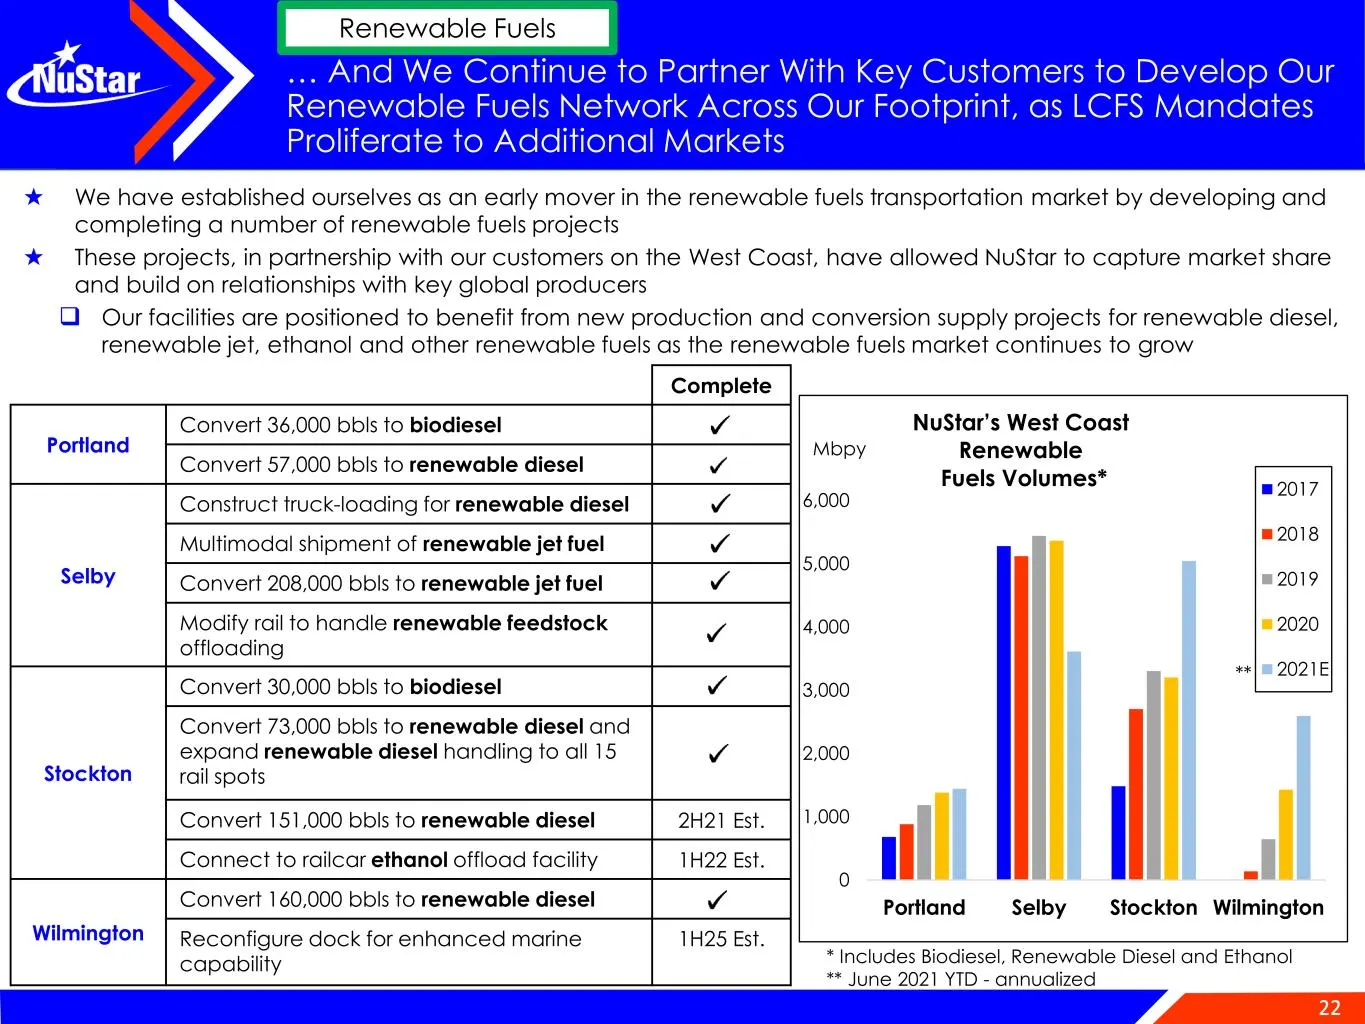
22 … And We Continue to Partner With Key Customers to Develop Our Renewable Fuels Network Across Our Footprint, as LCFS Mandates Proliferate to Additional Markets Complete Portland Convert 36,000 bbls to biodiesel Convert 57,000 bbls to renewable diesel Selby Construct truck-loading for renewable di
Slide 23: Ammonia Pipeline System
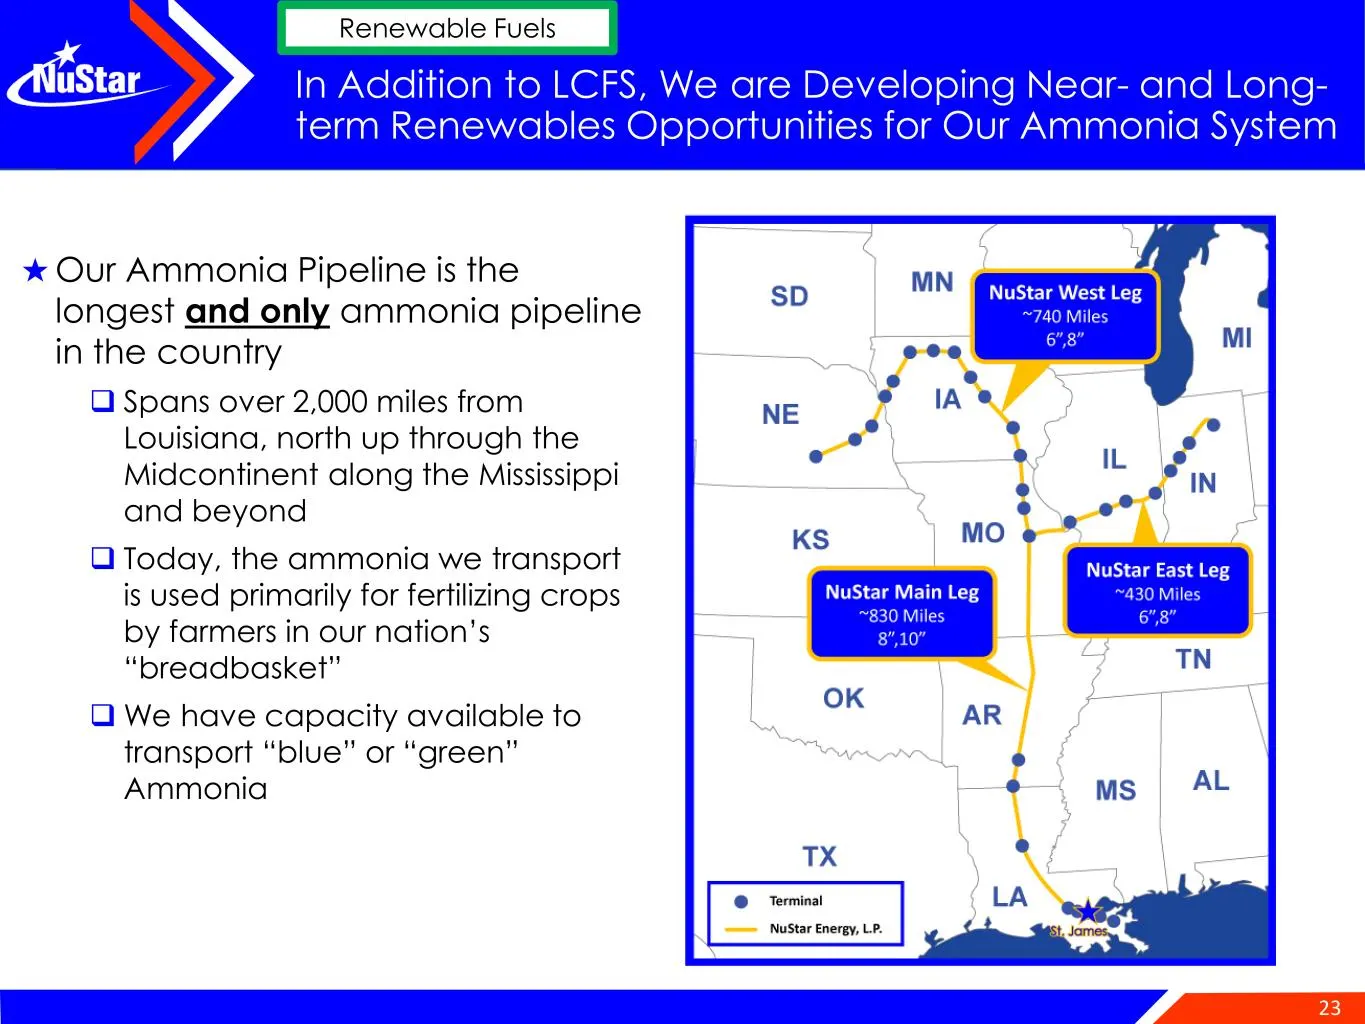
23 ★Our Ammonia Pipeline is the longest and only ammonia pipeline in the country ❑ Spans over 2,000 miles from Louisiana, north up through the Midcontinent along the Mississippi and beyond ❑ Today, the ammonia we transport is used primarily for fertilizing crops by farmers in our nation’s “breadbask
Slide 24: Gray, Blue and Green Ammonia Opportunities
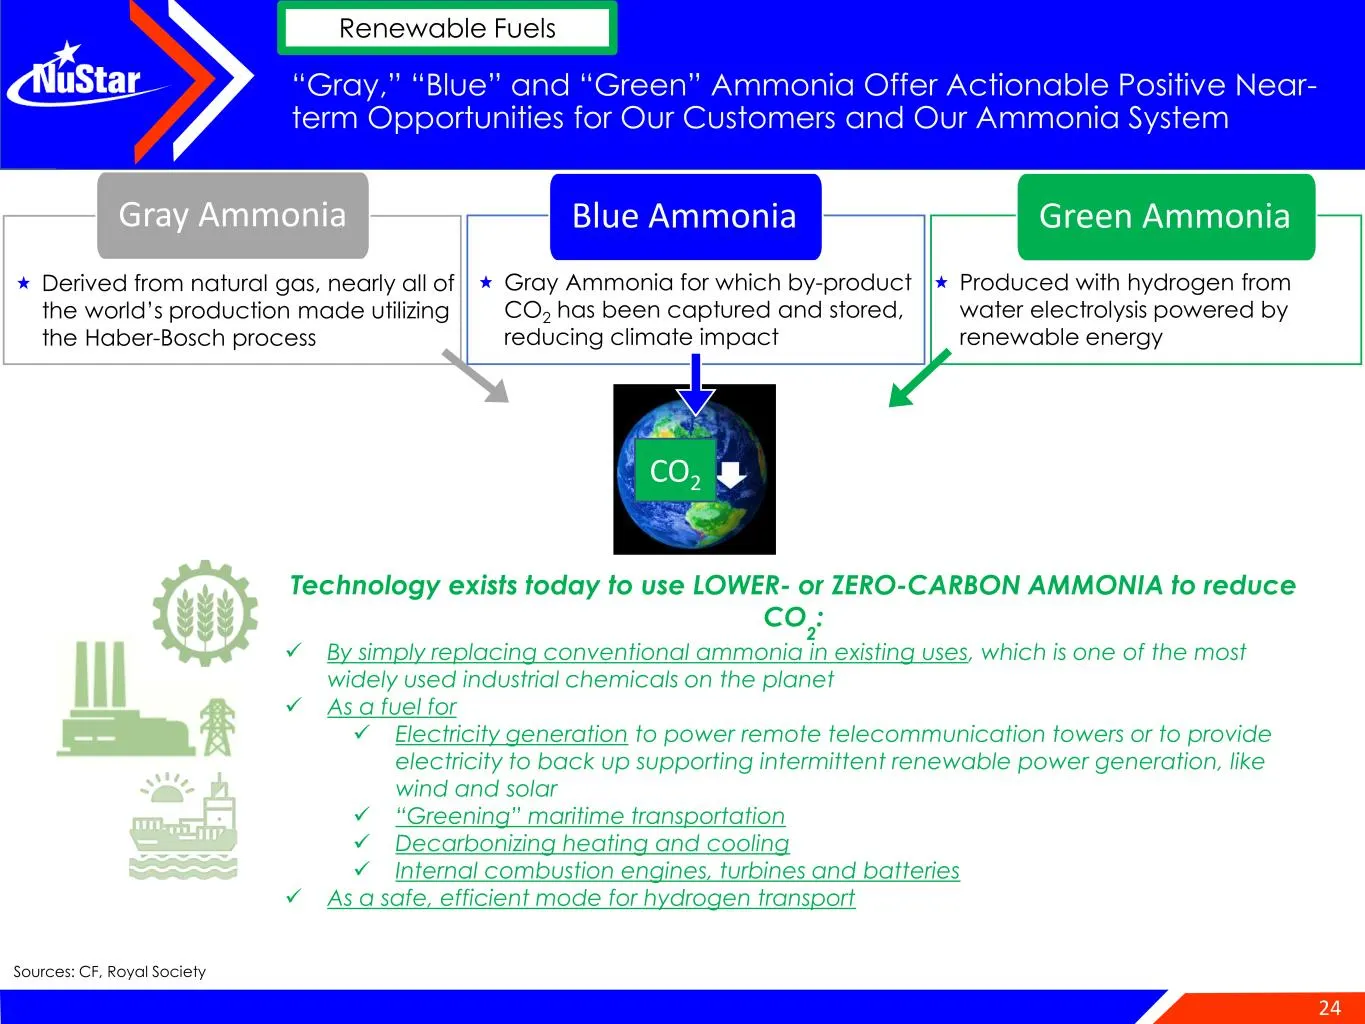
24 Gray Ammonia for which by-product CO2 has been captured and stored, reducing climate impact Derived from natural gas, nearly all of the world’s production made utilizing the Haber-Bosch process “Gray,” “Blue” and “Green” Ammonia Offer Actionable Positive Near- term Opportunities for Our Customers
Slide 25: Appendix
South Texas Crude System 25 APPENDIX
Slide 26: NuStar By-the-Numbers
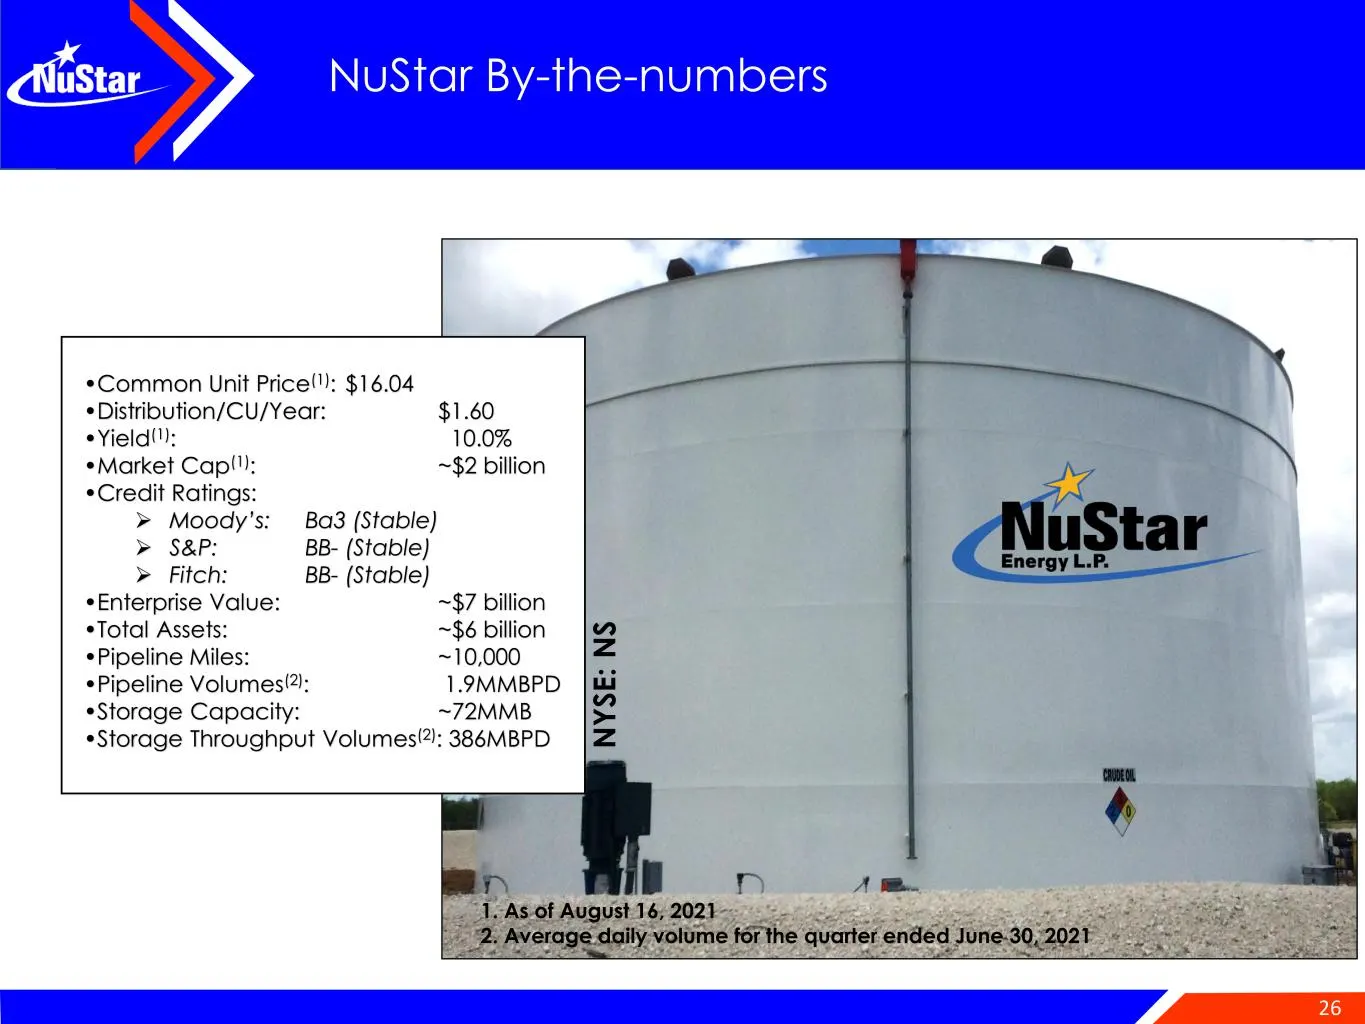
26 NuStar By-the-numbers N Y S E : N S •Common Unit Price(1): $16.04 •Distribution/CU/Year: $1.60 •Yield(1): 10.0% •Market Cap(1): ~$2 billion •Credit Ratings: ➢ Moody’s: Ba3 (Stable) ➢ S&P: BB- (Stable) ➢ Fitch: BB- (Stable) •Enterprise Value: ~$7 billion •Total Assets: ~$6 billion •Pipeline Miles:
Slide 27: Long-term Commitments From Creditworthy Customers
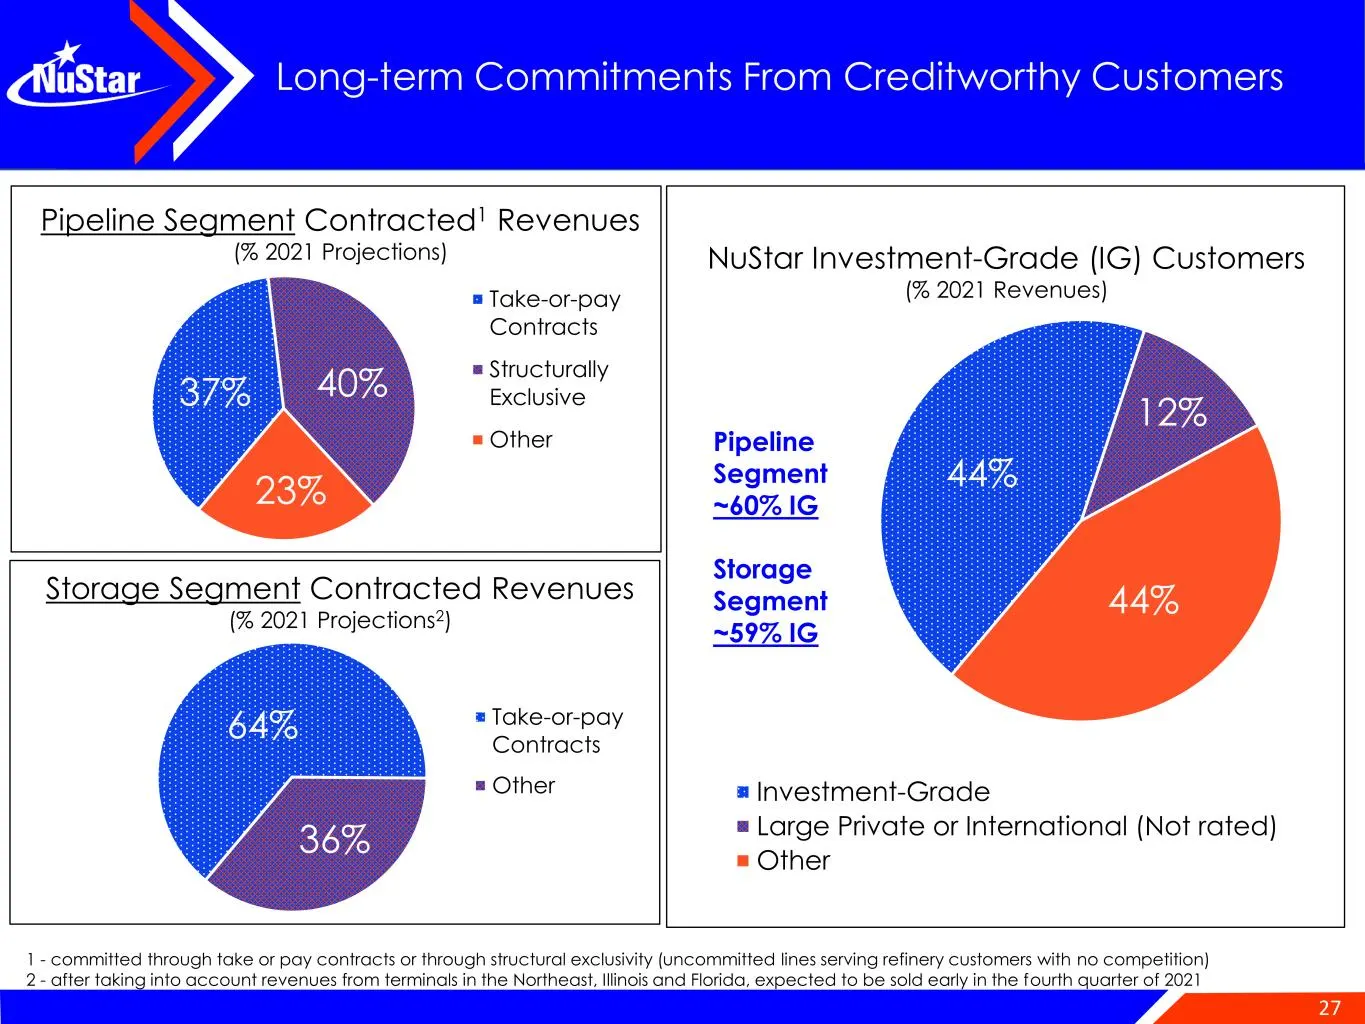
27 Long-term Commitments From Creditworthy Customers 44% 12% 44% Investment-Grade Large Private or International (Not rated) Other NuStar Investment-Grade (IG) Customers (% 2021 Revenues) Pipeline Segment ~60% IG Storage Segment ~59% IG 37% 40% 23% Take-or-pay Contracts Structurally Exclusive Other
Slide 28: Liquidity and Debt Maturity Schedule
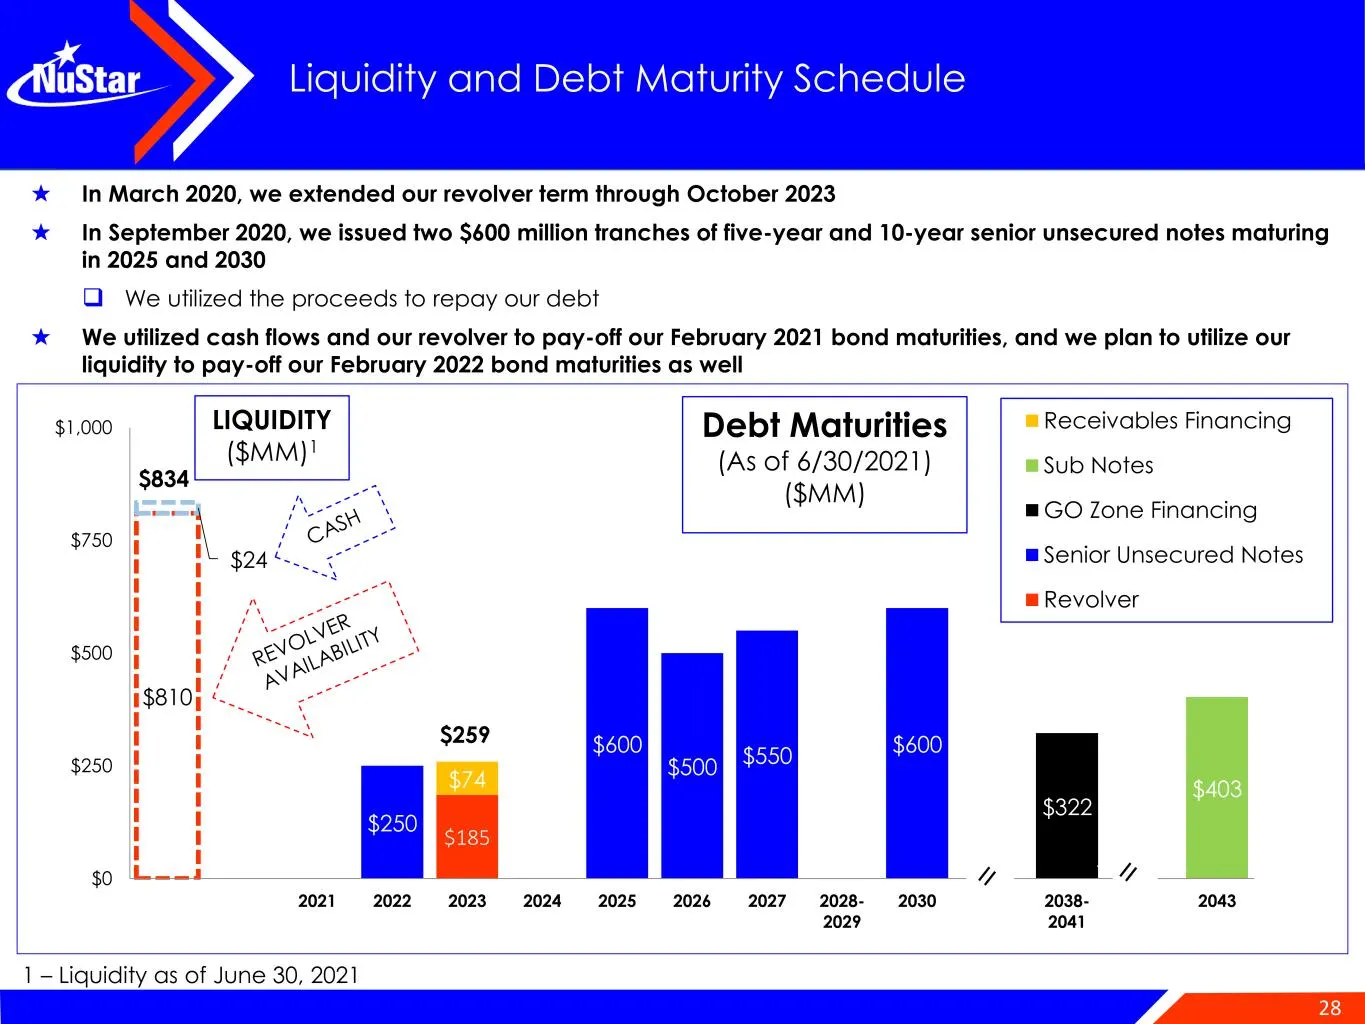
28 $185 $250 $600 $500 $550 $600 $322 $403 $74 $810 $24 $0 $250 $500 $750 $1,000 Liquidity 2021 2022 2023 2024 2025 2026 2027 2028- 2029 2030 2038- 2041 2043 Receivables Financing Sub Notes GO Zone Financing Senior Unsecured Notes Revolver $834 $259 LIQUIDITY ($MM)1 Liquidity and Debt Maturity Sched
Slide 29: Capital Structure as of June 30, 2021
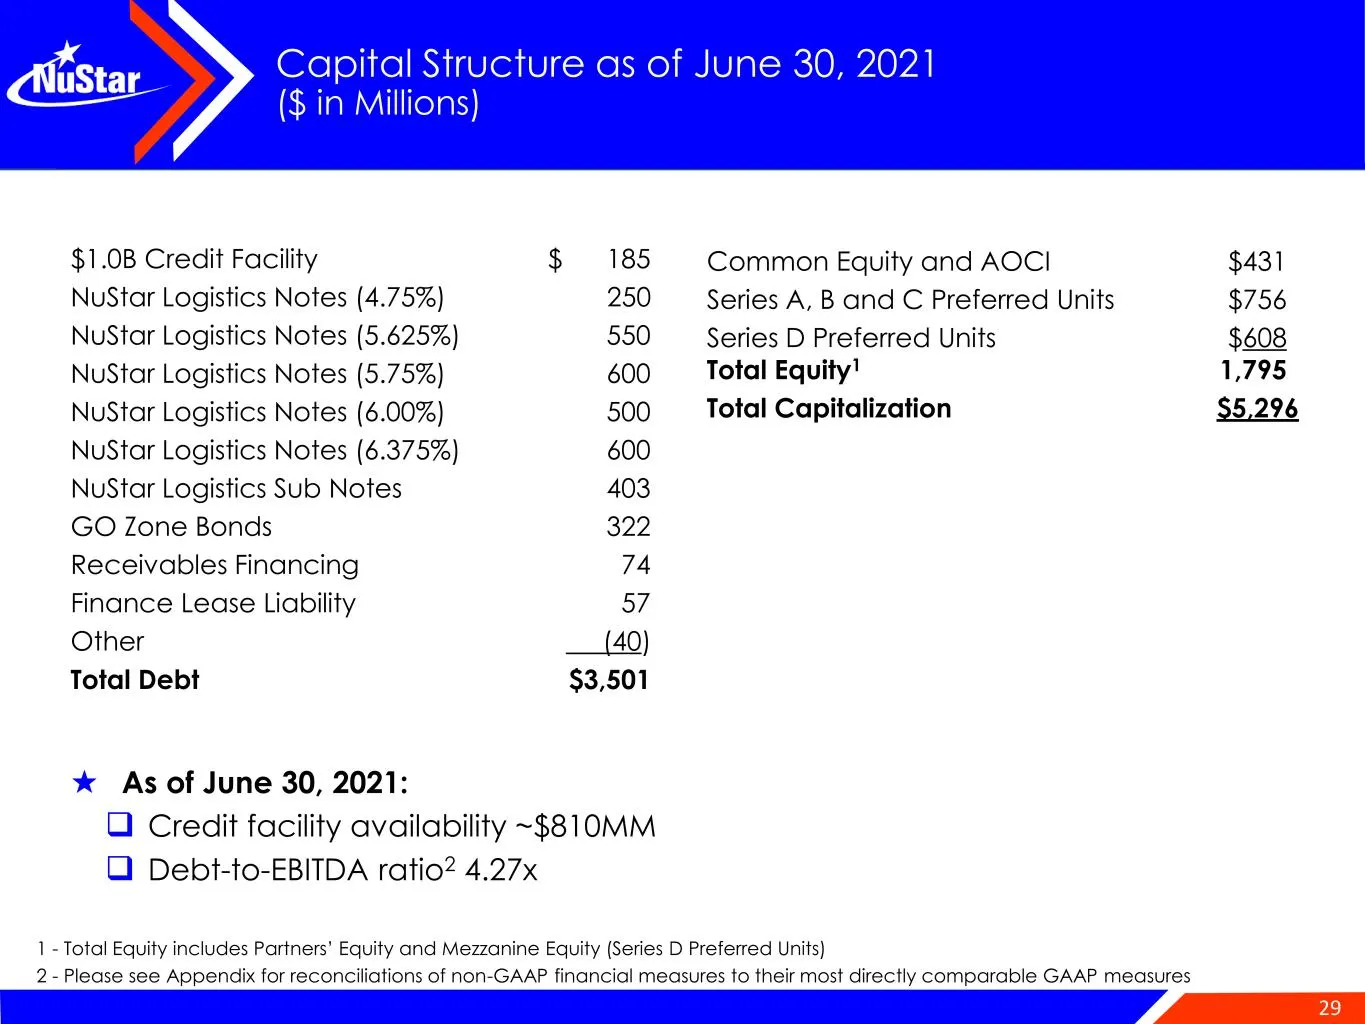
29 Capital Structure as of June 30, 2021 ($ in Millions) $1.0B Credit Facility $ 185 NuStar Logistics Notes (4.75%) 250 NuStar Logistics Notes (5.625%) 550 NuStar Logistics Notes (5.75%) 600 NuStar Logistics Notes (6.00%) 500 NuStar Logistics Notes (6.375%) 600 NuStar Logistics Sub Notes 403 GO Zone
Slide 30: Reconciliation of Non-GAAP Financial Information
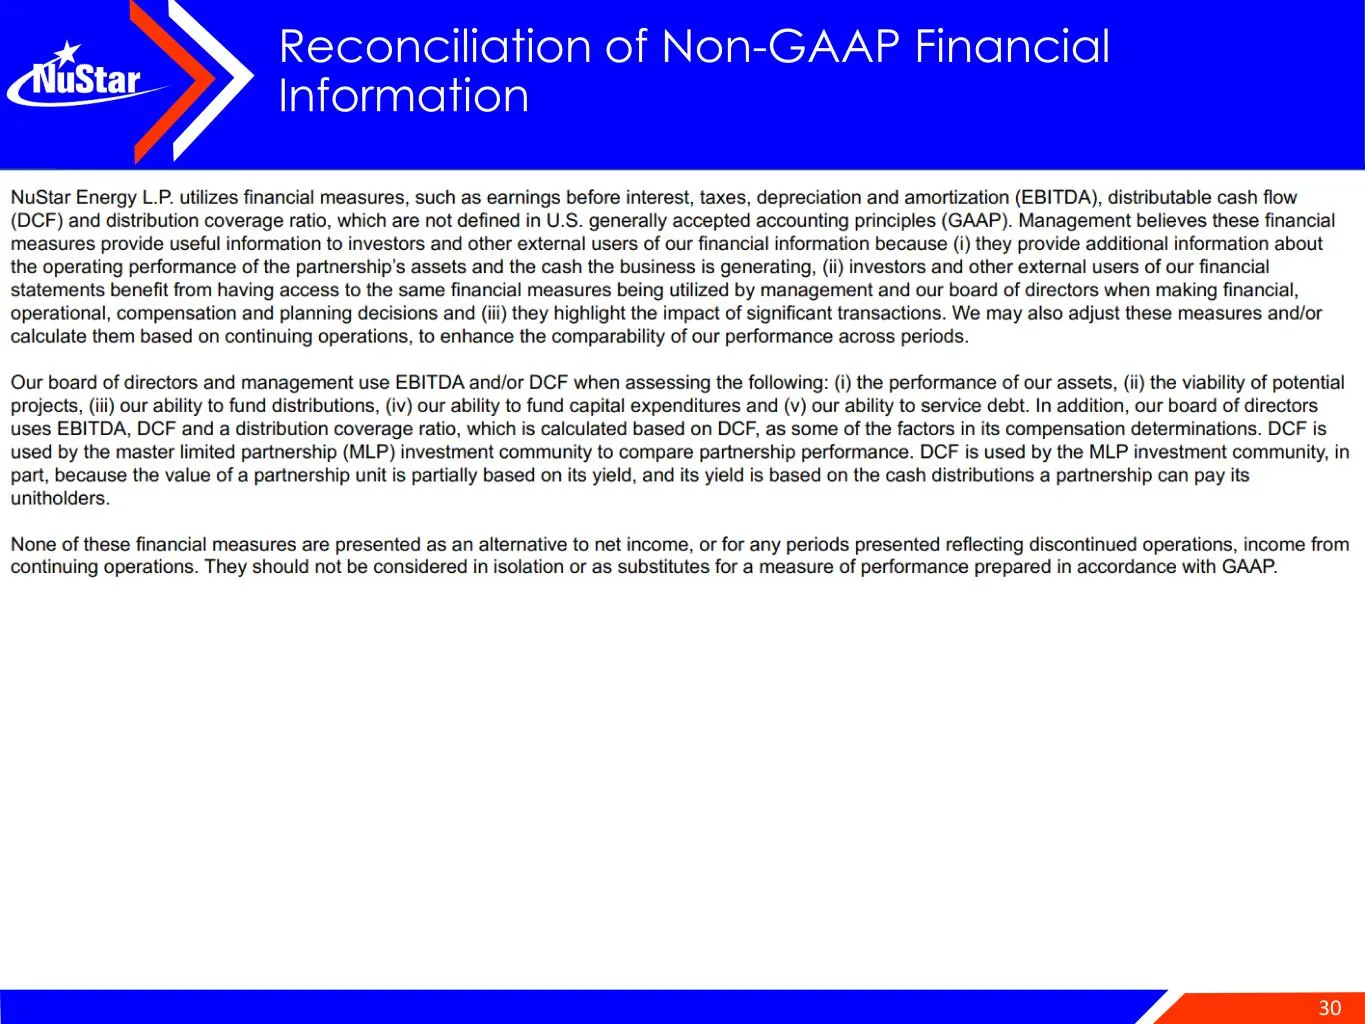
30 Reconciliation of Non-GAAP Financial Information
Slide 31: Reconciliation of Non-GAAP Financial Information (continued)
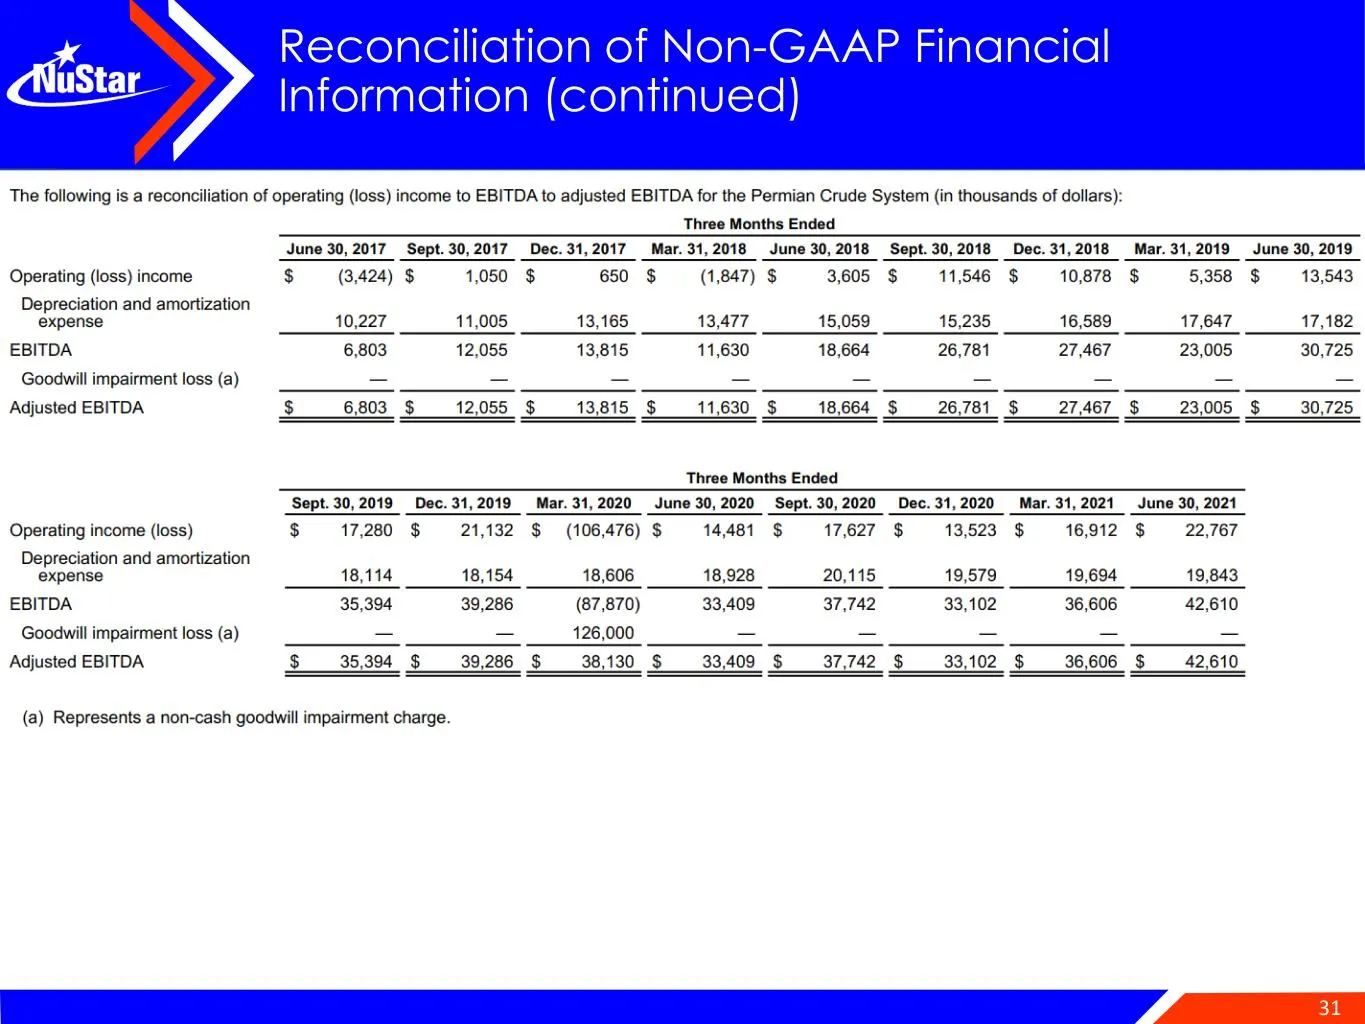
31 Reconciliation of Non-GAAP Financial Information (continued)
Slide 32: Reconciliation of Non-GAAP Financial Information (continued)
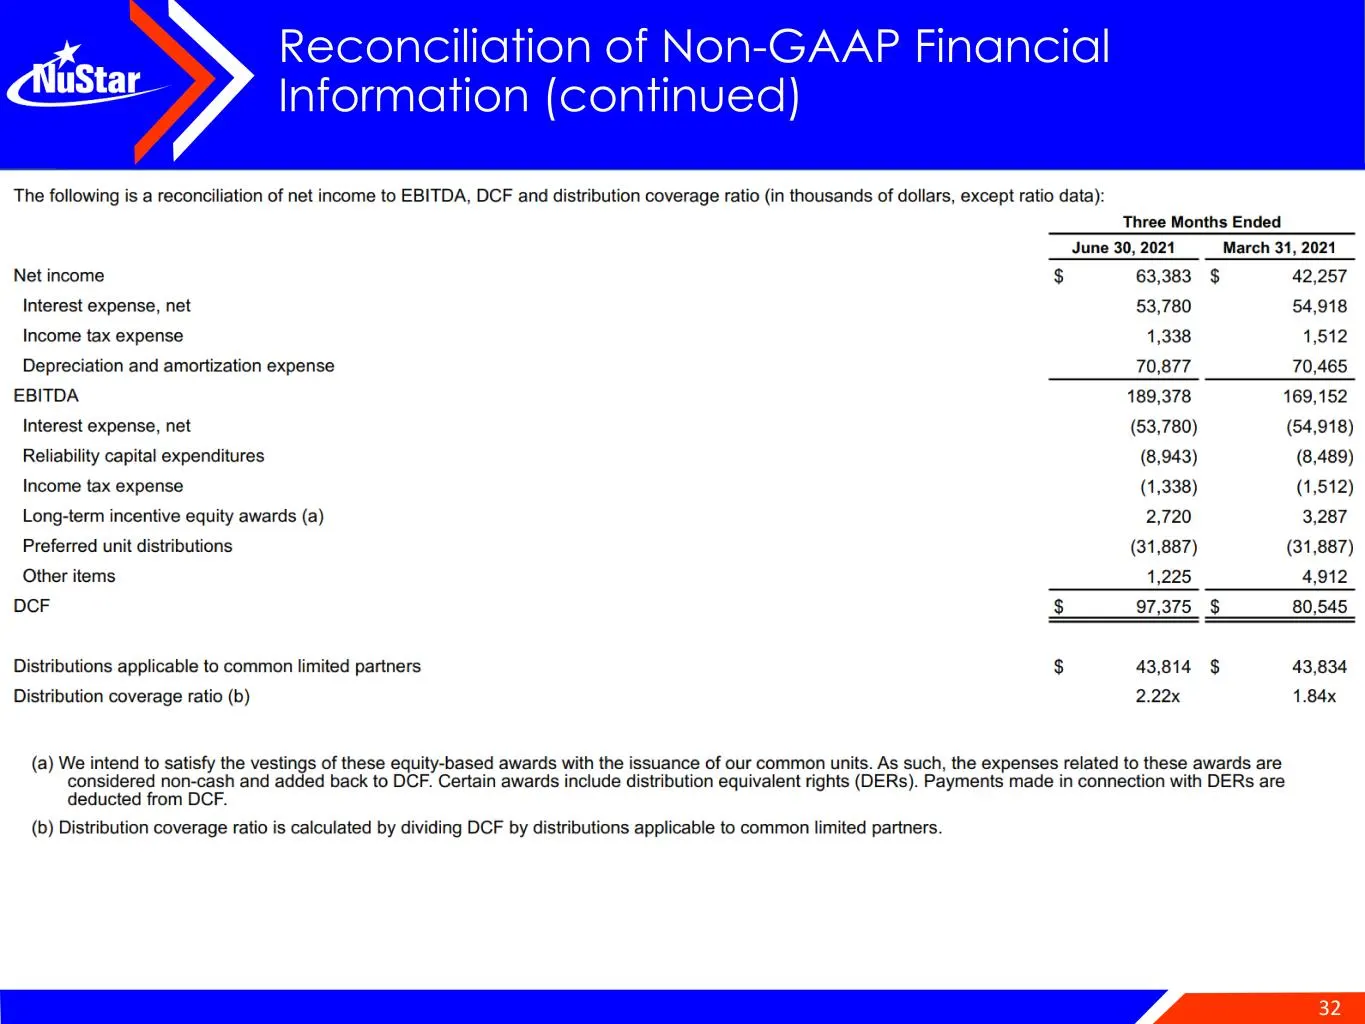
32 Reconciliation of Non-GAAP Financial Information (continued)
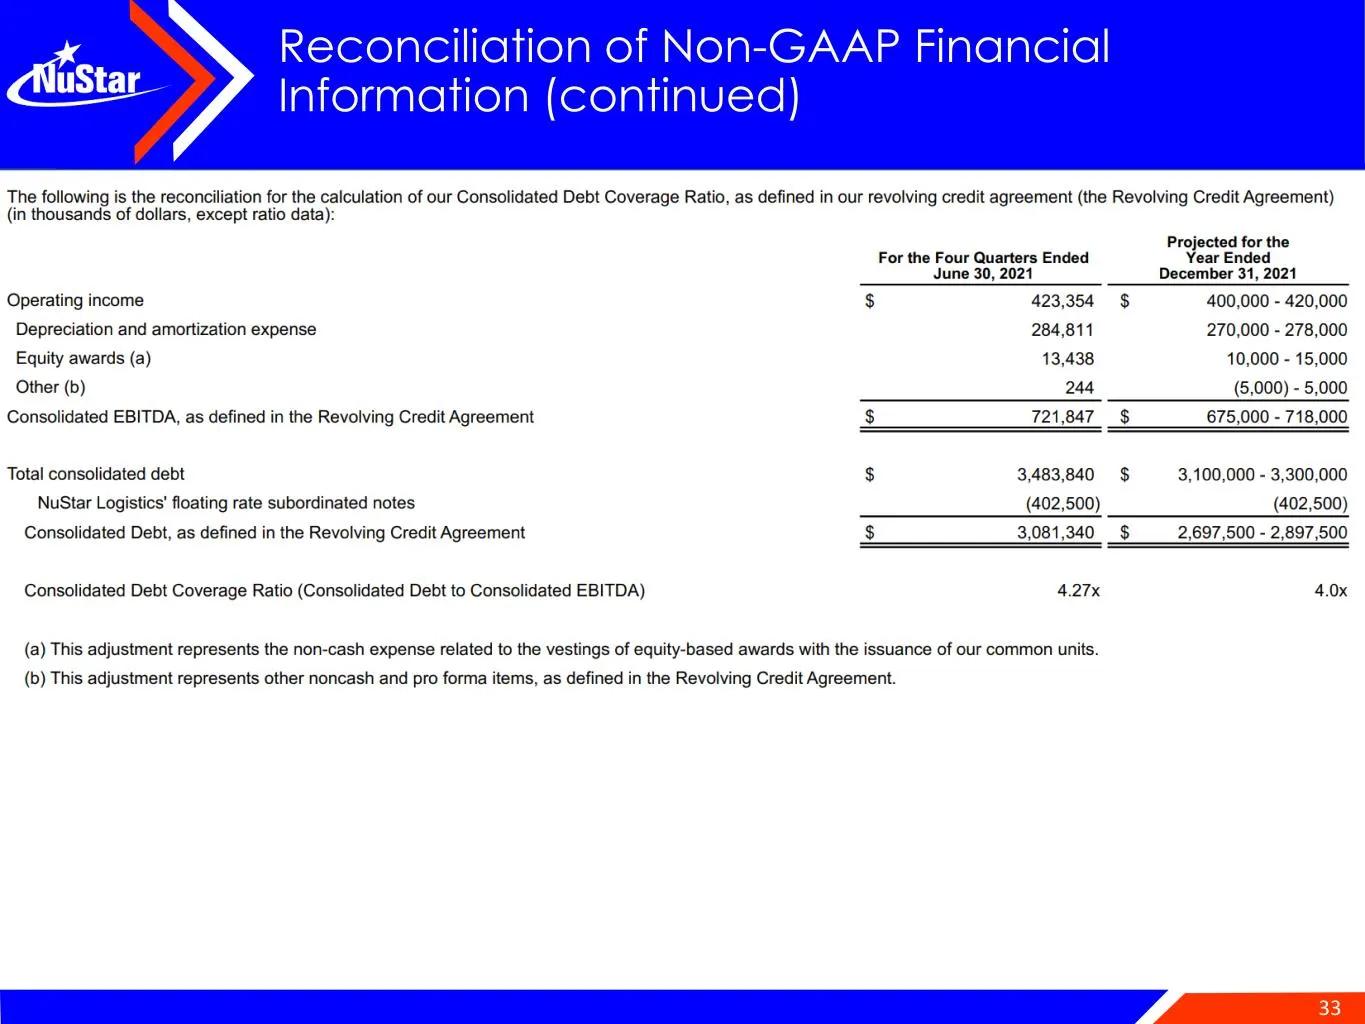
Slide 33: Reconciliation of Non-GAAP Financial Information (continued)
33 Reconciliation of Non-GAAP Financial Information (continued)
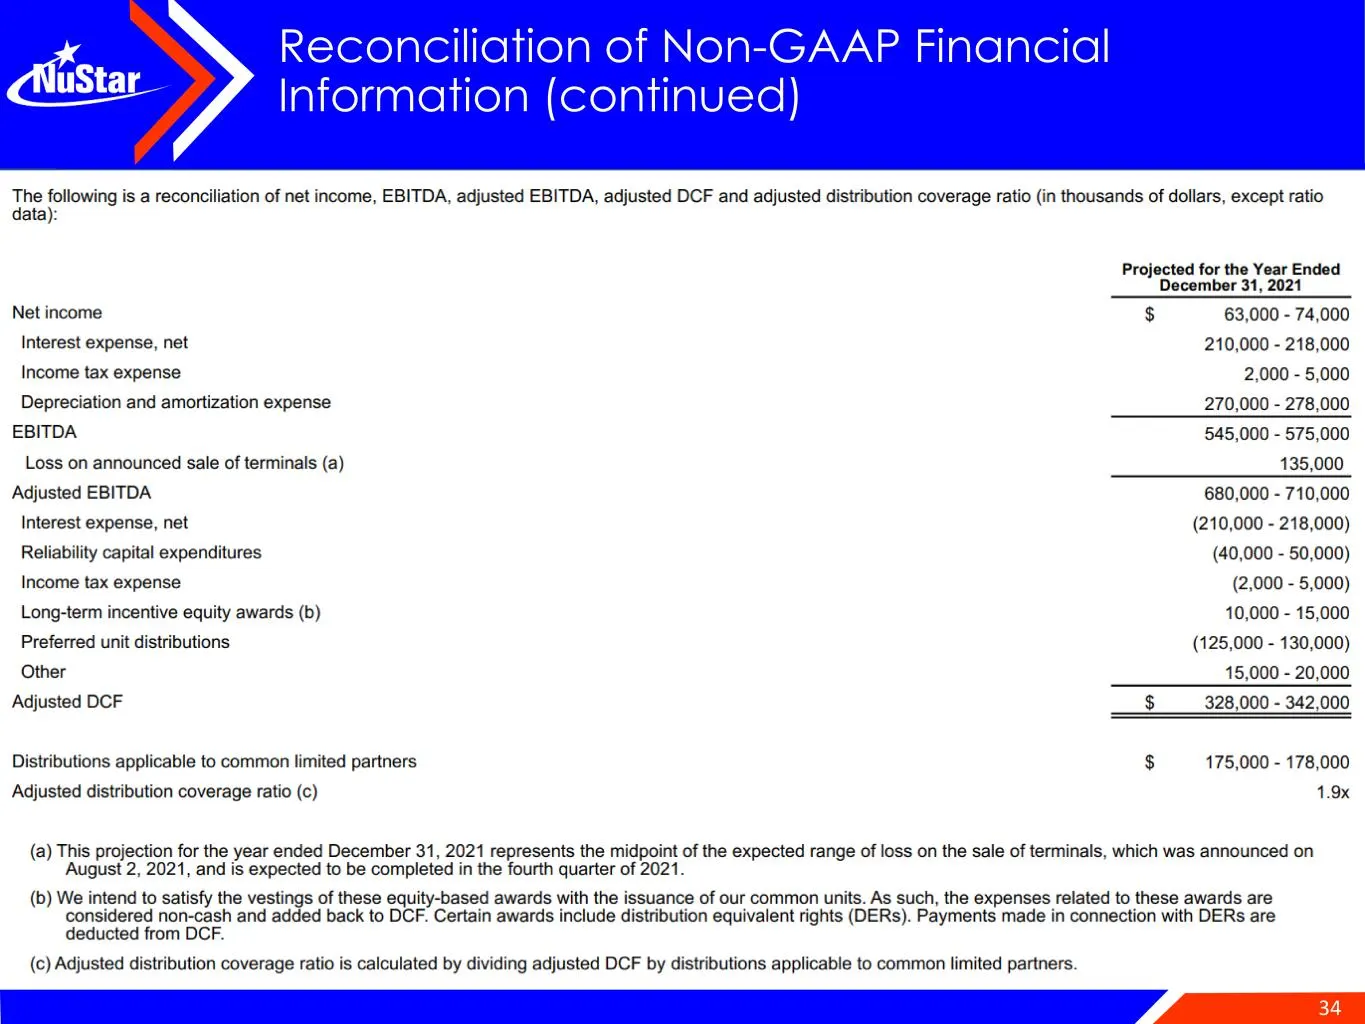
Slide 34: Reconciliation of Non-GAAP Financial Information (continued)
34 Reconciliation of Non-GAAP Financial Information (continued)
Slide 35: NuStar Contact Information
35 NuStar Contact Information INVESTOR RELATIONS For additional information about corporate sustainability at NuStar, visit http://www.NuStarEnergy.com/Sustainability SUSTAINABILITY (210) 918-INVR (4687) InvestorRelations@NuStarEnergy.com Sustainability@NuStarEnergy.com
Slide 36: Sustainability
Susta inabi l i ty J u l y 1 9 , 2 0 2 1 R e s p o n s i b l y R e s i l i e n t
Slide 37: Forward-looking Statements
Forward-looking Statements Statements contained in this presentation other than statements of historical fact are forward-looking statements. While these forward-looking statements, and any assumptions upon which they are based, are made in good faith and reflect our current judgment regarding the d
Slide 38: Table of Contents
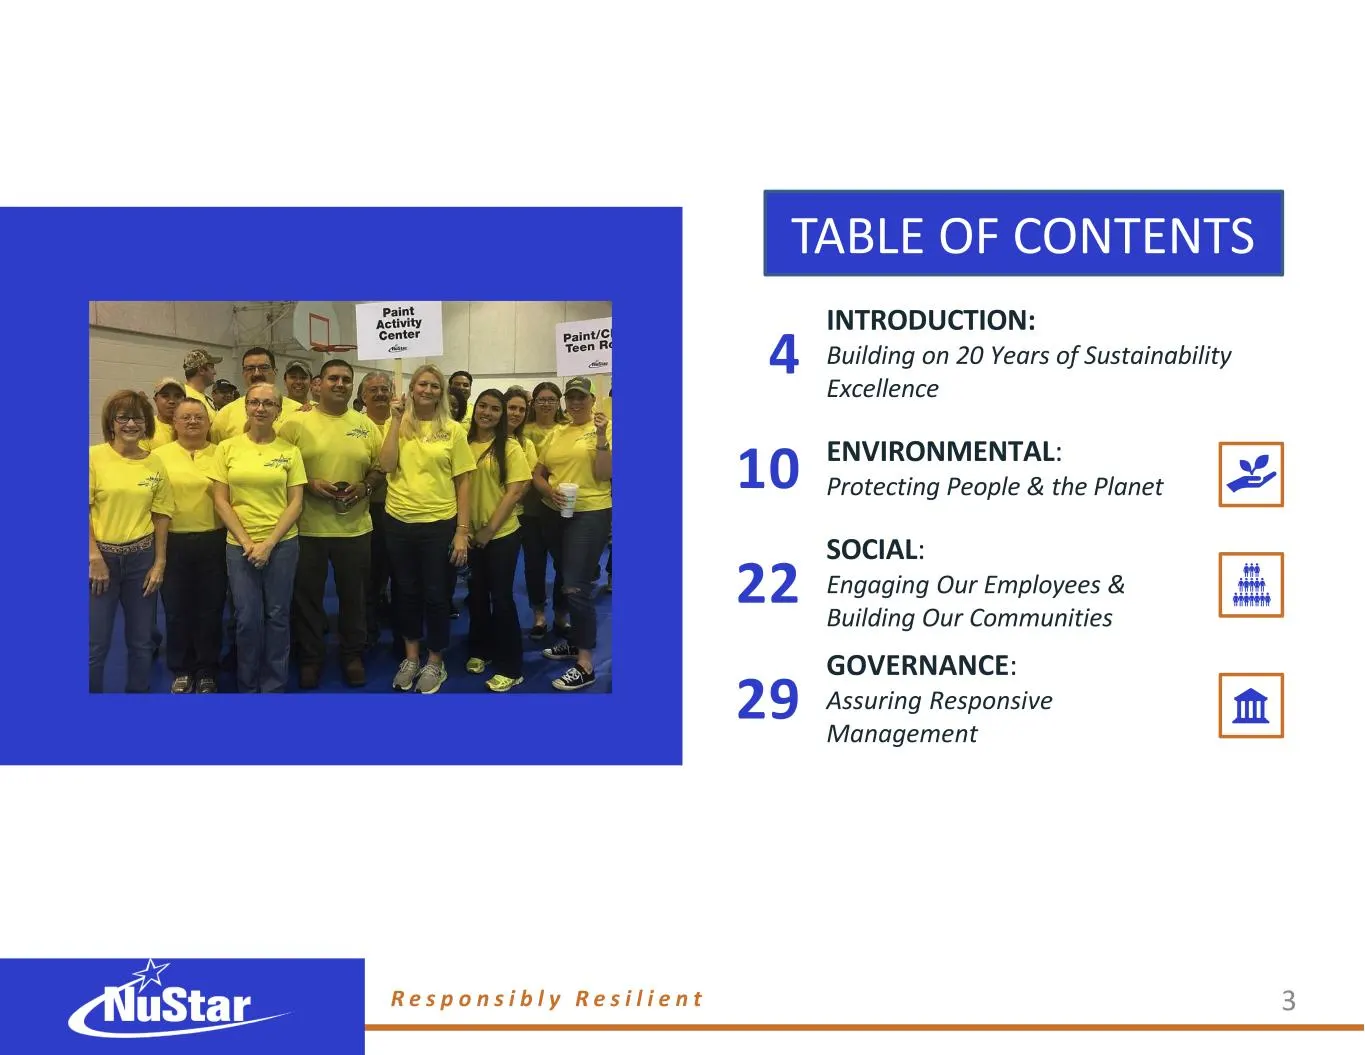
4 INTRODUCTION: Building on 20 Years of Sustainability Excellence 10 ENVIRONMENTAL: Protecting People & the Planet 22 SOCIAL: Engaging Our Employees & Building Our Communities 29 GOVERNANCE: Assuring Responsive Management R e s p o n s i b l y R e s i l i e n t 3 TABLE OF CONTENTS
Slide 39: Introduction: Building on Years of Sustainability Excellence
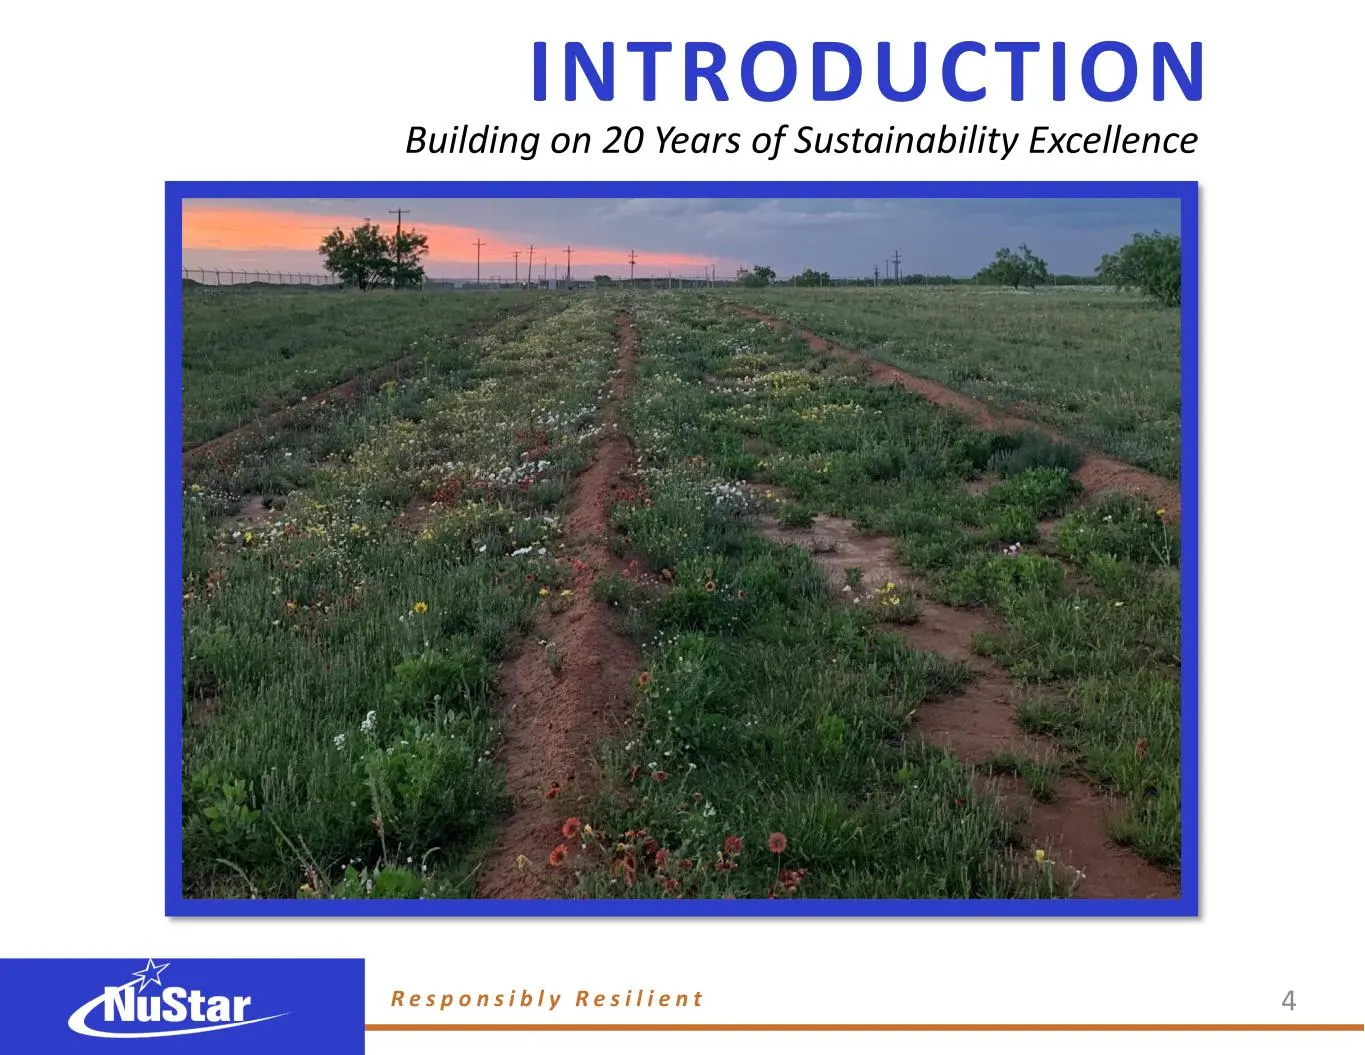
INTRODUCTION Building on 20 Years of Sustainability Excellence R e s p o n s i b l y R e s i l i e n t 4
Slide 40: Our Sustainability Commitment
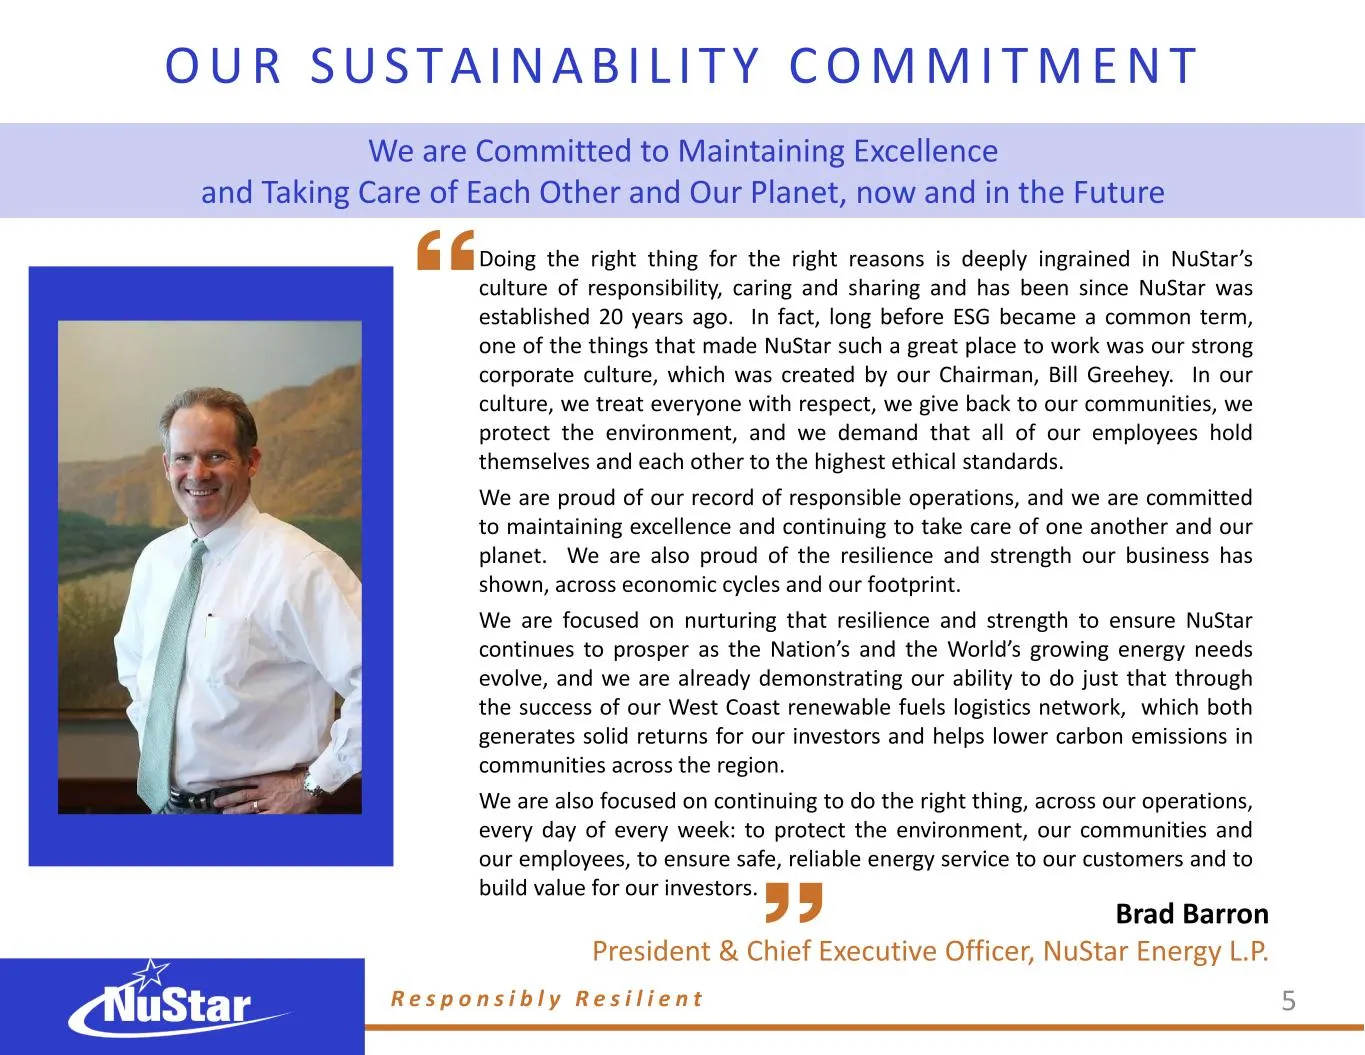
O U R S U S T A I N A B I L I T Y C O M M I T M E N T Brad Barron President & Chief Executive Officer, NuStar Energy L.P. Doing the right thing for the right reasons is deeply ingrained in NuStar’s culture of responsibility, caring and sharing and has been since NuStar was established 20 years ago.
Slide 41: Our Sustainability Priorities
O U R S U S T A I N A B I L I T Y P R I O R I T I E S Protecting People & the Planet SOCIAL Assuring Responsive Management GOVERNANCE Engaging Our Employees & Building Our Communities ENVIRONMENTAL R e s p o n s i b l y R e s i l i e n t 6
Slide 42: NuStar Transports and Stores Crude Oil, Petroleum Products, Ammonia and Renewable Fuels
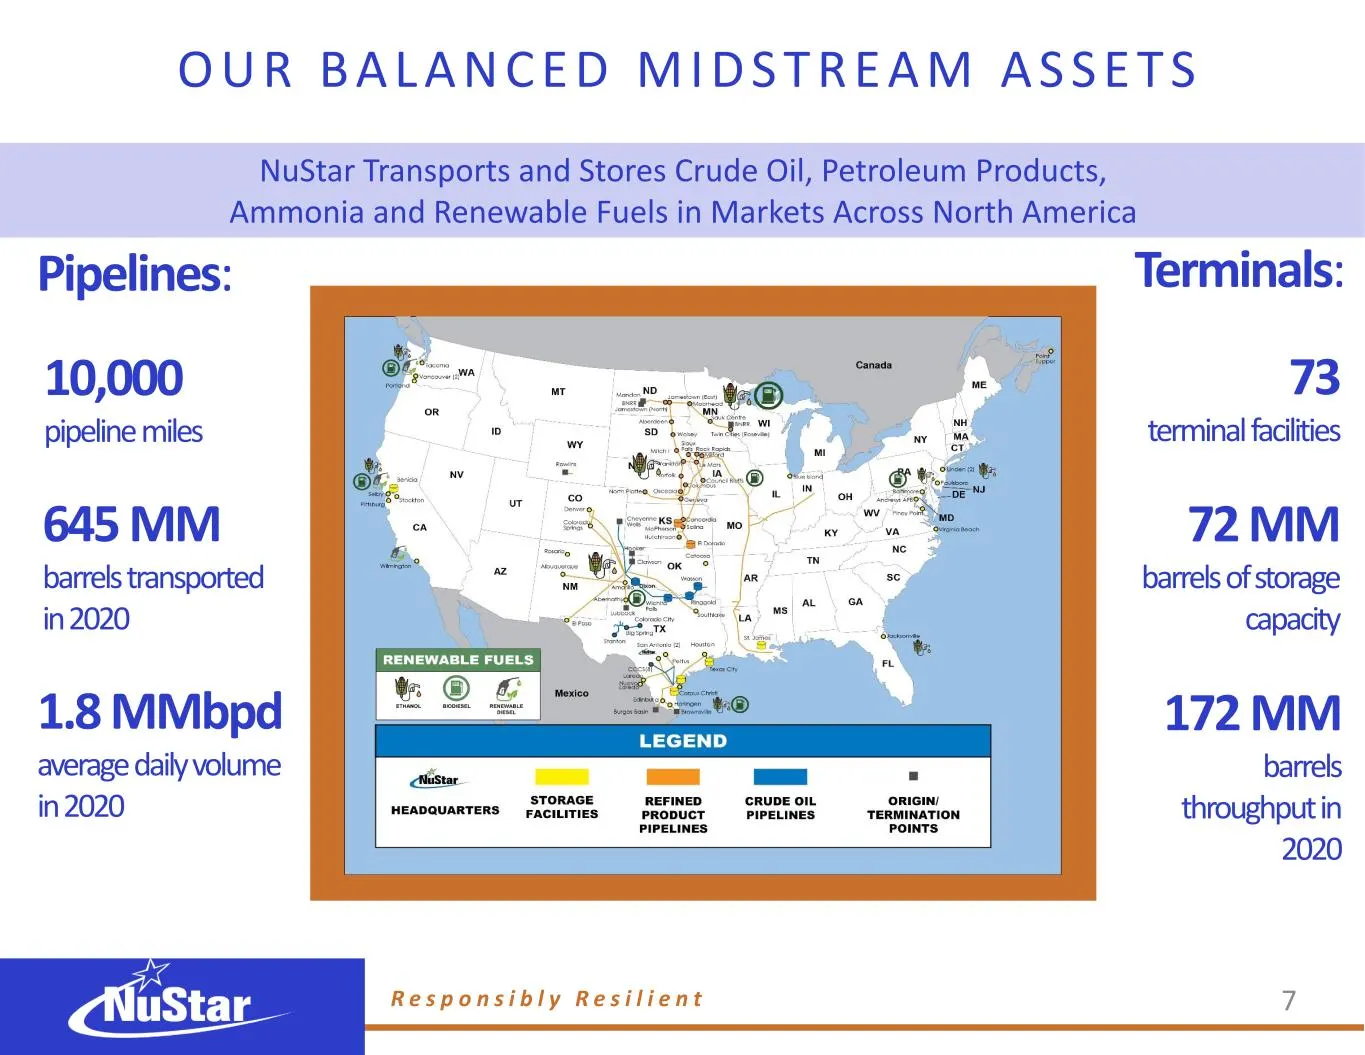
NuStar Transports and Stores Crude Oil, Petroleum Products, Ammonia and Renewable Fuels in Markets Across North America O U R B A L A N C E D M I D S T R E A M A S S E T S 10,000 pipeline miles 72 MM barrels of storage capacity 73 terminal facilities 645 MM barrels transported in 2020 172 MM barrels
Slide 43: Our Strength & Resilience in 2020
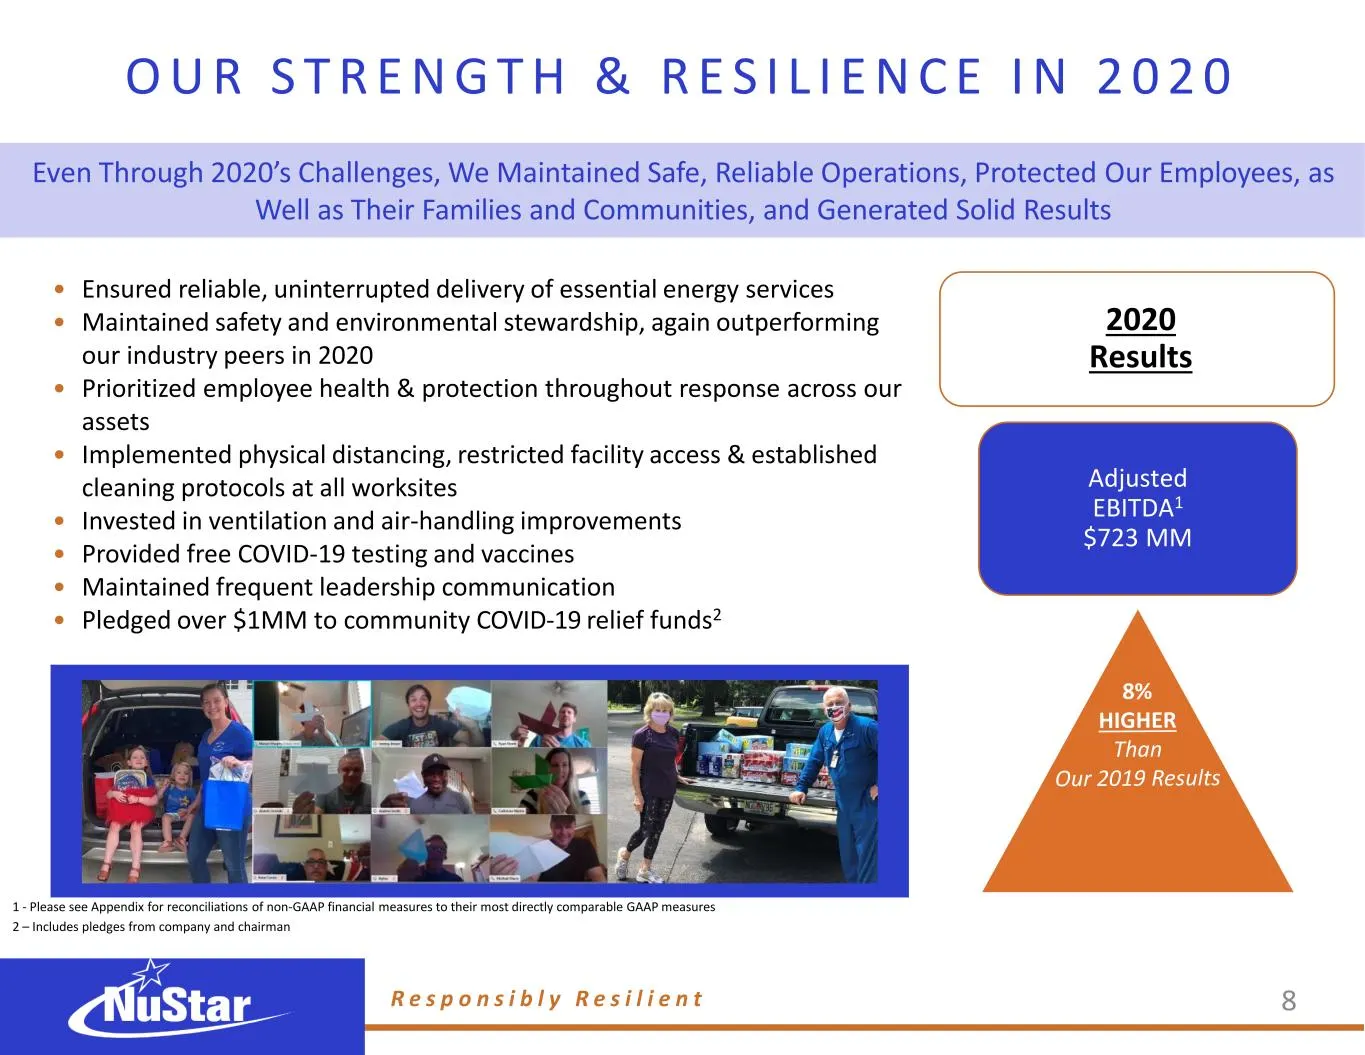
O U R S T R E N G T H & R E S I L I E N C E I N 2 0 2 0 • Ensured reliable, uninterrupted delivery of essential energy services • Maintained safety and environmental stewardship, again outperforming our industry peers in 2020 • Prioritized employee health & protection throughout response across our
Slide 44: Our Economic Impact in 2020
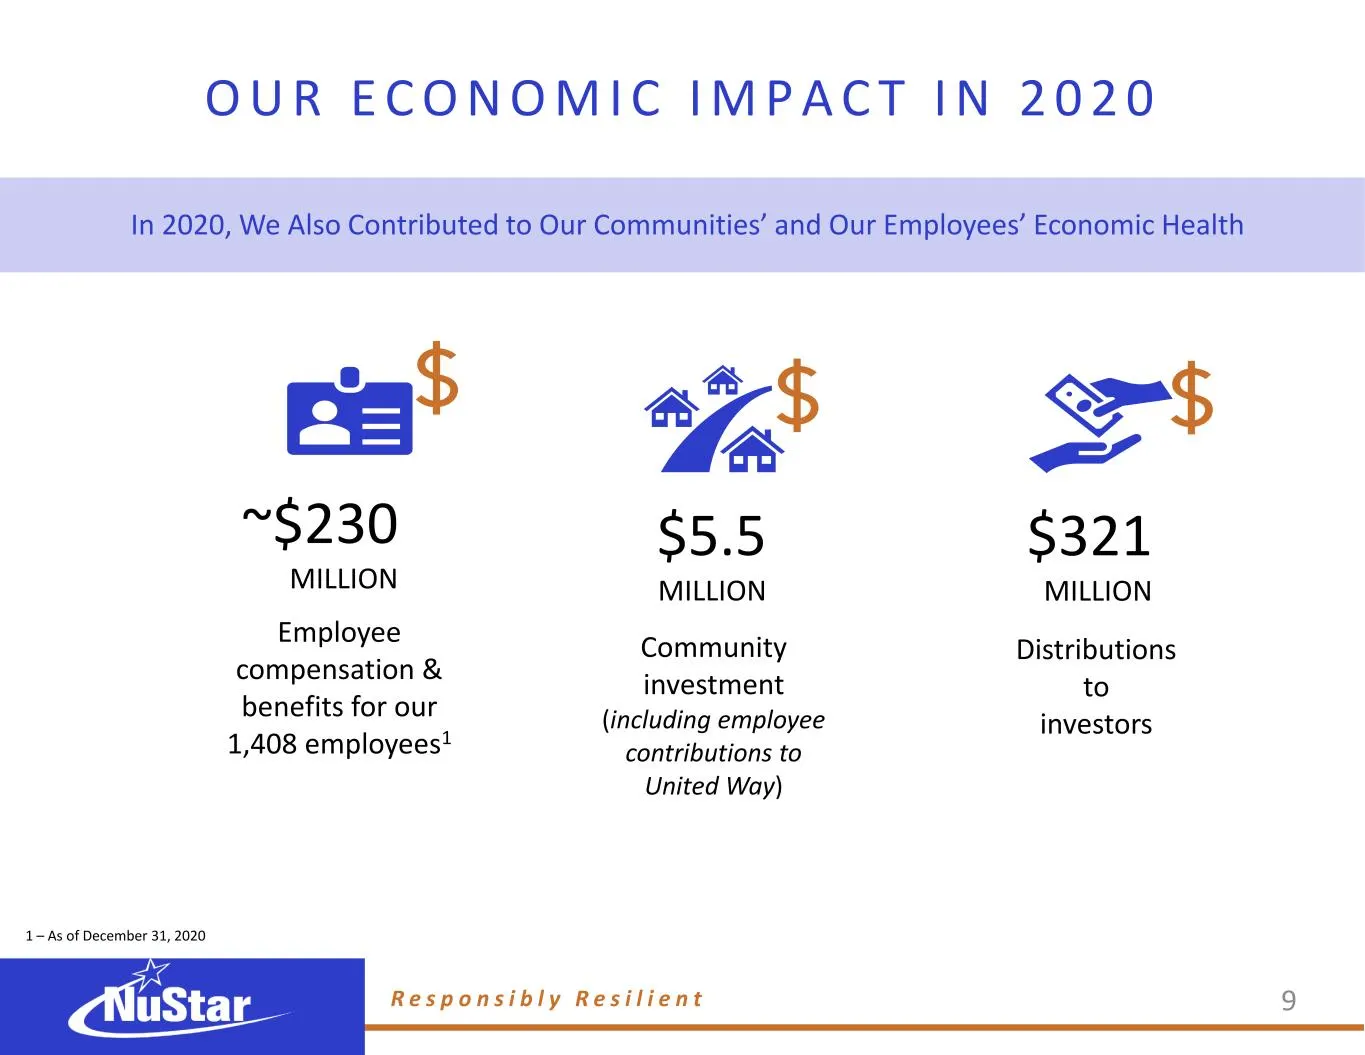
Community investment (including employee contributions to United Way) $5.5 MILLION Distributions to investors $321 MILLION Employee compensation & benefits for our 1,408 employees1 ~$230 MILLION O U R E C O N O M I C I M P A C T I N 2 0 2 0 R e s p o n s i b l y R e s i l i e n t In 2020, We Also Co
Slide 45: Environmental: Protecting People & the Planet
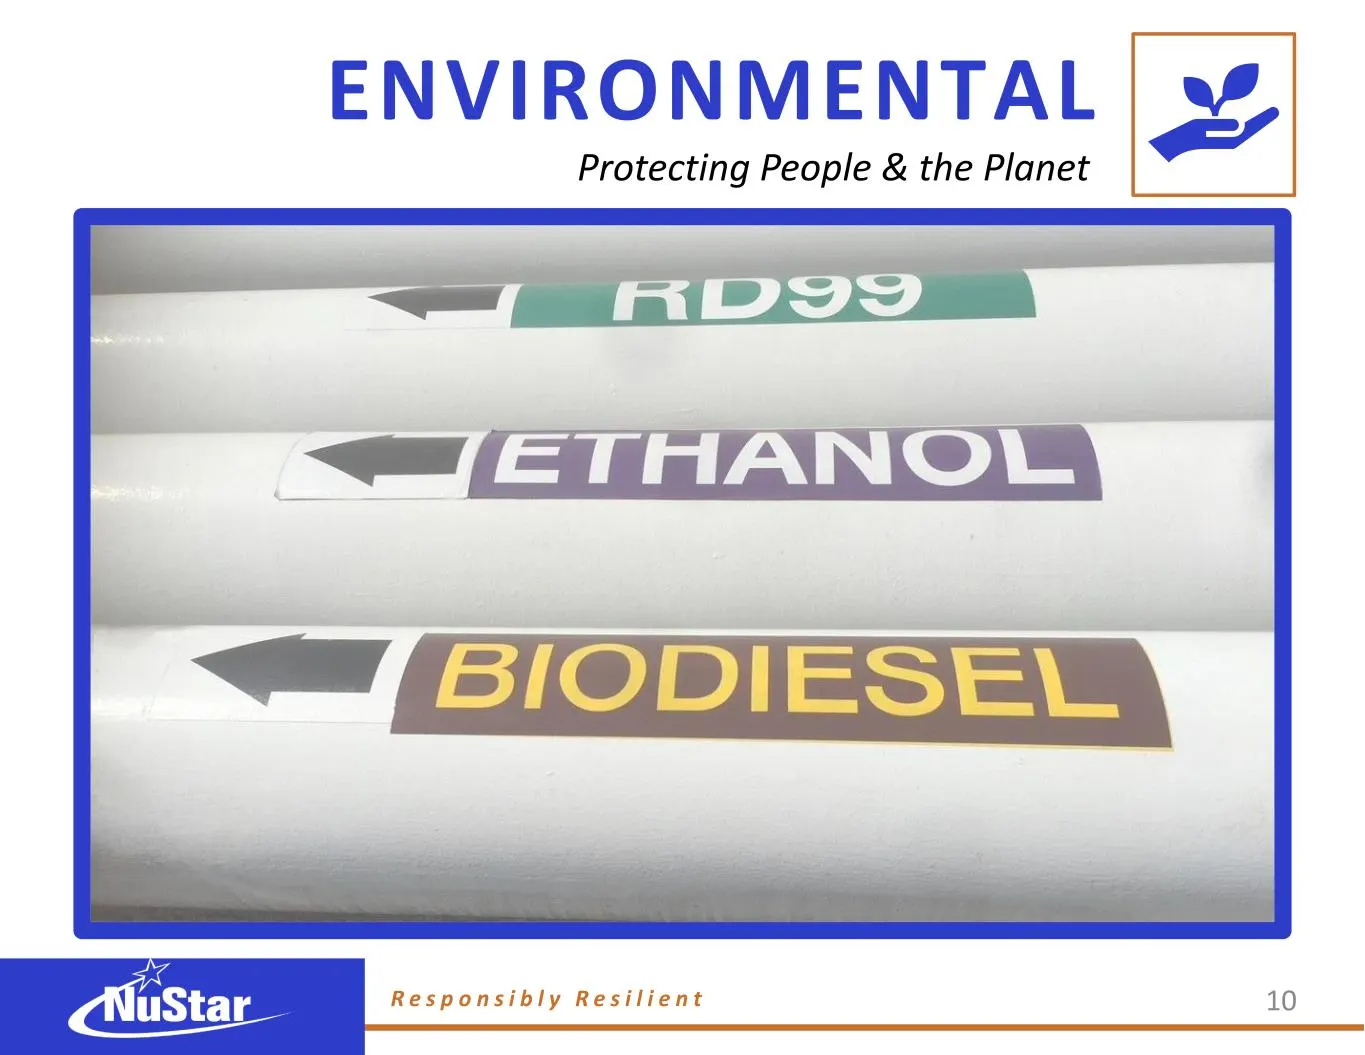
ENVIRONMENTAL Protecting People & the Planet R e s p o n s i b l y R e s i l i e n t 10
Slide 46: Committed to Safe, Reliable Access to Energy
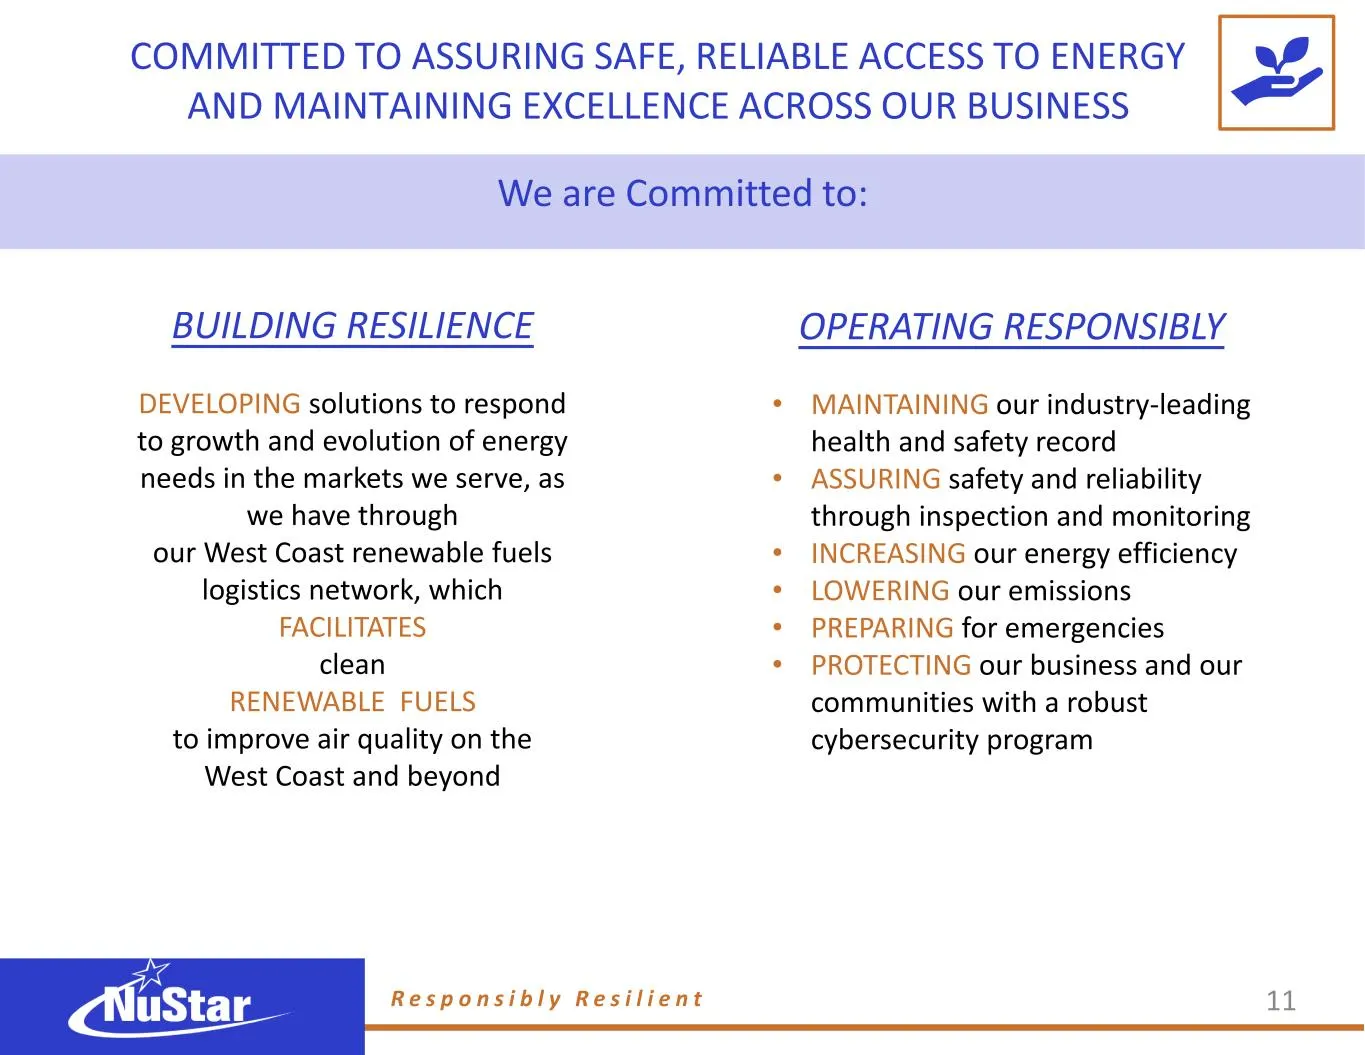
COMMITTED TO ASSURING SAFE, RELIABLE ACCESS TO ENERGY AND MAINTAINING EXCELLENCE ACROSS OUR BUSINESS DEVELOPING solutions to respond to growth and evolution of energy needs in the markets we serve, as we have through our West Coast renewable fuels logistics network, which FACILITATES clean RENEWABLE
Slide 47: Building Resilience: Decarbonizing Driving on the West Coast
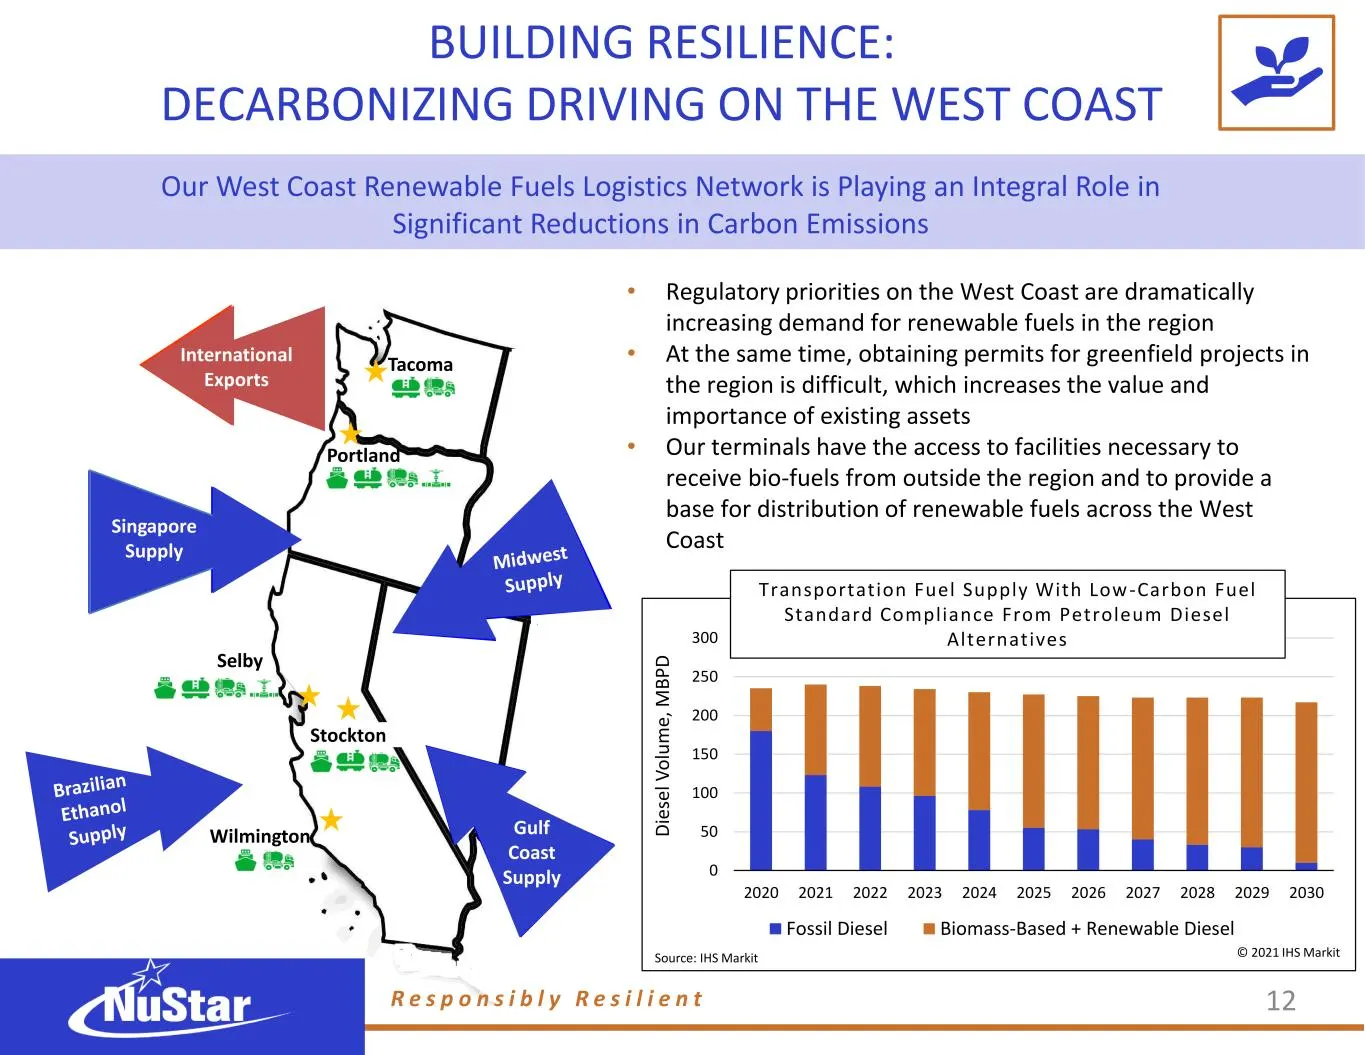
0 50 100 150 200 250 300 2020 2021 2022 2023 2024 2025 2026 2027 2028 2029 2030 D ie se l V o lu m e, M B P D Fossil Diesel Biomass-Based + Renewable Diesel Source: IHS Markit © 2021 IHS Markit BUILDING RESILIENCE: DECARBONIZING DRIVING ON THE WEST COAST • Regulatory priorities on the West Coast are
Slide 48: Building Resilience: Renewable Fuels Handling Leader
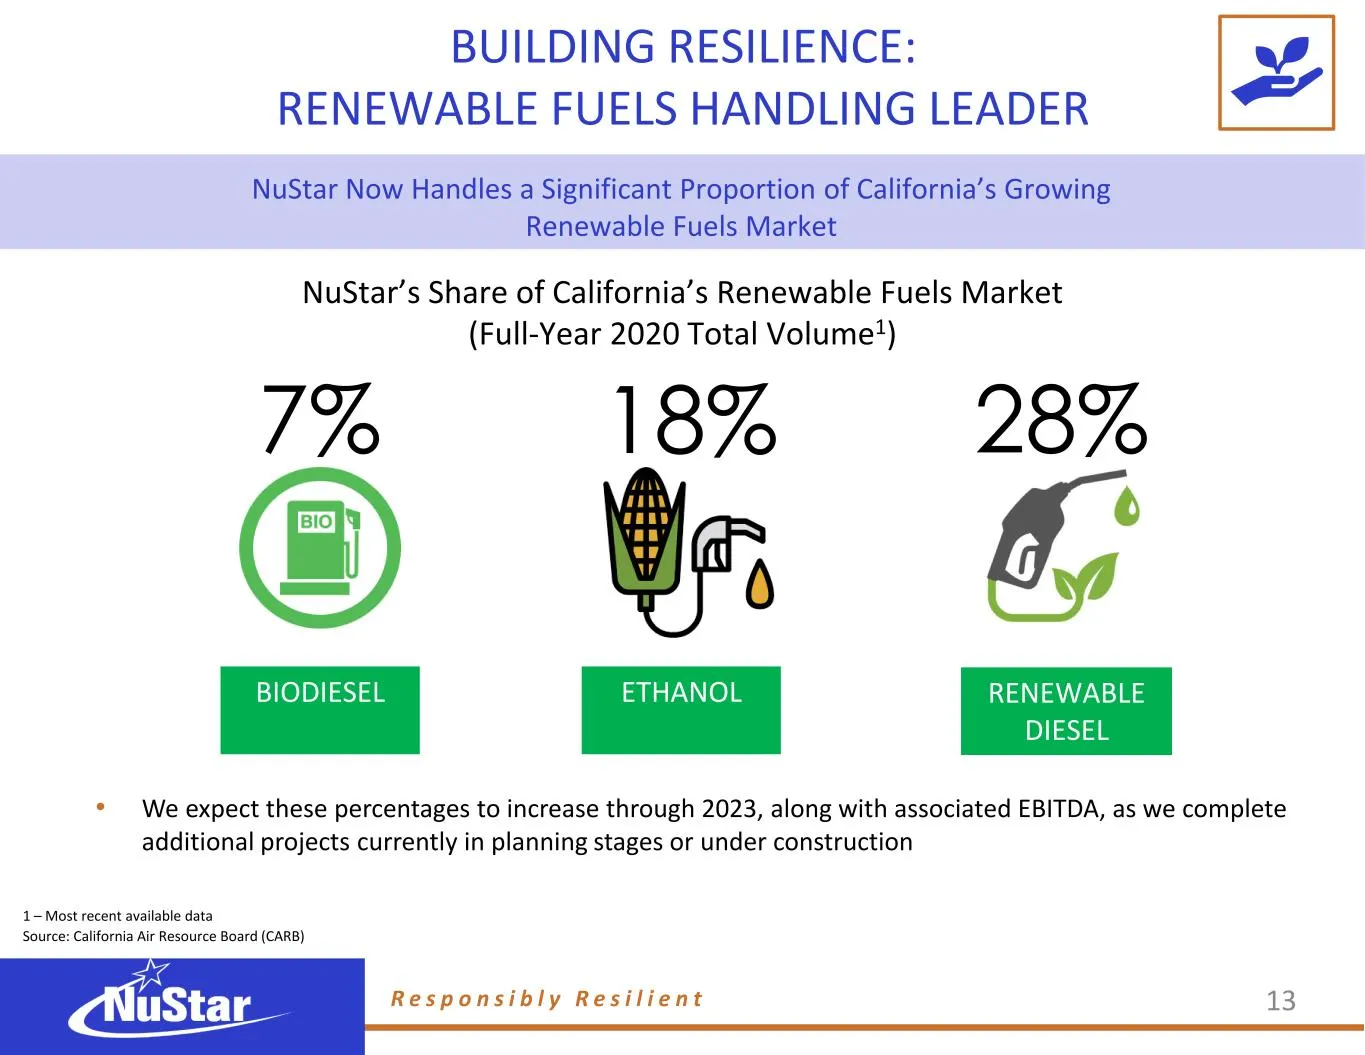
BUILDING RESILIENCE: RENEWABLE FUELS HANDLING LEADER • We expect these percentages to increase through 2023, along with associated EBITDA, as we complete additional projects currently in planning stages or under construction BIODIESEL ETHANOL RENEWABLE DIESEL 7% 18% 28% NuStar Now Handles a Signific
Slide 49: Building Resilience: Low-Carbon Mandate Opportunity
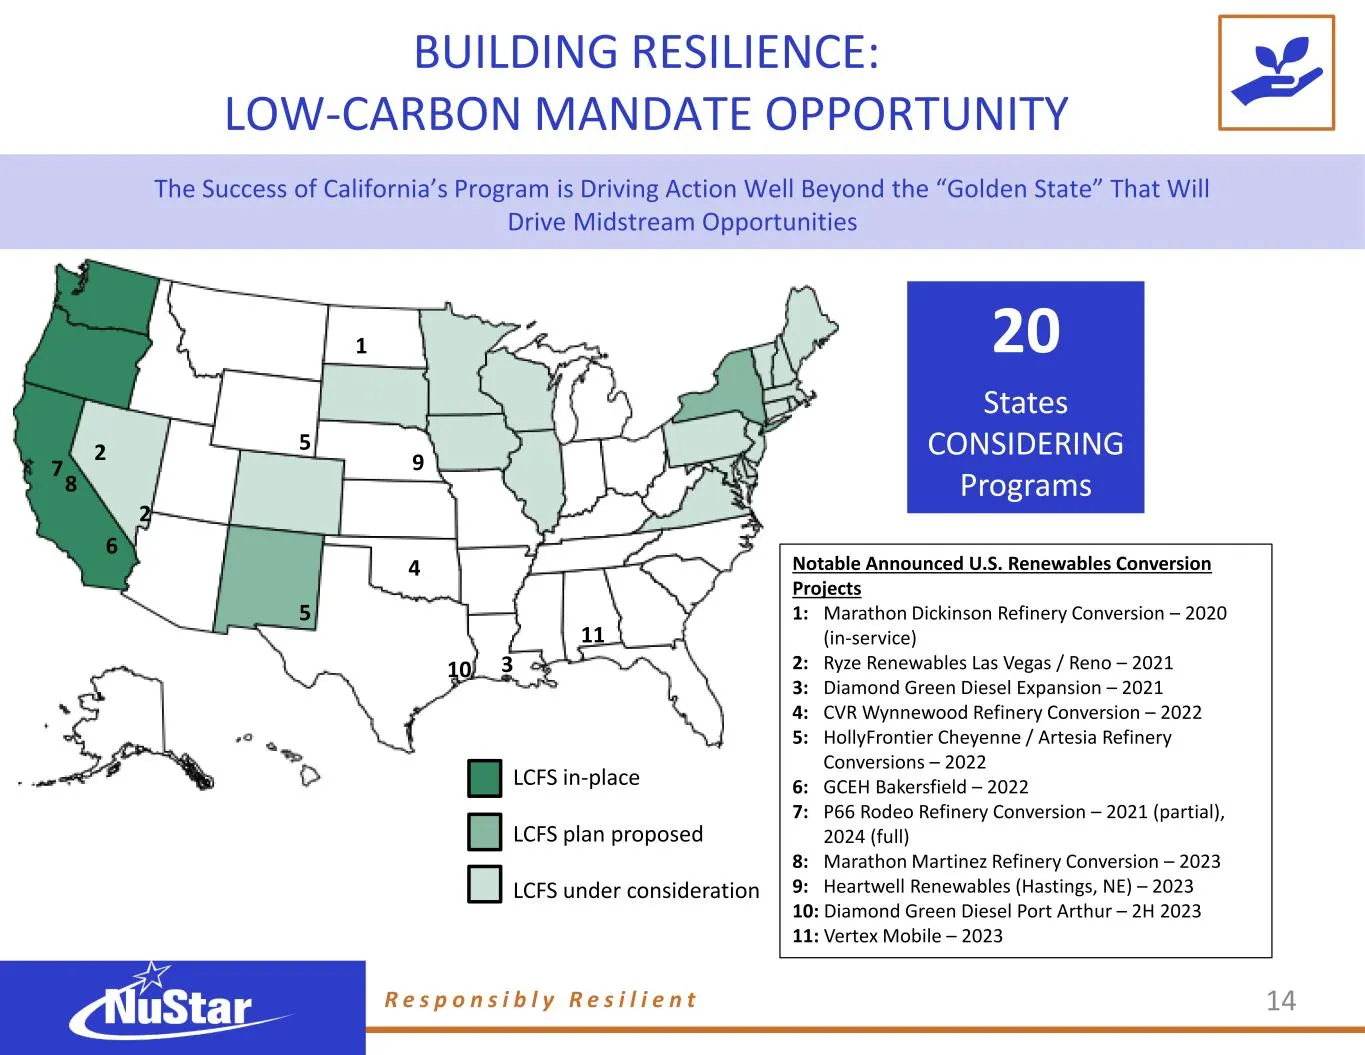
BUILDING RESILIENCE: LOW-CARBON MANDATE OPPORTUNITY The Success of California’s Program is Driving Action Well Beyond the “Golden State” That Will Drive Midstream Opportunities R e s p o n s i b l y R e s i l i e n t 14 20 States CONSIDERING Programs 7 2 2 8 3 5 5 6 4 1 10 9 11 LCFS in-place LCFS pl
Slide 50: Pipelines Are the Safest, Most Energy-Efficient Choice
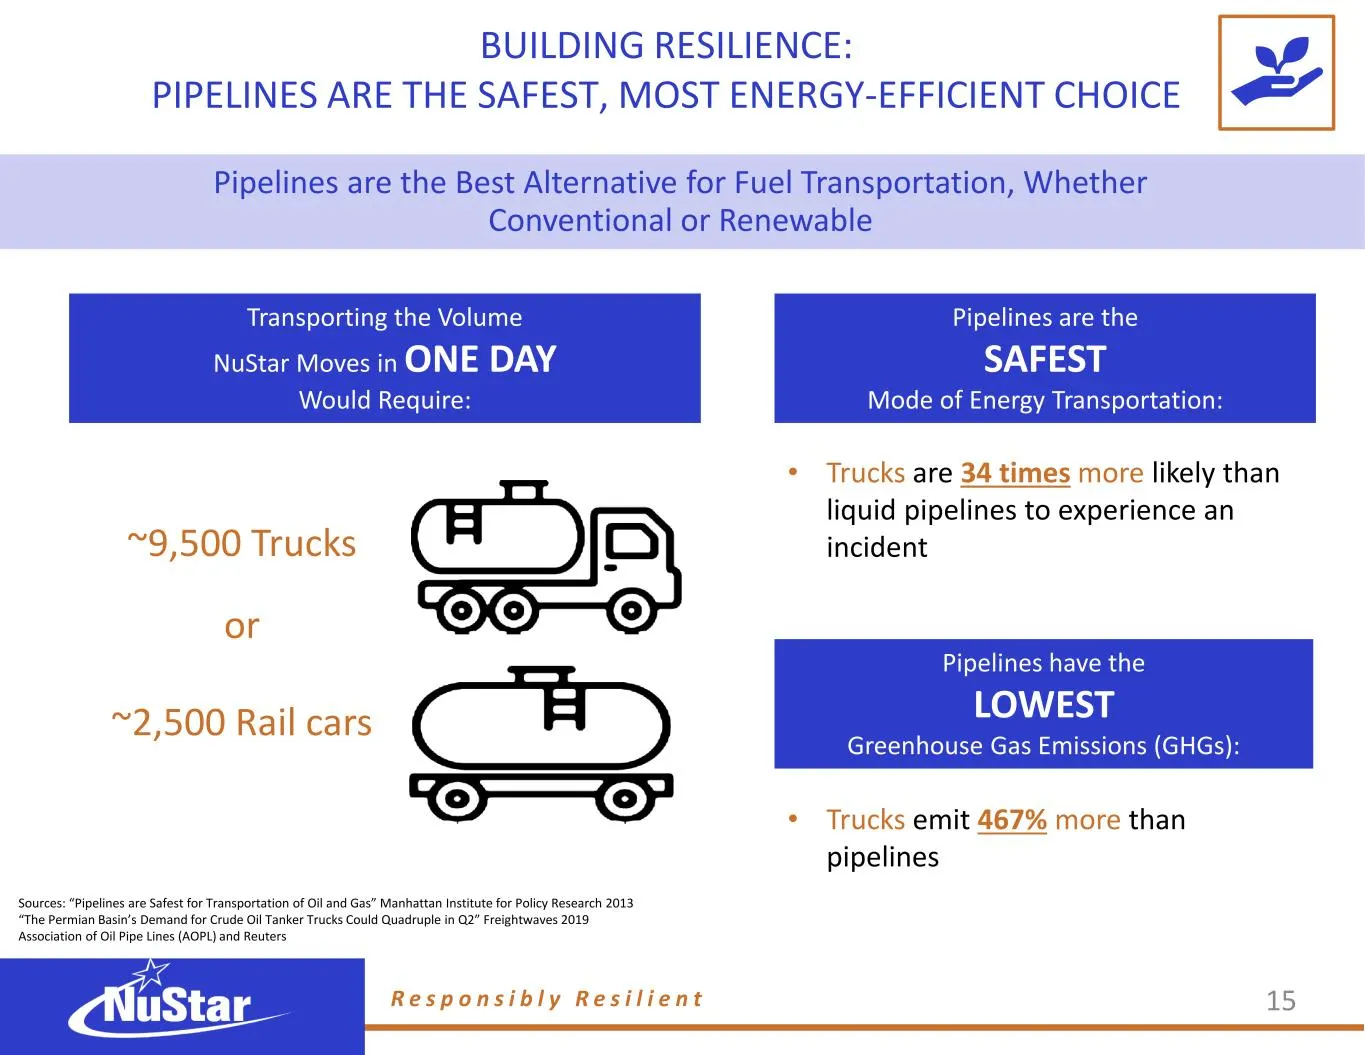
BUILDING RESILIENCE: PIPELINES ARE THE SAFEST, MOST ENERGY-EFFICIENT CHOICE Pipelines are the Best Alternative for Fuel Transportation, Whether Conventional or Renewable Pipelines have the LOWEST Greenhouse Gas Emissions (GHGs): Sources: “Pipelines are Safest for Transportation of Oil and Gas” Manha
Slide 51: Maintaining Our Strong Safety Culture & Record
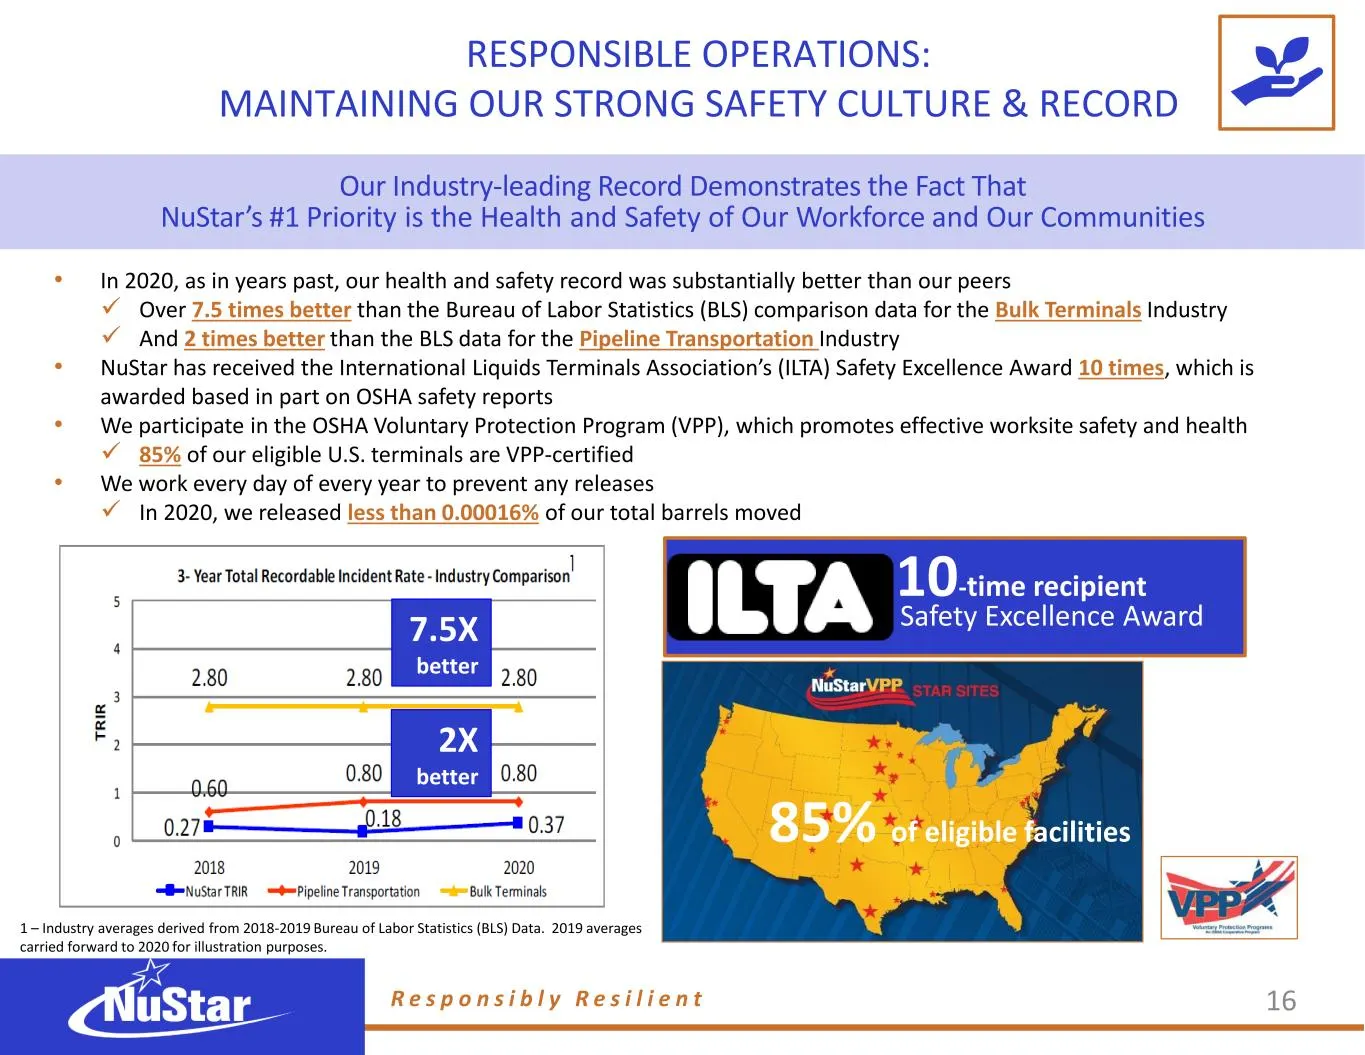
RESPONSIBLE OPERATIONS: MAINTAINING OUR STRONG SAFETY CULTURE & RECORD 3 year 0.69 3 year Average(1): 0.70 Our Industry-leading Record Demonstrates the Fact That NuStar’s #1 Priority is the Health and Safety of Our Workforce and Our Communities 1 – Industry averages derived from 2018-2019 Bureau of
Slide 52: Assuring Safety and Reliability Through Inspection
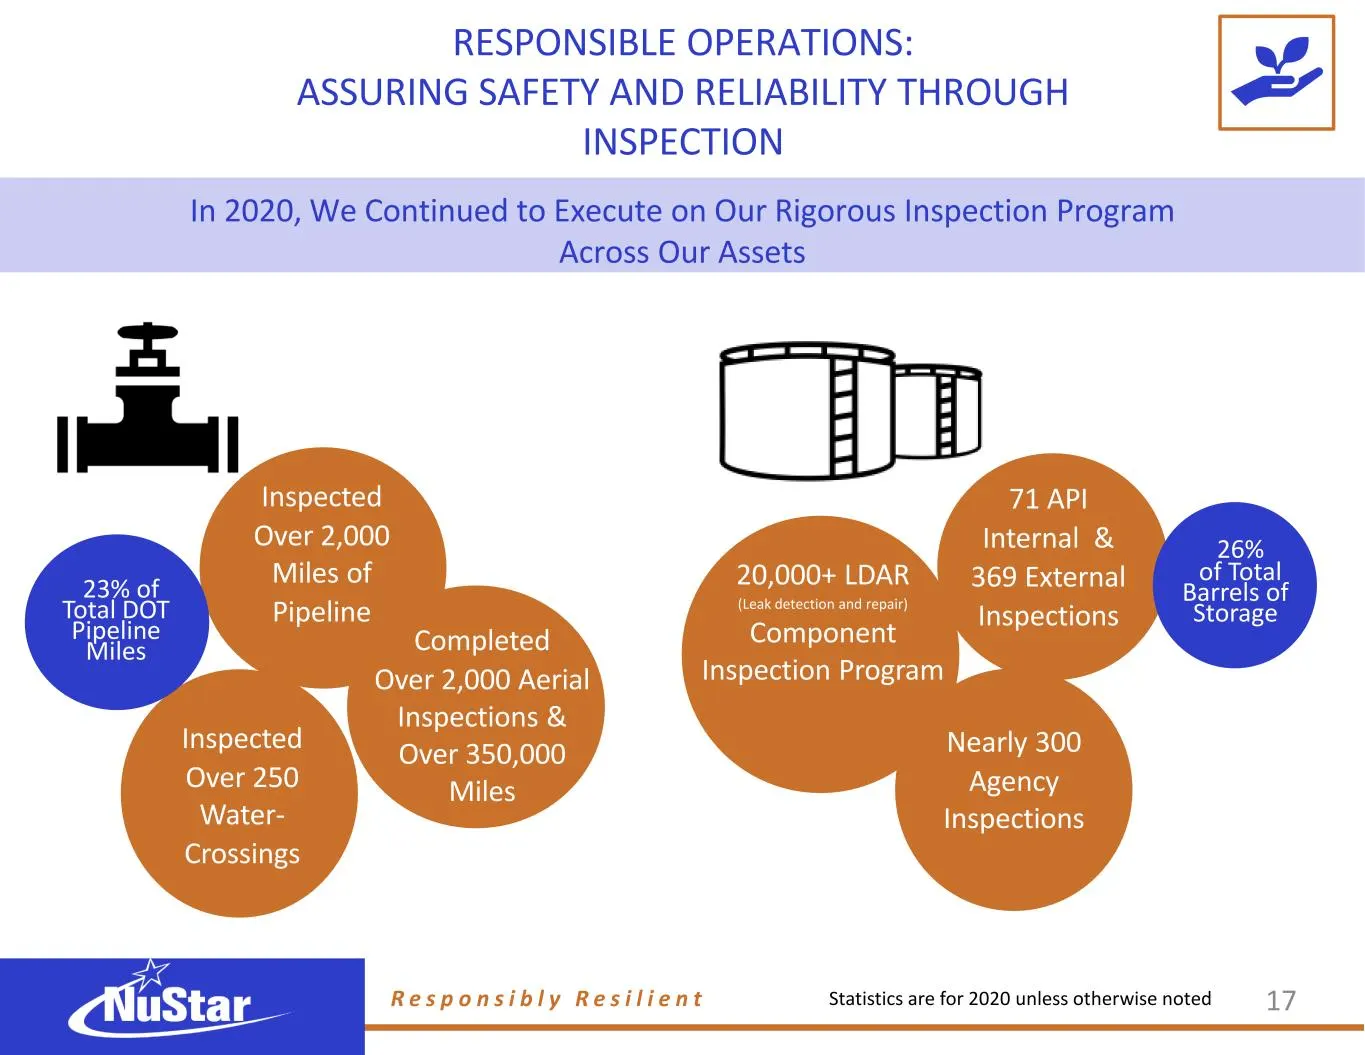
RESPONSIBLE OPERATIONS: ASSURING SAFETY AND RELIABILITY THROUGH INSPECTION 70 Internal & 369 External Inspections R e s p o n s i b l y R e s i l i e n t 71 API Internal & 369 External Inspections Inspected Over 2,000 Miles of Pipeline Inspected Over 250 Water- Crossings 20,000+ LDAR (Leak detection
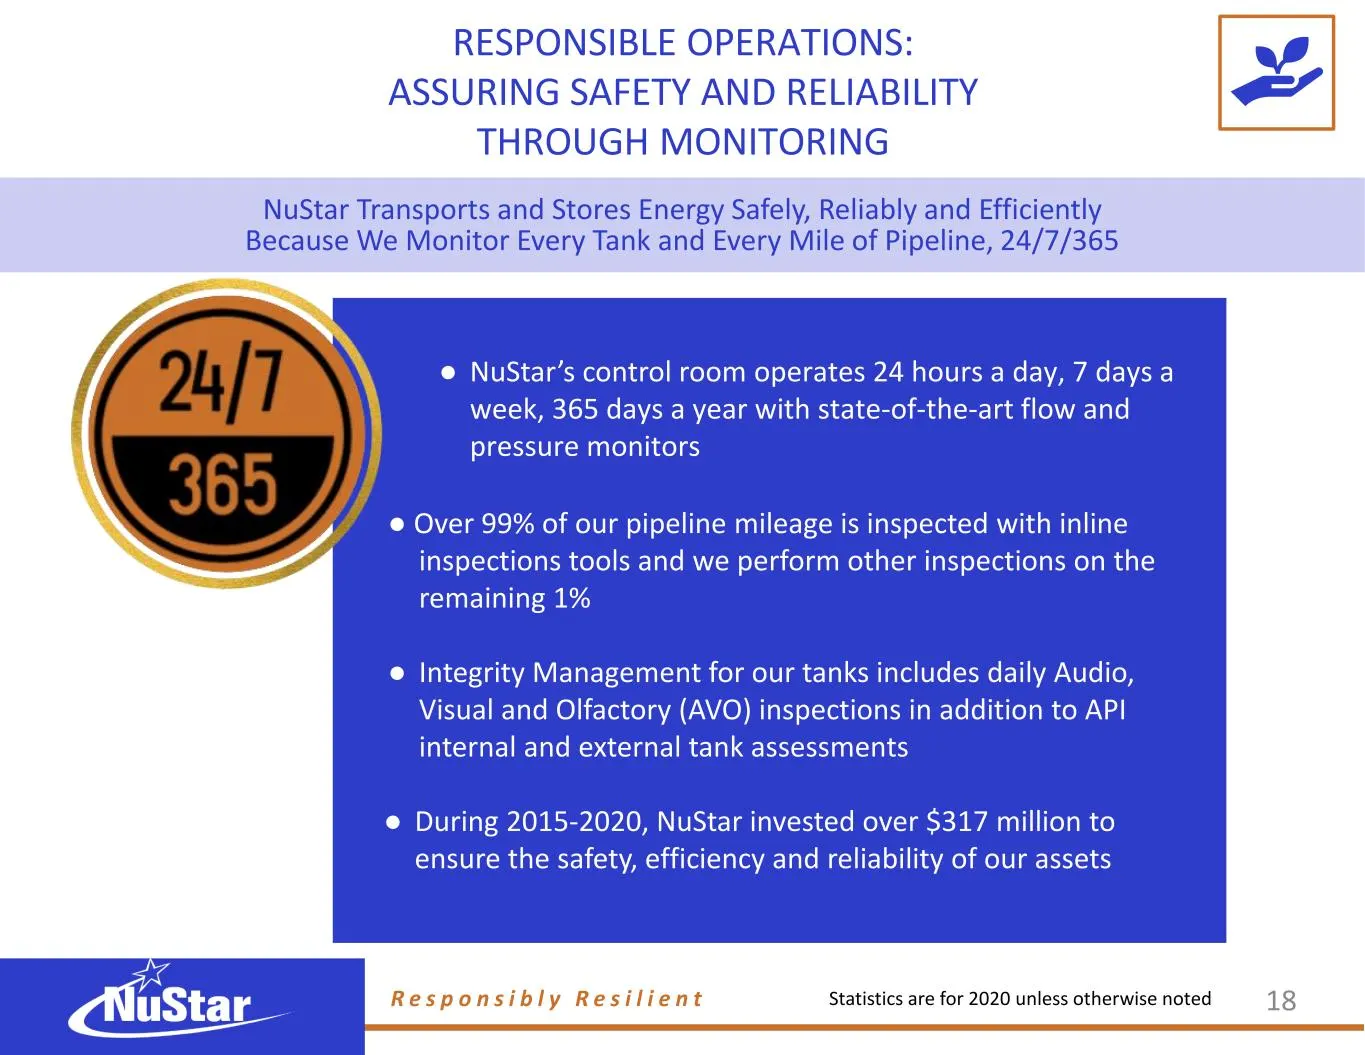
Slide 53: Assuring Safety and Reliability Through Monitoring
RESPONSIBLE OPERATIONS: ASSURING SAFETY AND RELIABILITY THROUGH MONITORING NuStar Transports and Stores Energy Safely, Reliably and Efficiently Because We Monitor Every Tank and Every Mile of Pipeline, 24/7/365 70 Internal & 369 External Inspections$____ Invested on integrity programs 2015-2020 R e
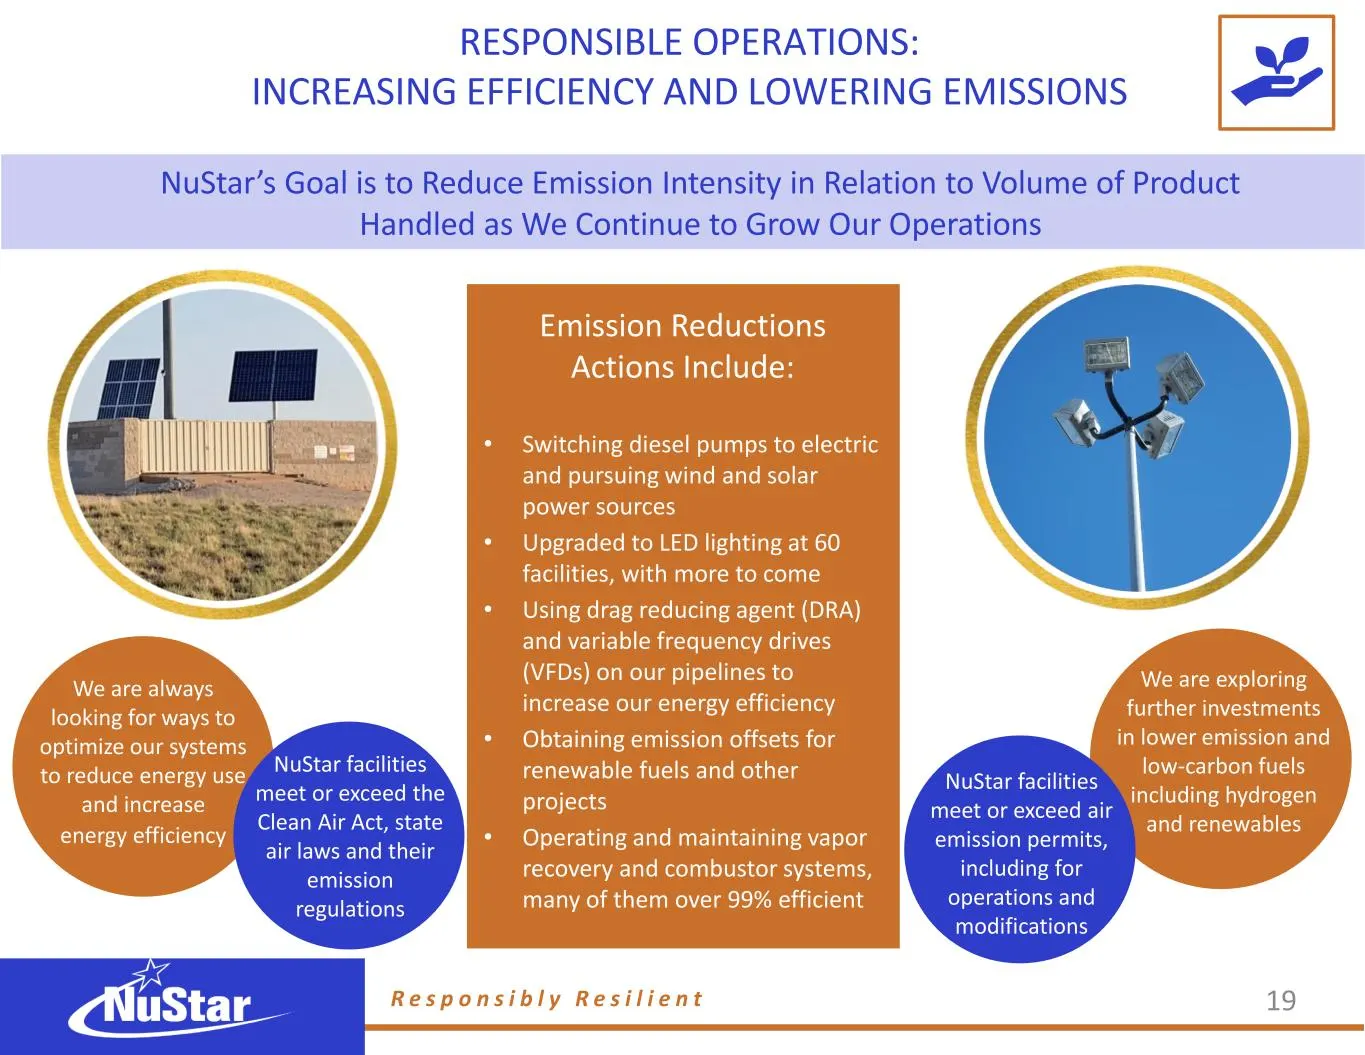
Slide 54: Increasing Efficiency and Lowering Emissions
RESPONSIBLE OPERATIONS: INCREASING EFFICIENCY AND LOWERING EMISSIONS R e s p o n s i b l y R e s i l i e n t NuStar’s Goal is to Reduce Emission Intensity in Relation to Volume of Product Handled as We Continue to Grow Our Operations 19 We are exploring further investments in lower emission and low-
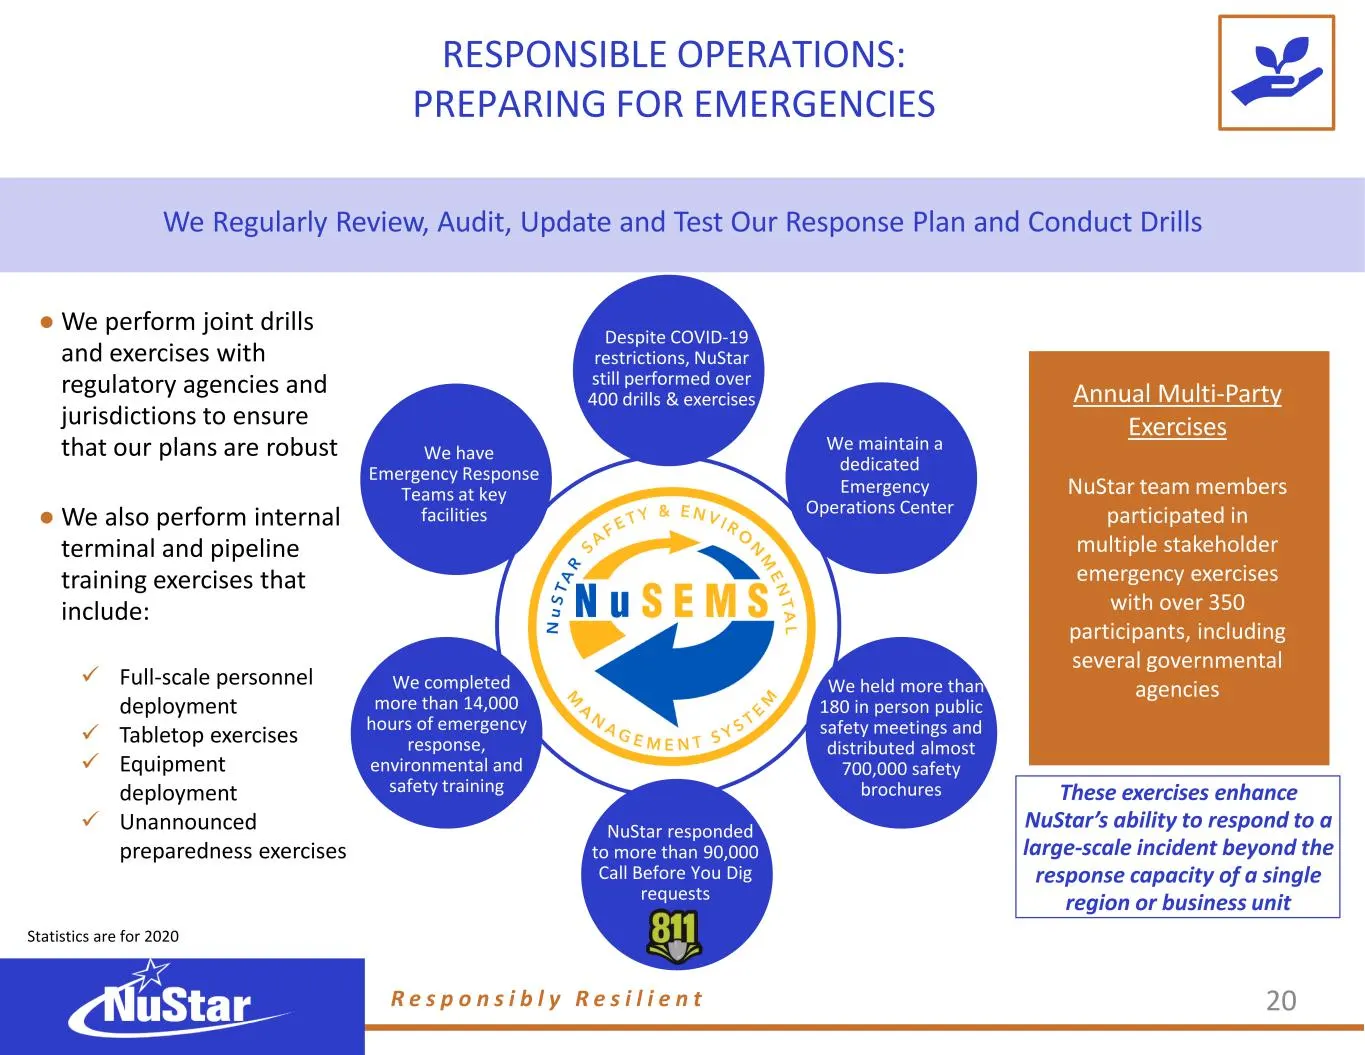
Slide 55: Preparing for Emergencies
RESPONSIBLE OPERATIONS: PREPARING FOR EMERGENCIES ● We perform joint drills and exercises with regulatory agencies and jurisdictions to ensure that our plans are robust ● We also perform internal terminal and pipeline training exercises that include: ✓ Full-scale personnel deployment ✓ Tabletop exer
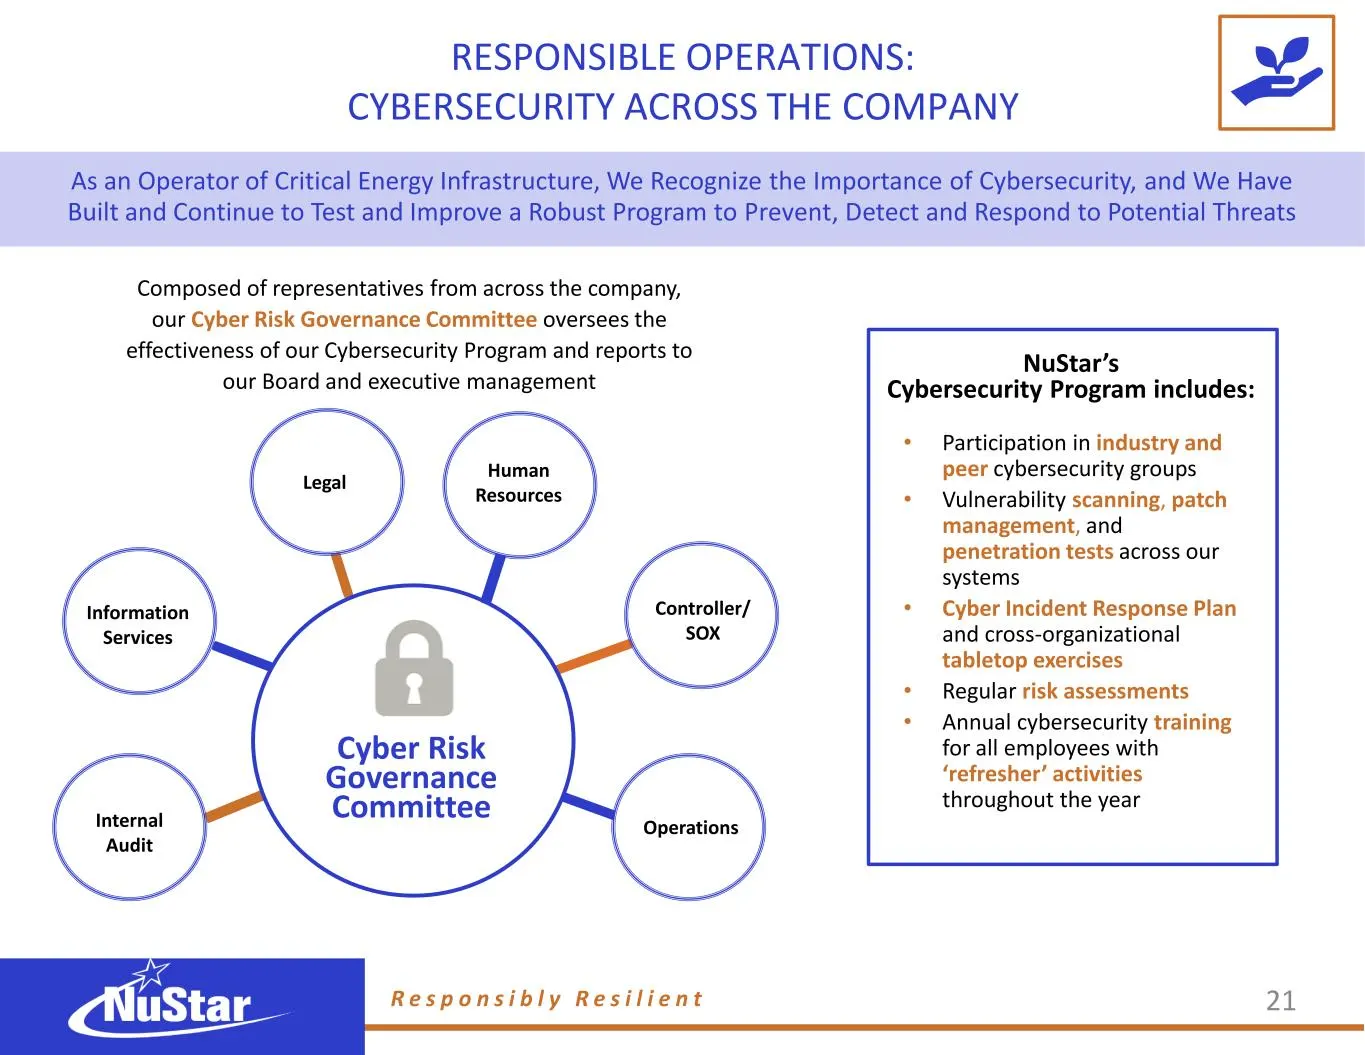
Slide 56: Cybersecurity Across the Company
RESPONSIBLE OPERATIONS: CYBERSECURITY ACROSS THE COMPANY As an Operator of Critical Energy Infrastructure, We Recognize the Importance of Cybersecurity, and We Have Built and Continue to Test and Improve a Robust Program to Prevent, Detect and Respond to Potential Threats Composed of representatives
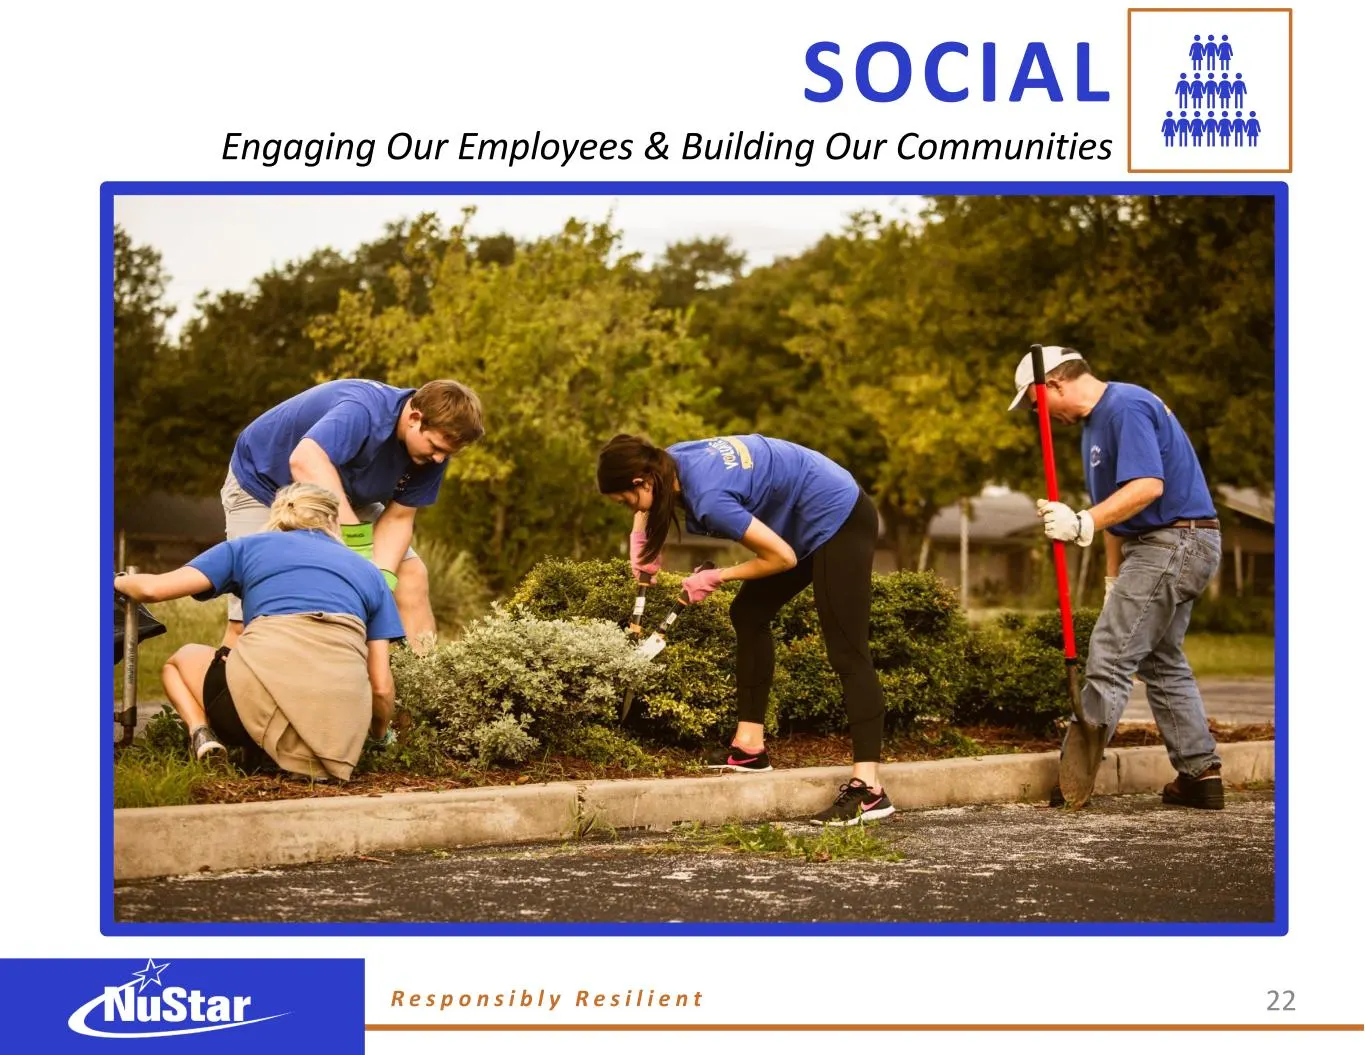
Slide 57: Social: Engaging Our Employees & Building Our Communities
SOCIAL Engaging Our Employees & Building Our Communities R e s p o n s i b l y R e s i l i e n t 22

Slide 58: Awards & Recognitions
We Have Been Recognized for Our Safe, Responsible Operations and Our Commitment to Our Employees and Diversity O U R A W A R D S & R E C O G N I T I O N S Safety Excellence Award 10-time recipient 12times R e s p o n s i b l y R e s i l i e n t 23 5 times
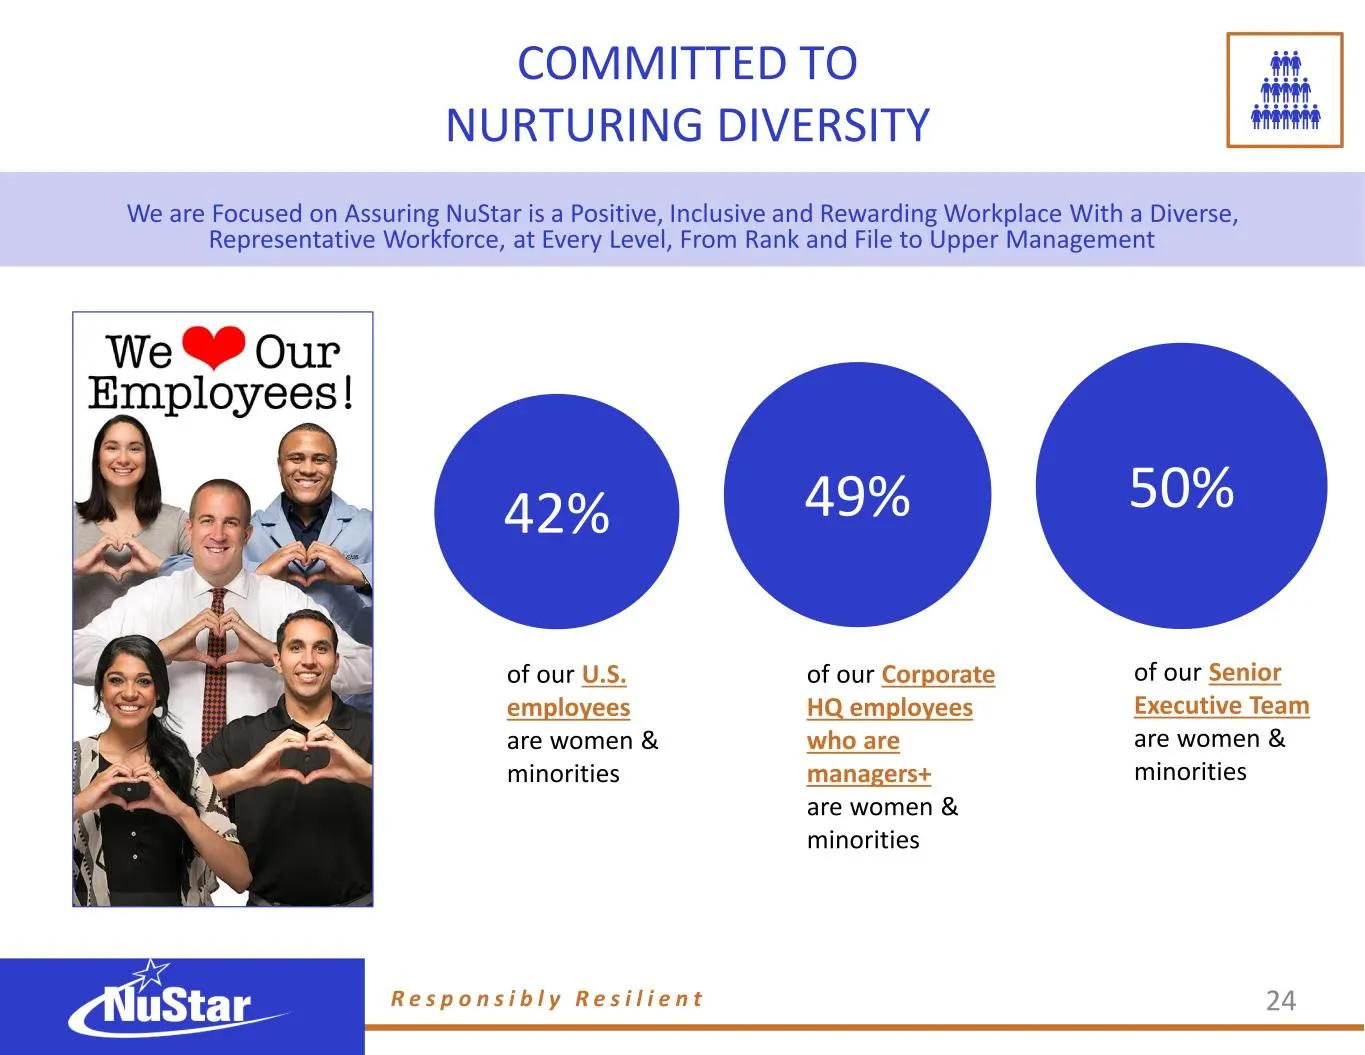
Slide 59: Committed to Nurturing Diversity
COMMITTED TO NURTURING DIVERSITY from 2018 +2.9 from 2018 from 20 18 We are Focused on Assuring NuStar is a Positive, Inclusive and Rewarding Workplace With a Diverse, Representative Workforce, at Every Level, From Rank and File to Upper Management R e s p o n s i b l y R e s i l i e n t 24 of our S
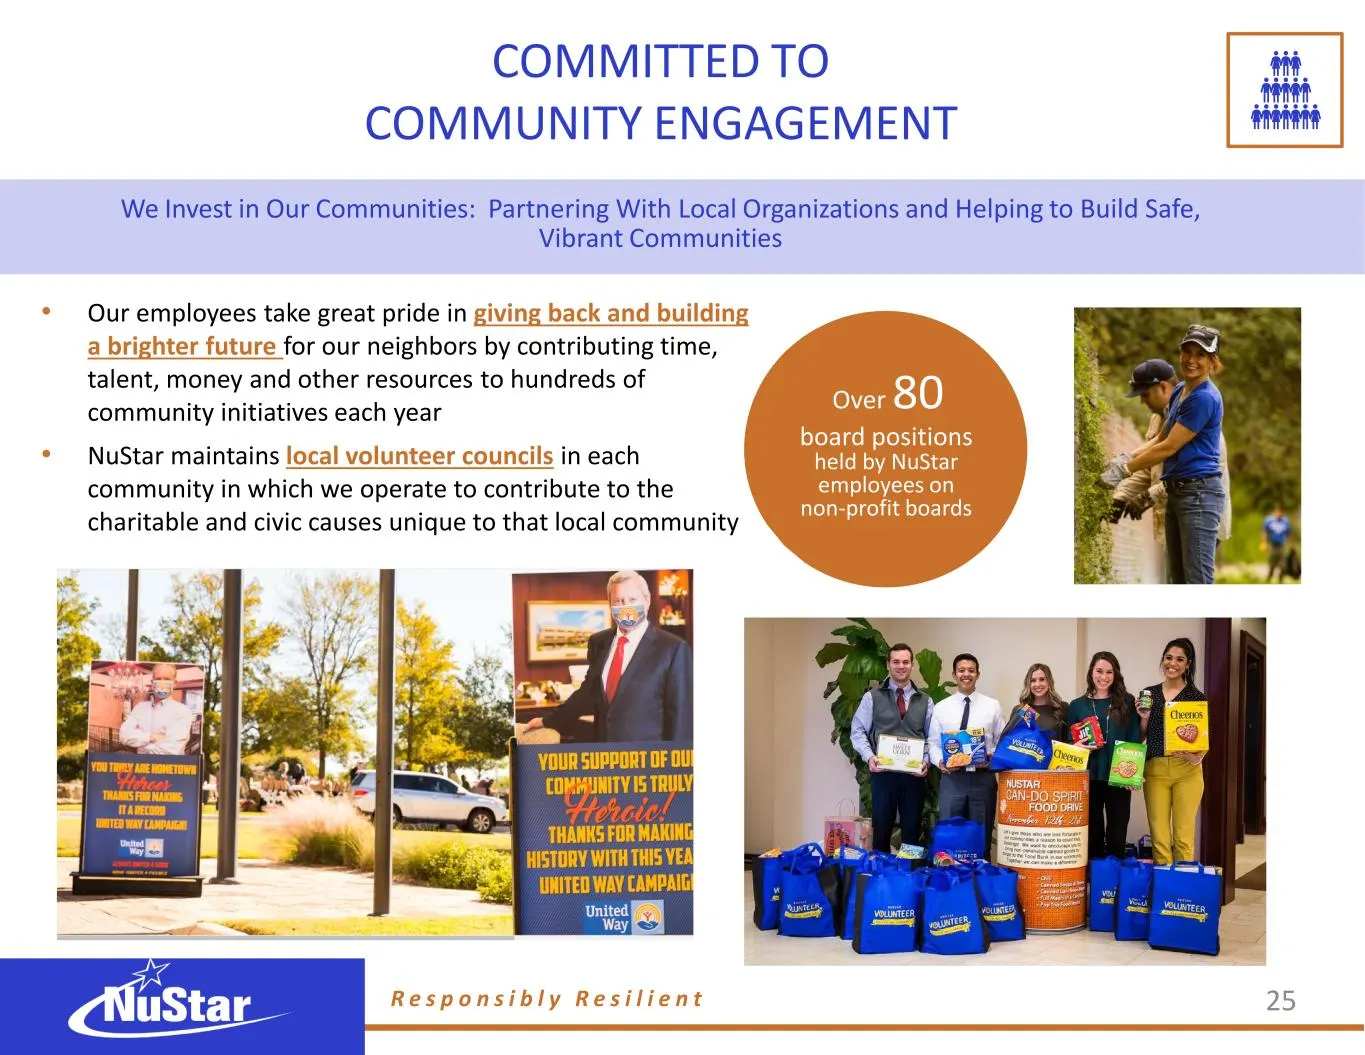
Slide 60: Committed to Community Engagement
COMMITTED TO COMMUNITY ENGAGEMENT We Invest in Our Communities: Partnering With Local Organizations and Helping to Build Safe, Vibrant Communities • Our employees take great pride in giving back and building a brighter future for our neighbors by contributing time, talent, money and other resources
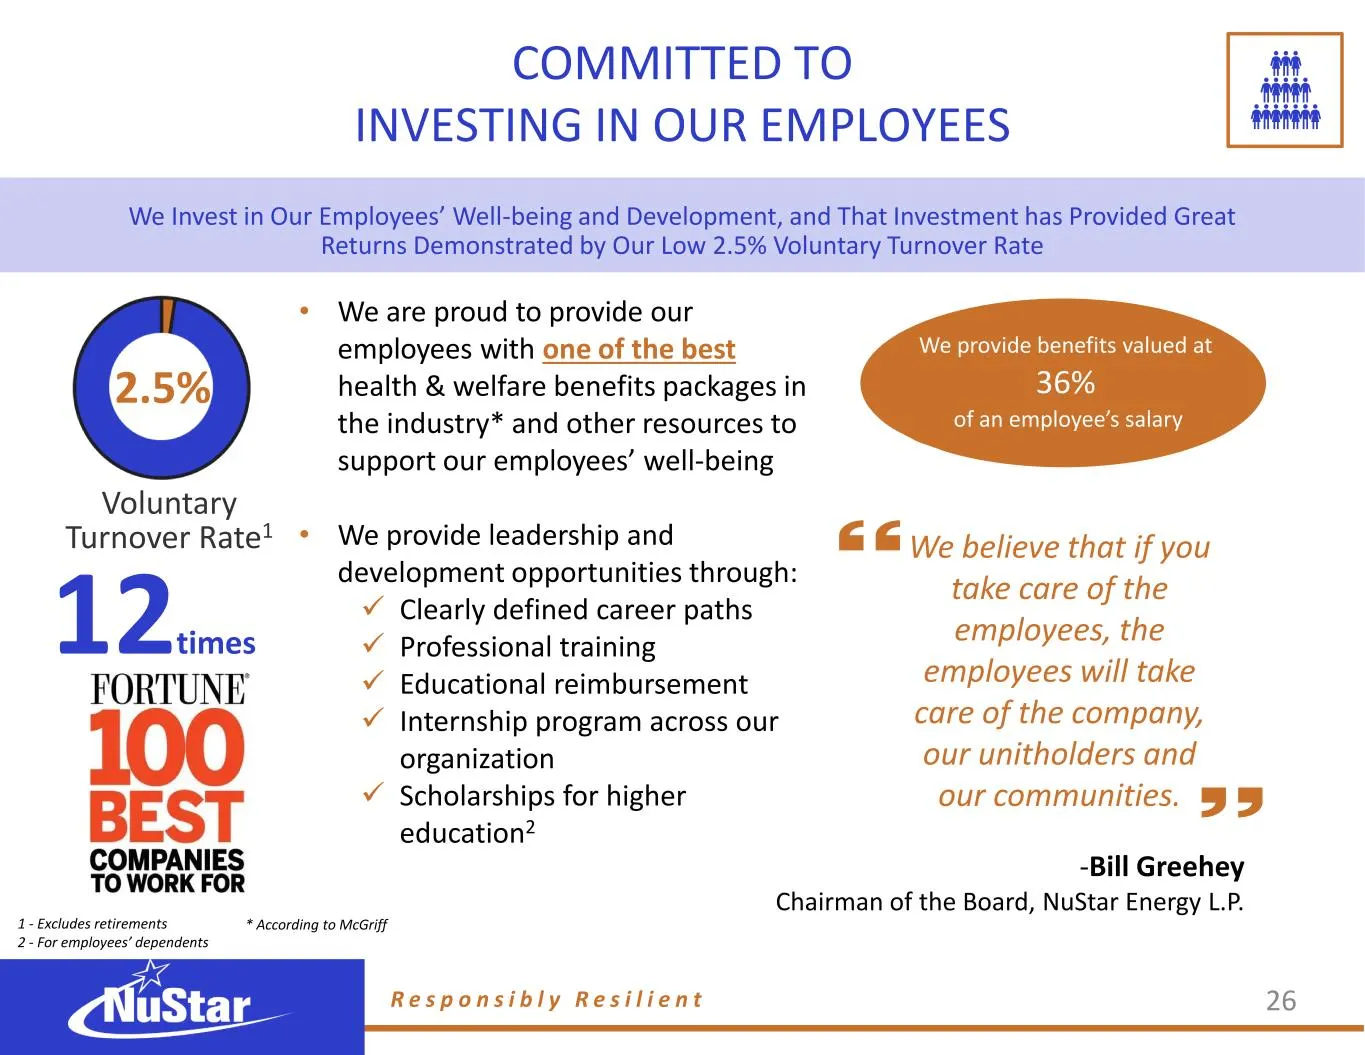
Slide 61: Committed to Investing in Our Employees
• We are proud to provide our employees with one of the best health & welfare benefits packages in the industry* and other resources to support our employees’ well-being • We provide leadership and development opportunities through: ✓ Clearly defined career paths ✓ Professional training ✓ Educationa
Slide 62: Investing in Our Communities Through Giving
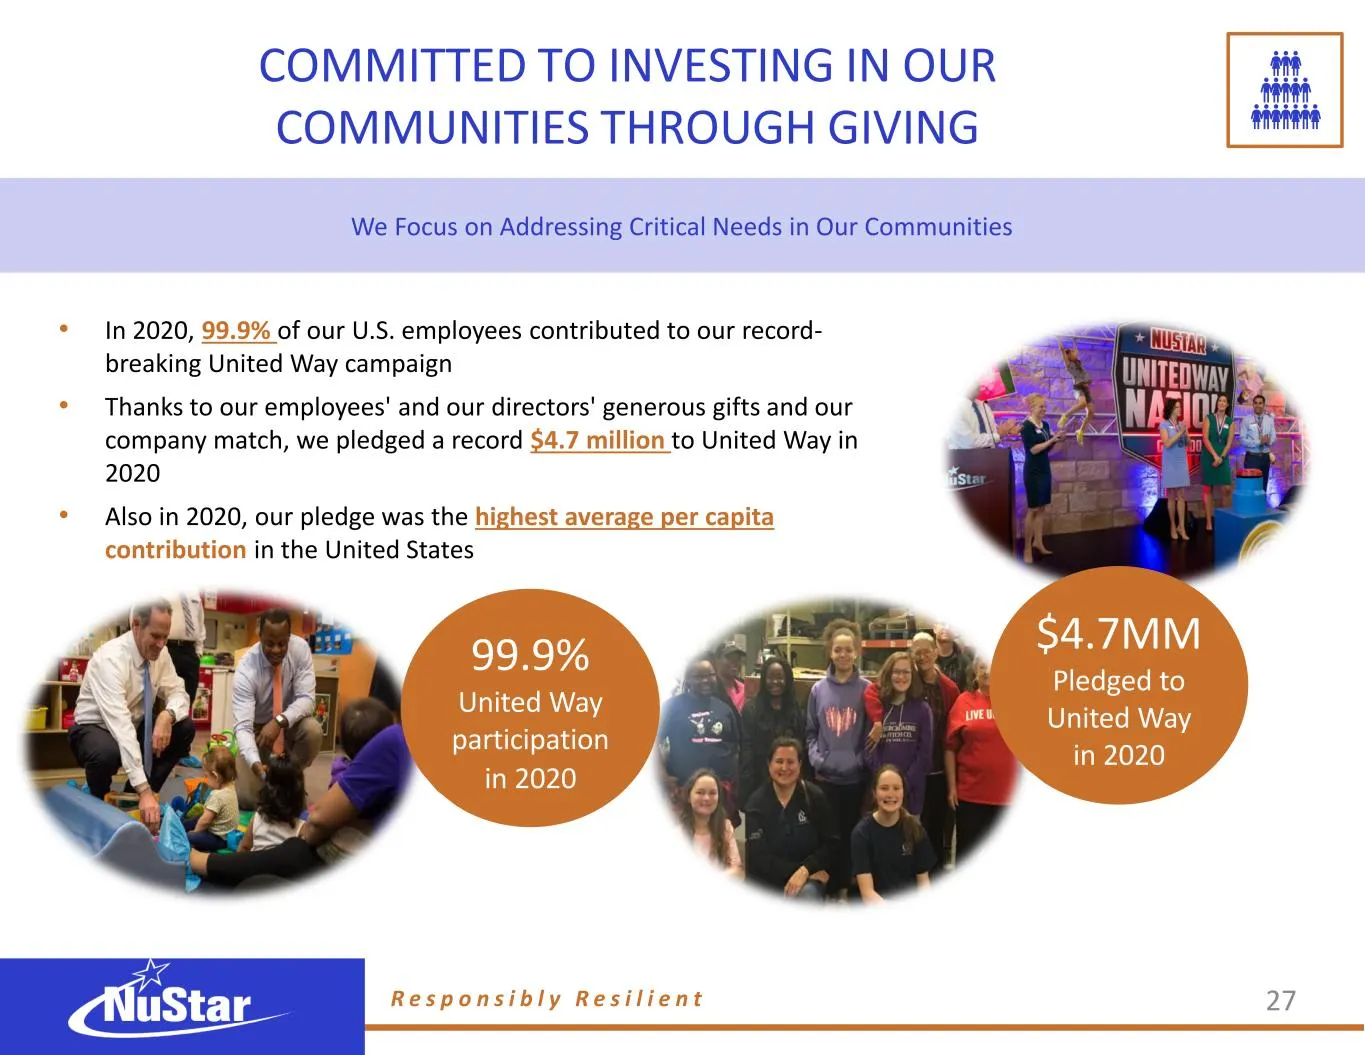
COMMITTED TO INVESTING IN OUR COMMUNITIES THROUGH GIVING We Focus on Addressing Critical Needs in Our Communities • In 2020, 99.9% of our U.S. employees contributed to our record- breaking United Way campaign • Thanks to our employees' and our directors' generous gifts and our company match, we pled

Slide 63: Fighting Homelessness Through Haven for Hope
COMMITTED TO FIGHTING HOMELESSNESS THROUGH OUR SUPPORT OF HAVEN FOR HOPE Proudly Supporting the Effort to Transform the Lives of Homeless Men, Women and Children • Bill Greehey, NuStar’s Chairman of the Board, founded Haven for Hope and continues to serve as the organization’s Chairman • Haven for H
Slide 64: Governance: Assuring Responsive Management
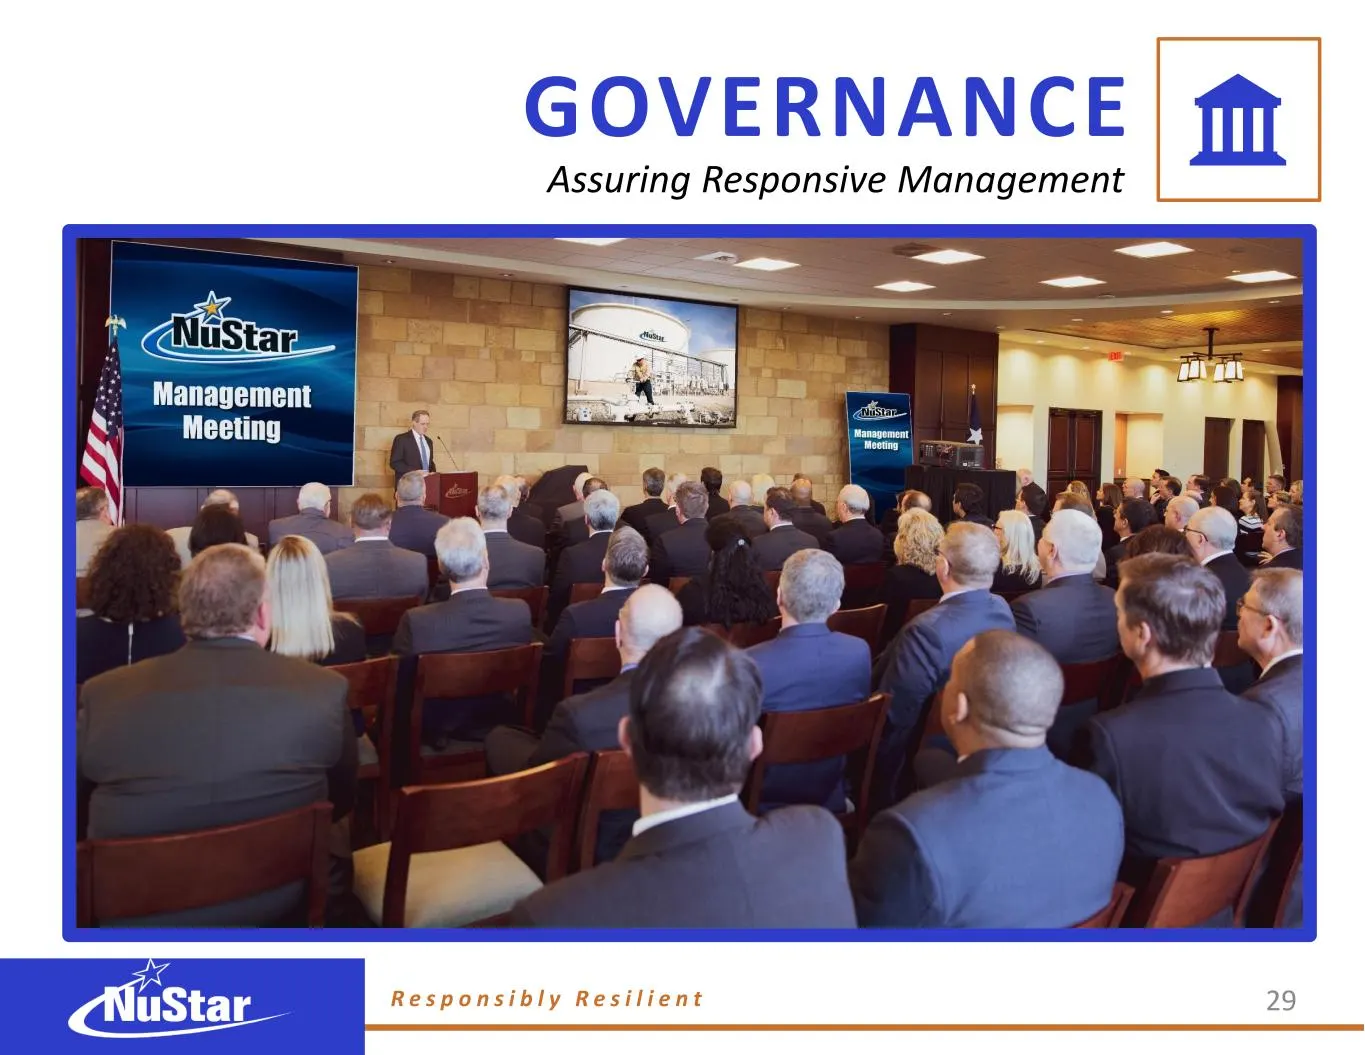
GOVERNANCE Assuring Responsive Management R e s p o n s i b l y R e s i l i e n t 29 BB: “lots of empty chairs” + “can we get a better photo” + circled the photoshop work
Slide 65: Sustainability & Risk Management
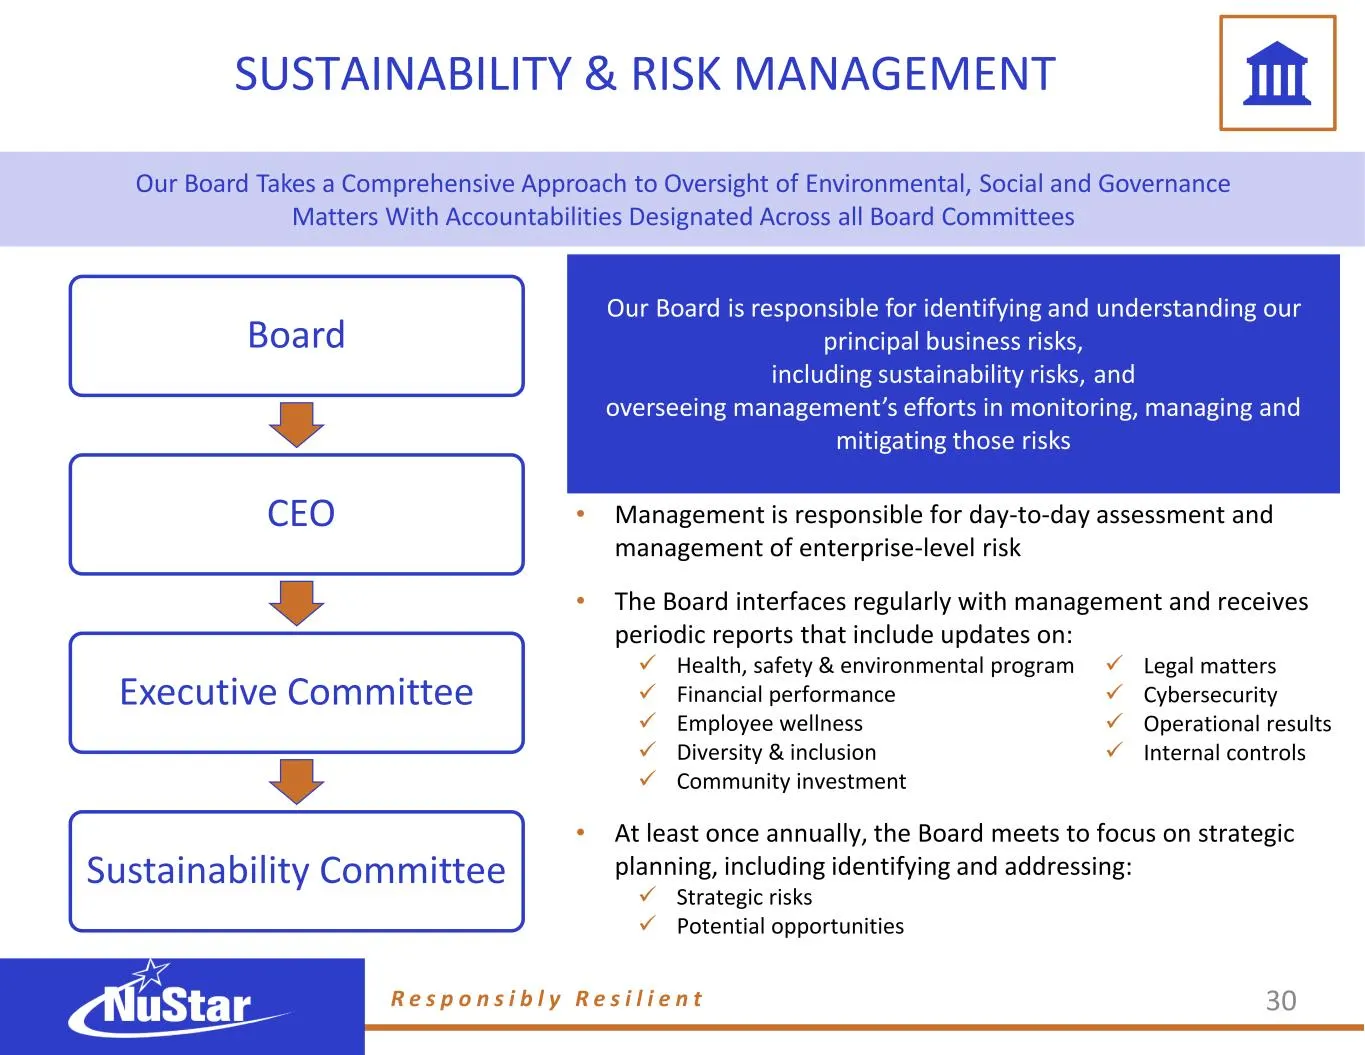
SUSTAINABILITY & RISK MANAGEMENT BOARD OF DIRECTORS Our Board is responsible for identifying and understanding our principal business risks, including sustainability risks, and overseeing management’s efforts in monitoring, managing and mitigating those risks Our Board Takes a Comprehensive Approach
Slide 66: Board Oversight & Executive Management
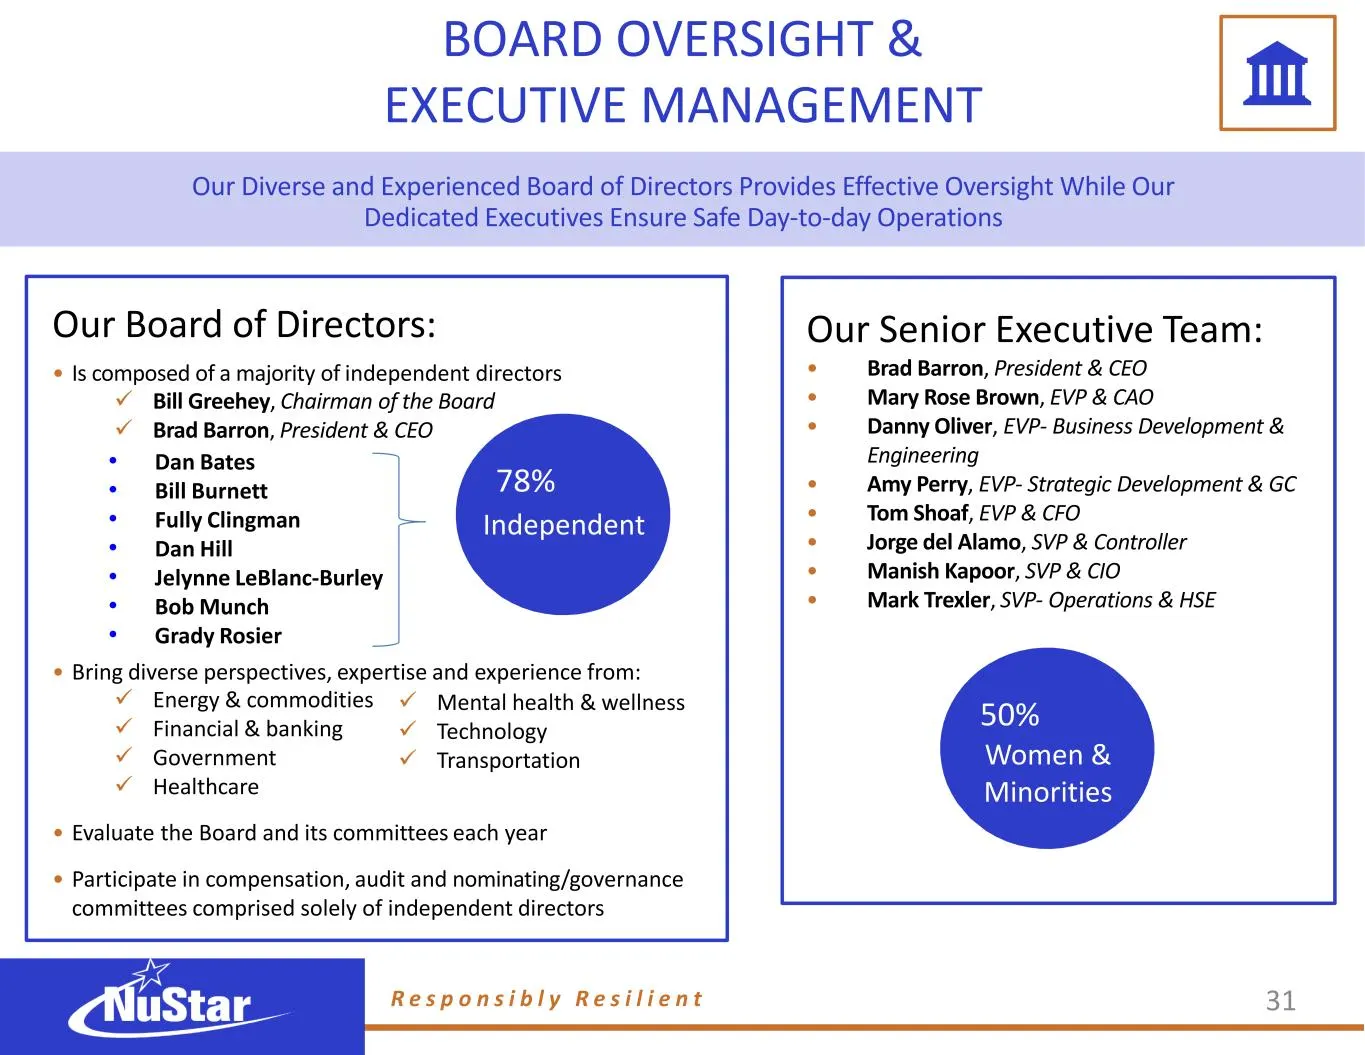
BOARD OVERSIGHT & EXECUTIVE MANAGEMENT Our Board of Directors: • Is composed of a majority of independent directors ✓ Bill Greehey, Chairman of the Board ✓ Brad Barron, President & CEO Dan Bates ✓ Bill Burnett ✓ Fully Clingman ✓ Dan Hill ✓ Jelynne LeBlanc-Burley ✓ Bob Munch ✓ Grady Rosier • Bring di
Slide 67: Executive Compensation Program
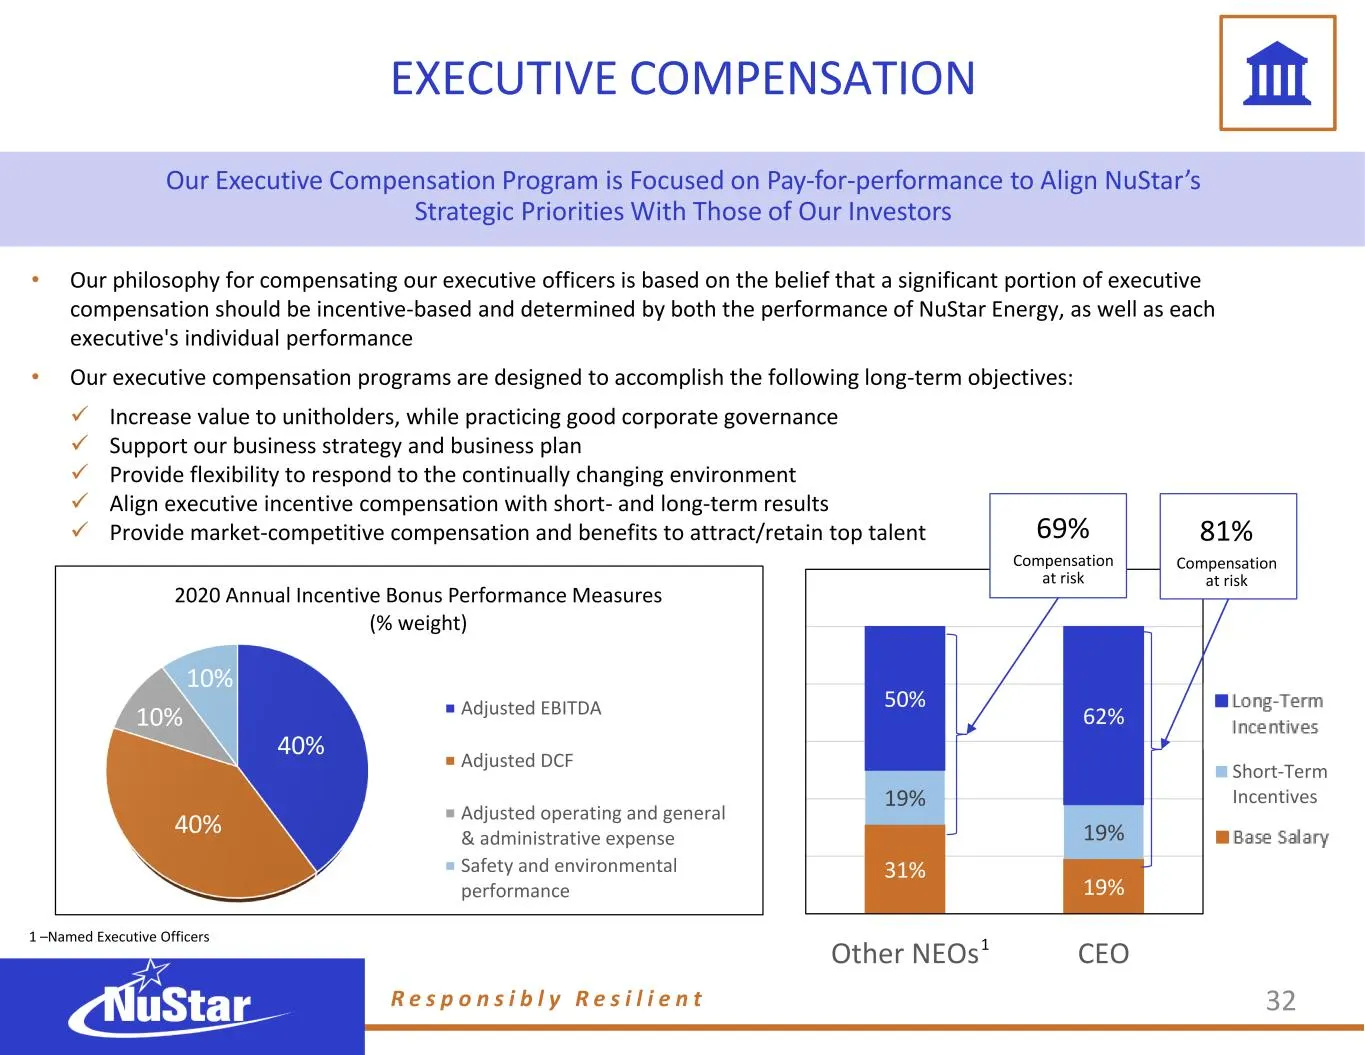
• Our philosophy for compensating our executive officers is based on the belief that a significant portion of executive compensation should be incentive-based and determined by both the performance of NuStar Energy, as well as each executive's individual performance • Our executive compensation prog
Slide 68: Board and Executives Invested in NuStar's Future
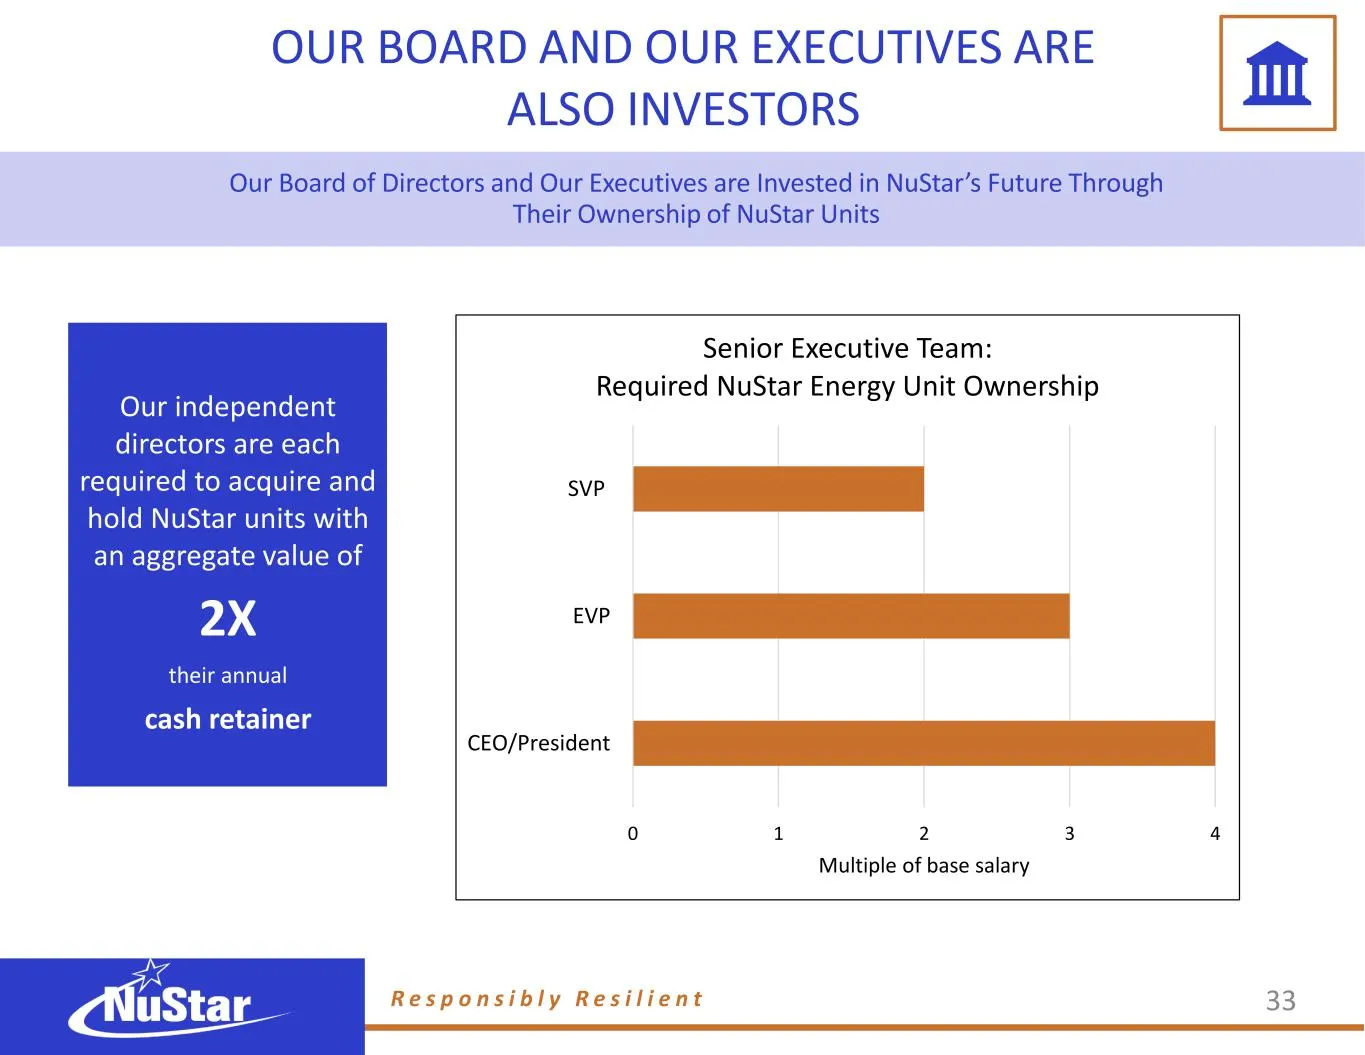
Our Board of Directors and Our Executives are Invested in NuStar’s Future Through Their Ownership of NuStar Units OUR BOARD AND OUR EXECUTIVES ARE ALSO INVESTORS 0 1 2 3 4 CEO/President EVP SVP Multiple of base salary Senior Executive Team: Required NuStar Energy Unit Ownership Our independent direc
Slide 69: Investor Relations Contact Information
INVESTOR RELATIONS For additional information about corporate sustainability at NuStar, visit http://www.NuStarEnergy.com/Sustainability CONTACT INFORMATION CORPORATE SECRETARY CORPORATE COMMUNICATIONS SUSTAINABILITY R e s p o n s i b l y R e s i l i e n t 34 (210) 918-INVR (4687) InvestorRelations@
Slide 70: Appendix: Reconciliation of Non-GAAP Financial Information
APPENDIX: RECONCILATION OF NON-GAAP FINANCIAL INFORMATION R e s p o n s i b l y R e s i l i e n t 35
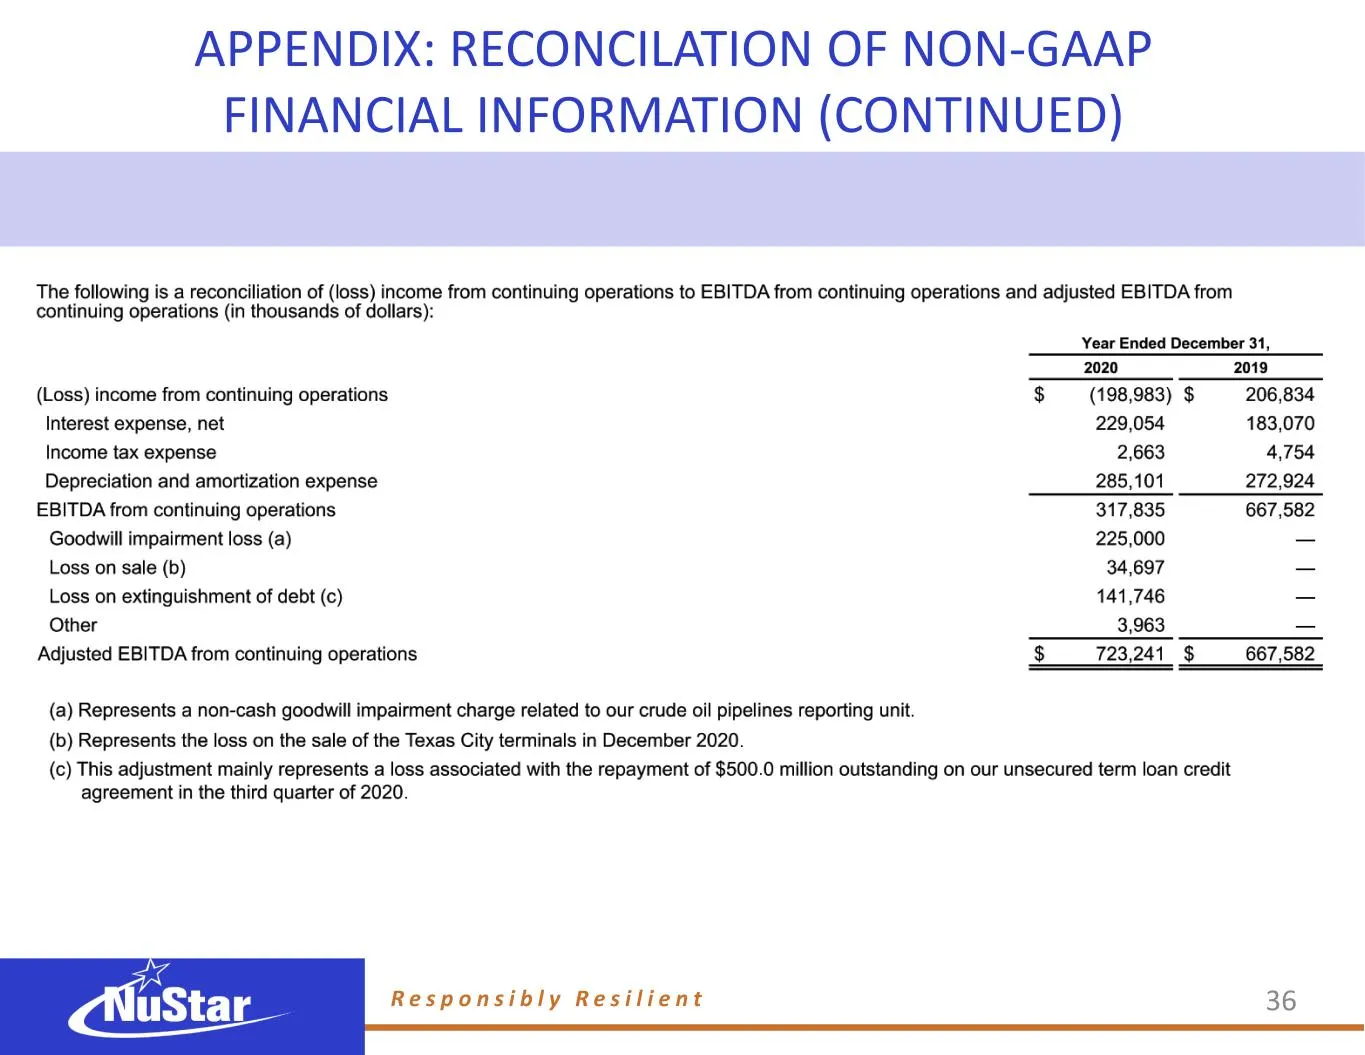
Slide 71: Appendix: Reconciliation of Non-GAAP Financial Information (continued)
APPENDIX: RECONCILATION OF NON-GAAP FINANCIAL INFORMATION (CONTINUED) R e s p o n s i b l y R e s i l i e n t 36
Source: SEC EDGAR · 8-K filed Aug 18, 2021
More decks from NuStar Energy LP
 Merger or Acquisition (January 2024)14 slides · Jan 22, 2024
 Investor Presentation (December 2023)35 slides · Dec 5, 2023
 Raymond James Virtual Energy Supply Chain Conference 2023; Pickering Energy Partners TE&MF36 slides · Sep 19, 2023
 Barclays CEO Energy-Power Conference 202336 slides · Sep 6, 2023
 Citi One-on-One Midstream/Energy Infrastructure Conference 202336 slides · Aug 22, 2023
 8th Annual J.P. Morgan Energy, Power & Renewables Conference 202336 slides · Jun 21, 2023