Western Sierra Bancorp — Investor Presentation (September 2004)
34 slides from Western Sierra Bancorp's investor presentation, Sep 28, 2004
Slide 1: Western Sierra Bancorp
Western Sierra Bancorp Gary D. Gall Anthony J. Gould President / CEO Executive Vice President / CFO Phone (530) 677-5694 Phone (530) 698-2234 Email: ggall@wsnb.com Email: agould@wsnb.com
Slide 2: Safe Harbor
SAFE HARBOR This presentation contains forward-looking statements within the meaning of the Private Securities Litigation Reform Act of 1995 regarding the future results and performance of WSBA. These forward-looking statements involve risks and uncertainties and actual results could differ material
Slide 3: Western Sierra Bancorp
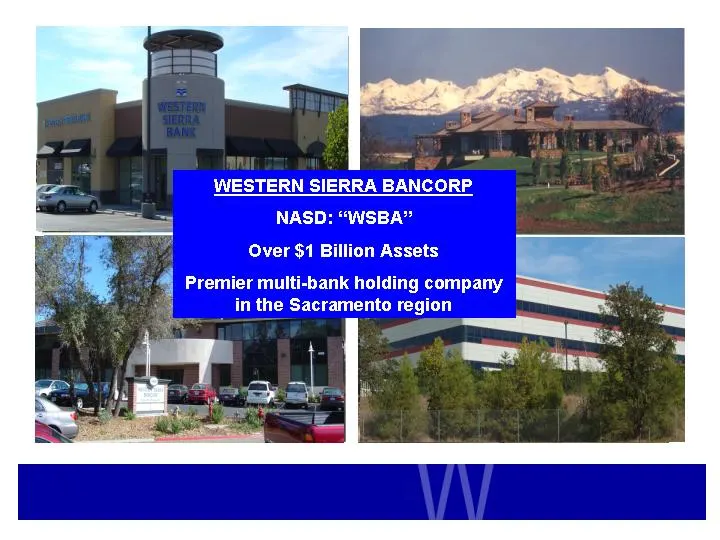
ll WESTERN SIERRA BANCORP NASD: “WSBA” Over $1 Billion Assets r multi-bank holding company in the Sacramento region —— =~
Slide 4: Western Sierra Bancorp
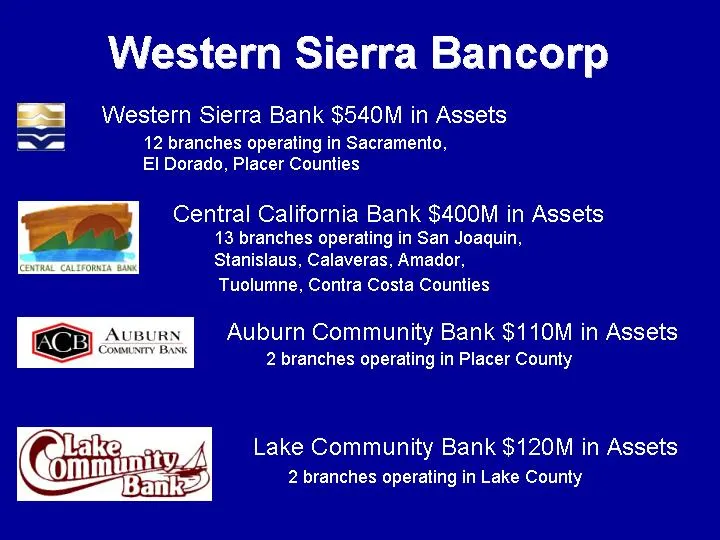
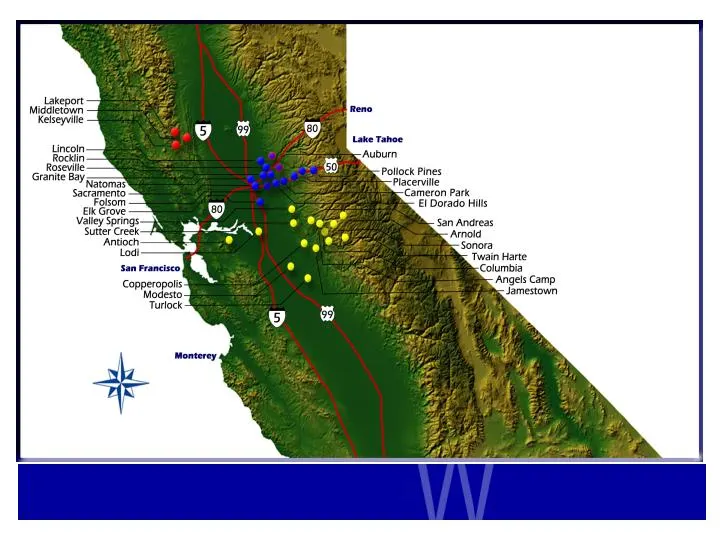
Western Sierra Bancorp = Western Sierra Bank $540M in Assets os 12 branches operating in Sacramento, El Dorado, Placer Counties Central California Bank $400M in Assets ] 13 branches operating in San Joaquin, . Stanislaus, Calaveras, Amador, Tuolumne, Contra Costa Counties Auburn Community Bank $110M
Slide 5: Branch locations map
Lakeport Migaietewn Relseyile Lincoln Roctin enlist ante PY Natomas Sacramento Folsom veceve faley Springs Sutter Creek ‘Antioch tod Copperopols Modesto Turlock ‘Auburn Pollock Pines iacervile ‘Cameron Park Et Dorado Hills san Andreas ‘Arnold sonora “Twain Harte ‘columbia ‘Angels Camp “Jamestown
Slide 6: The Market Opportunity
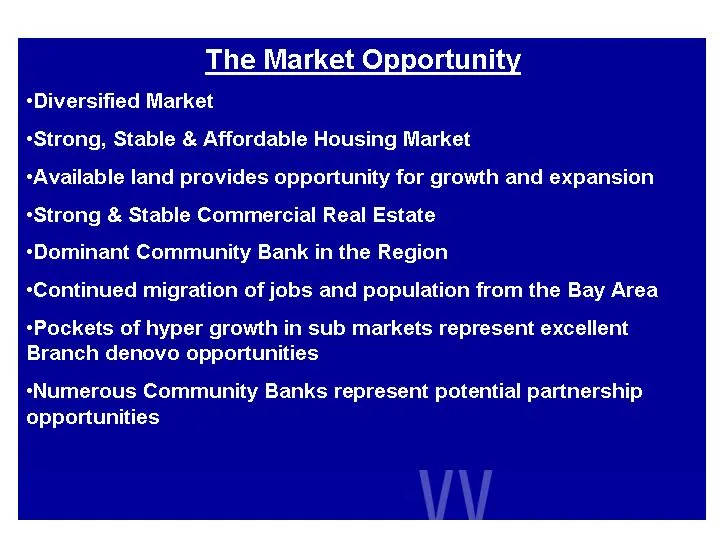
The Market Opportunity Diversified Market *Strong, Stable & Affordable Housing Market -Available land provides opportunity for growth and expansion +Strong & Stable Commercial Real Estate *Dominant Community Bank in the Region -Continued migration of jobs and population from the Bay Area +Pockets of
Slide 7: Sacramento Regional Economy
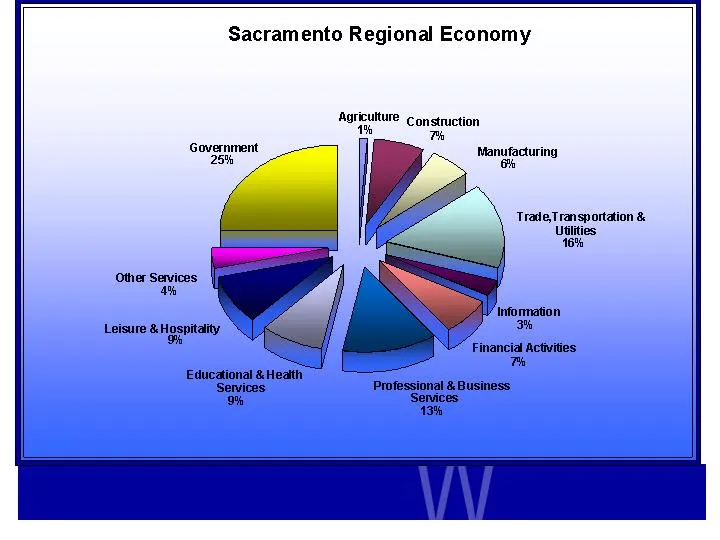
Sacramento Regional Economy Agriculture Construction 1% iy Government Gu Manufacturing Other Services 4% Leisure & Hospi tospitalty Educational & Health Services o%
Slide 8: Our Formula For Success
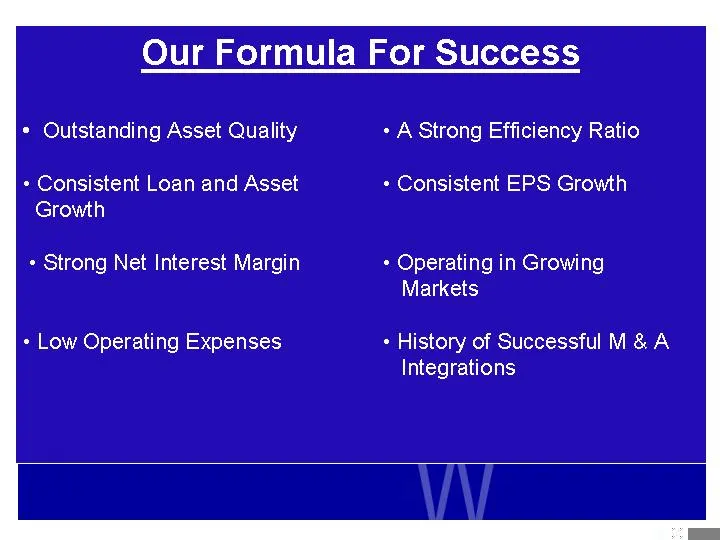
Our Formula For Success * Outstanding Asset Quality + A Strong Efficiency Ratio + Consistent Loan and Asset + Consistent EPS Growth Growth + Strong Net Interest Margin + Operating in Growing Markets + Low Operating Expenses + History of Successful M&A Integrations
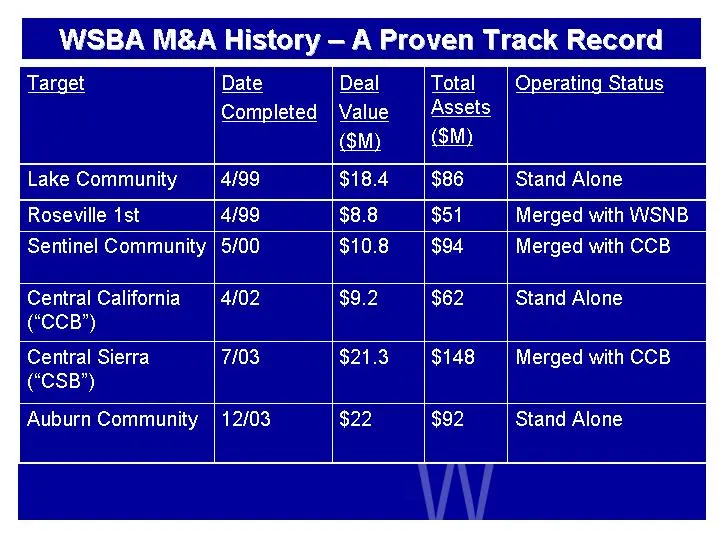
Slide 9: WSBA M&A History - A Proven Track Record
WSBA M&A ory — A Proven Track Record Operating Status Lake Community Stand Alone Roseville 1st Merged with WSNB Sentinel Community Merged with CCB Central California E Stand Alone (‘CCB’) Central Sierra Merged with CCB (‘CSB’) Auburn Community Stand Alone
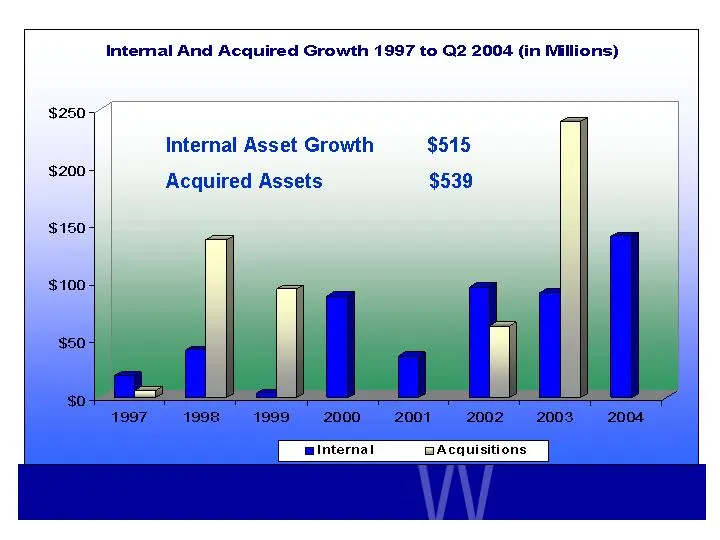
Slide 10: Internal And Acquired Growth 1997 to Q2 2004
Intemal And Acquired Growth 1997 to Q2 2004 (in Millions) Internal Asset Growth $515 Acquired Assets $539 Internal
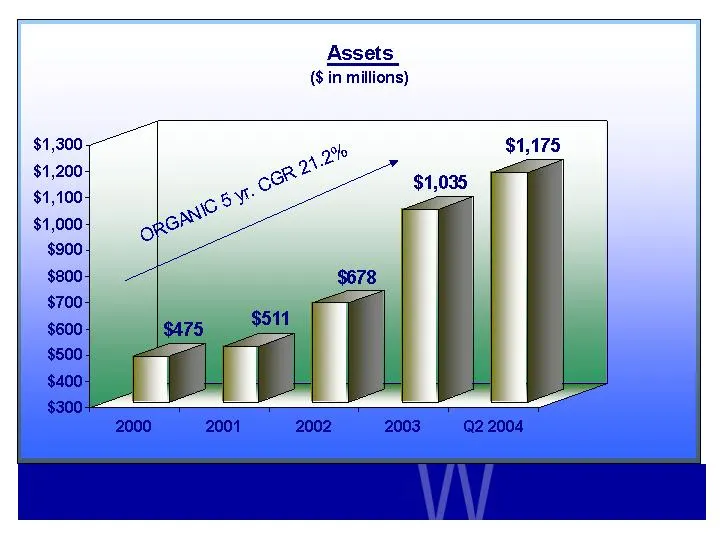
Slide 11: Assets
Assets (Sin millions) 2000 2001 2002 2003 Q2 2004
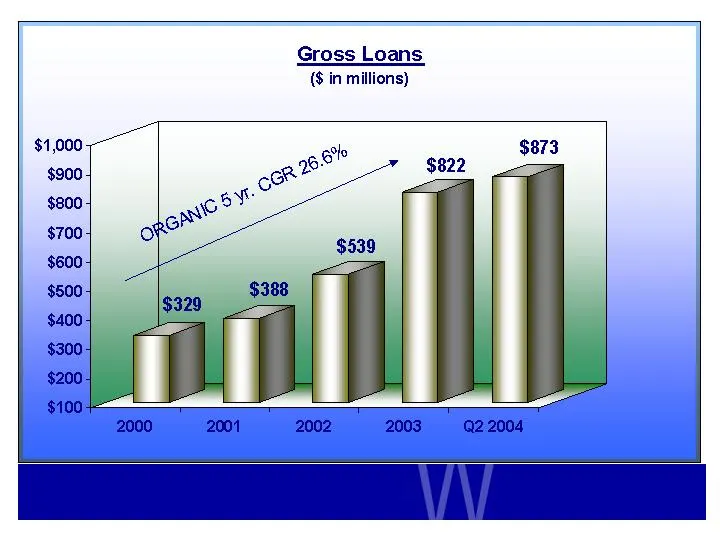
Slide 12: Gross Loans
Gross Loans ($ in millions) 2000 2001 2002 2003 Q2 2004
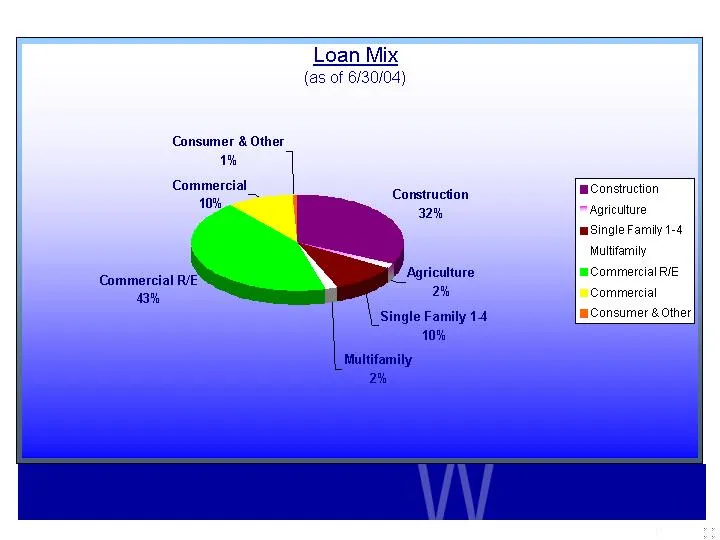
Slide 13: Loan Mix
Loan Mix (as of 6/30/04) Consumer & Other th ASU] earecucdan mConstruction ad 32% Agriculture mingle Farniy 1-4 Mulitarity Gommaraiae Agriculture Commercial RIE Bh 2% Commercial Single Family 14 Consumer & other| 10% Muttifamity 2%
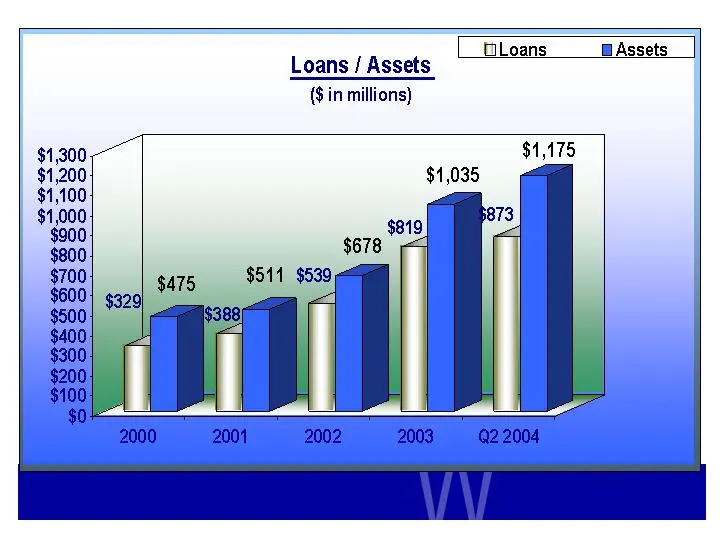
Slide 14: Loans / Assets
Loans BAssets Loans / Assets (in millions) 2000 2001 2002 2003 Q2 2004
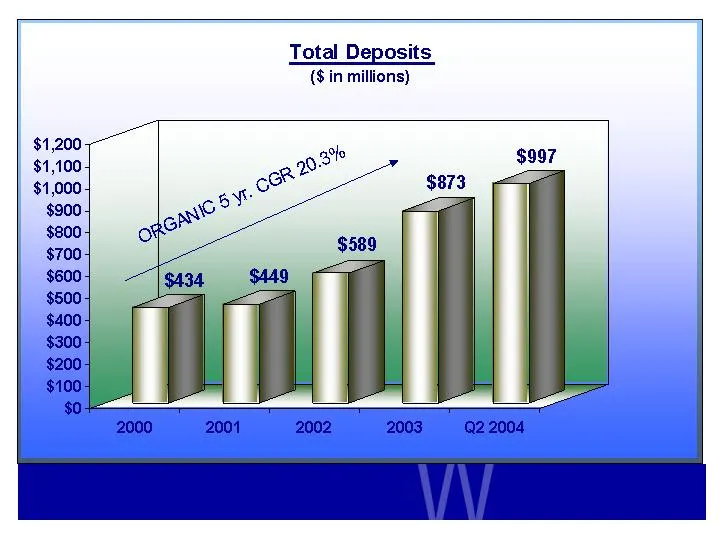
Slide 15: Total Deposits
Total Deposits ($ in millions) 2000 2001 2002 2003 Q2 2004
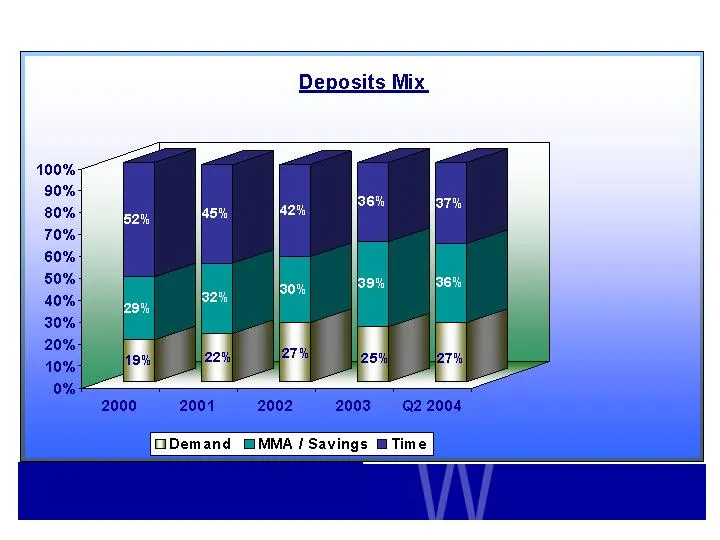
Slide 16: Deposit mix
2000 2004 2002 2003 ©. Q2. 2004 Demand HMMA / Savings mTime
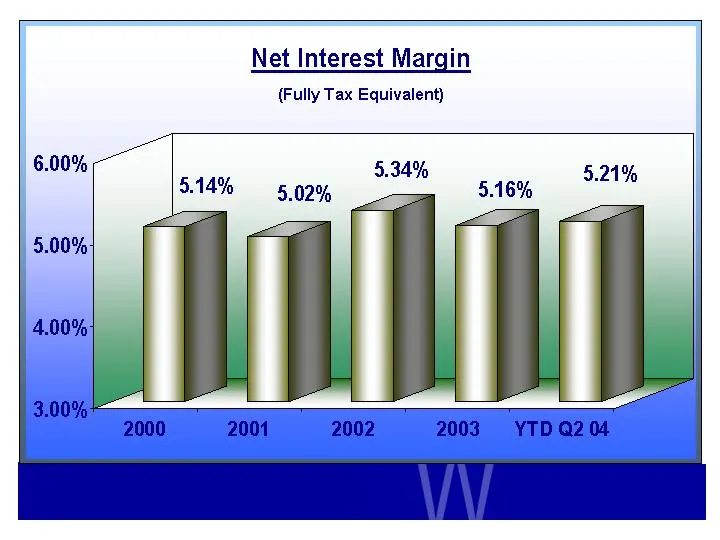
Slide 17: Net Interest Margin
Net Interest Margin (Fully Tax Equivalent) 5.34% 2000 2001 2002 2003 YTD Q204
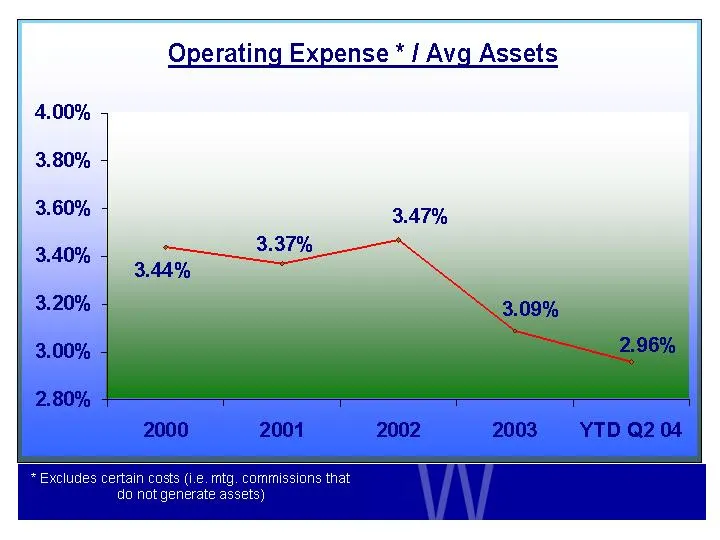
Slide 18: Operating Expense / Avg Assets
Operating Expense */ Avg Assets 4.00% 3.80% 3.60% 3.47% 2001 2002 2003 YTD Q2 04
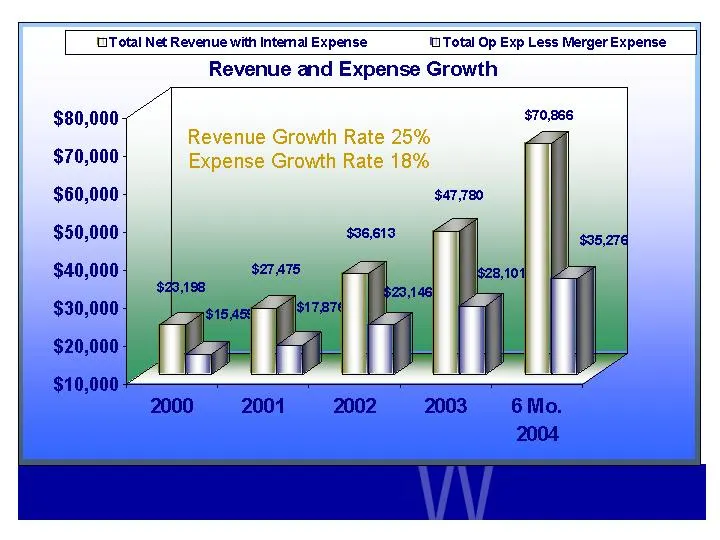
Slide 19: Revenue and Expense Growth
Total Net Revenue with intemal Expense (Total Op Exp Less Merger Expense Revenue and Expense Growth $80,000 Revenue Growth Rate 25% $70,000 Expense Growth Rate 18% $60,000 $50,000 $40,000 $30,000 $20,000 $10,000
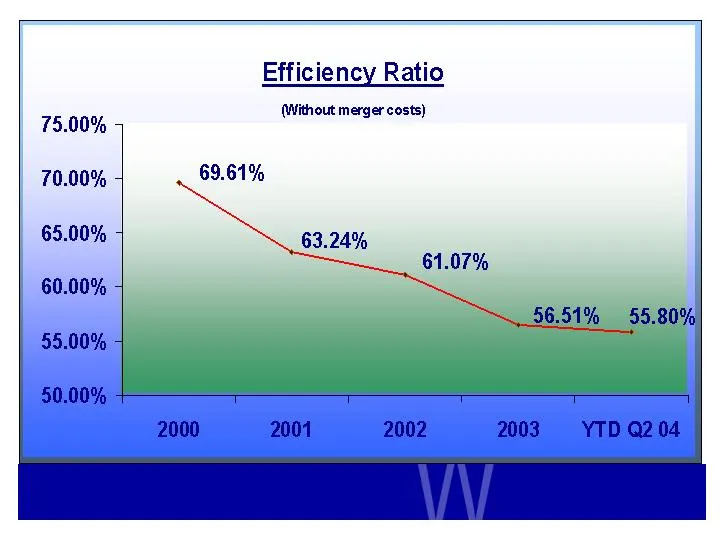
Slide 20: Efficiency Ratio
Efficiency Ratio (Without merger costs) 75.00% 70.00% 69.61% 65.00% 63.24% 60.00% : 56.51% 55.80%
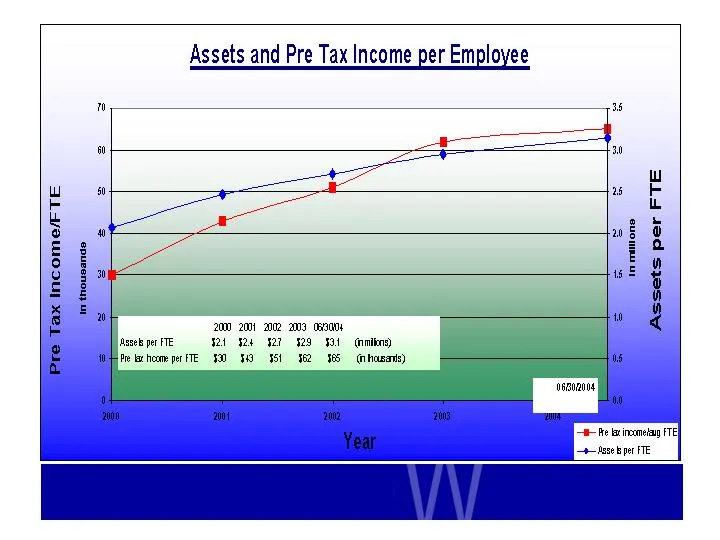
Slide 21: Assets and Pre Tax Income per Employee
Assets and Pre Tax Income per Employee n fe oy 30 ® Fe 0 sets per FTE Income/FTE s 2am 2a) om ama o2004 Ask peiTE 21 A BT $29 BI Gaming) Pe bxhoom por TE $30 40 $51 T6285 hasan) ngunog
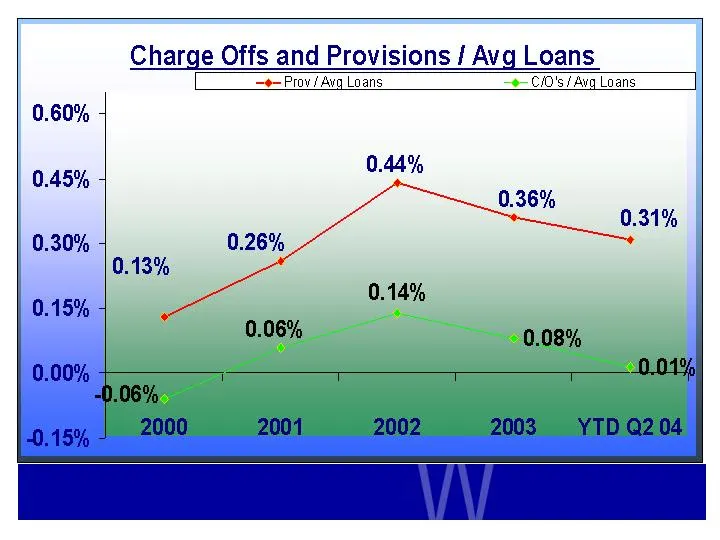
Slide 22: Charge Offs and Provisions / Avg Loans
Charge Offs and Provisions / Avg Loans -e—Prov/ Avg Loans C/0's / Avg Loans 0.44%
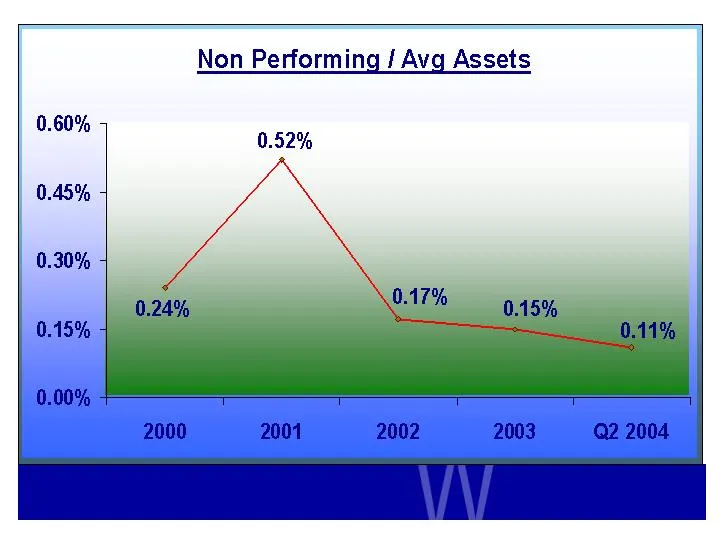
Slide 23: Non Performing / Avg Assets
Non Performing / Avg Assets 0.60% 0.52% 0.45% 2000 2001 2002 2003 Q2 2004
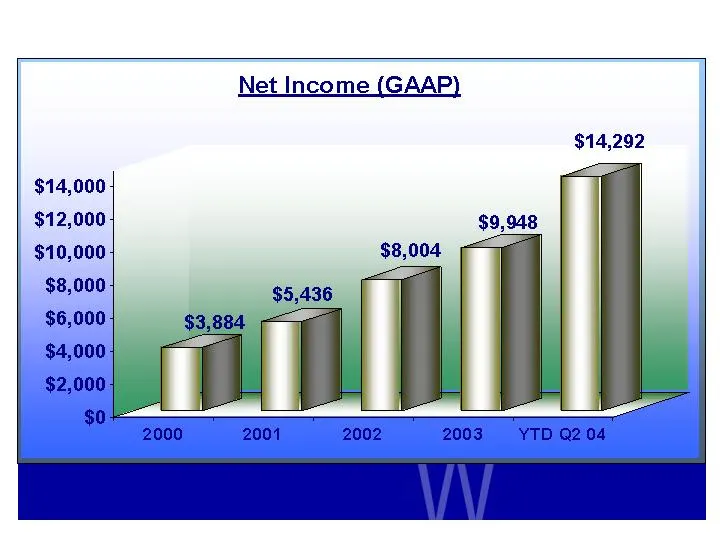
Slide 24: Net Income (GAAP)
Net Income (GAAP) $14,292 $14,000 $12,000 $10,000 $8,000, $6,000 $4,000 $2,000 $0 2000 2001 2002 2003 YTD Q2 04
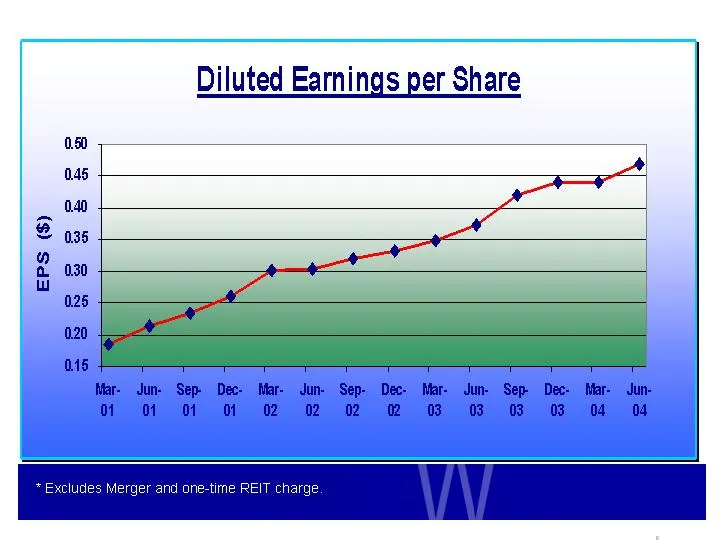
Slide 25: EPS ($)
EPS ($) 0.50 0.45 0.40 035 030 025 020 O15 Diluted Earnings per Share Mar- Jun Sep- Dec: Mar- Jun- Sep- Dec- Mar- Jun Sep- Dec- Mar» Jun- 1 Of Of Of 02 O2 O2 O@ 03 03 03 03 04 04
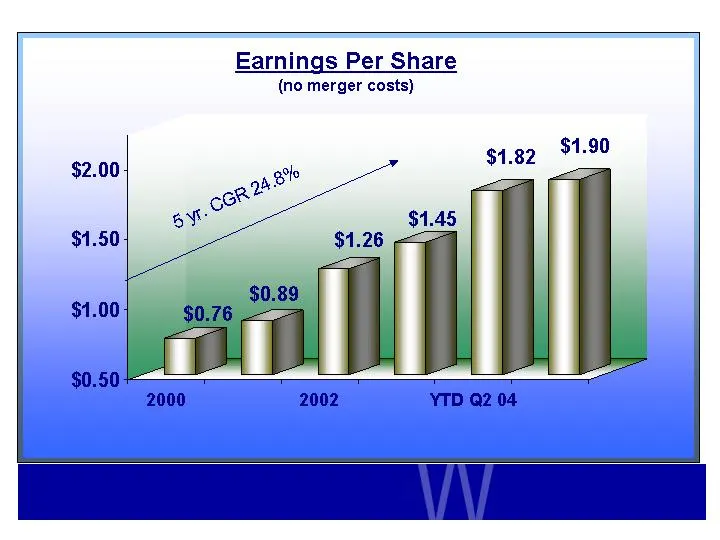
Slide 26: Earnings Per Share
Earnings Per Share (no merger costs) 2000 2002 YTD Q2 04 VV
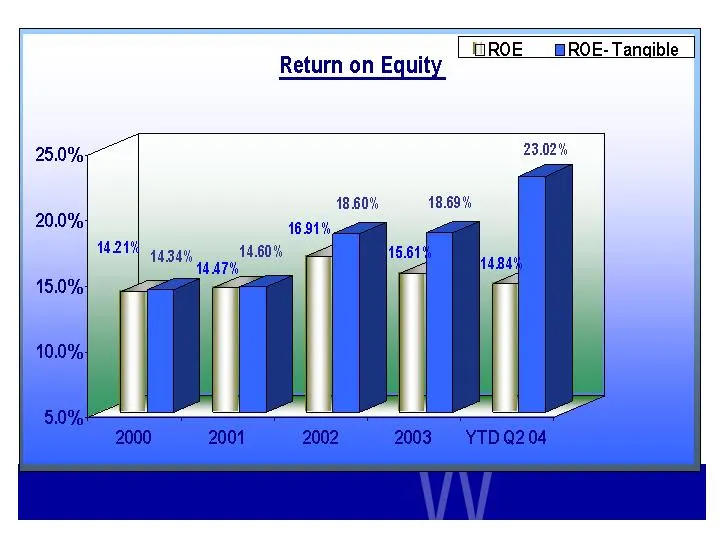
Slide 27: Return on Equity
[ROE __@ROE-Tanaible Return on Equity 23.02% 18.60% 18.69%, 2000 2001 2002 2003. «= YTD Q204
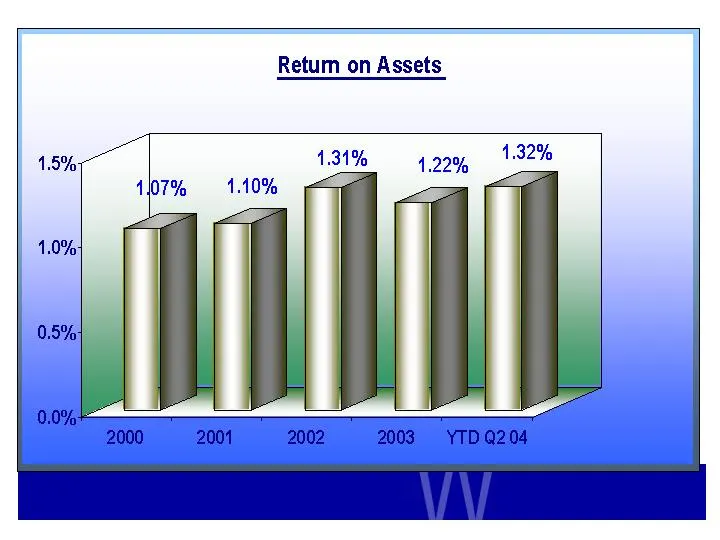
Slide 28: Return on Assets
Retum on Assets 2000 2001 2002 2003. «= YTD Q204
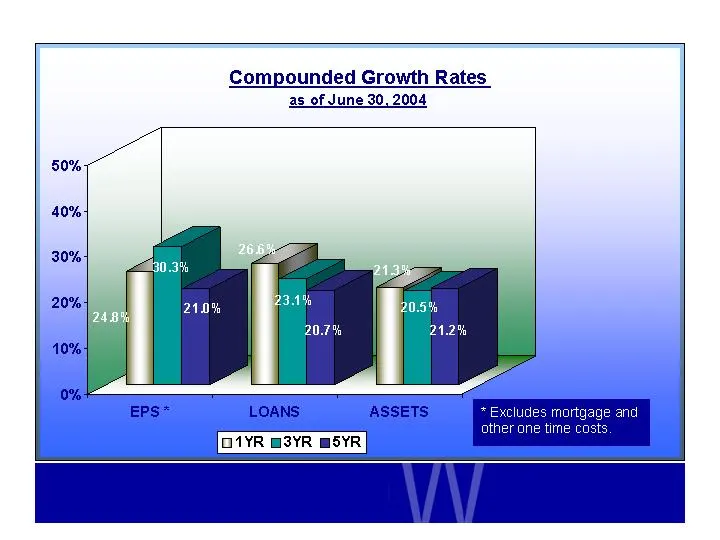
Slide 29: Compounded Growth Rates
Compounded Growth Rates as of June 30, 2004 LOANS ASSETS O1YR w3YR w5YR
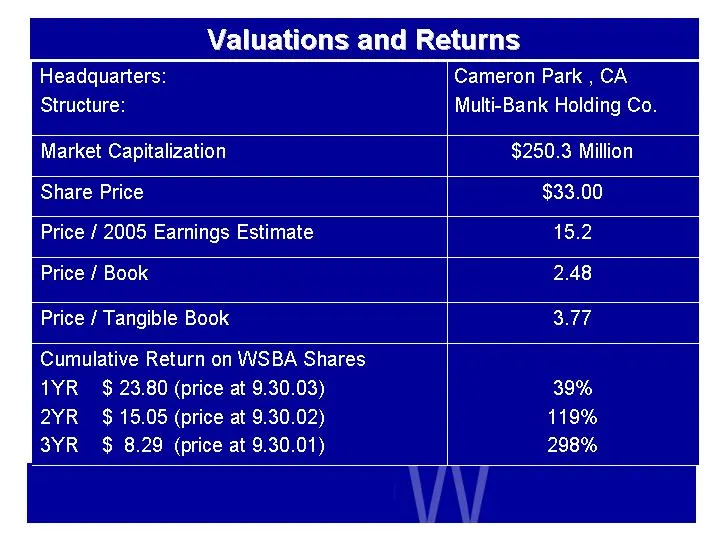
Slide 30: Valuations and Returns
Valuations and Returns Headquarters: Cameron Park , CA Structure: Multi-Bank Holding Co. Market Capitalization $250.3 Million Share Price $33.00 Price / 2005 Earnings Estimate 15.2 Price / Book 2.48 Price / Tangible Book 3.77 Cumulative Return on WSBA Shares 1YR $23.80 (price at 9.30.03) 39% 2YR $15
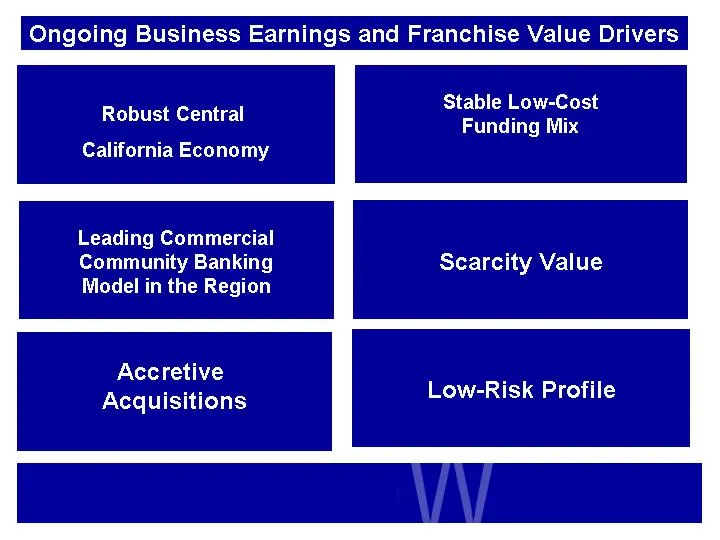
Slide 31: Earnings and Franchise Value Drivers
ing Business Earni Robust Central California Economy Leading Commercial Community Banking Model in the Region Accretive Acquisitions gs and Franchise Value Dri Stable Low-Cost Funding Mix Scarcity Value Low-Risk Profile
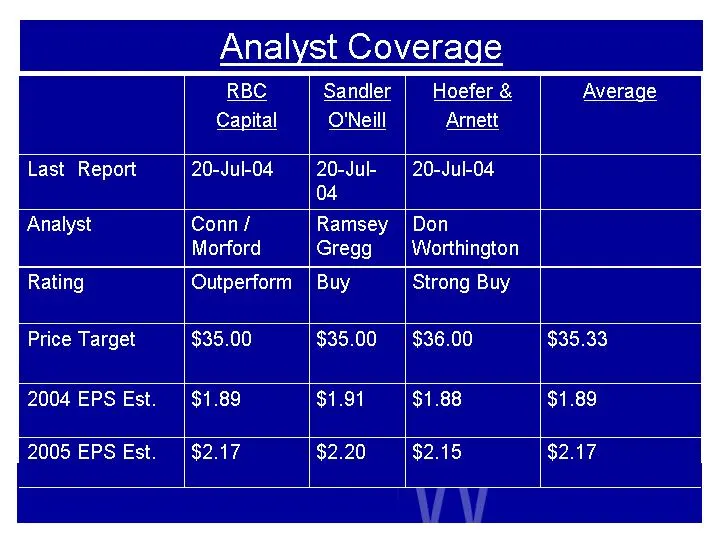
Slide 32: Analyst Coverage
Analyst Coverage RBC Hoefer & Average Capital Arnett Last Report 20-Jul-04 20-Jul-04 Analyst Conn/ Morford Don Worthington Rating Outperform Strong Buy Price Target $35.00 $36.00 2004 EPS Est. $1.89 $1.88 2005 EPS Est. $2.17 $2.15
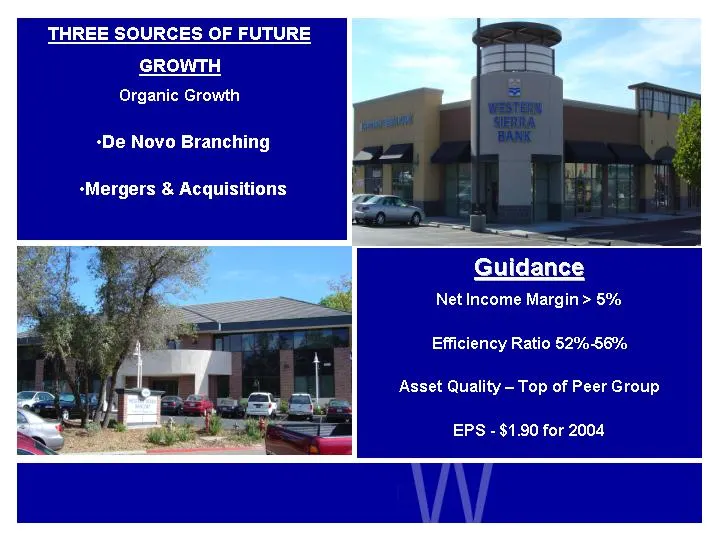
Slide 33: Three Sources of Future Growth
THREE SOURCES OF FUTURE GROWTH Organic Growth -De Novo Branching -Mergers & Acquisitions Guidance Net Income Margin > 5% Efficiency Ratio 52% 56% Asset Quality - Top of Peer Group EPS - $1.90 for 2004

Slide 34: Searchable text section of graphics
Searchable text section of graphics shown above [LO GO] Western Sierra Bancorp Gary D. Gall Anthony J. Gould President / CEO Executive Vice President / CFO Phone (530) 677-5694 Phone (530) 698-2234 Email: ggall@wsnb.com Email: agould@wsnb.com SAF E HARBOR This presentation contains forward-looking s
Source: SEC EDGAR · 8-K filed Sep 28, 2004
More decks from Western Sierra Bancorp
 Keefe, Bruyette & Woods Community Bank Conference 200534 slides · Jul 26, 2005
 Sandler O'Neill 2005 West Coast Financial Services Conference33 slides · Mar 10, 2005
 Merger or Acquisition (November 2004)10 slides · Nov 22, 2004
 Sandler O'Neill 2004 Financial Services Conference11 slides · Nov 10, 2004
 Investor Presentation (May 2004)24 slides · May 5, 2004
 Investor Presentation (March 2004)7 slides · Mar 10, 2004