Cloudberry Clean Energy ASA · OSL:CLOUD
Cloudberry Clean Energy ASA — Q1 2024 Earnings Presentation
19 slides from Cloudberry Clean Energy ASA's earnings presentation, May 8, 2024
Slide 1: Cloudberry Clean Energy First Quarter Report 2024
Q Cloudberry Cloudberry Clean Energy First Quarter Report 2024 08 May 2024
Slide 2: Disclaimer
Disclaimer This company presentation (the "Presentation" has been prepared by Cloudberry Clean Energy ASA (the "Company") and its subsidiaries (together the "Group" and is made solely for information purposes. This Presentation does not constitute any recommendation to buy, sell or otherwise transac
Slide 3: Agenda
Agenda Highlights & strategy Key Financials Market & summary Selselva
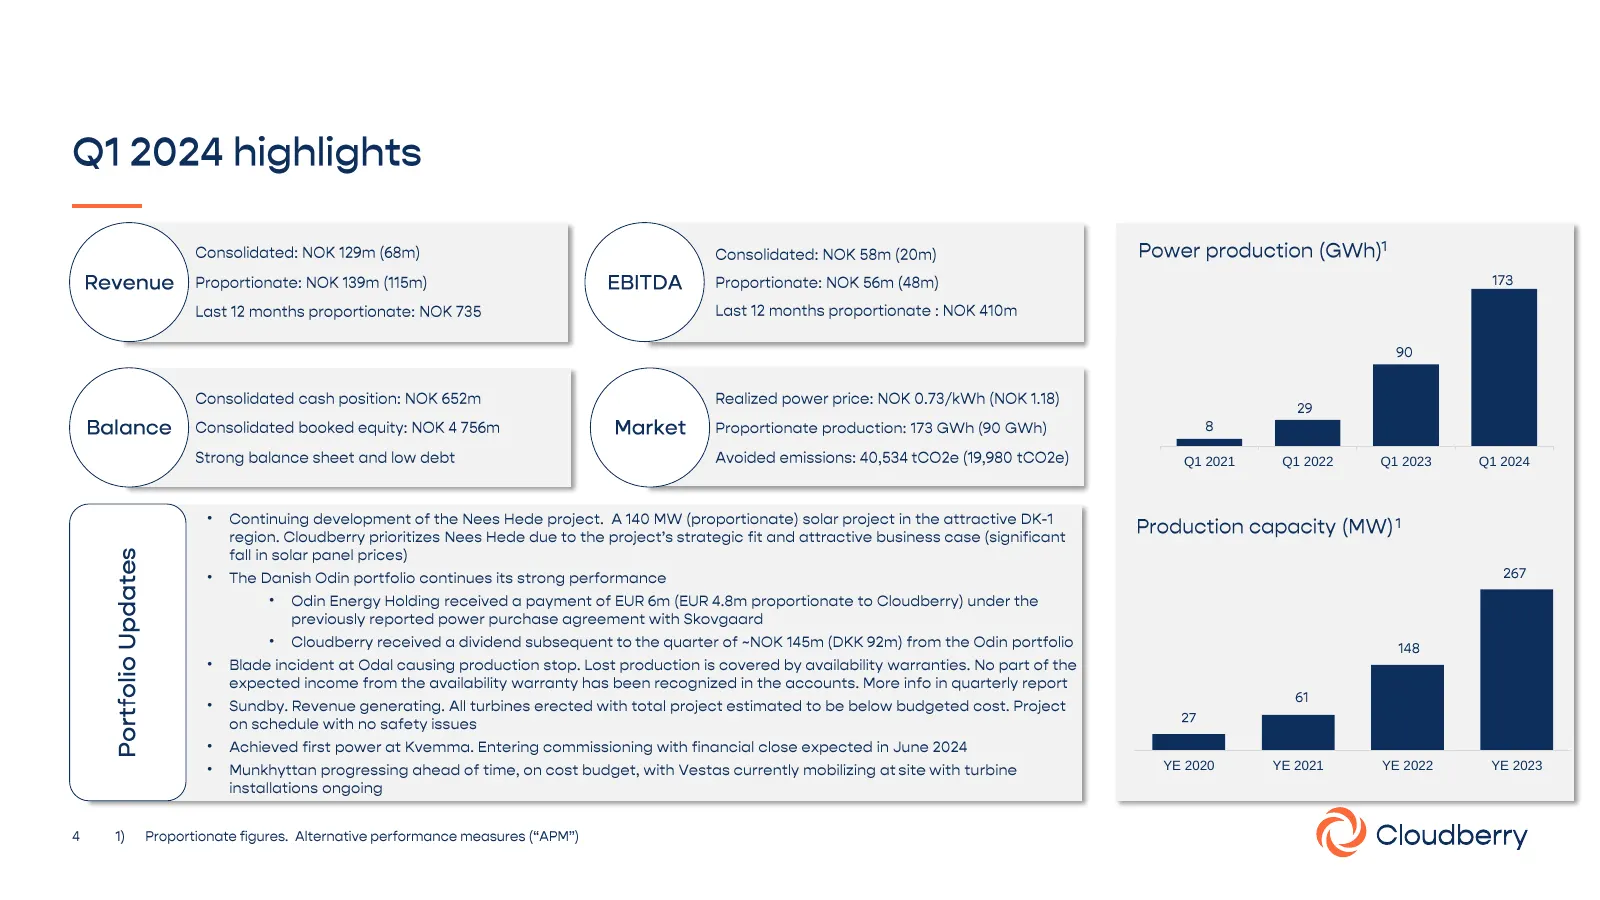
Slide 4: Q1 2024 highlights
Q1 2021 Q1 2022 Q1 2023 Q1 2024 • • • • • • • • YE 2020 YE 2021 YE 2022 YE 2023
Slide 5: End to end provider of renewable energy in the Nordics
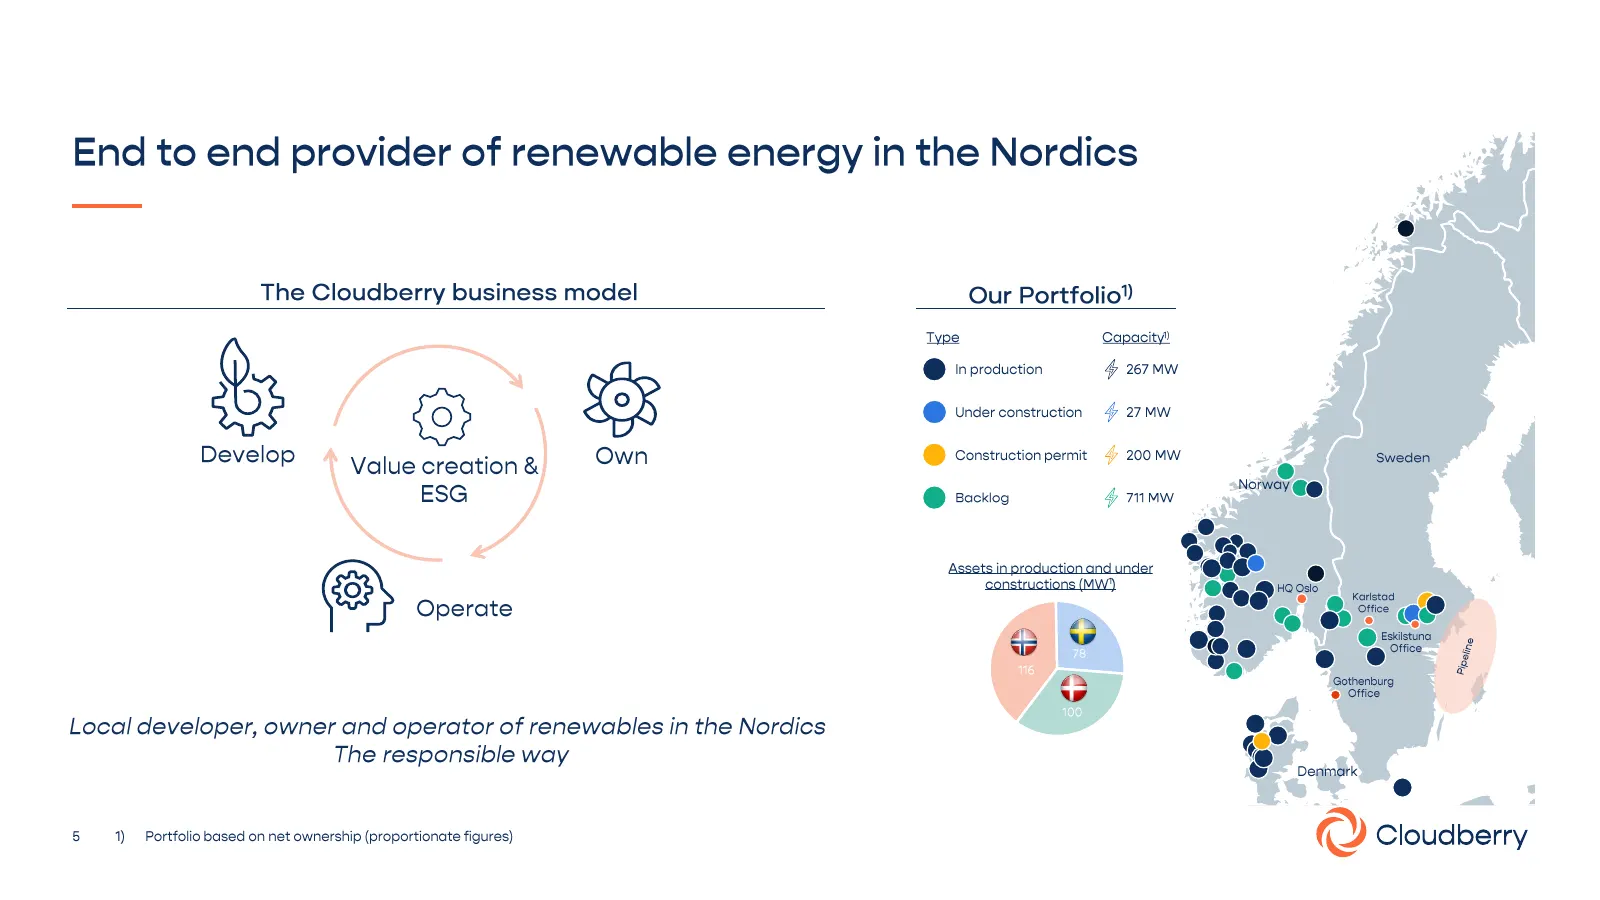
End to end provider of renewable energy in the Nordics The Cloudberry business model Our Portfolio” ae Own Y Bw oR se eation & cee Operate Local developer, owner and operator of renewables in the Nordics The responsible way 5 1) _ Portfolio based on net ownership (proportionate figures) Type Capacit
Slide 6: A diversified and growing portfolio across the Nordics
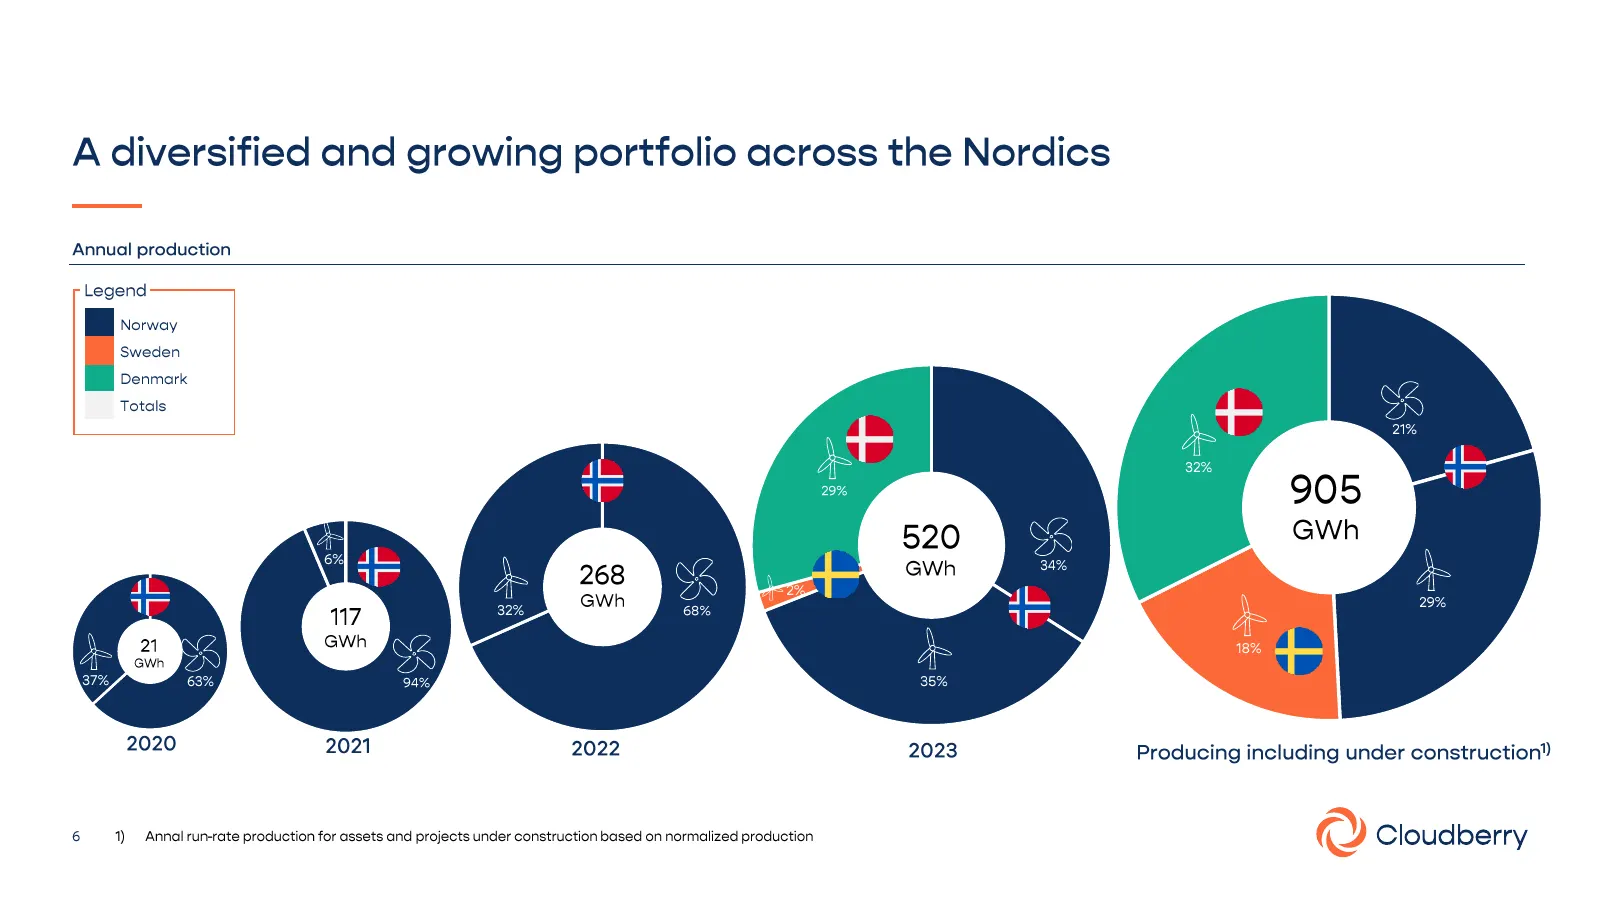
A diversified and growing portfolio across the Nordics Annual production Legend Norway Sweden Denmark Totals Producing including under construction” 2020 6 1) Annalrun-rate production for assets and projects under construction based on normalized production ( ») Cloud berry
Slide 7: Portfolio overview
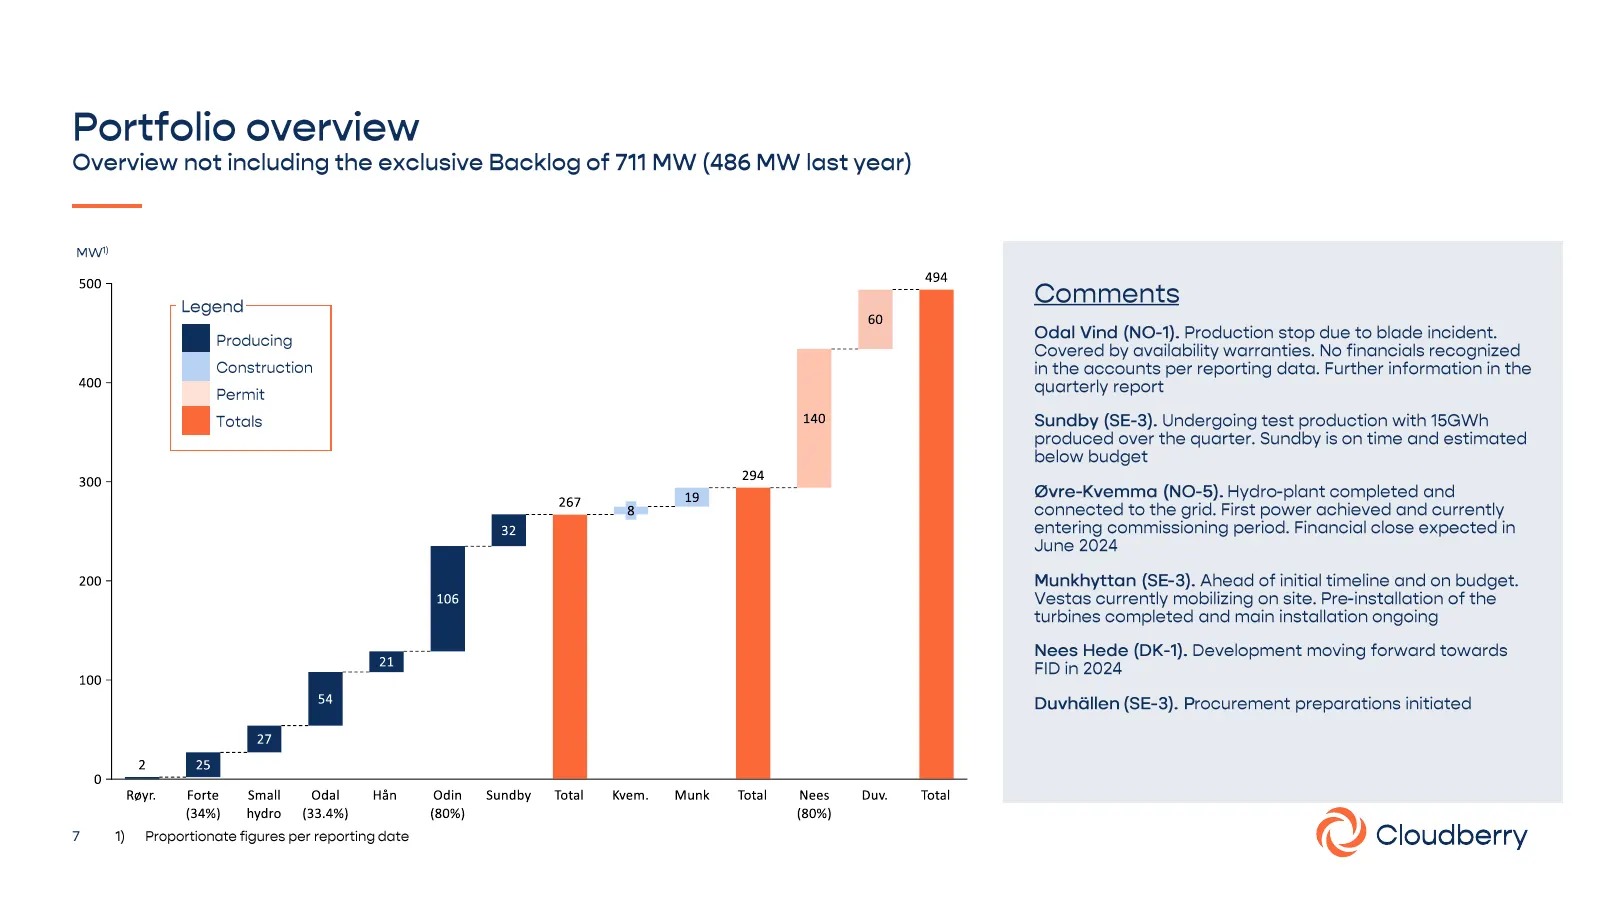
Portfolio overview Overview not including the exclusive Backlog of 711 MW (486 MW last year) Mw) 500 — Legend 9 60 en Construction 400 140 300 _ 294 _ J 19 200 100 2 oO Royr. Forte Small. Odal Han Odin Sundby Total Kvem. Munk Total Nees Duv. (34%) hydro (33.4%) (80%) (80%) v} Proportionate figures p
Slide 8: Cloudberry's strategic focus
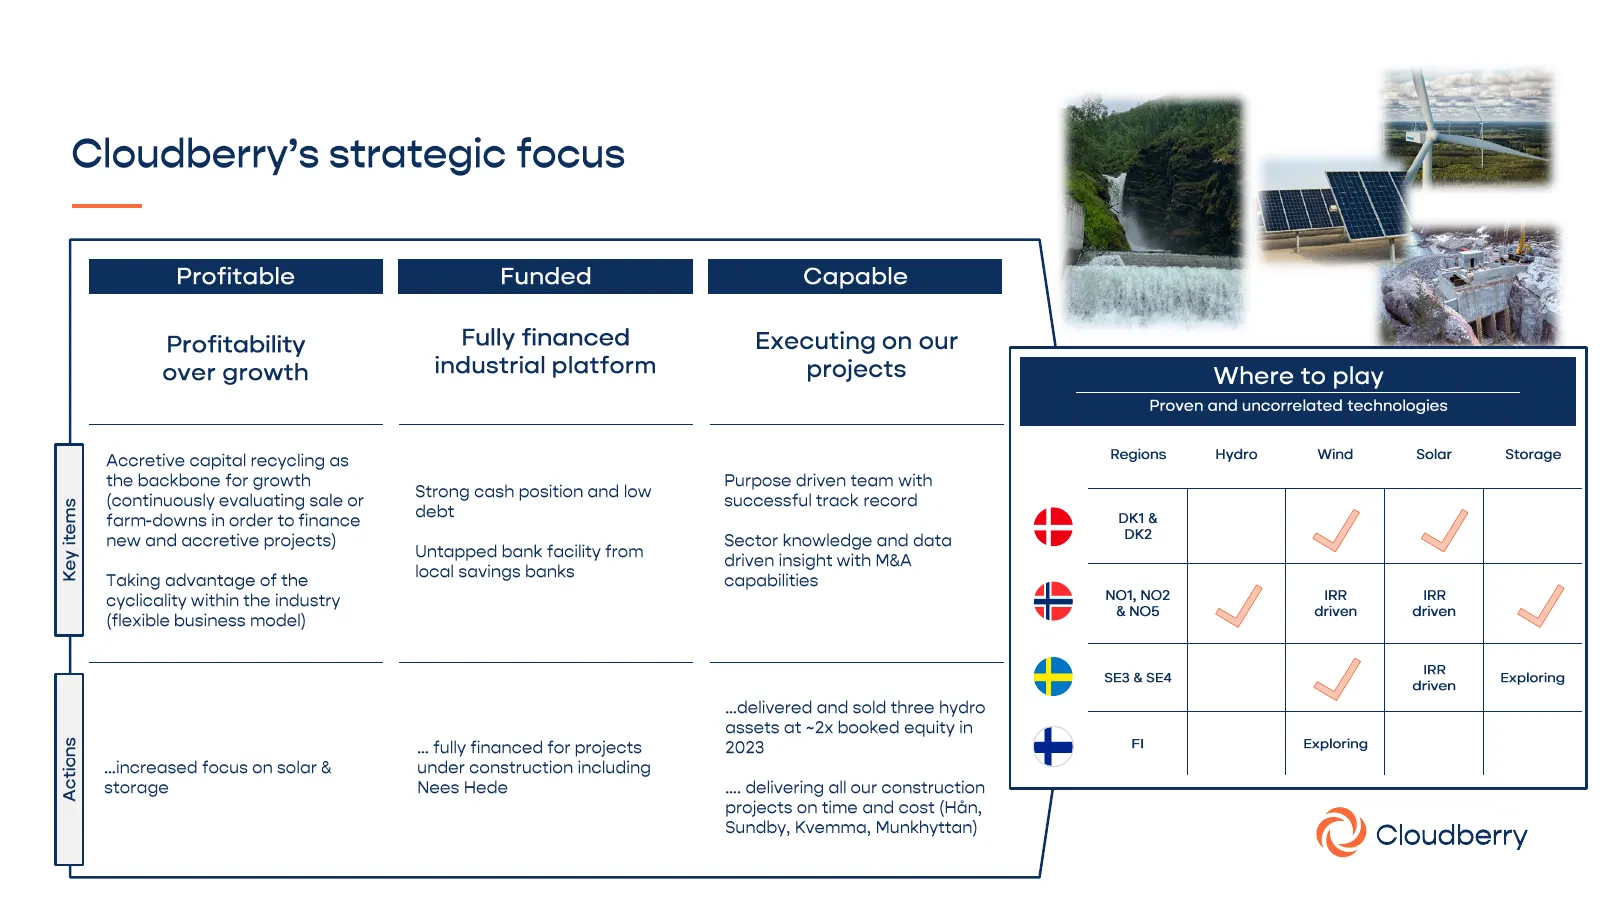
Cloudberry’s strategic focus Key items Actions Profitability over growth Fully financed industrial platform Executing on our projects Accretive capital recycling as the backbone for growth (continuously evaluating sale or farm-downs in order to finance new and accretive projects) Taking advantage of
Slide 9: ESG update Q1 2024
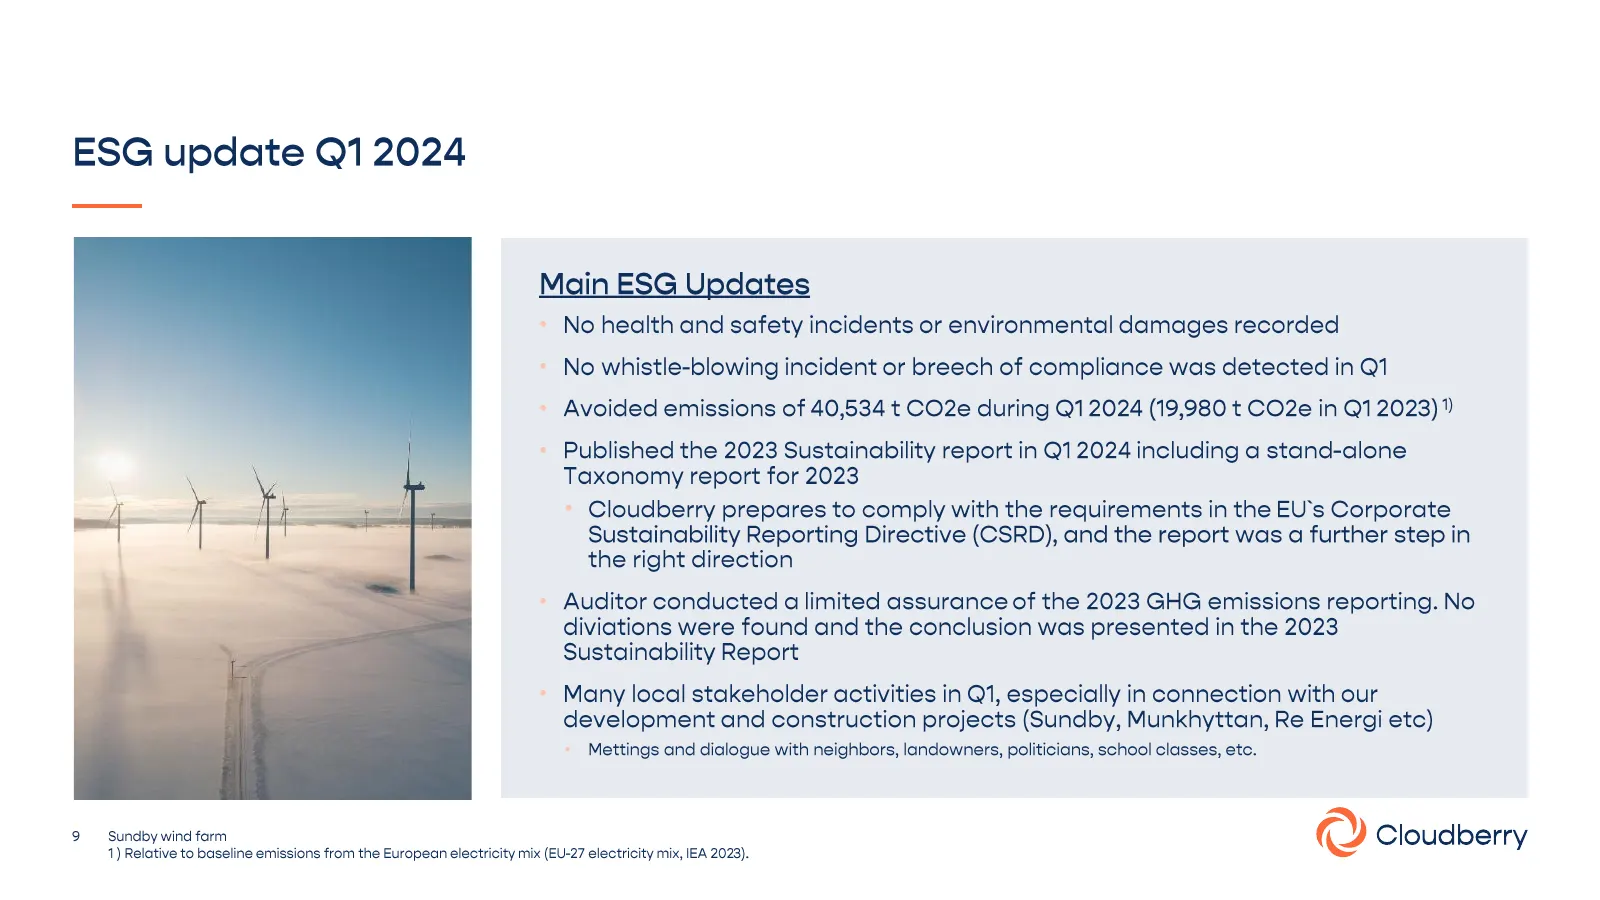
ESG update Q1 2024 Main E ti ~ No health and safety incidents or environmental damages recorded ~ No whistle-blowing incident or breech of compliance was detected in Q1 ~ Avoided emissions of 40,534 t CO2e during Q1 2024 (19,980 t CO2e in Q1 2023) ?) ~ Published the 2023 Sustainability report in Q12
Slide 10: Key Financials
Key Financials Han
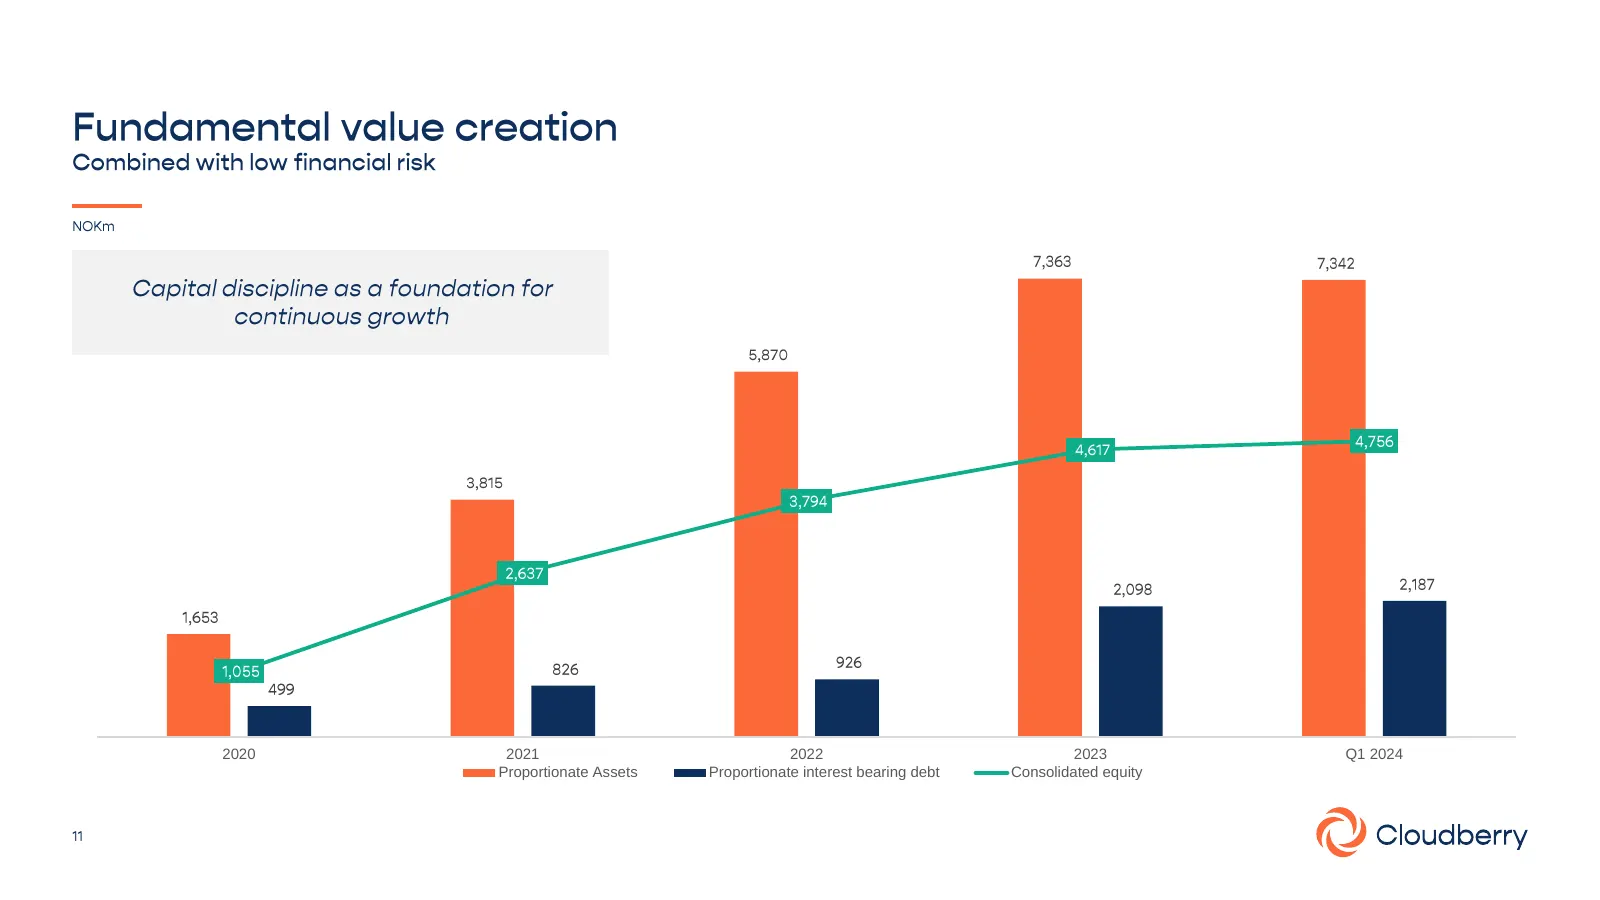
Slide 11: Proportionate assets, debt and consolidated equity
2020 2021 2022 2023 Q1 2024 Proportionate Assets Proportionate interest bearing debt Consolidated equity
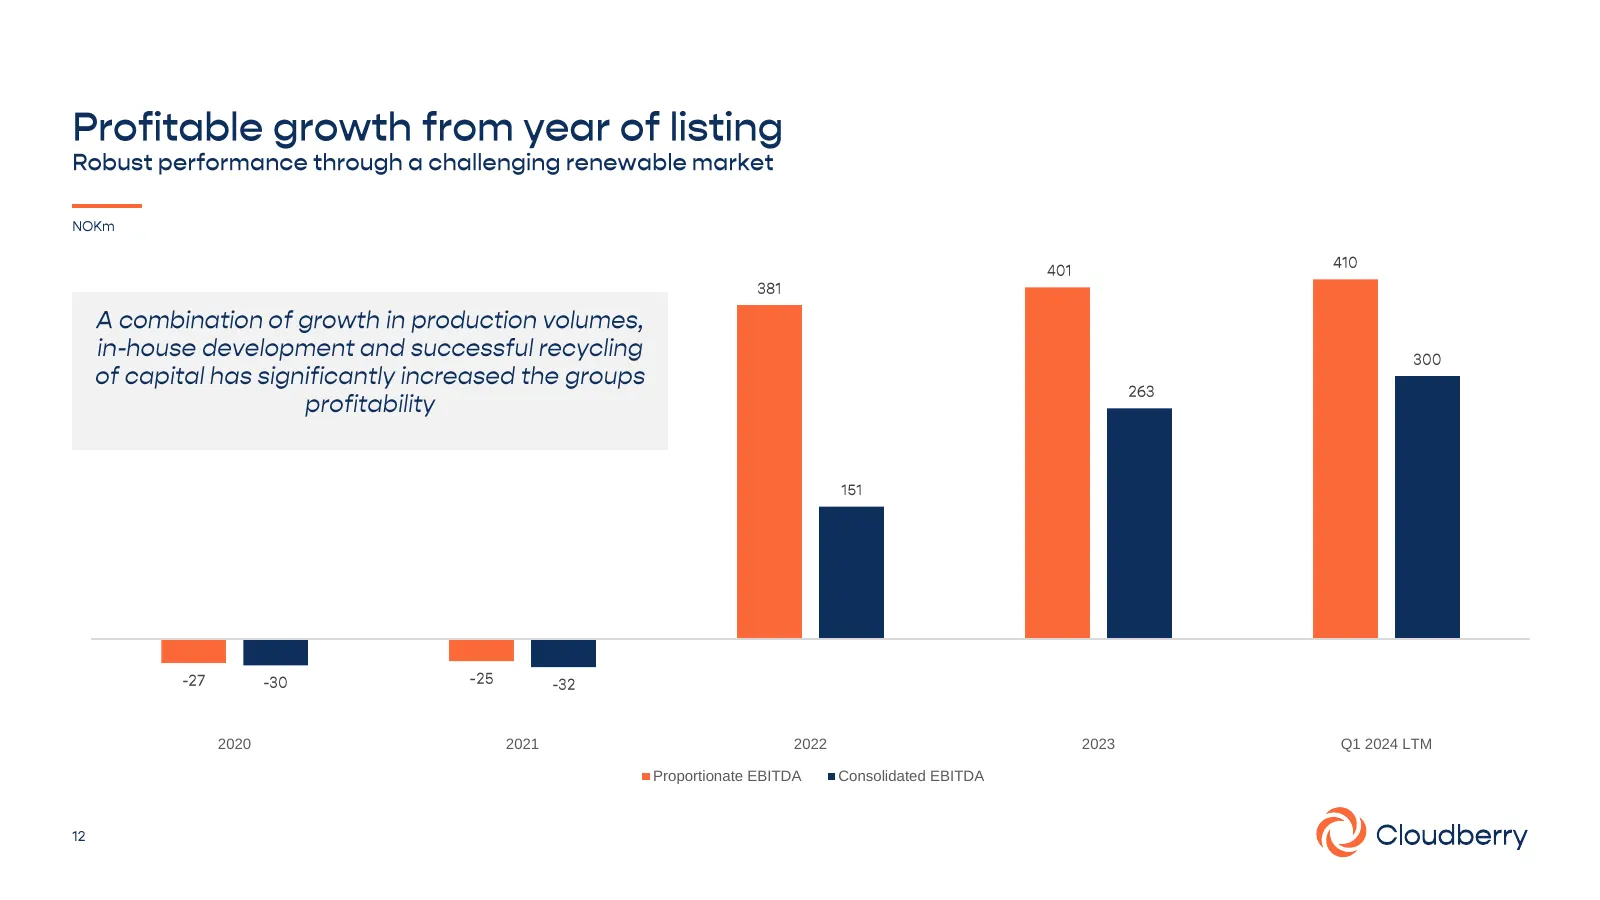
Slide 12: Proportionate and consolidated EBITDA
2020 2021 2022 2023 Q1 2024 LTM Proportionate EBITDA Consolidated EBITDA
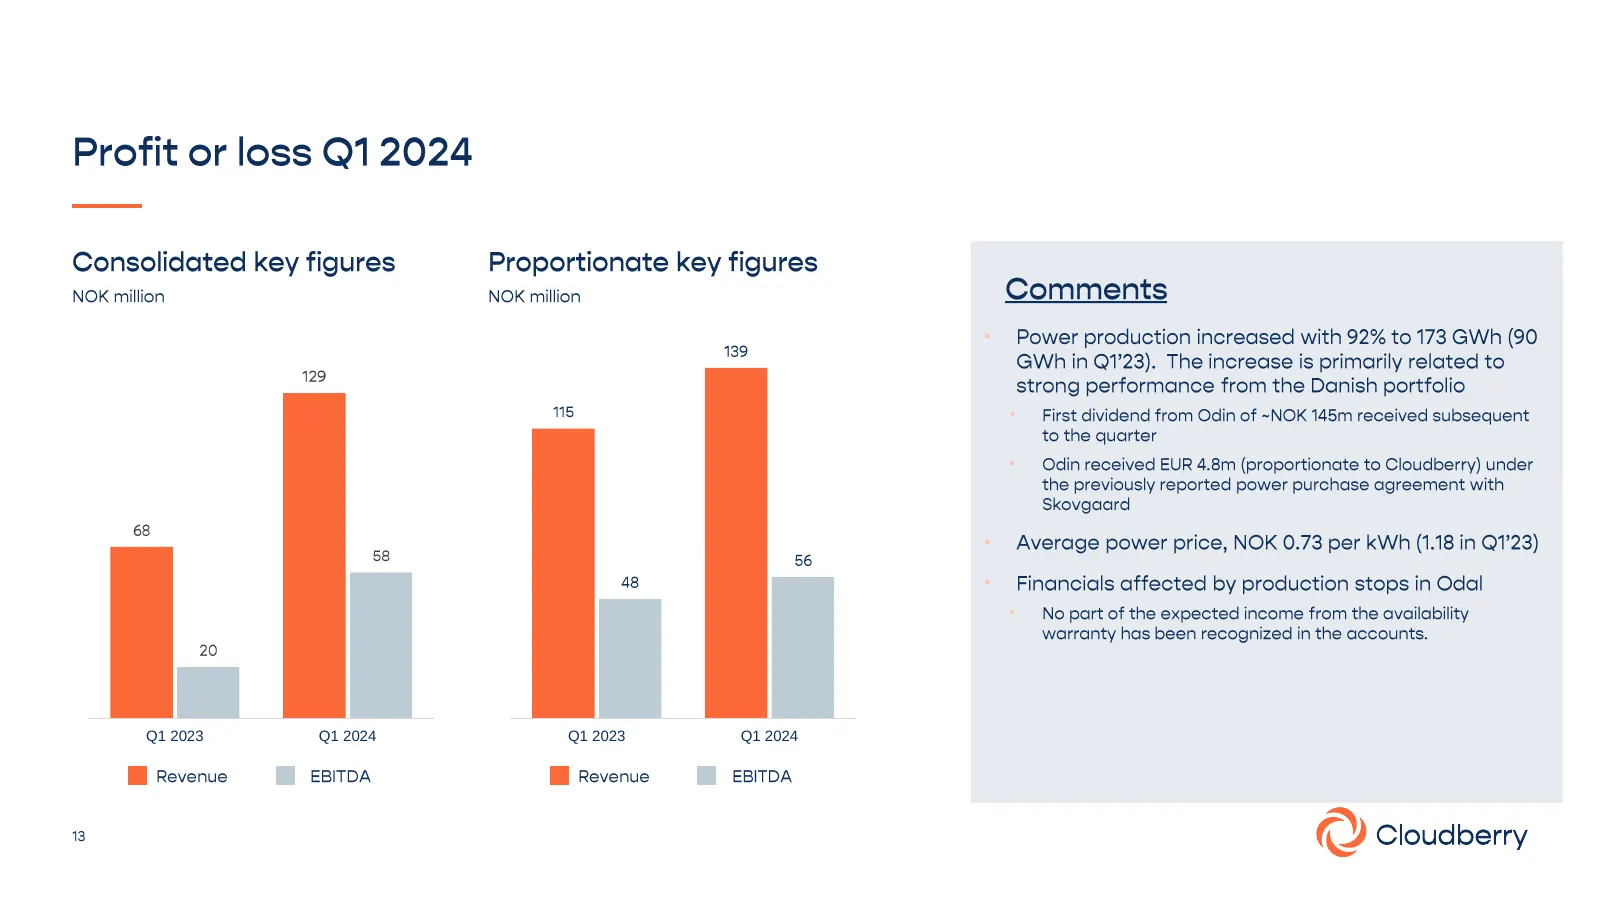
Slide 13: Q1 2023 vs Q1 2024 key figures
• • • • • • Q1 2023 Q1 2024 Q1 2023 Q1 2024
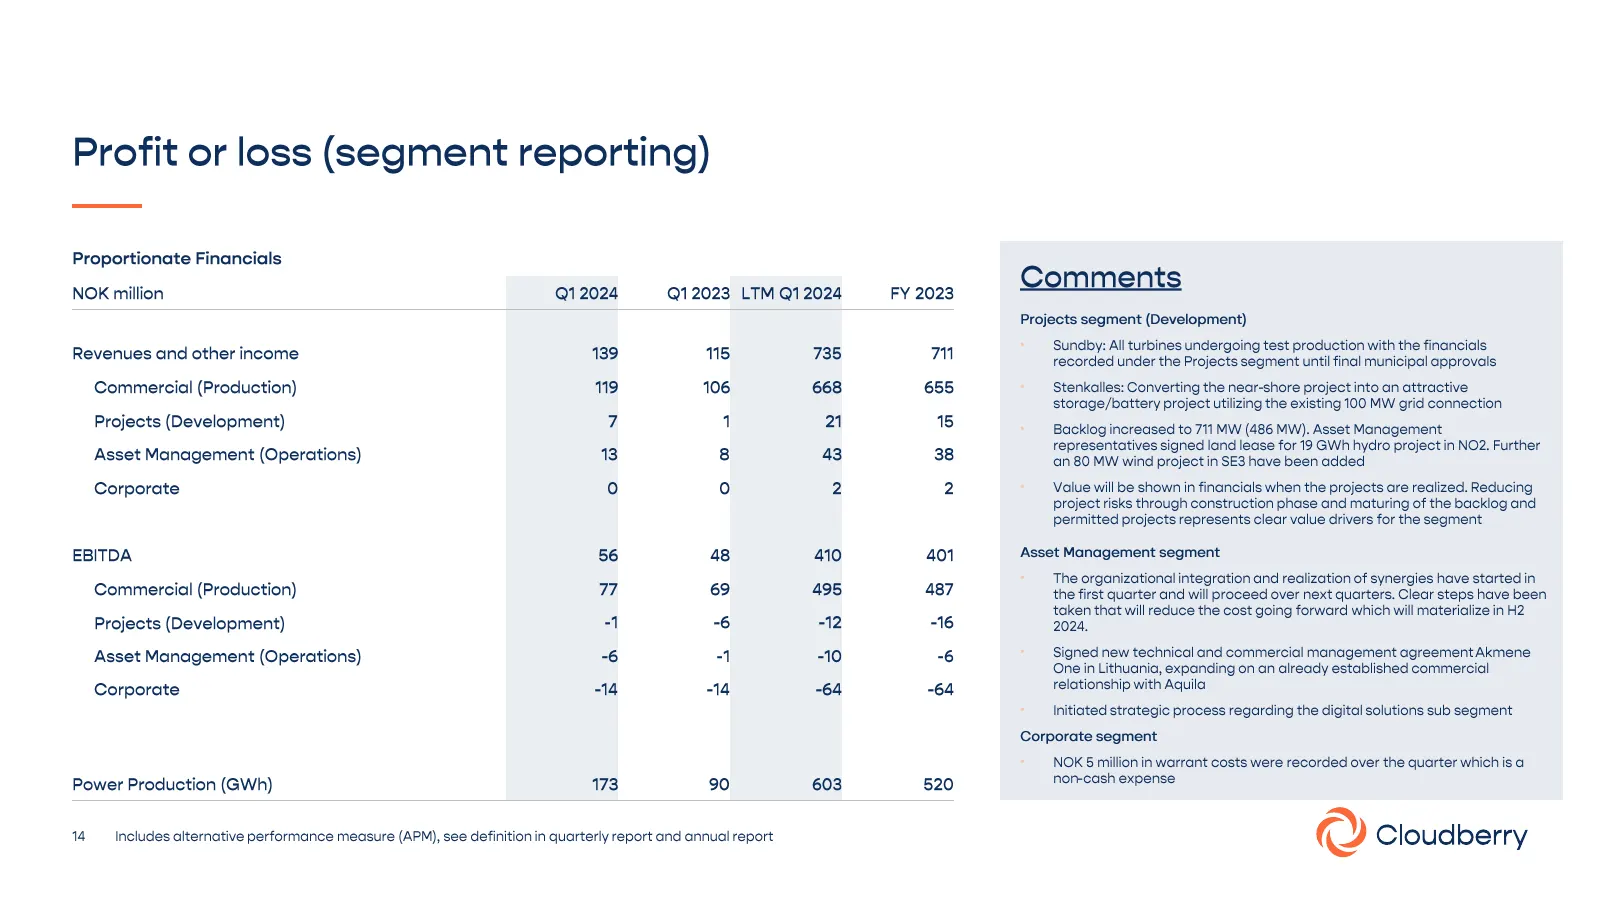
Slide 14: Profit or loss (segment reporting)
Profit or loss (segment reporting) Proportionate Financials NOK million Revenues and other income Commercial (Production) Projects (Development) Asset Management (Operations) Corporate EBITDA Commercial (Production) Projects (Development) Asset Management (Operations) Corporate Power Production (Wh)
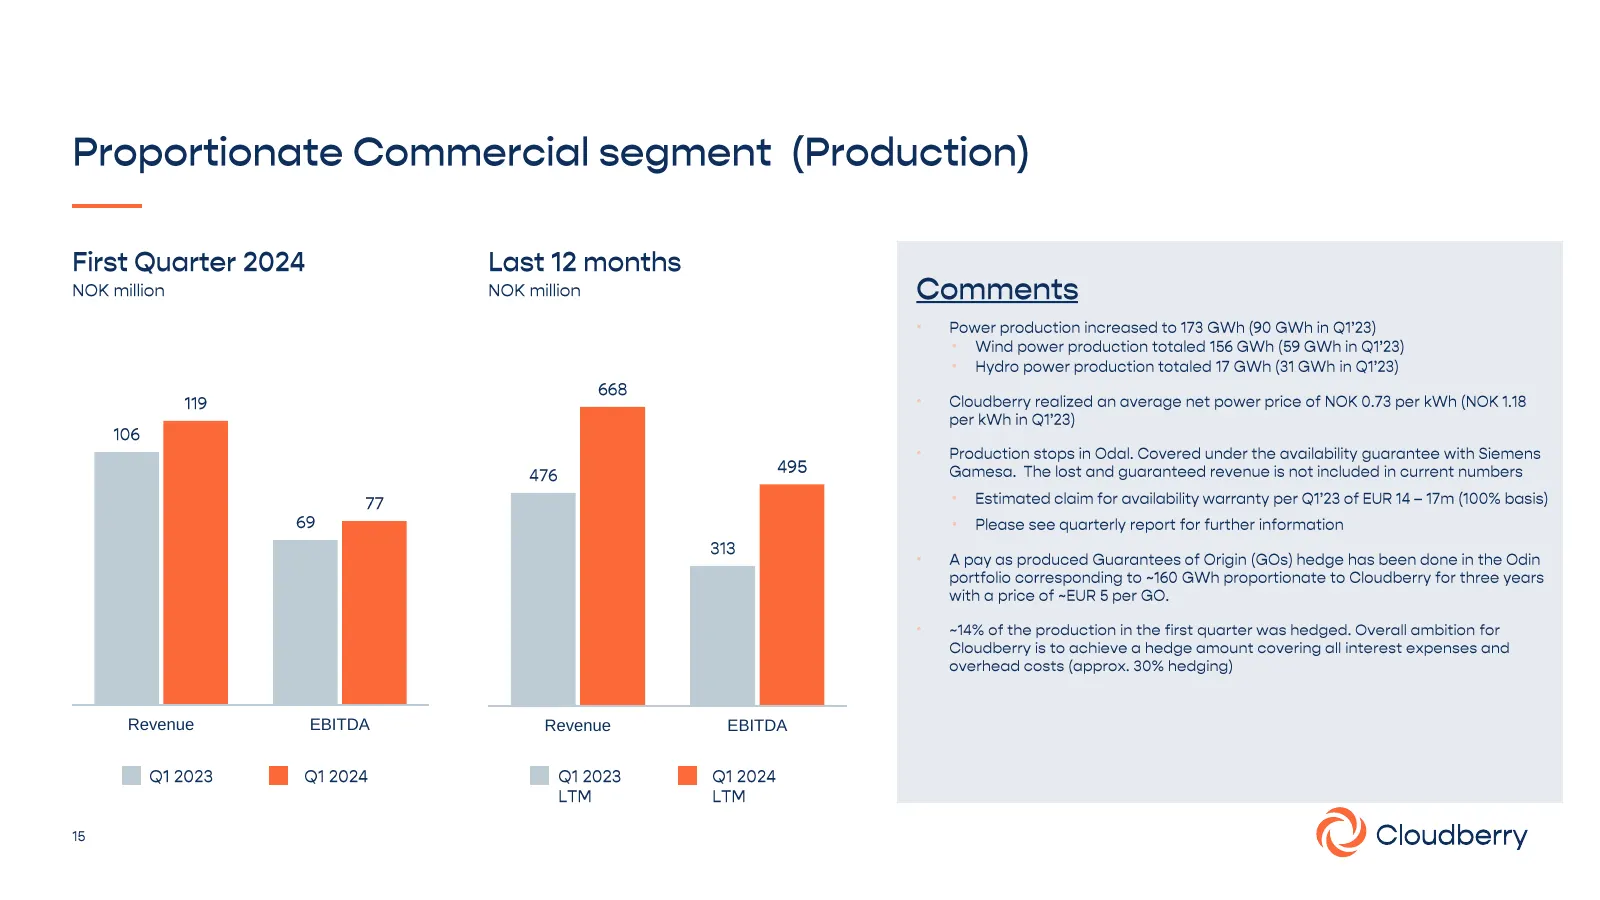
Slide 15: Revenue and EBITDA
• • • • • • • • • Revenue EBITDA Revenue EBITDA
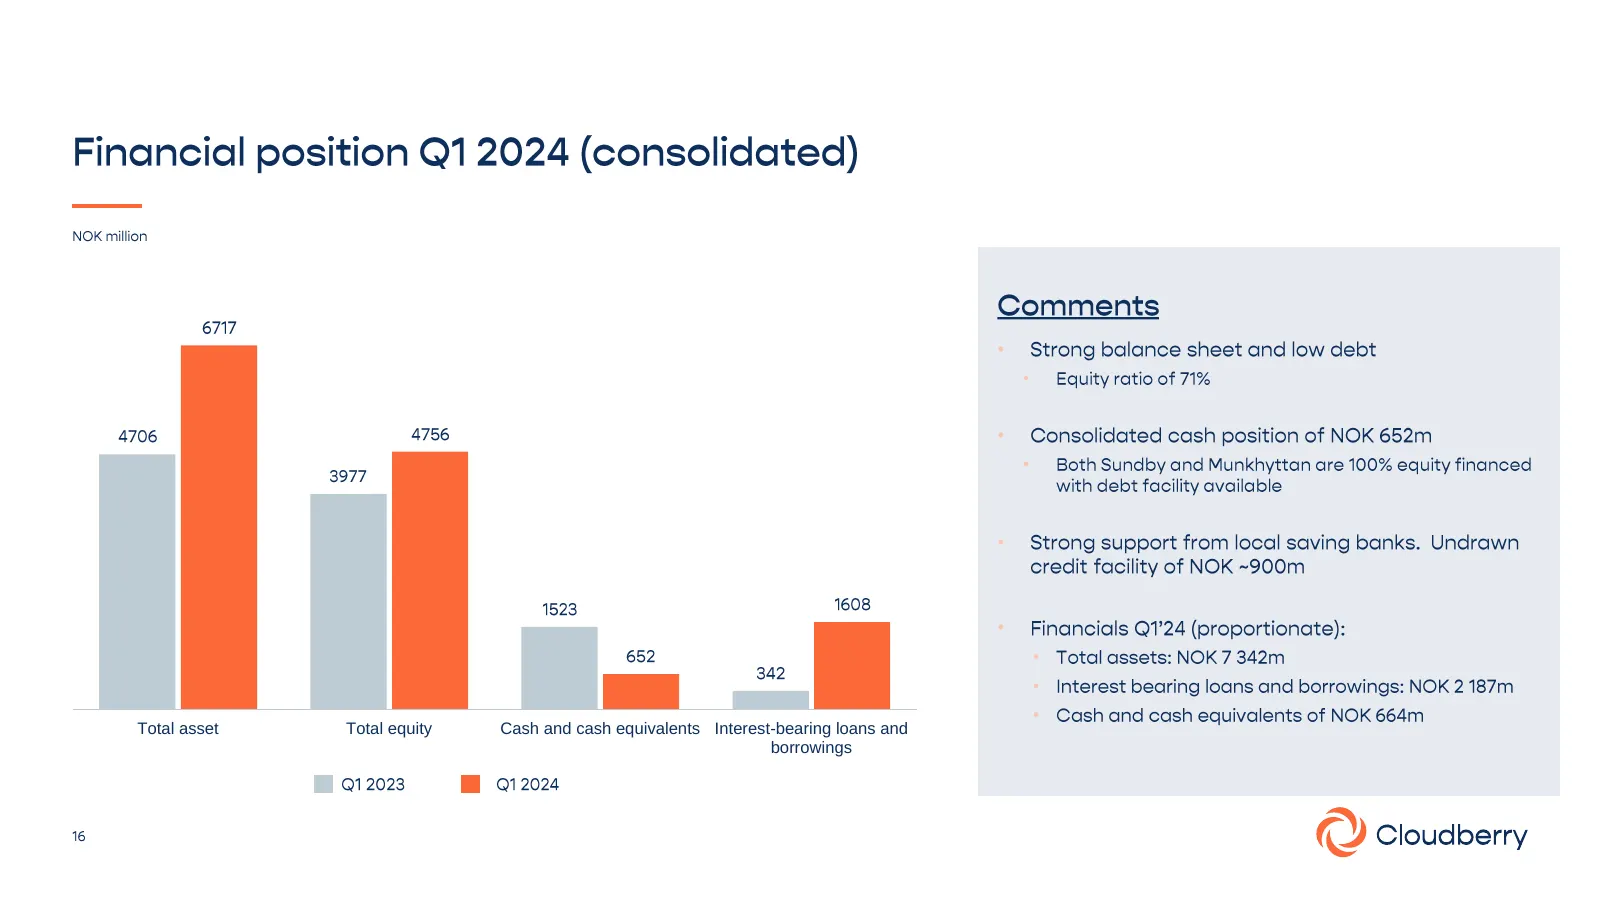
Slide 16: Total assets, equity, cash and interest-bearing loans
• • • • • • • • • Total asset Total equity Cash and cash equivalents Interest-bearing loans and borrowings
Slide 17: Market & summary
Market & summary Sundby
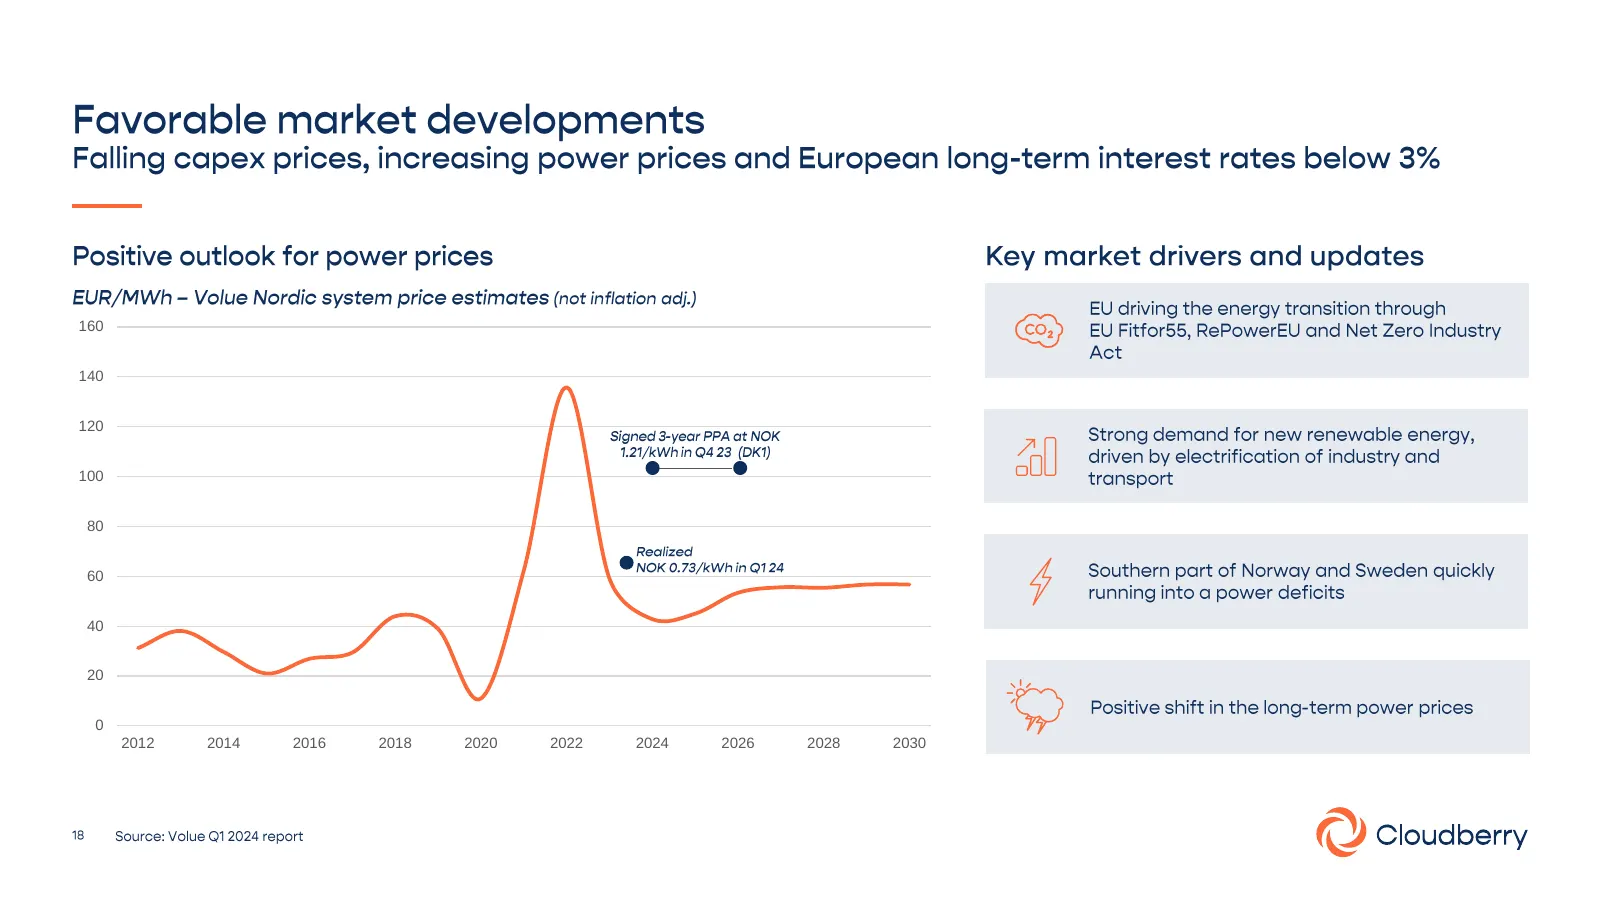
Slide 18: Market outlook 2012-2030
160 140 120 100 80 60 40 20 0 2012 2014 2016 2018 2020 2022 2024 2026 2028 2030
Slide 19: Closing remarks
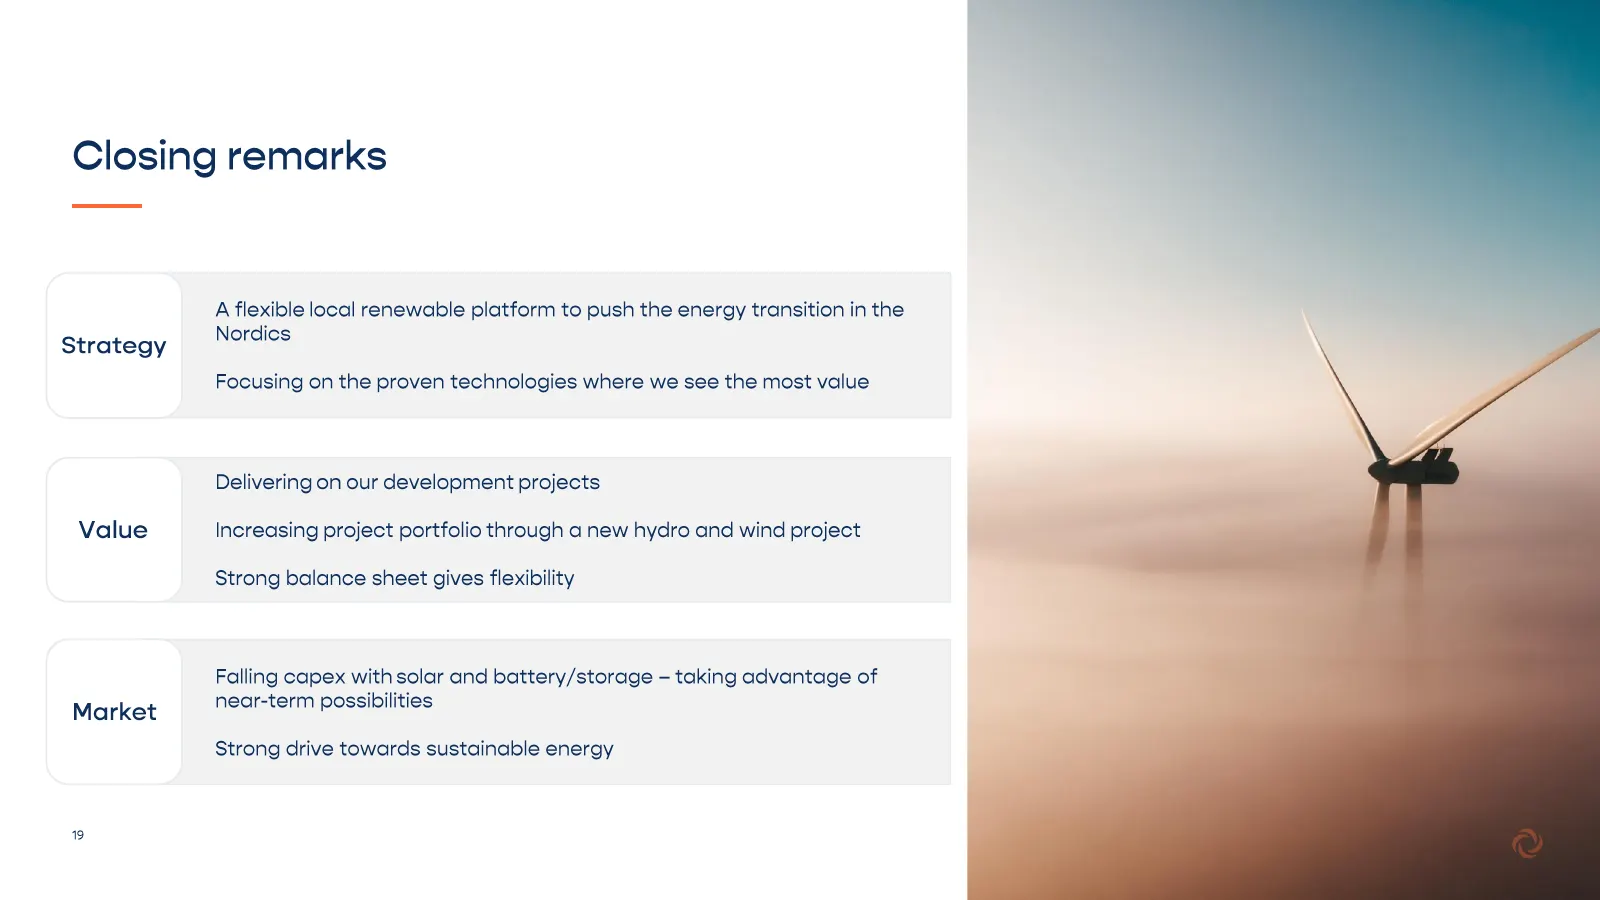
Closing remarks Strategy Value Market 9 A flexible local renewable platform to push the energy transition in the Nordics Focusing on the proven technologies where we see the most value Delivering on our development projects Increasing project portfolio through a new hydro and wind project Strong bal
Source: Internet Archive copy of cloudberry.no
More decks from Cloudberry Clean Energy ASA
 Q3 2026 Earnings Presentation19 slides · Nov 4, 2026
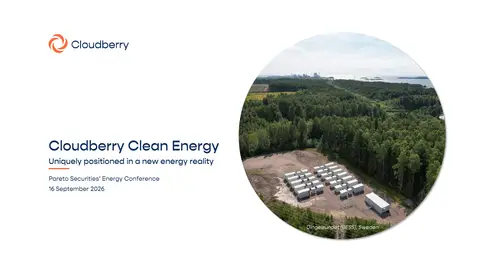 Pareto Securities' Energy Conference 202615 slides · Sep 16, 2026
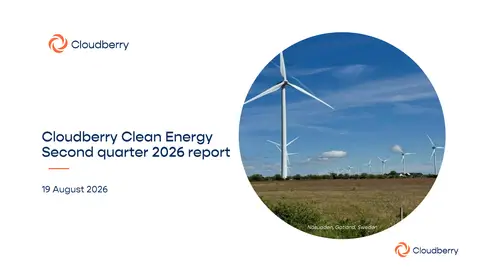 Q2 2026 Earnings Presentation24 slides · Aug 19, 2026
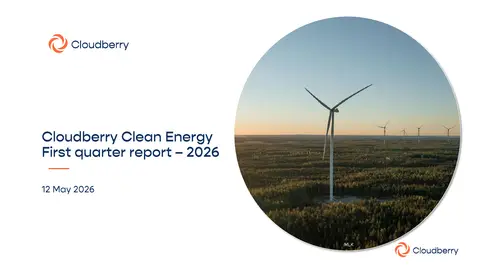 Q1 2026 Earnings Presentation22 slides · May 12, 2026
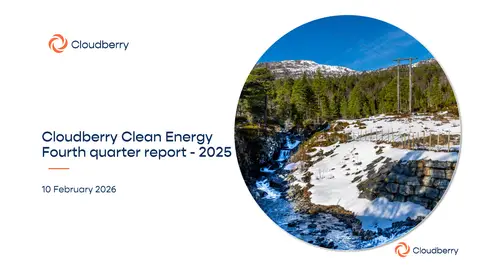 Q4 2025 Earnings Presentation23 slides · Feb 10, 2026
 Q3 2025 Earnings Presentation22 slides · Nov 4, 2025