BBX Capital Inc · OTC:BBXIA
BBX Capital — Bankatlantic Bancorp — Investor Presentation (February 2007)
34 slides from BBX Capital's investor presentation, Feb 7, 2007
Slide 1: BankAtlantic Bancorp February 2007
NYSE BBX FEBRUARY 2007 February 6, 2007 Prepared:
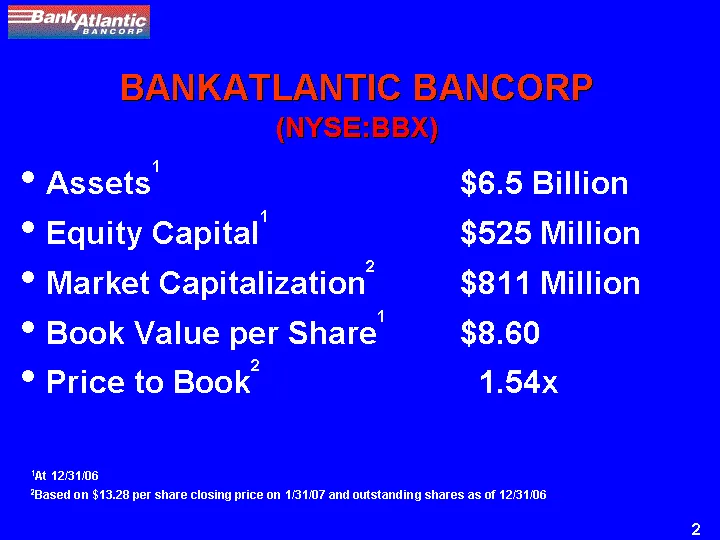
Slide 2: BankAtlantic Bancorp key figures
(NYSE:BBX) Assets1 $6.5 Billion Equity Capital1 $525 Million Market Capitalization2 $811 Million Book Value per Share1 $8.60 Price to Book2 1.54x 1At 12/31/06 2Based on $13.28 per share closing price on 1/31/07 and outstanding shares as of 12/31/06 BANKATLANTIC BANCORP
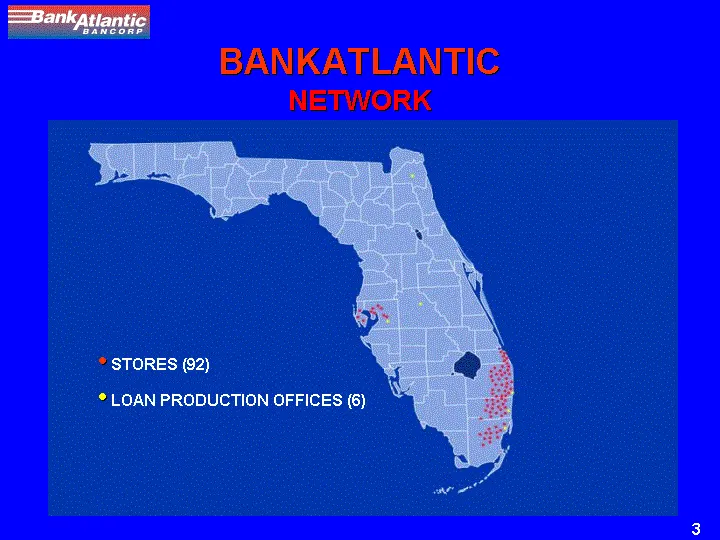
Slide 3: Network: BankAtlantic stores and loan production offices
NETWORK BANKATLANTIC STORES (92) LOAN PRODUCTION OFFICES (6)
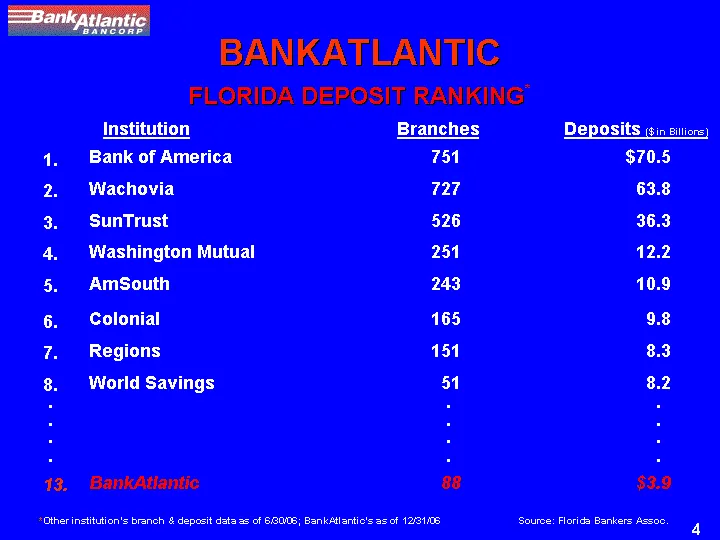
Slide 4: Florida deposit ranking
FLORIDA DEPOSIT RANKING* Institution Branches Deposits ($ in Billions) *Other institution's branch & deposit data as of 6/30/06; BankAtlantic's as of 12/31/06 Source: Florida Bankers Assoc. 1. Bank of America 751 $70.5 2. Wachovia 727 63.8 3. SunTrust 526 36.3 4. Washington Mutual 251 12.2 5. AmSout
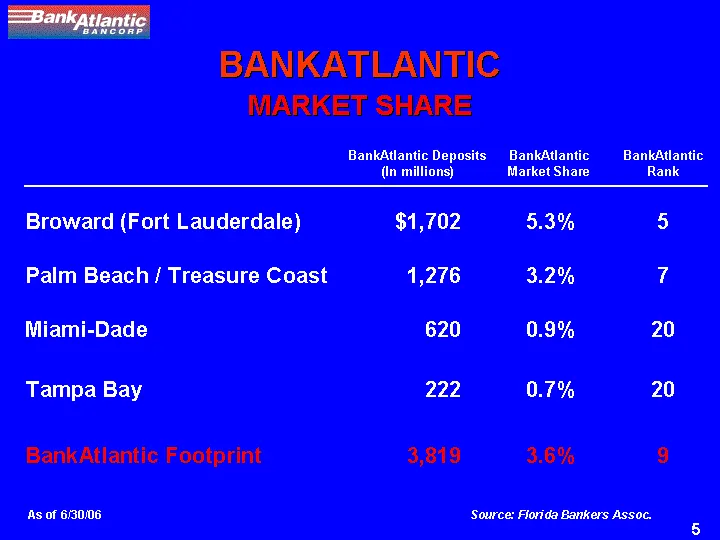
Slide 5: BankAtlantic deposits and market share
BankAtlantic Deposits (In millions) BankAtlantic Market Share As of 6/30/06 Source: Florida Bankers Assoc. MARKET SHARE Broward (Fort Lauderdale) $1,702 5.3% 5 Palm Beach / Treasure Coast 1,276 3.2% 7 Miami-Dade 620 0.9% 20 Tampa Bay 222 0.7% 20 BankAtlantic Footprint 3,819 3.6% 9 BANKATLANTIC BankA
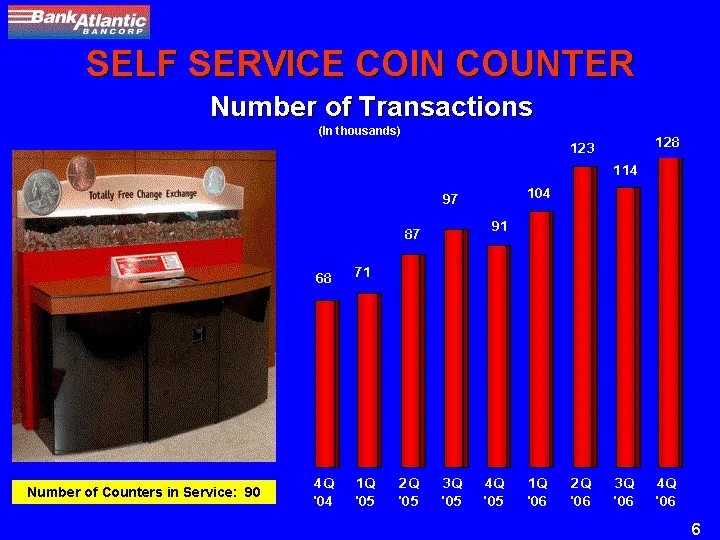
Slide 6: Number of counters in service
Number of Counters in Service: 90 4Q '04 1Q '05 2Q '05 3Q '05 4Q '05 1Q '06 2Q '06 3Q '06 4Q '06 East 68.121 71.113 86.718 97.025 90.63 104.28 122.767 114 128 SELF SERVICE COIN COUNTER Number of Transactions (In thousands)
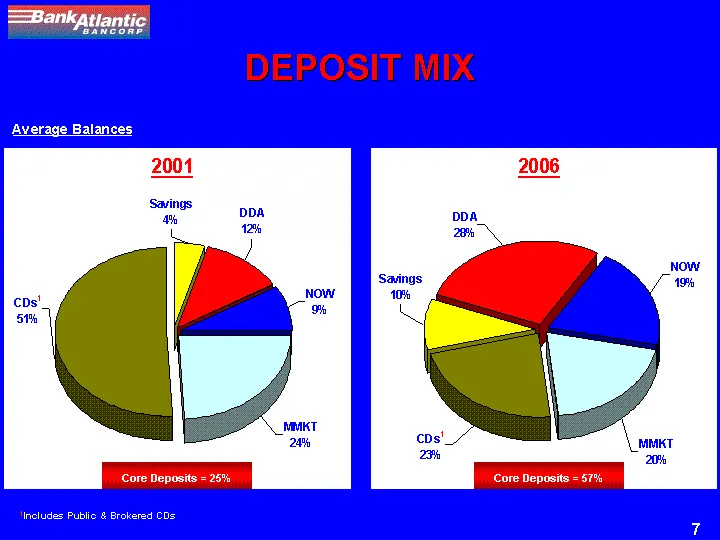
Slide 7: Deposit mix
Savings4% DDA12% NOW9% MMKT24% CDs51% East 103055 278707 198295 559390 1182074 DEPOSIT MIX Savings10% DDA28% NOW20% MMKT20% CDs23% East 369504 1056254 746837 755221 868777 Core Deposits = 25% Core Deposits = 57% Average Balances 1Includes Public & Brokered CDs
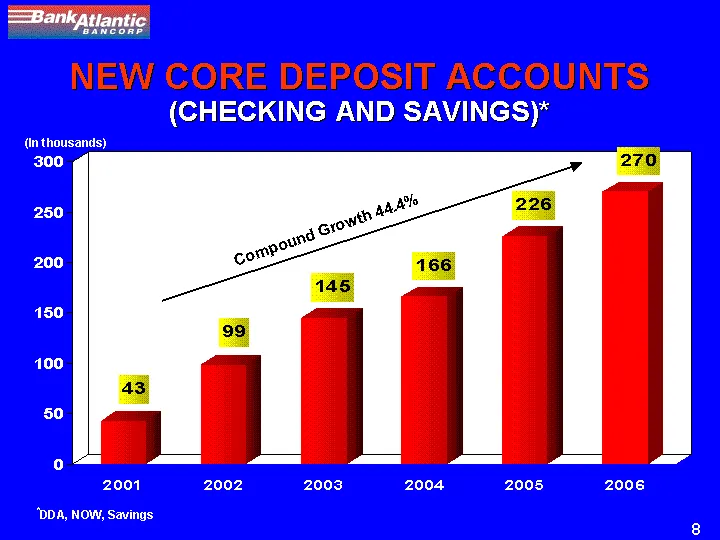
Slide 8: New core deposit accounts
2001 2002 2003 2004 2005 2006 NEW LOW COST DEP 43 99 145 166 226 270 NEW CORE DEPOSIT ACCOUNTS (CHECKING AND SAVINGS)* *DDA, NOW, Savings Compound Growth 44.4% (In thousands)
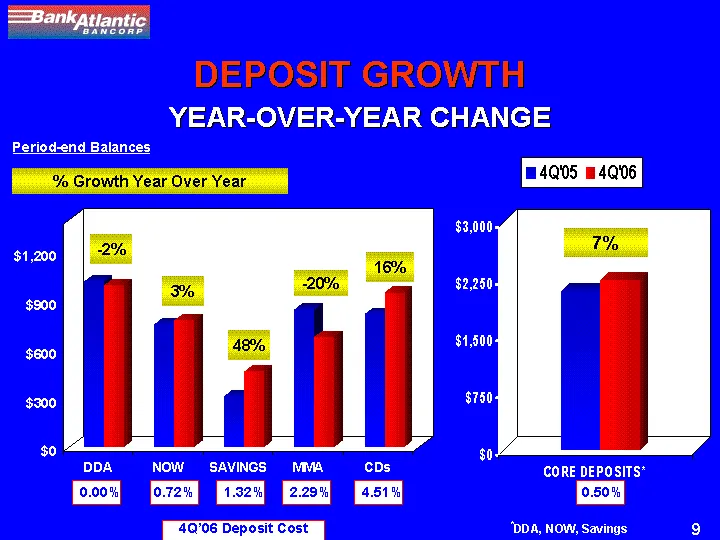
Slide 9: Deposit growth year-over-year change
DEPOSIT GROWTH DDA NOW SAVINGS MMA CDs 4Q'05 1020 756 314 846 817 4Q'06 996 779 465 678 949 CORE DEPOSITS* 4Q'05 2090 4Q'06 2240 Period-end Balances - -2% 3% 48% 16% 0.50% 0.00% 0.72% 1.32% 4.51% - -20% 2.29% 4Q'06 Deposit Cost % Growth Year Over Year 7% *DDA, NOW, Savings YEAR-OVER-YEAR CHANGE
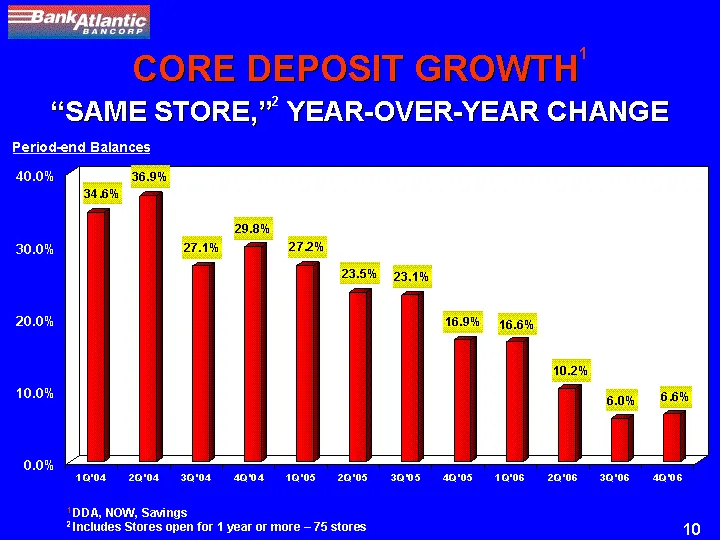
Slide 10: Core deposit growth same store
1 DDA, NOW, Savings 2 Includes Stores open for 1 year or more - 75 stores 1Q'04 2Q'04 3Q'04 4Q'04 1Q'05 2Q'05 3Q'05 4Q'05 1Q'06 2Q'06 3Q'06 4Q'06 LCD GROWTH 0.346 0.369 0.271 0.298 0.272 0.235 0.231 0.169 0.166 0.102 0.06 0.066 CORE DEPOSIT GROWTH1 "SAME STORE,"2 YEAR-OVER-YEAR CHANGE Period-end Bal
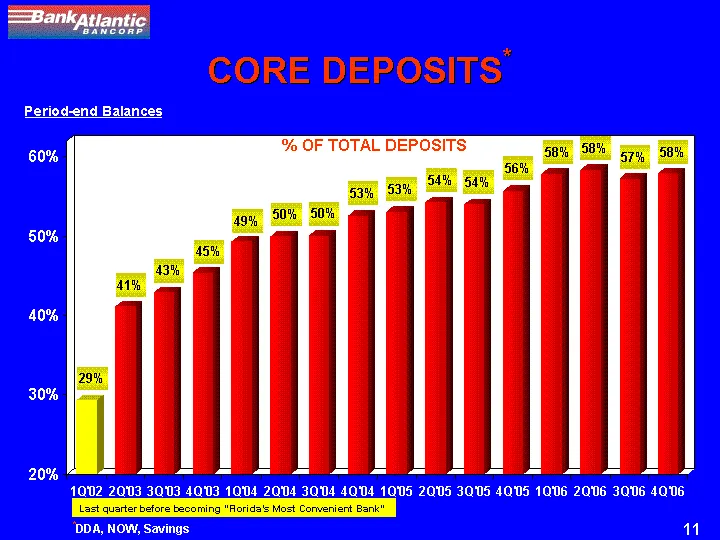
Slide 11: Core deposits percent of total deposits
CORE DEPOSITS* 1Q'02 2Q'03 3Q'03 4Q'03 1Q'04 2Q'04 3Q'04 4Q'04 1Q'05 2Q'05 3Q'05 4Q'05 1Q'06 2Q'06 3Q'06 4Q'06 Low Cost Deposit % 0.293 0.411 0.429 0.454 0.493 0.5 0.501 0.526 0.531 0.543 0.54 0.557 0.579 0.584 0.5727 0.5794 *DDA, NOW, Savings % OF TOTAL DEPOSITS Period-end Balances Last quarter bef
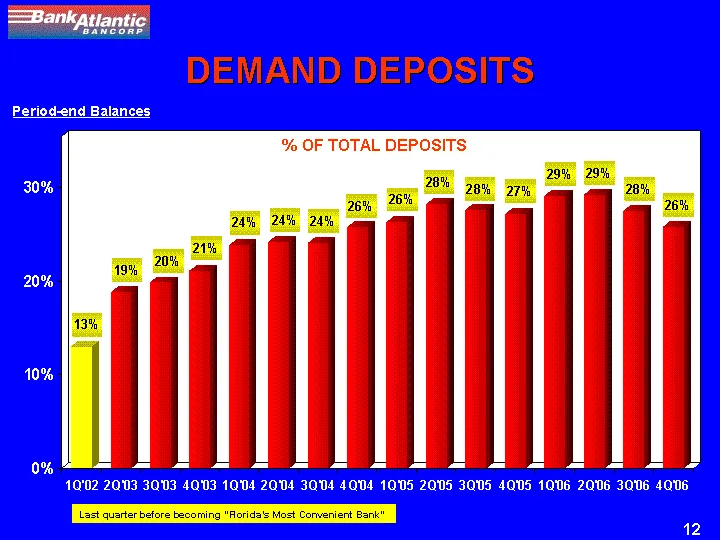
Slide 12: Demand deposits percent of total deposits
DEMAND DEPOSITS 1Q'02 2Q'03 3Q'03 4Q'03 1Q'04 2Q'04 3Q'04 4Q'04 1Q'05 2Q'05 3Q'05 4Q'05 1Q'06 2Q'06 3Q'06 4Q'06 Low Cost Deposit % 0.13 0.188 0.199 0.211 0.238 0.242 0.241 0.258 0.263 0.282 0.276 0.272 0.291 0.2919 0.2752 0.2575 % OF TOTAL DEPOSITS Period-end Balances Last quarter before becoming "F
Slide 13: Total deposits
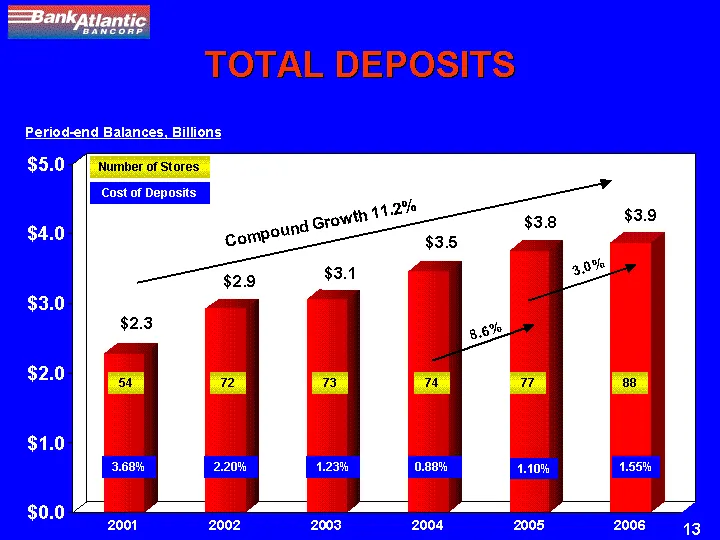
TOTAL DEPOSITS 2001 2002 2003 2004 2005 2006 Total Deposits 2.276567 2.920555 3.058142 3.457202 3.752676 3.867036 Compound Growth 11.2% Cost of Deposits 3.68% 2.20% 1.23% 54 72 73 Number of Stores Period-end Balances, Billions 74 0.88% 8.6% 77 1.10% 3.0% 1.55% 88
Slide 14: New store core deposit growth
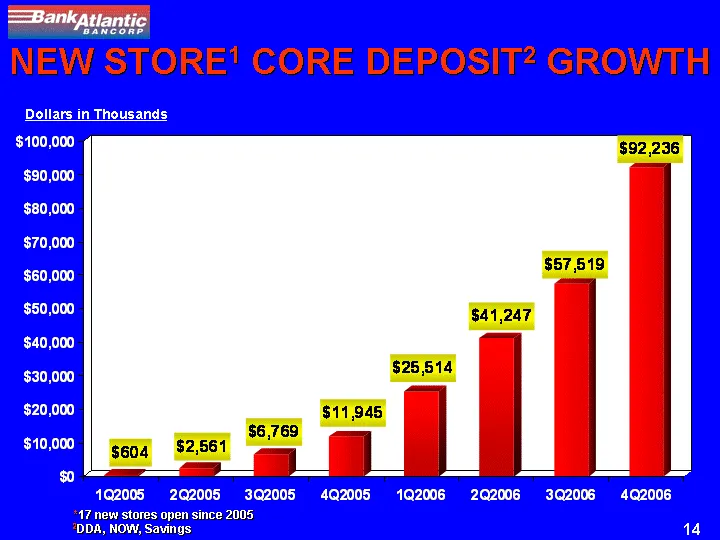
1Q2005 2Q2005 3Q2005 4Q2005 1Q2006 2Q2006 3Q2006 4Q2006 Core Deposits 604 2561 6769 11945 25514 41247 57519 92236 NEW STORE1 CORE DEPOSIT2 GROWTH Dollars in Millions *17 new stores open since 2005 2DDA, NOW, Savings
Slide 15: New store total deposit growth
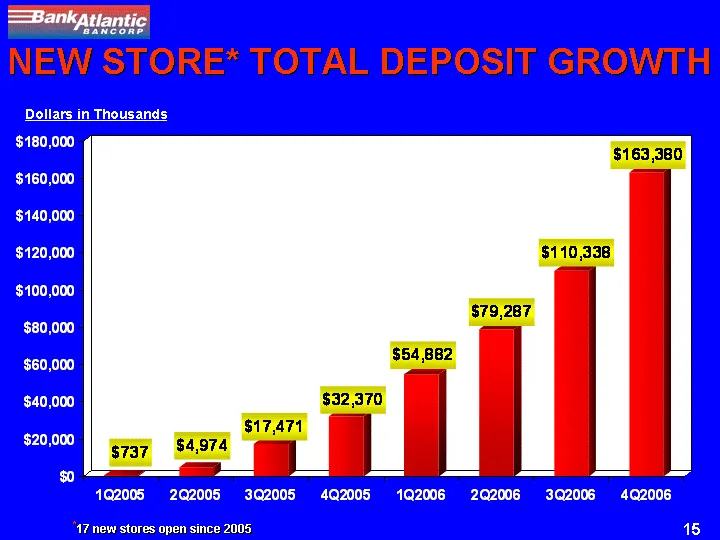
1Q2005 2Q2005 3Q2005 4Q2005 1Q2006 2Q2006 3Q2006 4Q2006 Total Deposits 737 4974 17471 32370 54882 79287 110338 163380 NEW STORE* TOTAL DEPOSIT GROWTH Dollars in Thousands *17 new stores open since 2005
Slide 16: Growing fee income
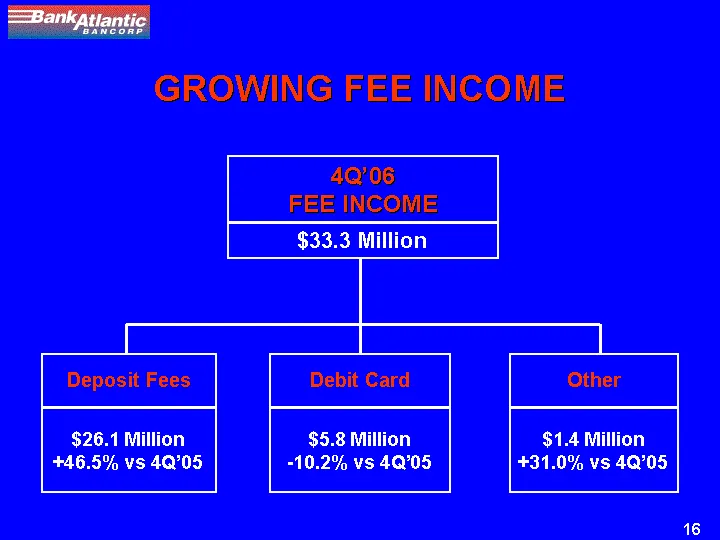
GROWING FEE INCOME $5.8 Million - -10.2% vs 4Q'05 $26.1 Million +46.5% vs 4Q'05 Debit Card Deposit Fees 4Q'06 FEE INCOME $33.3 Million Other $1.4 Million +31.0% vs 4Q'05
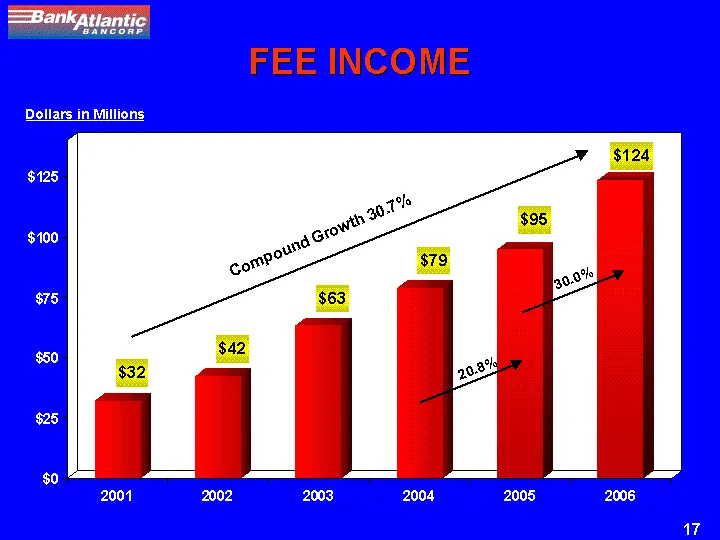
Slide 17: Fee income
2001 2002 2003 2004 2005 2006 Fee Income 32.368349 42.430051 63.250105 78.68041 95.02268012 123.561849 Compound Growth 30.7% 30.0% FEE INCOME Dollars in Millions 20.8%
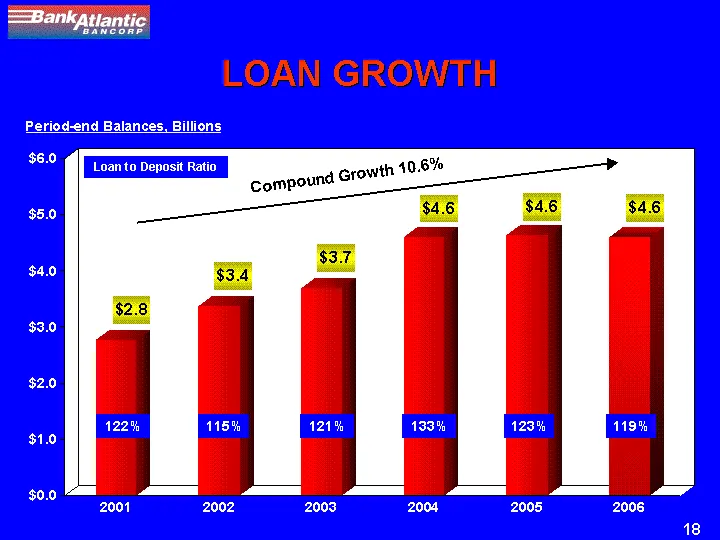
Slide 18: Loan growth
2001 2002 2003 2004 2005 2006 Total Loans 2.774238 3.37263 3.686153 4.599048 4.624772 4.59592 Compound Growth 10.6% Loan to Deposit Ratio 122% 115% 121% 133% 123% Period-end Balances, Billions LOAN GROWTH 119%
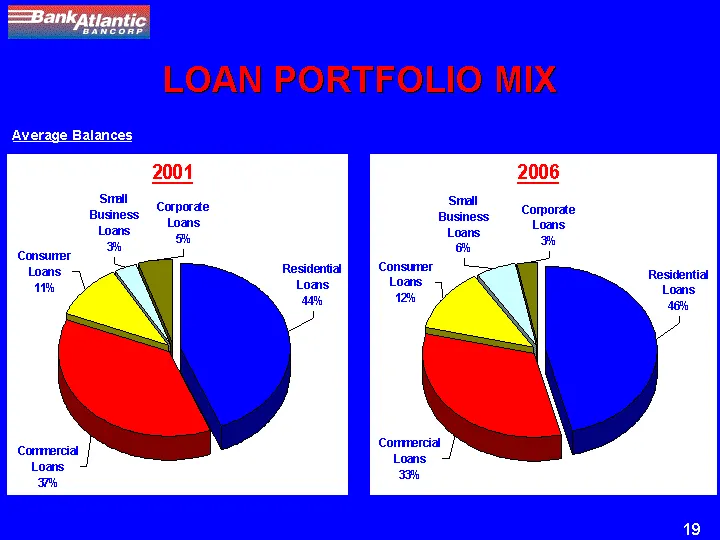
Slide 19: Loan portfolio mix
Residential Loans44% Commercial Loans37% Consumer Loans11% Small Business Loans3% Corporate Loans.5% East 1323144 1116835 315873 98231 153588 LOAN PORTFOLIO MIX Residential Loans46% Commercial Loans33% Consumer Loans12% Small Business Loans6% Corporate Loans3% East 2099664 1499388 558769 259816 1404
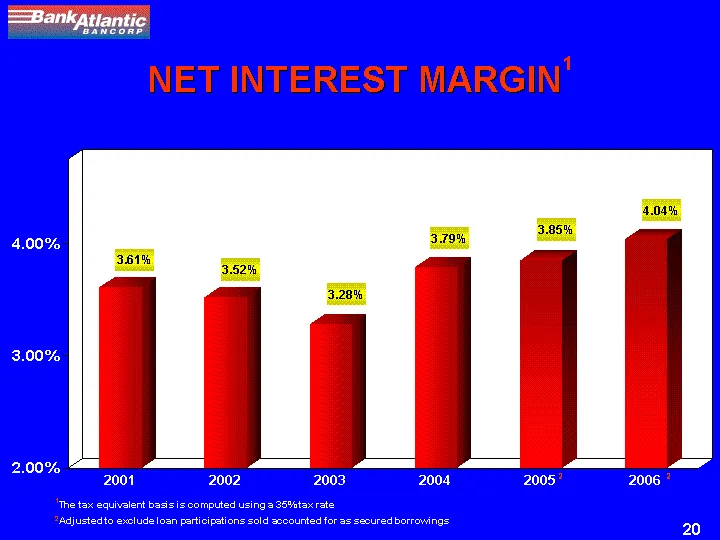
Slide 20: Net interest margin
2001 2002 2003 2004 2005 2006 NIM 0.0361 0.0352 0.0328 0.0379 0.0385 0.0404 NET INTEREST MARGIN1 1The tax equivalent basis is computed using a 35% tax rate 2Adjusted to exclude loan participations sold accounted for as secured borrowings 2 2
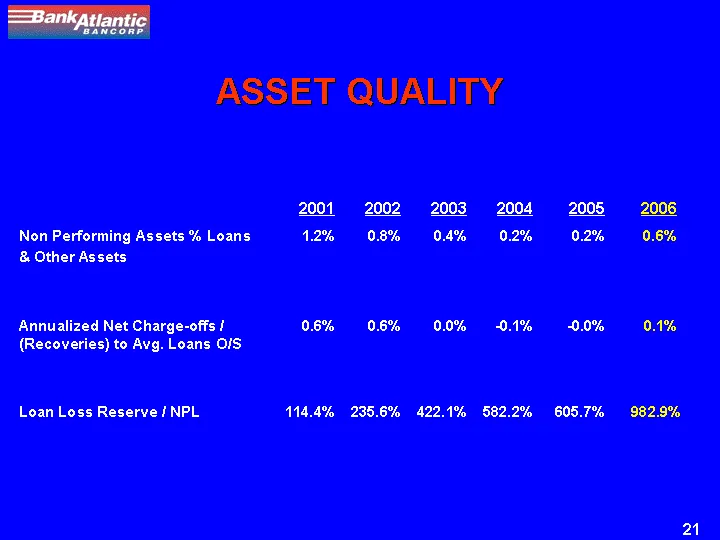
Slide 21: Asset quality
2001 2002 2003 2004 2005 2006 2006 Non Performing Assets % Loans & Other Assets 1.2% 0.8% 0.4% 0.2% 0.2% 0.6% 0.6% Annualized Net Charge-offs / (Recoveries) to Avg. Loans O/S 0.6% 0.6% 0.0% -0.1% -0.0% 0.1% 0.1% Loan Loss Reserve / NPL 114.4% 235.6% 422.1% 582.2% 605.7% 982.9% 982.9% ASSET QUALITY
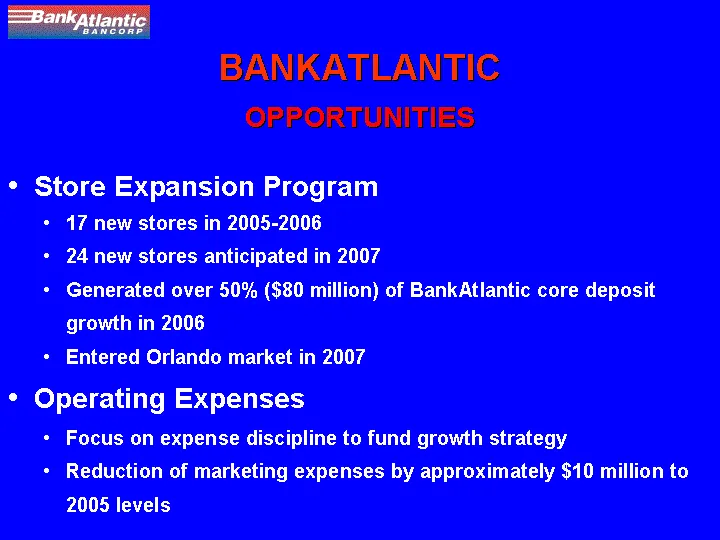
Slide 22: BankAtlantic opportunities
BANKATLANTIC OPPORTUNITIES Store Expansion Program 17 new stores in 2005-2006 24 new stores anticipated in 2007 Generated over 50% ($80 million) of BankAtlantic core deposit growth in 2006 Entered Orlando market in 2007 Operating Expenses Focus on expense discipline to fund growth strategy Reduction
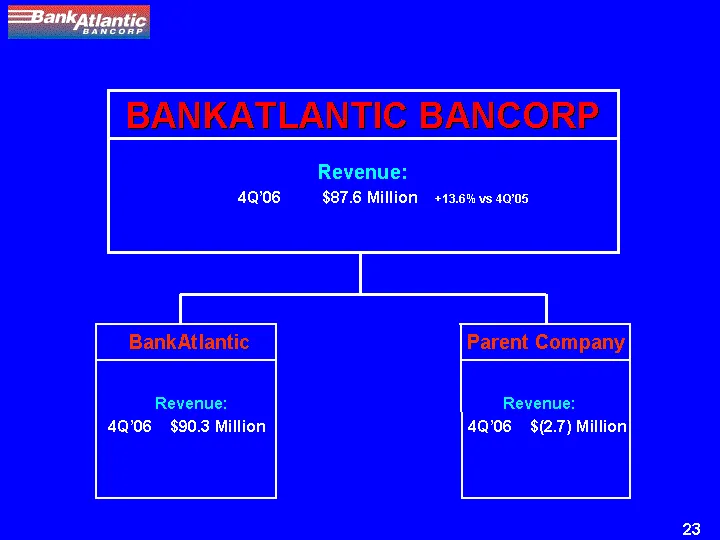
Slide 23: Revenue 4Q'06
Revenue: 4Q'06 $(2.7) Million Revenue: 4Q'06 $90.3 Million Parent Company BankAtlantic Revenue: 4Q'06 $87.6 Million +13.6% vs 4Q'05 BANKATLANTIC BANCORP
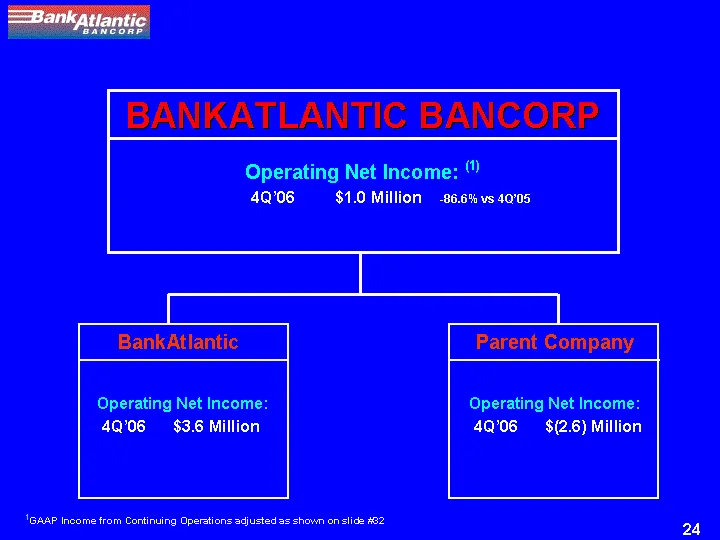
Slide 24: Operating net income 4Q'06
Operating Net Income: (1) 4Q'06 $1.0 Million -86.6% vs 4Q'05 BANKATLANTIC BANCORP Operating Net Income: 4Q'06 $3.6 Million BankAtlantic 1GAAP Income from Continuing Operations adjusted as shown on slide #32 Operating Net Income: 4Q'06 $(2.6) Million Parent Company
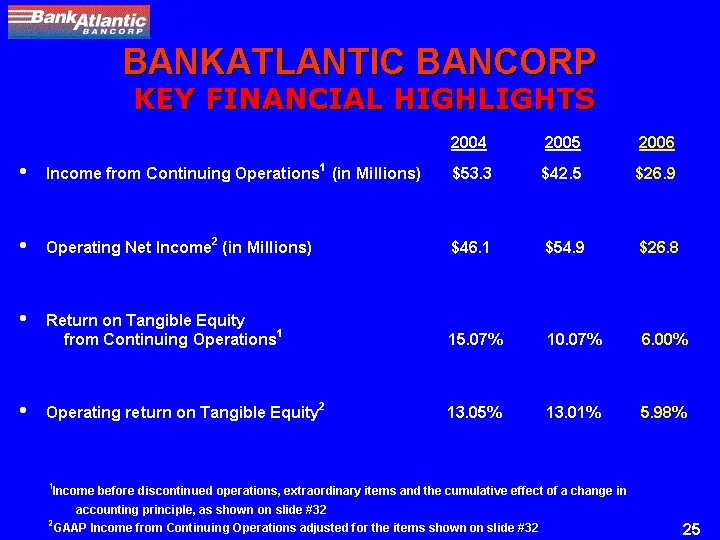
Slide 25: Key financial highlights 2004-2006
Income from Continuing Operations1 (in Millions) $53.3 $42.5 $26.9 Operating Net Income2 (in Millions) $46.1 $54.9 $26.8 Return on Tangible Equity from Continuing Operations1 15.07% 10.07% 6.00% Operating return on Tangible Equity2 13.05% 13.01% 5.98% 1Income before discontinued operations, extraord
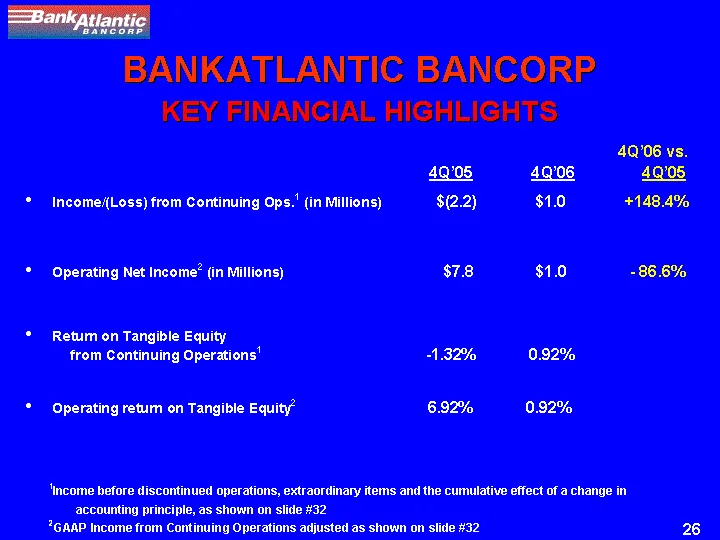
Slide 26: Key financial highlights 4Q'06 vs 4Q'05
Income/(Loss) from Continuing Ops.1 (in Millions) $(2.2) $1.0 +148.4% Operating Net Income2 (in Millions) $7.8 $1.0 - 86.6% Return on Tangible Equity from Continuing Operations1 -1.32% 0.92% Operating return on Tangible Equity2 6.92% 0.92% 1Income before discontinued operations, extraordinary items
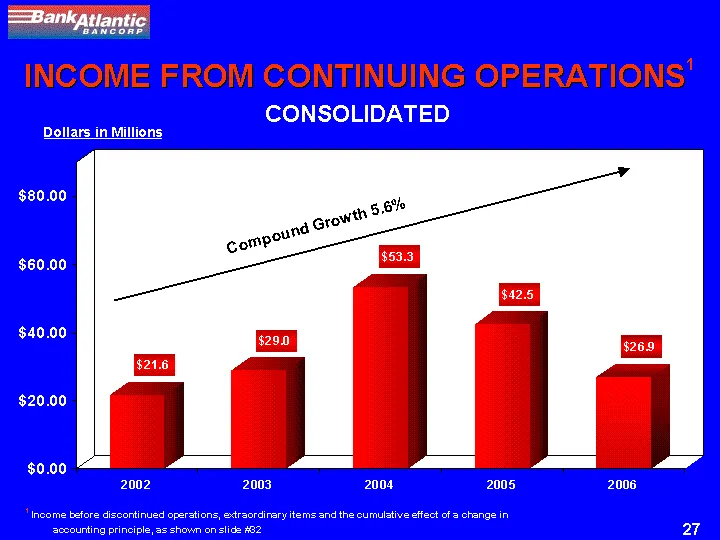
Slide 27: Income from continuing operations
INCOME FROM CONTINUING OPERATIONS1 2002 2003 2004 2005 2006 Income from Continuing Ops 21.598 28.952 53.285 42.526 26.879 CONSOLIDATED 1 Income before discontinued operations, extraordinary items and the cumulative effect of a change in accounting principle, as shown on slide #32 Compound Growth 5.6
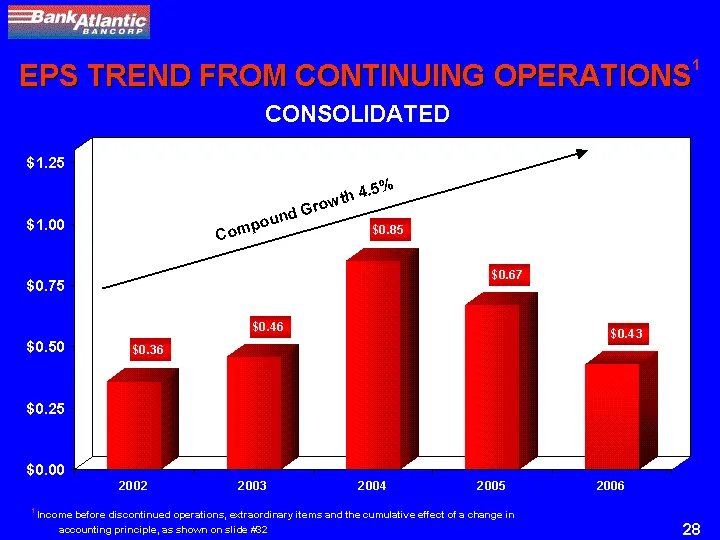
Slide 28: EPS trend from continuing operations
EPS TREND FROM CONTINUING OPERATIONS1 2002 2003 2004 2005 2006 EPS Trend from Continuing Operations 0.36 0.46 0.85 0.67 0.43 CONSOLIDATED Compound Growth 4.5% 1 Income before discontinued operations, extraordinary items and the cumulative effect of a change in accounting principle, as shown on slide
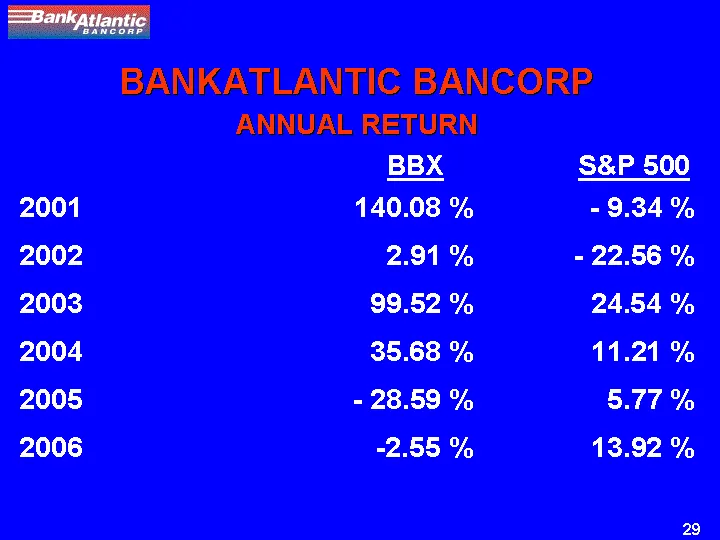
Slide 29: Annual return BBX vs S&P
ANNUAL RETURN BBX S&P 500 2001 140.08 % - 9.34 % 2002 2.91 % - 22.56 % 2003 99.52 % 24.54 % 2004 35.68 % 11.21 % 2005 - 28.59 % 5.77 % 2006 -2.55 % 13.92 % BANKATLANTIC BANCORP
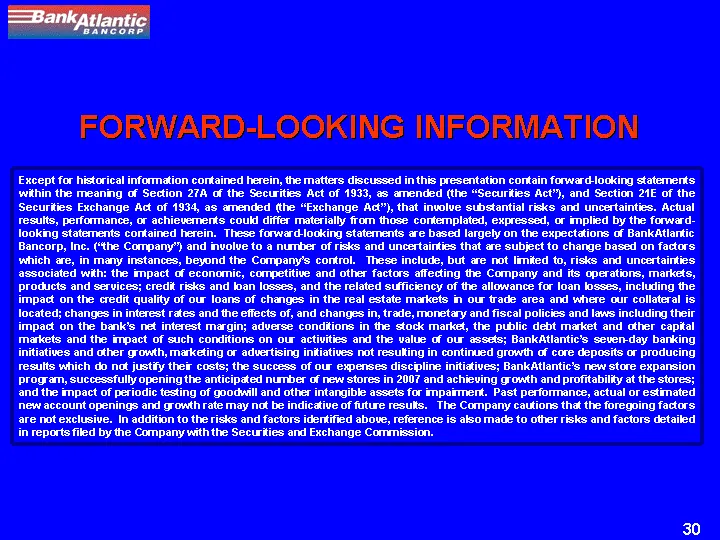
Slide 30: Forward-looking information
FORWARD-LOOKING INFORMATION Except for historical information contained herein, the matters discussed in this presentation contain forward-looking statements within the meaning of Section 27A of the Securities Act of 1933, as amended (the “Securities Act”), and Section 21E of the Securities Exchange
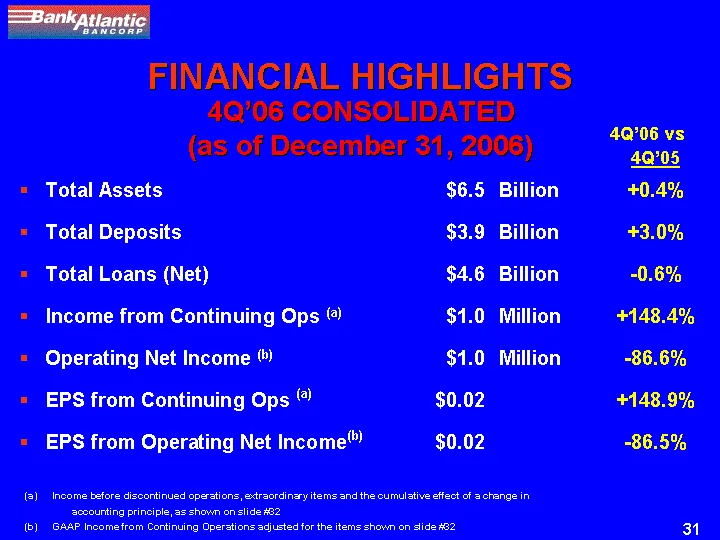
Slide 31: Financial highlights 4Q'06
Total Assets $6.5 Billion Billion +0.4% Total Deposits $3.9 Billion Billion +3.0% Total Loans (Net) $4.6 Billion Billion -0.6% Income from Continuing Ops (a) $1.0 Million Million +148.4% Operating Net Income (b) $1.0 Million Million -86.6% EPS from Continuing Ops (a) $0.02 +148.9% EPS from Operating
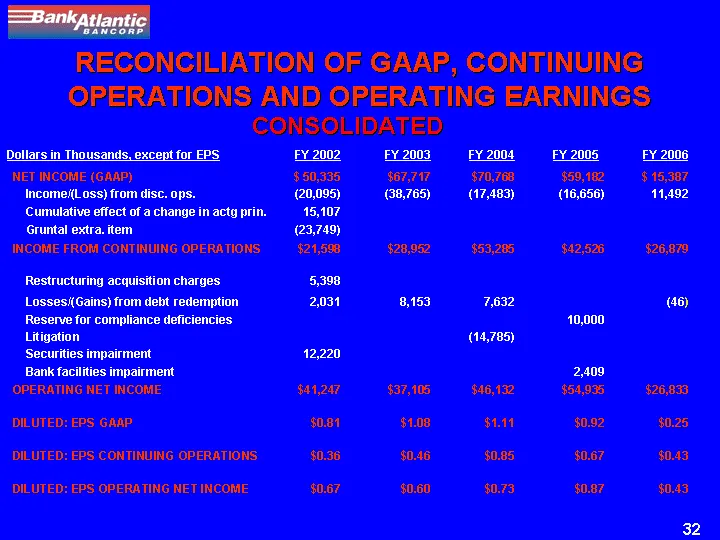
Slide 32: Consolidated reconciliation of GAAP, continuing operations and operating earnings
CONSOLIDATED RECONCILIATION OF GAAP, CONTINUING OPERATIONS AND OPERATING EARNINGS NET INCOME (GAAP) $ 50,335 $67,717 $70,768 $59,182 $ 15,387 Income/(Loss) from disc. ops. (20,095) (38,765) (17,483) (16,656) 11,492 Cumulative effect of a change in actg prin. 15,107 Gruntal extra. item (23,749) INCOM
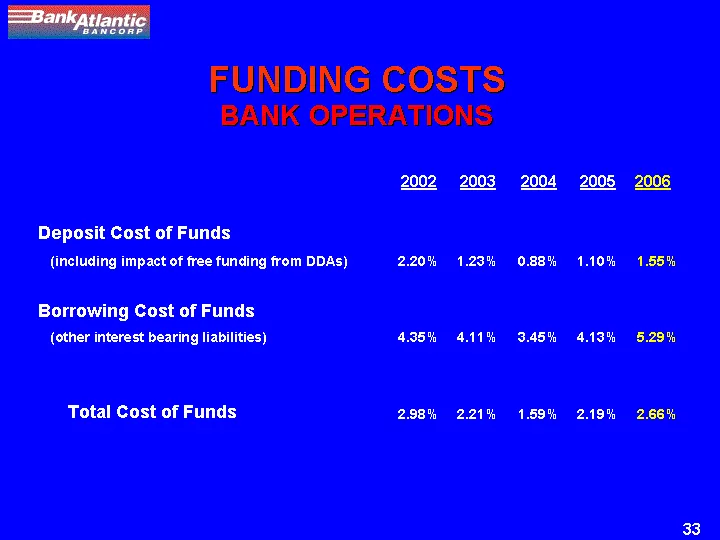
Slide 33: Bank operations funding costs
BANK OPERATIONS 2002 2003 2004 2005 2006 Deposit Cost of Funds (including impact of free funding from DDAs) 2.20% 1.23% 0.88% 1.10% 1.55% Borrowing Cost of Funds (other interest bearing liabilities) 4.35% 4.11% 3.45% 4.13% 5.29% Total Cost of Funds 2.98% 2.21% 1.59% 2.19% 2.66% FUNDING COSTS
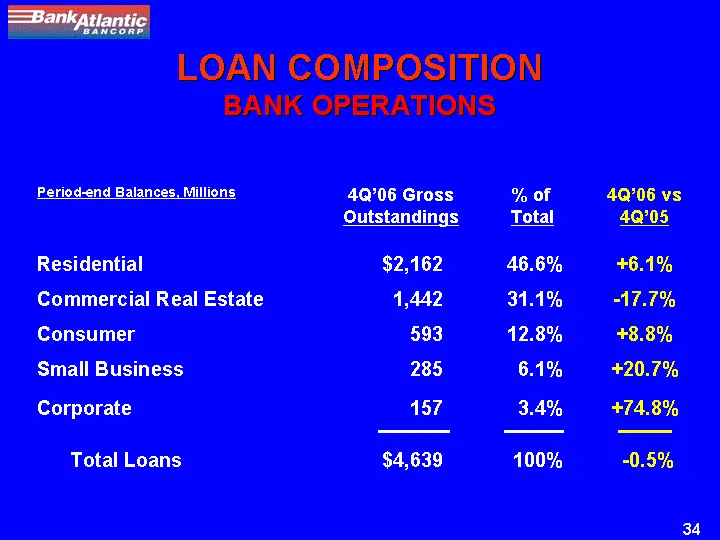
Slide 34: Loan composition
Residential $2,162 46.6% +6.1% Commercial Real Estate 1,442 31.1% -17.7% Consumer 593 12.8% +8.8% Small Business 285 6.1% +20.7% Corporate 157 3.4% +74.8% Total Loans $4,639 100% -0.5% 4Q'06 Gross Outstandings % of Total 4Q'06 vs 4Q'05 Period-end Balances, Millions LOAN COMPOSITION BANK OPERATIONS
Source: SEC EDGAR · 8-K filed Feb 7, 2007
More decks from BBX Capital Inc
 Merger or Acquisition (November 2016)60 slides · Nov 21, 2016
 Merger or Acquisition (October 2016)61 slides · Oct 11, 2016
 Merger or Acquisition (July 2016)11 slides · Jul 28, 2016
 Investor Presentation (November 2014)77 slides · Nov 26, 2014
 Merger or Acquisition (November 2014)77 slides · Nov 26, 2014
 Merger or Acquisition (September 2014)74 slides · Sep 19, 2014