Lagardere SA · EURONEXT:MMB
Lagardere SA — Debt Investor Presentation (September 2021)
47 slides from Lagardere SA's debt investor presentation, September 2021

Slide 1: Credit Investor Presentation
CREDIT INVESTOR PRESENTATION September 2021
Slide 2: Disclaimer
DISCLAIMER By reading this presentation, you agree to be bound by the following limitations and qualifications: This presentation is for information purposes only and does not constitute an offer or solicitation for the sale or purchase of any securities, any part of the business or assets described
Slide 3: Today's Speakers
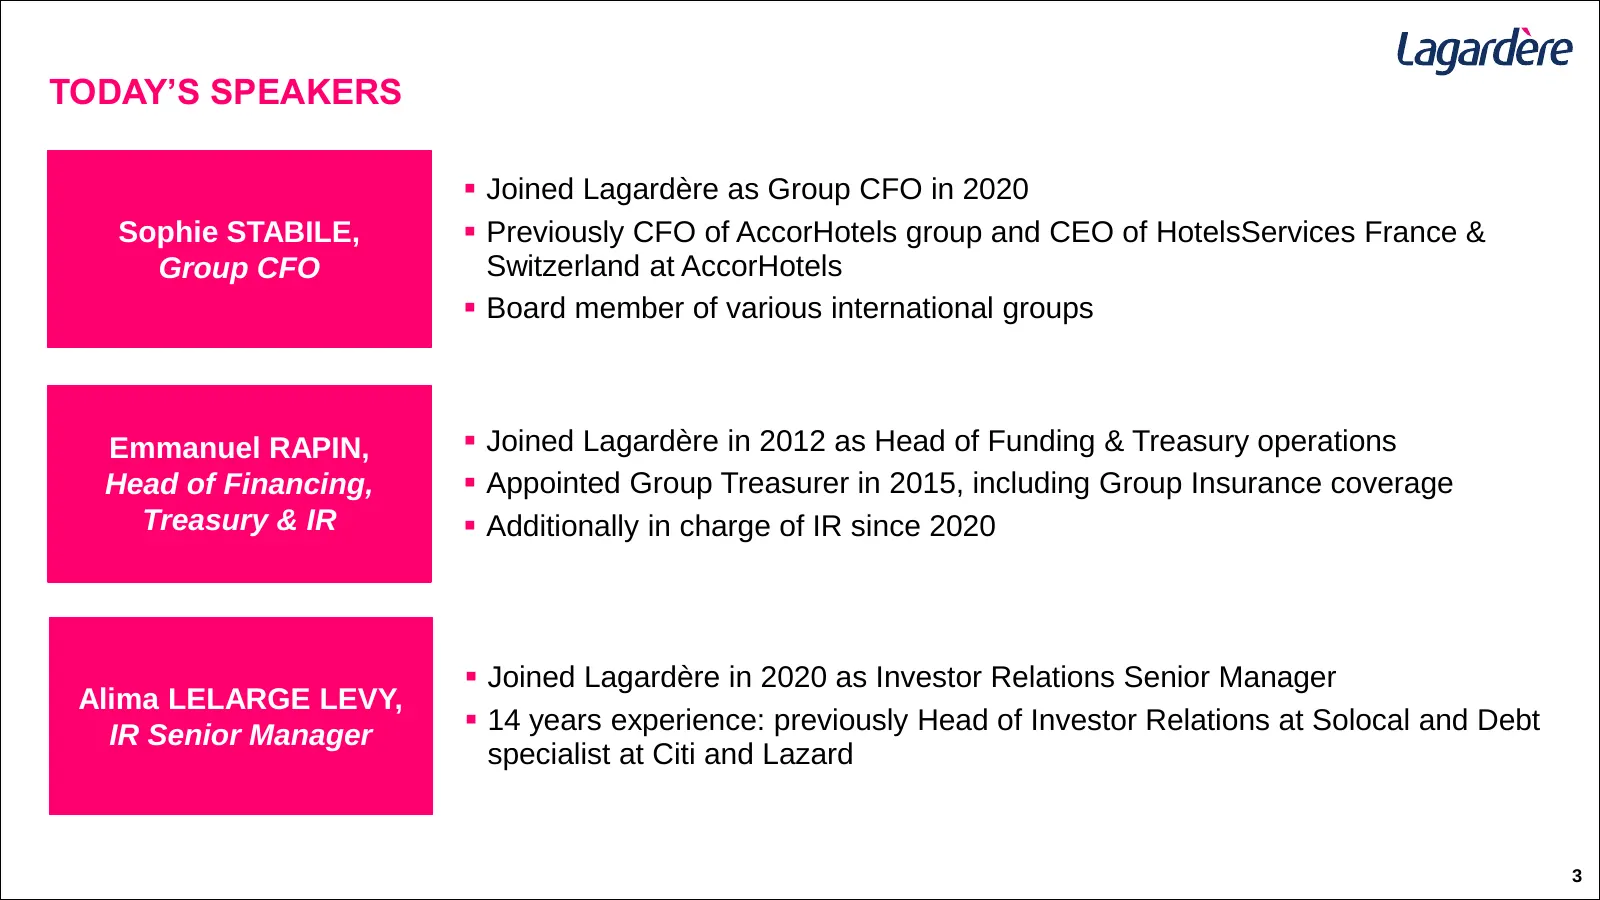
TODAY’S SPEAKERS ▪ Joined Lagardère as Group CFO in 2020 Sophie STABILE, ▪ Previously CFO of AccorHotels group and CEO of HotelsServices France & Group CFO Switzerland at AccorHotels ▪ Board member of various international groups Emmanuel RAPIN, ▪ Joined Lagardère in 2012 as Head of Funding & Treasu
Slide 4: Table of Content
TABLE OF CONTENT 1. Group Overview 5 2. H1 2021 Highlights 14 A. H1 2021 Performance by division 16 B. H1 2021 Group Results & Financing profile 24 3. Outlook 30 4. Transaction Overview 32 5. Appendix 35

Slide 5: Group Overview
1. GROUP OVERVIEW
Slide 6: Lagardère Group: Complementary Activities with Focus on Two Strategic Pillars
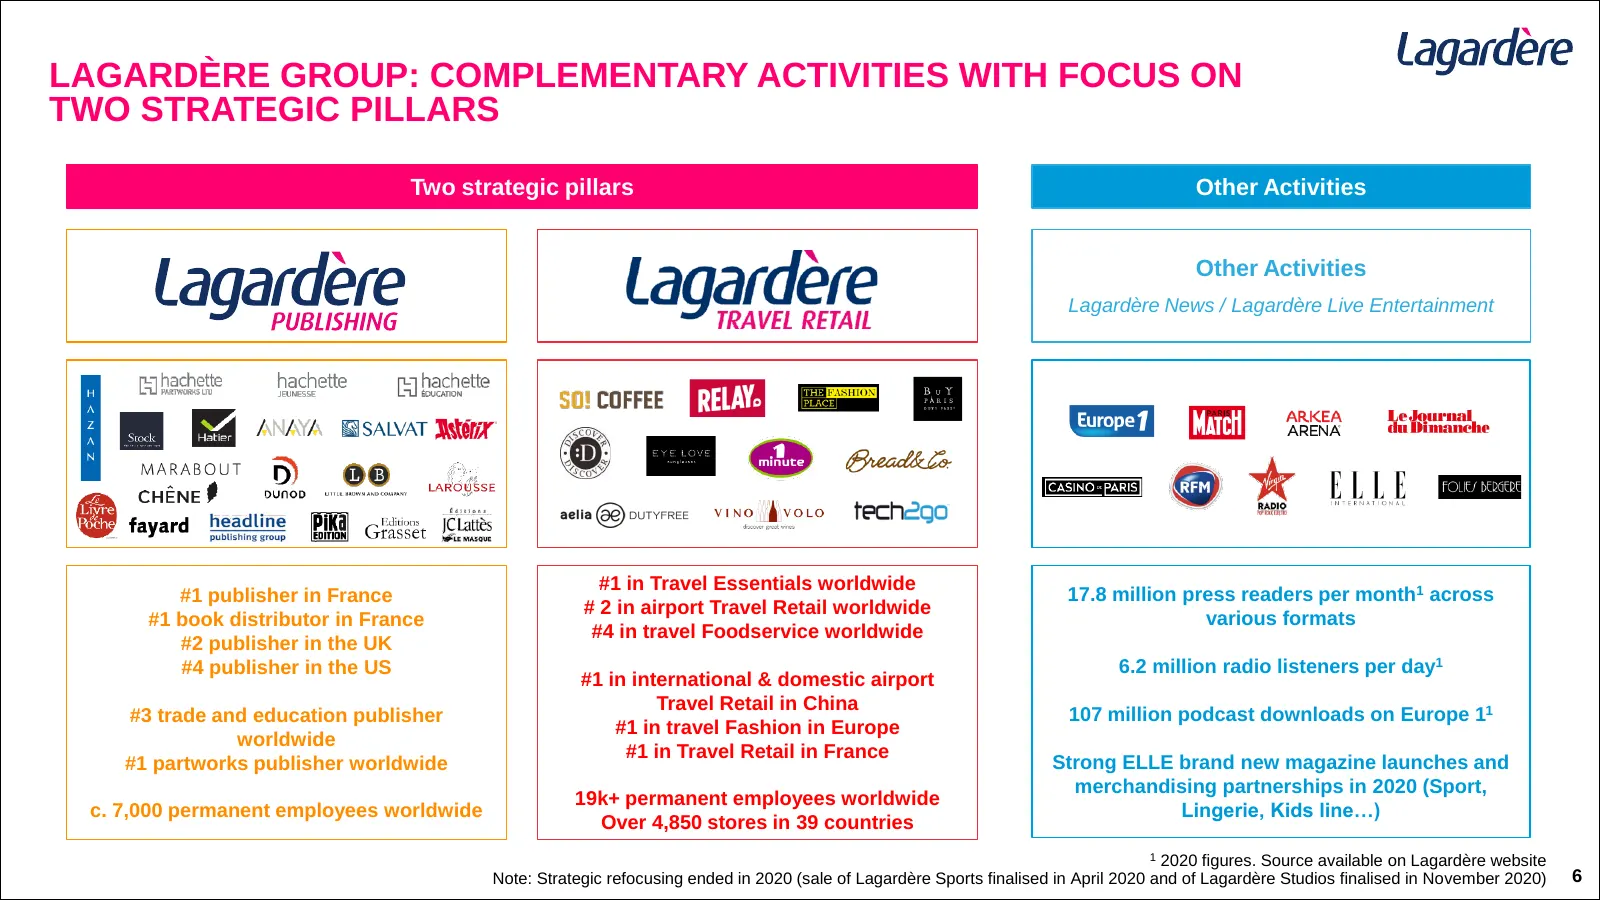
LAGARDÈRE GROUP: COMPLEMENTARY ACTIVITIES WITH FOCUS ON TWO STRATEGIC PILLARS Two strategic pillars Other Activities Other Activities Lagardère News / Lagardère Live Entertainment #1 in Travel Essentials worldwide #1 publisher in France 17.8 million press readers per month1 across # 2 in airport Tra
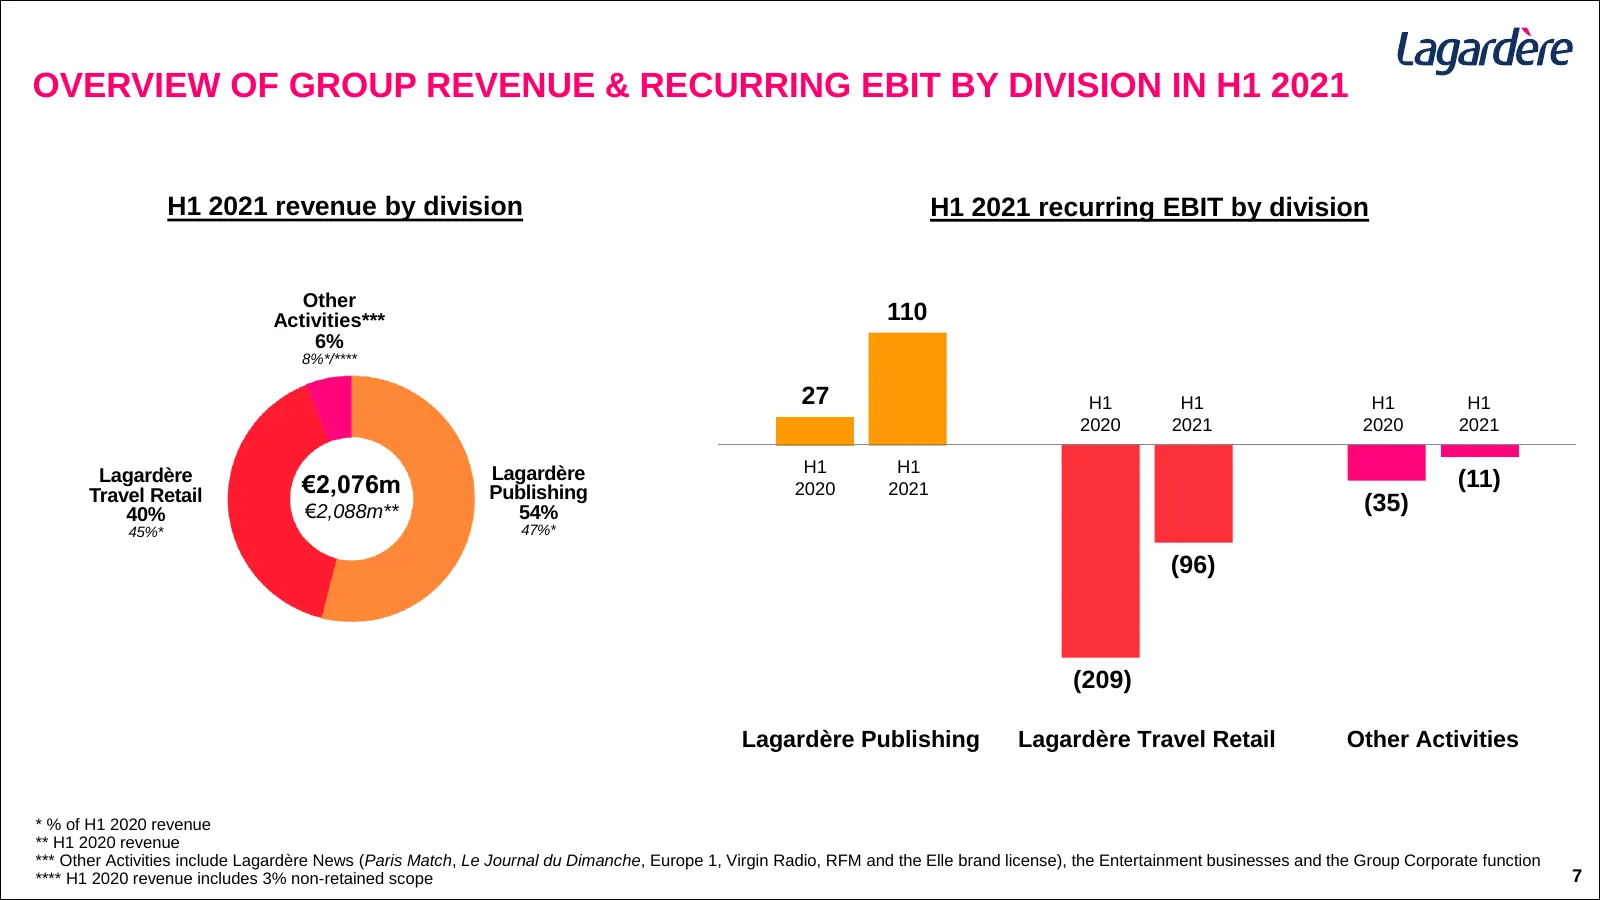
Slide 7: Overview of Group Revenue & Recurring EBIT by Division in H1 2021
OVERVIEW OF GROUP REVENUE & RECURRING EBIT BY DIVISION IN H1 2021 H1 2021 revenue by division H1 2021 recurring EBIT by division Other Activities*** 110 6% 8%*/**** 27 H1 H1 H1 H1 2020 2021 2020 2021 Lagardère Lagardère H1 H1 €2,076m 2020 2021 (11) Travel Retail Publishing 40% €2,088m** 54% (35) 45%
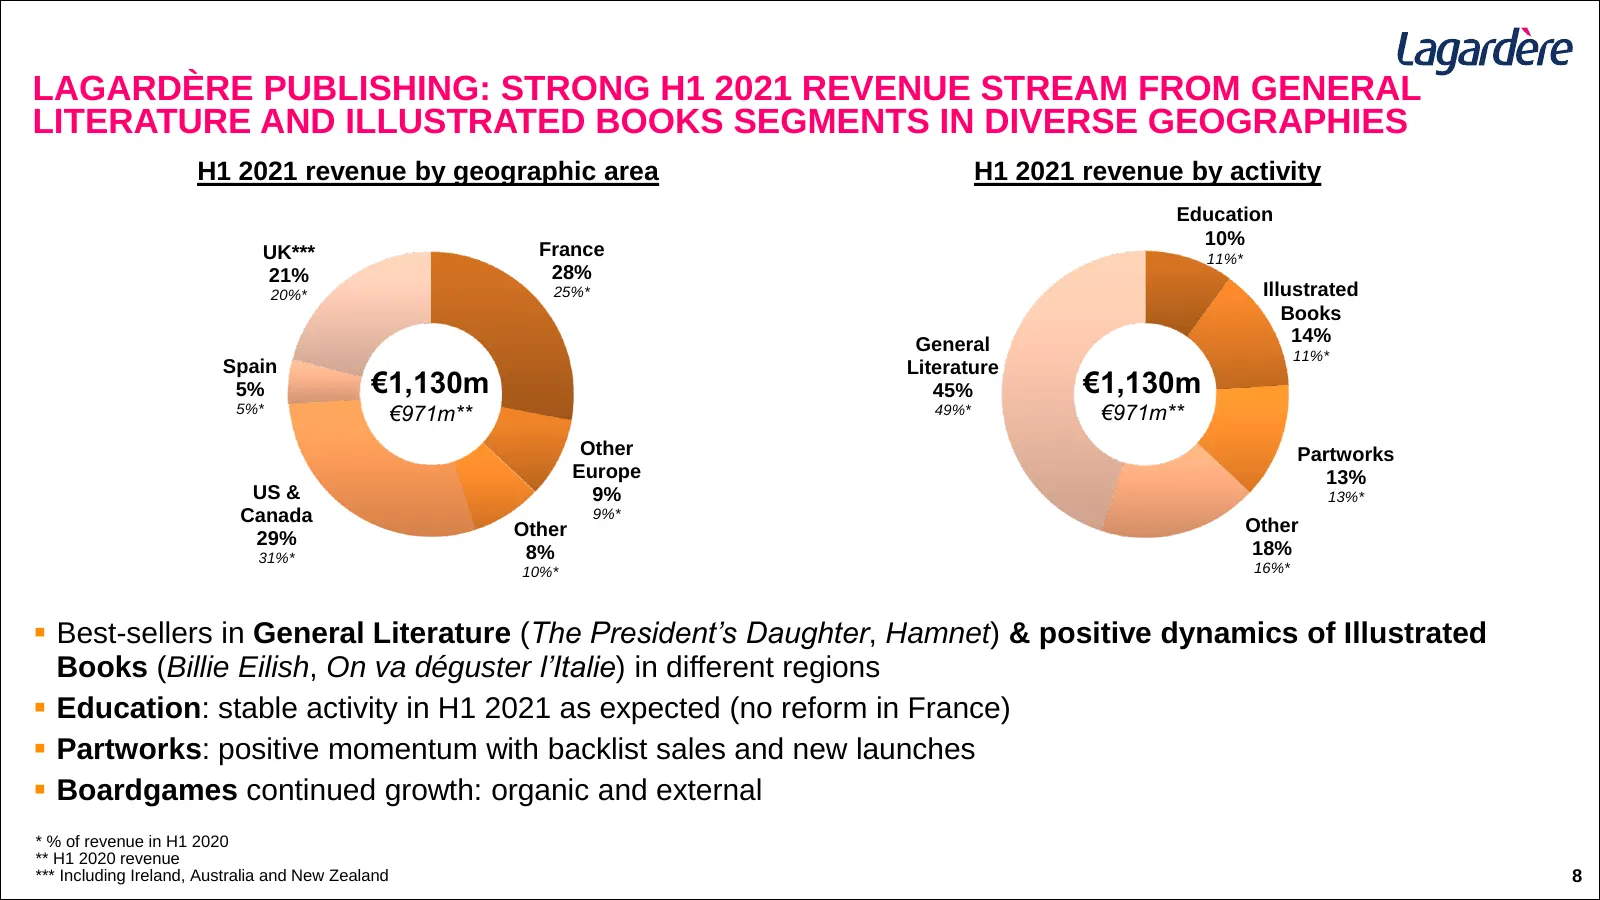
Slide 8: Lagardère Publishing: Strong H1 2021 Revenue from General Literature and Illustrated Books
LAGARDÈRE PUBLISHING: STRONG H1 2021 REVENUE STREAM FROM GENERAL LITERATURE AND ILLUSTRATED BOOKS SEGMENTS IN DIVERSE GEOGRAPHIES H1 2021 revenue by geographic area H1 2021 revenue by activity Education 10% UK*** France 11%* 21% 28% 20%* 25%* Illustrated Books General 14% 11%* Spain Literature 5% €1
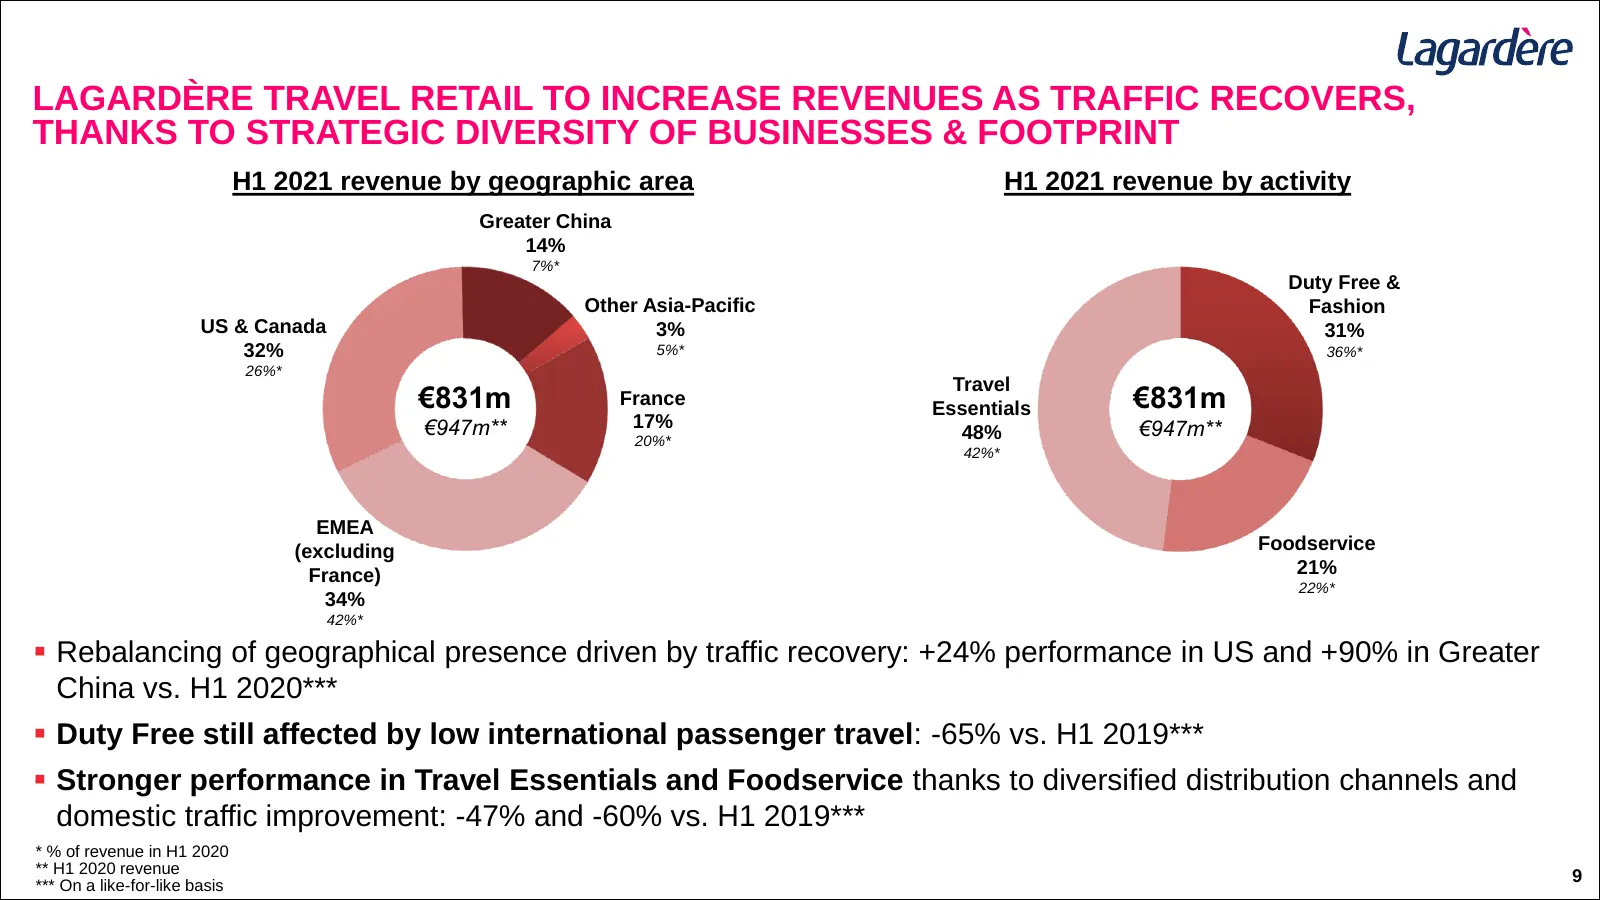
Slide 9: Lagardère Travel Retail to Increase Revenues as Traffic Recovers
LAGARDÈRE TRAVEL RETAIL TO INCREASE REVENUES AS TRAFFIC RECOVERS, THANKS TO STRATEGIC DIVERSITY OF BUSINESSES & FOOTPRINT H1 2021 revenue by geographic area H1 2021 revenue by activity Greater China 14% 7%* Duty Free & Other Asia-Pacific Fashion US & Canada 3% 31% 32% 5%* 36%* 26%* Travel €831m Fran
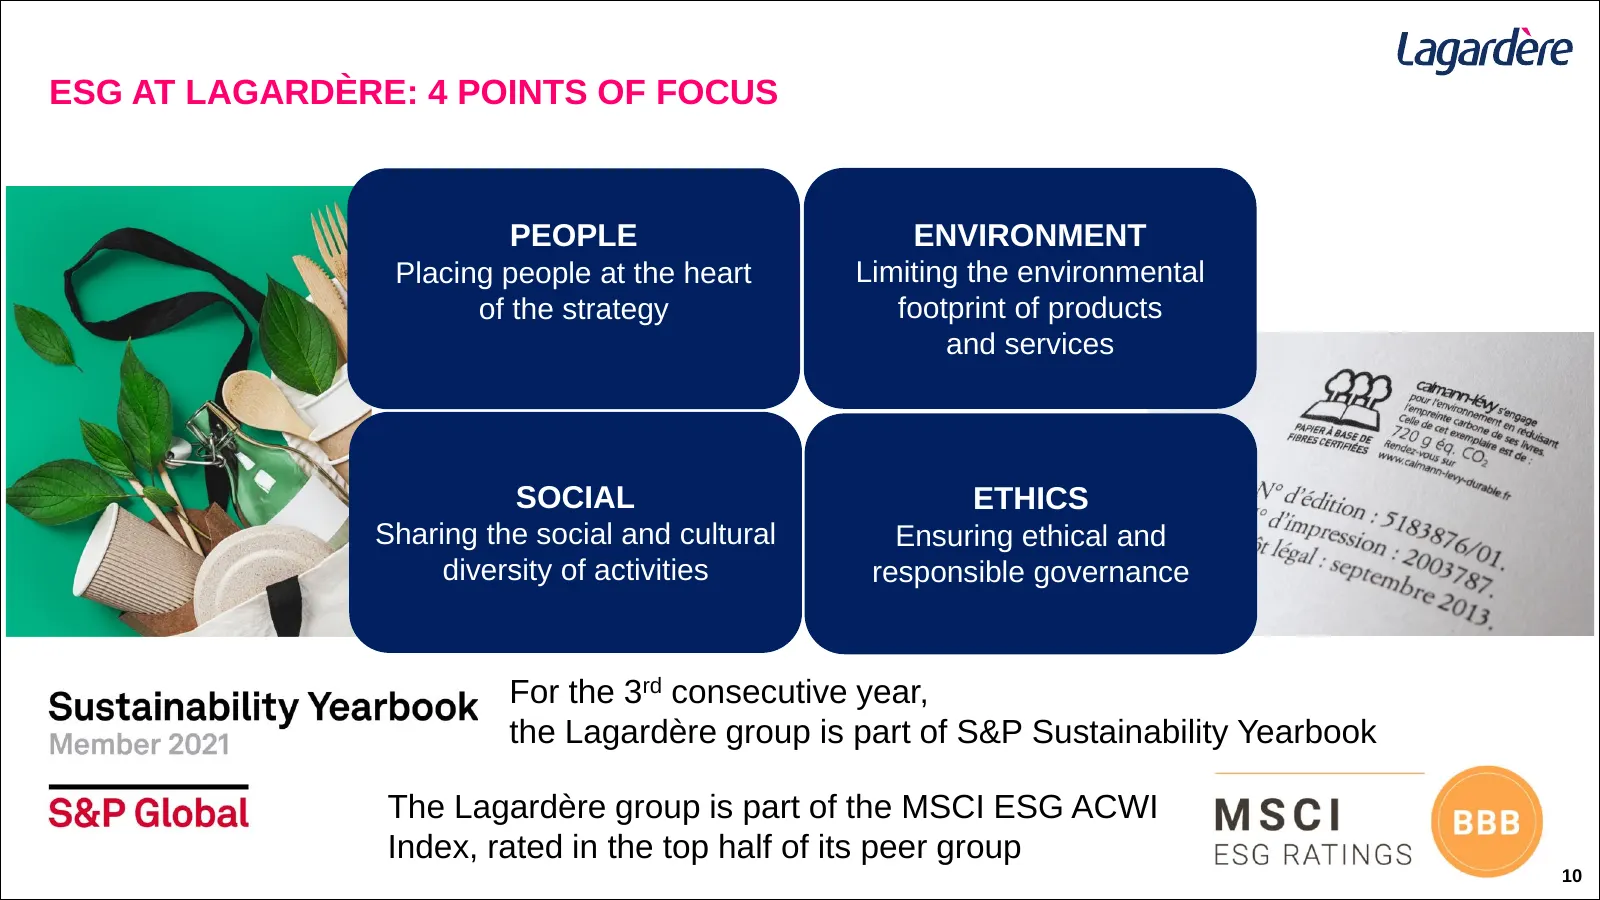
Slide 10: ESG at Lagardère: Points of Focus
ESG AT LAGARDÈRE: 4 POINTS OF FOCUS PEOPLE ENVIRONMENT Placing people at the heart Limiting the environmental of the strategy footprint of products and services SOCIAL ETHICS Sharing the social and cultural Ensuring ethical and diversity of activities responsible governance For the 3rd consecutive y
Slide 11: Lagardère Governance: Aligned with Market Standards
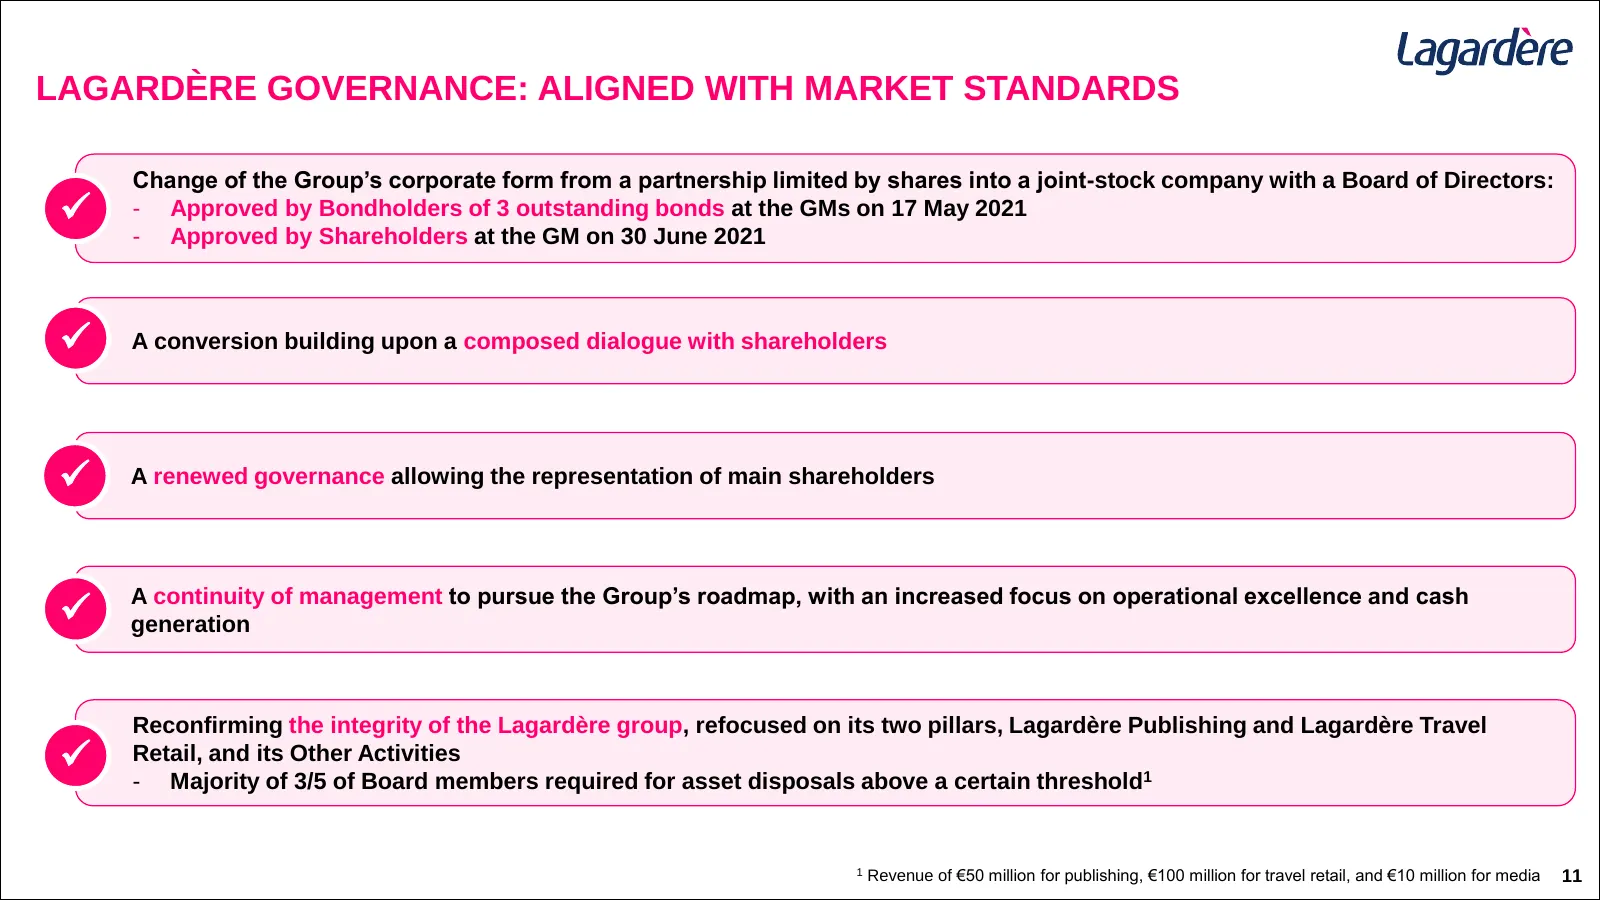
LAGARDÈRE GOVERNANCE: ALIGNED WITH MARKET STANDARDS Change of the Group’s corporate form from a partnership limited by shares into a joint-stock company with a Board of Directors: ✓ - Approved by Bondholders of 3 outstanding bonds at the GMs on 17 May 2021 - Approved by Shareholders at the GM on 30
Slide 12: A Balanced Shareholder Structure Represented on the Board of Directors
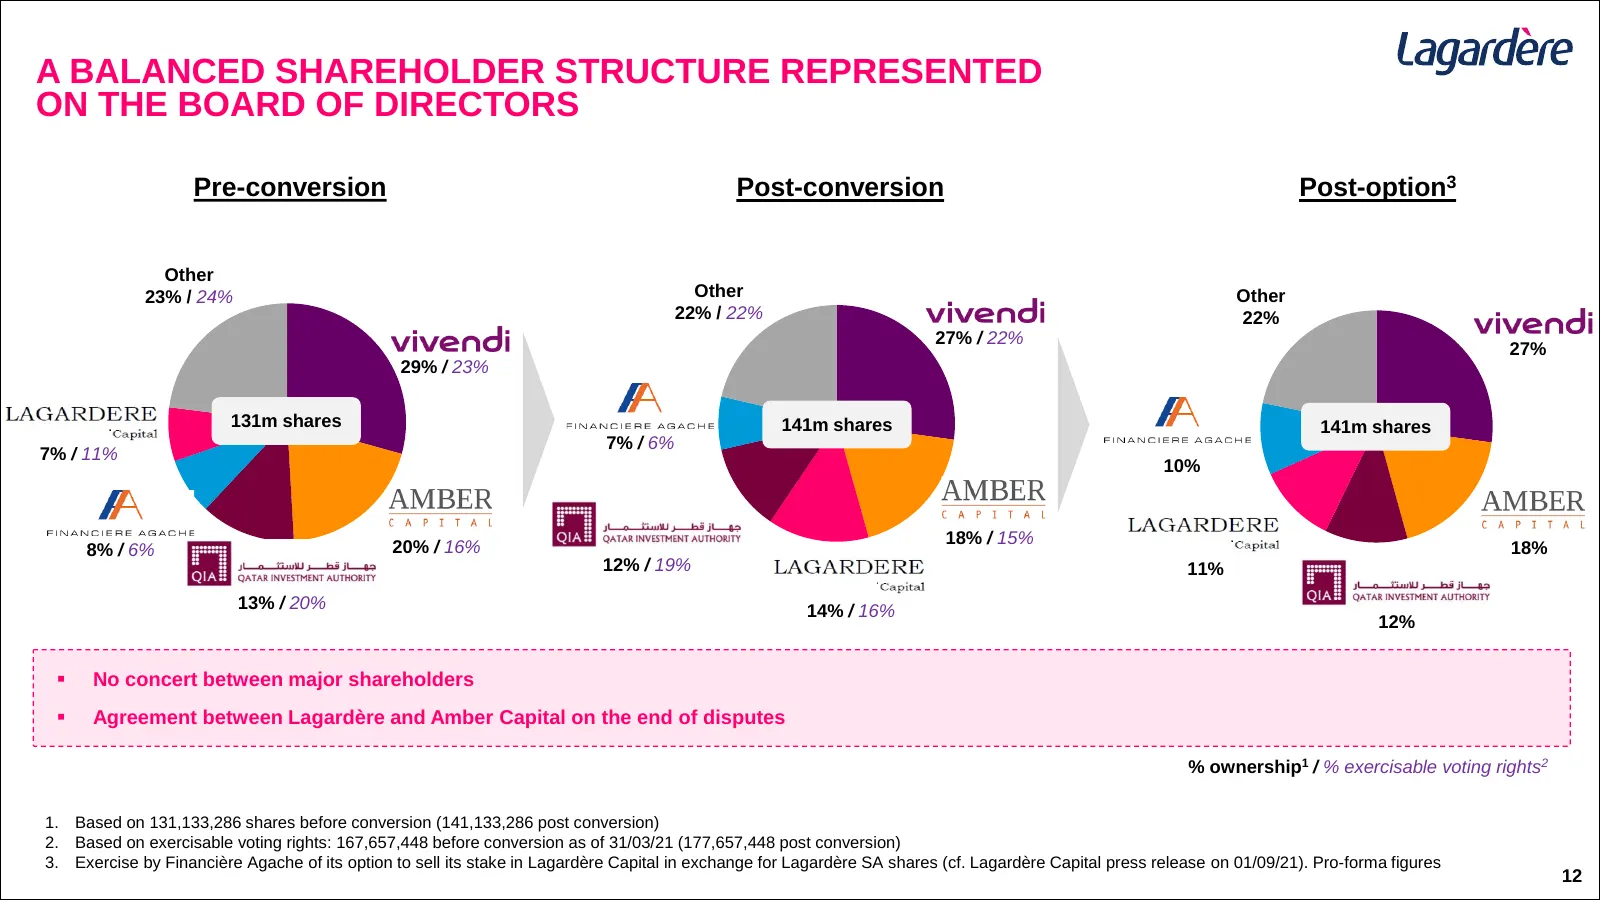
A BALANCED SHAREHOLDER STRUCTURE REPRESENTED ON THE BOARD OF DIRECTORS Pre-conversion Post-conversion Post-option3 Chart Title Chart Title Other 23% / 24% Other Other 22% / 22% 22% 27% / 22% 27% 29% / 23% 131m shares 141m shares 141m shares 7% / 6% 7% / 11% 10% 20% / 16% 18% / 15% 8% / 6% 18% 12% /
Slide 13: Overview of Recent Press Release
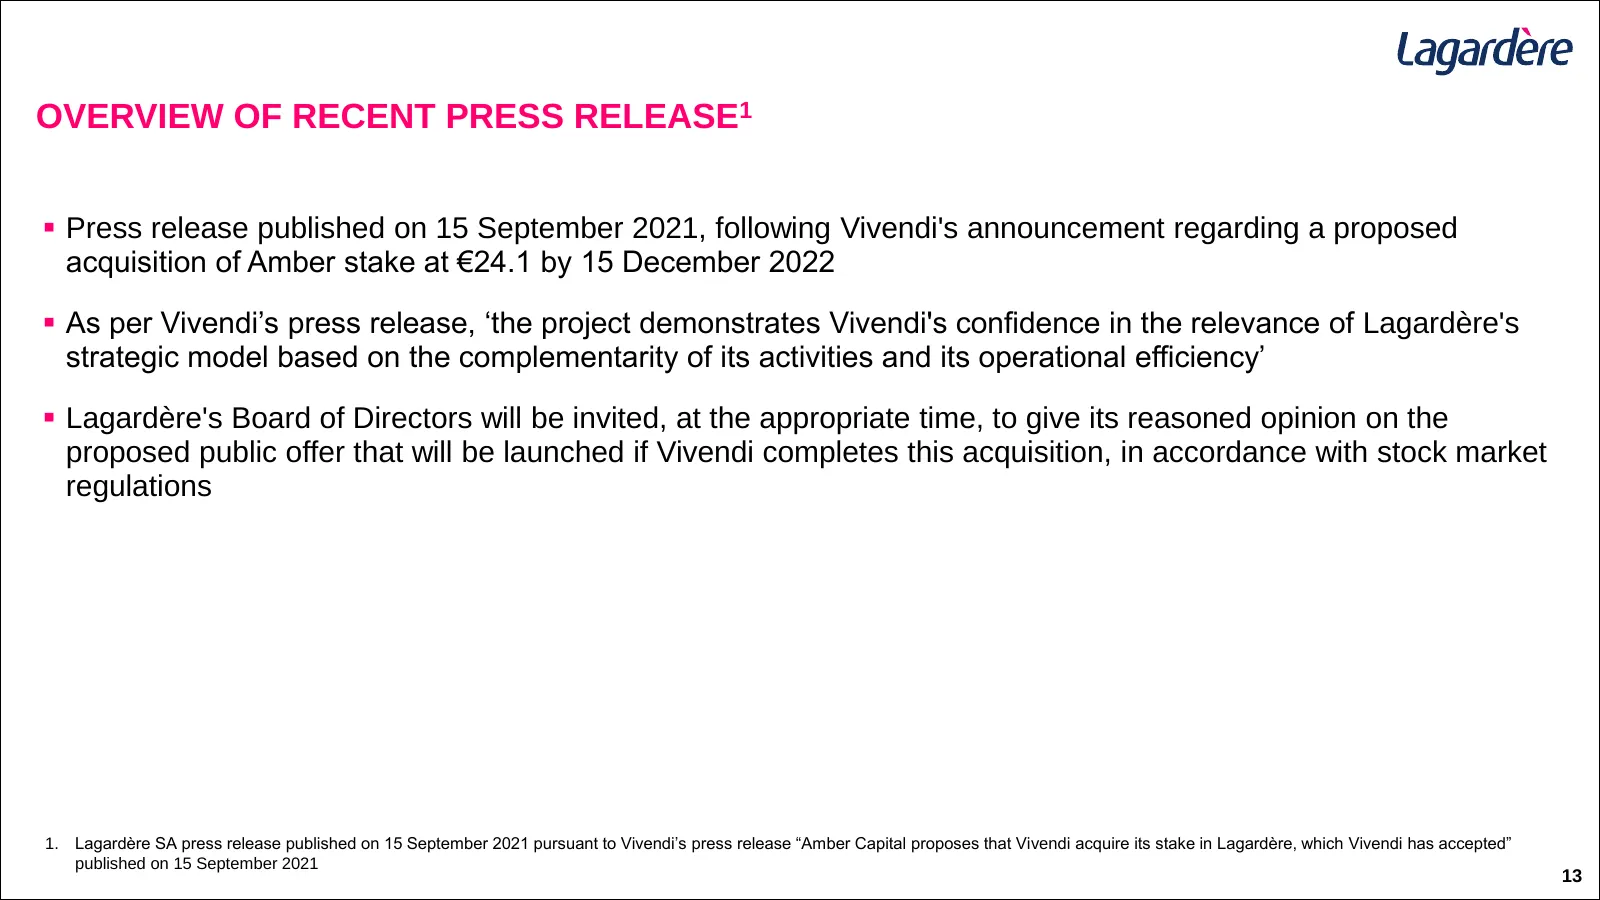
OVERVIEW OF RECENT PRESS RELEASE1 ▪ Press release published on 15 September 2021, following Vivendi's announcement regarding a proposed acquisition of Amber stake at €24.1 by 15 December 2022 ▪ As per Vivendi’s press release, ‘the project demonstrates Vivendi's confidence in the relevance of Lagardè
Slide 14: H1 2021 Highlights
2. H1 2021 HIGHLIGHTS
Slide 15: H1 2021 Group Performance Improved vs. H1 2020
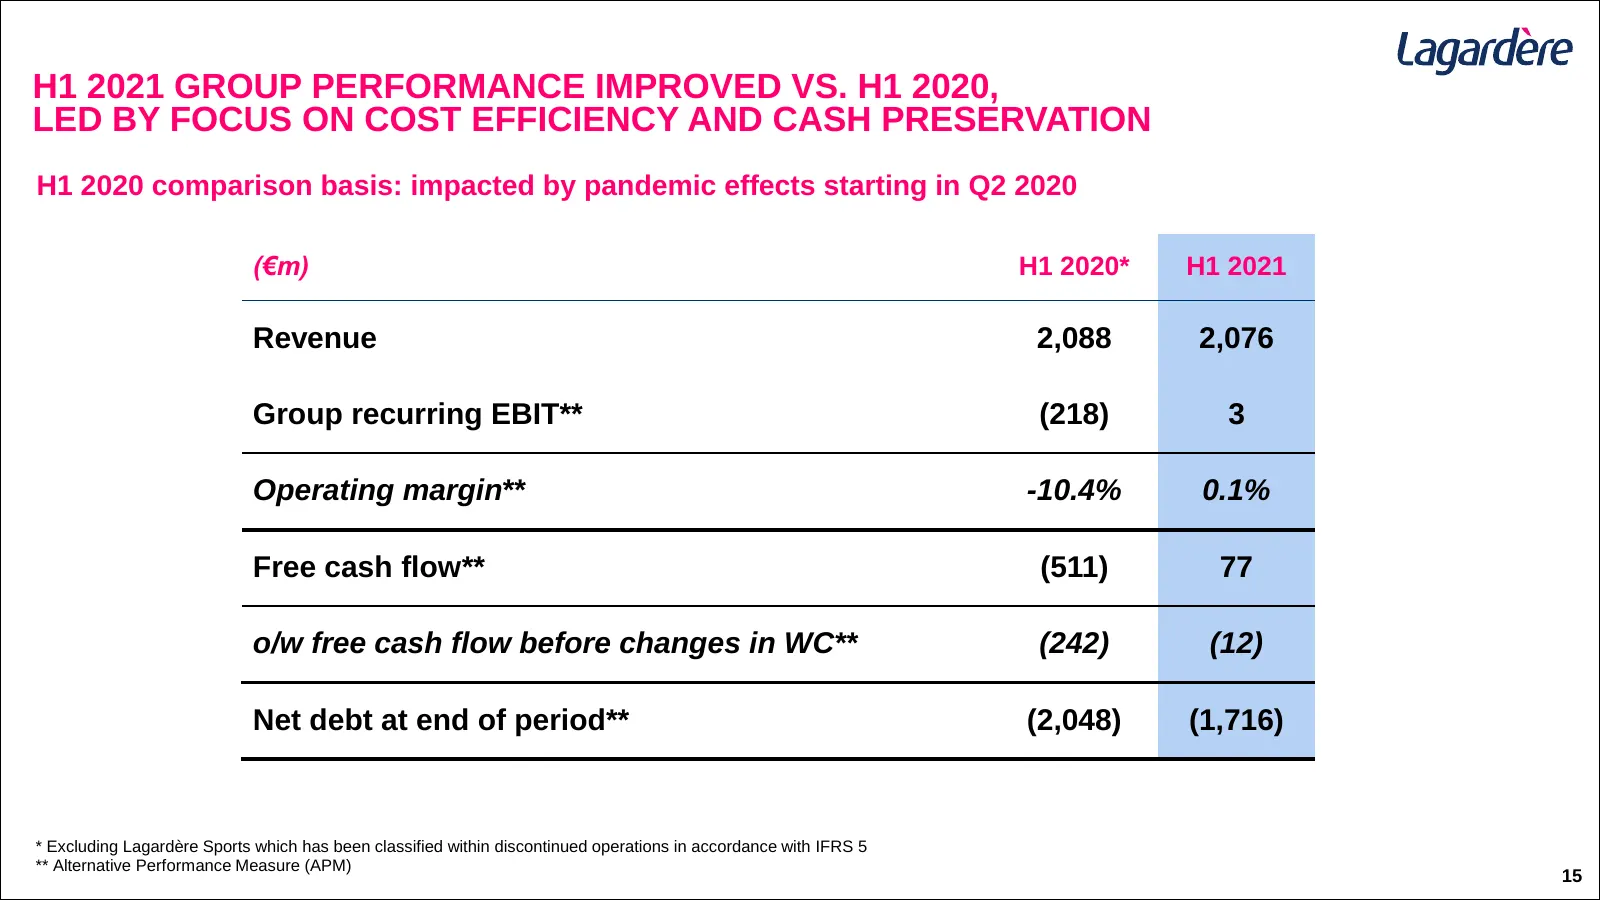
H1 2021 GROUP PERFORMANCE IMPROVED VS. H1 2020, LED BY FOCUS ON COST EFFICIENCY AND CASH PRESERVATION H1 2020 comparison basis: impacted by pandemic effects starting in Q2 2020 (€m) H1 2020* H1 2021 Revenue 2,088 2,076 Group recurring EBIT** (218) 3 Operating margin** -10.4% 0.1% Free cash flow** (5
Slide 16: H1 2021 Performance by Division
H1 2021 PERFORMANCE BY DIVISION
Slide 17: Lagardère Publishing H1 2021: Strong Book Sales Growth & Record Profitability
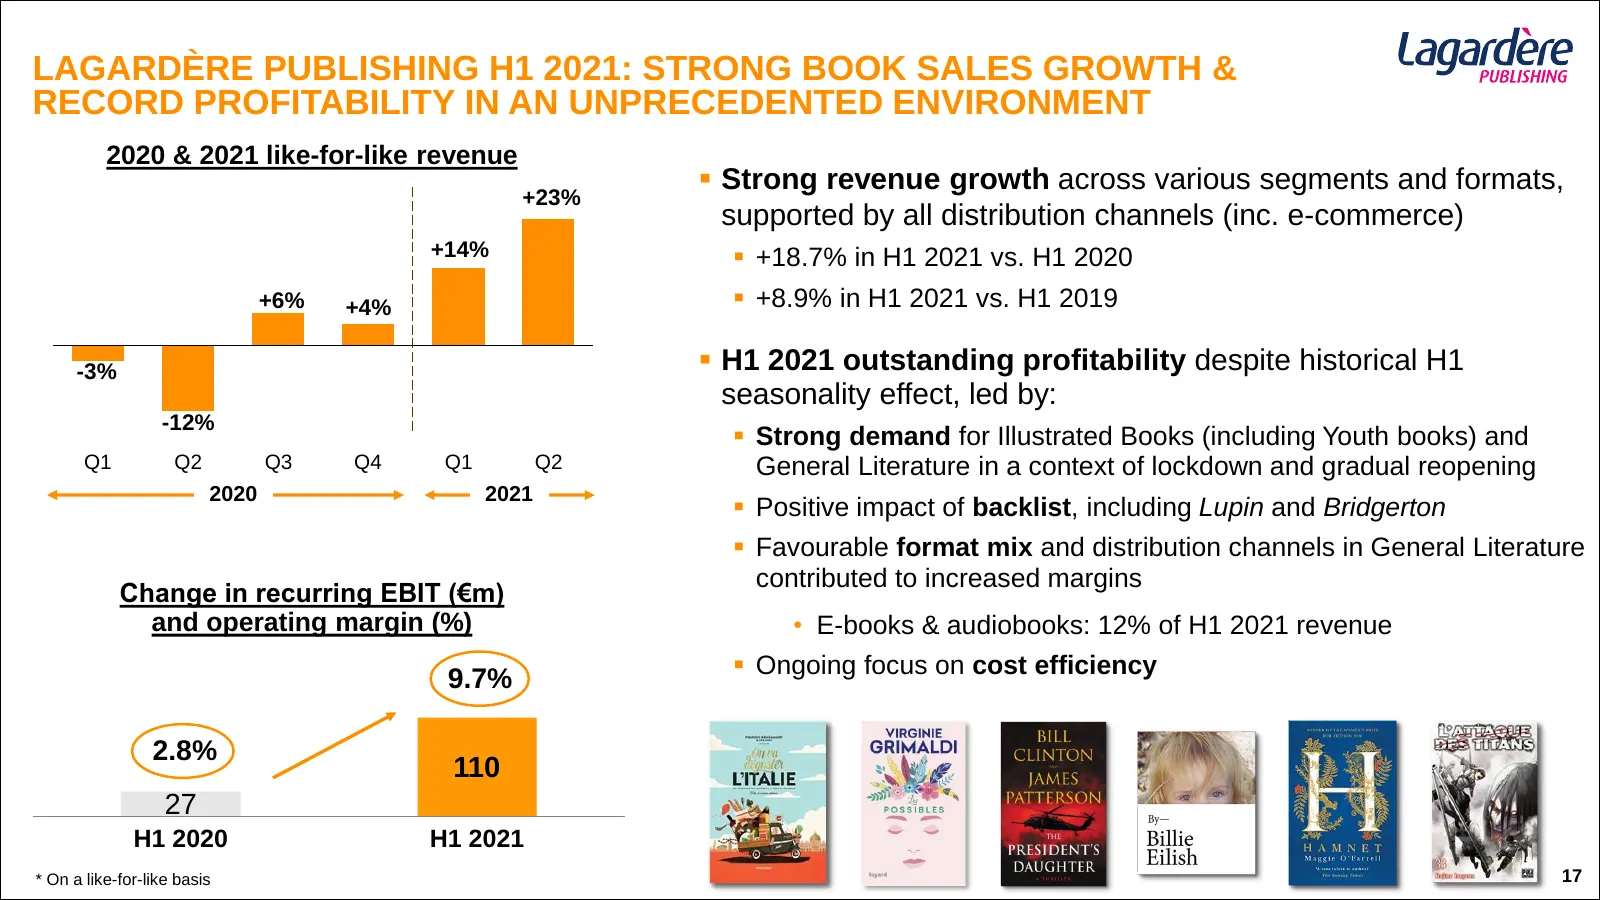
LAGARDÈRE PUBLISHING H1 2021: STRONG BOOK SALES GROWTH & RECORD PROFITABILITY IN AN UNPRECEDENTED ENVIRONMENT 2020 & 2021 like-for-like revenue ▪ Strong revenue growth across various segments and formats, +23% supported by all distribution channels (inc. e-commerce) +14% ▪ +18.7% in H1 2021 vs. H1 2
Slide 18: Lagardère Publishing H1 2021: Exceptional Positive Free Cash Flow
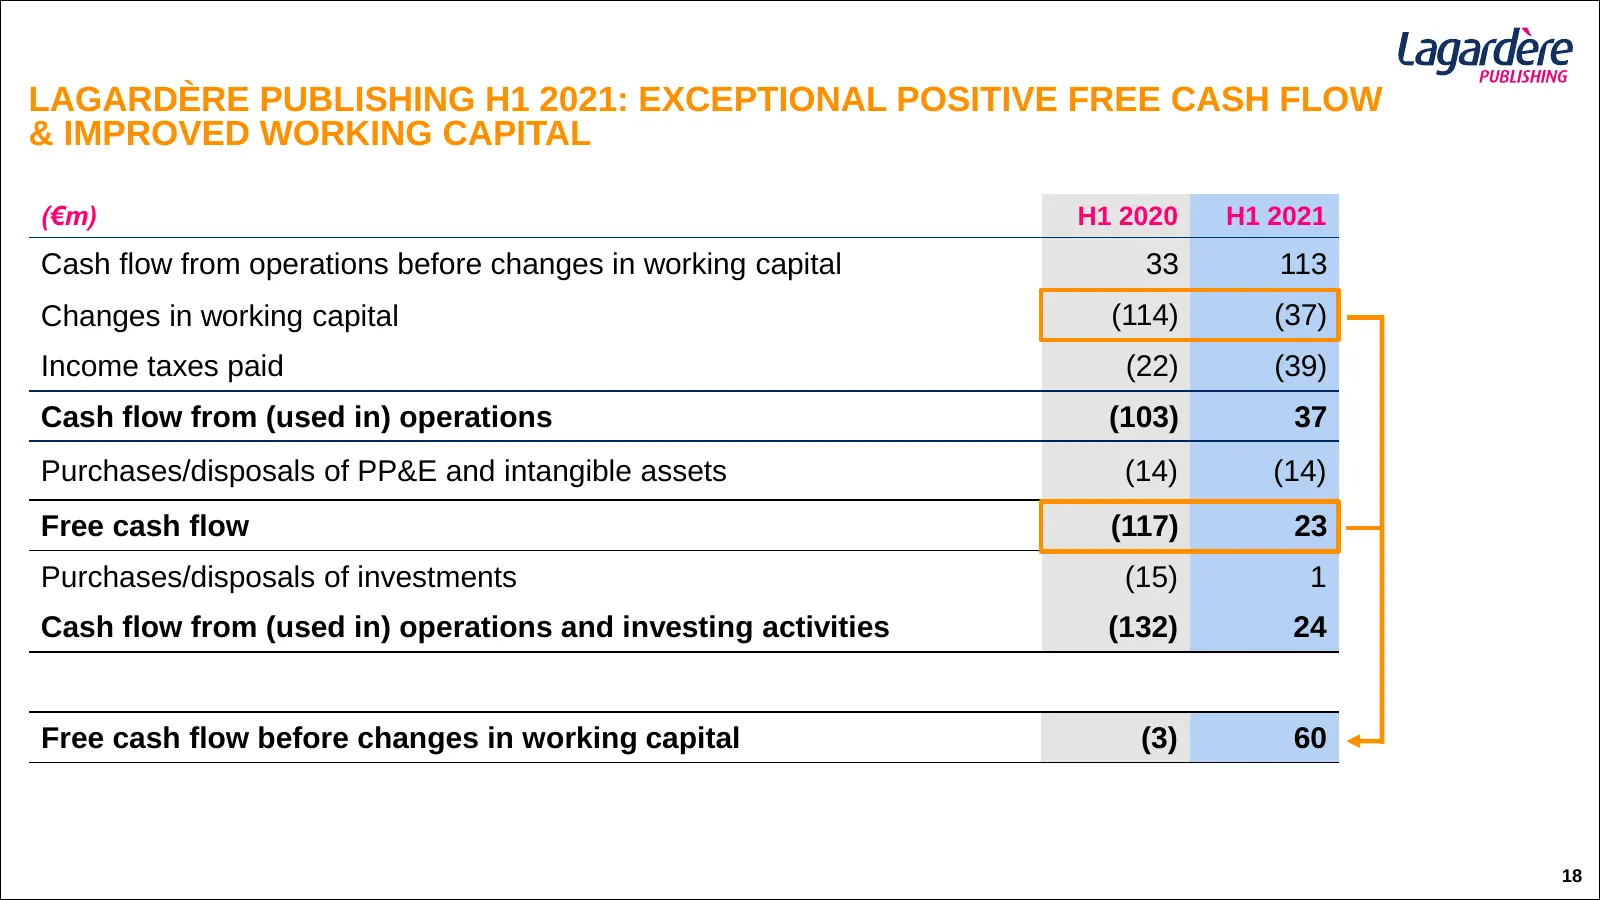
LAGARDÈRE PUBLISHING H1 2021: EXCEPTIONAL POSITIVE FREE CASH FLOW & IMPROVED WORKING CAPITAL (€m) H1 2020 H1 2021 Cash flow from operations before changes in working capital 33 113 Changes in working capital (114) (37) Income taxes paid (22) (39) Cash flow from (used in) operations (103) 37 Purchase
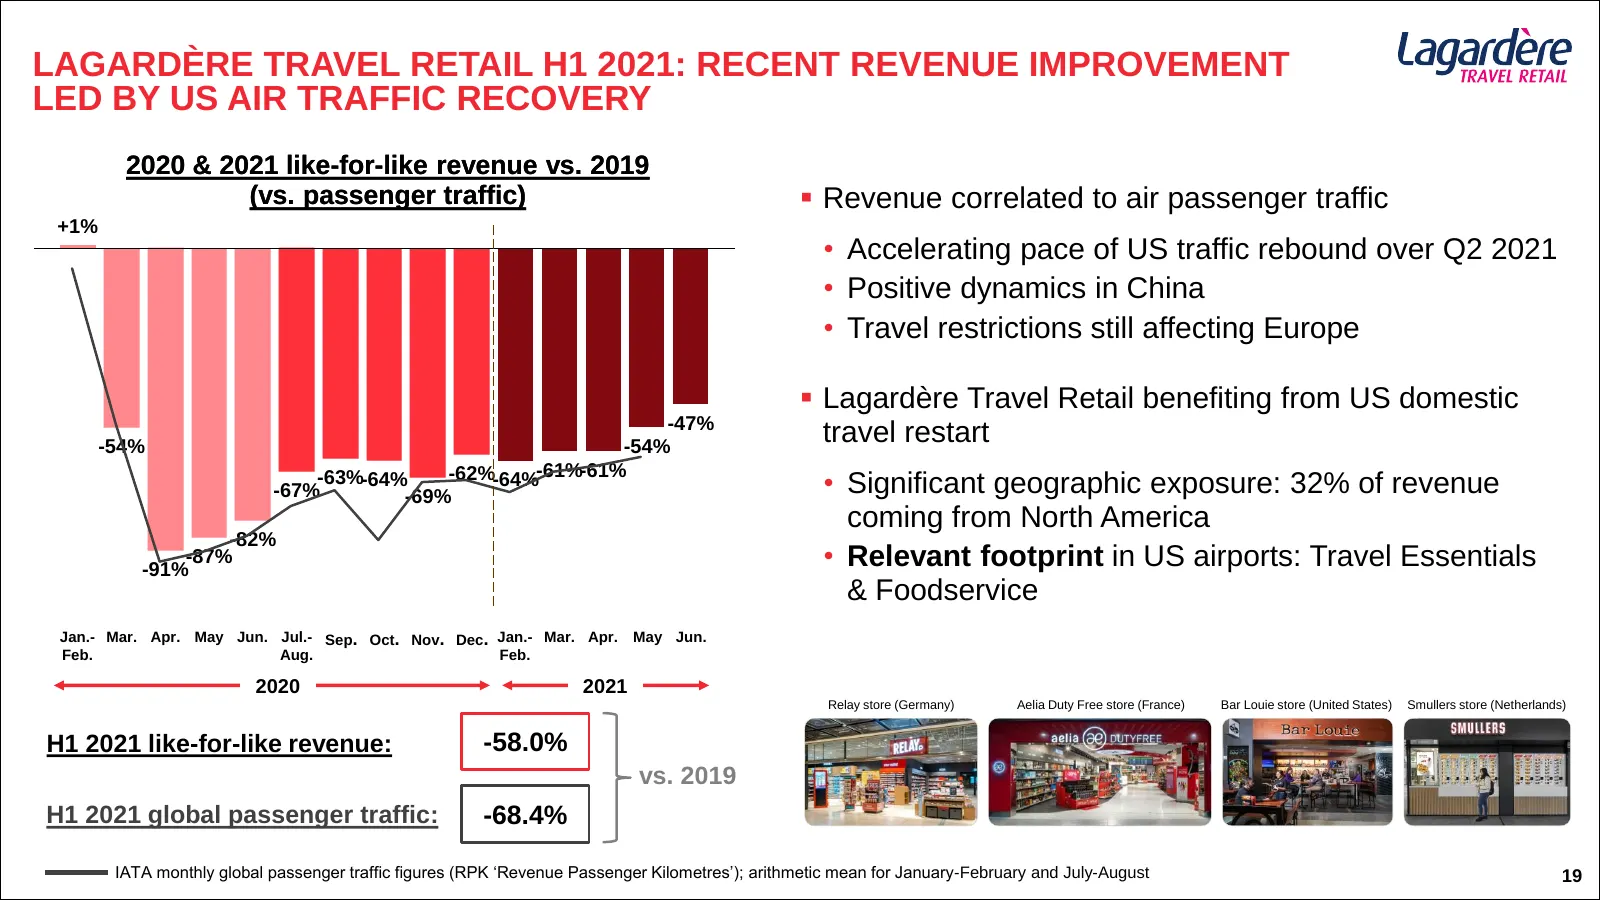
Slide 19: Lagardère Travel Retail H1 2021: Revenue Improvement Led by US Air Traffic Recovery
LAGARDÈRE TRAVEL RETAIL H1 2021: RECENT REVENUE IMPROVEMENT LED BY US AIR TRAFFIC RECOVERY 2020 & 2021 like-for-like revenue vs. 2019 (vs. passenger traffic) ▪ Revenue correlated to air passenger traffic +1% • Accelerating pace of US traffic rebound over Q2 2021 • Positive dynamics in China • Travel
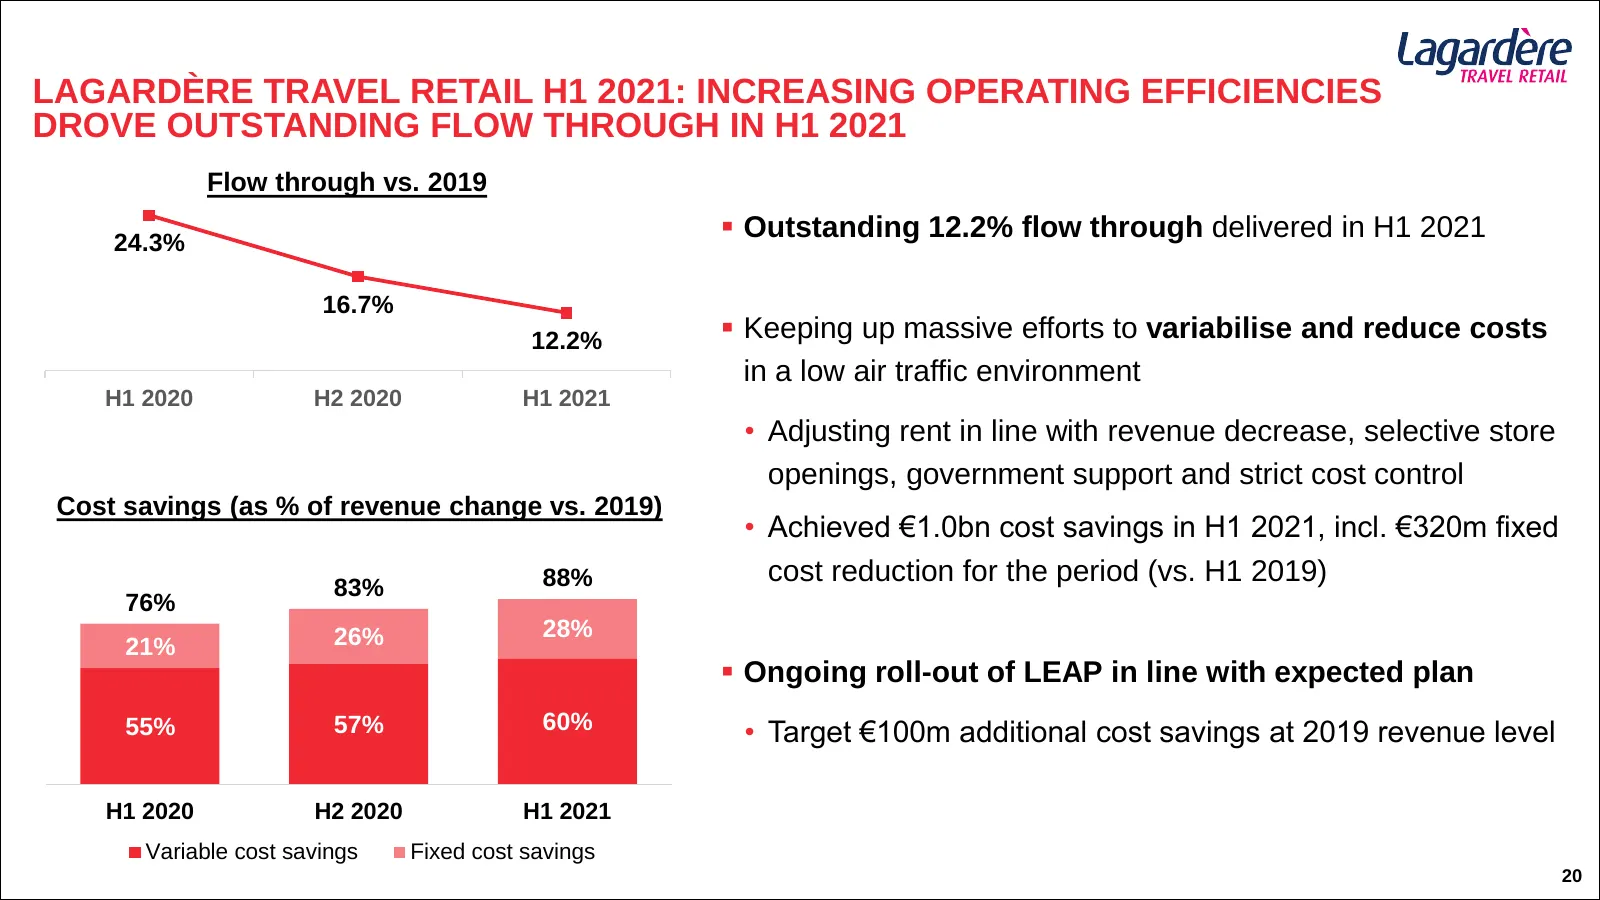
Slide 20: Lagardère Travel Retail H1 2021: Increasing Operating Efficiencies Drove Flow Through
LAGARDÈRE TRAVEL RETAIL H1 2021: INCREASING OPERATING EFFICIENCIES DROVE OUTSTANDING FLOW THROUGH IN H1 2021 Flow through vs. 2019 24.3% ▪ Outstanding 12.2% flow through delivered in H1 2021 16.7% 12.2% ▪ Keeping up massive efforts to variabilise and reduce costs in a low air traffic environment H1
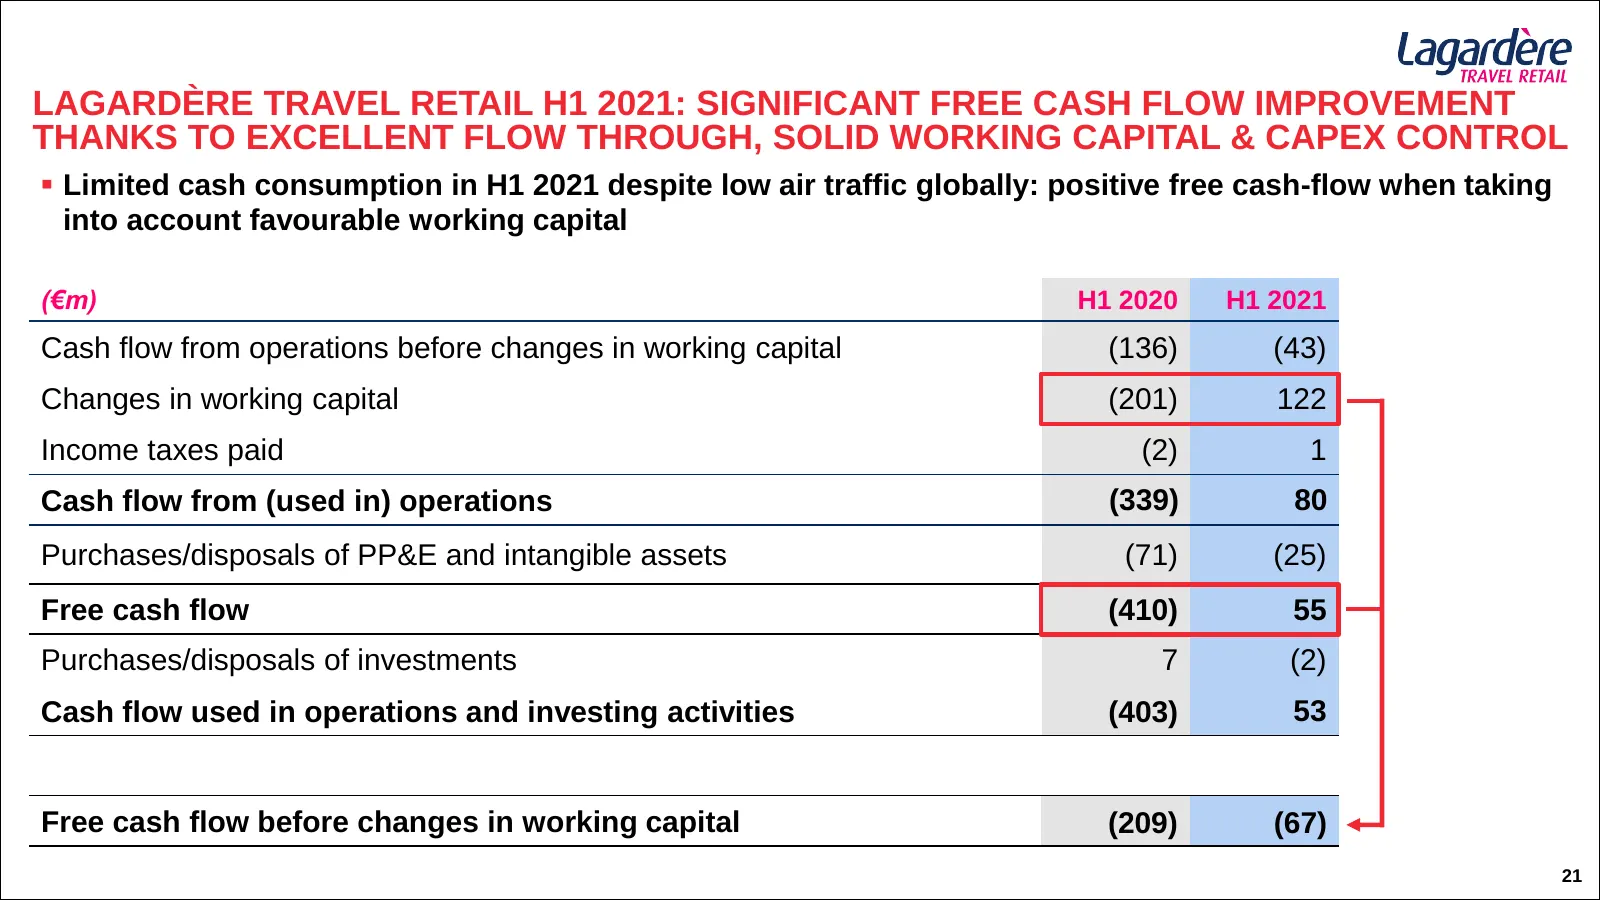
Slide 21: Lagardère Travel Retail H1 2021: Significant Free Cash Flow Improvement
LAGARDÈRE TRAVEL RETAIL H1 2021: SIGNIFICANT FREE CASH FLOW IMPROVEMENT THANKS TO EXCELLENT FLOW THROUGH, SOLID WORKING CAPITAL & CAPEX CONTROL ▪ Limited cash consumption in H1 2021 despite low air traffic globally: positive free cash-flow when taking into account favourable working capital (€m) H1
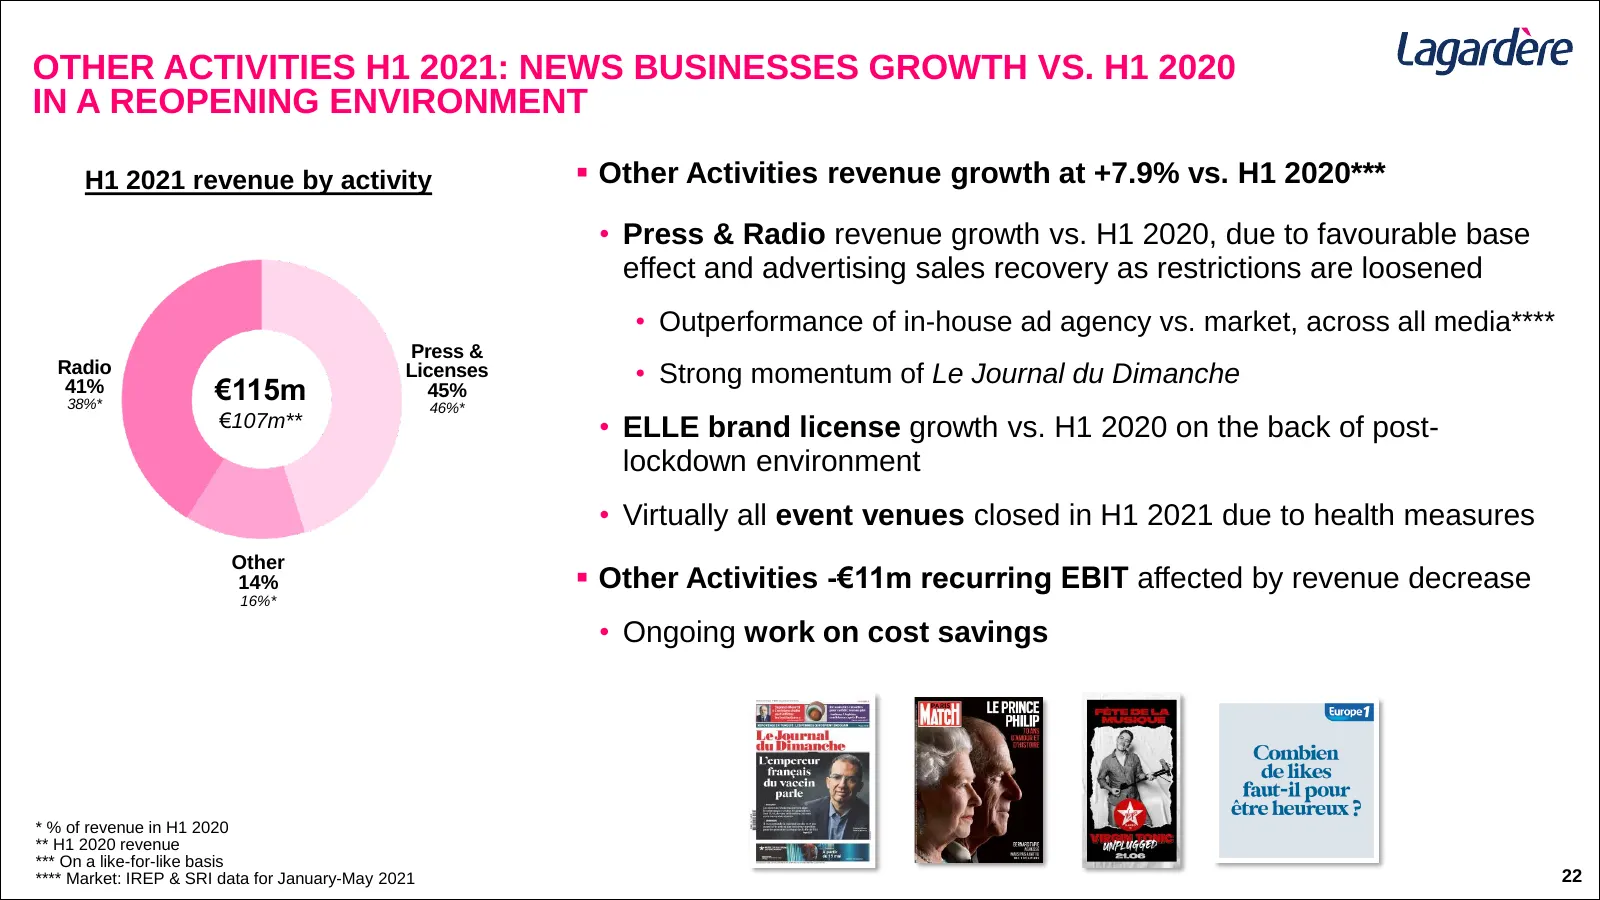
Slide 22: Other Activities H1 2021: News Businesses Growth vs. H1 2020
OTHER ACTIVITIES H1 2021: NEWS BUSINESSES GROWTH VS. H1 2020 IN A REOPENING ENVIRONMENT H1 2021 revenue by activity ▪ Other Activities revenue growth at +7.9% vs. H1 2020*** • Press & Radio revenue growth vs. H1 2020, due to favourable base effect and advertising sales recovery as restrictions are l
Slide 23: Corporate Costs: Continuous Efforts to Reduce Costs Since 2014
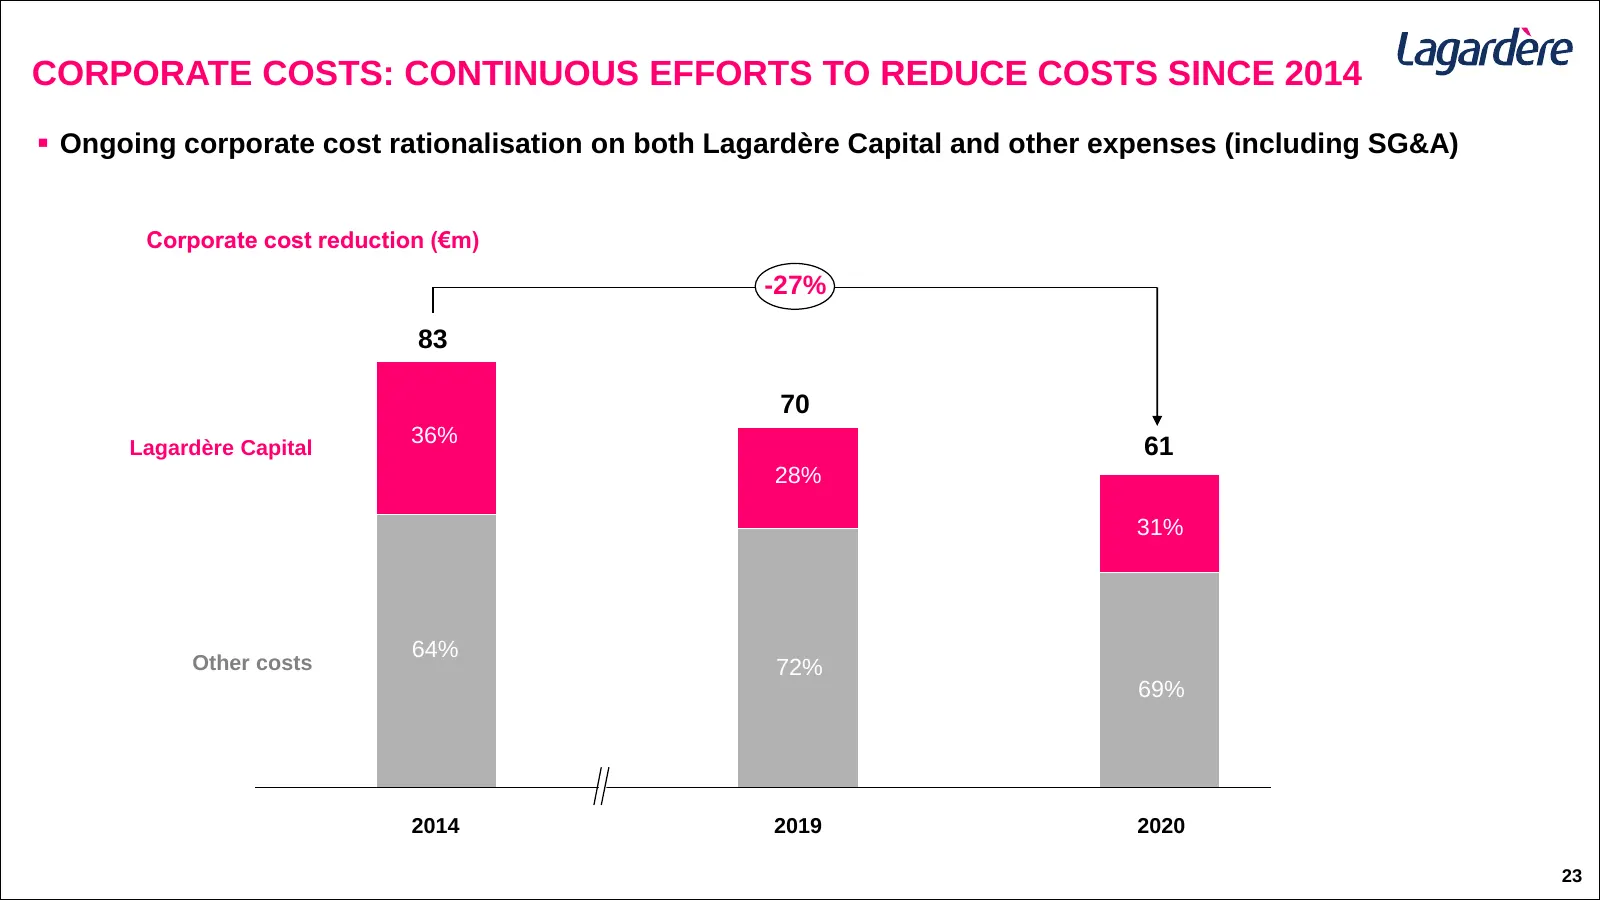
CORPORATE COSTS: CONTINUOUS EFFORTS TO REDUCE COSTS SINCE 2014 ▪ Ongoing corporate cost rationalisation on both Lagardère Capital and other expenses (including SG&A) Corporate cost reduction (€m) -27% 83 70 36% Lagardère Capital 61 28% 31% 37% 64% Other costs 72% 69% 2014 2019 2020 23
Slide 24: H1 2021 Group Results & Financing Profile
H1 2021 GROUP RESULTS & FINANCING PROFILE
Slide 25: H1 2021 Consolidated Income Statement
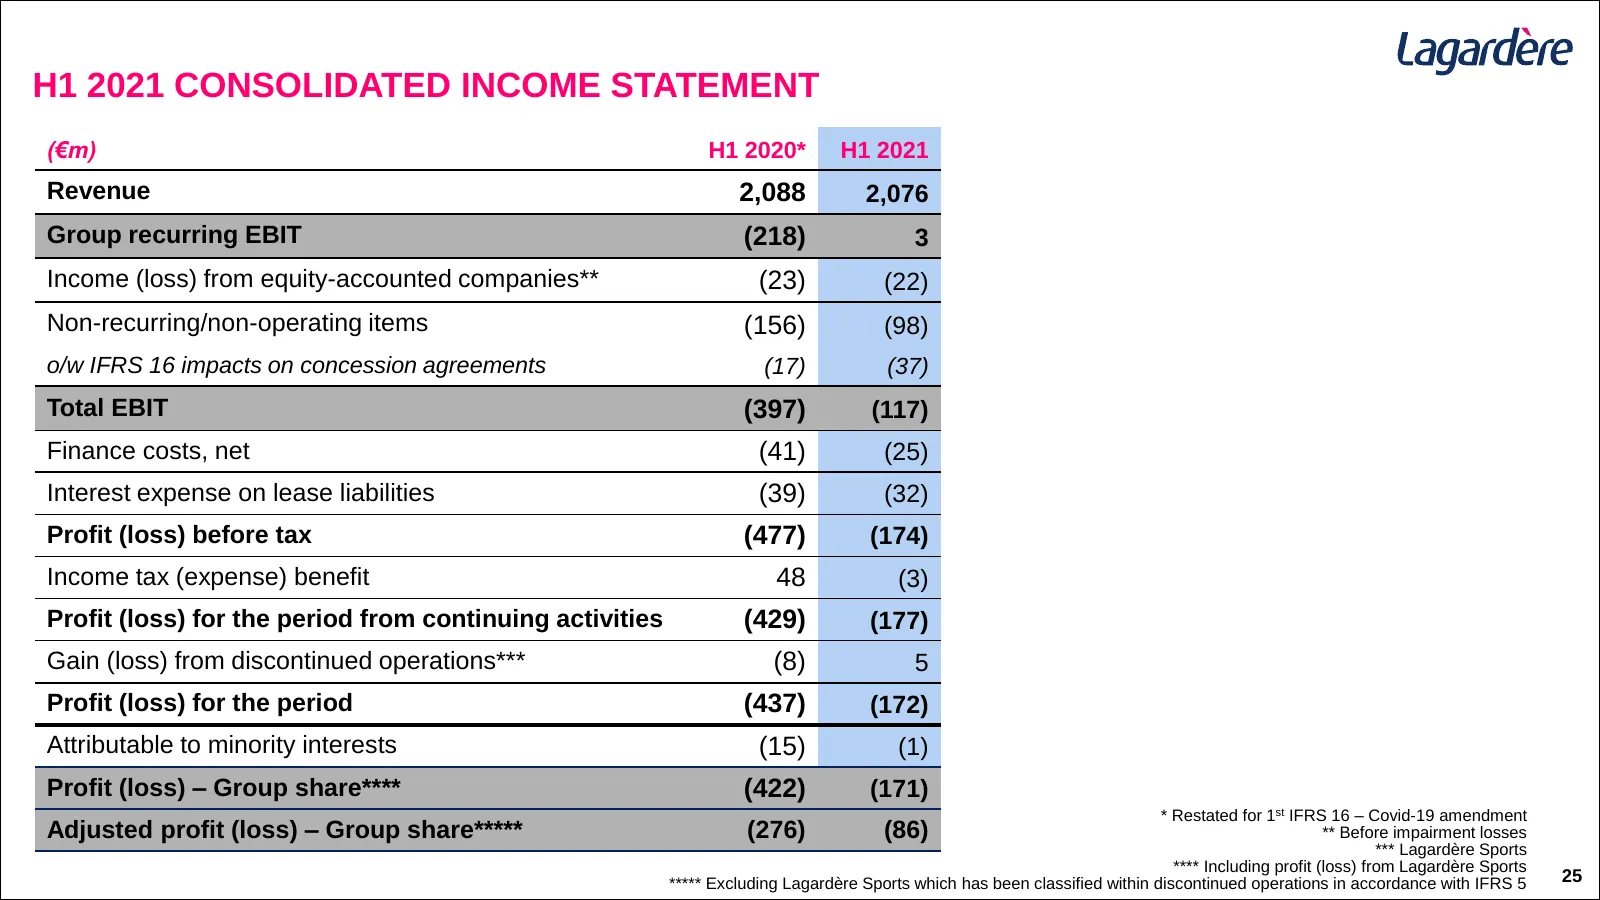
H1 2021 CONSOLIDATED INCOME STATEMENT (€m) H1 2020* H1 2021 Revenue 2,088 2,076 Group recurring EBIT (218) 3 Income (loss) from equity-accounted companies** (23) (22) Non-recurring/non-operating items (156) (98) o/w IFRS 16 impacts on concession agreements (17) (37) Total EBIT (397) (117) Finance co
Slide 26: H1 2021 Consolidated Balance Sheet
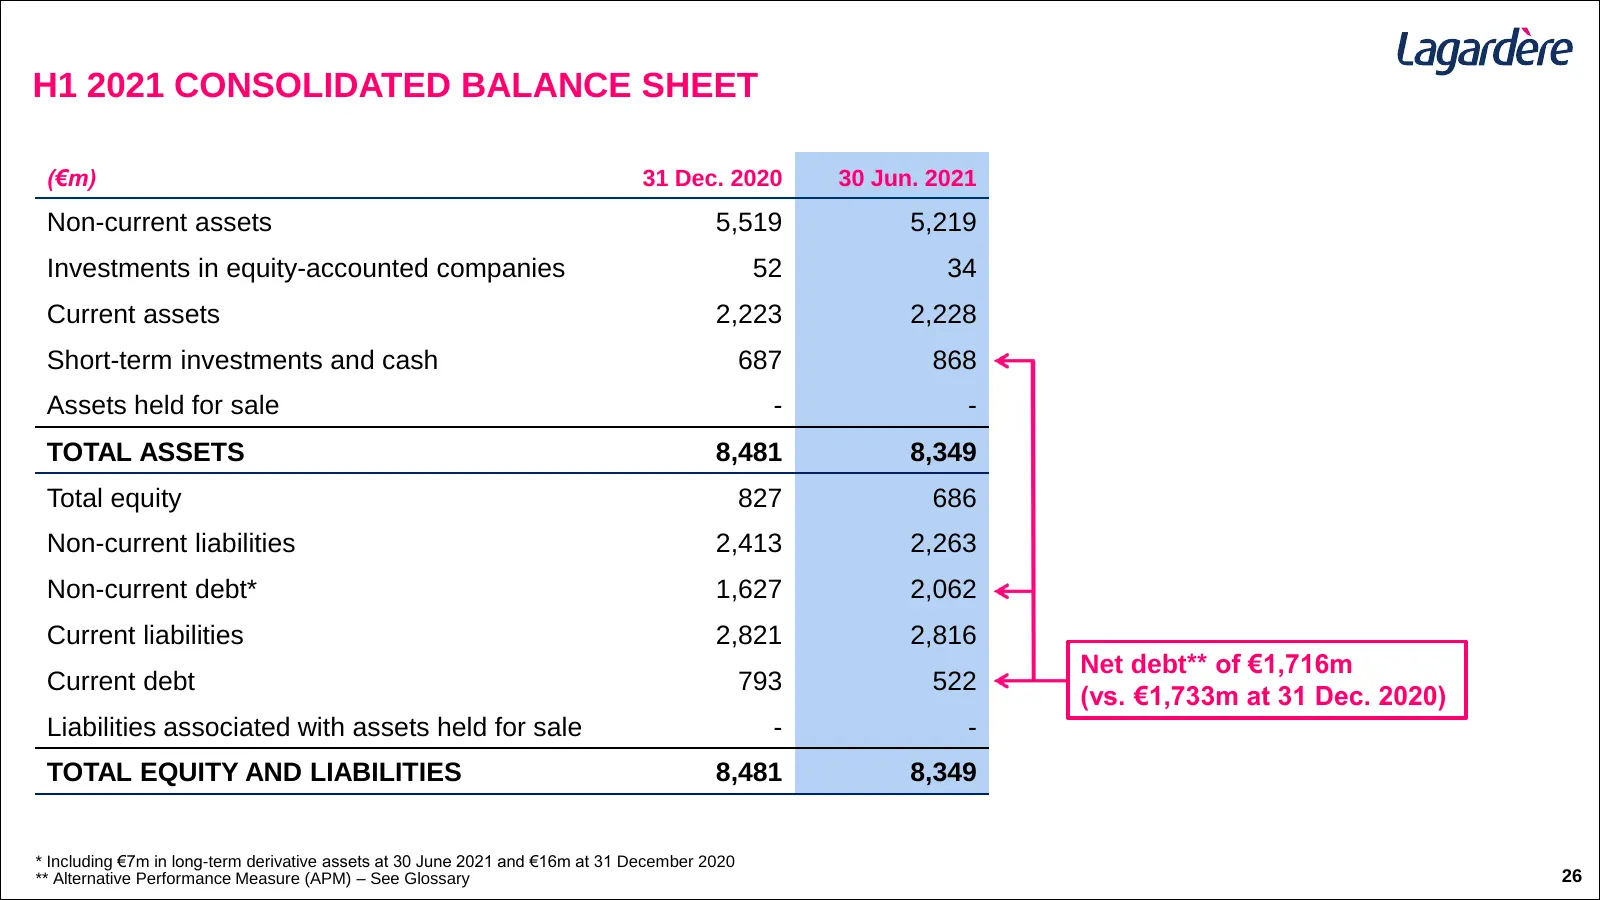
H1 2021 CONSOLIDATED BALANCE SHEET (€m) 31 Dec. 2020 30 Jun. 2021 Non-current assets 5,519 5,219 Investments in equity-accounted companies 52 34 Current assets 2,223 2,228 Short-term investments and cash 687 868 Assets held for sale - - TOTAL ASSETS 8,481 8,349 Total equity 827 686 Non-current liabi
Slide 27: H1 2021 Consolidated Statement of Cash Flows
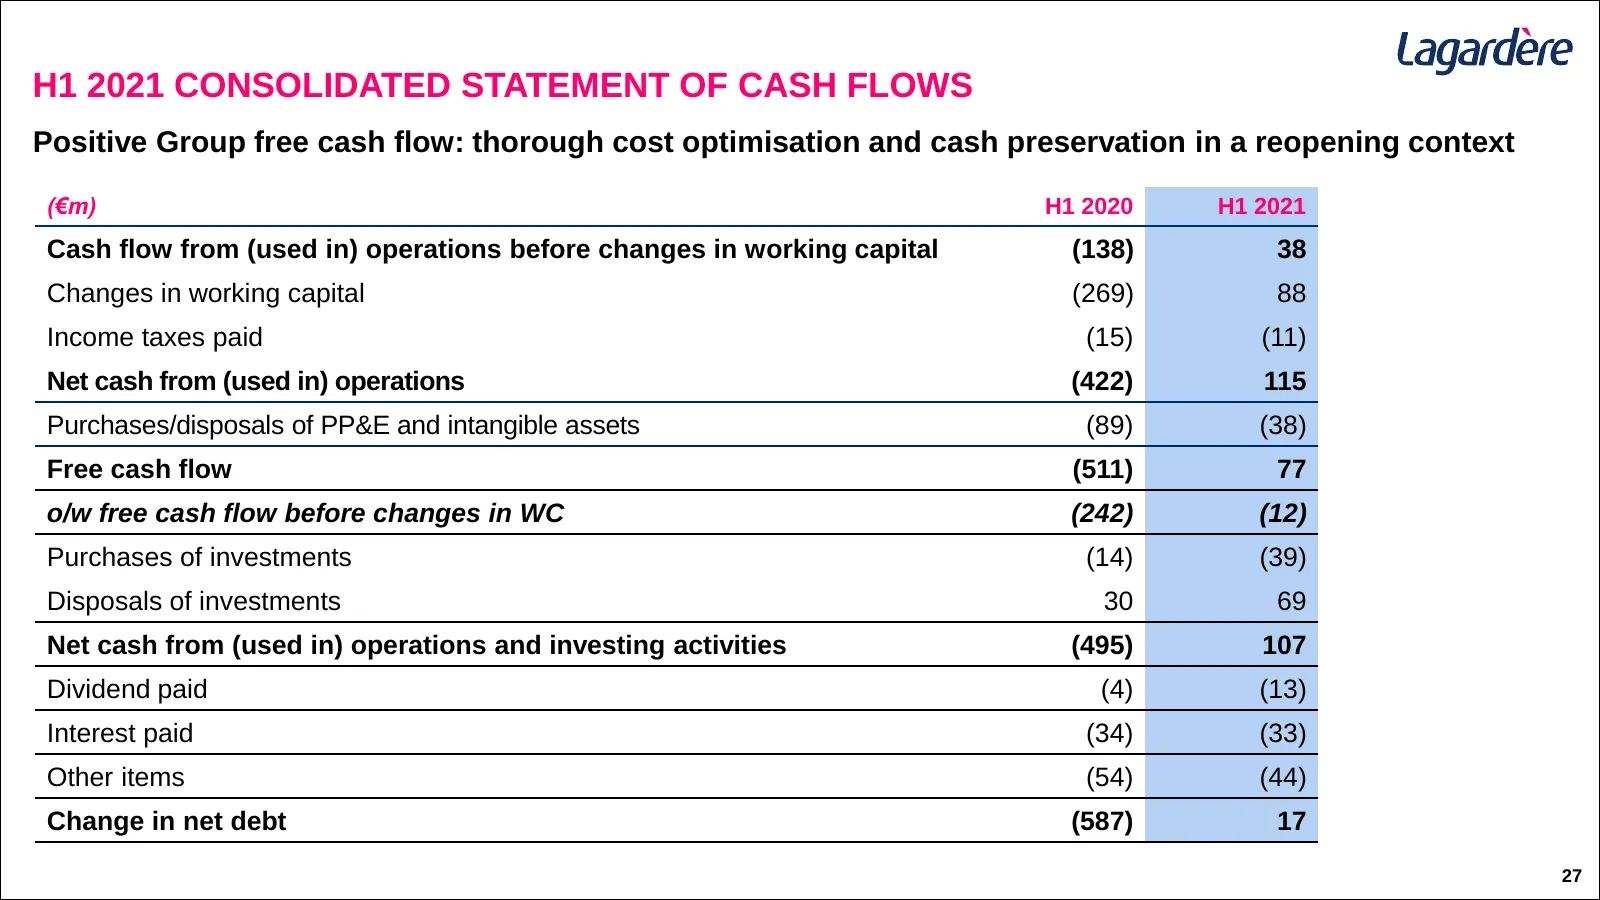
H1 2021 CONSOLIDATED STATEMENT OF CASH FLOWS Positive Group free cash flow: thorough cost optimisation and cash preservation in a reopening context (€m) H1 2020 H1 2021 Cash flow from (used in) operations before changes in working capital (138) 38 Changes in working capital (269) 88 Income taxes pai
Slide 28: Ongoing Thorough Net Debt Management
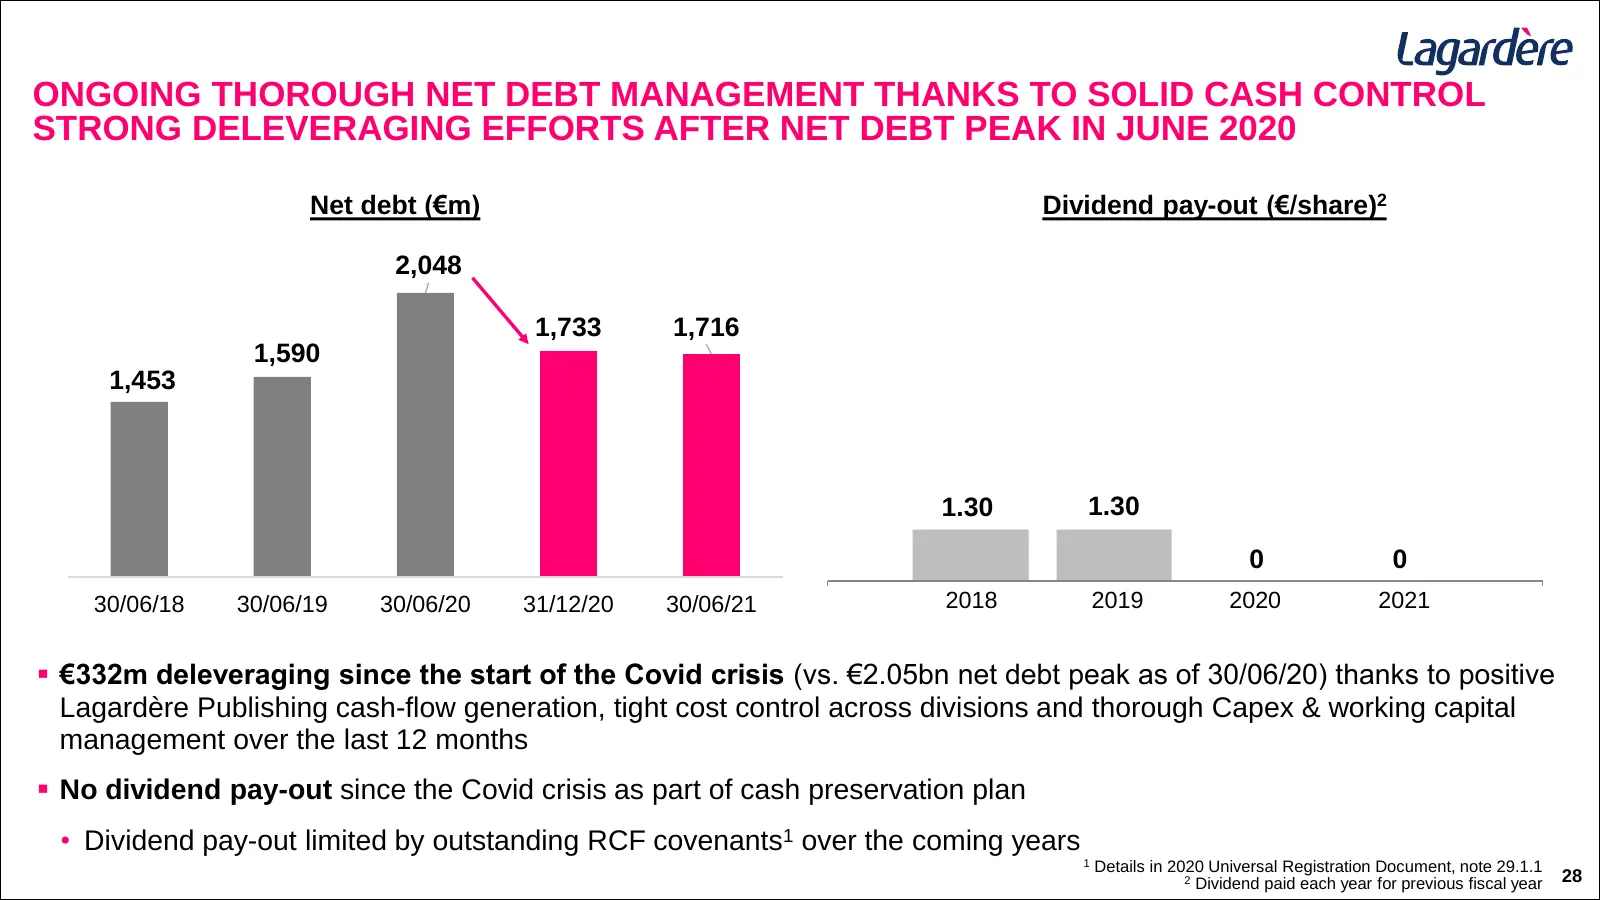
ONGOING THOROUGH NET DEBT MANAGEMENT THANKS TO SOLID CASH CONTROL STRONG DELEVERAGING EFFORTS AFTER NET DEBT PEAK IN JUNE 2020 Net debt (€m) Dividend pay-out (€/share)2 2,048 1,733 1,716 1,590 1,453 1.30 1.30 0 0 30/06/18 30/06/19 30/06/20 31/12/20 30/06/21 2018 2019 2020 2021 ▪ €332m deleveraging s
Slide 29: Robust Liquidity with €2.0bn Available as of June 2021
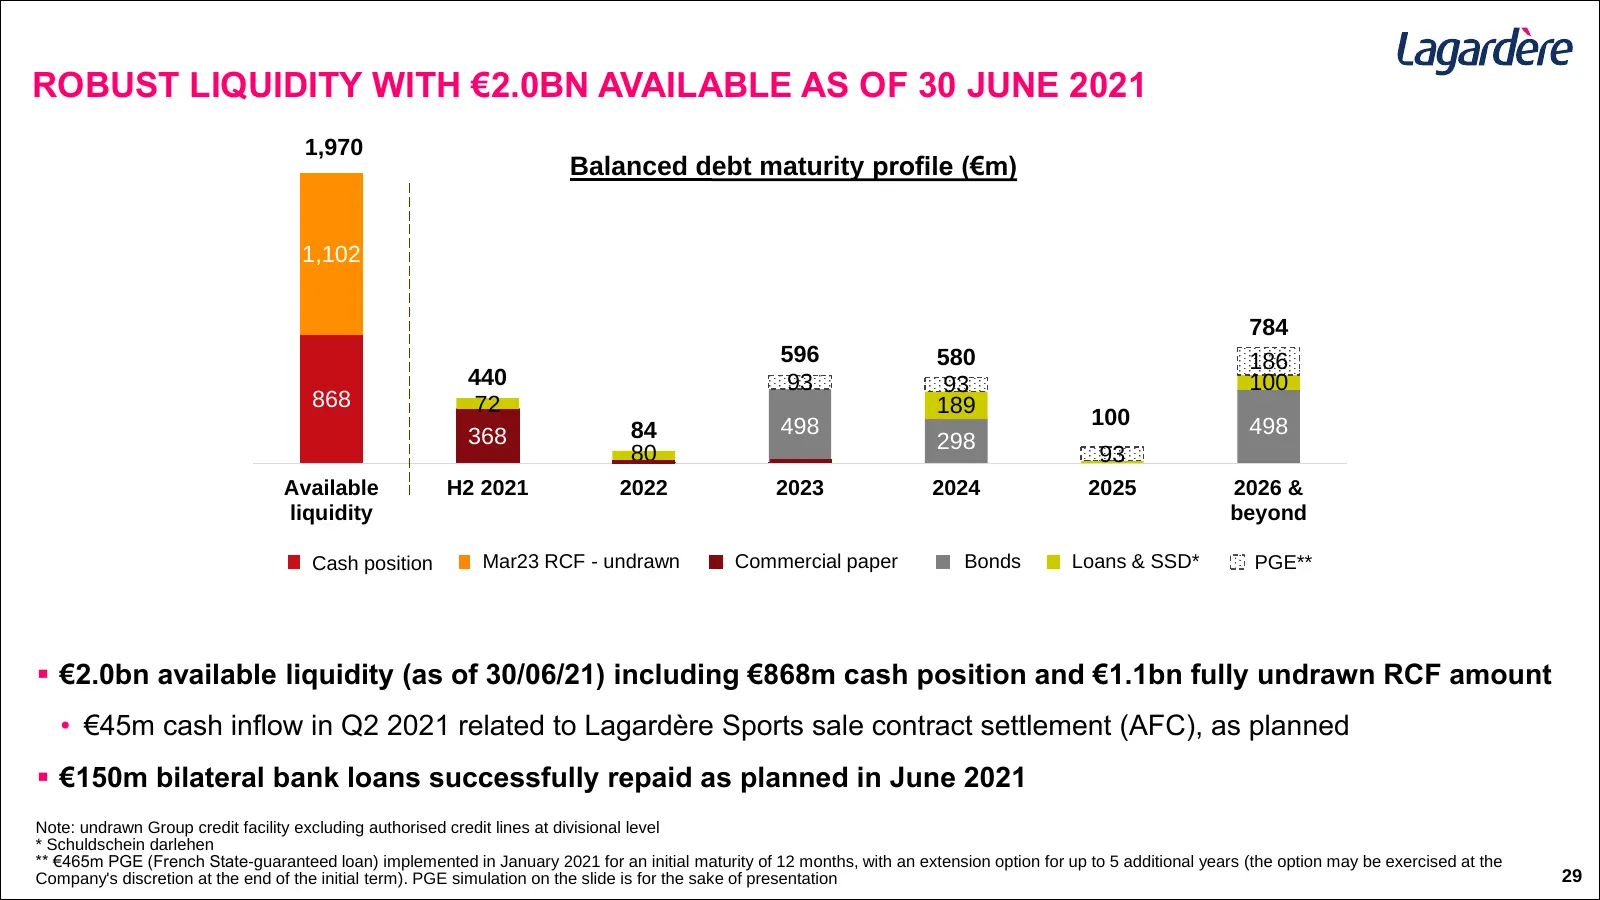
ROBUST LIQUIDITY WITH €2.0BN AVAILABLE AS OF 30 JUNE 2021 1,970 Balanced debt maturity profile (€m) 1,102 784 596 580 186 440 93 93 100 868 72 189 498 100 498 368 84 298 80 93 Available H2 2021 2022 2023 2024 2025 2026 & liquidity beyond Cash position Mar23 RCF - undrawn Commercial paper Commercial

Slide 30: Outlook
3. OUTLOOK
Slide 31: Outlook
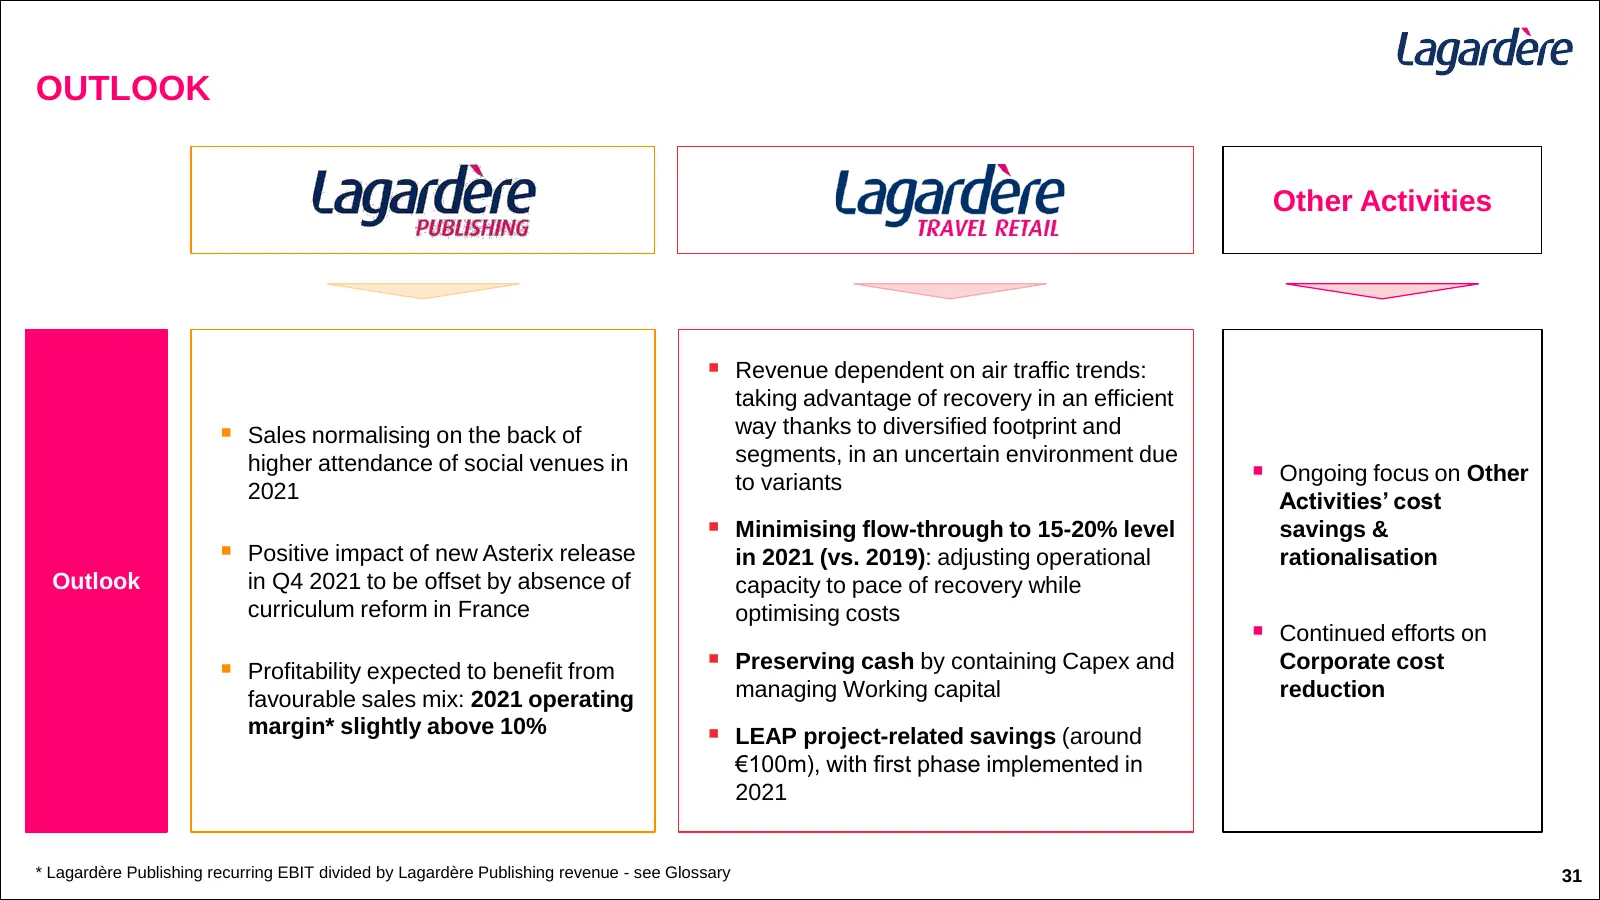
OUTLOOK Other Activities ▪ Revenue dependent on air traffic trends: taking advantage of recovery in an efficient ▪ Sales normalising on the back of way thanks to diversified footprint and higher attendance of social venues in segments, in an uncertain environment due to variants ▪ Ongoing focus on O
Slide 32: Transaction Overview
4. TRANSACTION OVERVIEW
Slide 33: Lagardère Bond Issue: Proposed Term Sheet
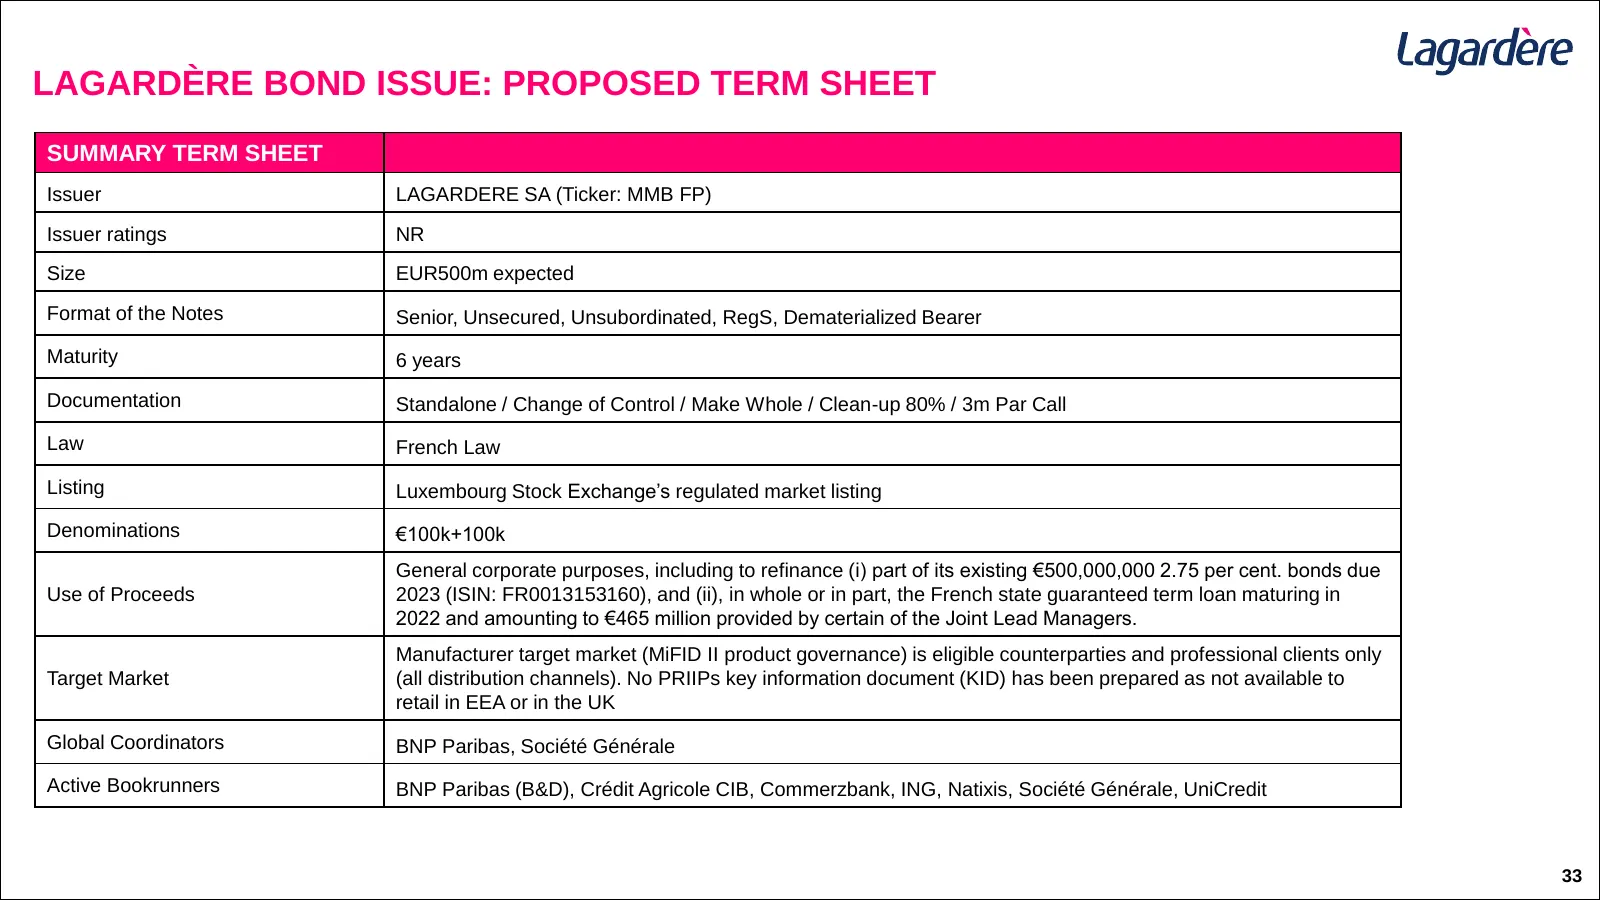
LAGARDÈRE BOND ISSUE: PROPOSED TERM SHEET SUMMARY TERM SHEET Issuer LAGARDERE SA (Ticker: MMB FP) Issuer ratings NR Size EUR500m expected Format of the Notes Senior, Unsecured, Unsubordinated, RegS, Dematerialized Bearer Maturity 6 years Documentation Standalone / Change of Control / Make Whole / Cl
Slide 34: Summary of the Tender Offer
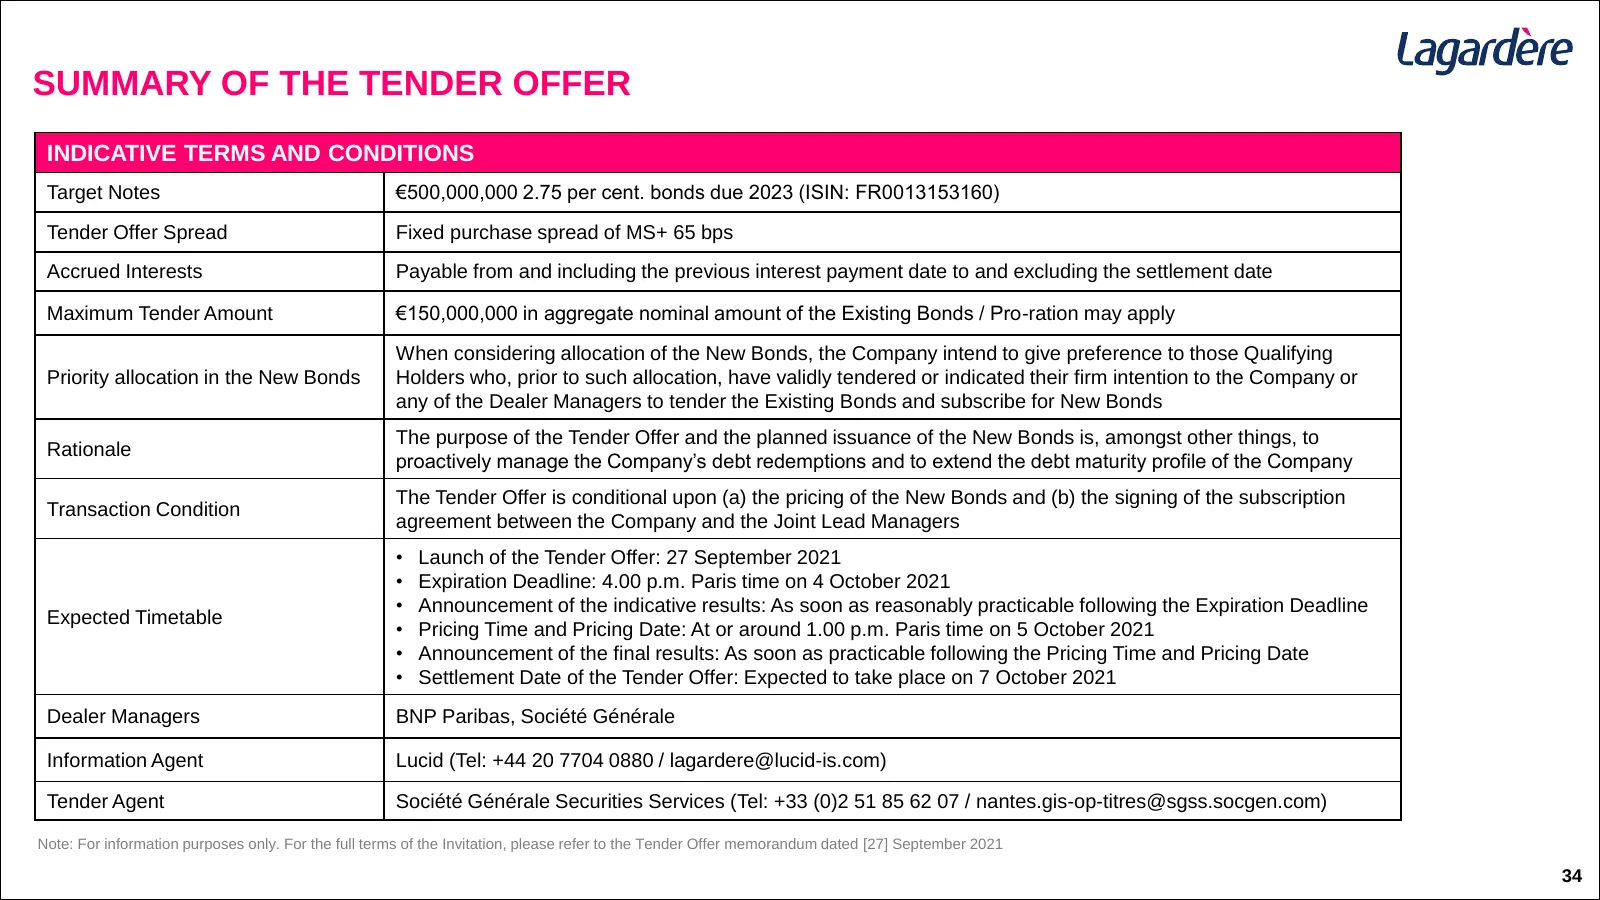
SUMMARY OF THE TENDER OFFER INDICATIVE TERMS AND CONDITIONS Target Notes €500,000,000 2.75 per cent. bonds due 2023 (ISIN: FR0013153160) Tender Offer Spread Fixed purchase spread of MS+ 65 bps Accrued Interests Payable from and including the previous interest payment date to and excluding the settle
Slide 35: Appendix
5. APPENDIX
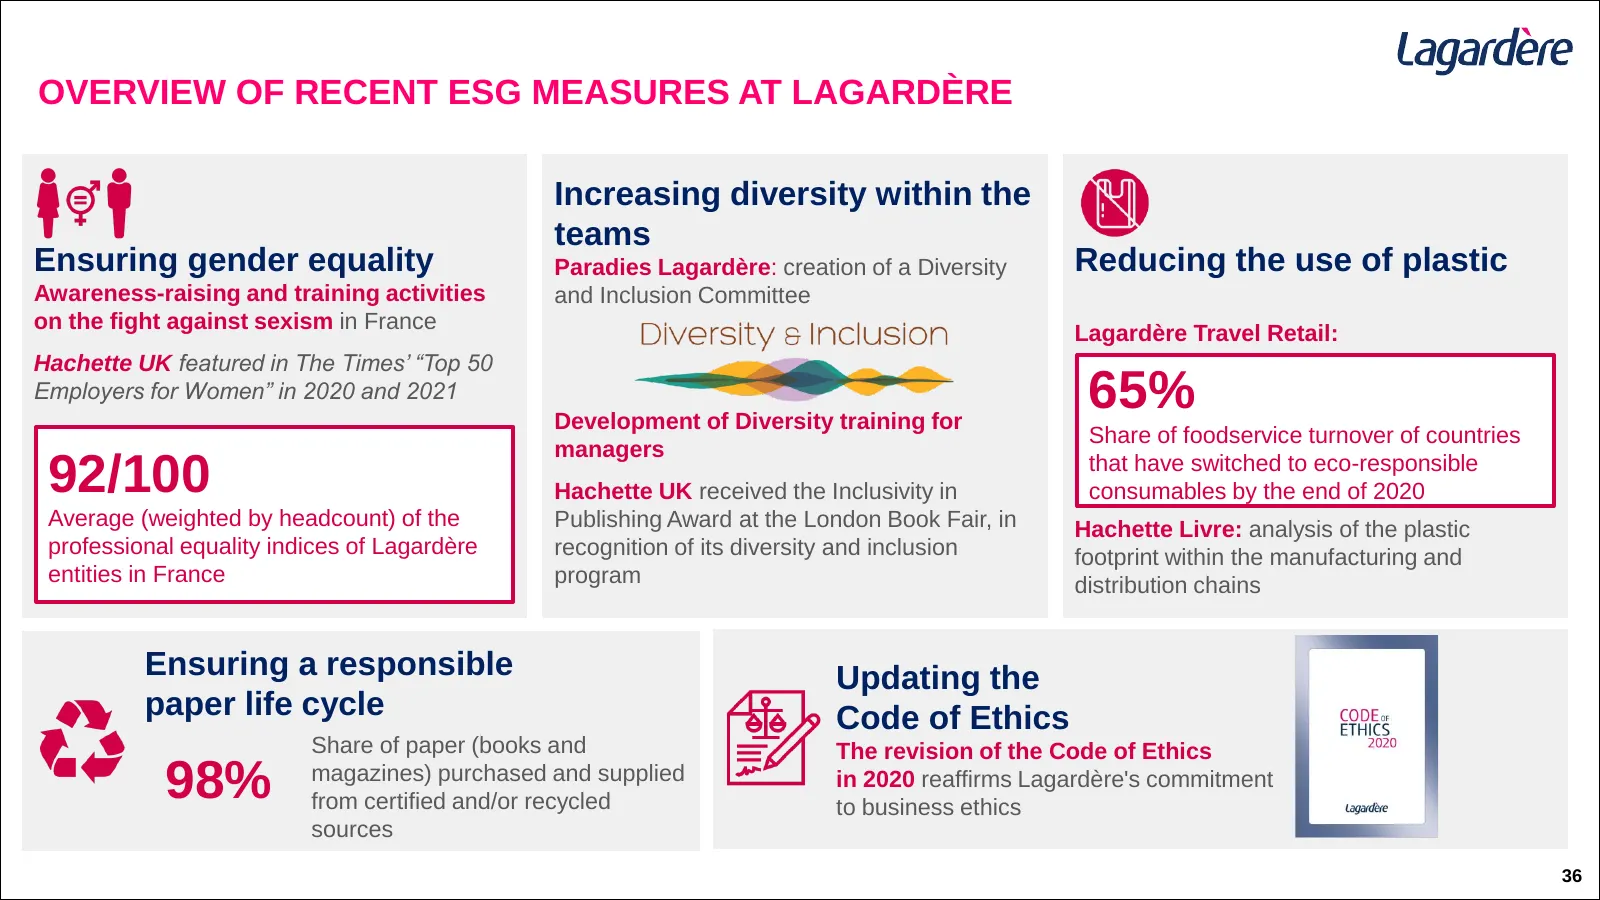
Slide 36: Overview of Recent ESG Measures at Lagardère
OVERVIEW OF RECENT ESG MEASURES AT LAGARDÈRE Increasing diversity within the teams Ensuring gender equality Paradies Lagardère: creation of a Diversity Reducing the use of plastic Awareness-raising and training activities and Inclusion Committee on the fight against sexism in France Lagardère Travel
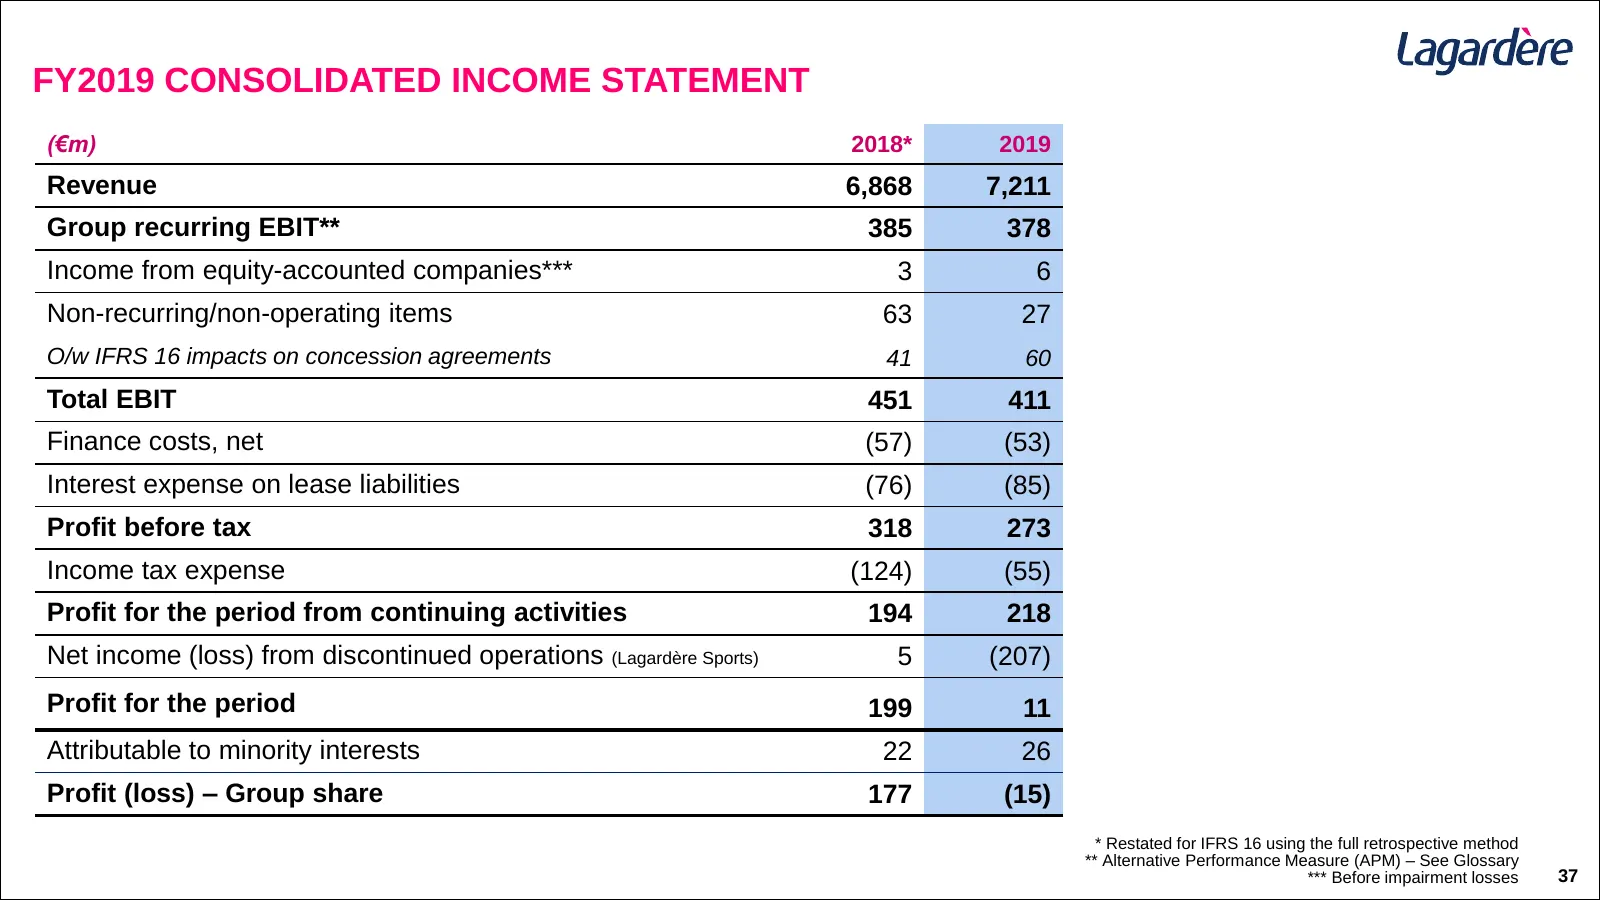
Slide 37: FY2019 Consolidated Income Statement
FY2019 CONSOLIDATED INCOME STATEMENT (€m) 2018* 2019 Revenue 6,868 7,211 Group recurring EBIT** 385 378 Income from equity-accounted companies*** 3 6 Non-recurring/non-operating items 63 27 O/w IFRS 16 impacts on concession agreements 41 60 Total EBIT 451 411 Finance costs, net (57) (53) Interest ex
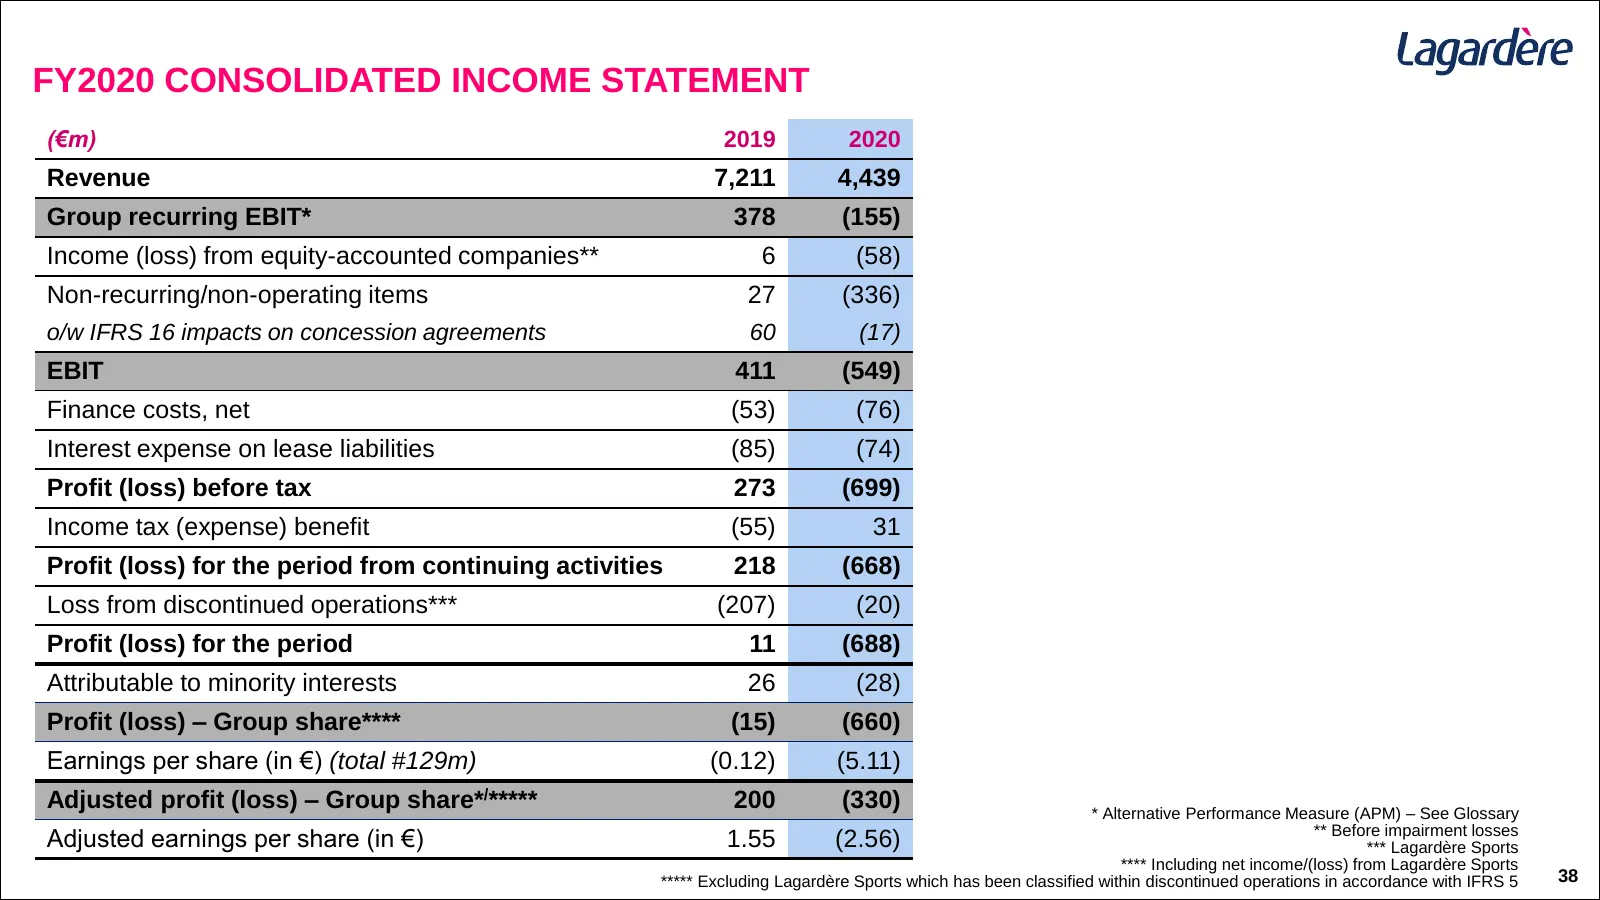
Slide 38: FY2020 Consolidated Income Statement
FY2020 CONSOLIDATED INCOME STATEMENT (€m) 2019 2020 Revenue 7,211 4,439 Group recurring EBIT* 378 (155) Income (loss) from equity-accounted companies** 6 (58) Non-recurring/non-operating items 27 (336) o/w IFRS 16 impacts on concession agreements 60 (17) EBIT 411 (549) Finance costs, net (53) (76) I
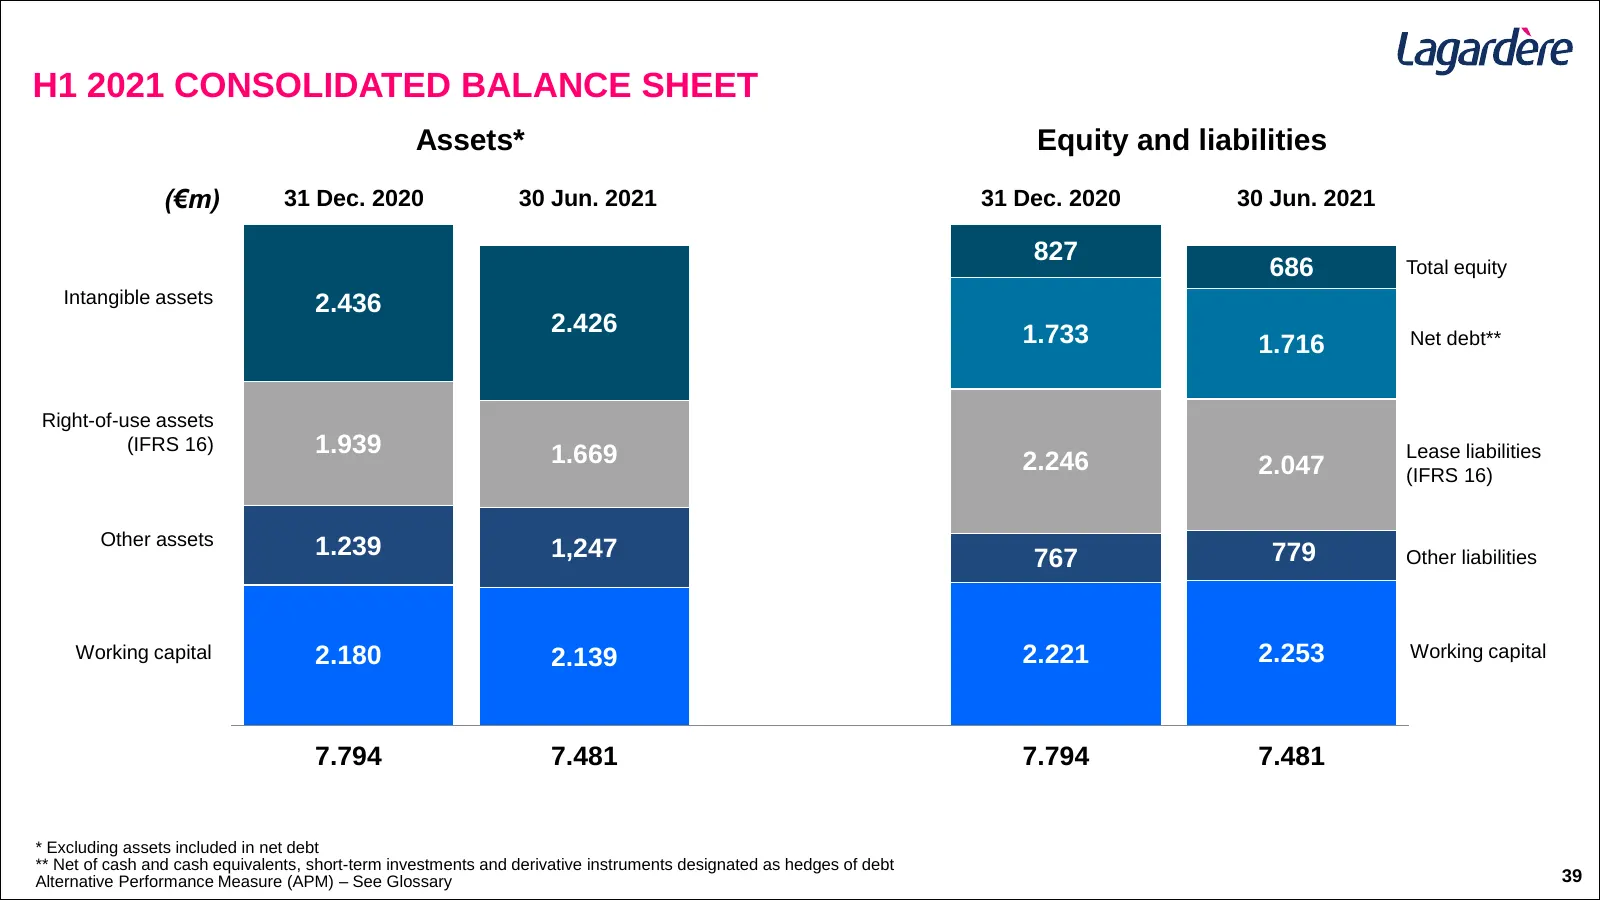
Slide 39: H1 2021 Consolidated Balance Sheet (€m)
H1 2021 CONSOLIDATED BALANCE SHEET Assets* Equity and liabilities (€m) 31 Dec. 2020 30 Jun. 2021 31 Dec. 2020 30 Jun. 2021 827 686 Total equity Intangible assets 2.436 2.426 1.733 Net debt** 1.716 Right-of-use assets (IFRS 16) 1.939 1.669 Lease liabilities 2.246 2.047 (IFRS 16) Other assets 1.239 1,

Slide 40: IFRS 16 Impact on the Consolidated Accounts
IFRS 16 IMPACT ON THE CONSOLIDATED ACCOUNTS
Slide 41: Impact of IFRS 16 on the Consolidated Income Statement and Related Indicators
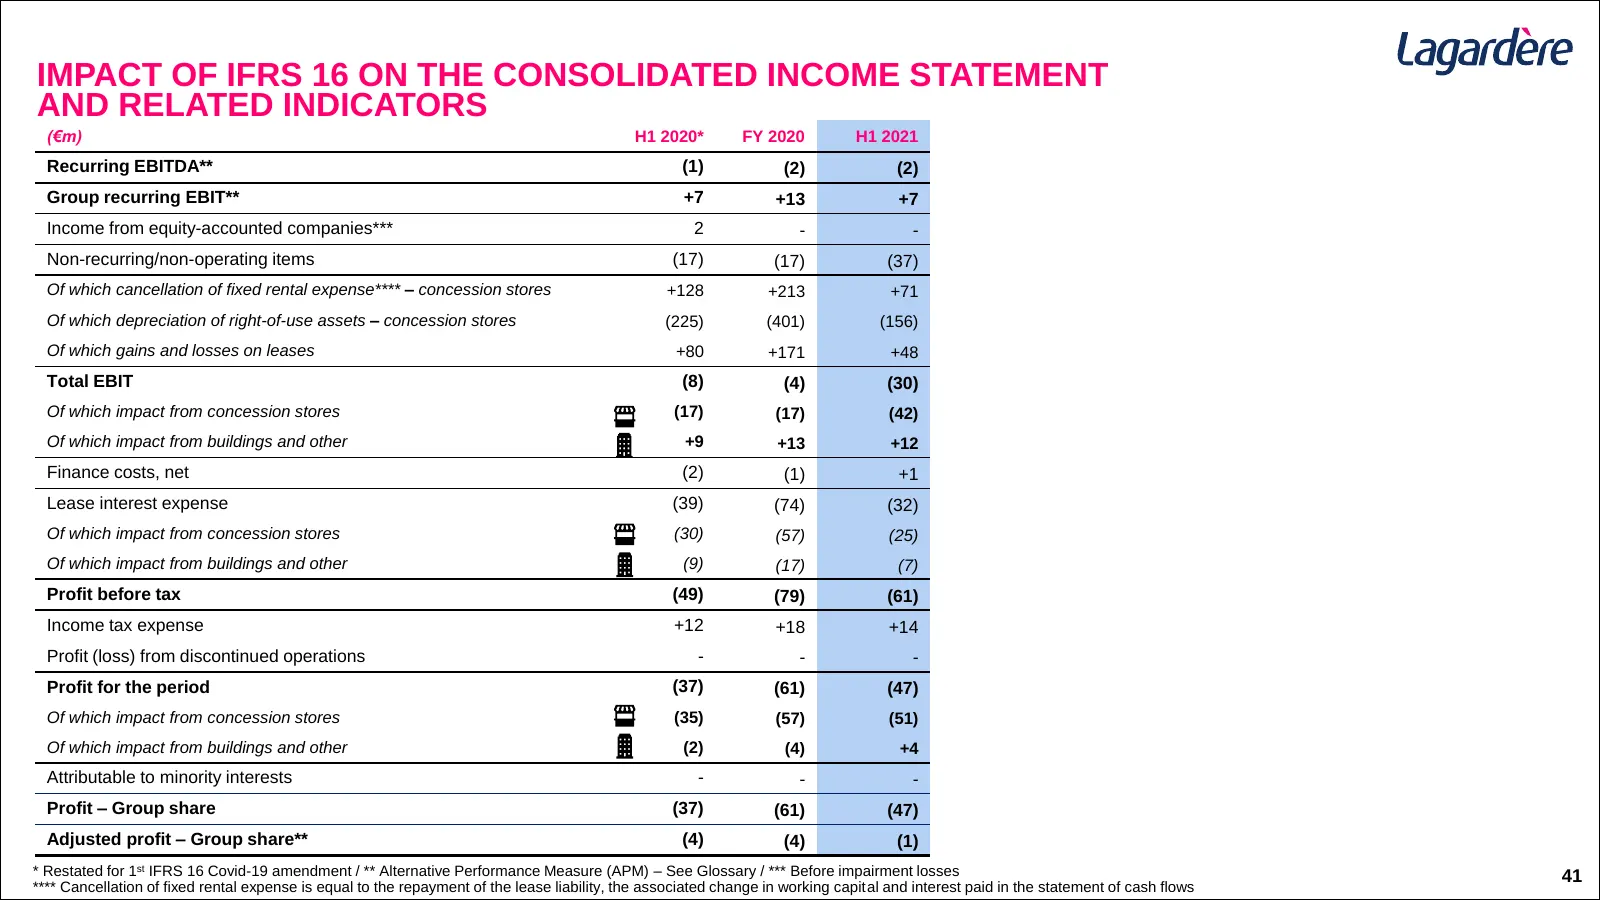
IMPACT OF IFRS 16 ON THE CONSOLIDATED INCOME STATEMENT AND RELATED INDICATORS (€m) H1 2020* FY 2020 H1 2021 Recurring EBITDA** (1) (2) (2) Group recurring EBIT** +7 +13 +7 Income from equity-accounted companies*** 2 - - Non-recurring/non-operating items (17) (17) (37) Of which cancellation of fixed
Slide 42: Impact of IFRS 16 on the Consolidated Statement of Cash Flows
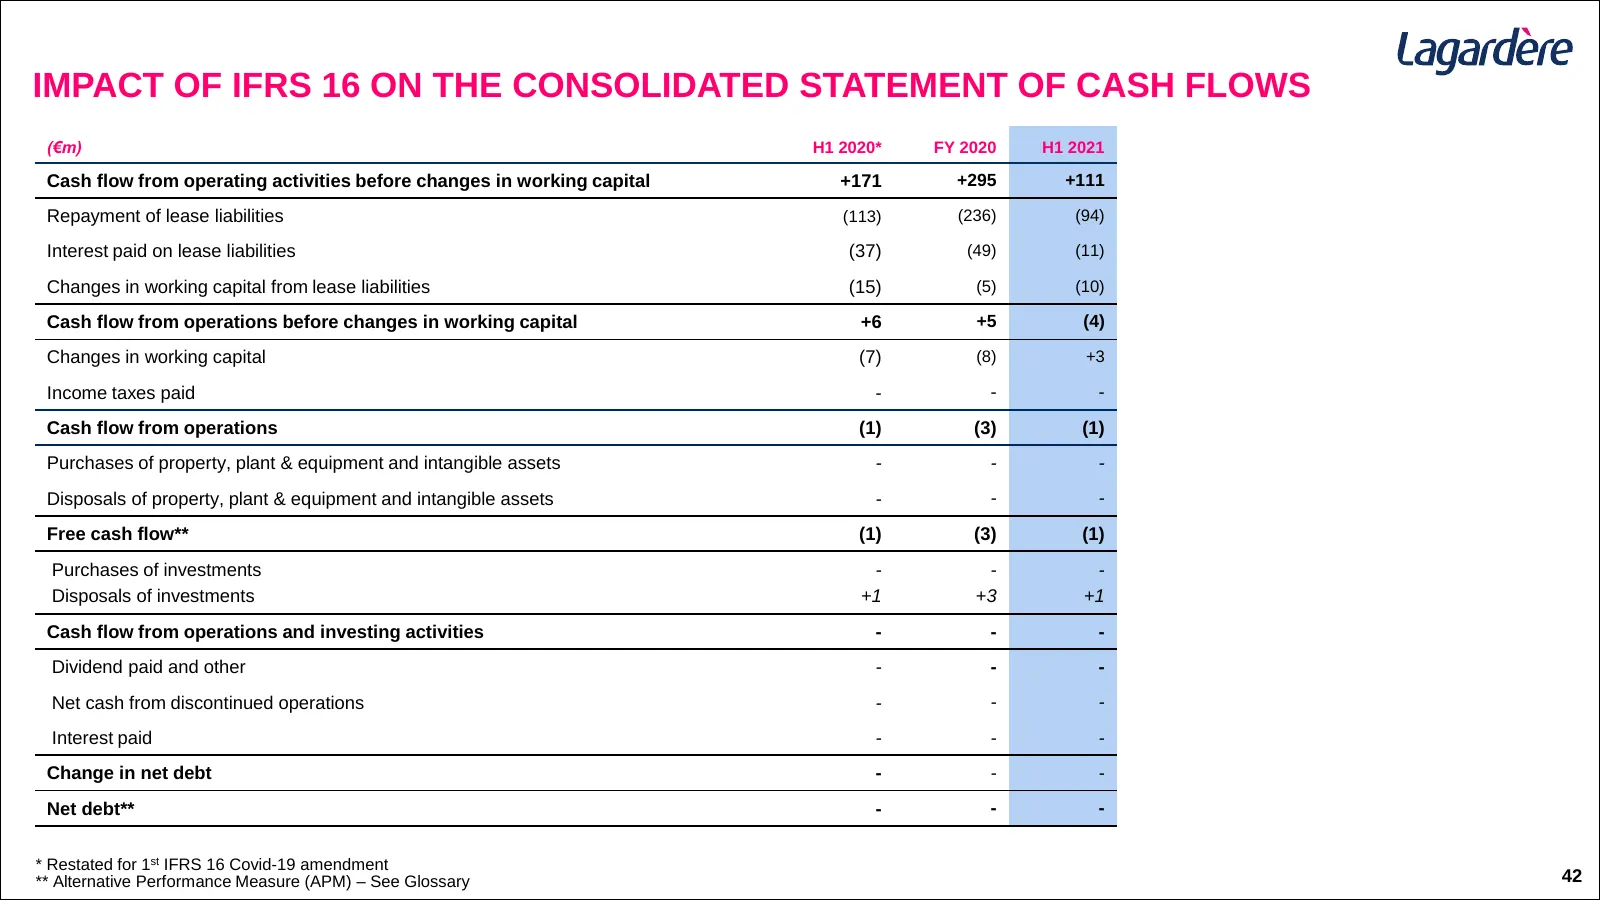
IMPACT OF IFRS 16 ON THE CONSOLIDATED STATEMENT OF CASH FLOWS (€m) H1 2020* FY 2020 H1 2021 Cash flow from operating activities before changes in working capital +171 +295 +111 Repayment of lease liabilities (113) (236) (94) Interest paid on lease liabilities (37) (49) (11) Changes in working capita
Slide 43: Impact of IFRS 16 on the Consolidated Balance Sheet
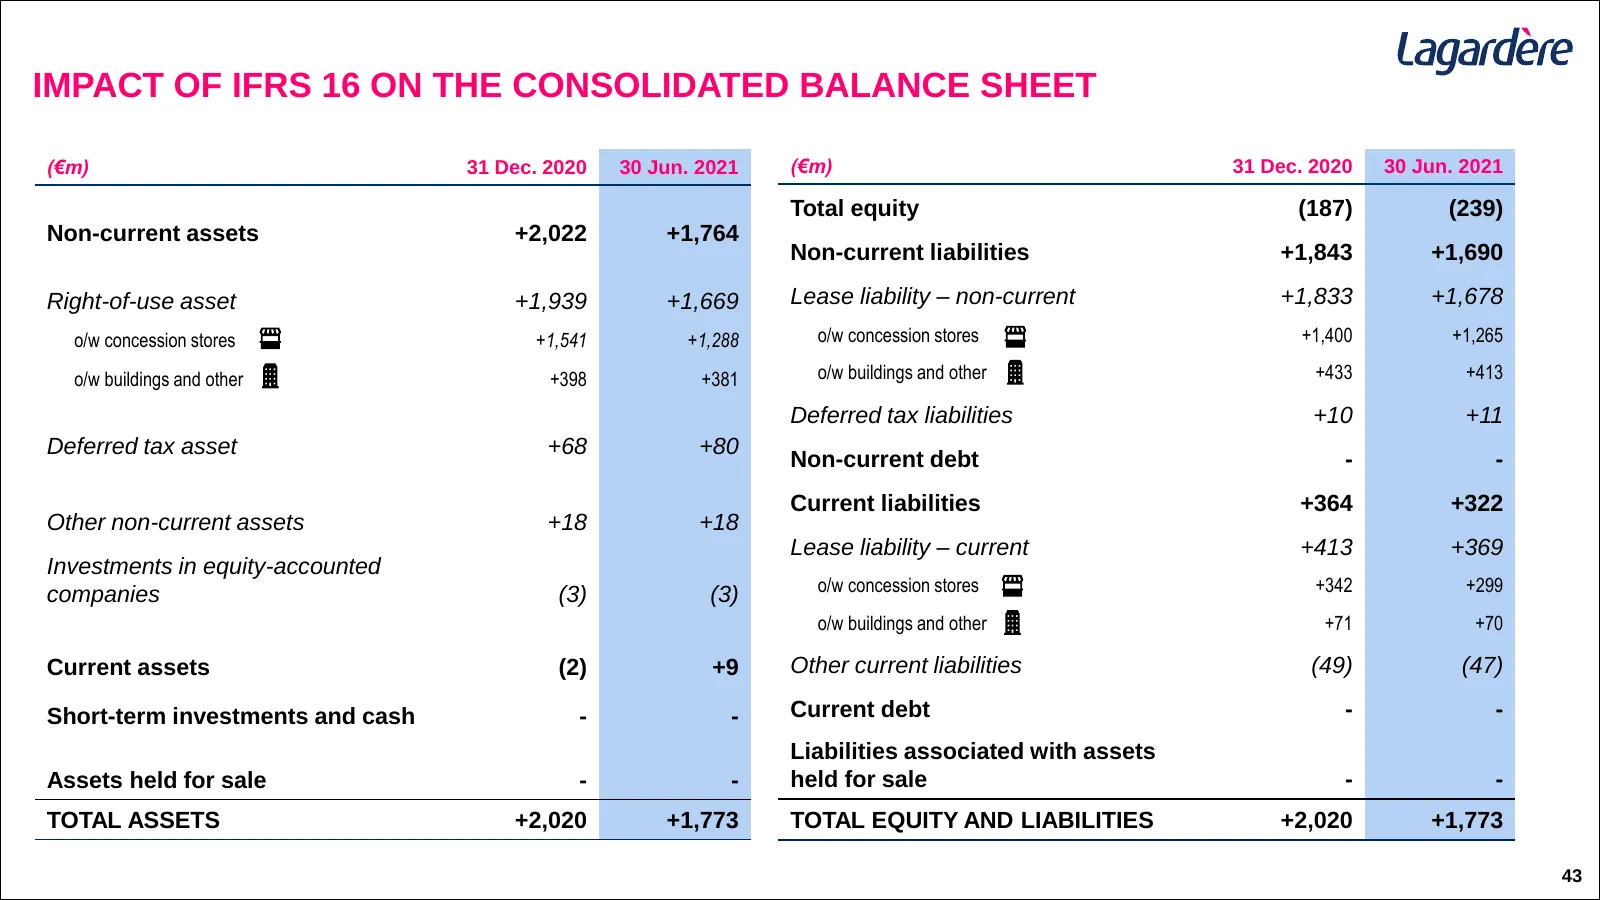
IMPACT OF IFRS 16 ON THE CONSOLIDATED BALANCE SHEET (€m) 31 Dec. 2020 30 Jun. 2021 (€m) 31 Dec. 2020 30 Jun. 2021 Total equity (187) (239) Non-current assets +2,022 +1,764 Non-current liabilities +1,843 +1,690 Right-of-use asset +1,939 +1,669 Lease liability – non-current +1,833 +1,678 o/w concessio

Slide 44: Glossary
GLOSSARY
Slide 45: Glossary (1/3)
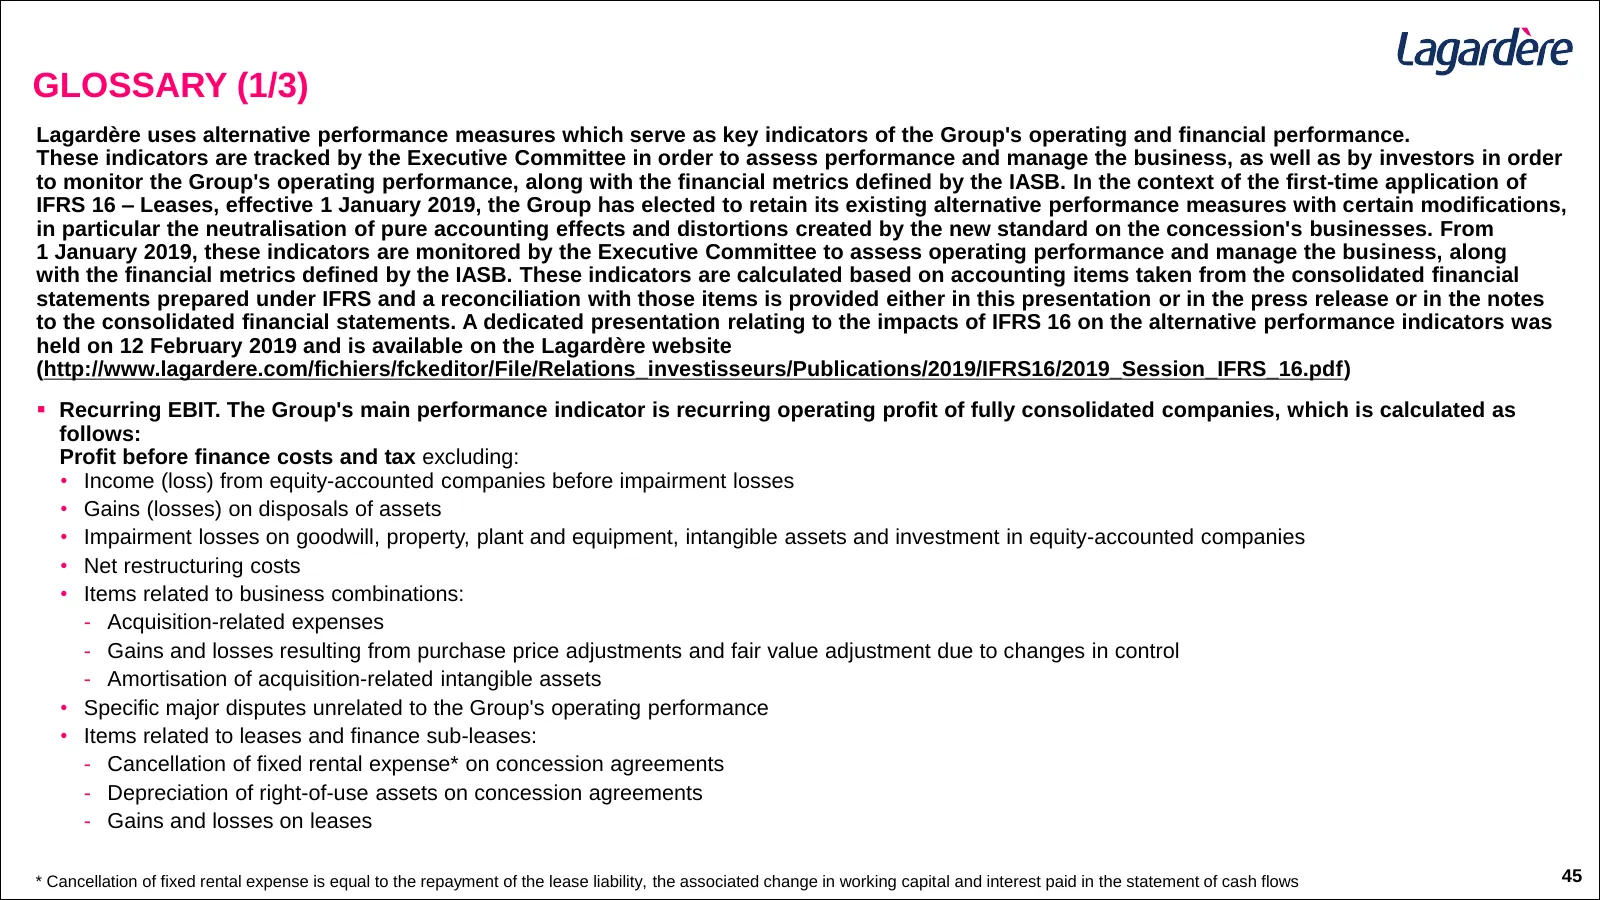
GLOSSARY (1/3) Lagardère uses alternative performance measures which serve as key indicators of the Group's operating and financial performance. These indicators are tracked by the Executive Committee in order to assess performance and manage the business, as well as by investors in order to monitor
Slide 46: Glossary (2/3)
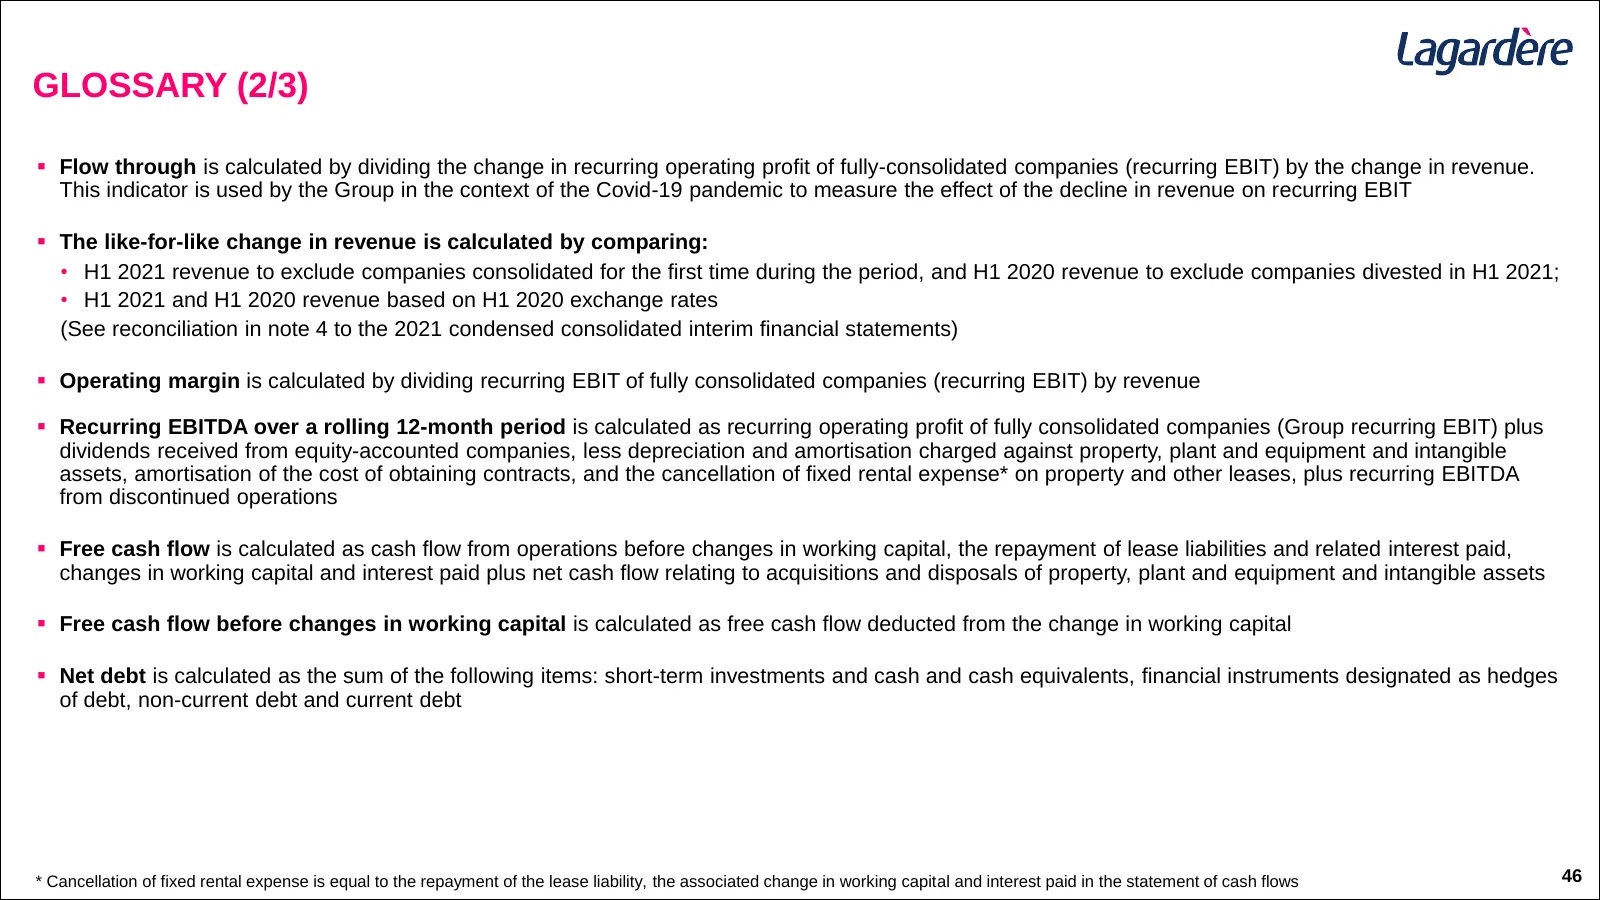
GLOSSARY (2/3) ▪ Flow through is calculated by dividing the change in recurring operating profit of fully-consolidated companies (recurring EBIT) by the change in revenue. This indicator is used by the Group in the context of the Covid-19 pandemic to measure the effect of the decline in revenue on r
Slide 47: Glossary (3/3)
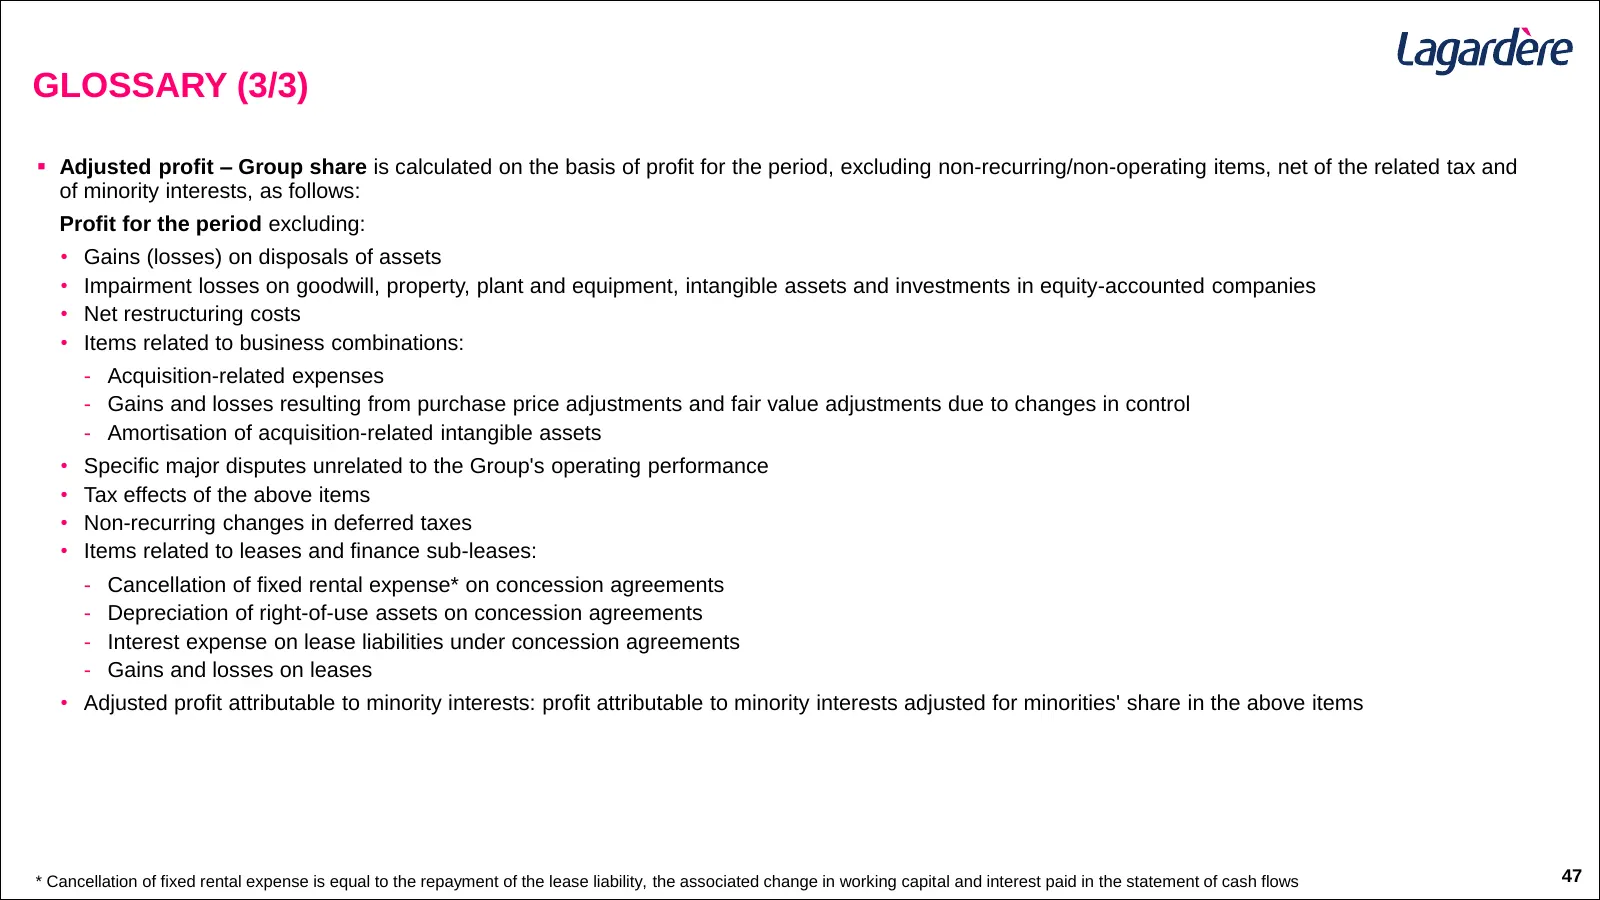
GLOSSARY (3/3) ▪ Adjusted profit – Group share is calculated on the basis of profit for the period, excluding non-recurring/non-operating items, net of the related tax and of minority interests, as follows: Profit for the period excluding: • Gains (losses) on disposals of assets • Impairment losses
Source: Internet Archive copy of lagardere.com
More decks from Lagardere SA
 Debt Investor Presentation (September 2026)47 slides · September 2026
 H1 2026 Earnings Presentation36 slides · Jul 28, 2026
 Shareholder Meeting (May 2026)101 slides · May 5, 2026
 Shareholder Meeting (May 2026)101 slides · May 5, 2026
 Q1 2026 Earnings Presentation14 slides · Apr 16, 2026
 FY2025 Earnings Presentation44 slides · Feb 19, 2026