South Financial — Q2 2008 Earnings Presentation
21 slides from South Financial's earnings presentation, Jul 22, 2008
Slide 1: Second Quarter 2008 Financial Review
Second Quarter 2008 Financial Review July 23, 2008
Slide 2: Forward-Looking Statements and Non-GAAP Financial Information
Forward-Looking Statements and Non-GAAP Financial Information The forward-looking statements, as defined in the applicable federal securities laws, being made today are subject to risks and uncertainties. TSFG’s actual results may differ materially from those set forth in such forward-looking statem
Slide 3: 2Q08 Highlights
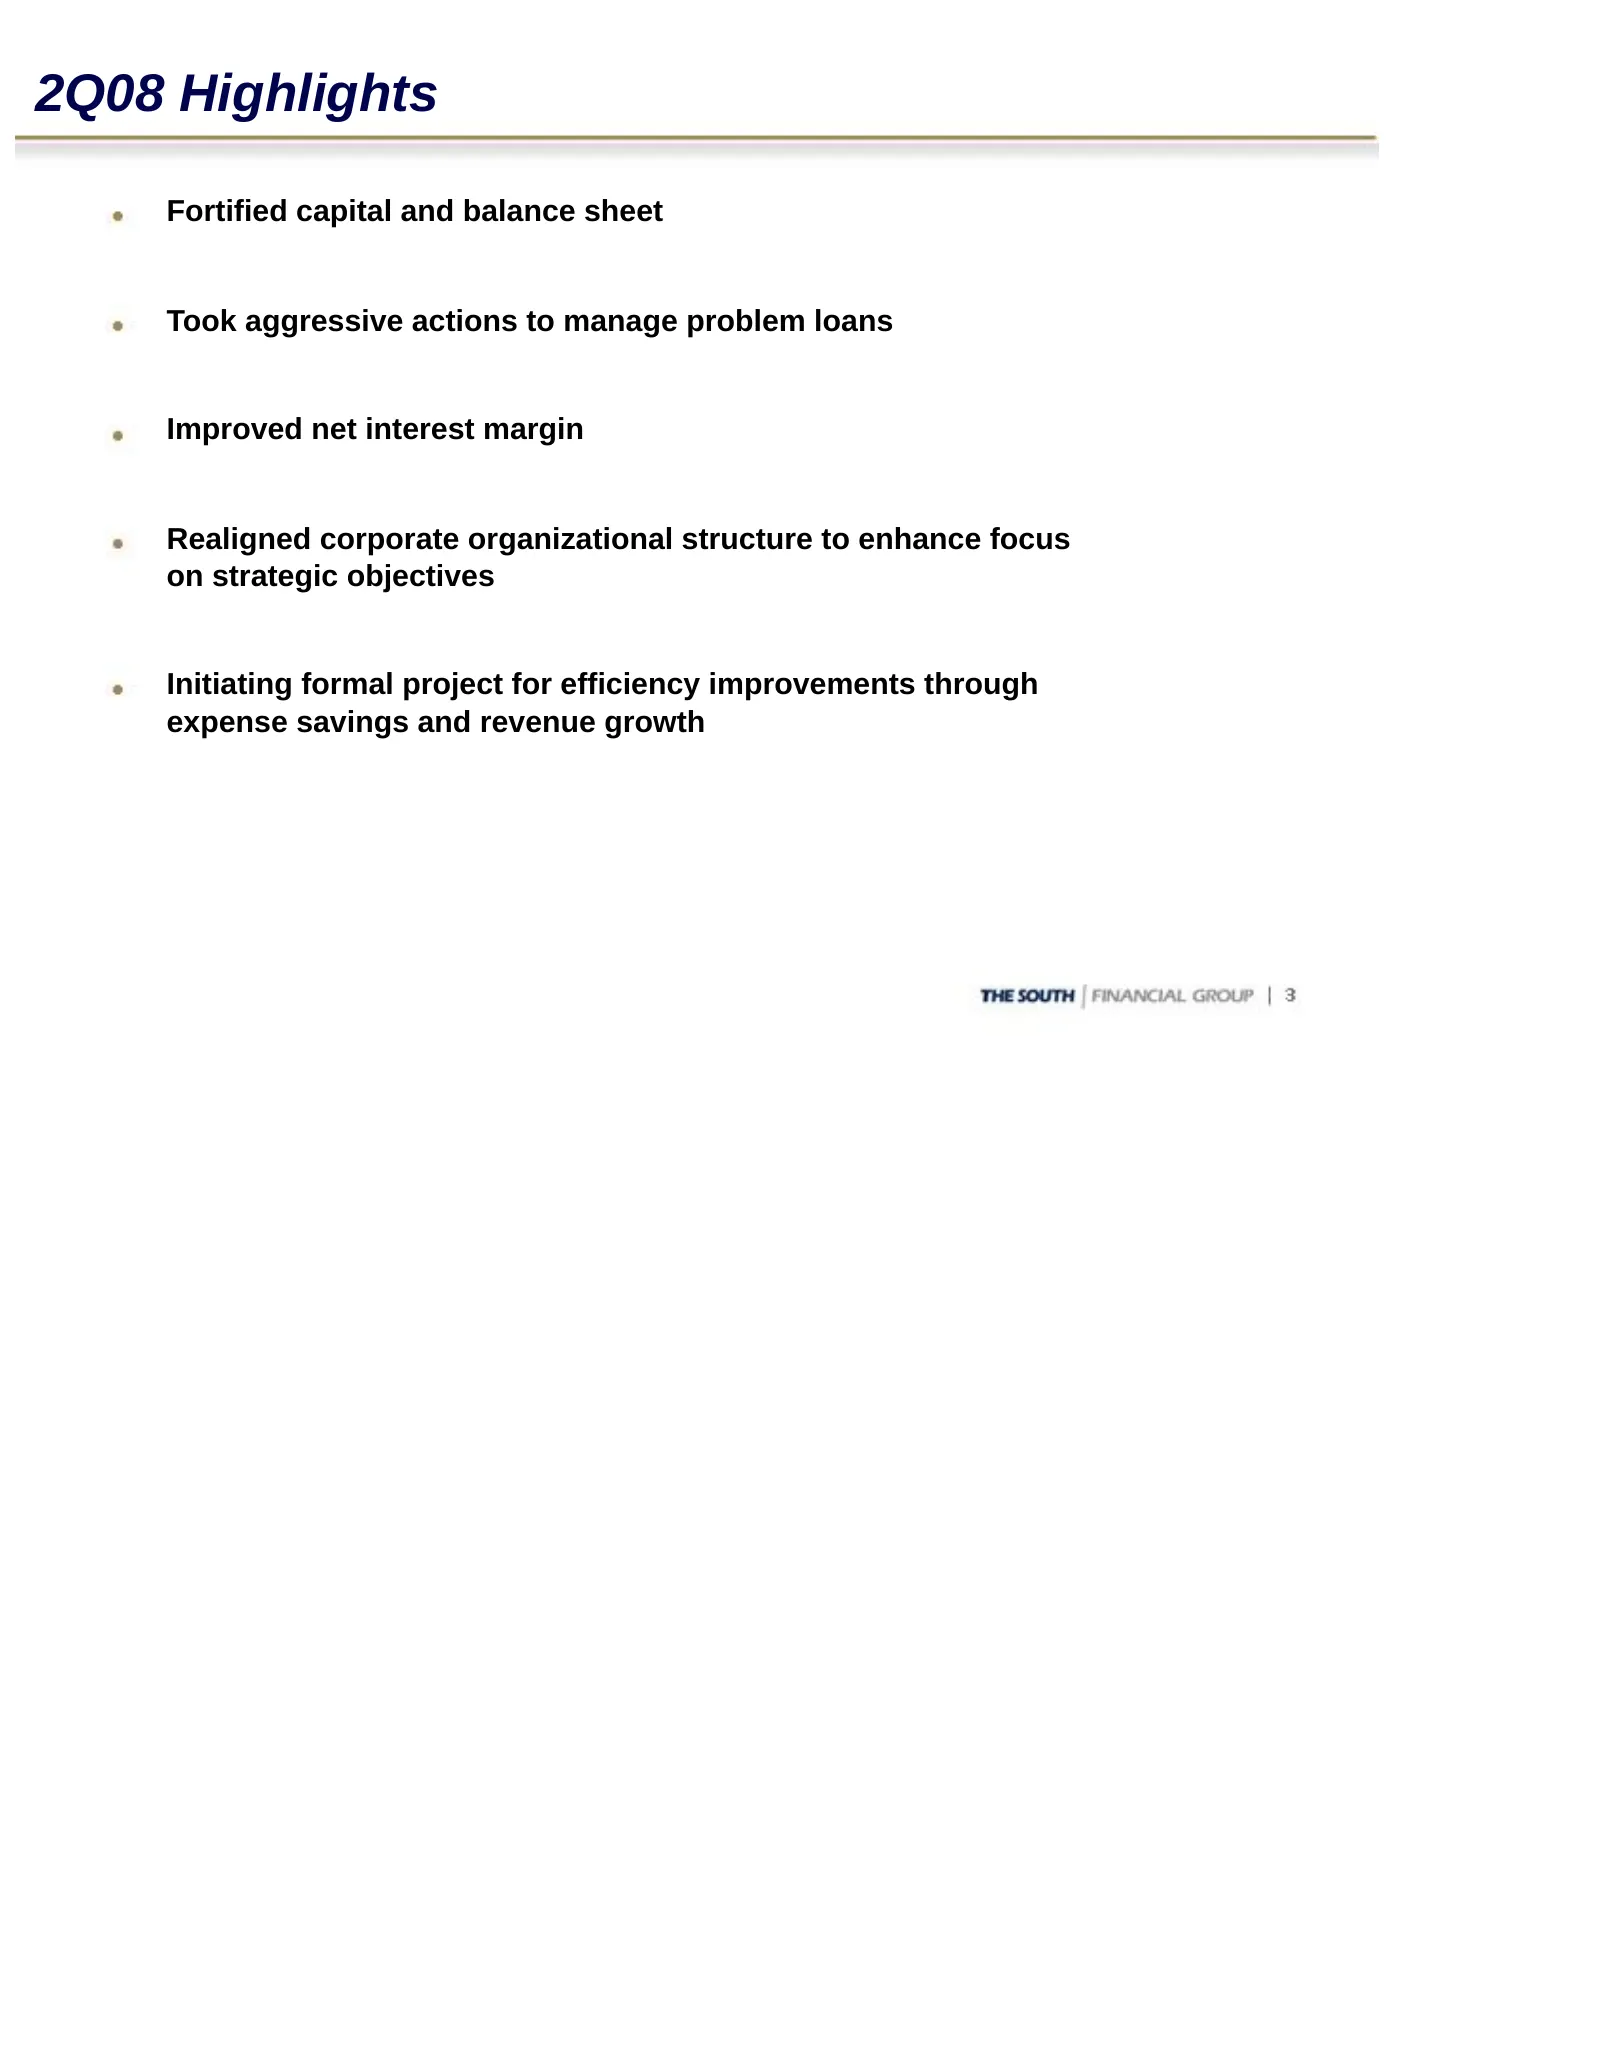
2Q08 Highlights Fortified capital and balance sheet Took aggressive actions to manage problem loans Improved net interest margin Realigned corporate organizational structure to enhance focus on strategic objectives Initiating formal project for efficiency improvements through expense savings and rev
Slide 4: 2Q08 Financial Results
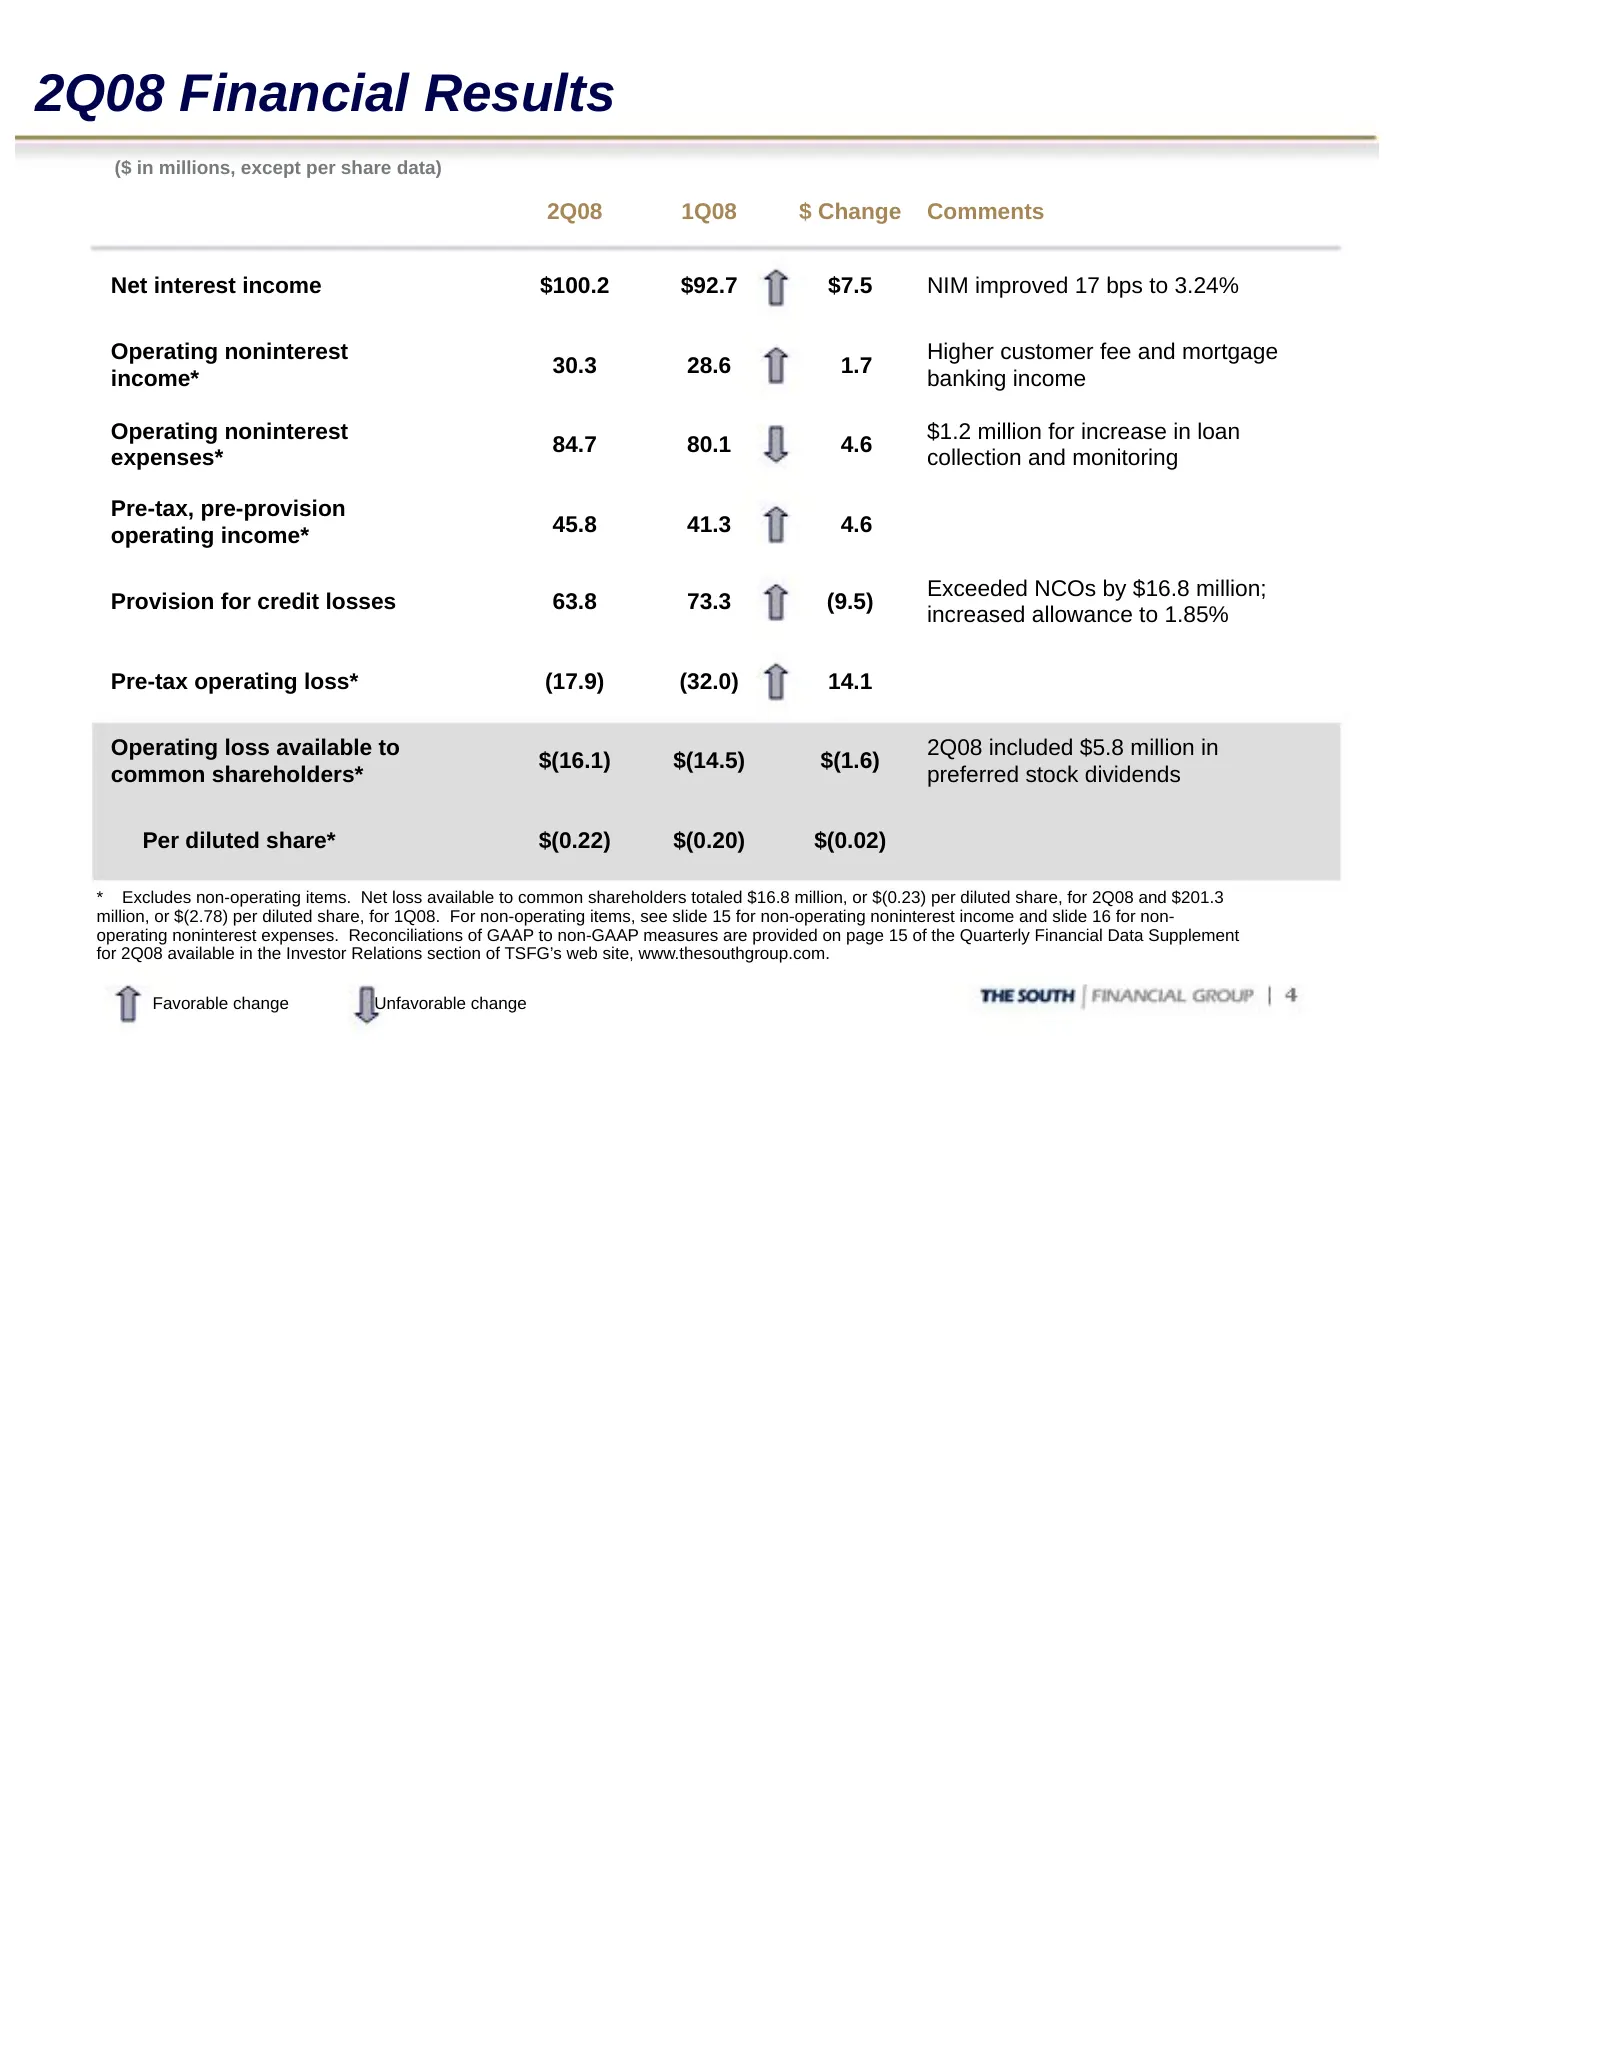
2Q08 Financial Results ($ in millions, except per share data) 2Q08 1Q08 $ Change Comments Net interest income $100.2 $92.7 $7.5 NIM improved 17 bps to 3.24% Operating noninterest Higher customer fee and mortgage 30.3 28.6 1.7 income* banking income Operating noninterest $1.2 million for increase in
Slide 5: Credit Quality Results
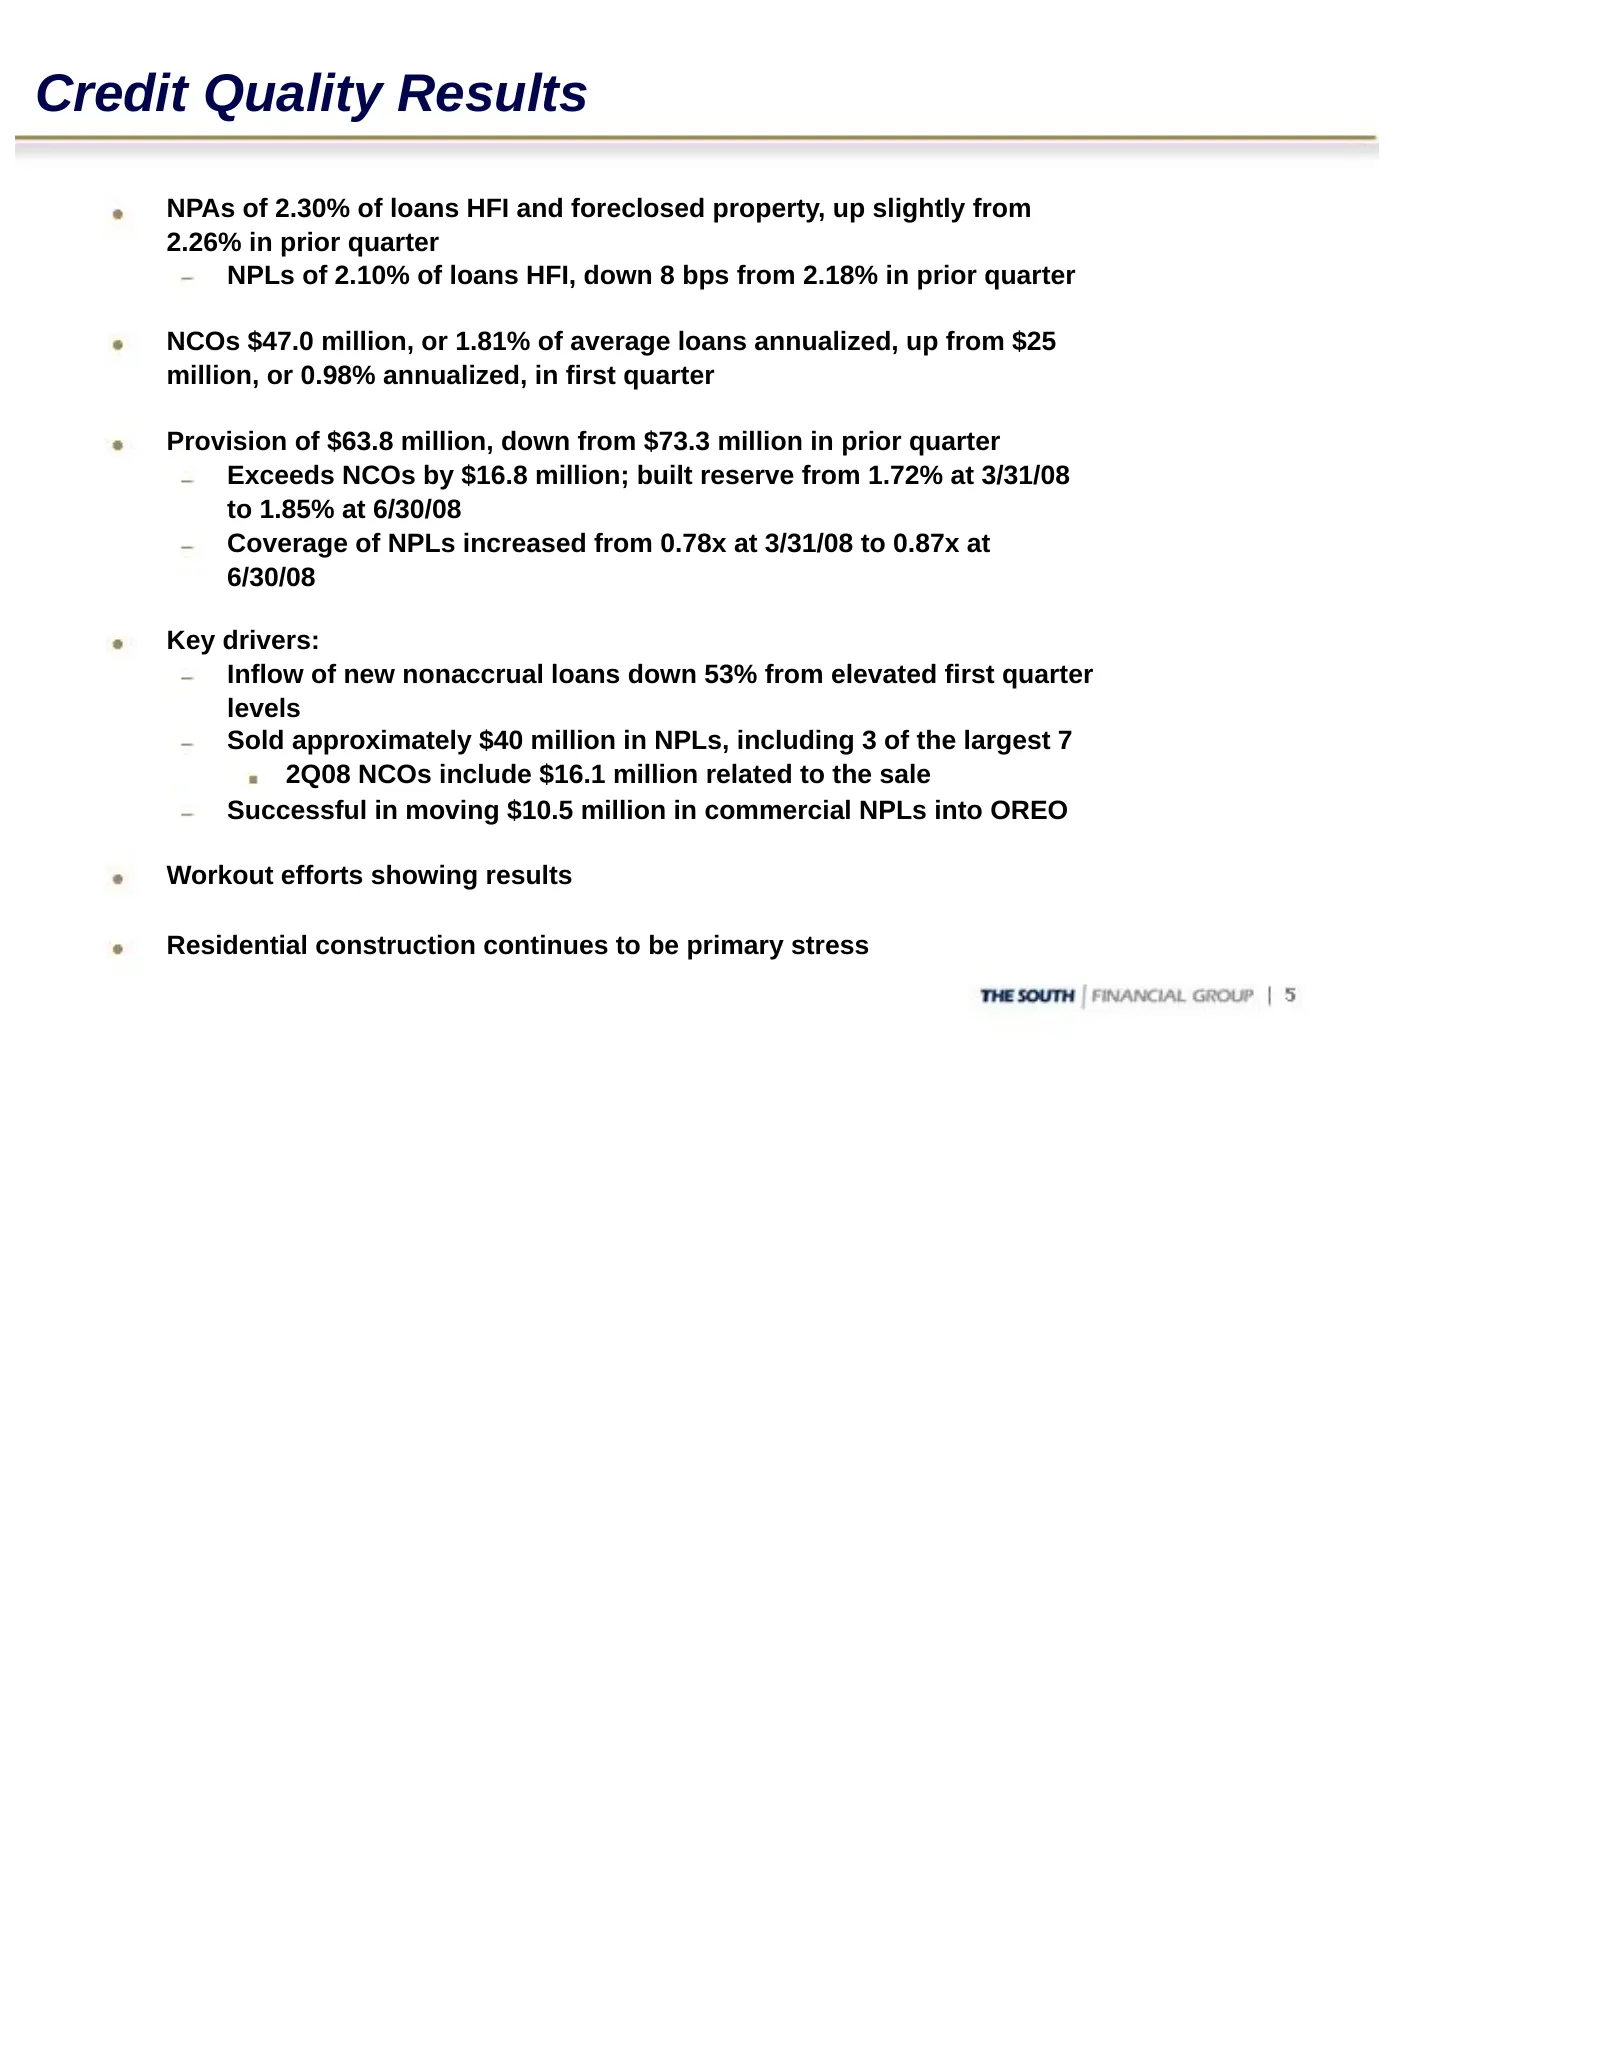
Credit Quality Results NPAs of 2.30% of loans HFI and foreclosed property, up slightly from 2.26% in prior quarter NPLs of 2.10% of loans HFI, down 8 bps from 2.18% in prior quarter NCOs $47.0 million, or 1.81% of average loans annualized, up from $25 million, or 0.98% annualized, in first quarter P
Slide 6: Loan and Credit Quality Composition
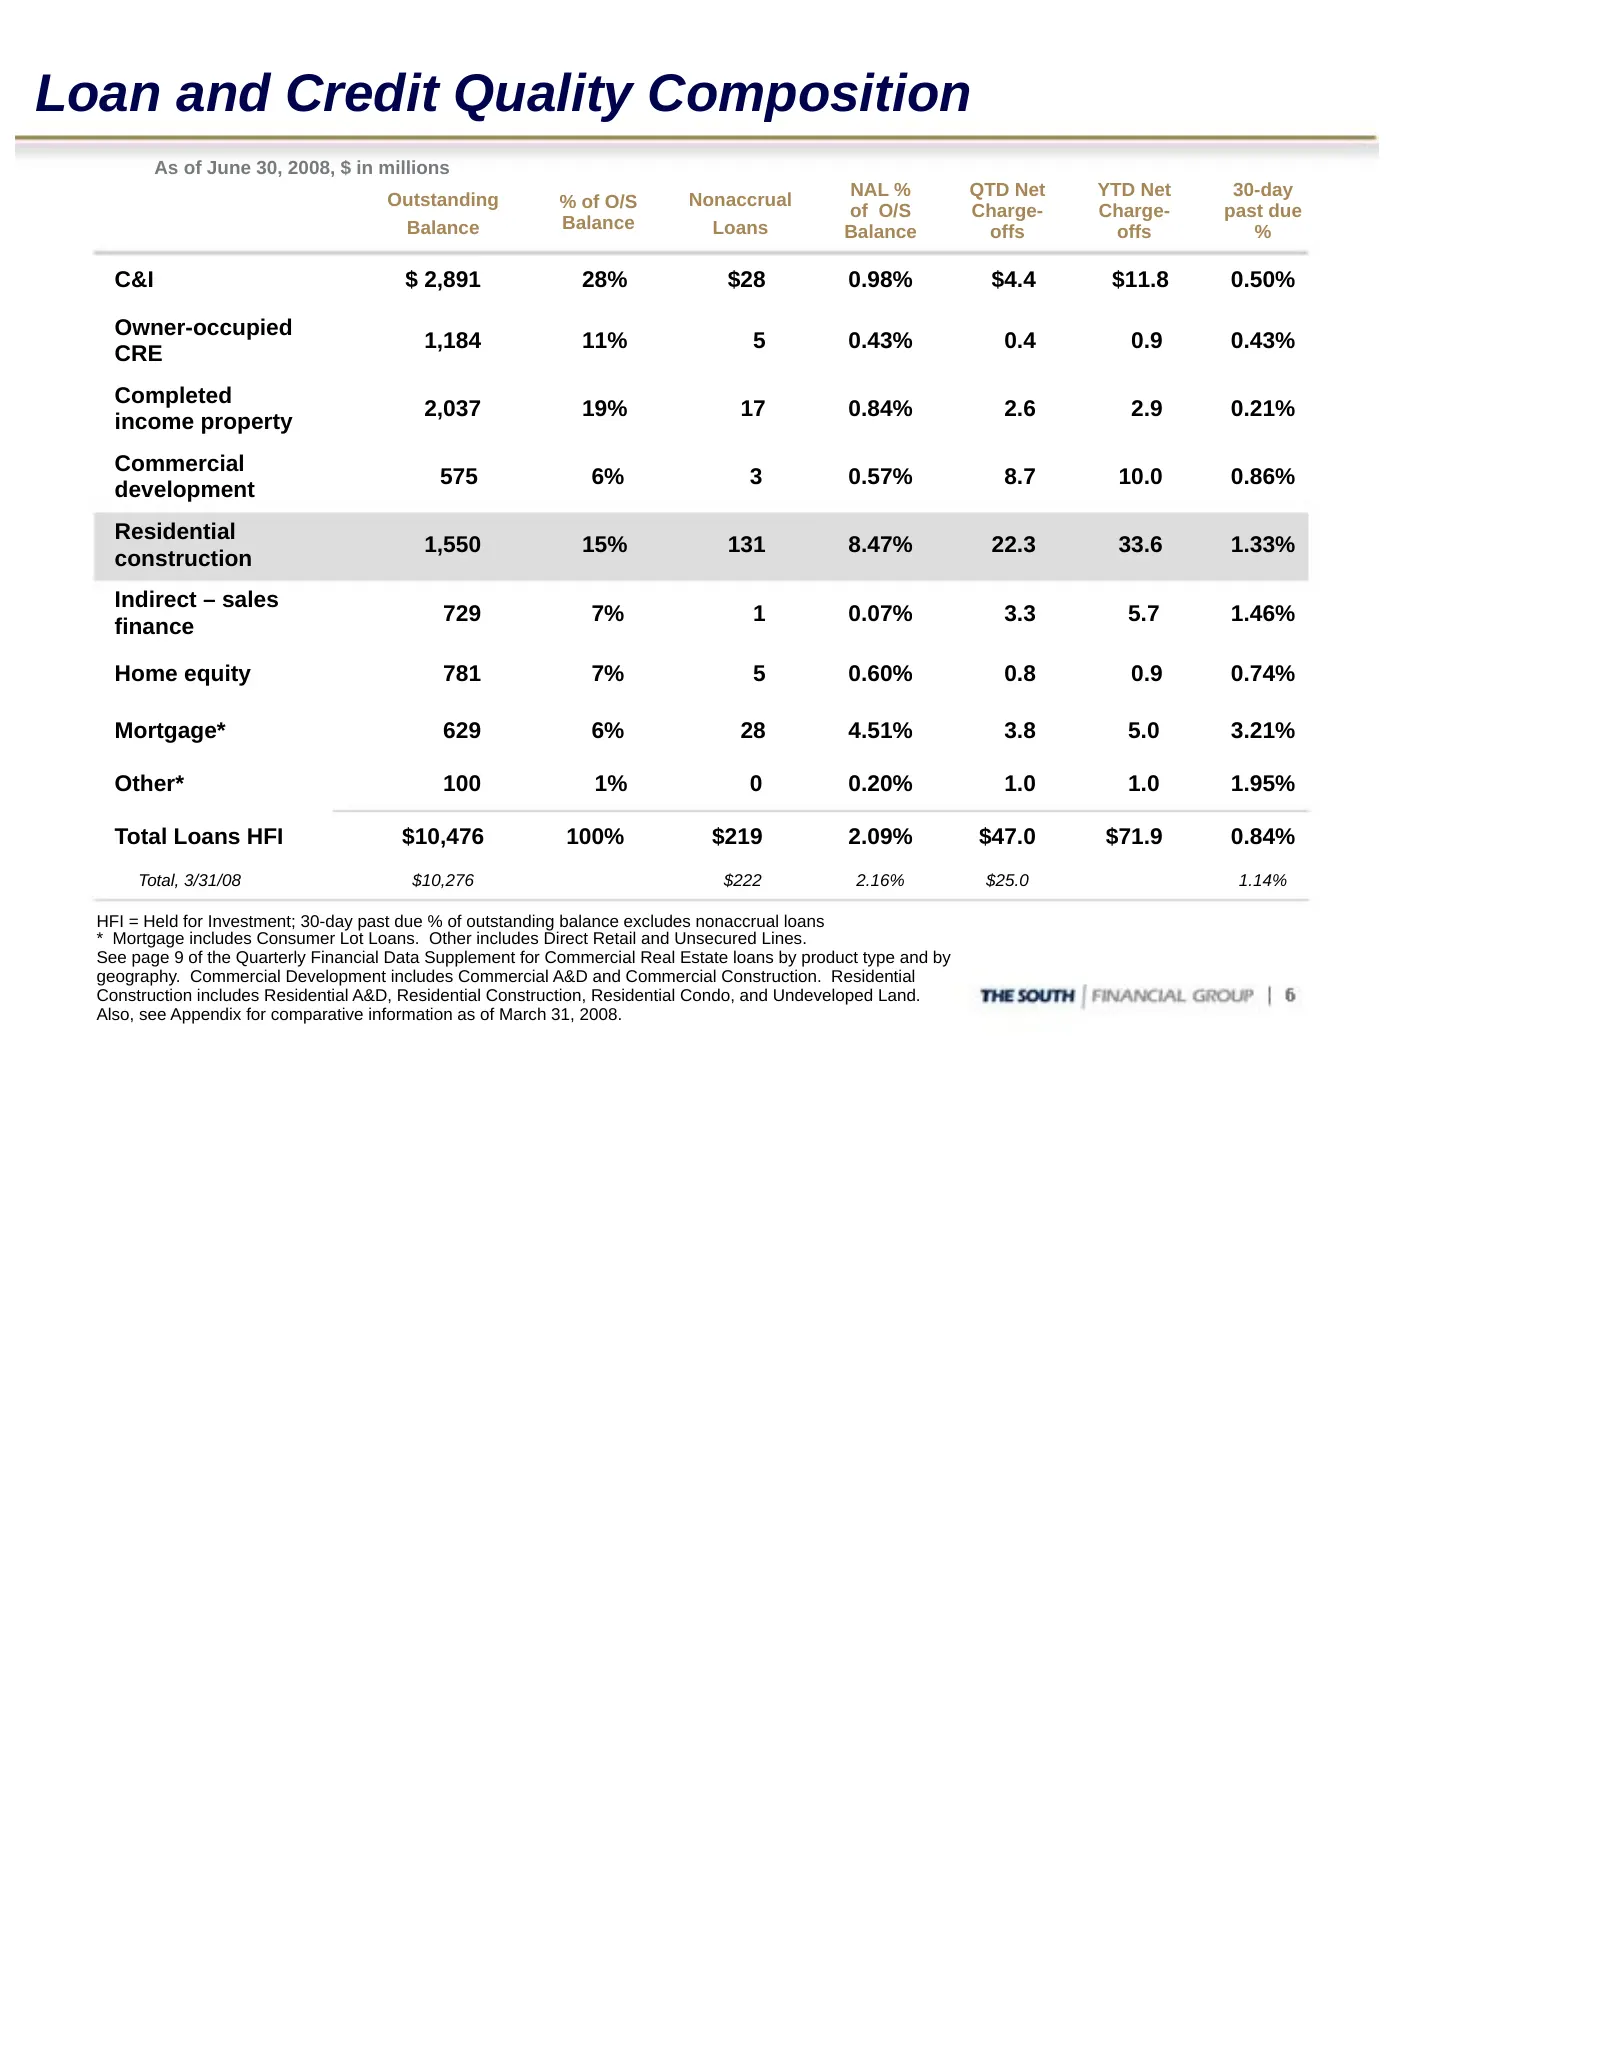
Loan and Credit Quality Composition As of June 30, 2008, $ in millions NAL % QTD Net YTD Net 30-day Outstanding % of O/S Nonaccrual of O/S Charge- Charge- past due Balance Balance Loans Balance offs offs % C&I $ 2,891 28% $28 0.98% $4.4 $11.8 0.50% Owner-occupied 1,184 11% 5 0.43% 0.4 0.9 0.43% CRE
Slide 7: Residential Construction by Geography
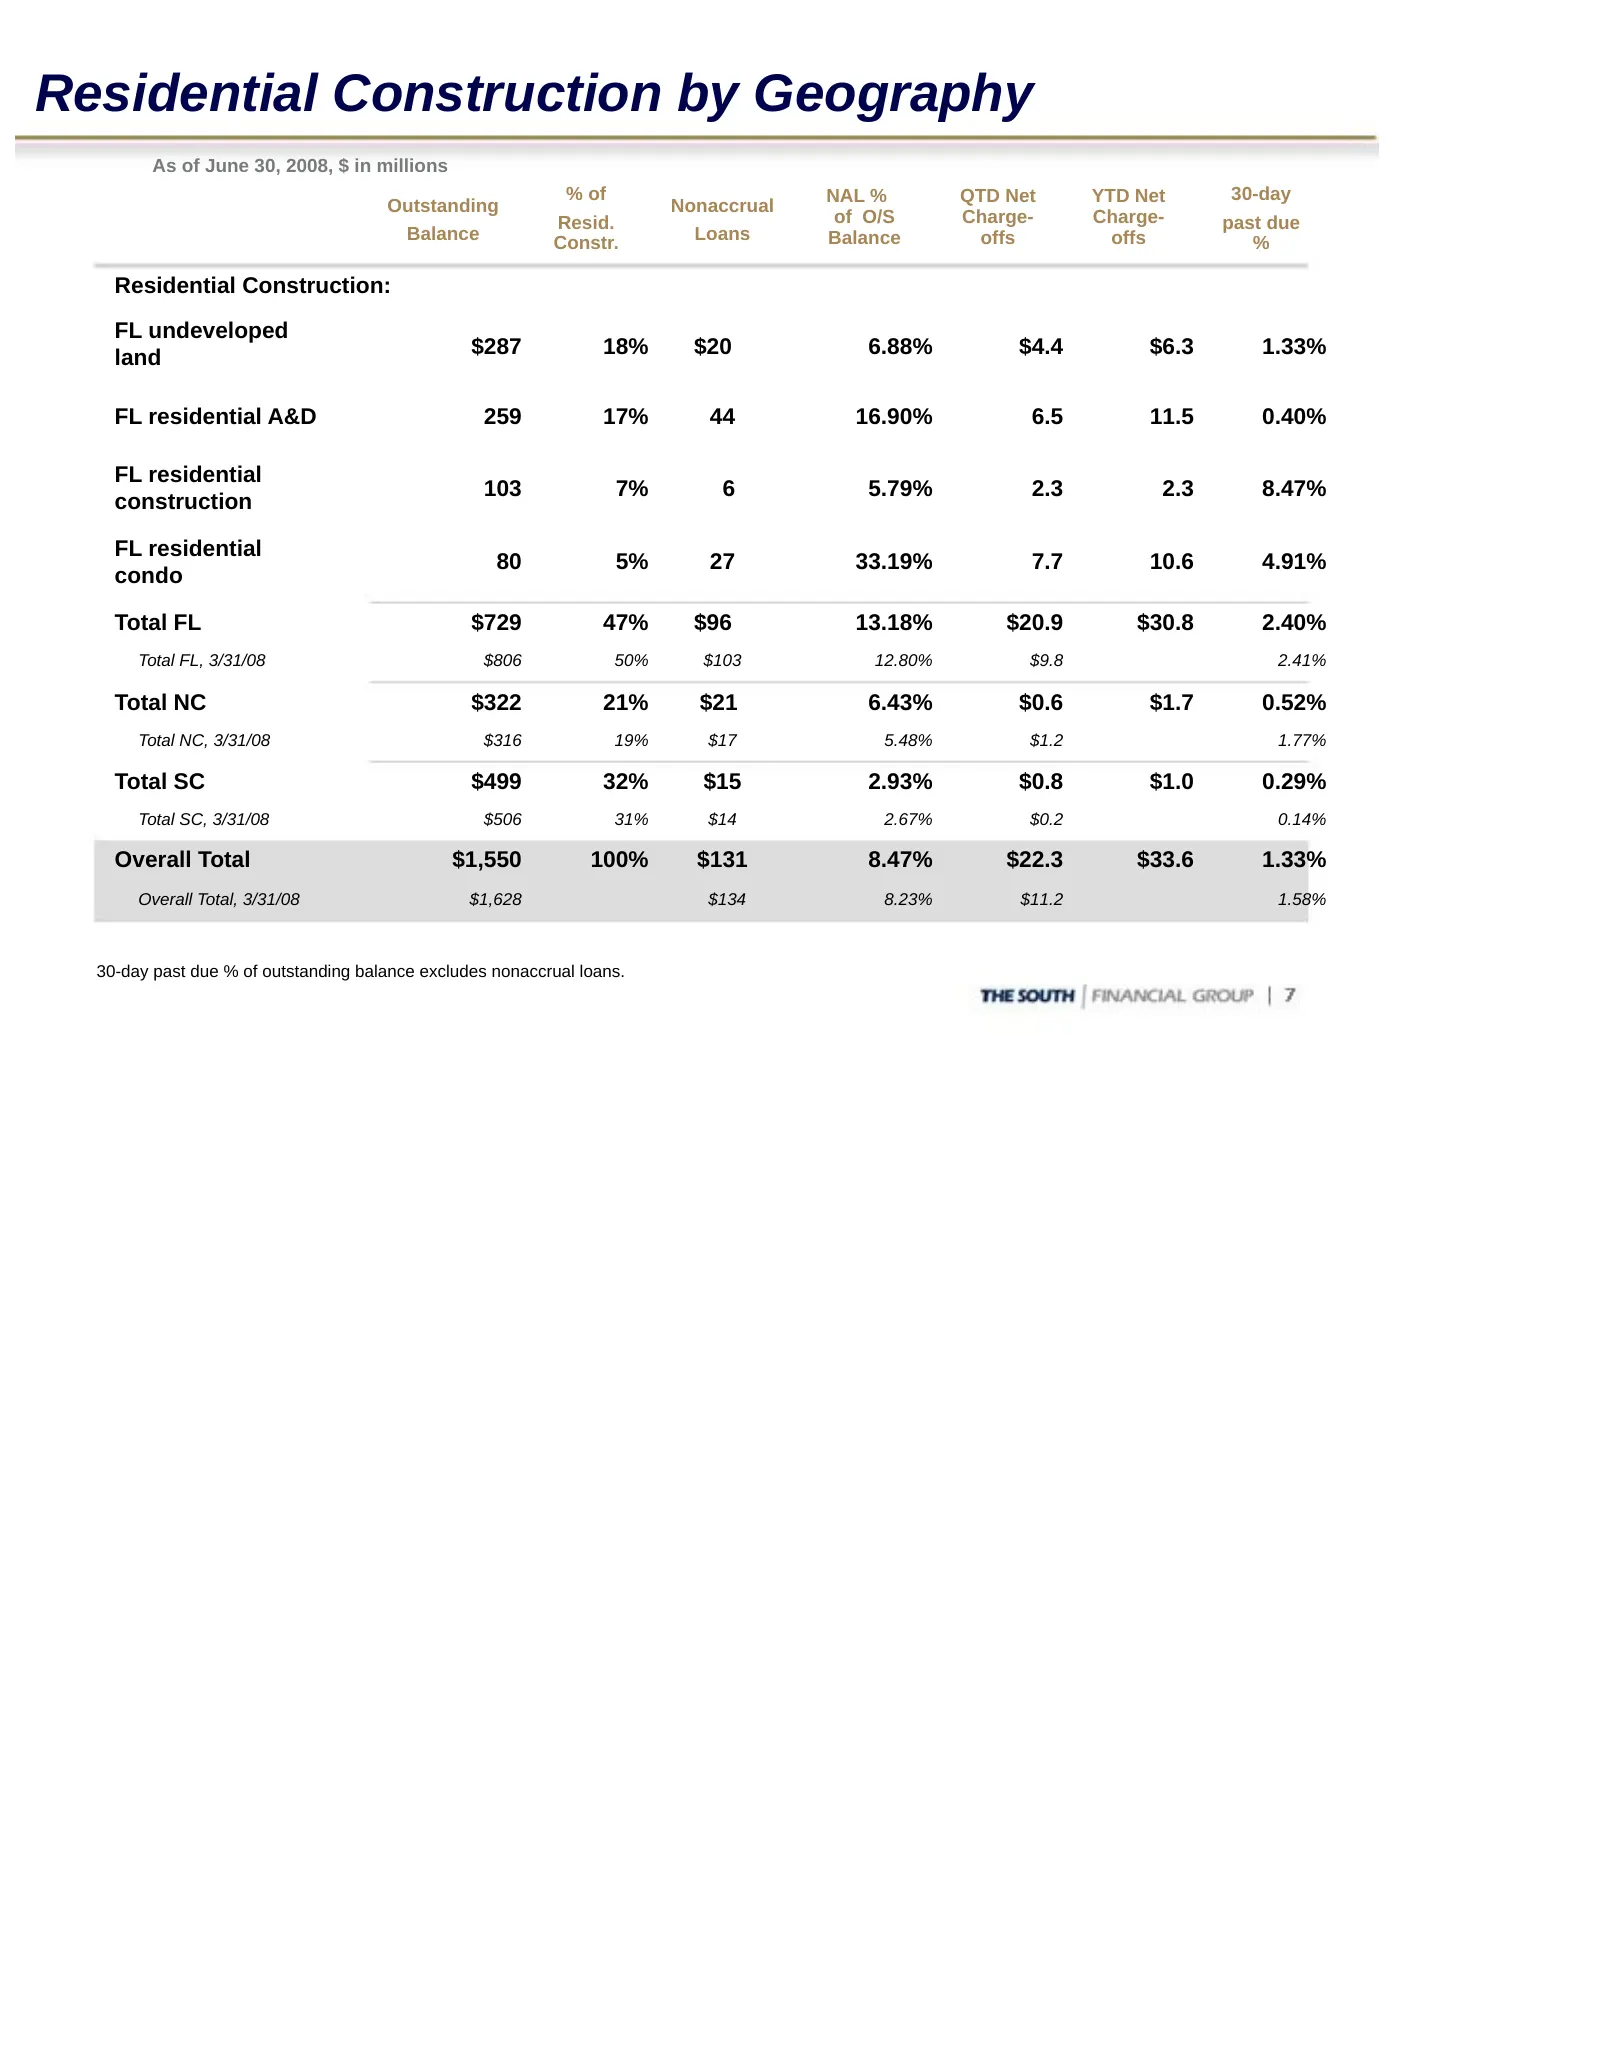
Residential Construction by Geography As of June 30, 2008, $ in millions % of NAL % QTD Net YTD Net 30-day Outstanding Nonaccrual Resid. of O/S Charge- Charge- past due Balance Constr. Loans Balance offs offs % Residential Construction: FL undeveloped land $287 18% $20 6.88% $4.4 $6.3 1.33% FL resid
Slide 8: Home Equity Lines/Loans
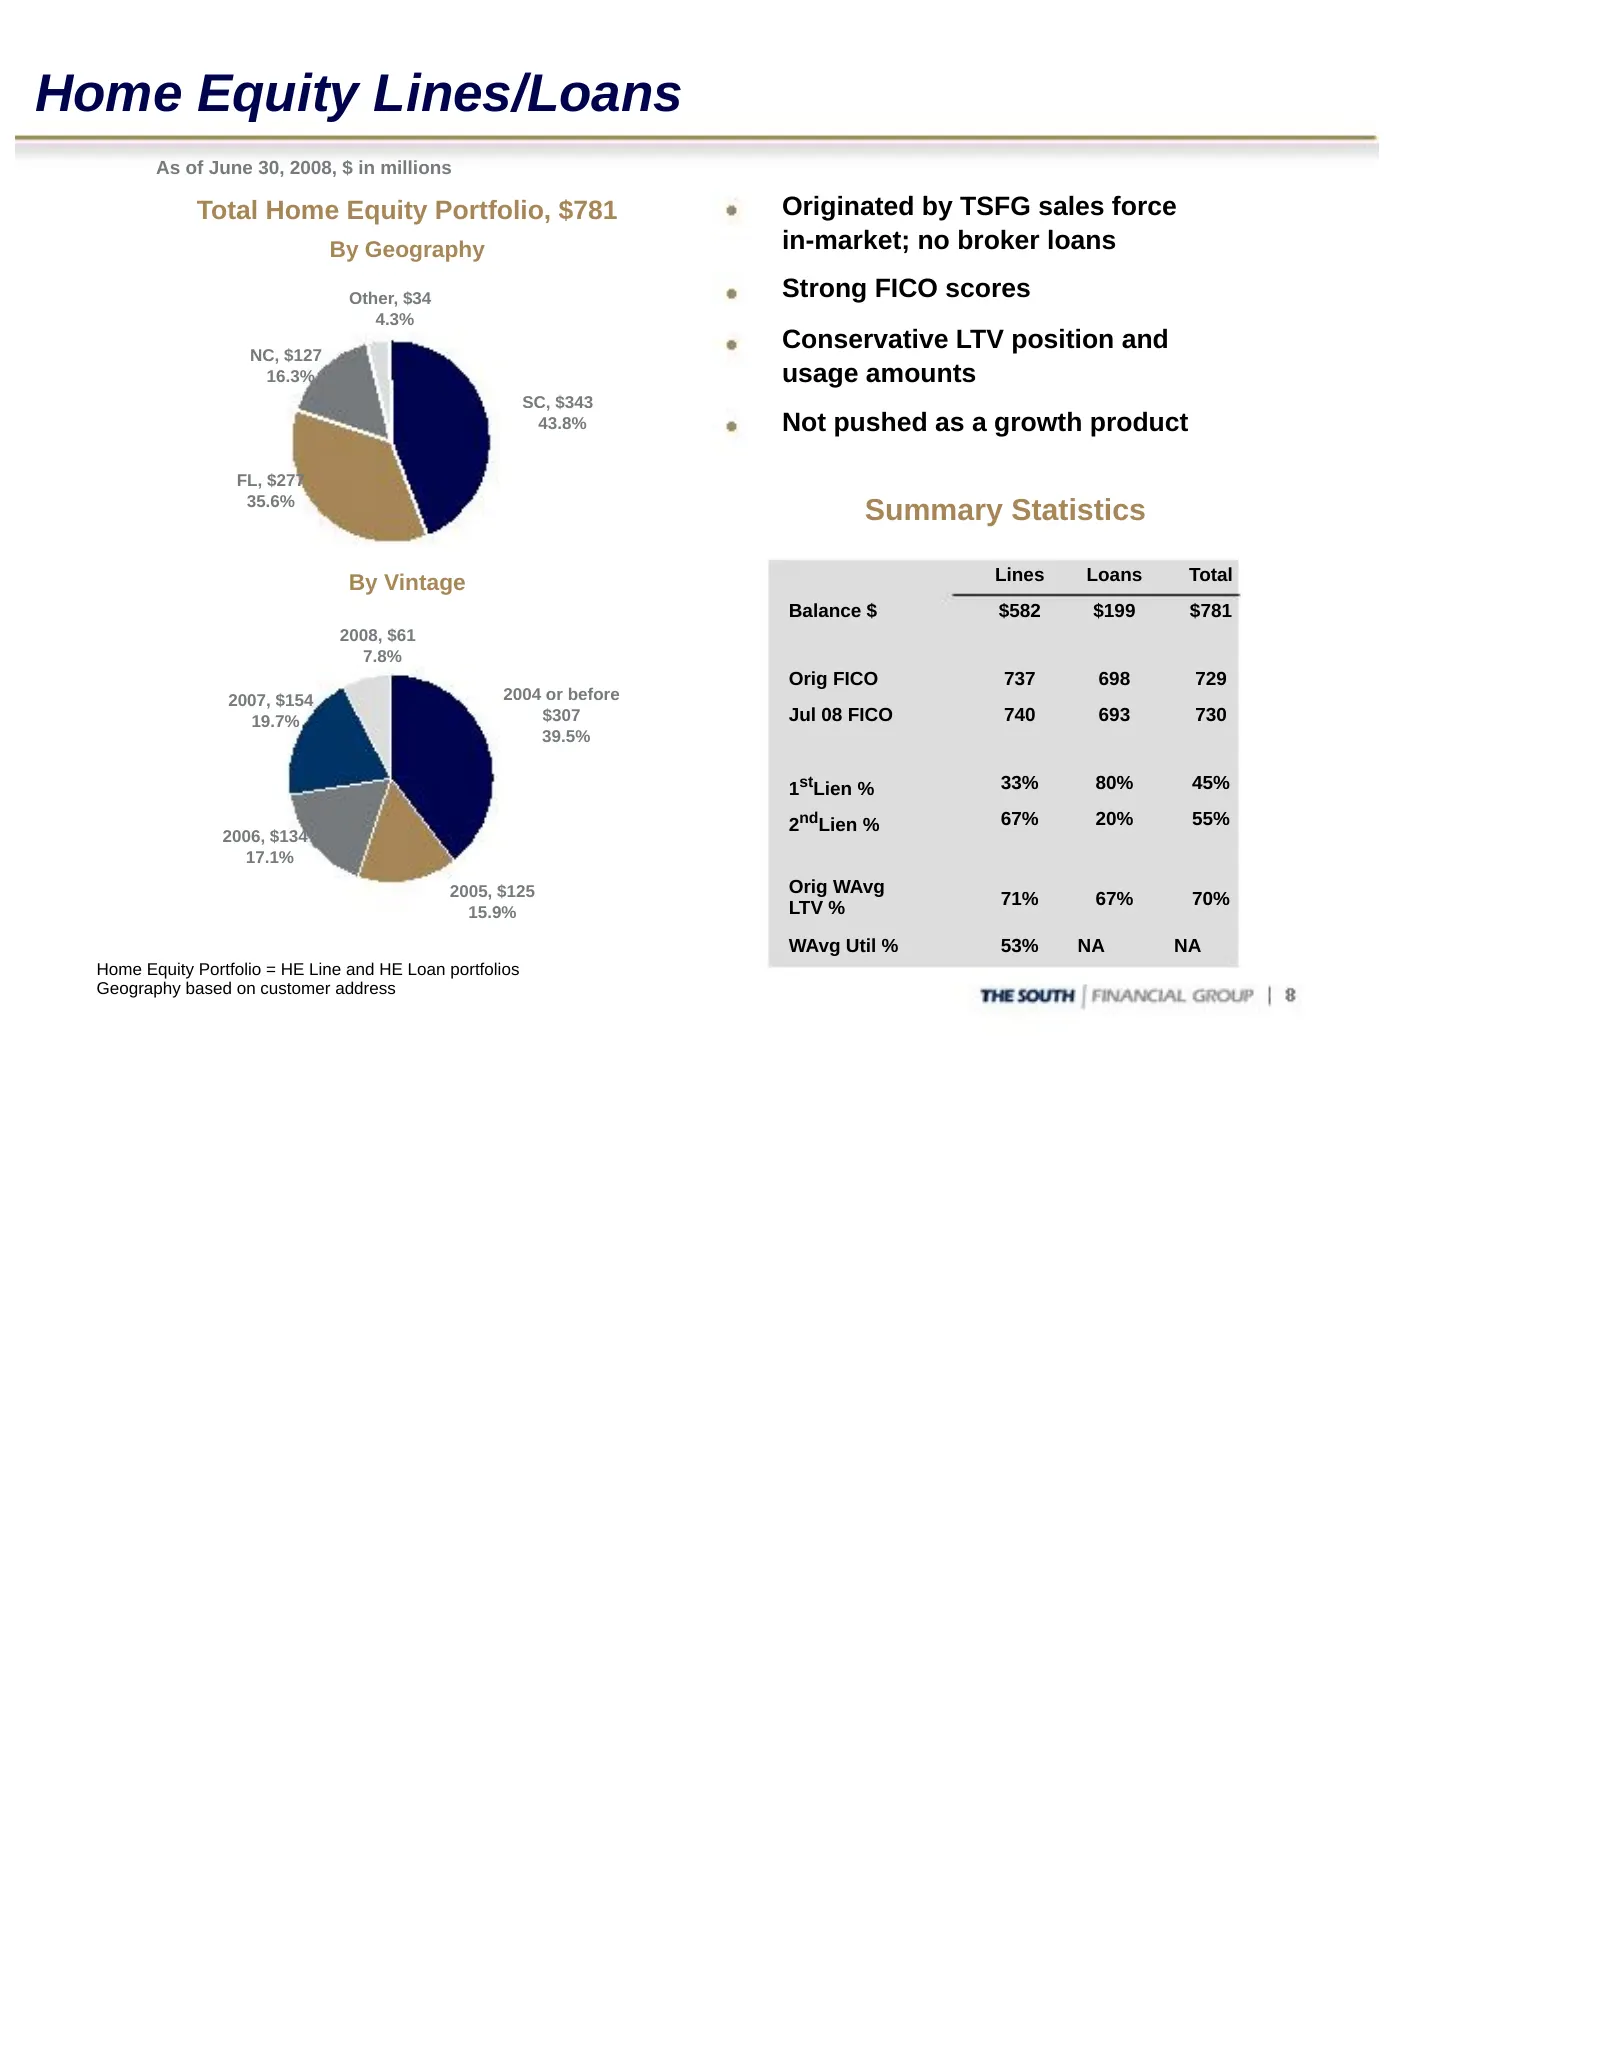
Home Equity Lines/Loans As of June 30, 2008, $ in millions Total Home Equity Portfolio, $781 Originated by TSFG sales force By Geography in-market; no broker loans Other, $34 Strong FICO scores 4.3% NC, $127 Conservative LTV position and 16.3% usage amounts SC, $343 43.8% Not pushed as a growth prod
Slide 9: Mortgage Portfolio
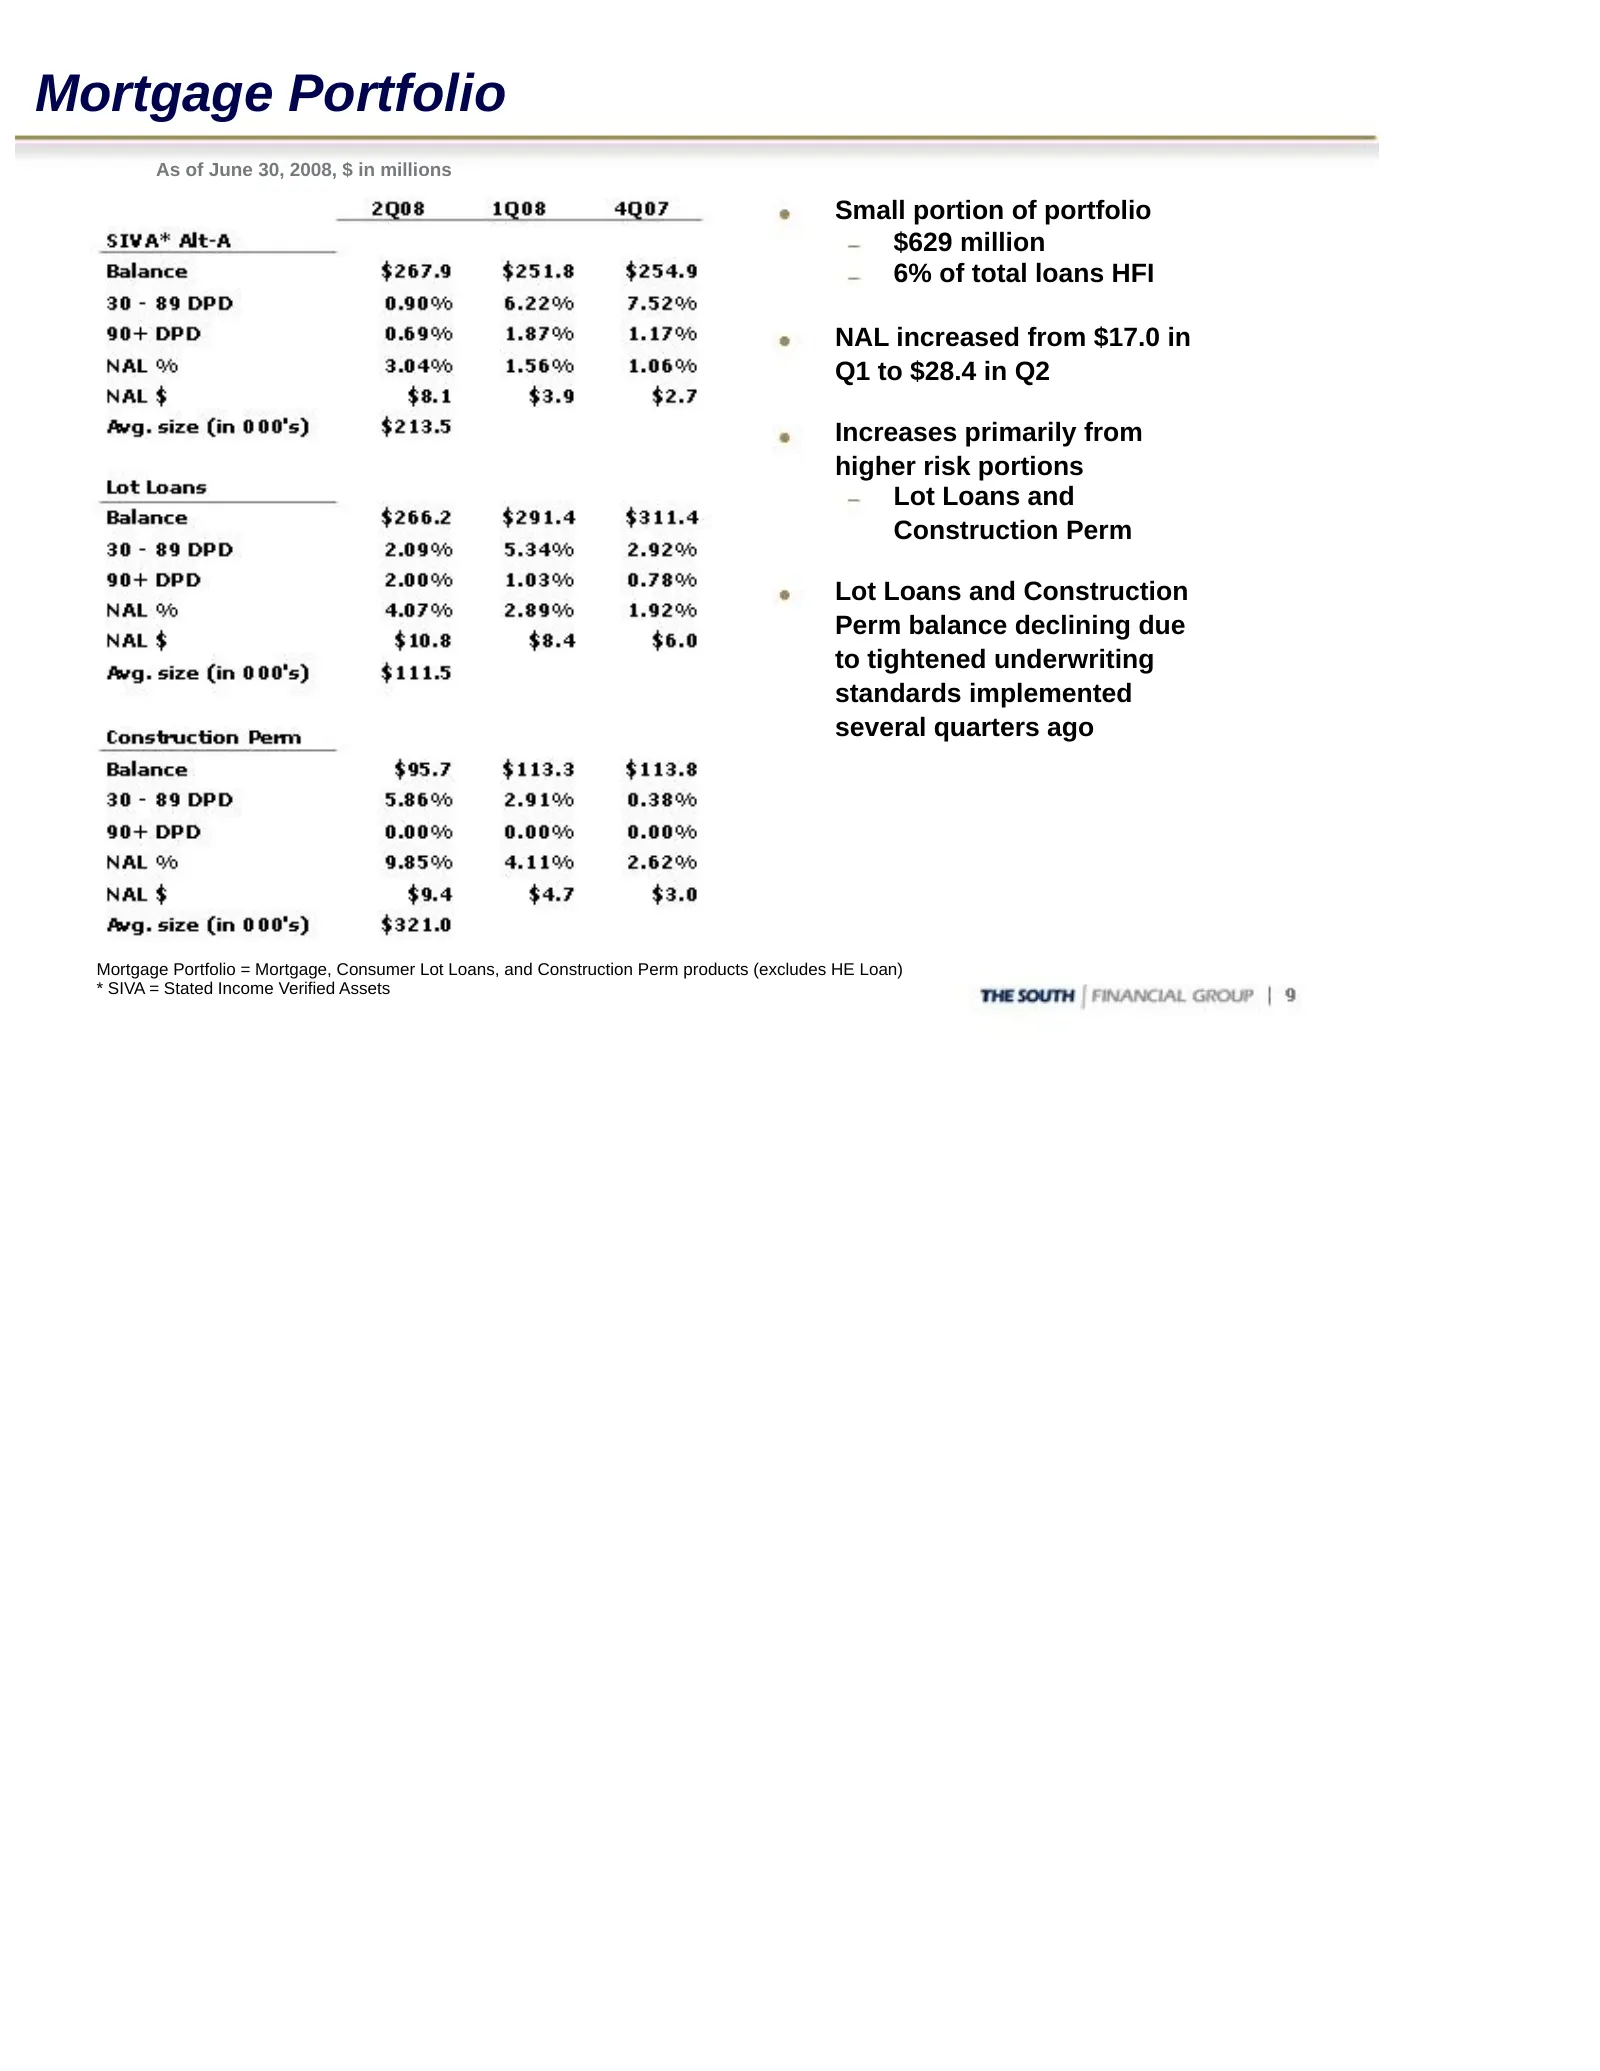
Mortgage Portfolio As of June 30, 2008, $ in millions Small portion of portfolio $629 million 6% of total loans HFI NAL increased from $17.0 in Q1 to $28.4 in Q2 Increases primarily from higher risk portions Lot Loans and Construction Perm Lot Loans and Construction Perm balance declining due to tig
Slide 10: Balance Sheet Actions
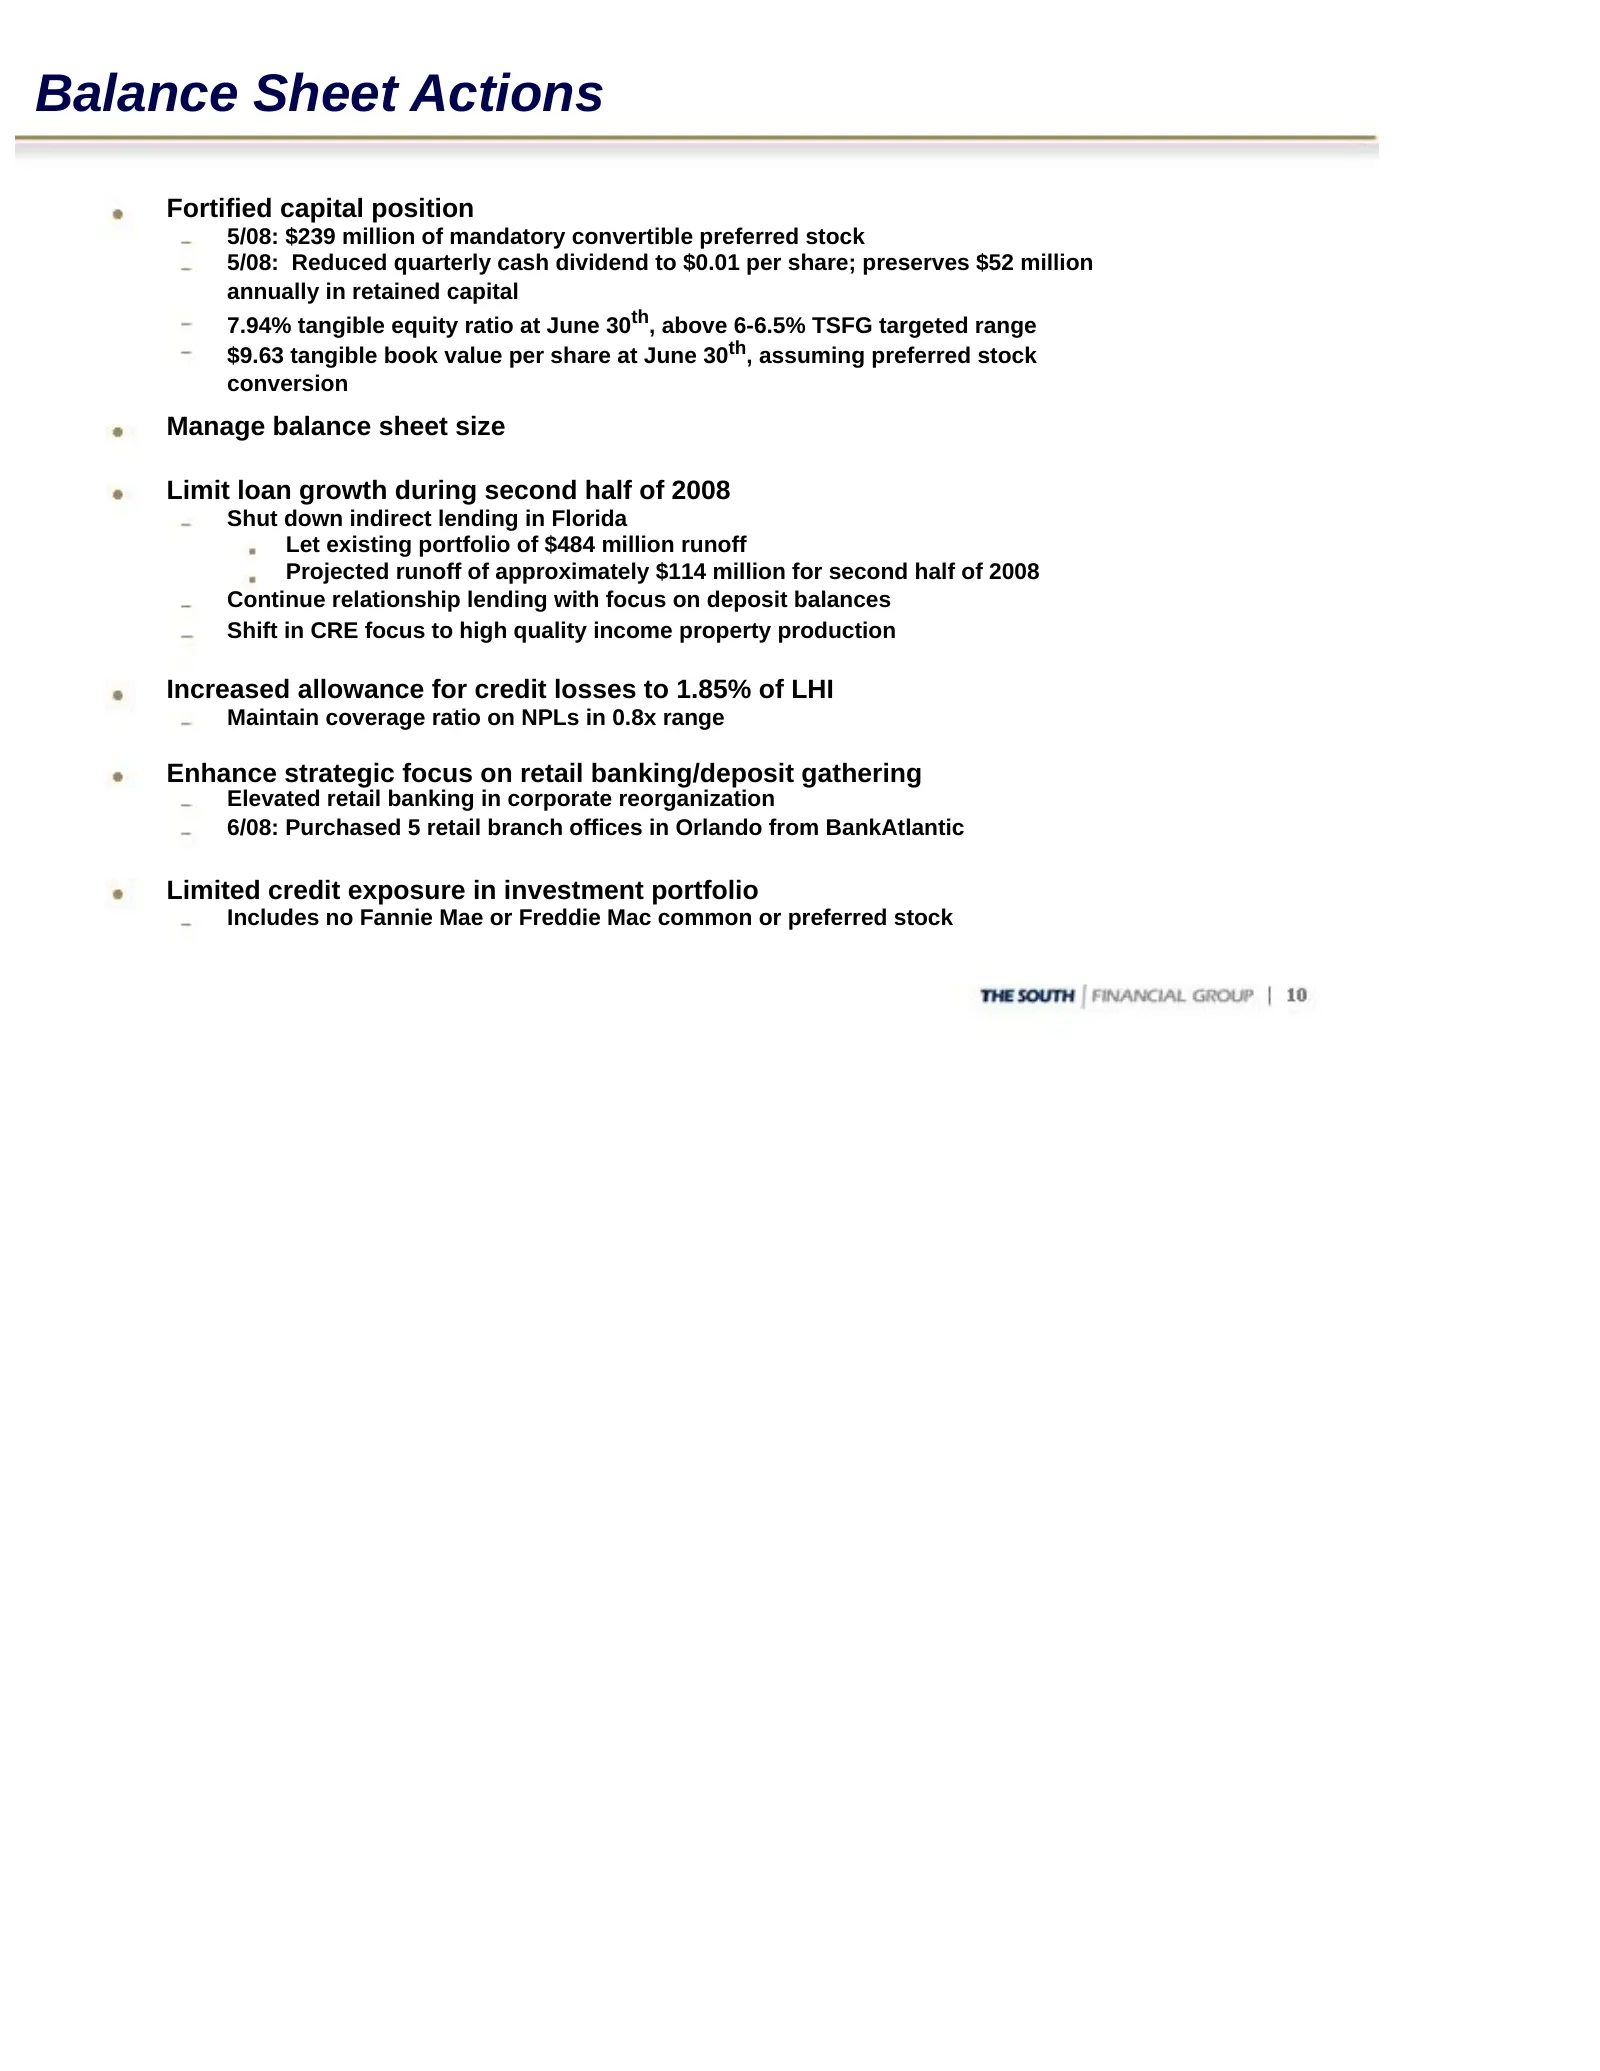
Balance Sheet Actions Fortified capital position 5/08: $239 million of mandatory convertible preferred stock 5/08: Reduced quarterly cash dividend to $0.01 per share; preserves $52 million annually in retained capital 7.94% tangible equity ratio at June 30th, above 6-6.5% TSFG targeted range $9.63 t
Slide 11: Capital Position
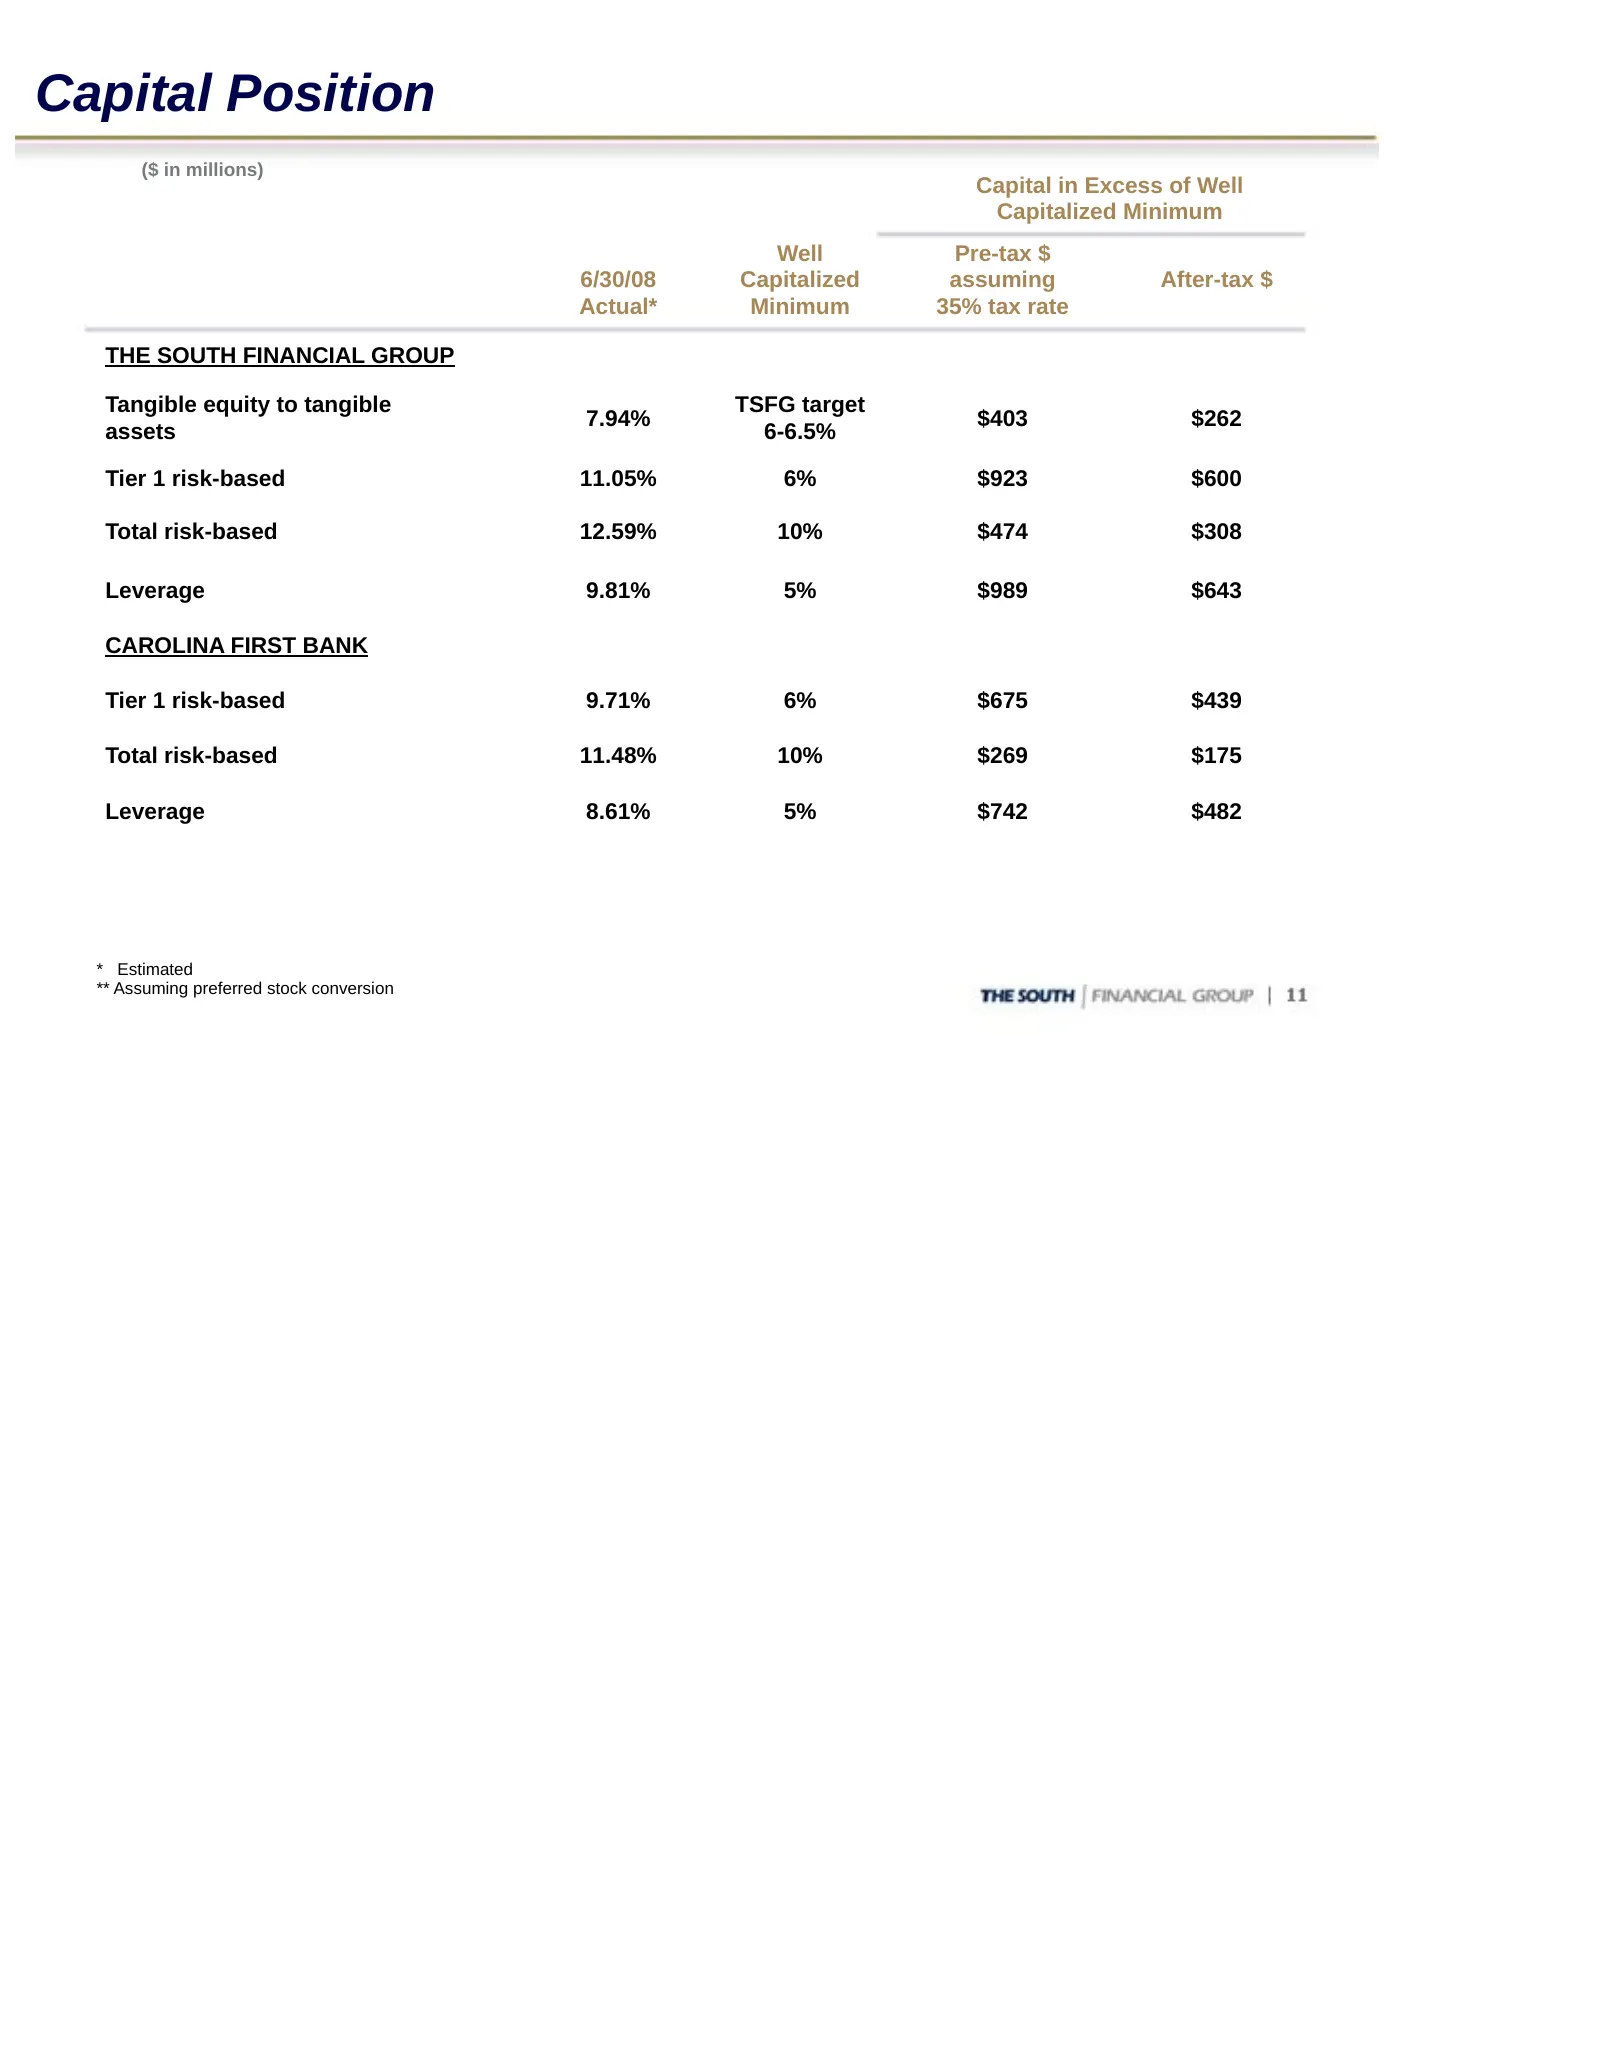
Capital Position ($ in millions) Capital in Excess of Well Capitalized Minimum Well Pre-tax $ 6/30/08 Capitalized assuming After-tax $ Actual* Minimum 35% tax rate THE SOUTH FINANCIAL GROUP Tangible equity to tangible TSFG target 7.94% $403 $262 assets 6-6.5% Tier 1 risk-based 11.05% 6% $923 $600 To
Slide 12: Excess Loss Absorption – Next 12 Months
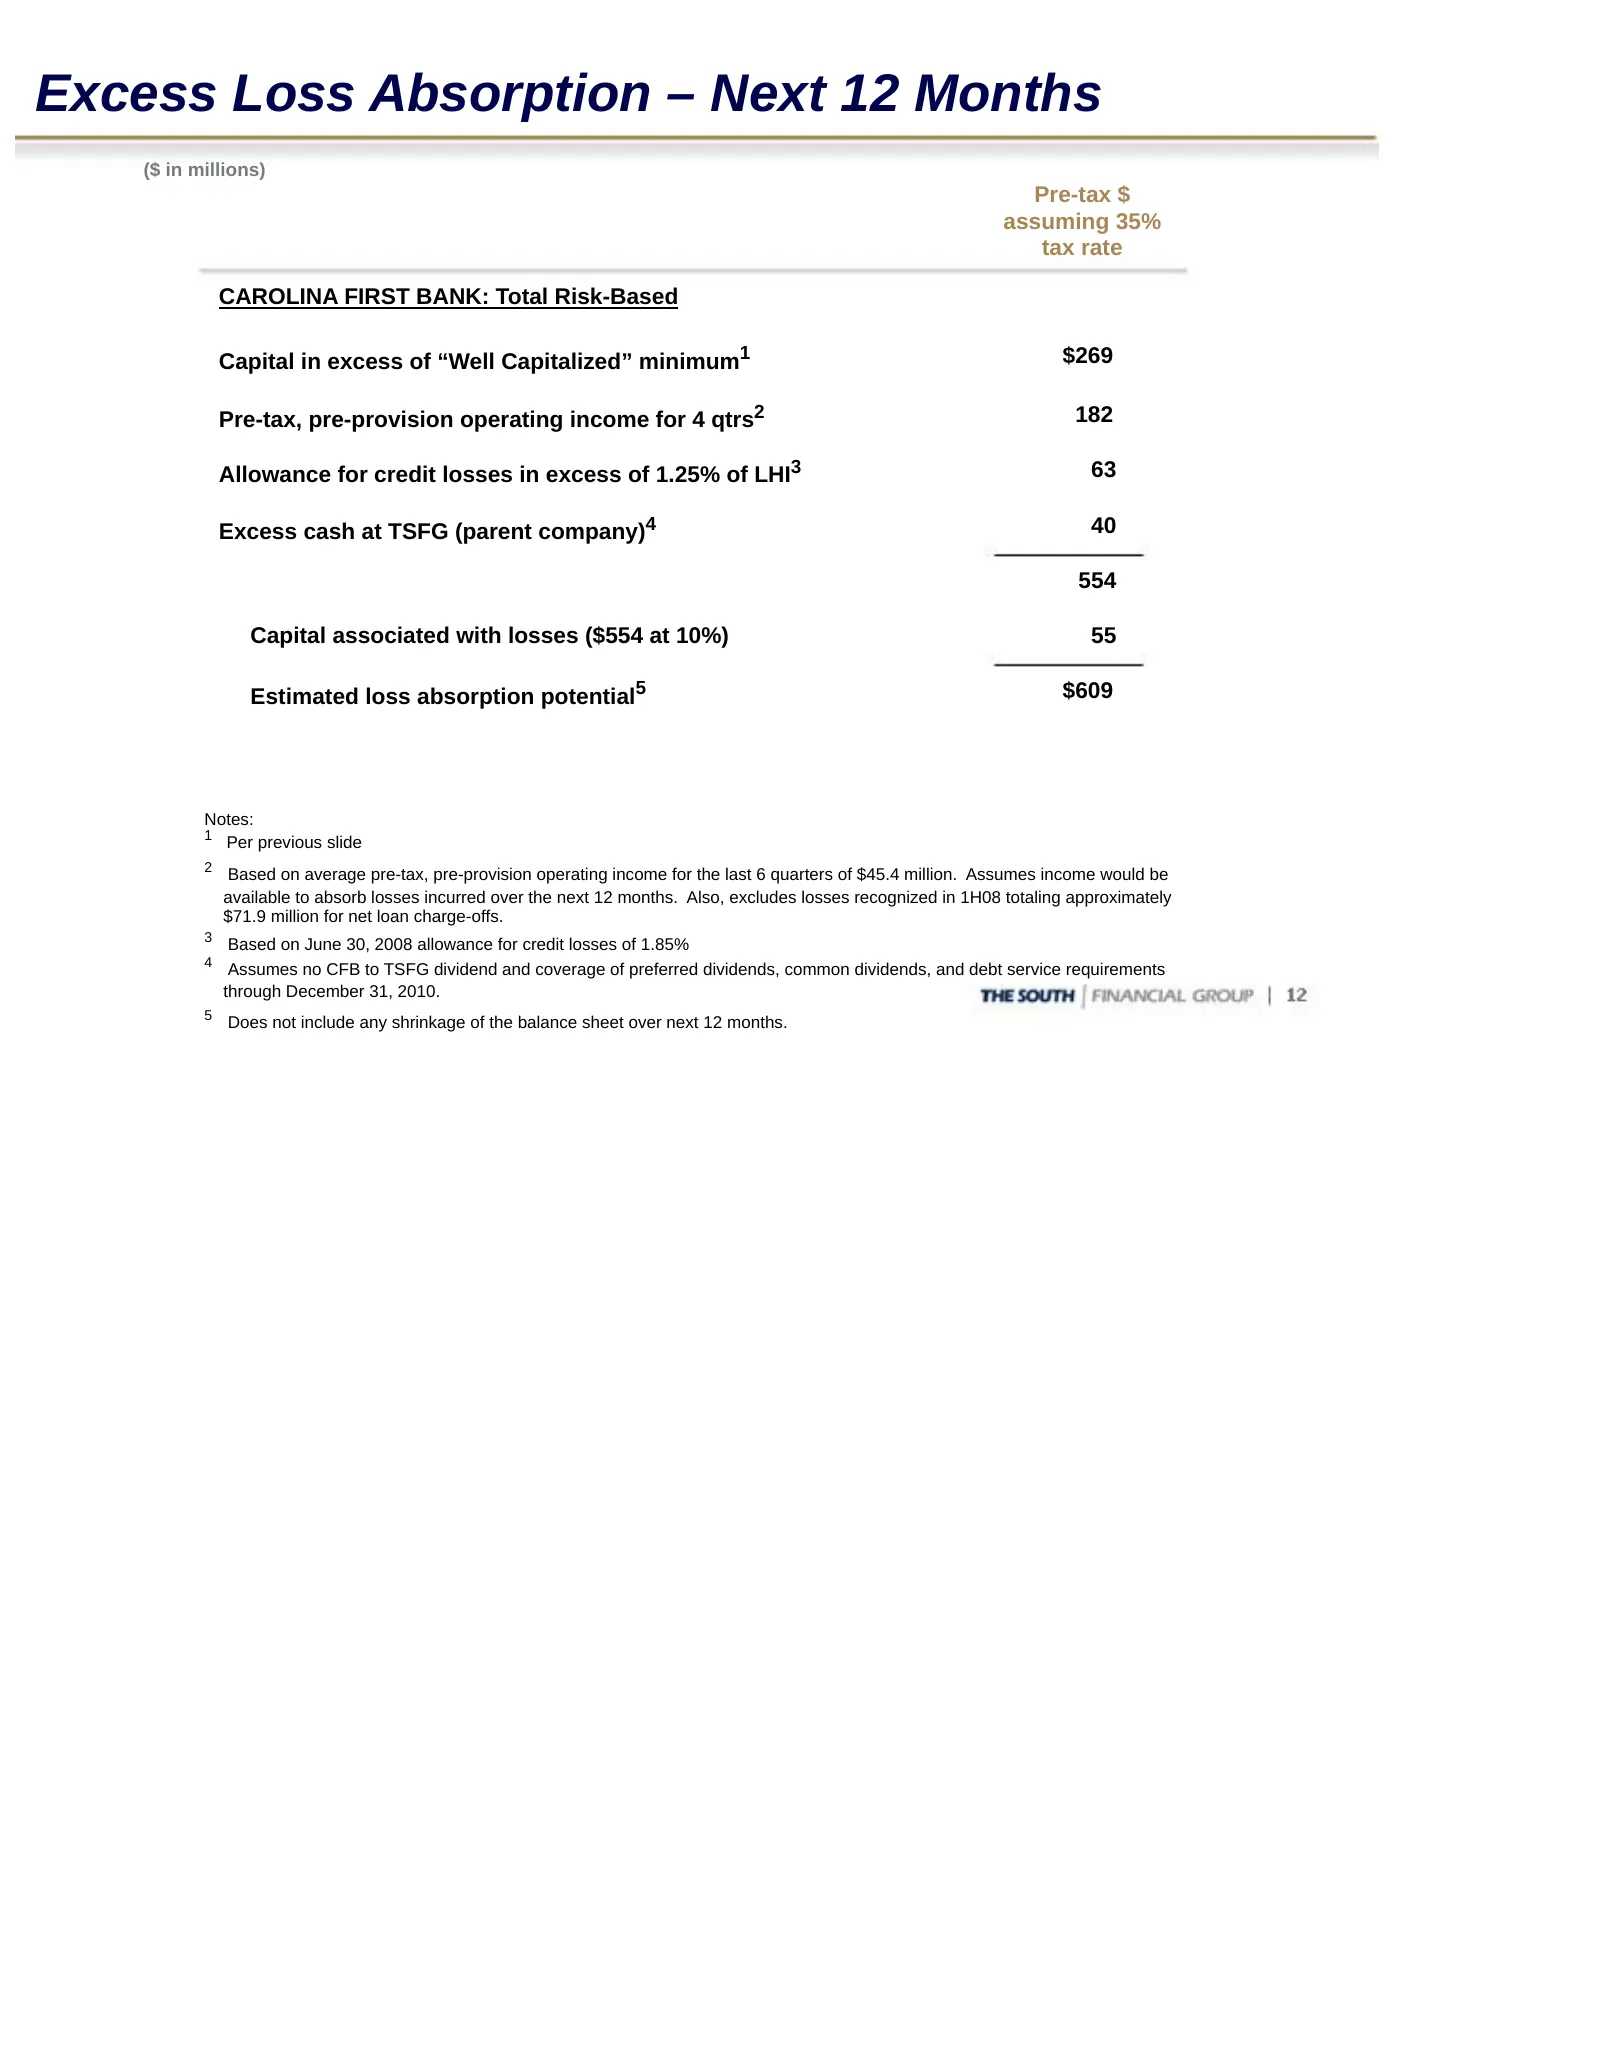
Excess Loss Absorption – Next 12 Months ($ in millions) Pre-tax $ assuming 35% tax rate CAROLINA FIRST BANK: Total Risk-Based Capital in excess of “Well Capitalized” minimum1 $269 Pre-tax, pre-provision operating income for 4 qtrs2 182 Allowance for credit losses in excess of 1.25% of LHI3 63 Excess
Slide 13: Net Interest Income and Margin
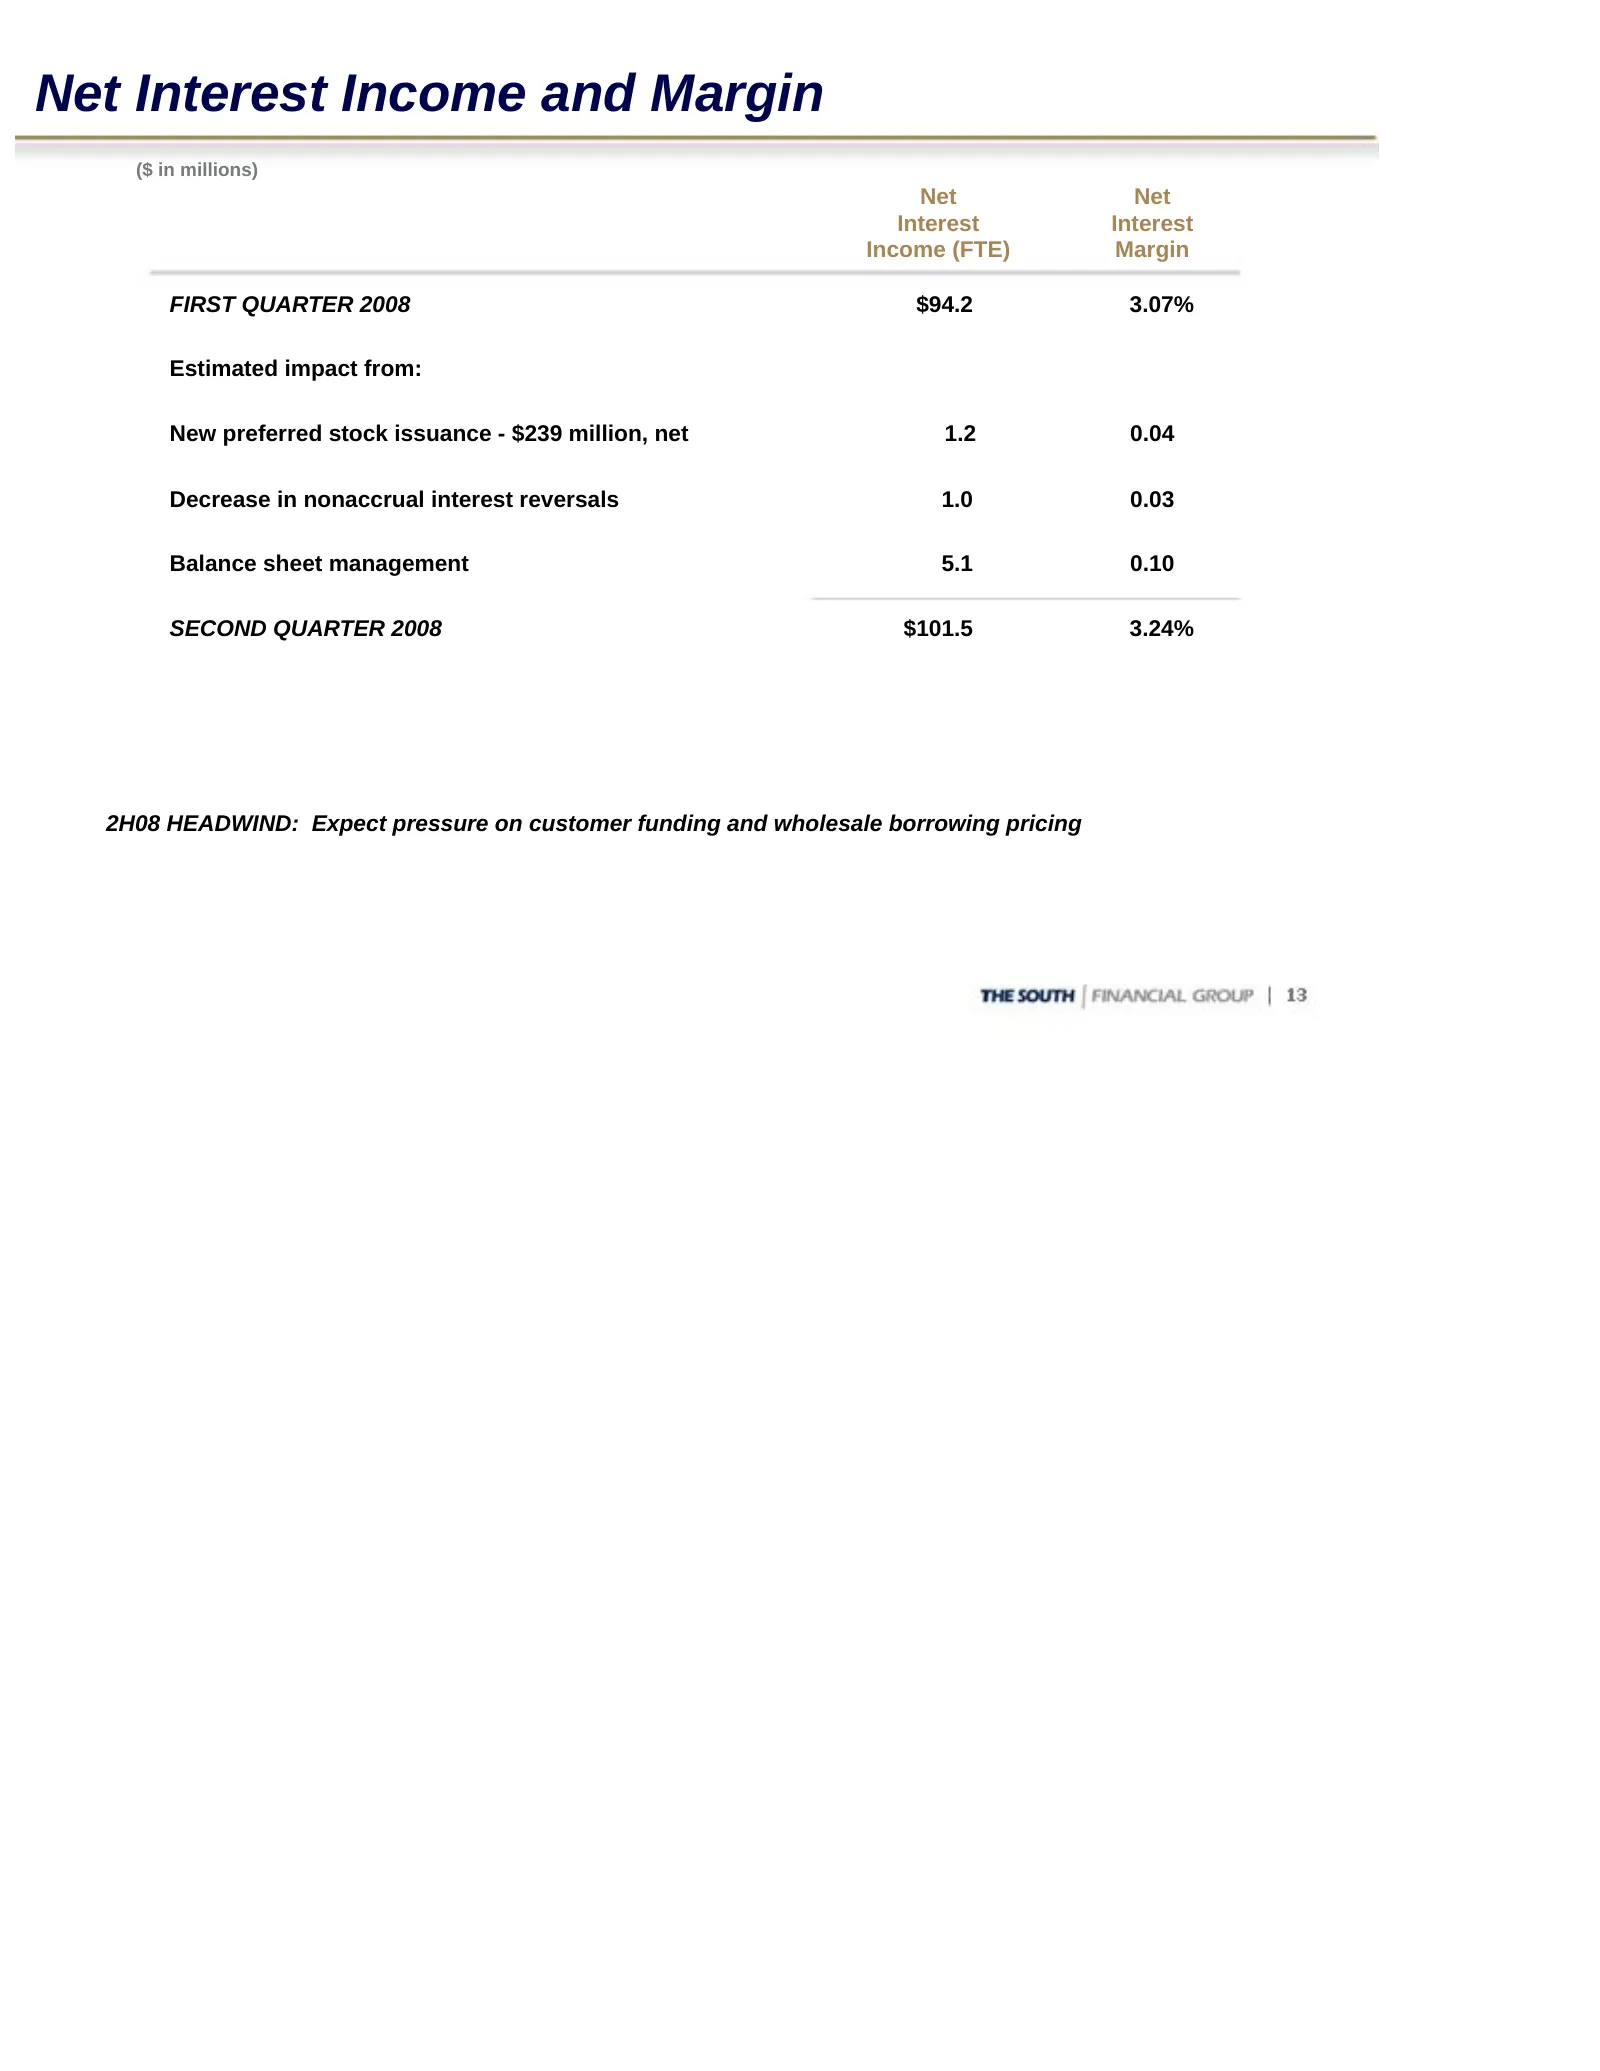
Net Interest Income and Margin ($ in millions) Net Net Interest Interest Income (FTE) Margin FIRST QUARTER 2008 $94.2 3.07% Estimated impact from: New preferred stock issuance - $239 million, net 1.2 0.04 Decrease in nonaccrual interest reversals 1.0 0.03 Balance sheet management 5.1 0.10 SECOND QUA
Slide 14: Customer Funding
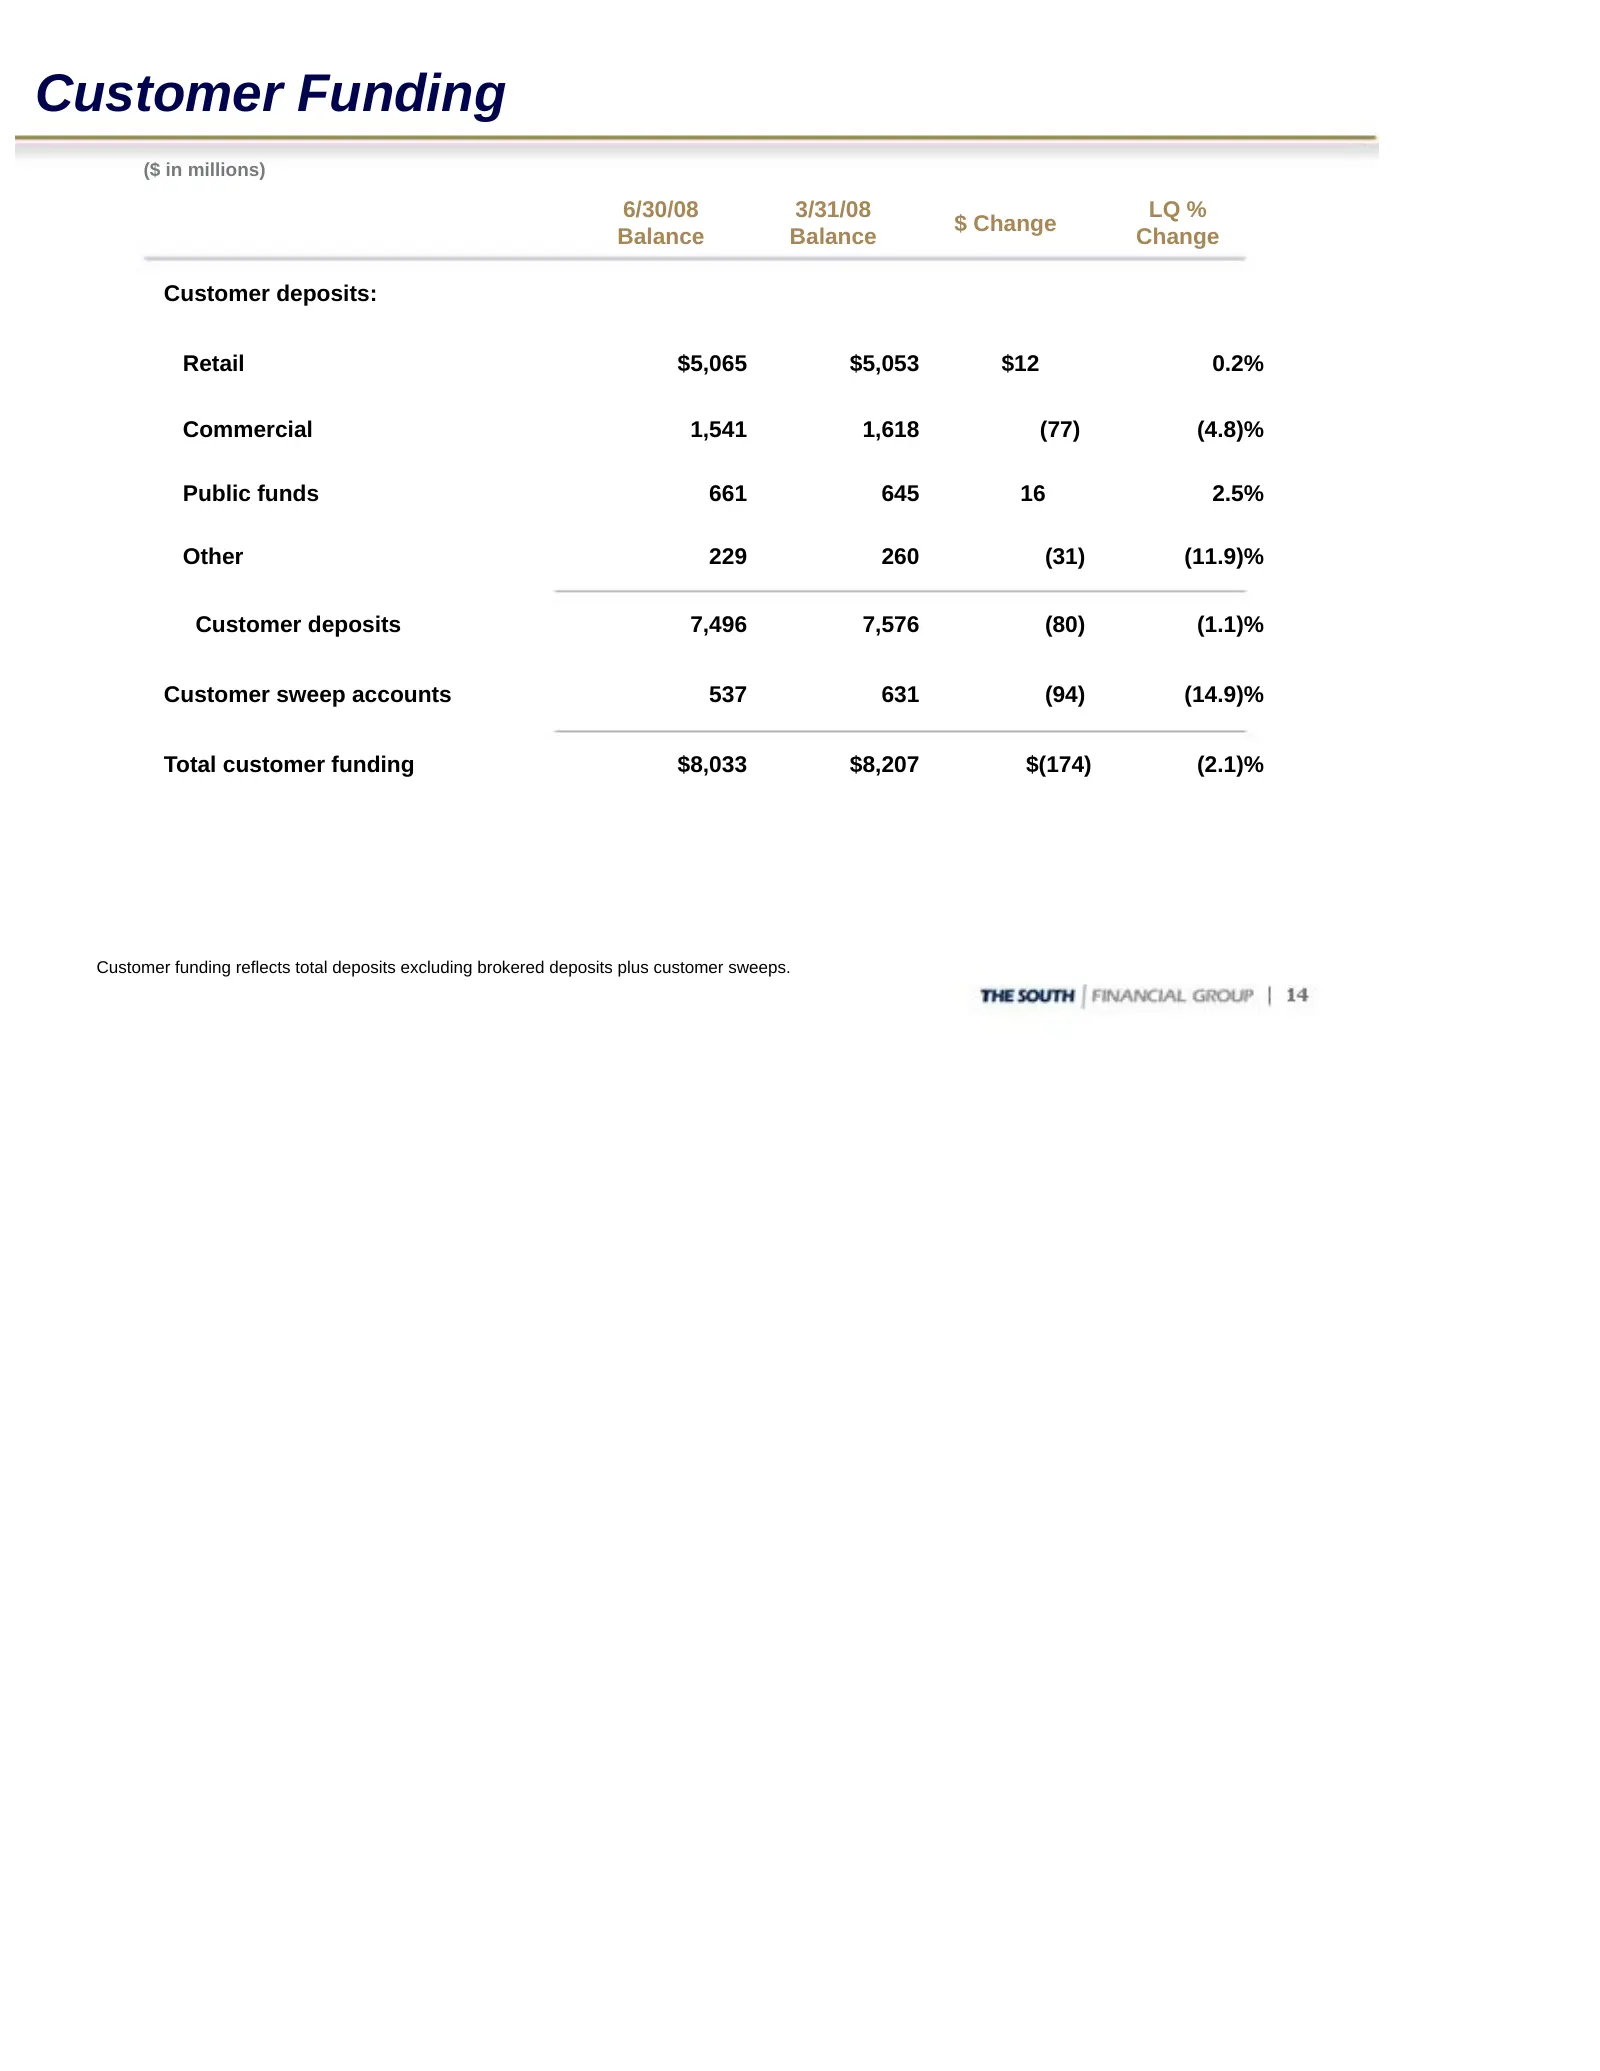
Customer Funding ($ in millions) 6/30/08 3/31/08 LQ % $ Change Balance Balance Change Customer deposits: Retail $5,065 $5,053 $12 0.2% Commercial 1,541 1,618 (77) (4.8)% Public funds 661 645 16 2.5% Other 229 260 (31) (11.9)% Customer deposits 7,496 7,576 (80) (1.1)% Customer sweep accounts 537 631
Slide 15: Noninterest Income
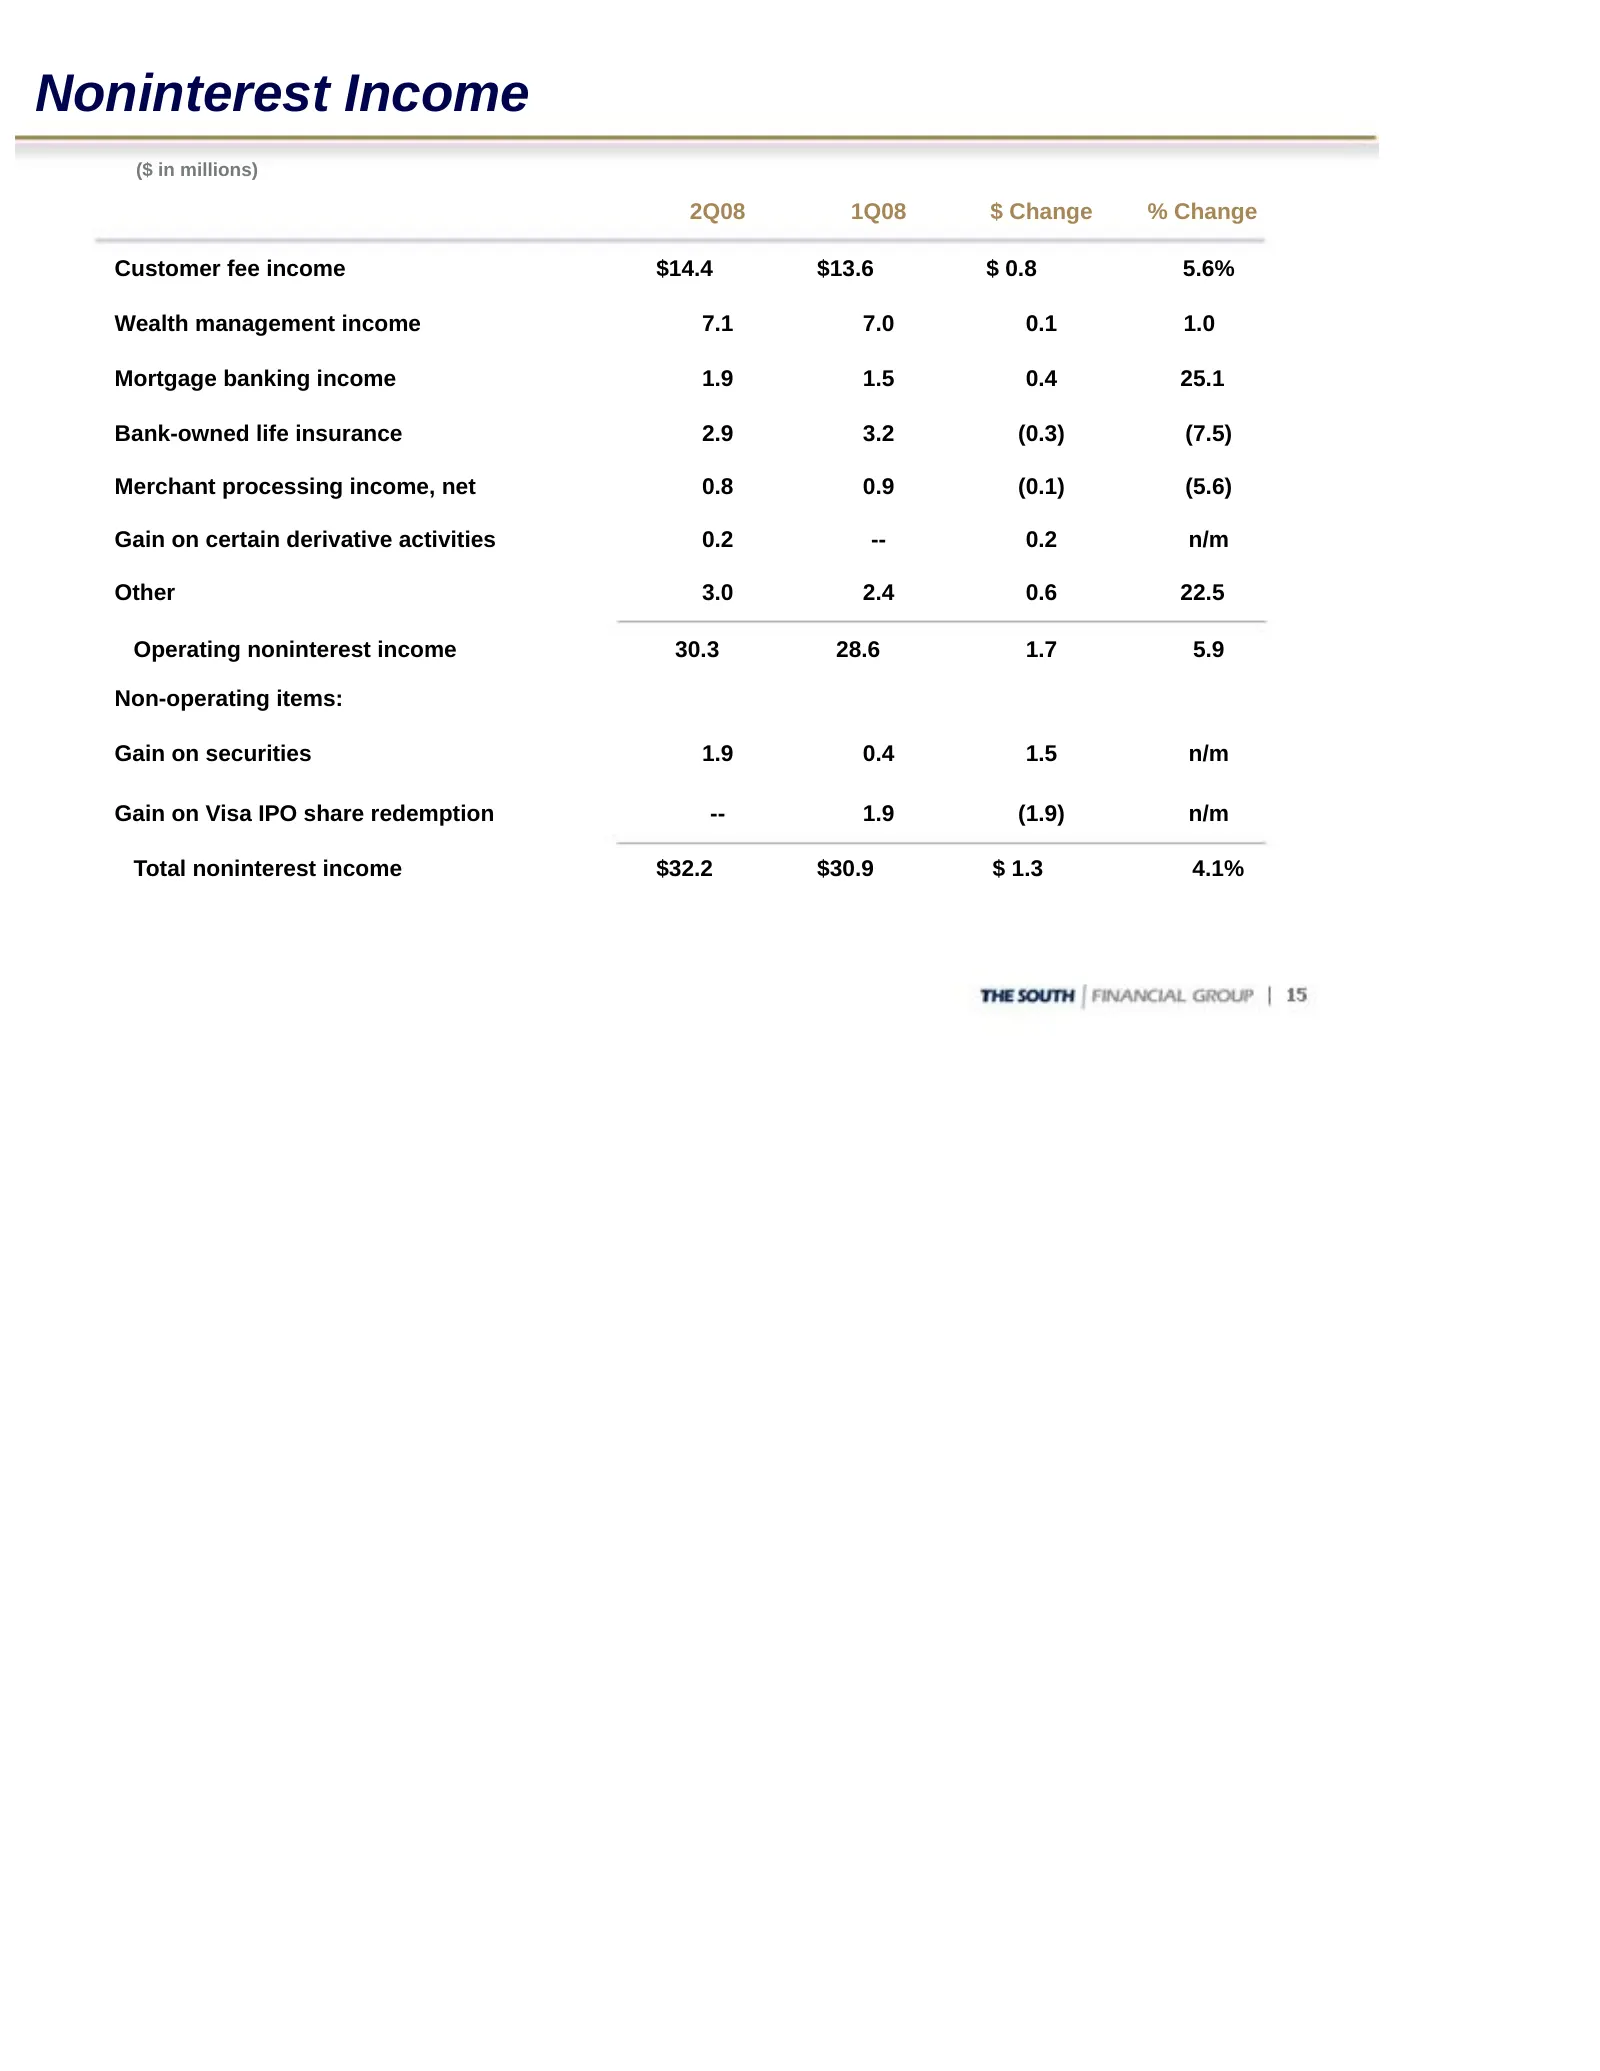
Noninterest Income ($ in millions) 2Q08 1Q08 $ Change % Change Customer fee income $14.4 $13.6 $ 0.8 5.6% Wealth management income 7.1 7.0 0.1 1.0 Mortgage banking income 1.9 1.5 0.4 25.1 Bank-owned life insurance 2.9 3.2 (0.3) (7.5) Merchant processing income, net 0.8 0.9 (0.1) (5.6) Gain on certai
Slide 16: Noninterest Expenses
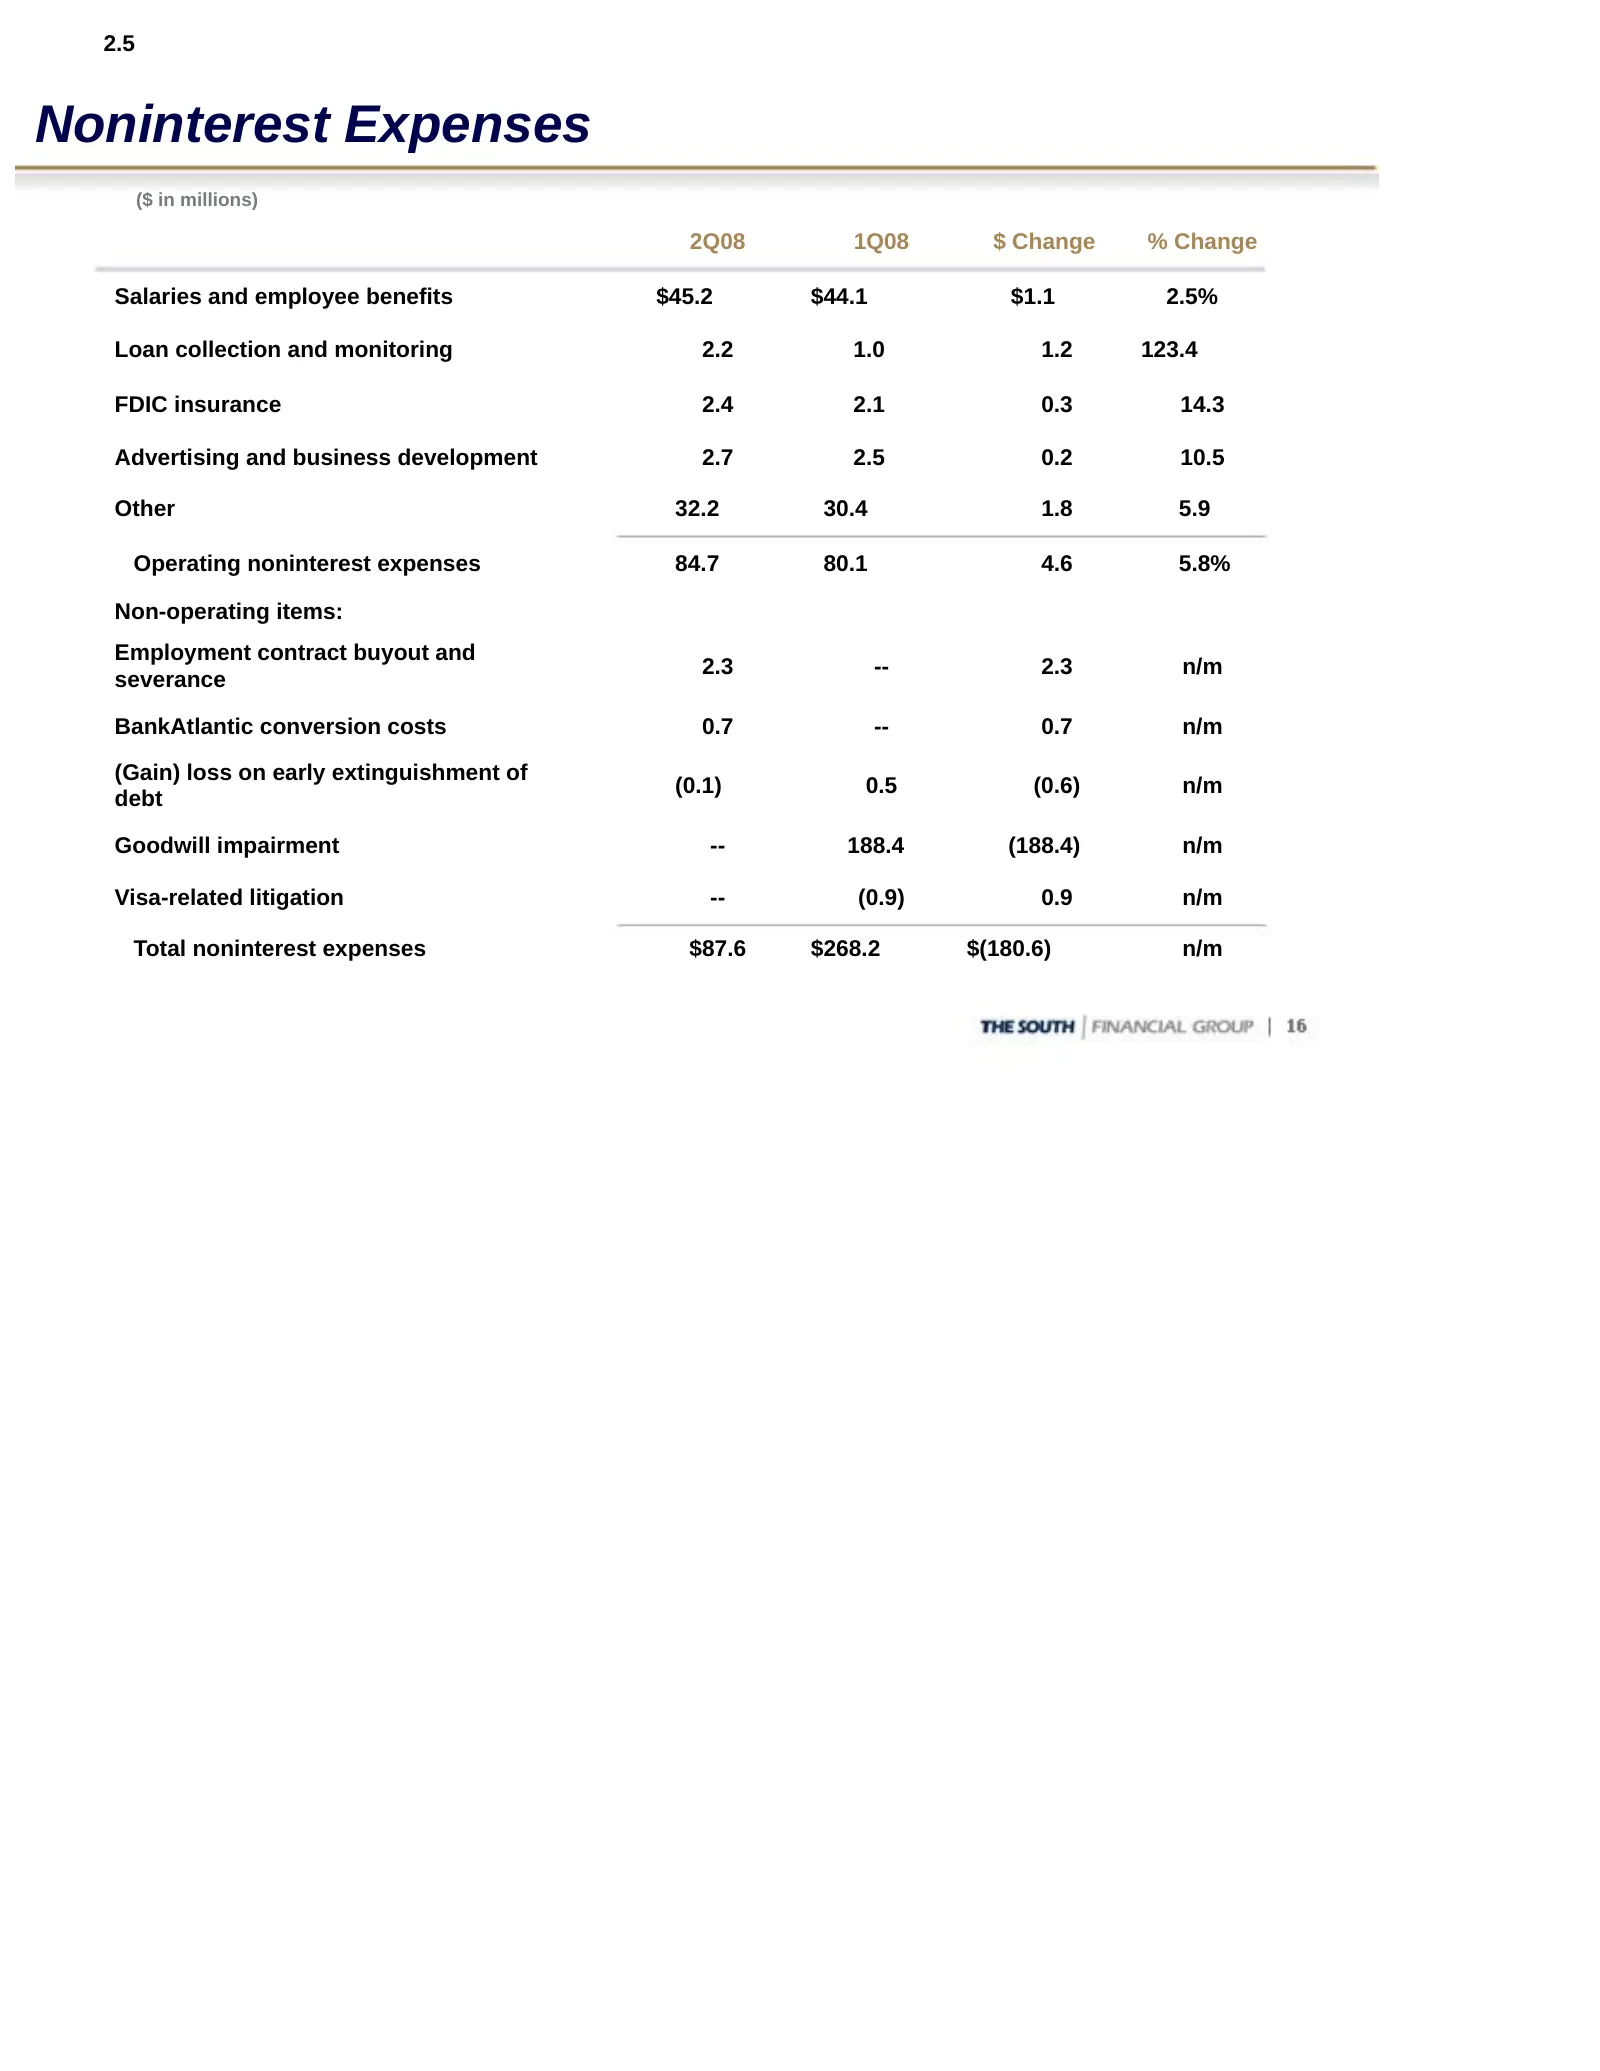
2.5 Noninterest Expenses ($ in millions) 2Q08 1Q08 $ Change % Change Salaries and employee benefits $45.2 $44.1 $1.1 2.5% Loan collection and monitoring 2.2 1.0 1.2 123.4 FDIC insurance 2.4 2.1 0.3 14.3 Advertising and business development 2.7 2.5 0.2 10.5 Other 32.2 30.4 1.8 5.9 Operating nonintere
Slide 17: Organizational Structure
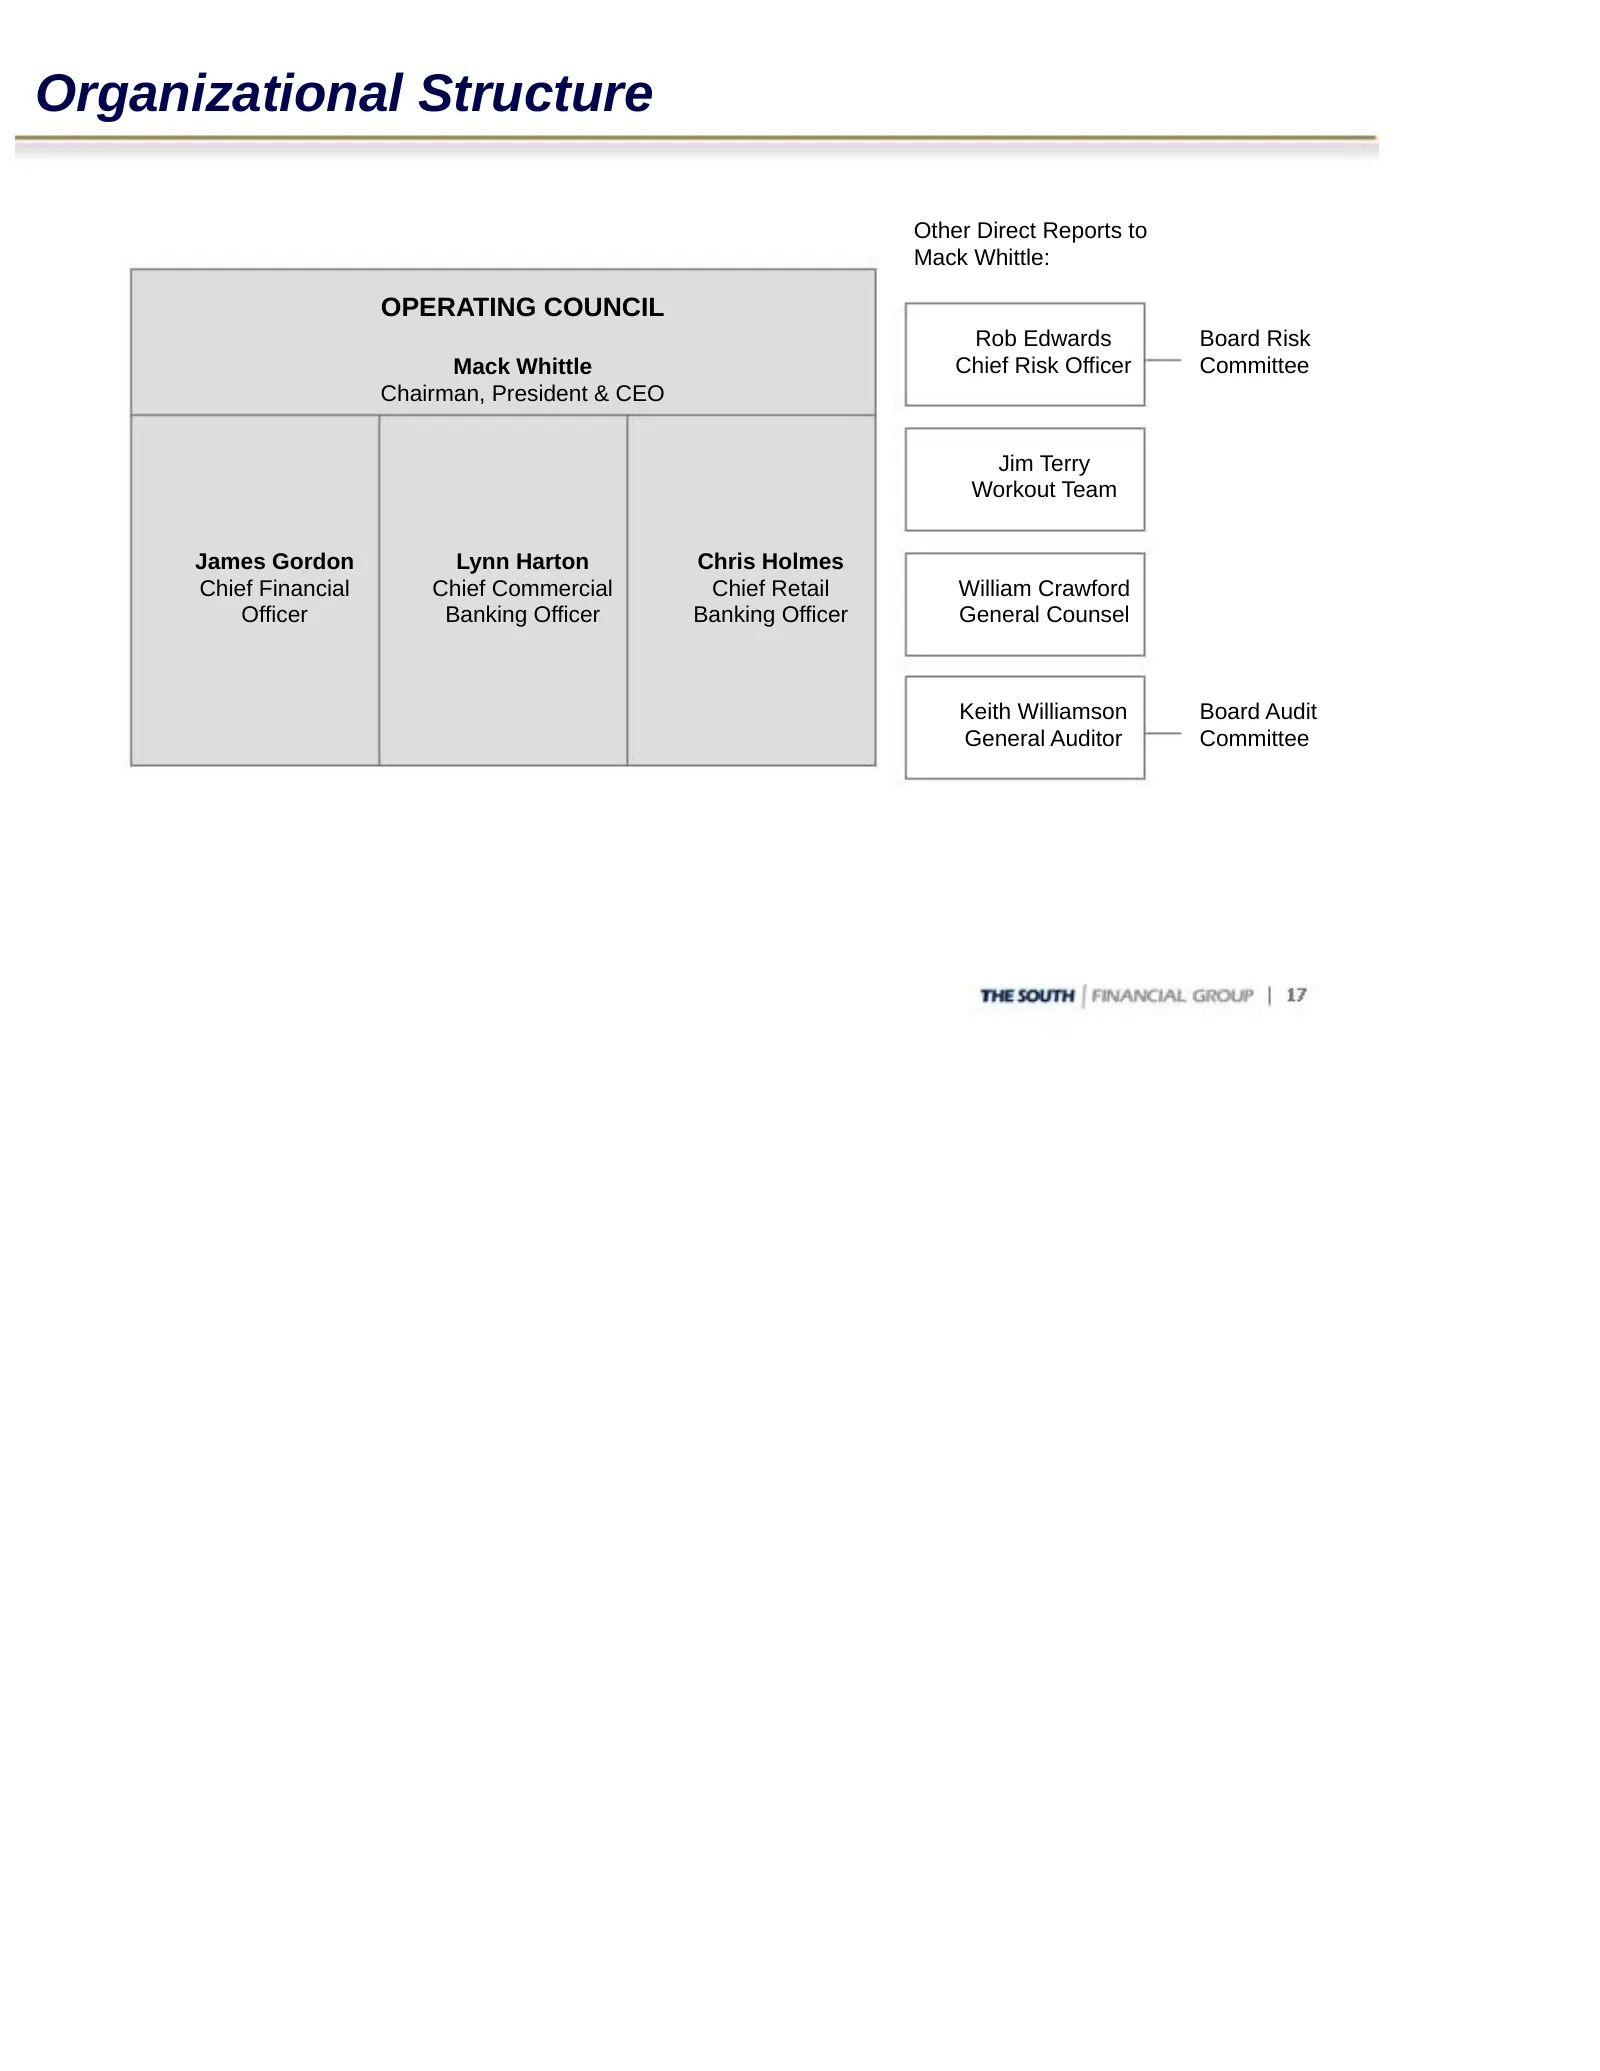
Organizational Structure Other Direct Reports to Mack Whittle: OPERATING COUNCIL Rob Edwards Board Risk Mack Whittle Chief Risk Officer Committee Chairman, President & CEO Jim Terry Workout Team James Gordon Lynn Harton Chris Holmes Chief Financial Chief Commercial Chief Retail William Crawford Offi
Slide 18: Appendix: Comparative Information
APPENDIX Comparative Information as of 3/31/08
Slide 19: Loan and Credit Quality Composition, 3/31/08
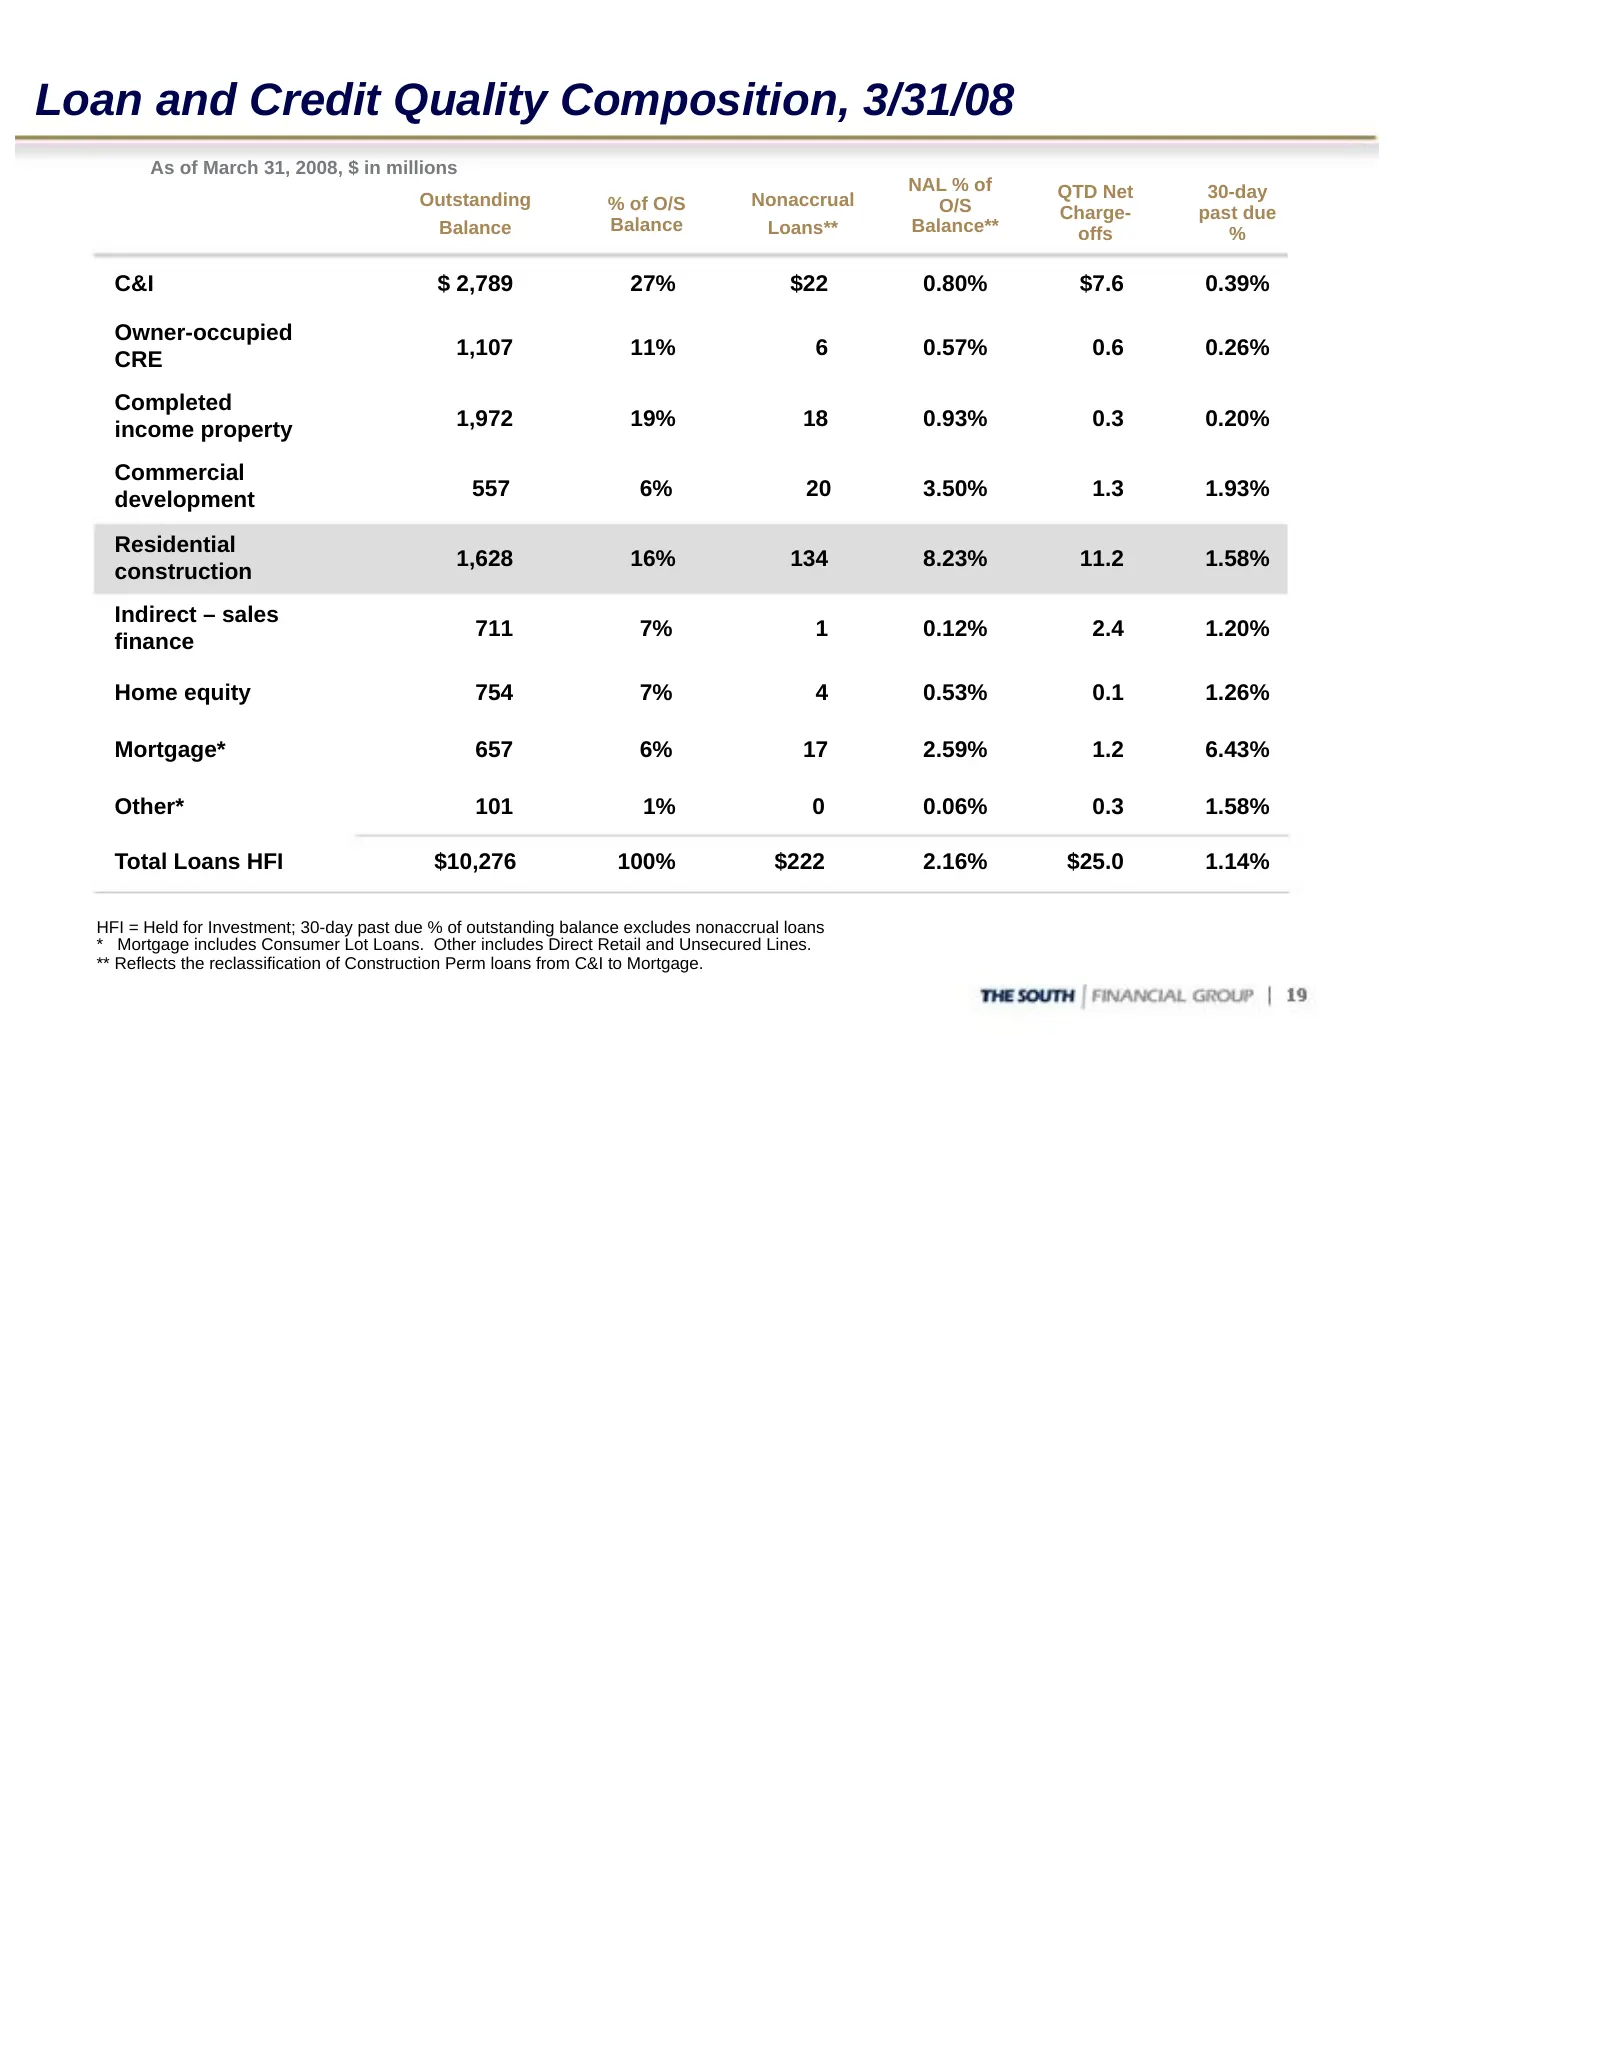
Loan and Credit Quality Composition, 3/31/08 As of March 31, 2008, $ in millions NAL % of QTD Net 30-day Outstanding % of O/S Nonaccrual O/S Charge- past due Balance Balance Loans** Balance** offs % C&I $ 2,789 27% $22 0.80% $7.6 0.39% Owner-occupied CRE 1,107 11% 6 0.57% 0.6 0.26% Completed 1,972 1
Slide 20: Residential Construction by Geography, 3/31/08
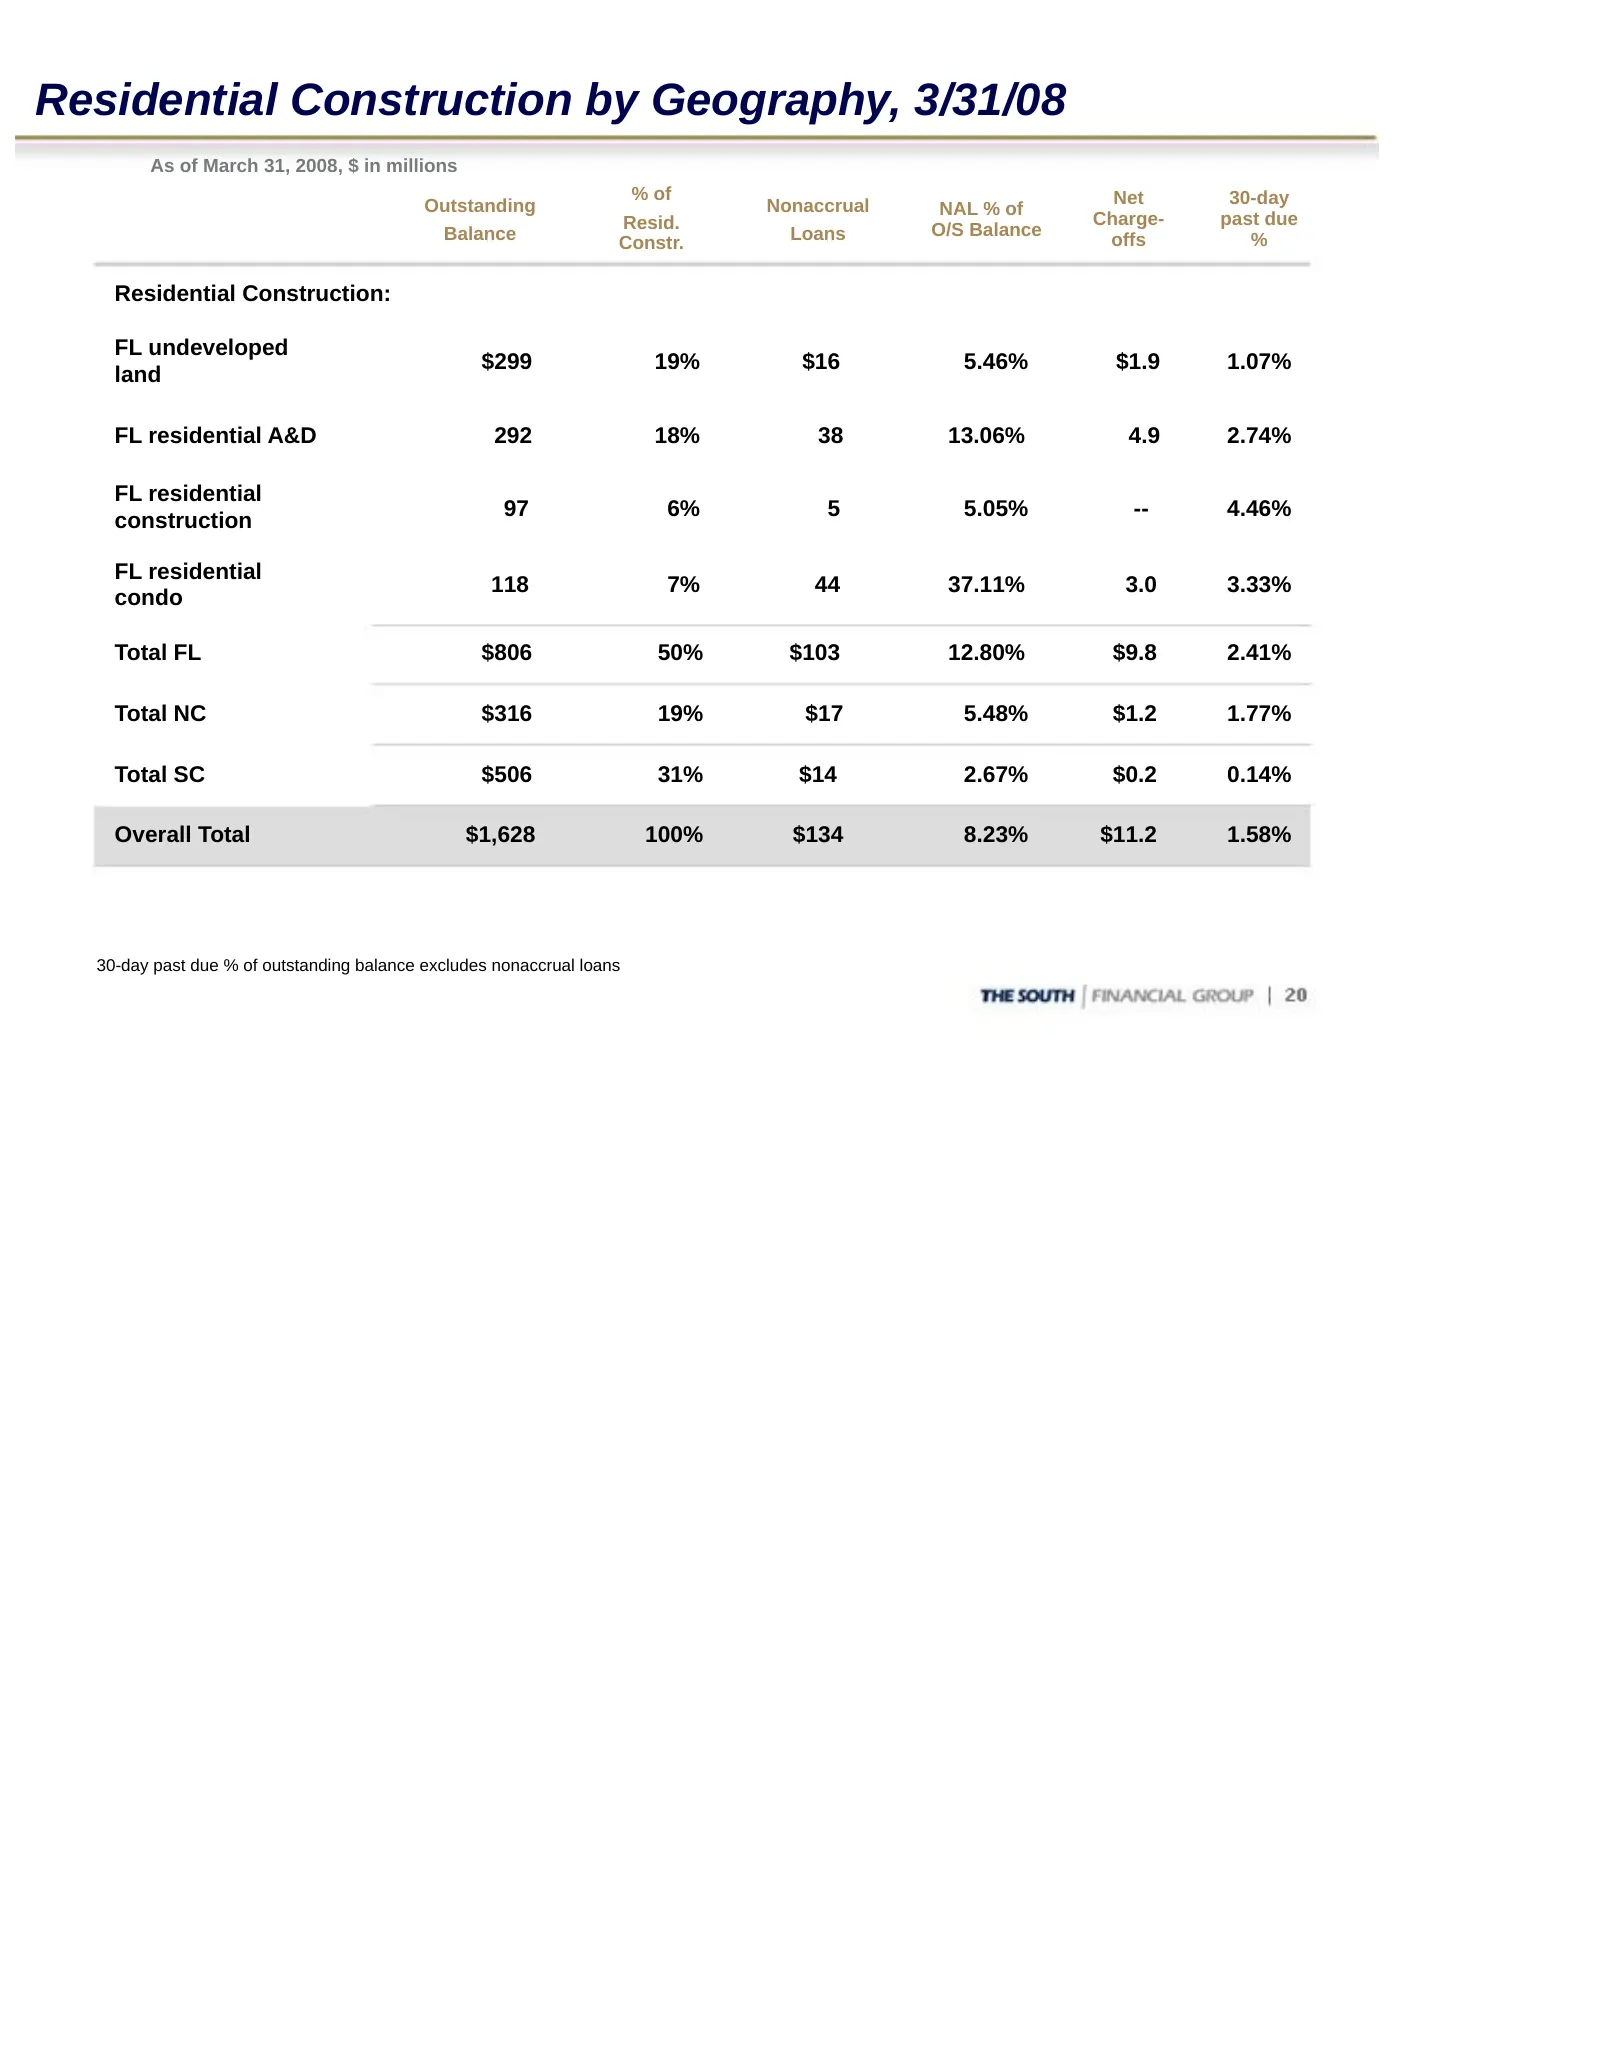
Residential Construction by Geography, 3/31/08 As of March 31, 2008, $ in millions % of Net 30-day Outstanding Nonaccrual NAL % of Resid. Charge- past due Balance Loans O/S Balance Constr. offs % Residential Construction: FL undeveloped $299 19% $16 5.46% $1.9 1.07% land FL residential A&D 292 18% 3
Slide 21: Current as of 7/22/08
THE:SOUTH — oi FINANCIAL | GROUP Si, “an | ~ a, \ > For more information: > 7 INVESTOR RELATIONS ~ investor@thesouthgroup.com > www.thesouthgroup.com ~ Current as of 7/22/08
Source: SEC EDGAR · 8-K filed Jul 22, 2008
More decks from South Financial Group Inc
 Merger or Acquisition (June 2010)15 slides · Jun 29, 2010
 Debt Investor Presentation (June 2010)84 slides · Jun 18, 2010
 Merger or Acquisition (June 2010)43 slides · Jun 4, 2010
 Merger or Acquisition (May 2010)15 slides · May 17, 2010
 Q1 2010 Earnings Presentation30 slides · Apr 20, 2010
 Q4 2009 Earnings Presentation30 slides · Jan 26, 2010