Bridge Investment Group Holdings Inc
Bridge Investment — Q4 2023 Earnings Presentation
40 slides from Bridge Investment's earnings presentation, Feb 21, 2024
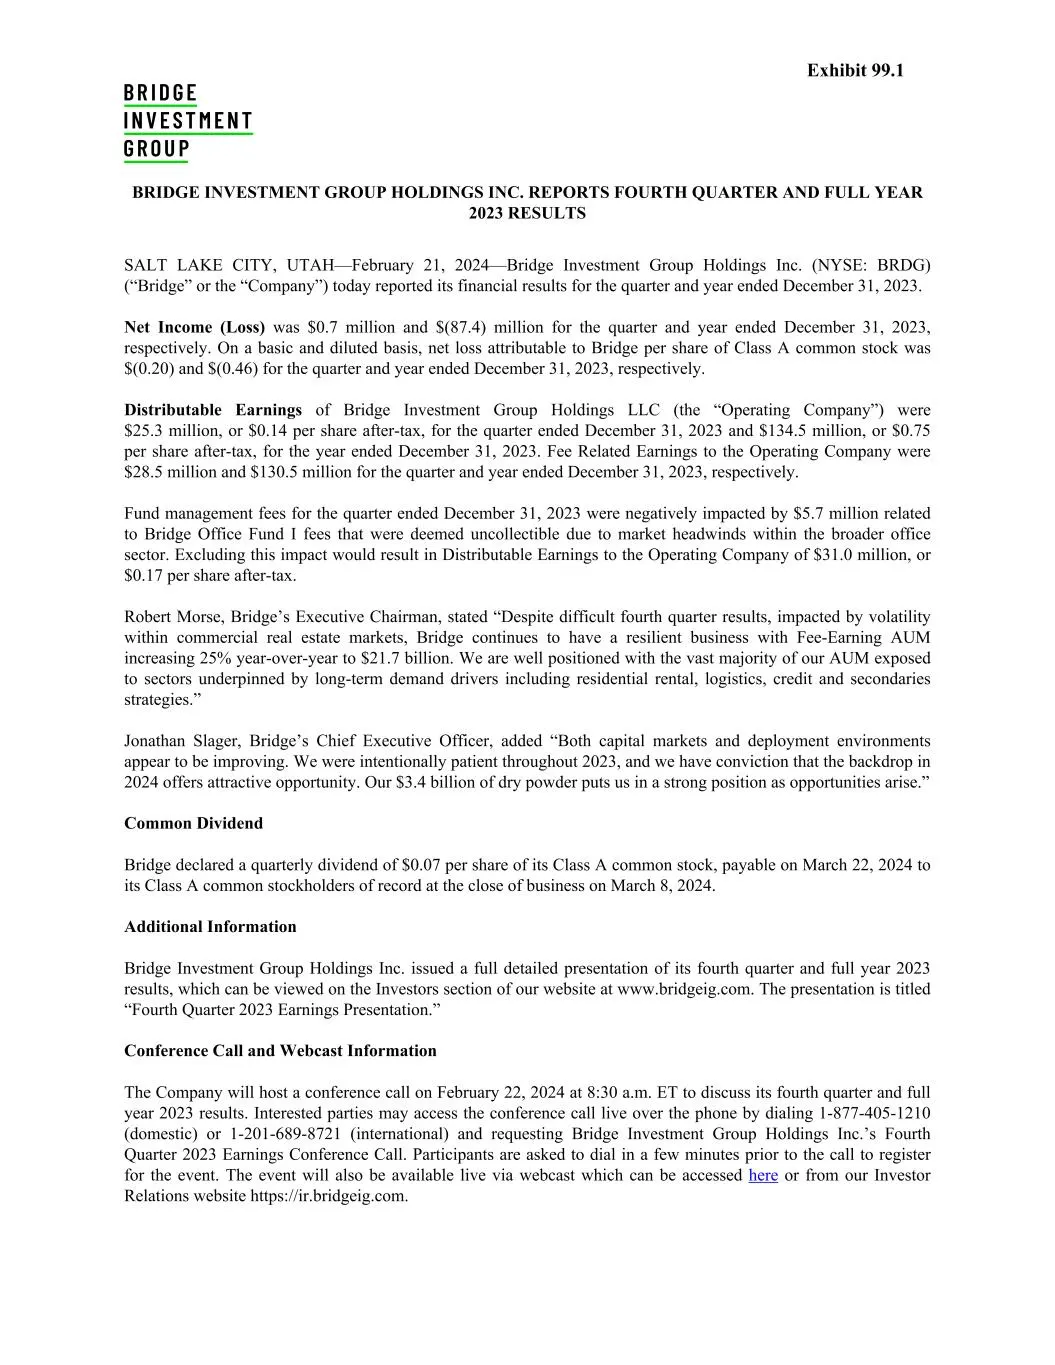
Slide 1: Reports Fourth Quarter and Full Year 2023 Results
BRIDGE INVESTMENT GROUP HOLDINGS INC. REPORTS FOURTH QUARTER AND FULL YEAR 2023 RESULTS SALT LAKE CITY, UTAH—February 21, 2024—Bridge Investment Group Holdings Inc. (NYSE: BRDG) (“Bridge” or the “Company”) today reported its financial results for the quarter and year ended December 31, 2023. Net Inc
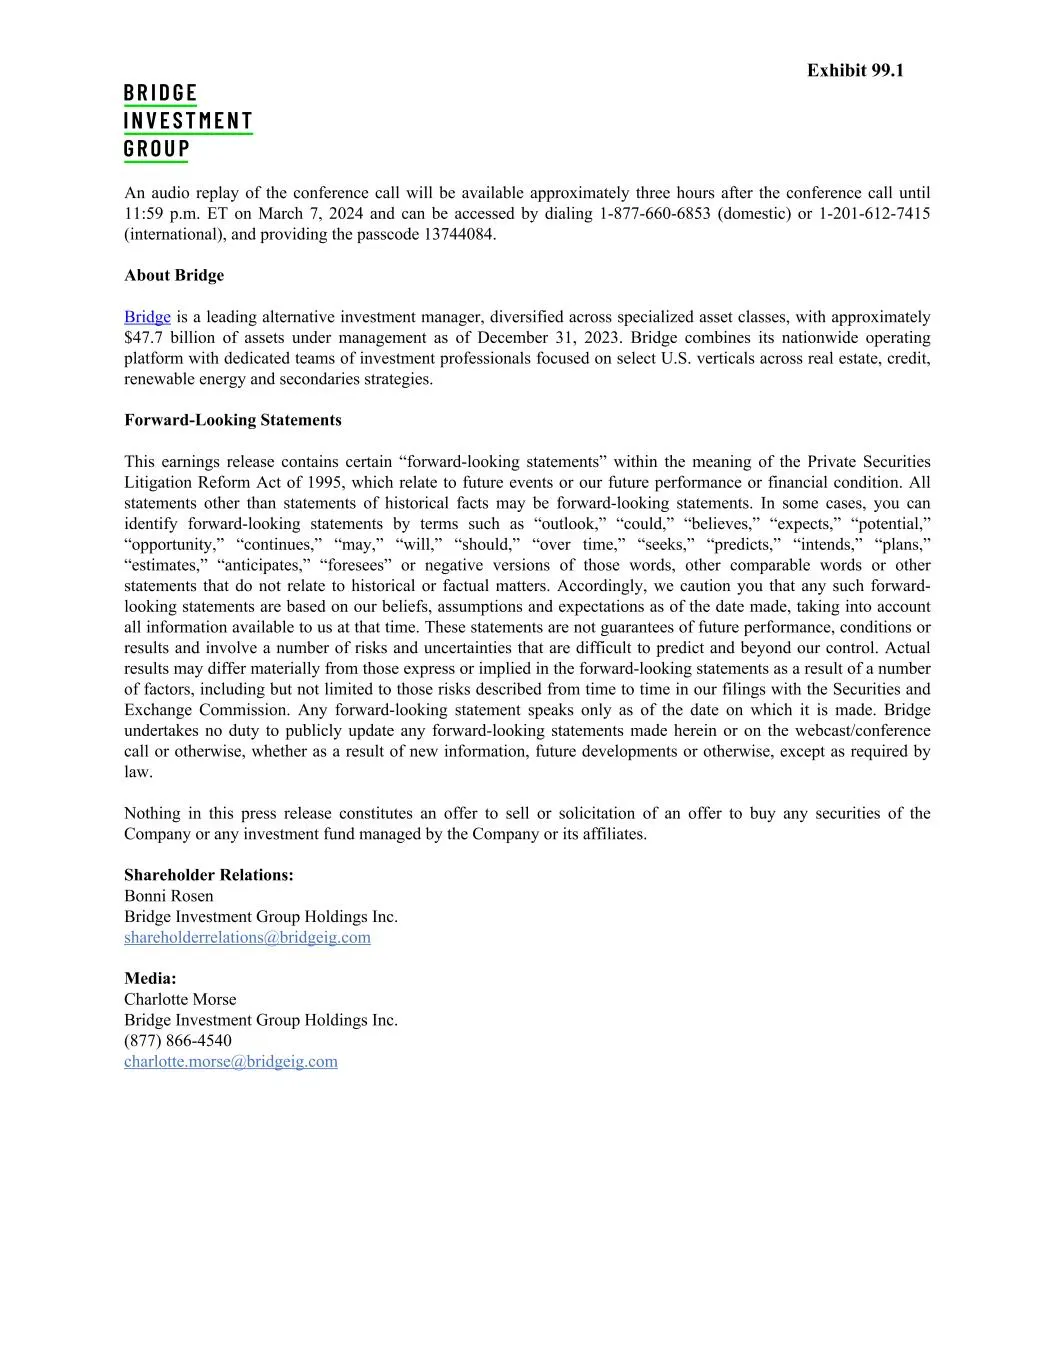
Slide 2: About Bridge and Forward-Looking Statements
An audio replay of the conference call will be available approximately three hours after the conference call until 11:59 p.m. ET on March 7, 2024 and can be accessed by dialing 1-877-660-6853 (domestic) or 1-201-612-7415 (international), and providing the passcode 13744084. About Bridge Bridge is a
Slide 3: Earnings Presentation 4th Quarter 2023
EARNINGS PRESENTATION February 21, 2024 4th QUARTER 2023 1
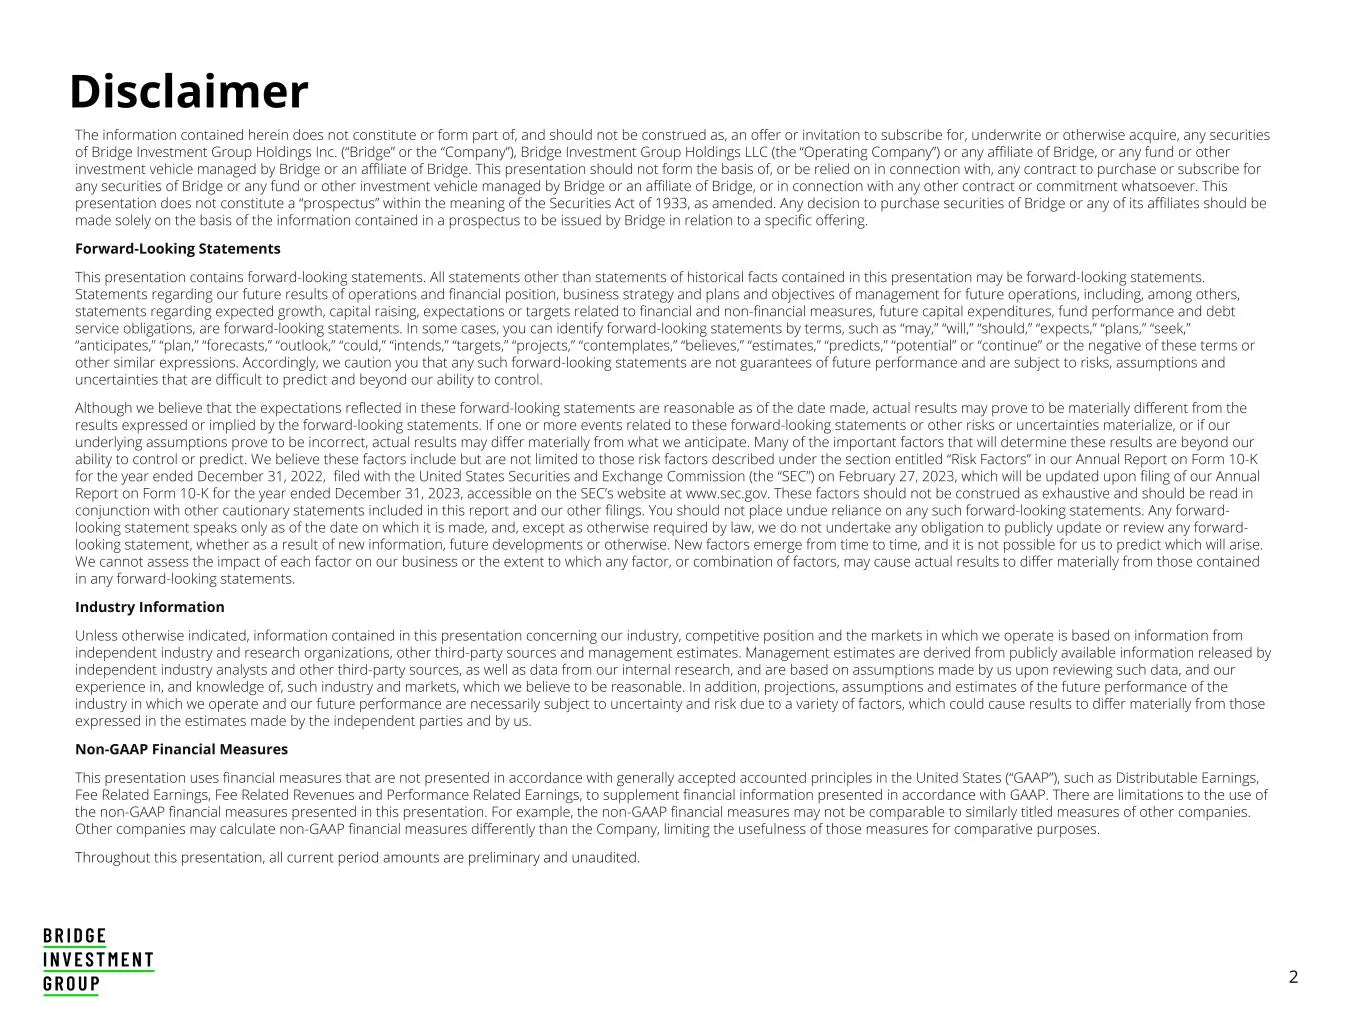
Slide 4: Disclaimer
2 Disclaimer The information contained herein does not constitute or form part of, and should not be construed as, an offer or invitation to subscribe for, underwrite or otherwise acquire, any securities of Bridge Investment Group Holdings Inc. (“Bridge” or the “Company”), Bridge Investment Group Ho
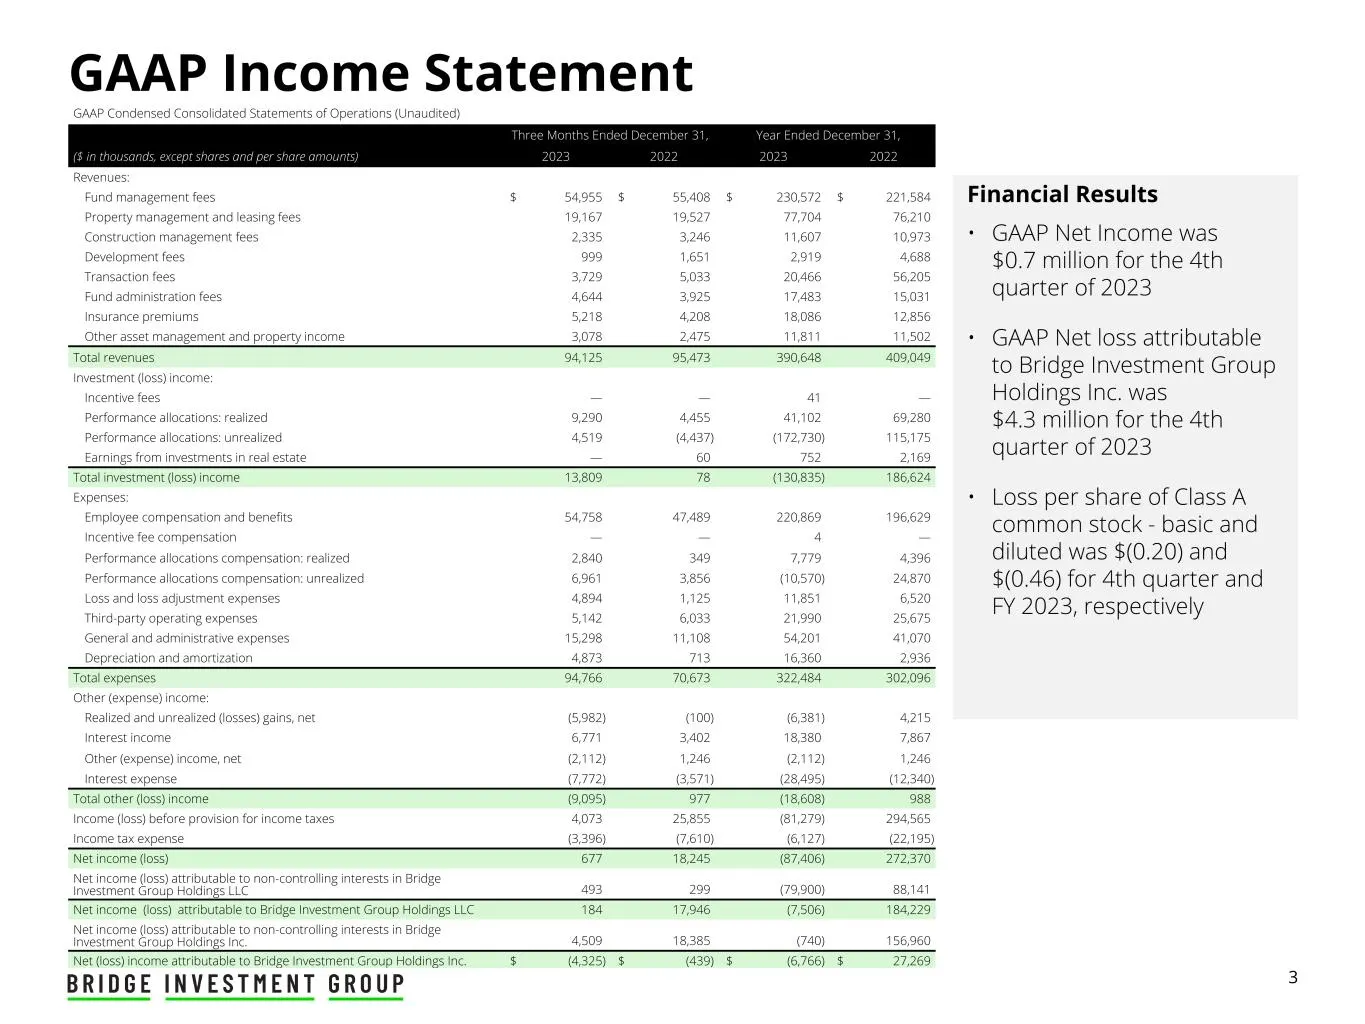
Slide 5: GAAP Income Statement
3 GAAP Income Statement GAAP Condensed Consolidated Statements of Operations (Unaudited) Three Months Ended December 31, Year Ended December 31, ($ in thousands, except shares and per share amounts) 2023 2022 2023 2022 Revenues: Fund management fees $ 54,955 $ 55,408 $ 230,572 $ 221,584 Property man
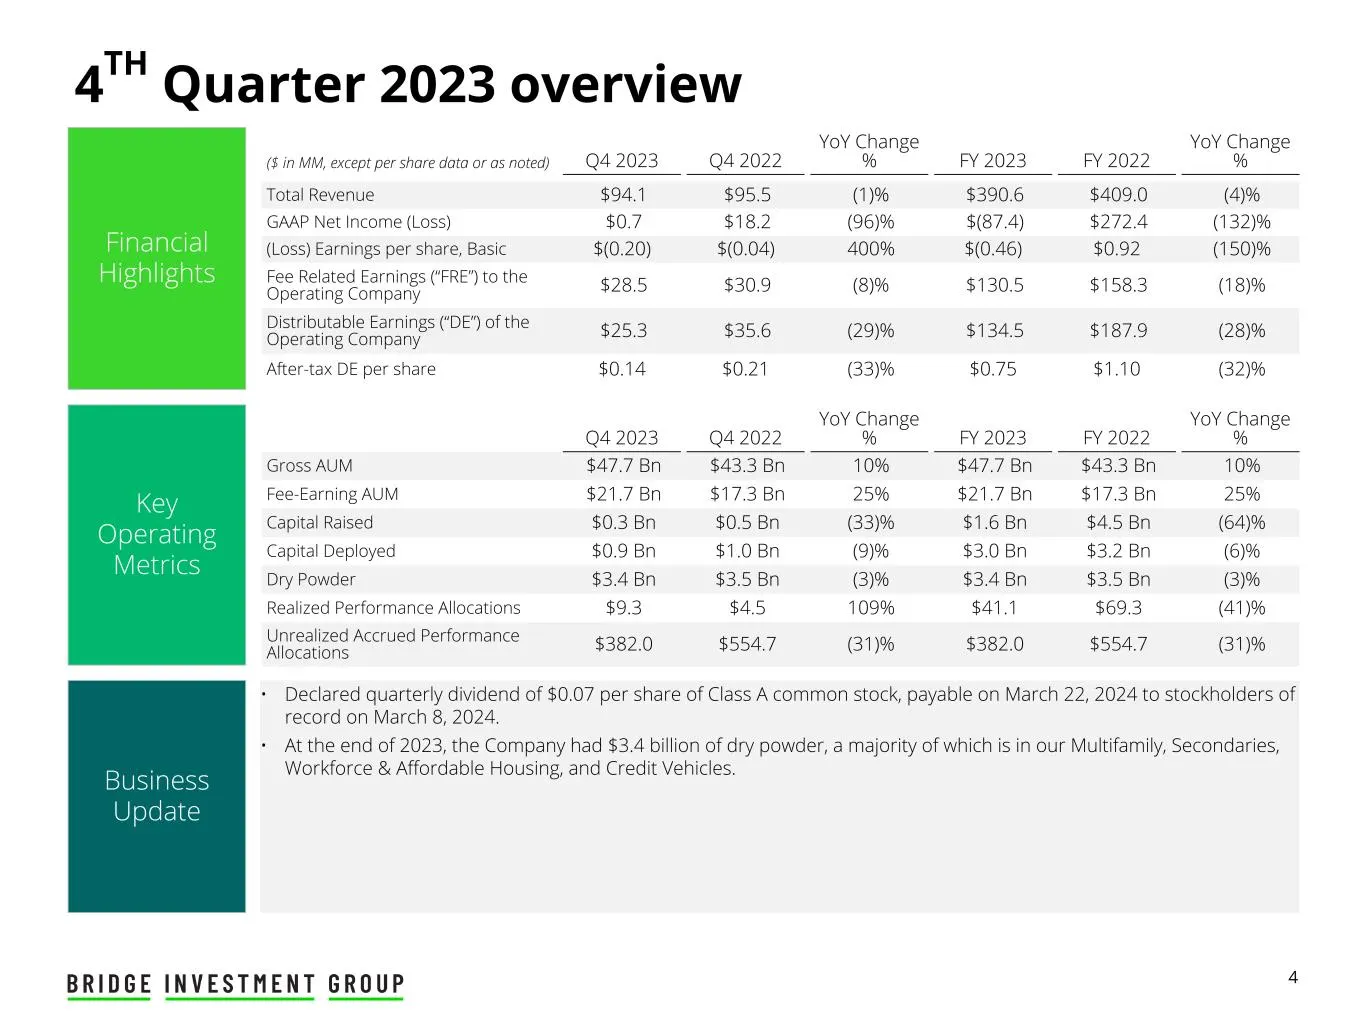
Slide 6: Financial Highlights
4 Financial Highlights 4TH Quarter 2023 overview Key Operating Metrics Business Update • Declared quarterly dividend of $0.07 per share of Class A common stock, payable on March 22, 2024 to stockholders of record on March 8, 2024. • At the end of 2023, the Company had $3.4 billion of dry powder, a m
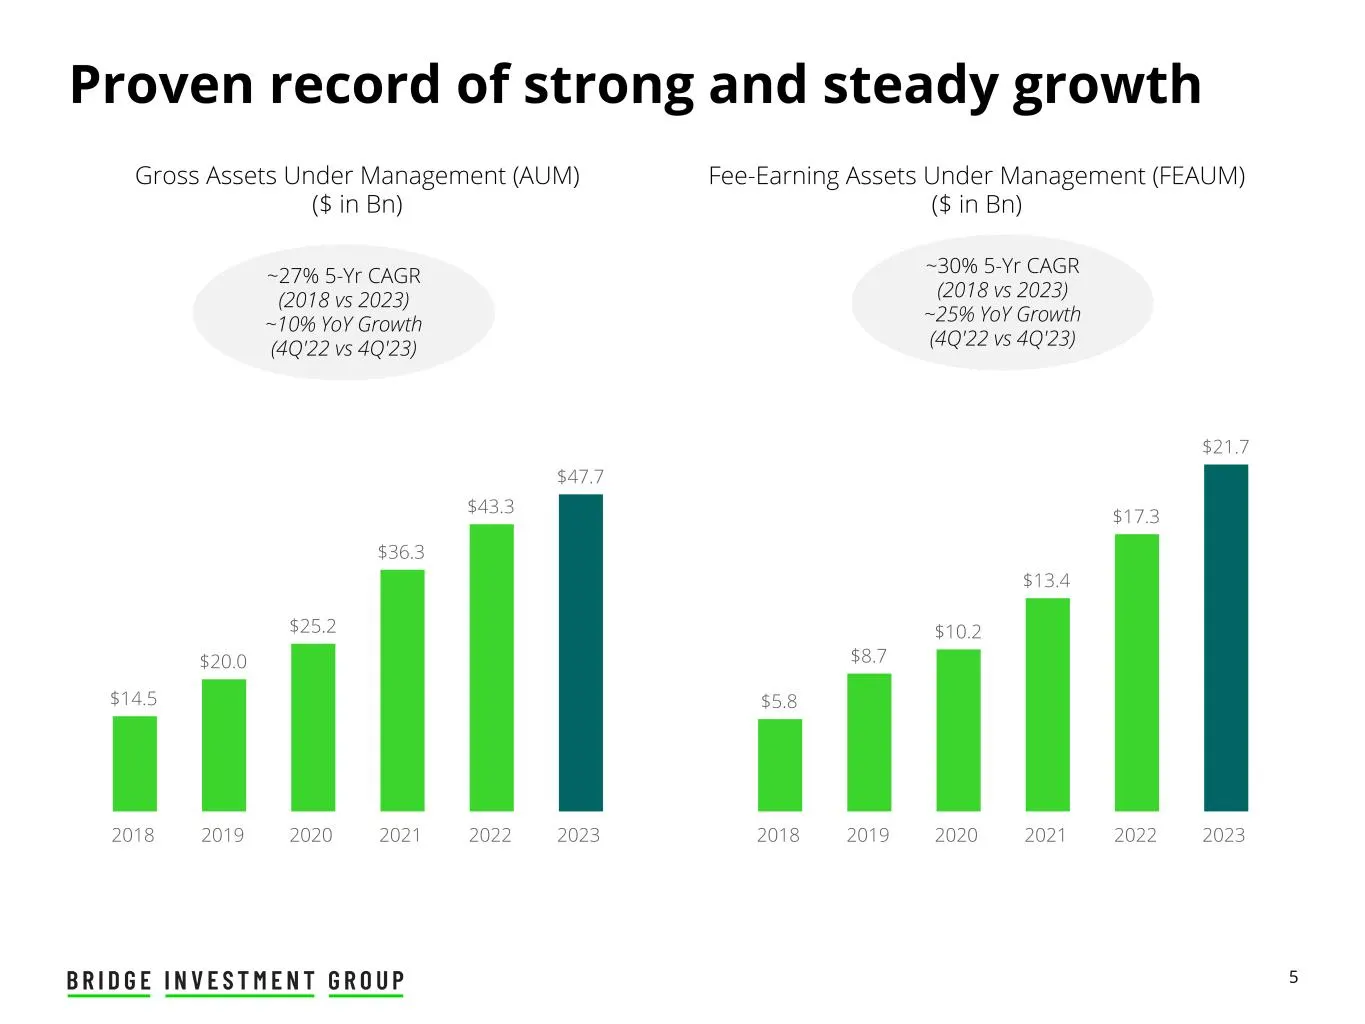
Slide 7: Proven record of strong and steady growth: AUM and FEAUM
5 $14.5 $20.0 $25.2 $36.3 $43.3 $47.7 2018 2019 2020 2021 2022 2023 Gross Assets Under Management (AUM) ($ in Bn) Fee-Earning Assets Under Management (FEAUM) ($ in Bn) Proven record of strong and steady growth ~27% 5-Yr CAGR (2018 vs 2023) ~10% YoY Growth (4Q'22 vs 4Q'23) $5.8 $8.7 $10.2 $13.4 $17.3
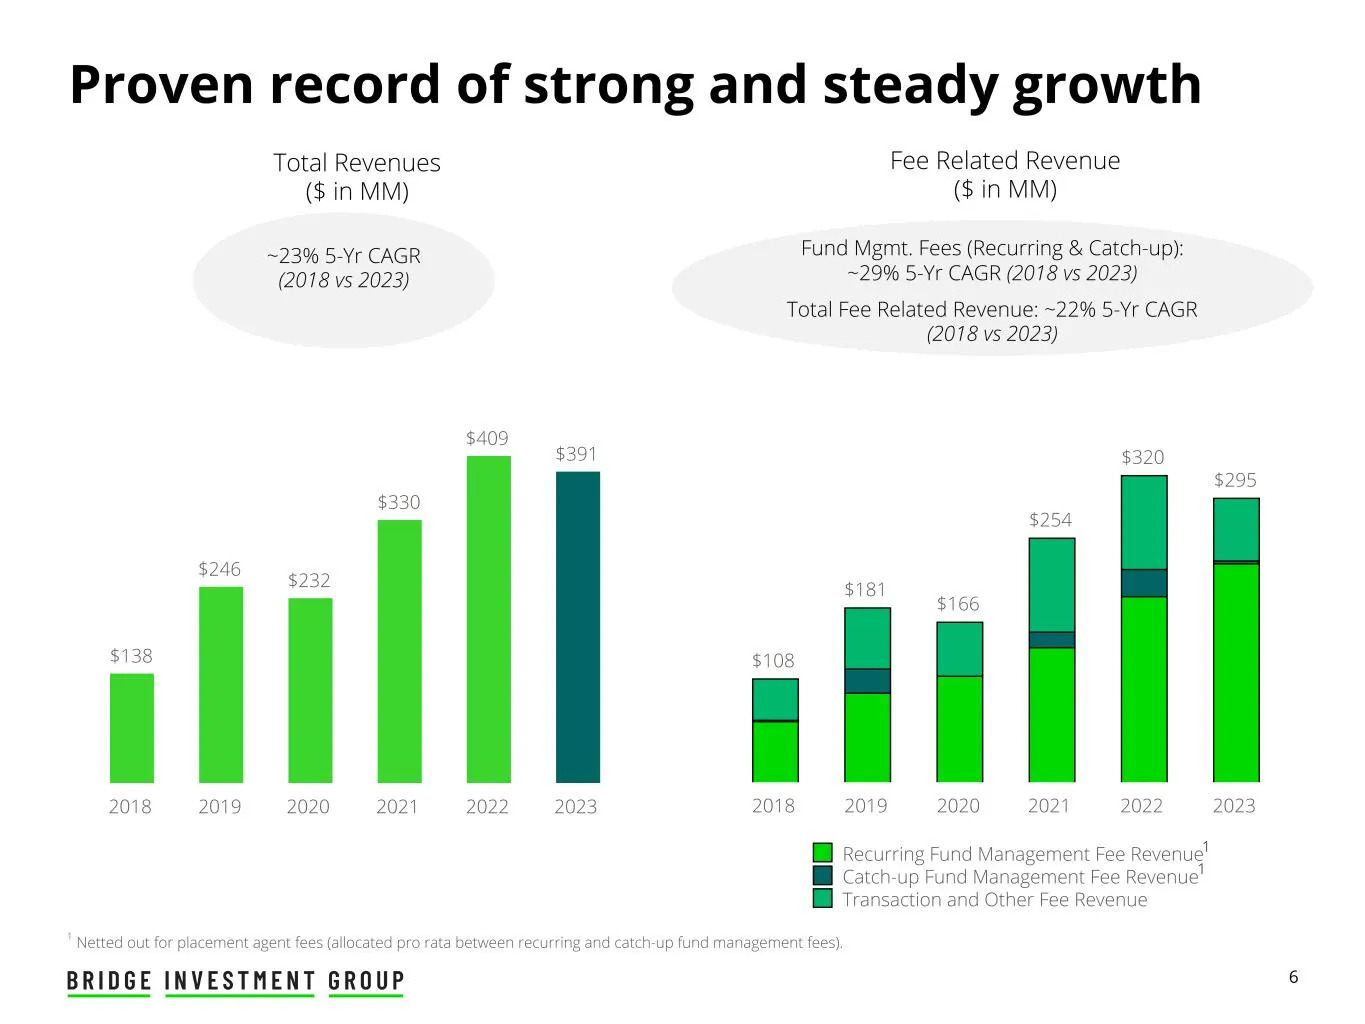
Slide 8: Proven record of strong and steady growth: Revenues
6 $108 $181 $166 $254 $320 $295 Recurring Fund Management Fee Revenue Catch-up Fund Management Fee Revenue Transaction and Other Fee Revenue 2018 2019 2020 2021 2022 2023 $138 $246 $232 $330 $409 $391 2018 2019 2020 2021 2022 2023 Total Revenues ($ in MM) Fee Related Revenue ($ in MM) Proven record
Slide 9: Distributable Earnings
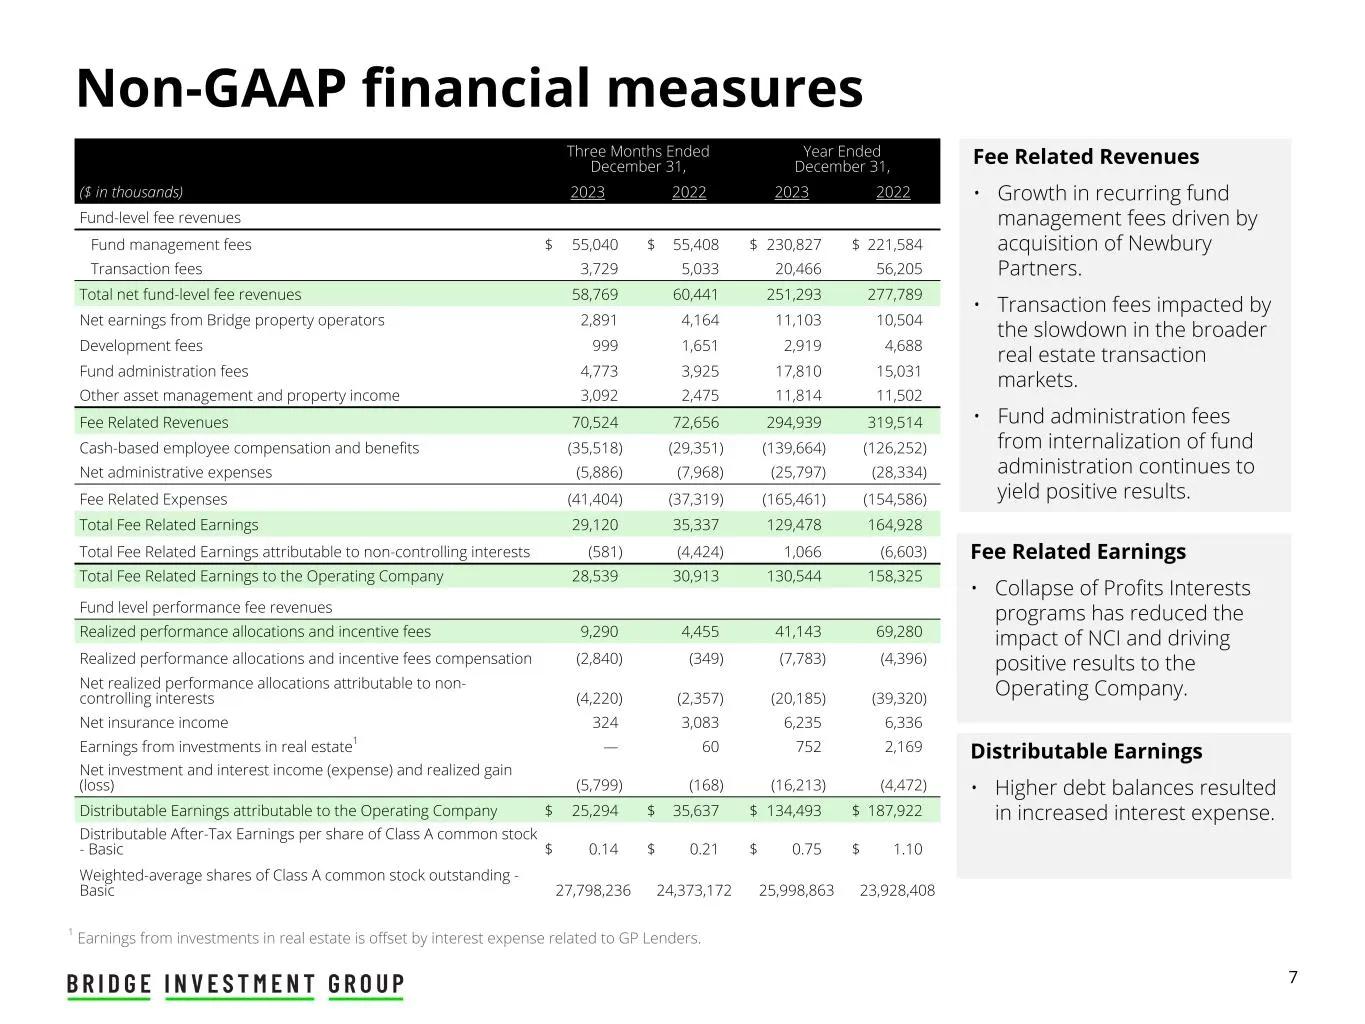
7 Distributable Earnings • Higher debt balances resulted in increased interest expense. Fee Related Earnings • Collapse of Profits Interests programs has reduced the impact of NCI and driving positive results to the Operating Company. Non-GAAP financial measures Three Months Ended December 31, Year
Slide 10: Capital Raised, Deployment and Fee-Earning AUM
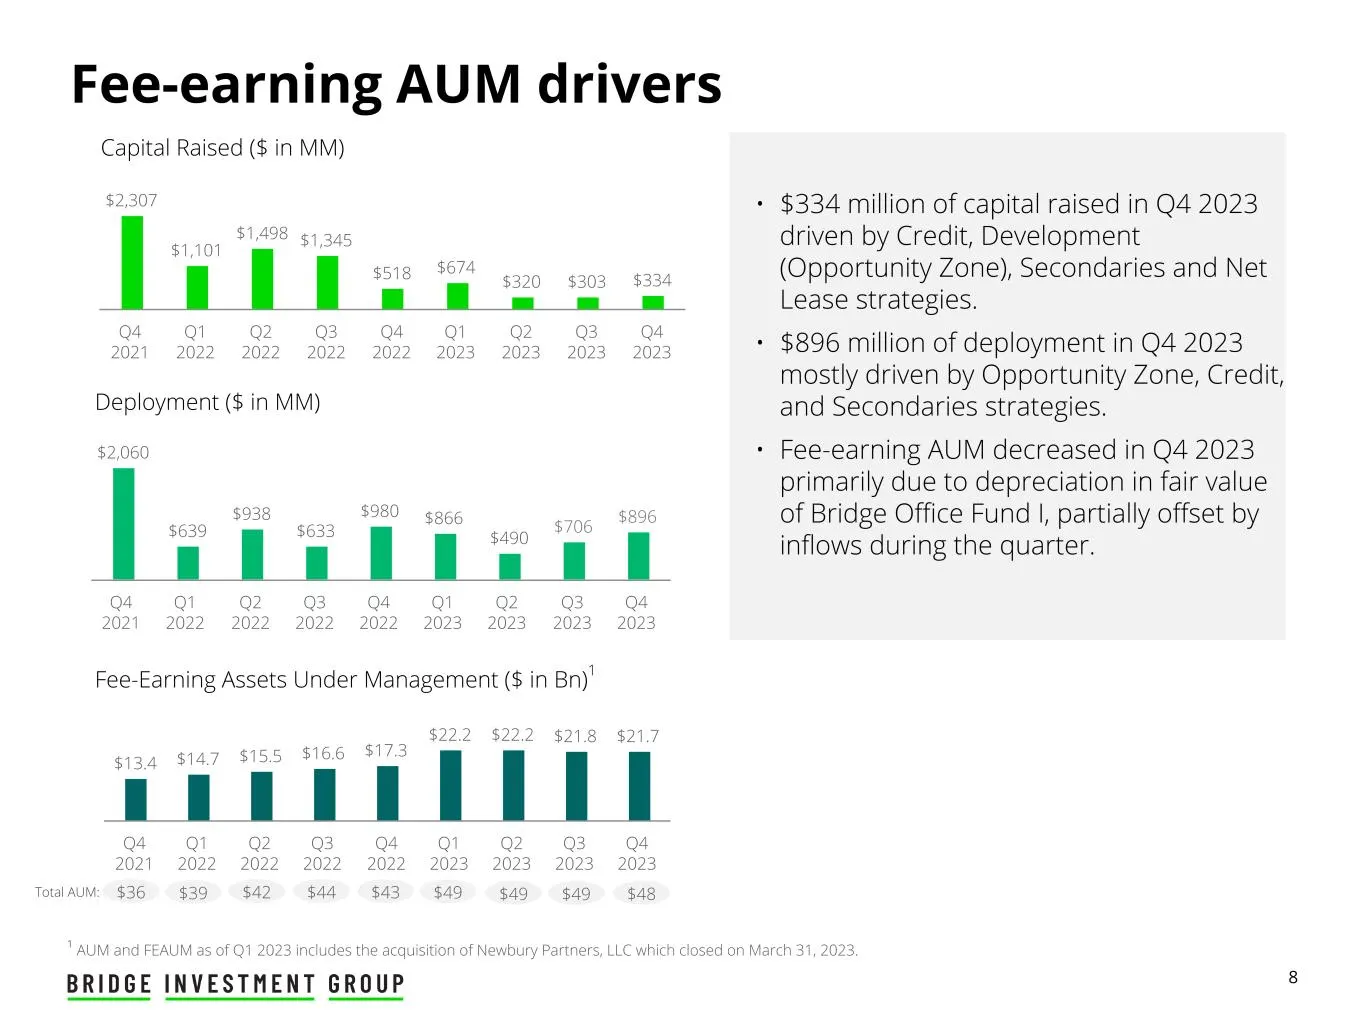
8 $2,307 $1,101 $1,498 $1,345 $518 $674 $320 $303 $334 Q4 2021 Q1 2022 Q2 2022 Q3 2022 Q4 2022 Q1 2023 Q2 2023 Q3 2023 Q4 2023 • $334 million of capital raised in Q4 2023 driven by Credit, Development (Opportunity Zone), Secondaries and Net Lease strategies. • $896 million of deployment in Q4 2023 m
Slide 11: Fee Related Revenue Summary
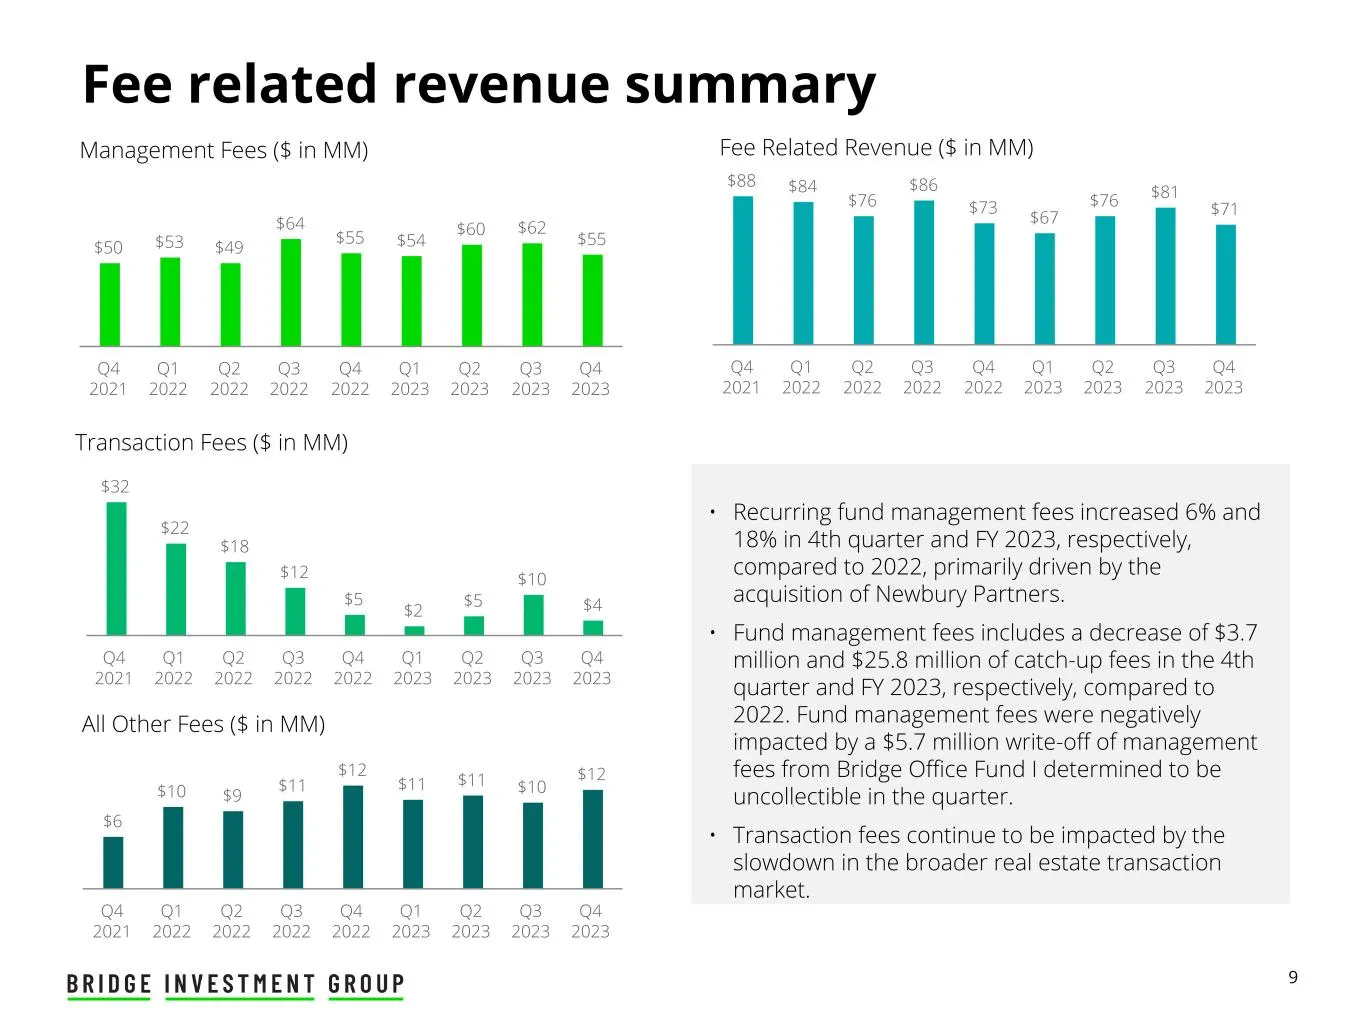
9 Management Fees ($ in MM) Fee related revenue summary Transaction Fees ($ in MM) Fee Related Revenue ($ in MM) • Recurring fund management fees increased 6% and 18% in 4th quarter and FY 2023, respectively, compared to 2022, primarily driven by the acquisition of Newbury Partners. • Fund managemen
Slide 12: Long Duration Capital Drives Fee Visibility
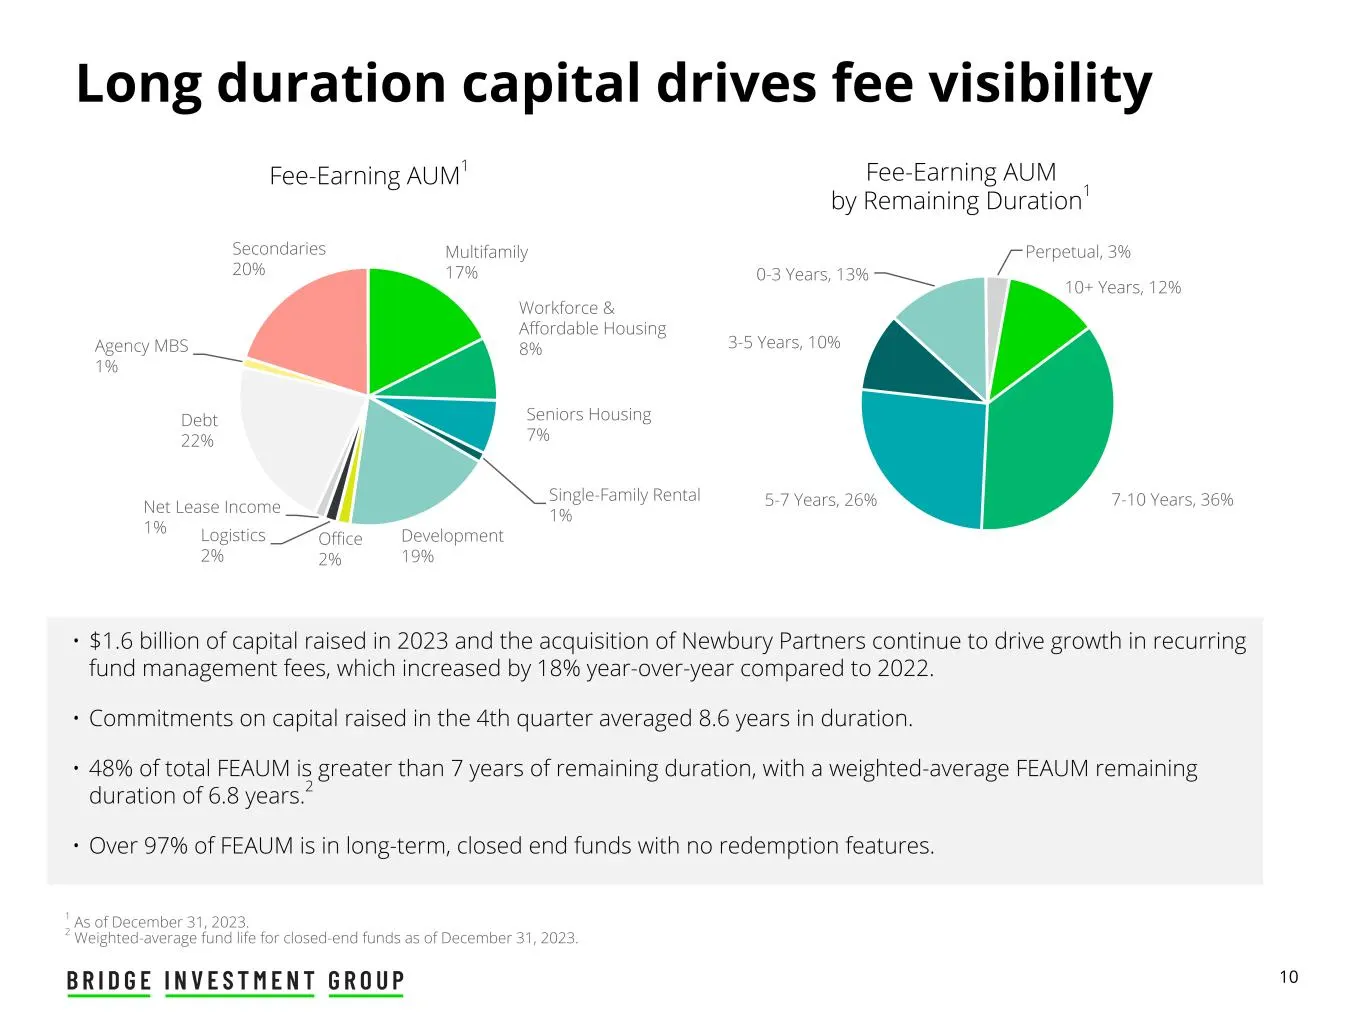
10 1 As of December 31, 2023. 2 Weighted-average fund life for closed-end funds as of December 31, 2023. Long duration capital drives fee visibility Fee-Earning AUM1 Multifamily 17% Workforce & Affordable Housing 8% Seniors Housing 7% Single-Family Rental 1% Development 19% Office 2% Logistics 2% Ne
Slide 13: Earnings Summary
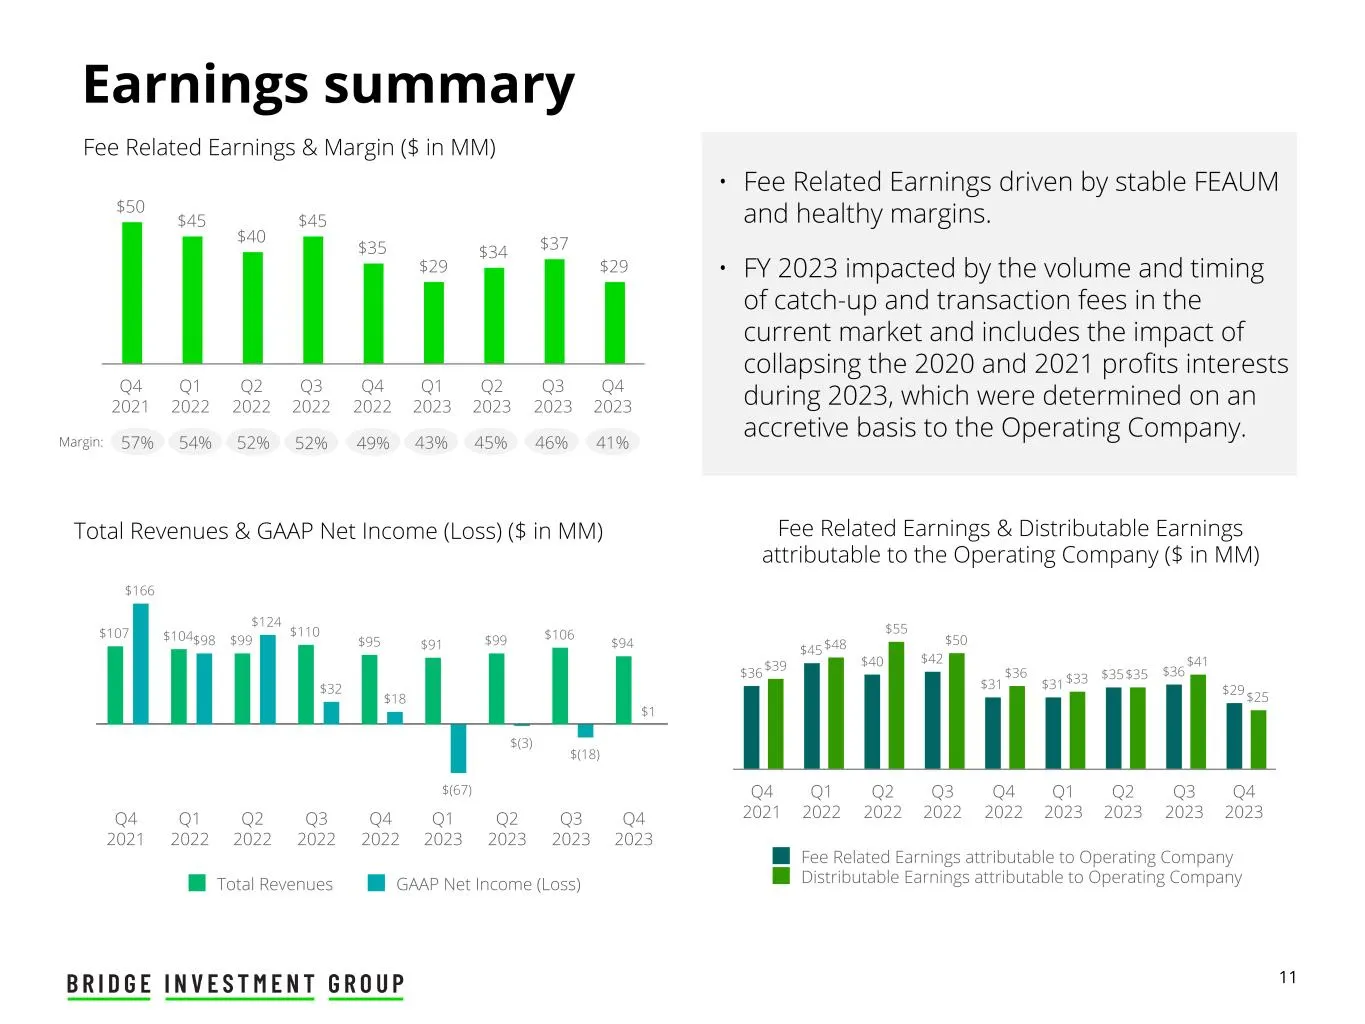
11 $50 $45 $40 $45 $35 $29 $34 $37 $29 Q4 2021 Q1 2022 Q2 2022 Q3 2022 Q4 2022 Q1 2023 Q2 2023 Q3 2023 Q4 2023 Total Revenues & GAAP Net Income (Loss) ($ in MM) Earnings summary Fee Related Earnings & Distributable Earnings attributable to the Operating Company ($ in MM) • Fee Related Earnings drive
Slide 14: Performance Fee Summary
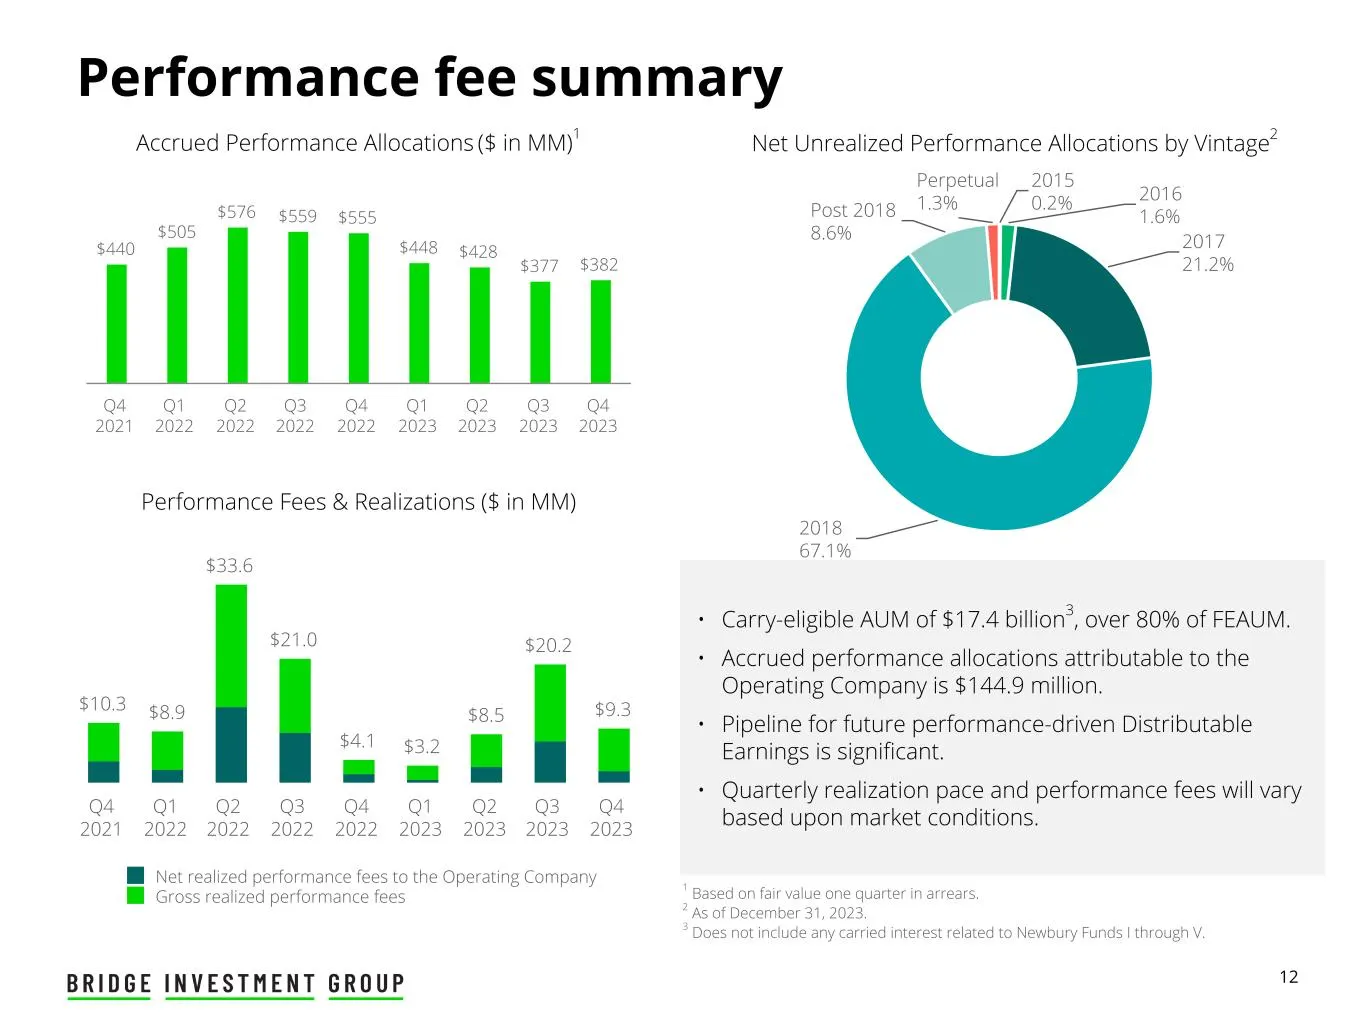
12 $440 $505 $576 $559 $555 $448 $428 $377 $382 Q4 2021 Q1 2022 Q2 2022 Q3 2022 Q4 2022 Q1 2023 Q2 2023 Q3 2023 Q4 2023 Performance fee summary Net Unrealized Performance Allocations by Vintage2Accrued Performance Allocations ($ in MM)1 1 Based on fair value one quarter in arrears. 2 As of December
Slide 15: Compelling Fund-Level Track Record
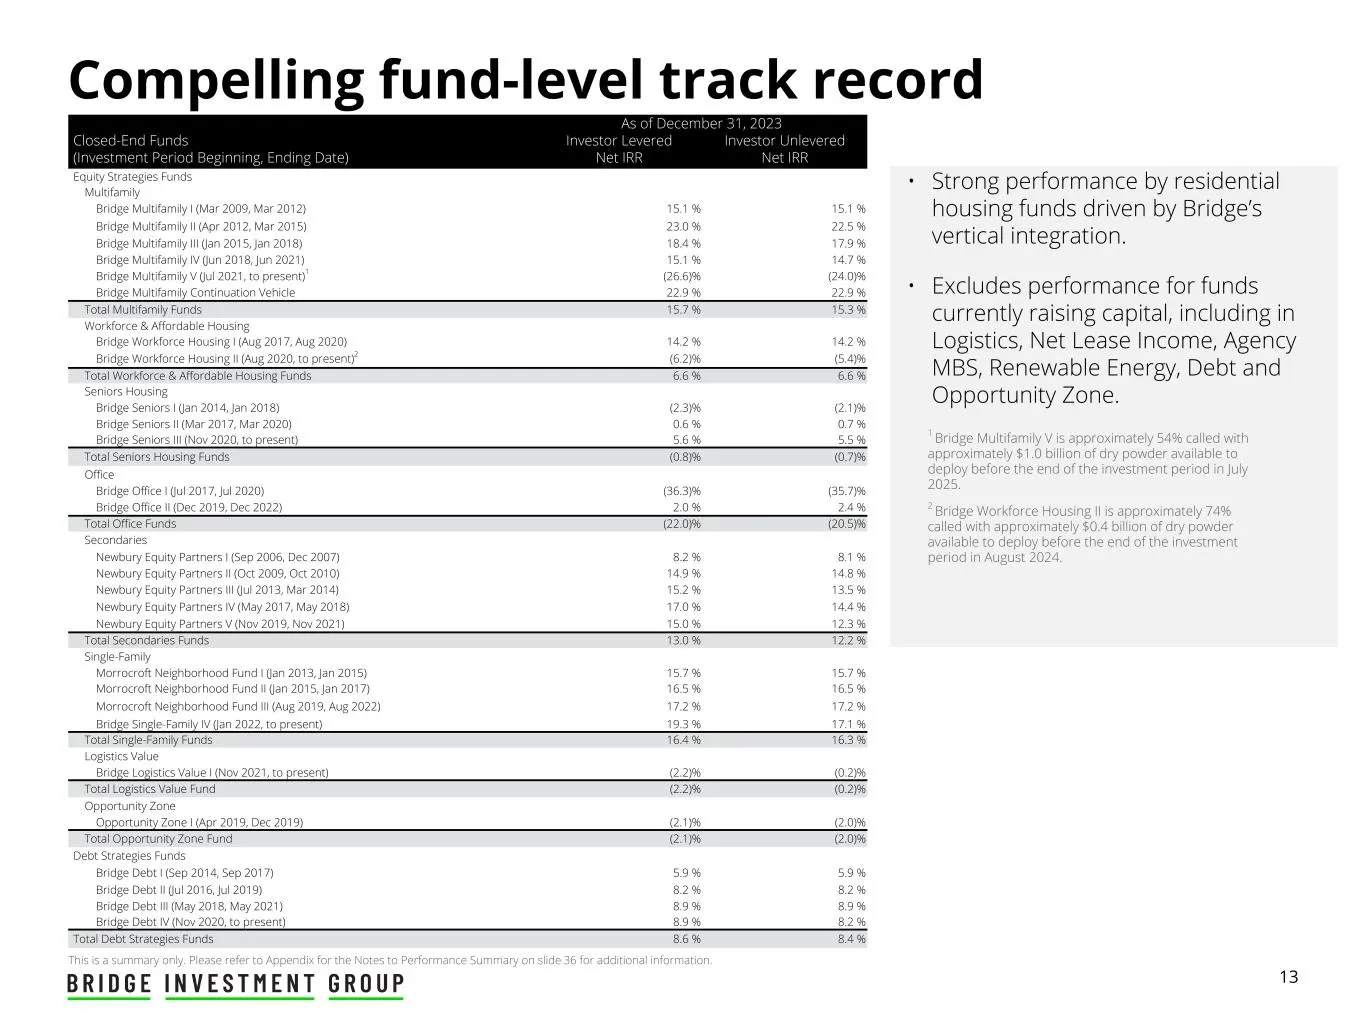
13 Compelling fund-level track record This is a summary only. Please refer to Appendix for the Notes to Performance Summary on slide 36 for additional information. • Strong performance by residential housing funds driven by Bridge’s vertical integration. • Excludes performance for funds currently ra
Slide 16: Distributable Earnings and Capitalization
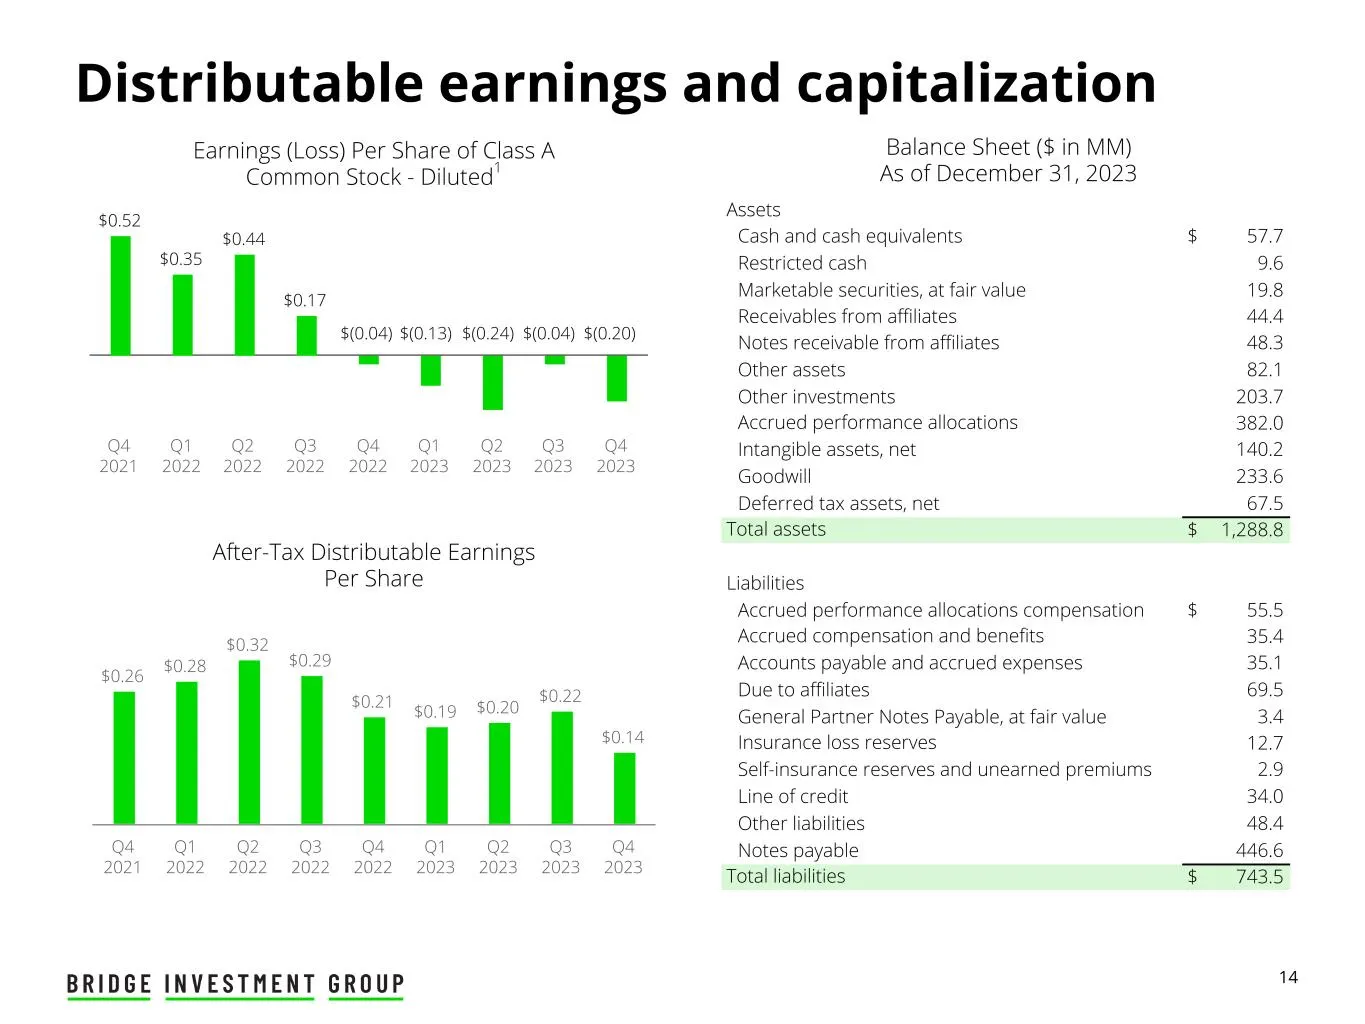
14 $0.52 $0.35 $0.44 $0.17 Q4 2021 Q1 2022 Q2 2022 Q3 2022 Q4 2022 Q1 2023 Q2 2023 Q3 2023 Q4 2023 Distributable earnings and capitalization Balance Sheet ($ in MM) As of December 31, 2023 After-Tax Distributable Earnings Per Share $0.26 $0.28 $0.32 $0.29 $0.21 $0.19 $0.20 $0.22 $0.14 Q4 2021 Q1 202
Slide 17: Company Overview
Company Overview 15
Slide 18: Bridge Investment Group Overview
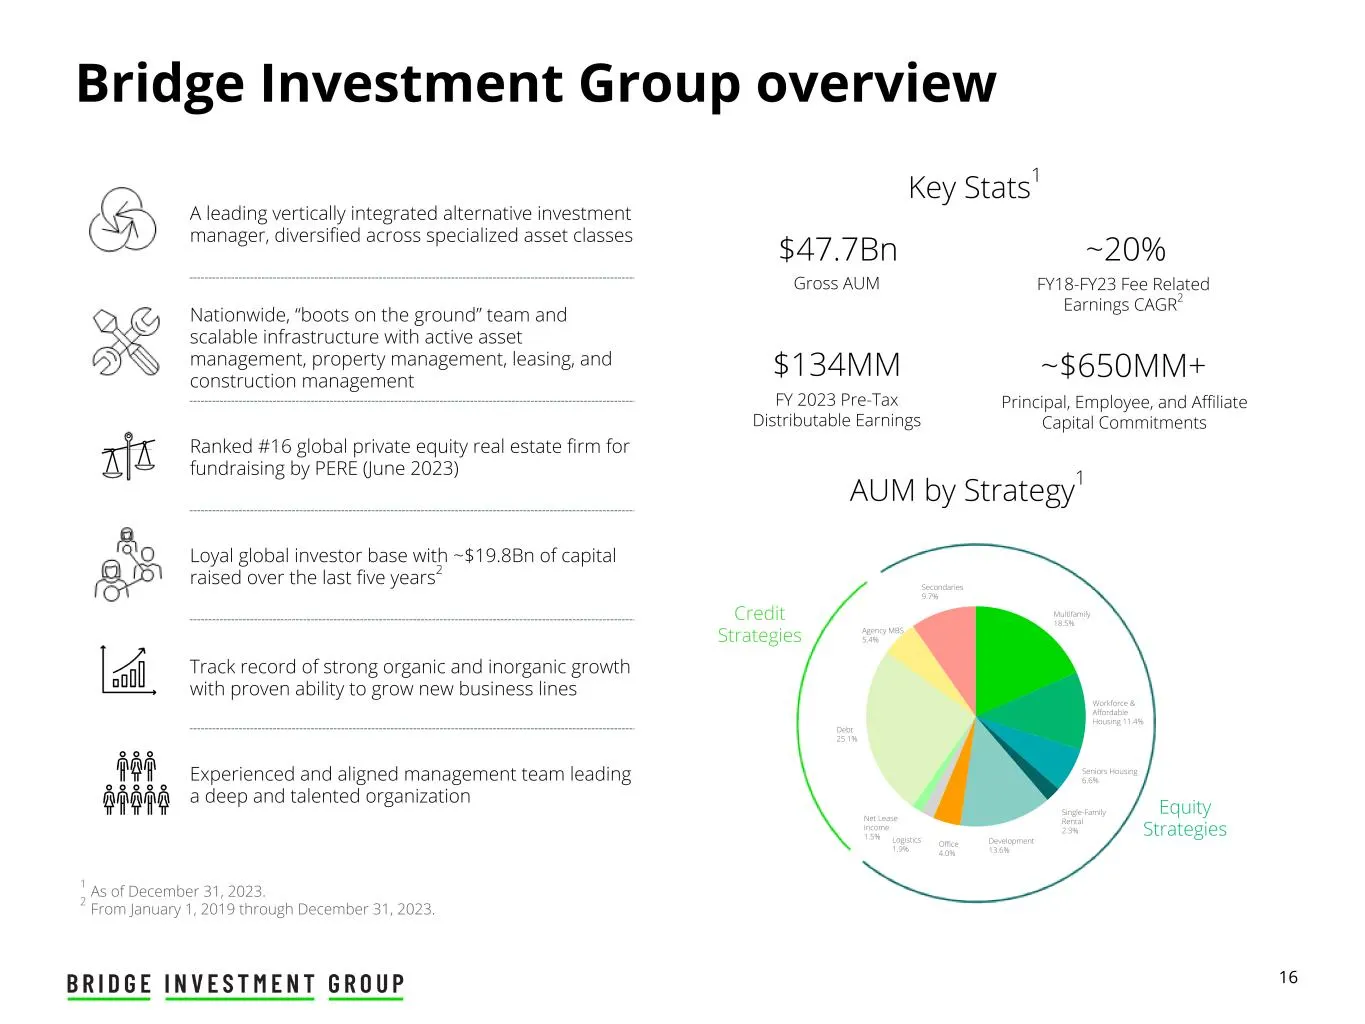
16 Multifamily 18.5% Workforce & Affordable Housing 11.4% Seniors Housing 6.6% Single-Family Rental 2.3% Development 13.6% Office 4.0% Logistics 1.9% Net Lease Income 1.5% Debt 25.1% Agency MBS 5.4% Secondaries 9.7% Bridge Investment Group overview A leading vertically integrated alternative investm
Slide 19: Bridge Investment Group Key Highlights
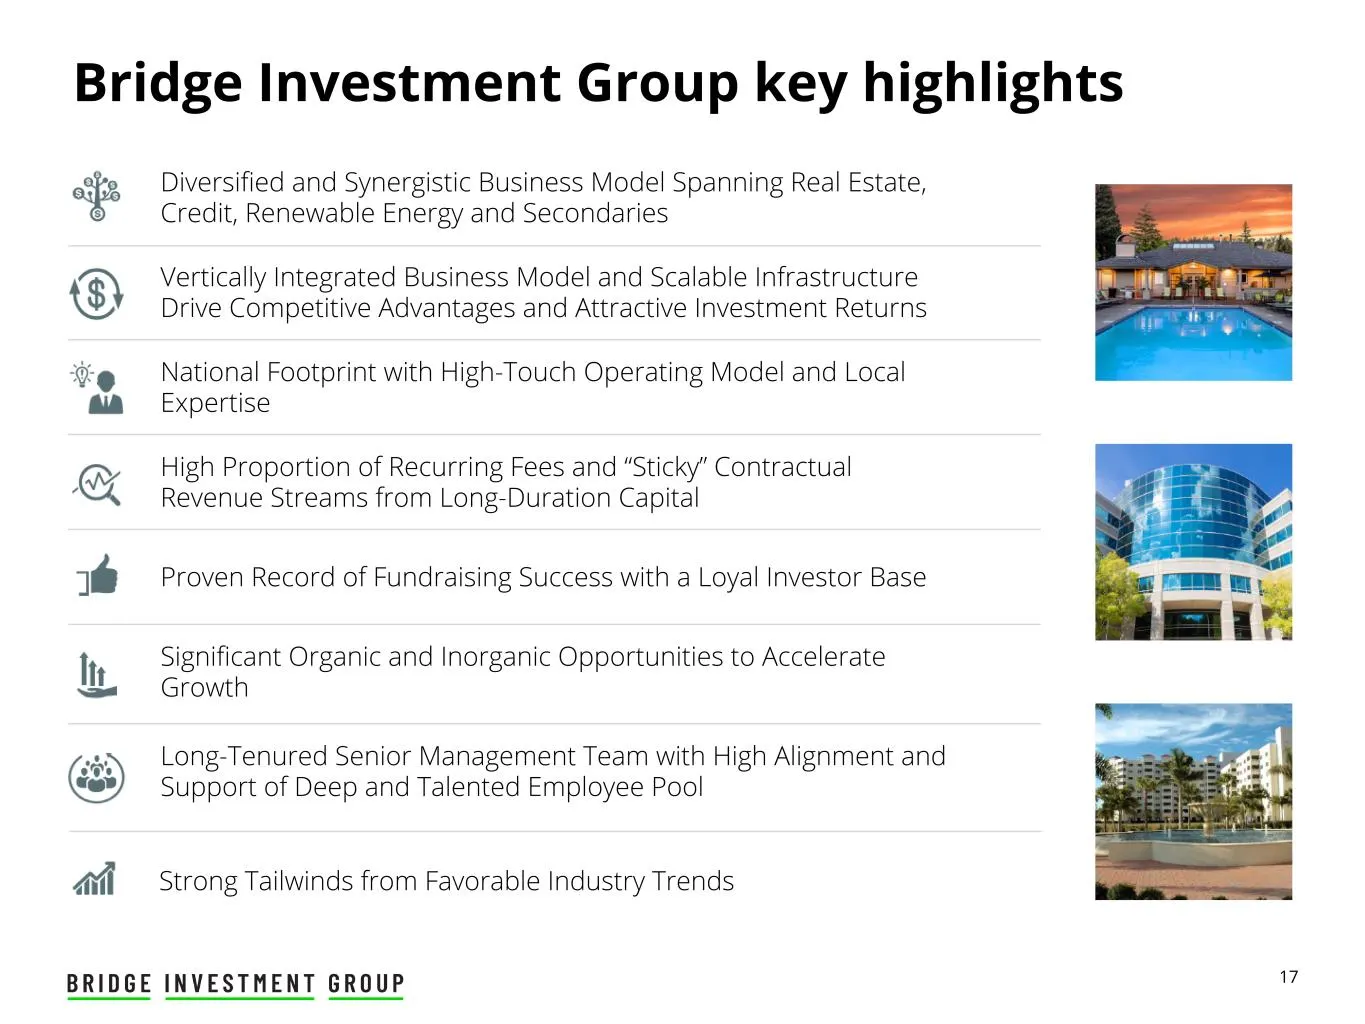
17 Strong Tailwinds from Favorable Industry Trends Diversified and Synergistic Business Model Spanning Real Estate, Credit, Renewable Energy and Secondaries Vertically Integrated Business Model and Scalable Infrastructure Drive Competitive Advantages and Attractive Investment Returns National Footpr
Slide 20: Bridge's Differentiated Approach Drives Results
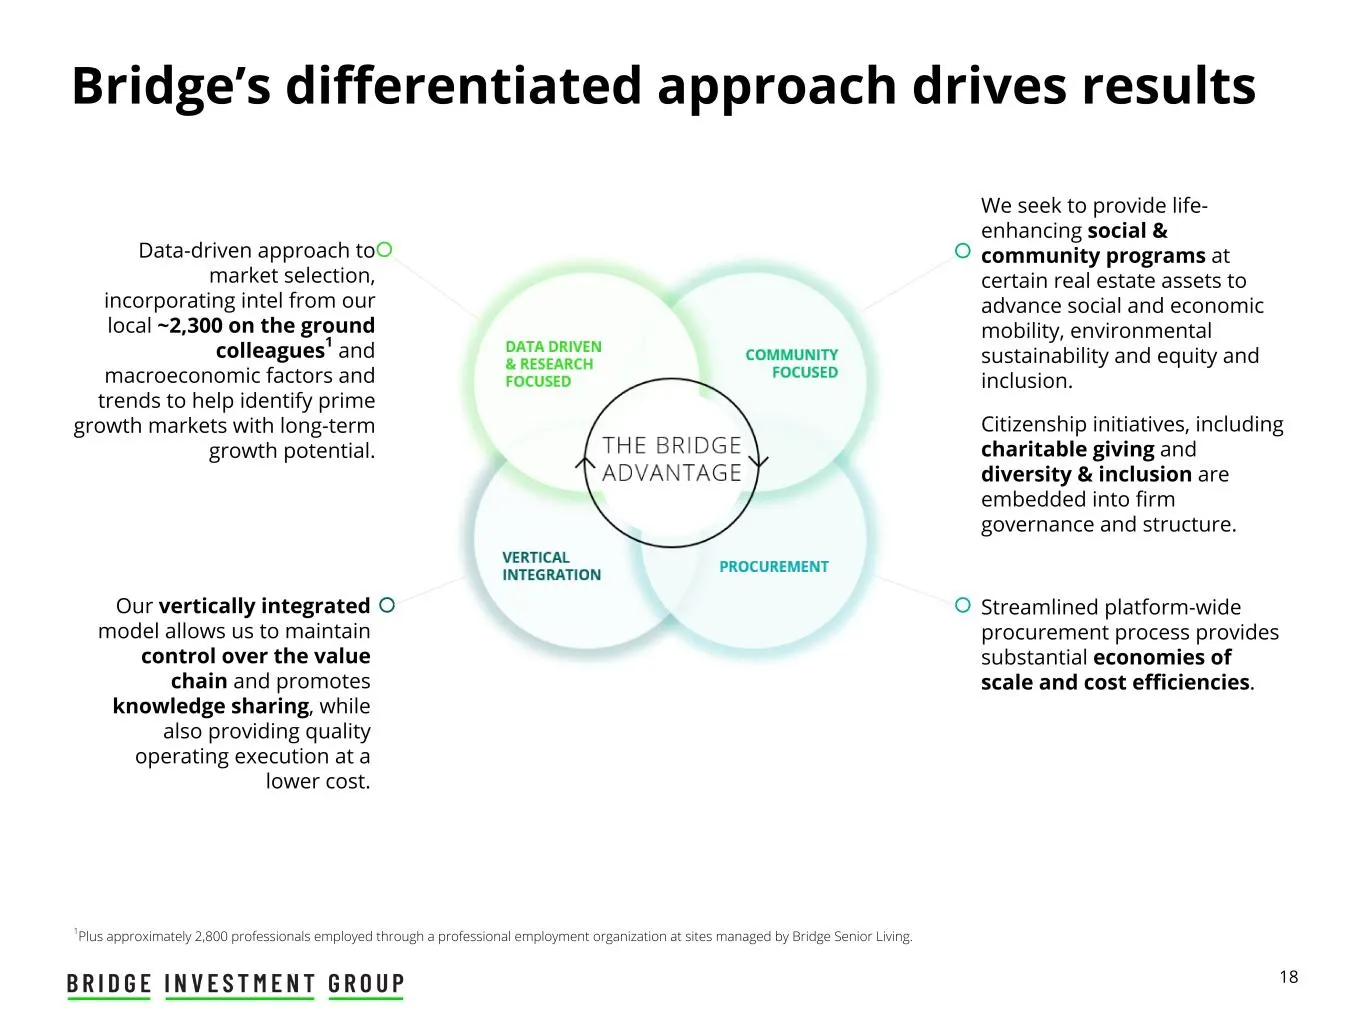
18 Bridge’s differentiated approach drives results 1Plus approximately 2,800 professionals employed through a professional employment organization at sites managed by Bridge Senior Living. Data-driven approach to market selection, incorporating intel from our local ~2,300 on the ground colleagues1 a
Slide 21: Balanced Investor Base
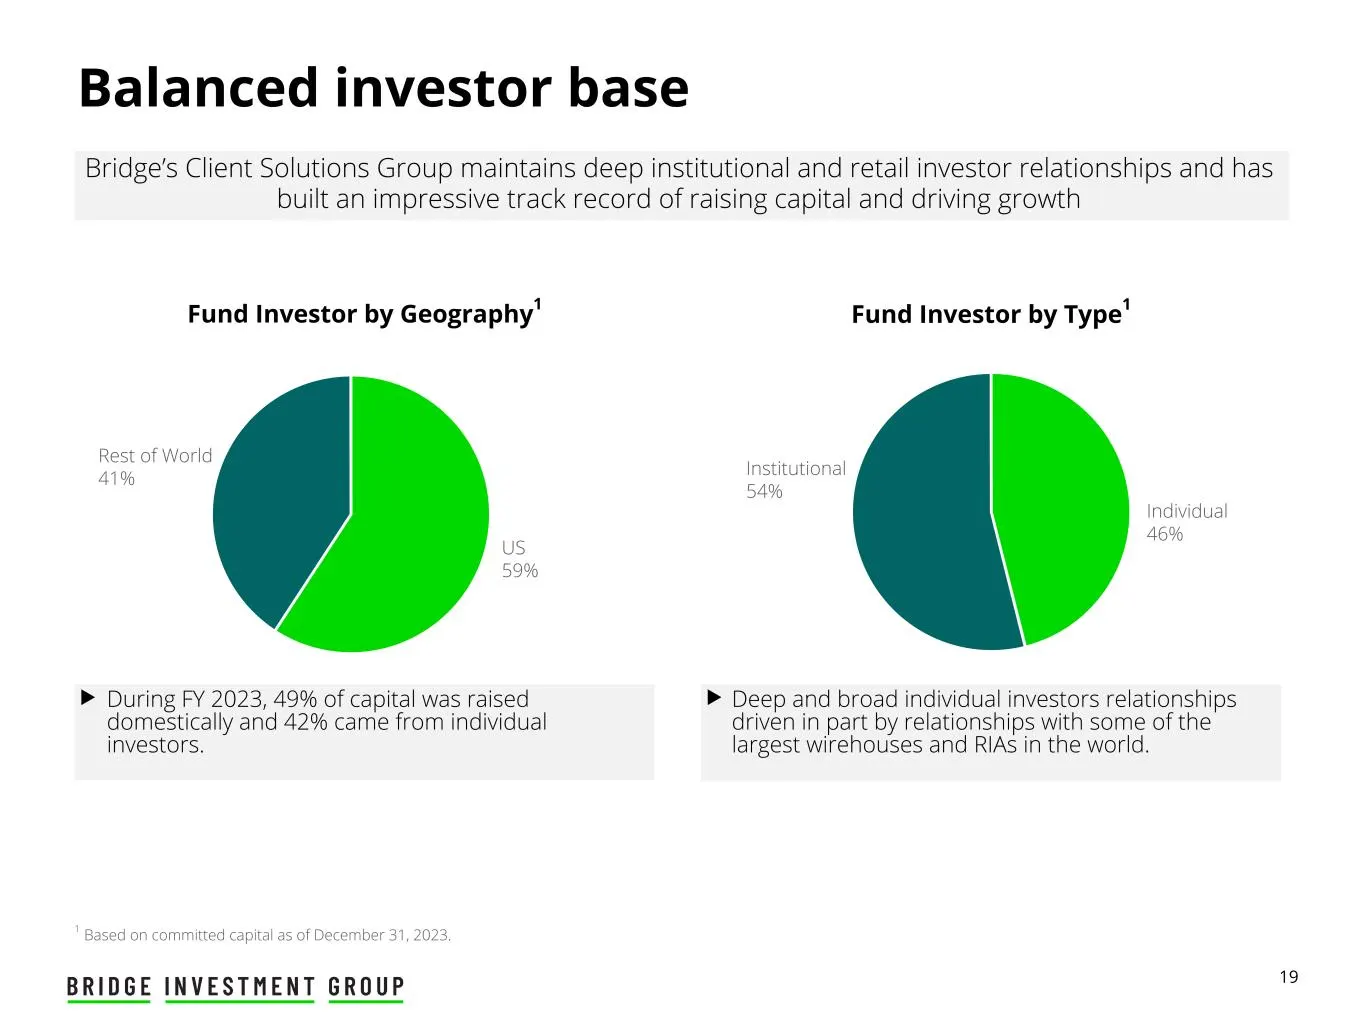
19 Individual 46% Institutional 54% Balanced investor base Fund Investor by Geography1 Fund Investor by Type1 Bridge’s Client Solutions Group maintains deep institutional and retail investor relationships and has built an impressive track record of raising capital and driving growth u During FY 2023
Slide 22: Track Record of Fundraising Success with a Loyal Investor Base
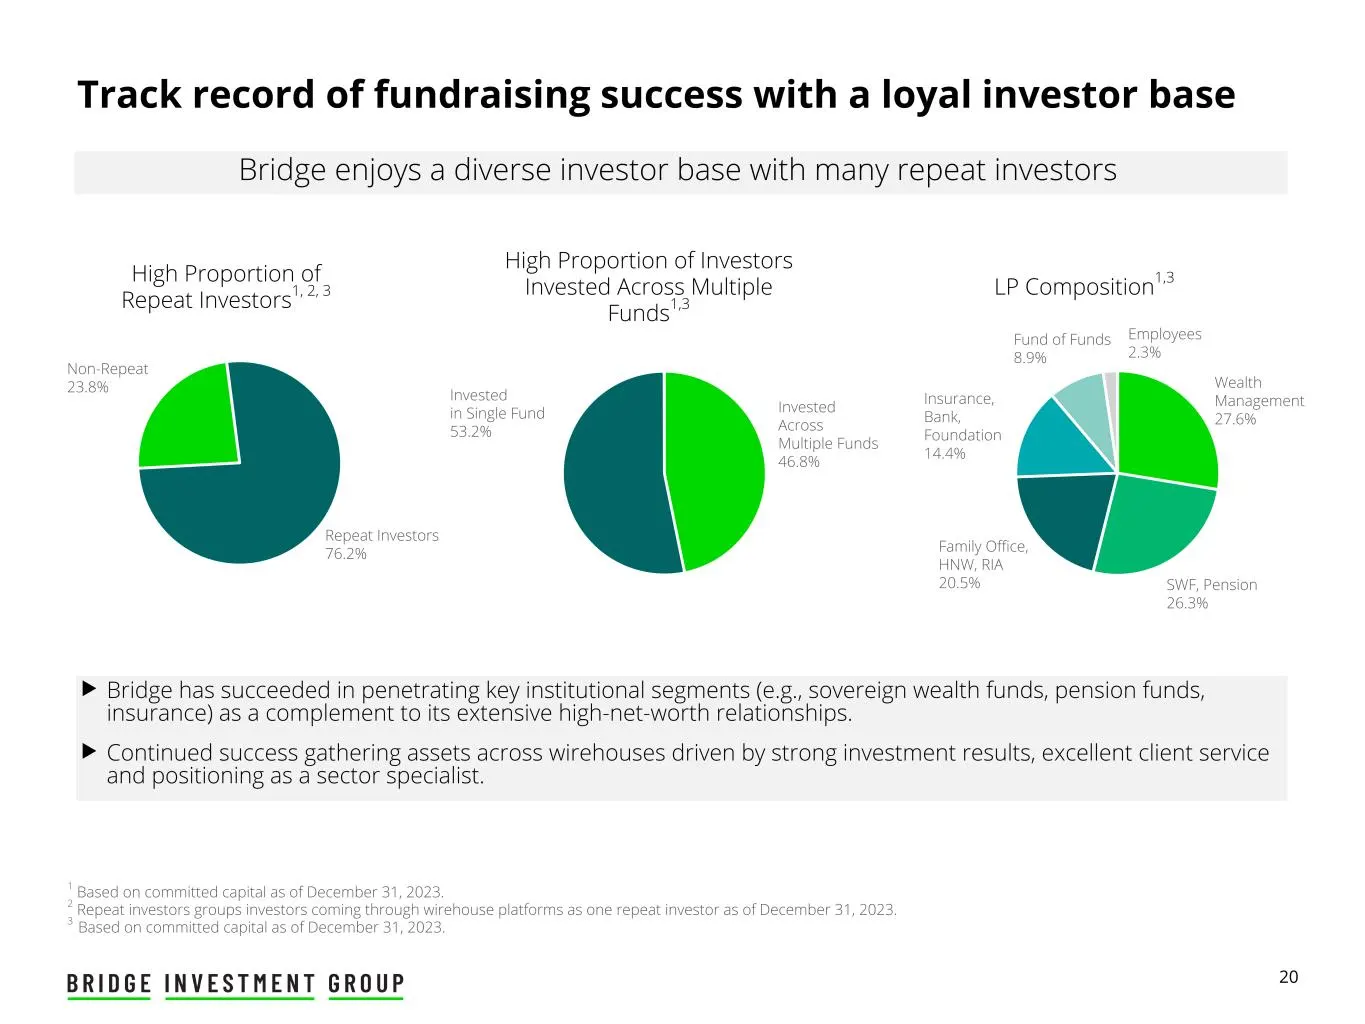
20 High Proportion of Repeat Investors1, 2, 3 High Proportion of Investors Invested Across Multiple Funds1,3 LP Composition1,3 1 Based on committed capital as of December 31, 2023. 2 Repeat investors groups investors coming through wirehouse platforms as one repeat investor as of December 31, 2023.
Slide 23: Sustainability and Responsibility Initiatives
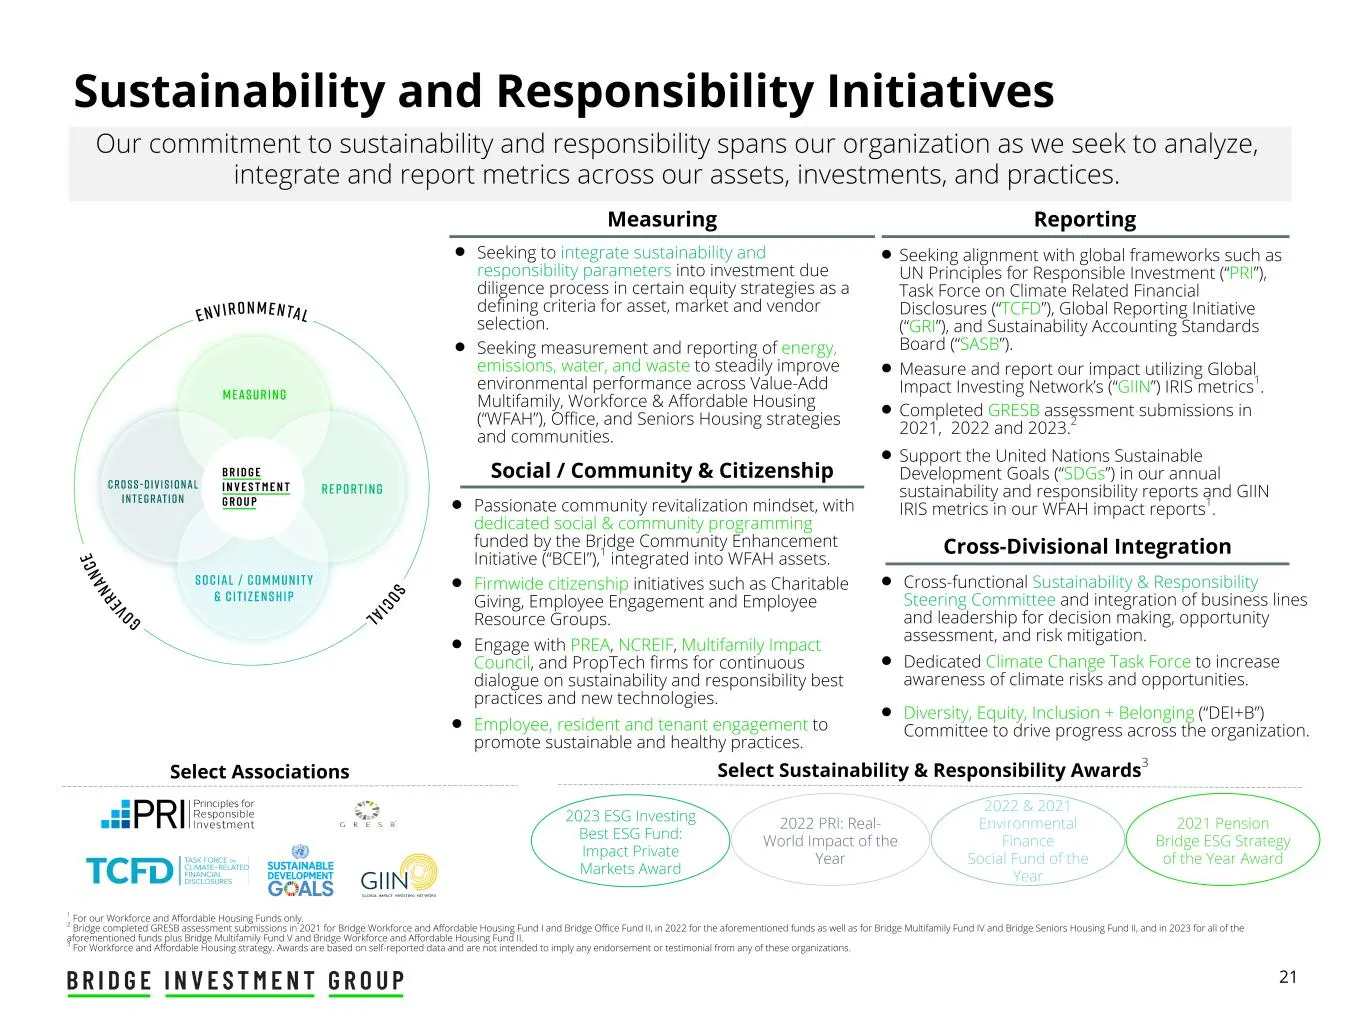
21 Sustainability and Responsibility Initiatives Our commitment to sustainability and responsibility spans our organization as we seek to analyze, integrate and report metrics across our assets, investments, and practices. Select Associations Select Sustainability & Responsibility Awards3 2021 Pensi
Slide 24: Appendix
Appendix 22
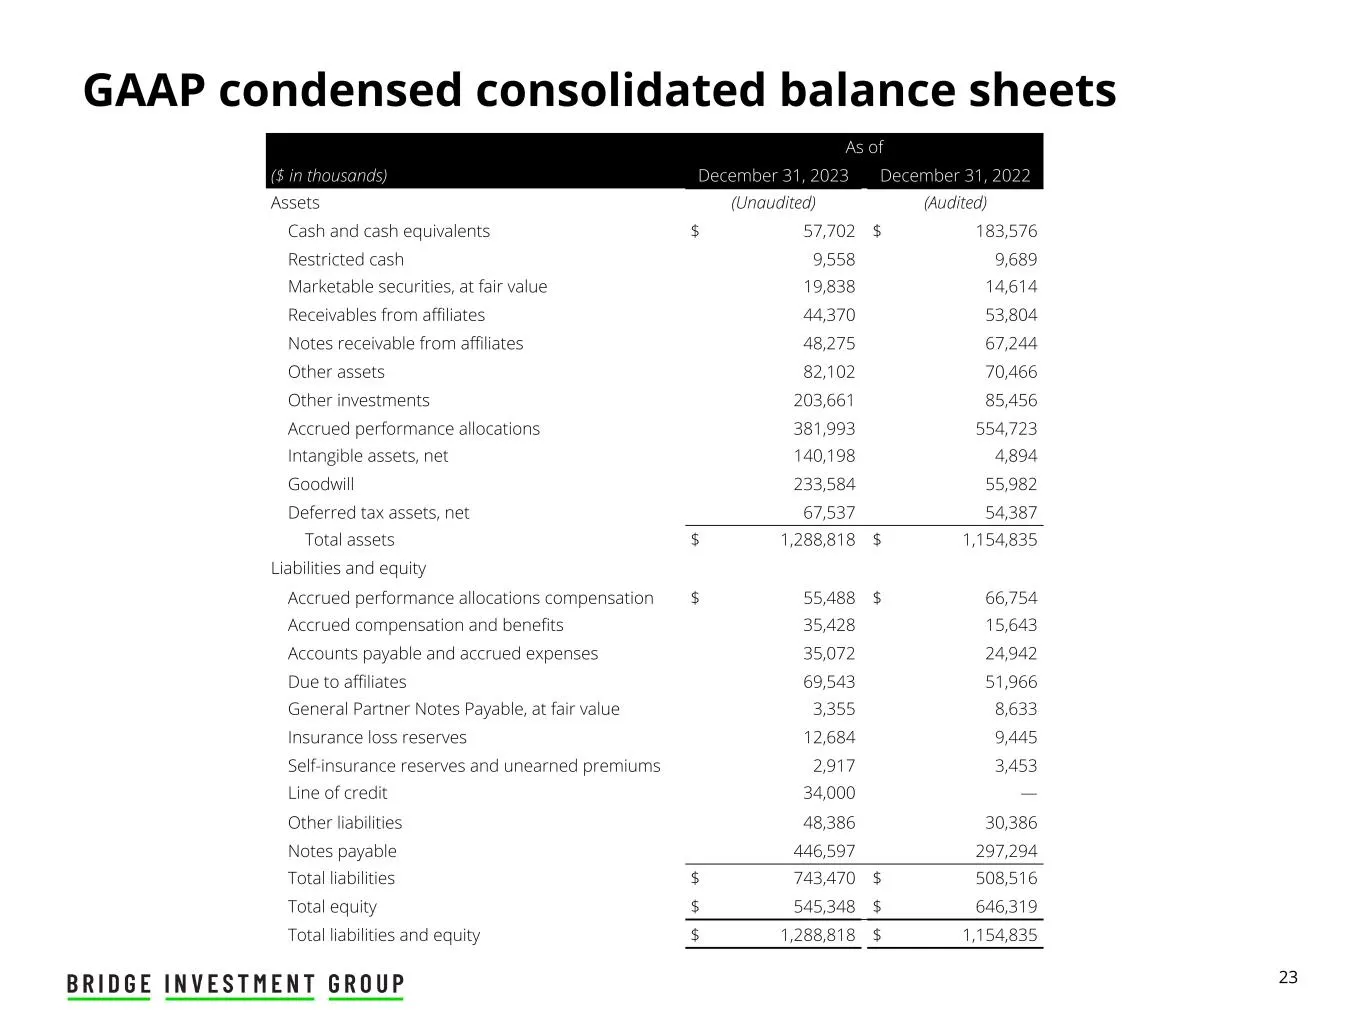
Slide 25: Consolidated Balance Sheet
23 As of ($ in thousands) December 31, 2023 December 31, 2022 Assets (Unaudited) (Audited) Cash and cash equivalents $ 57,702 $ 183,576 Restricted cash 9,558 9,689 Marketable securities, at fair value 19,838 14,614 Receivables from affiliates 44,370 53,804 Notes receivable from affiliates 48,275 67,
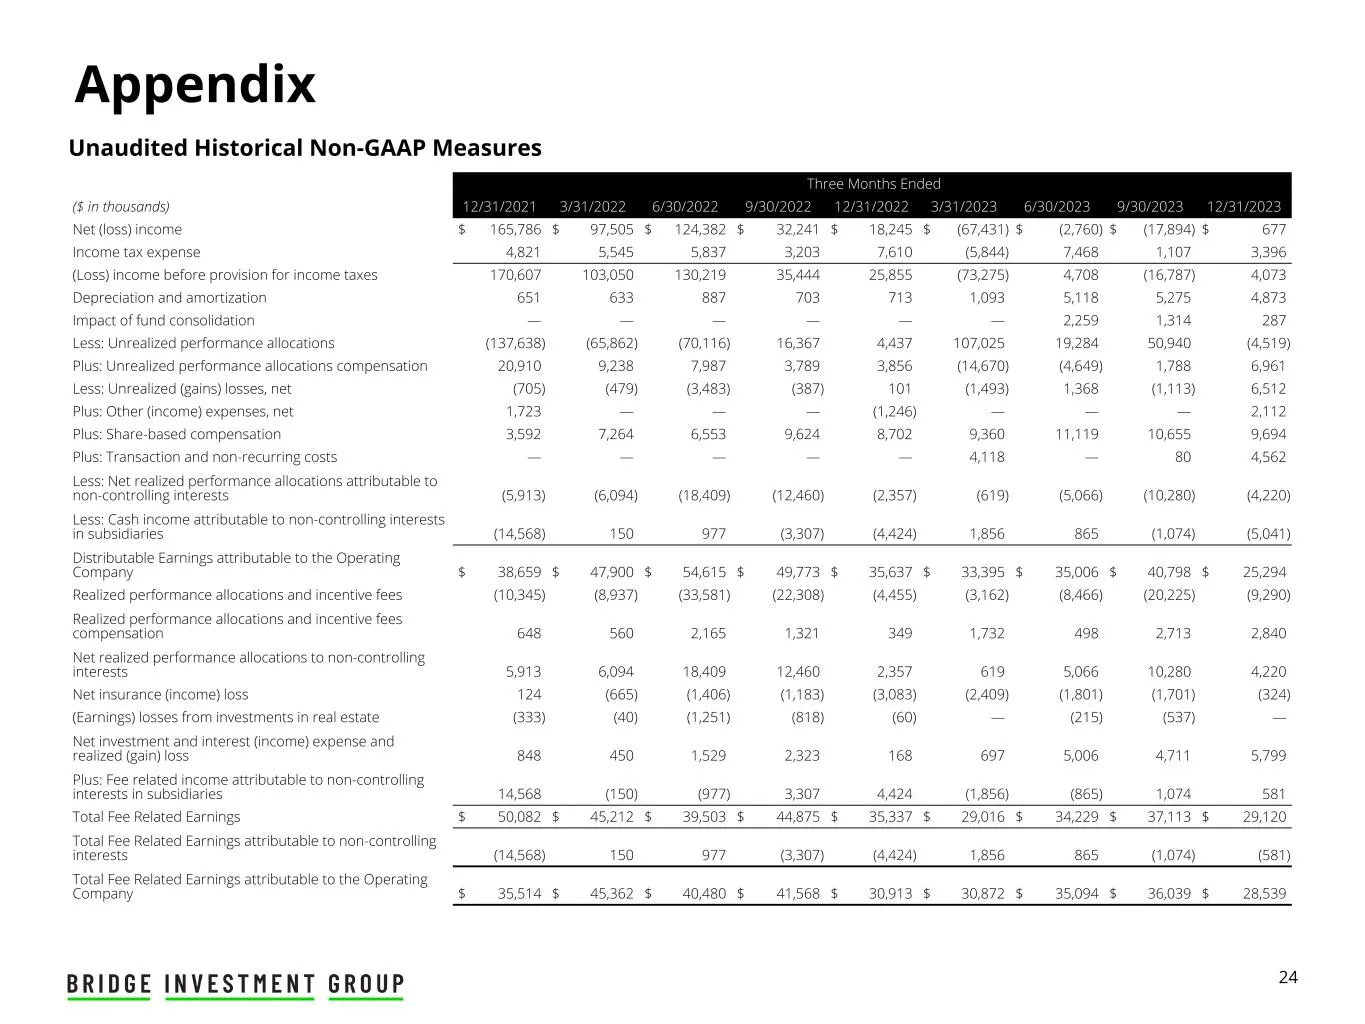
Slide 26: Unaudited Historical Non-GAAP Measures
24 Appendix Unaudited Historical Non-GAAP Measures Three Months Ended ($ in thousands) 12/31/2021 3/31/2022 6/30/2022 9/30/2022 12/31/2022 3/31/2023 6/30/2023 9/30/2023 12/31/2023 Net (loss) income $ 165,786 $ 97,505 $ 124,382 $ 32,241 $ 18,245 $ (67,431) $ (2,760) $ (17,894) $ 677 Income tax expens
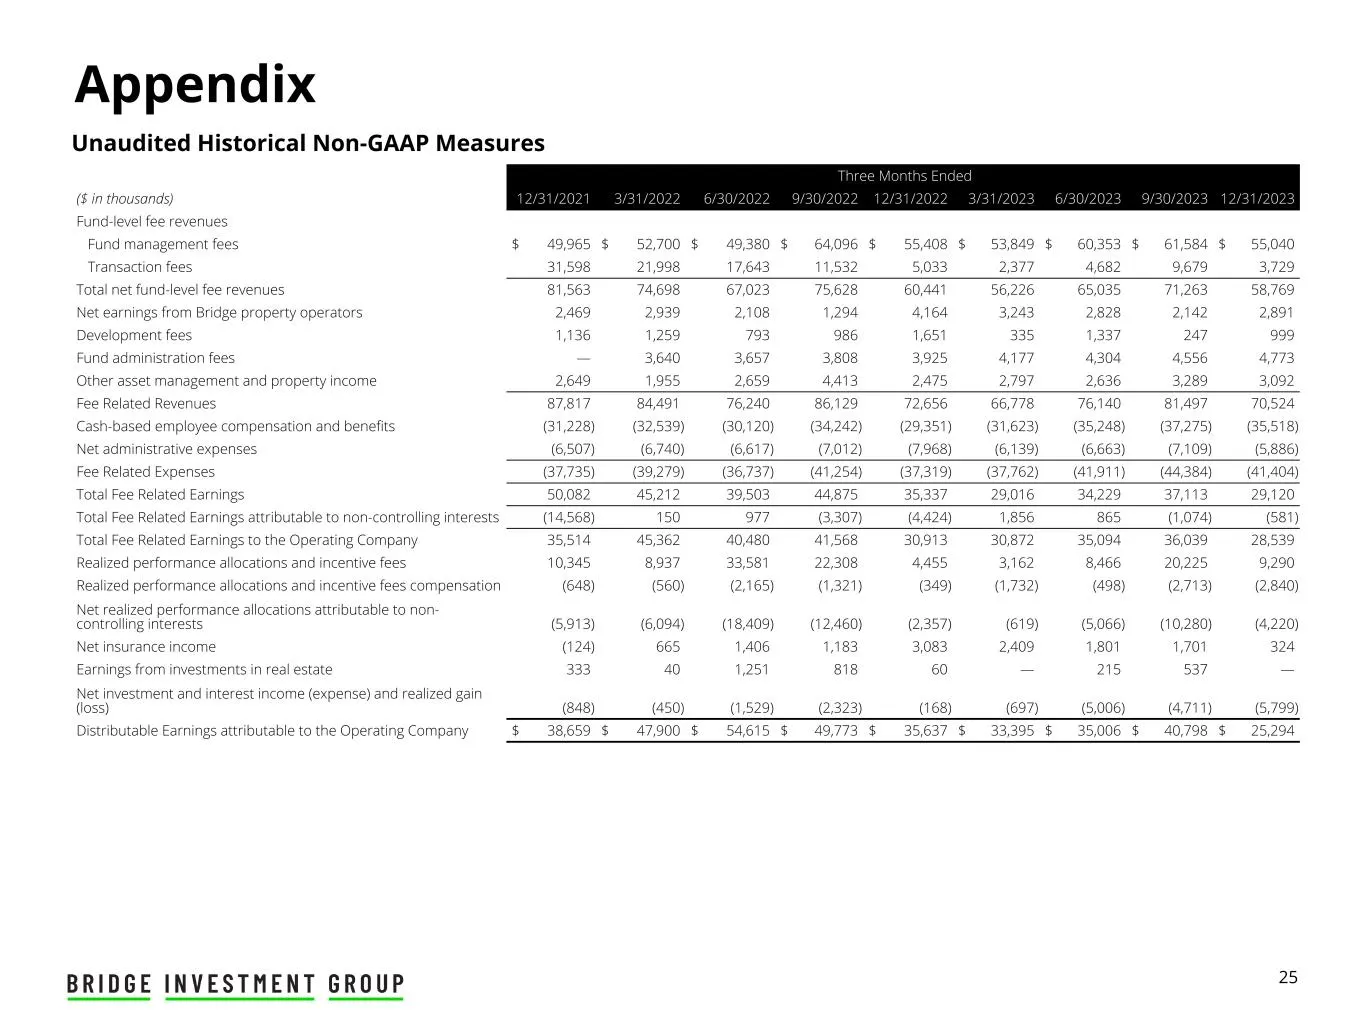
Slide 27: Unaudited Historical Non-GAAP Measures
25 Appendix Unaudited Historical Non-GAAP Measures Three Months Ended ($ in thousands) 12/31/2021 3/31/2022 6/30/2022 9/30/2022 12/31/2022 3/31/2023 6/30/2023 9/30/2023 12/31/2023 Fund-level fee revenues Fund management fees $ 49,965 $ 52,700 $ 49,380 $ 64,096 $ 55,408 $ 53,849 $ 60,353 $ 61,584 $ 5
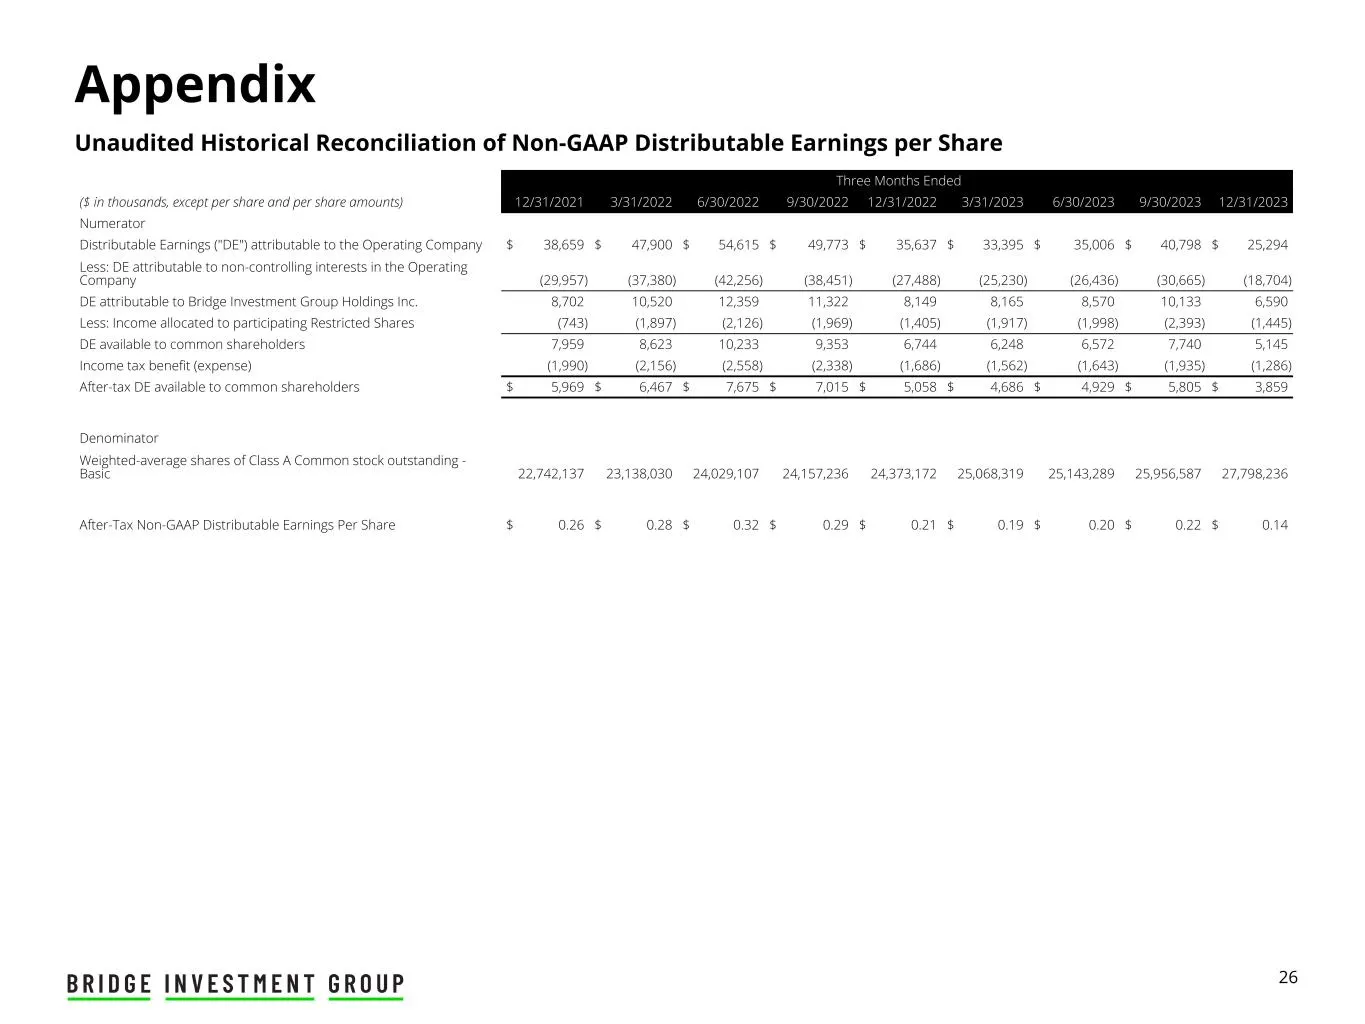
Slide 28: Reconciliation of Non-GAAP Distributable Earnings per Share
26 Appendix Unaudited Historical Reconciliation of Non-GAAP Distributable Earnings per Share Three Months Ended ($ in thousands, except per share and per share amounts) 12/31/2021 3/31/2022 6/30/2022 9/30/2022 12/31/2022 3/31/2023 6/30/2023 9/30/2023 12/31/2023 Numerator Distributable Earnings ("DE"
Slide 29: Unaudited Historical Non-GAAP to GAAP Reconciliation
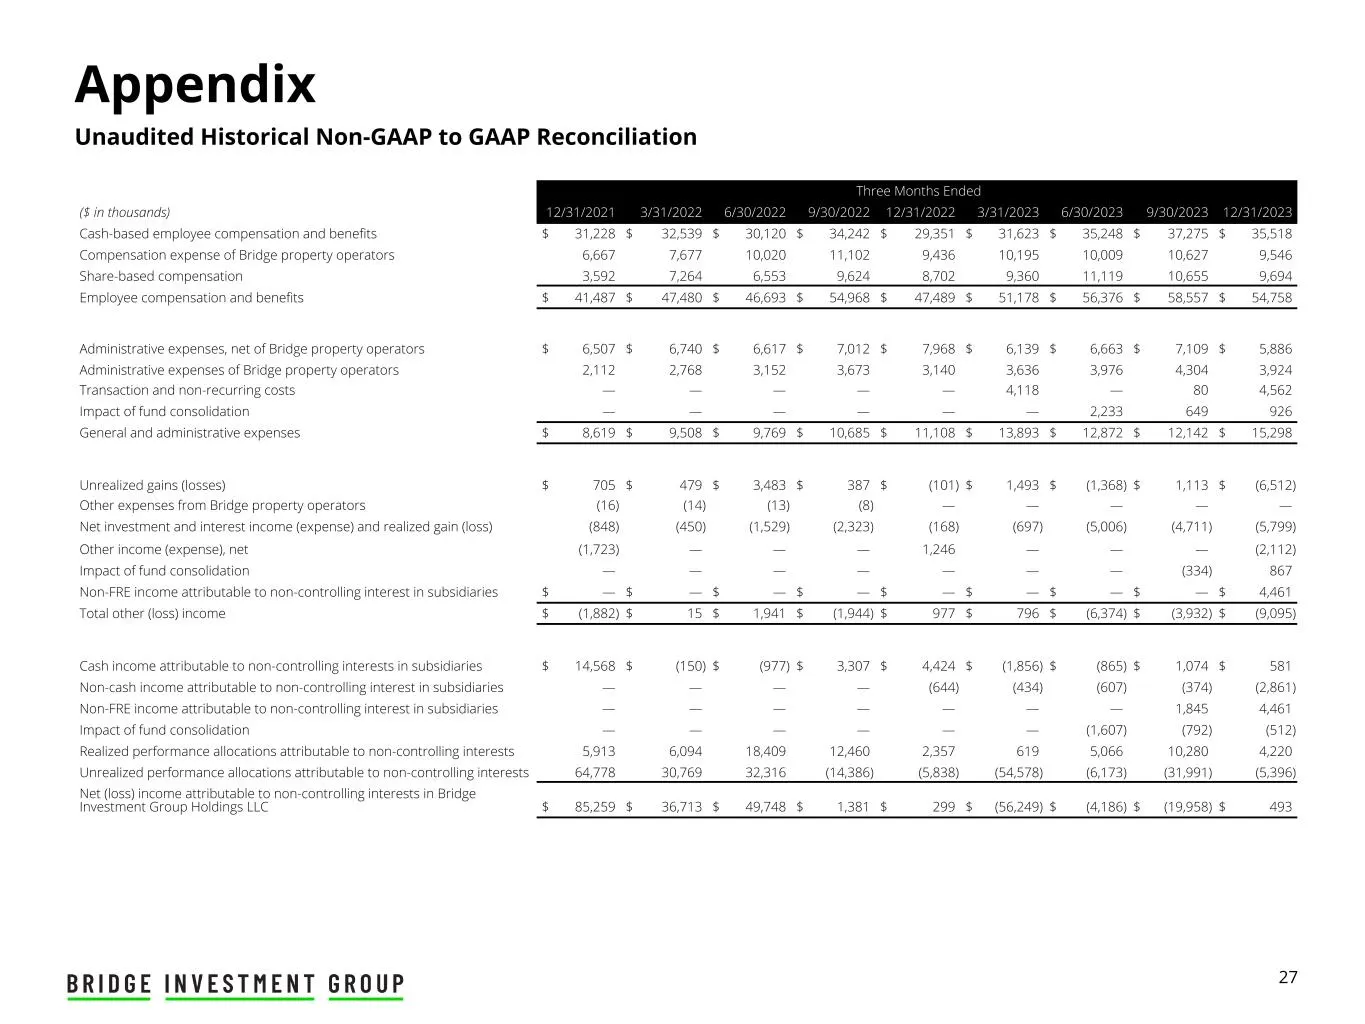
27 Appendix Unaudited Historical Non-GAAP to GAAP Reconciliation Three Months Ended ($ in thousands) 12/31/2021 3/31/2022 6/30/2022 9/30/2022 12/31/2022 3/31/2023 6/30/2023 9/30/2023 12/31/2023 Cash-based employee compensation and benefits $ 31,228 $ 32,539 $ 30,120 $ 34,242 $ 29,351 $ 31,623 $ 35,2
Slide 30: AUM and FEAUM Roll Forward
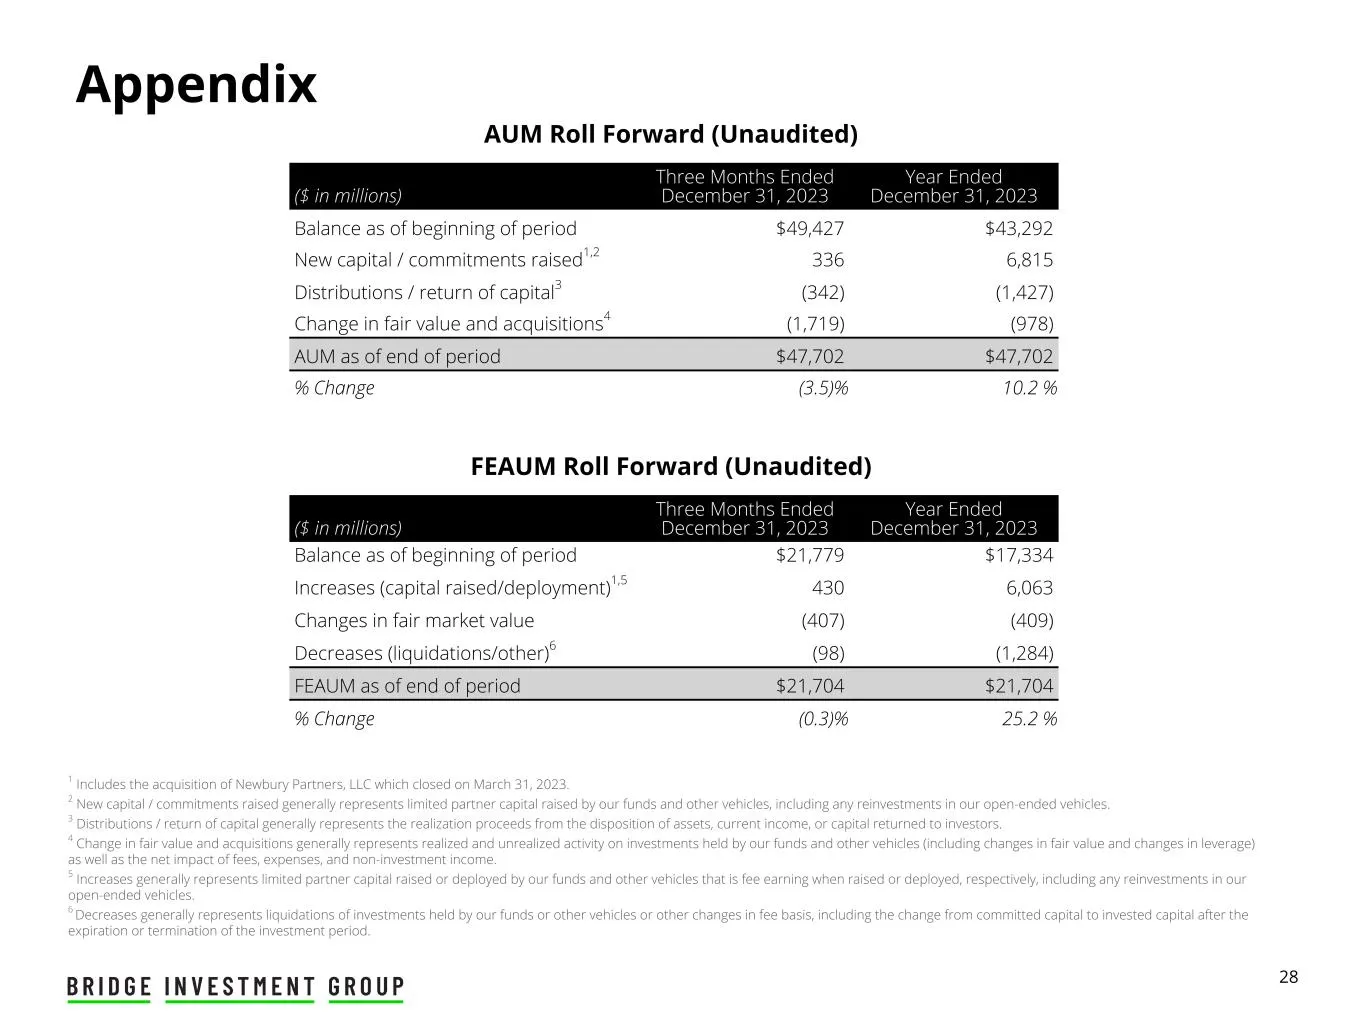
28 Appendix AUM Roll Forward (Unaudited) FEAUM Roll Forward (Unaudited) ($ in millions) Three Months Ended December 31, 2023 Year Ended December 31, 2023 Balance as of beginning of period $21,779 $17,334 Increases (capital raised/deployment)1,5 430 6,063 Changes in fair market value (407) (409) Decr
Slide 31: FEAUM by Fund
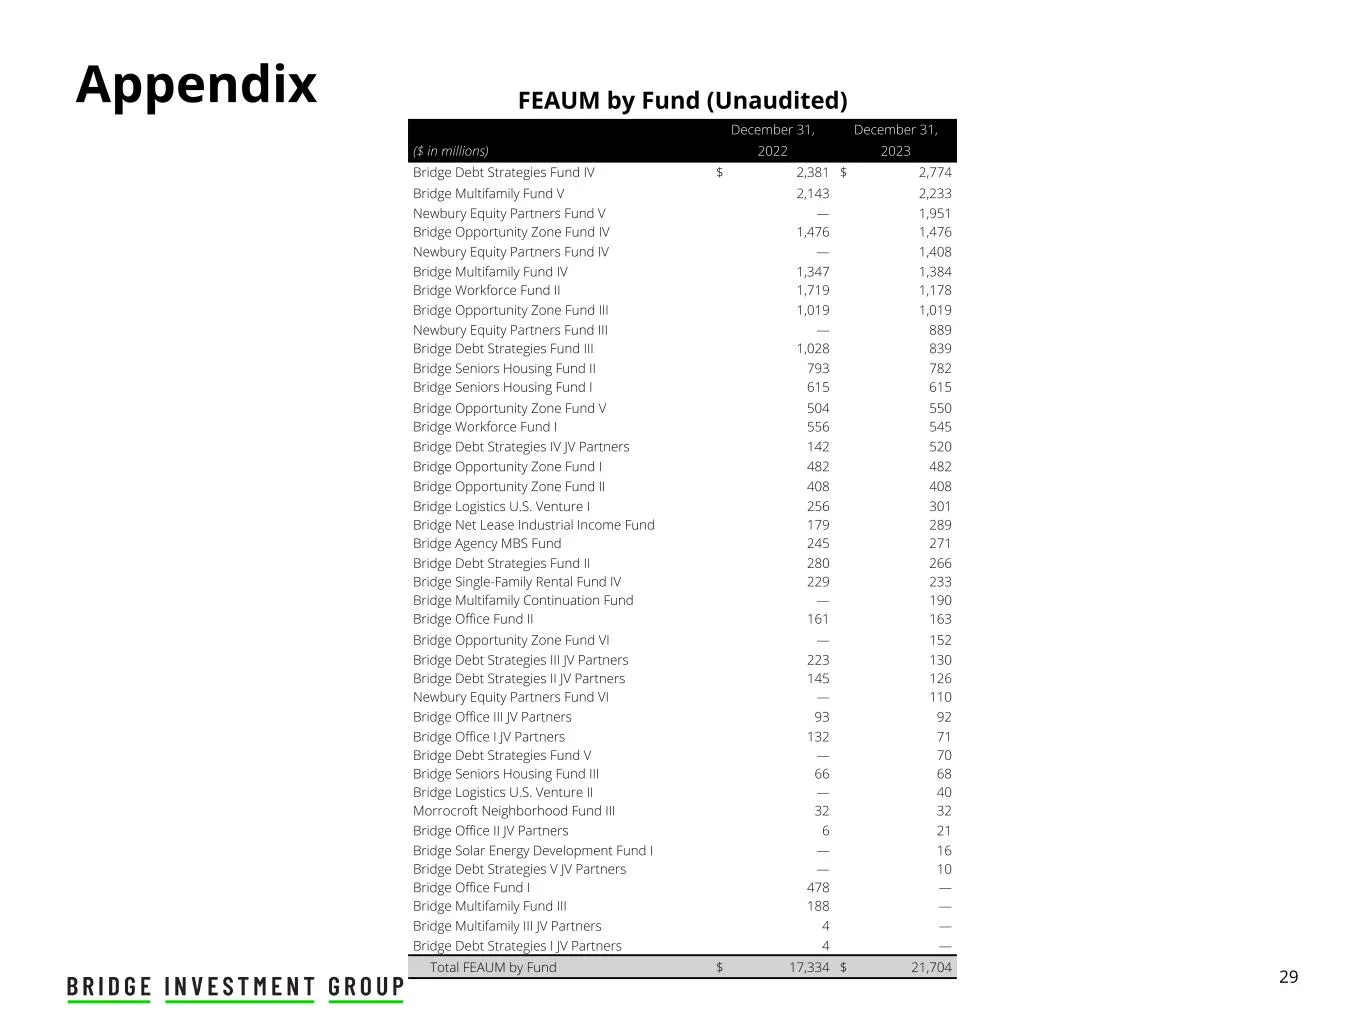
29 Appendix FEAUM by Fund (Unaudited) December 31, December 31, ($ in millions) 2022 2023 Bridge Debt Strategies Fund IV $ 2,381 $ 2,774 Bridge Multifamily Fund V 2,143 2,233 Newbury Equity Partners Fund V — 1,951 Bridge Opportunity Zone Fund IV 1,476 1,476 Newbury Equity Partners Fund IV — 1,408 Br
Slide 32: Reconciliation of GAAP Shares Outstanding to Total Shares Outstanding
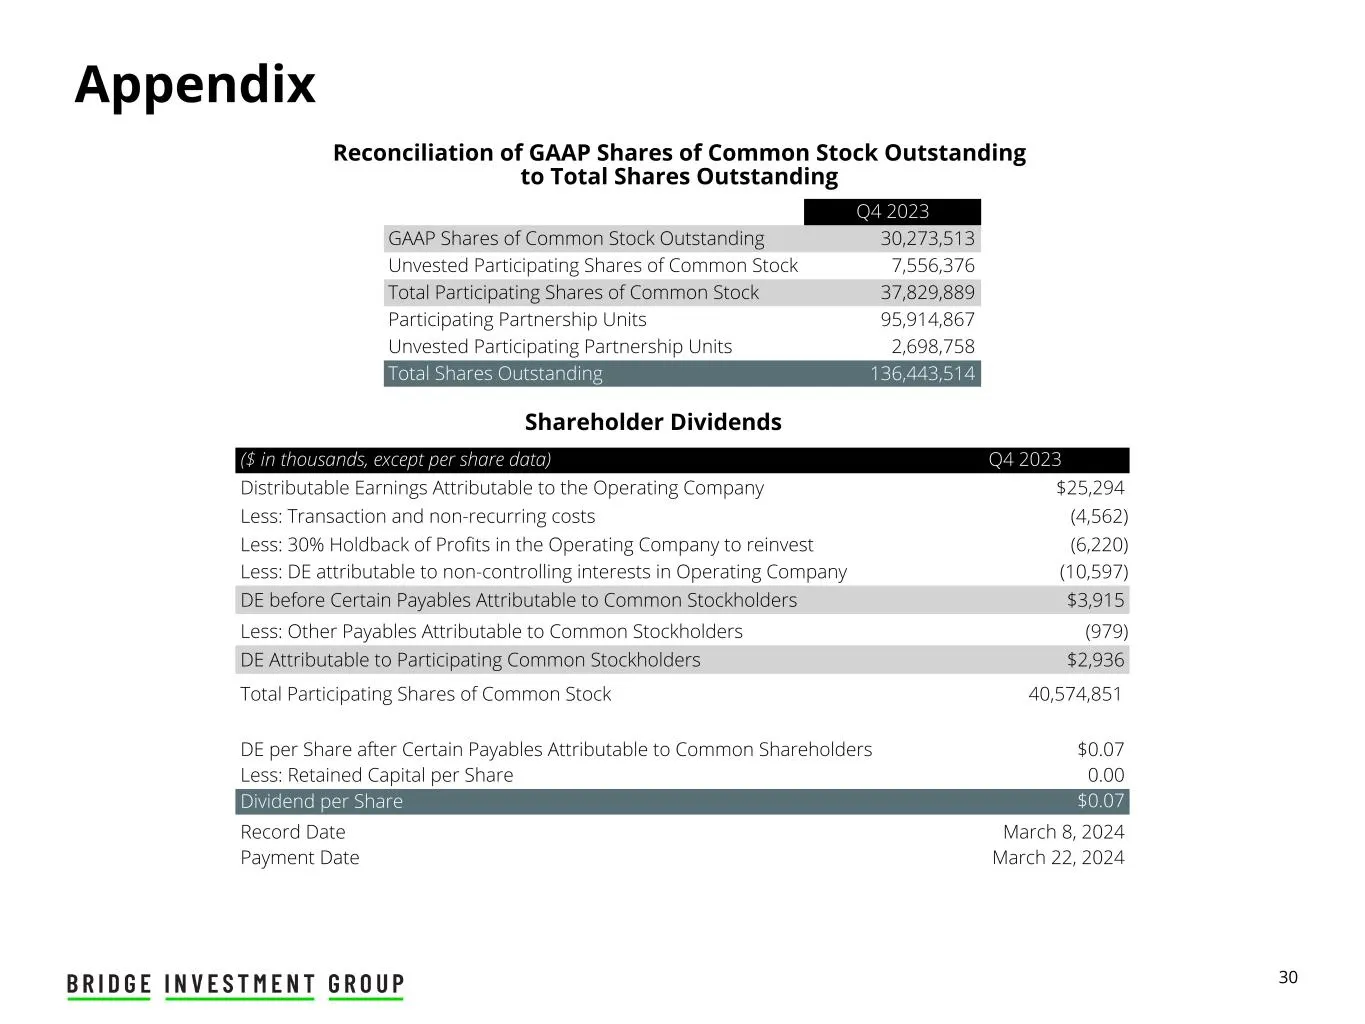
30 Appendix Reconciliation of GAAP Shares of Common Stock Outstanding to Total Shares Outstanding Q4 2023 GAAP Shares of Common Stock Outstanding 30,273,513 Unvested Participating Shares of Common Stock 7,556,376 Total Participating Shares of Common Stock 37,829,889 Participating Partnership Units 9
Slide 33: Reconciliation of GAAP Loss per Share to Distributable Earnings per Share
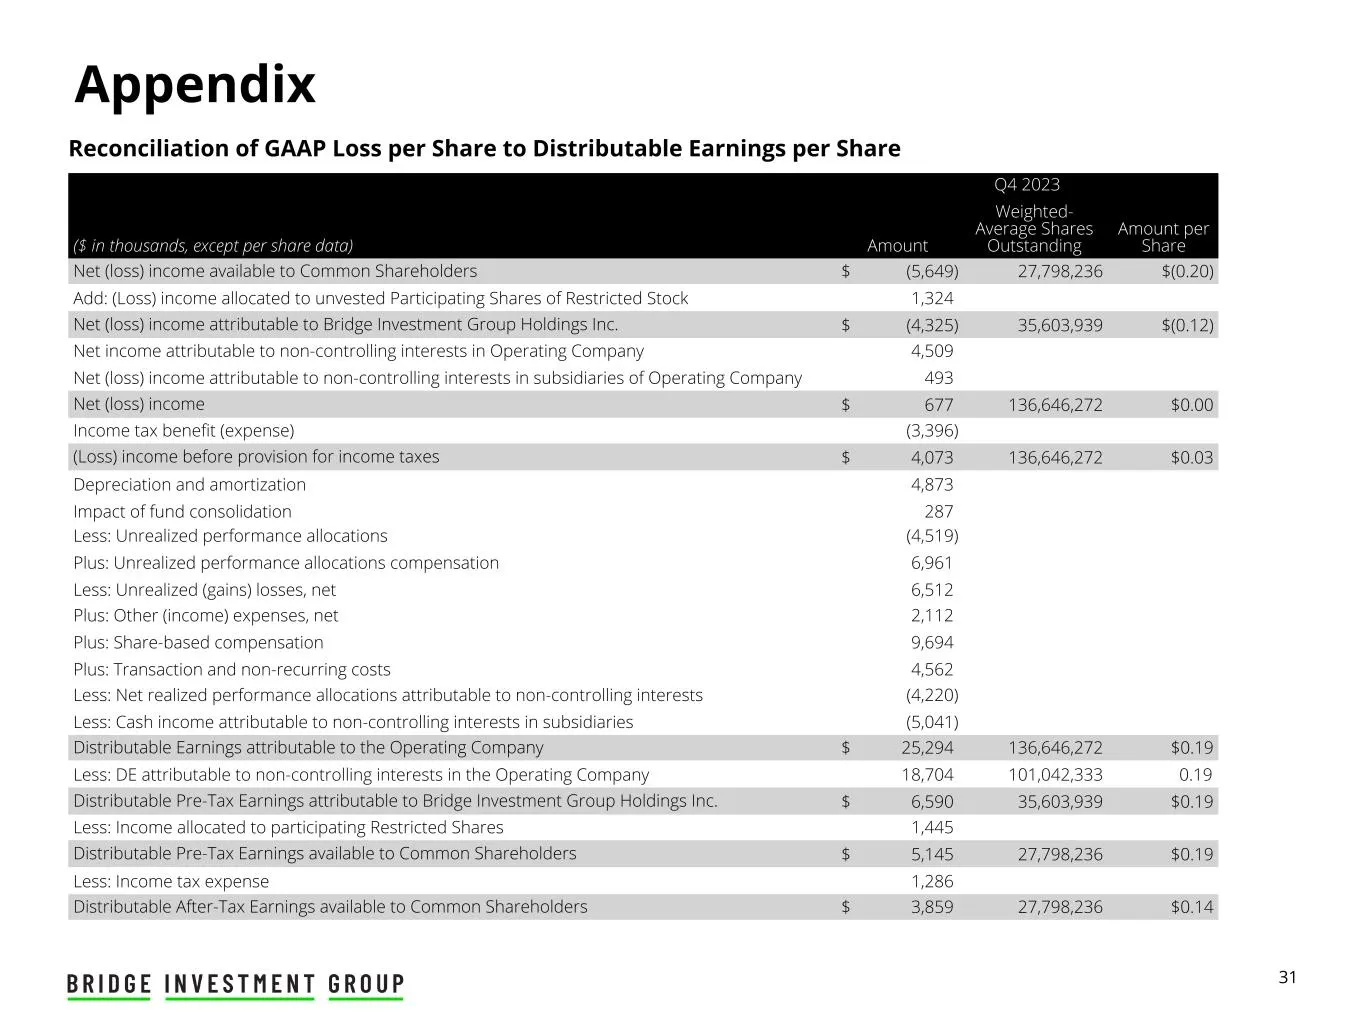
31 Appendix Reconciliation of GAAP Loss per Share to Distributable Earnings per Share Q4 2023 ($ in thousands, except per share data) Amount Weighted- Average Shares Outstanding Amount per Share Net (loss) income available to Common Shareholders $ (5,649) 27,798,236 $(0.20) Add: (Loss) income alloca
Slide 34: Profits Interests
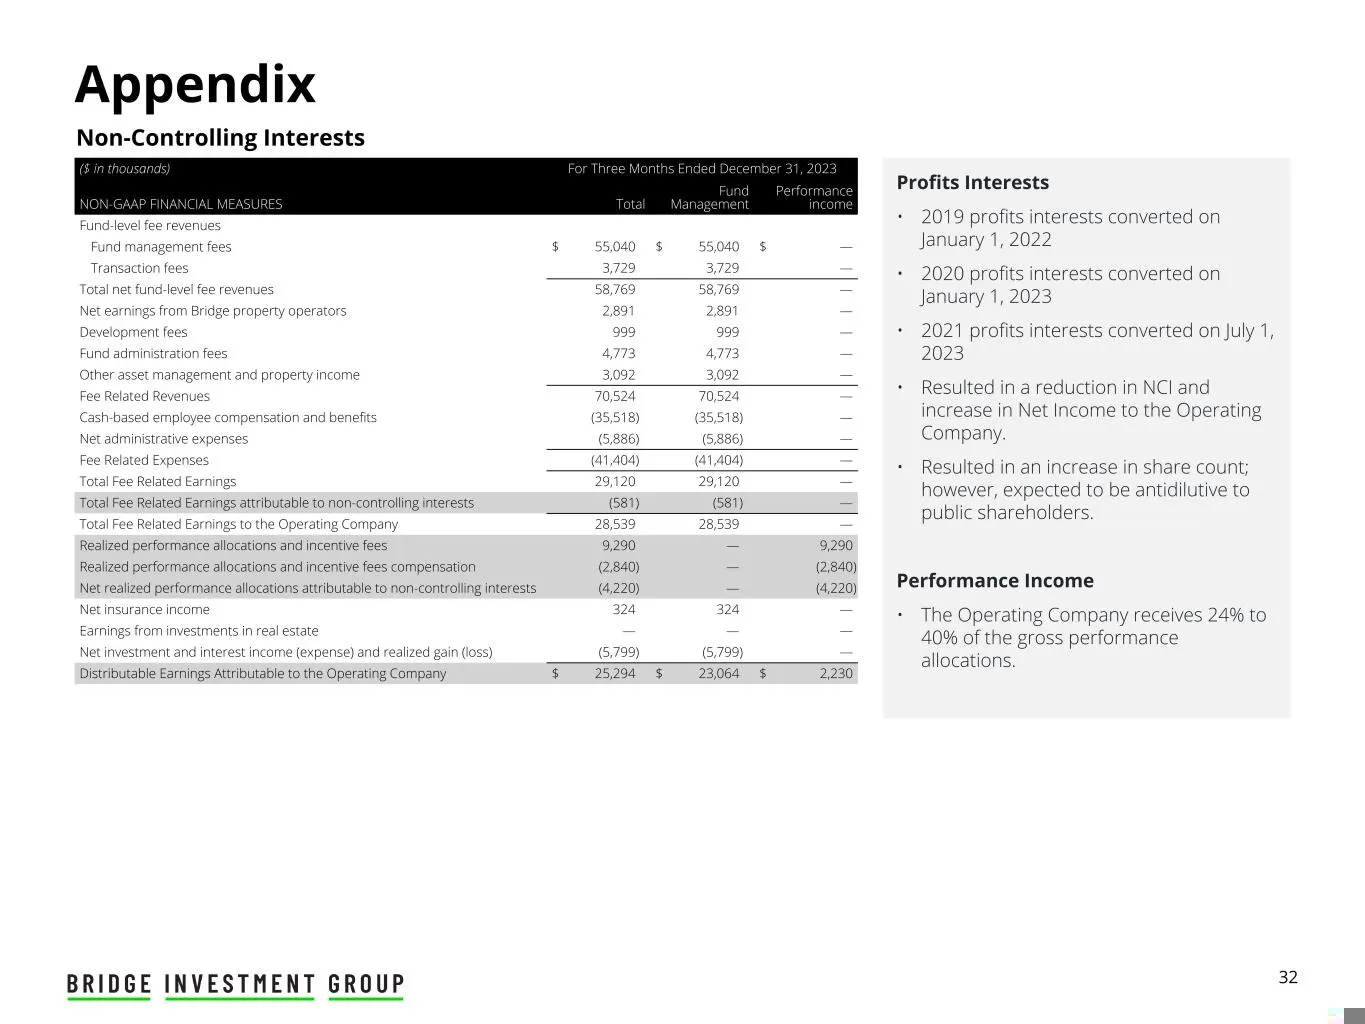
32 Appendix Profits Interests • 2019 profits interests converted on January 1, 2022 • 2020 profits interests converted on January 1, 2023 • 2021 profits interests converted on July 1, 2023 • Resulted in a reduction in NCI and increase in Net Income to the Operating Company. • Resulted in an increase
Slide 35: Composition of Fund Management Fees
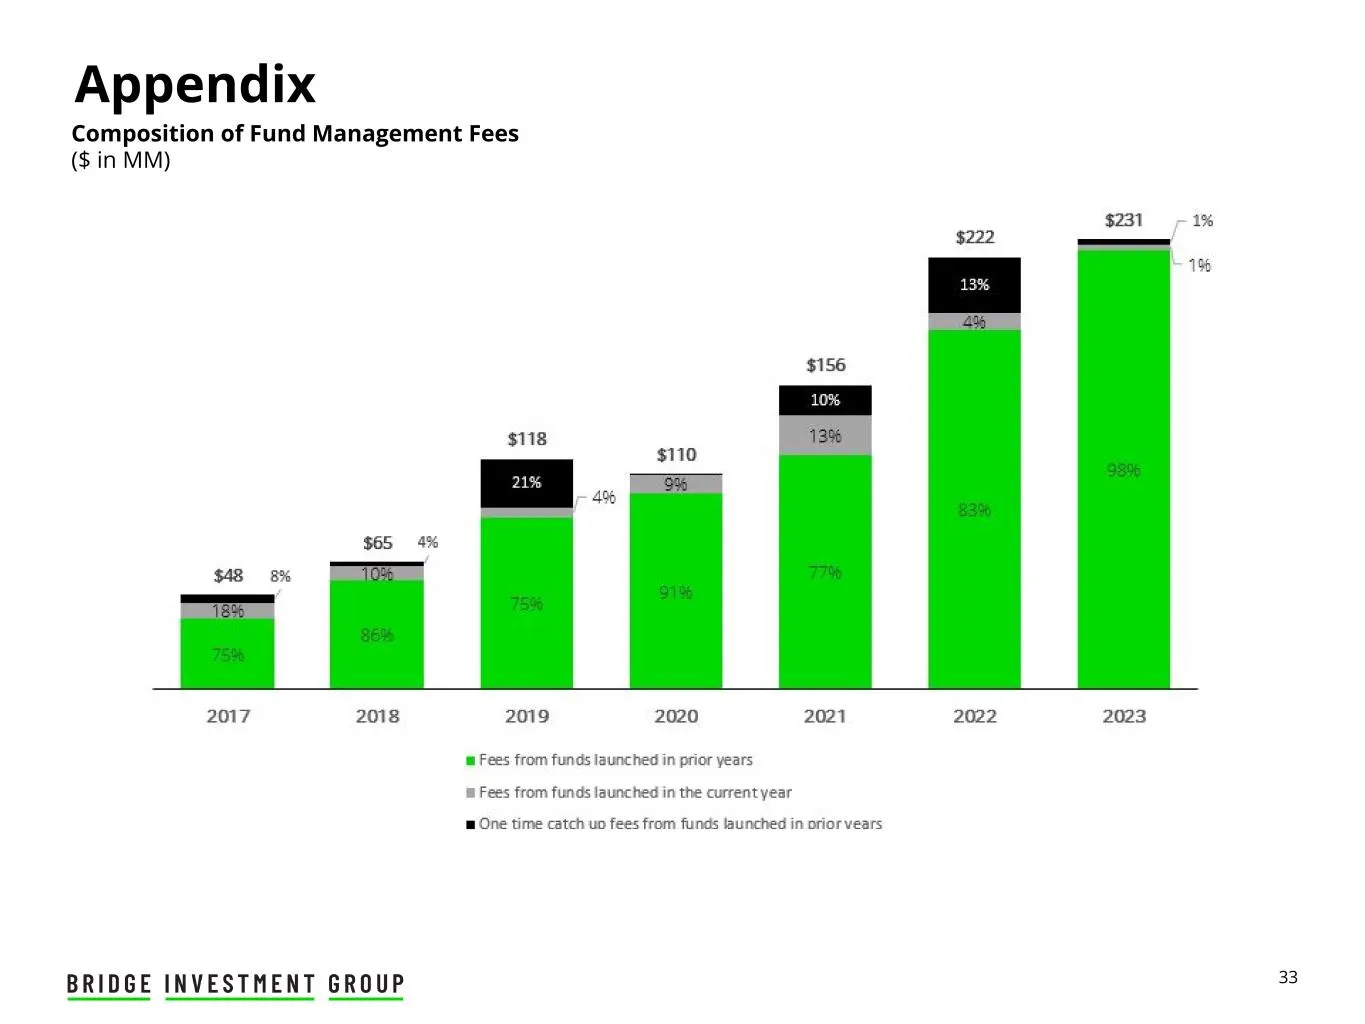
33 Appendix Composition of Fund Management Fees ($ in MM)
Slide 36: Investment Performance Summary
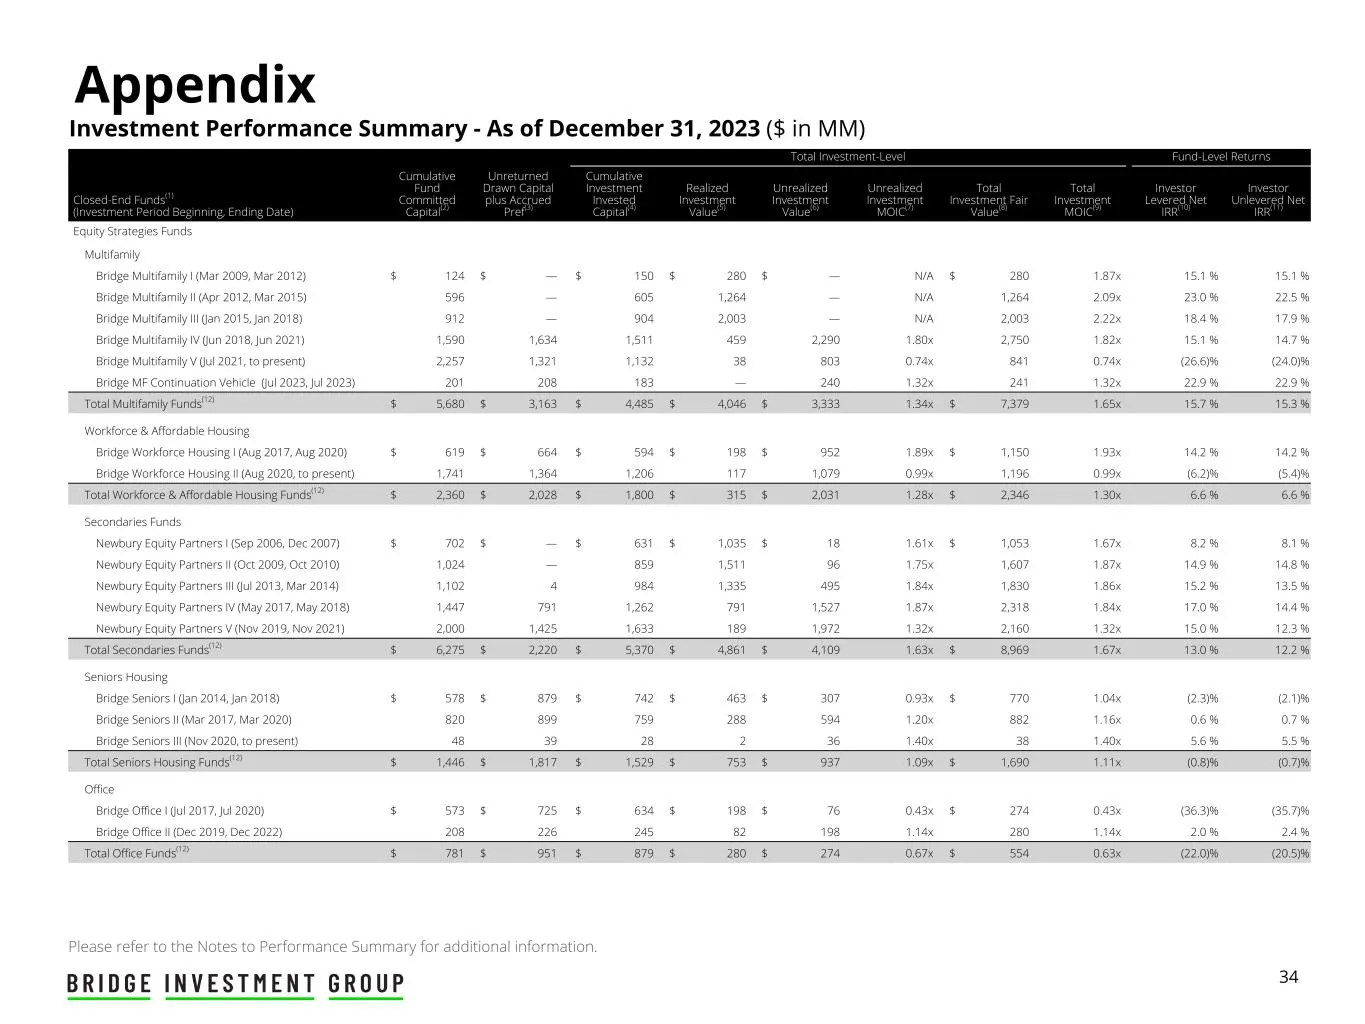
34 Investment Performance Summary - As of December 31, 2023 ($ in MM) Appendix Total Investment-Level Fund-Level Returns Closed-End Funds(1) (Investment Period Beginning, Ending Date) Cumulative Fund Committed Capital(2) Unreturned Drawn Capital plus Accrued Pref(3) Cumulative Investment Invested Ca
Slide 37: Investment Performance Summary
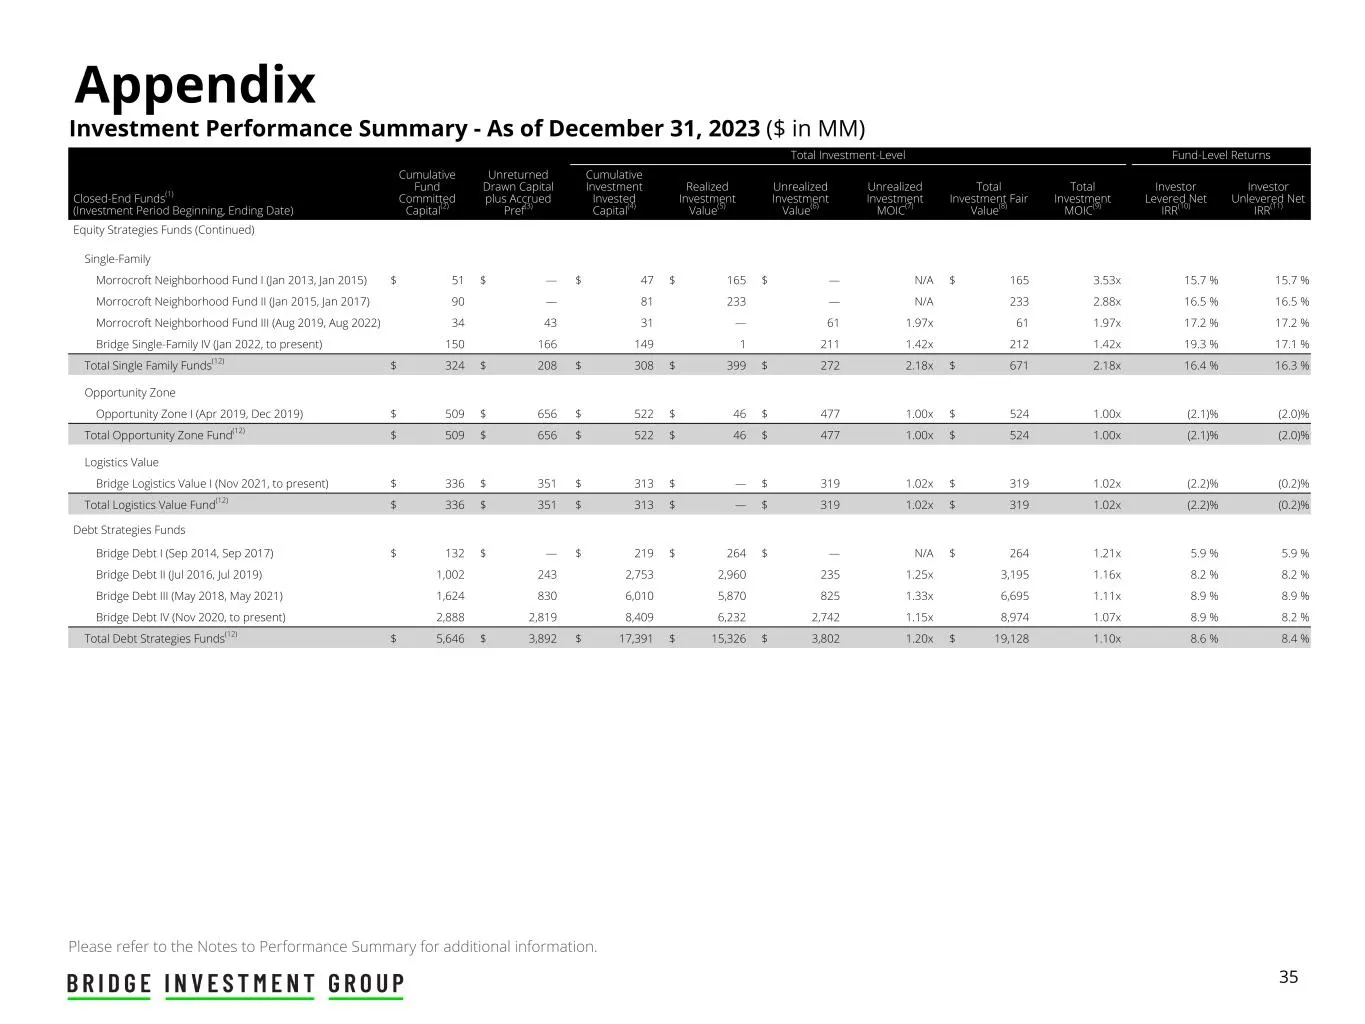
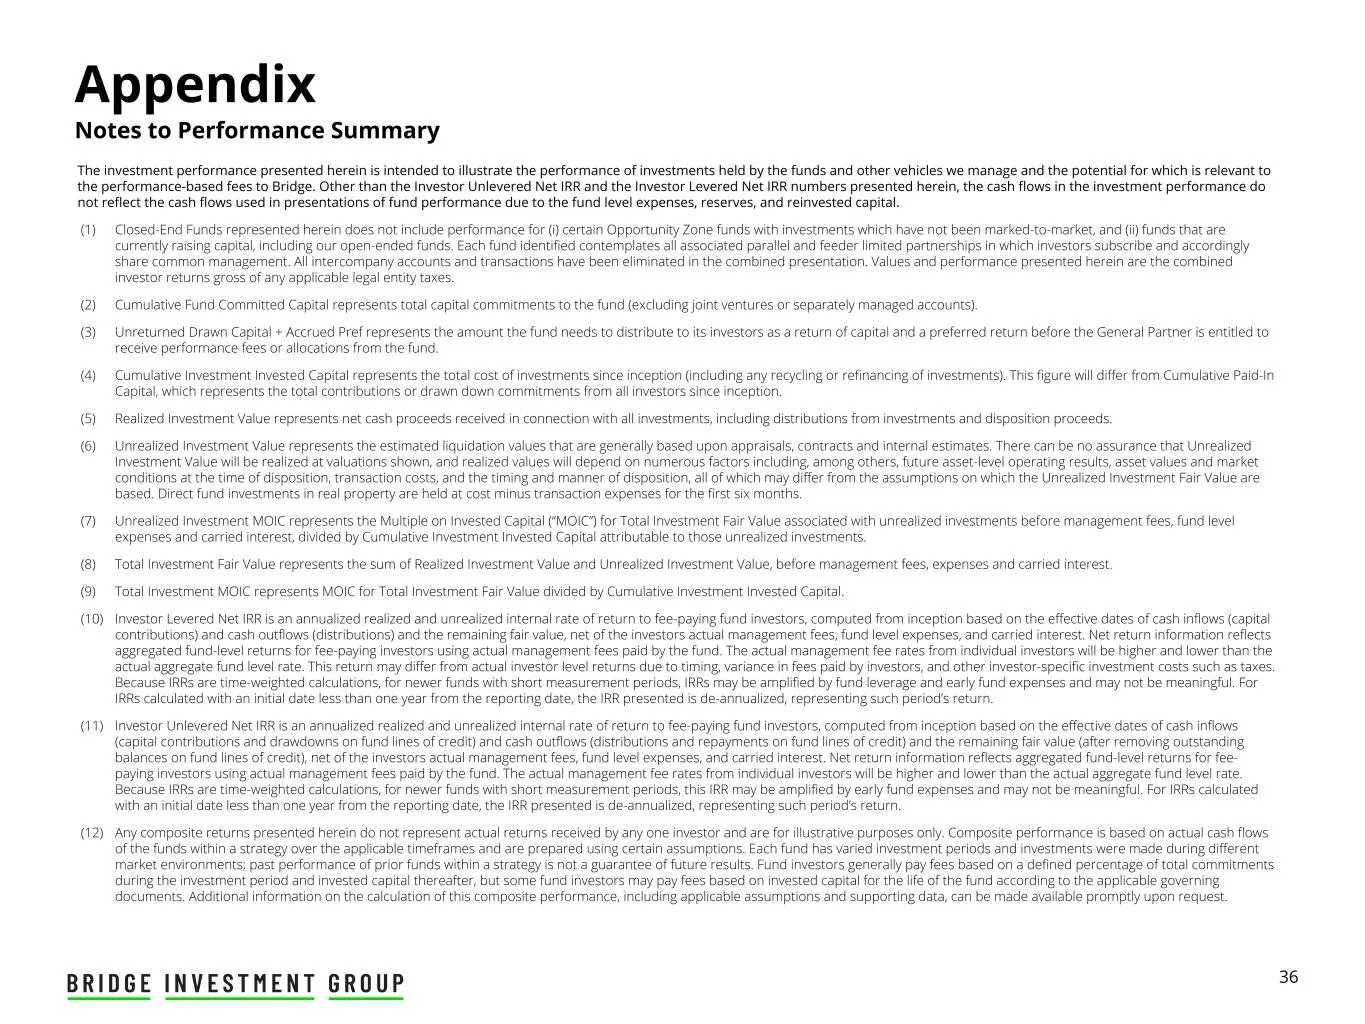
35 Investment Performance Summary - As of December 31, 2023 ($ in MM) Appendix Total Investment-Level Fund-Level Returns Closed-End Funds(1) (Investment Period Beginning, Ending Date) Cumulative Fund Committed Capital(2) Unreturned Drawn Capital plus Accrued Pref(3) Cumulative Investment Invested Ca
Slide 38: Notes to Performance Summary
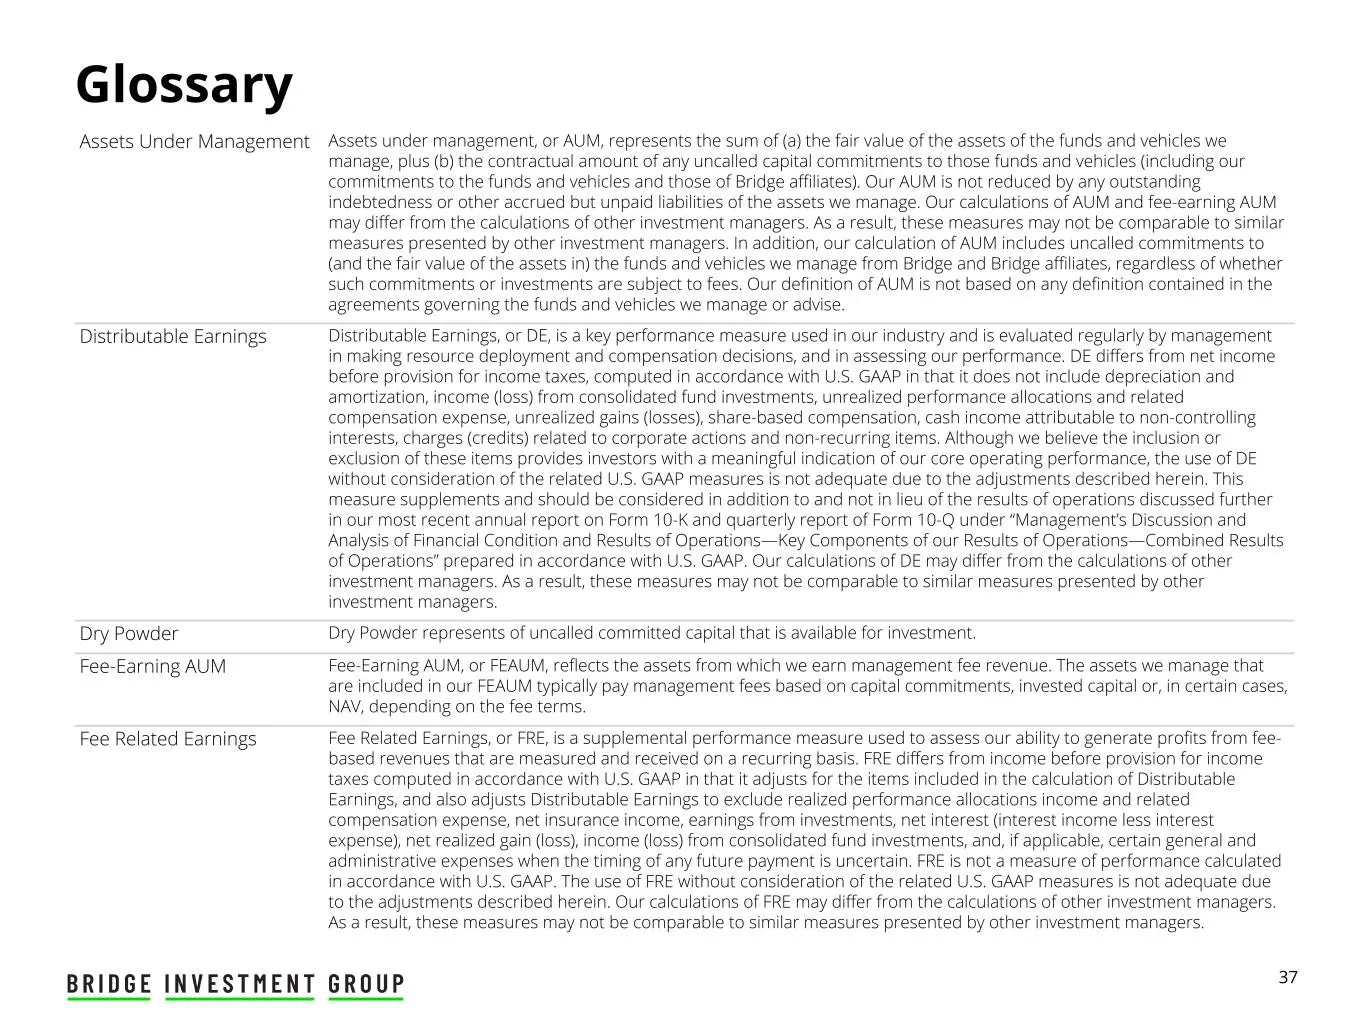
36 Notes to Performance Summary Appendix The investment performance presented herein is intended to illustrate the performance of investments held by the funds and other vehicles we manage and the potential for which is relevant to the performance-based fees to Bridge. Other than the Investor Unleve
Slide 39: Glossary
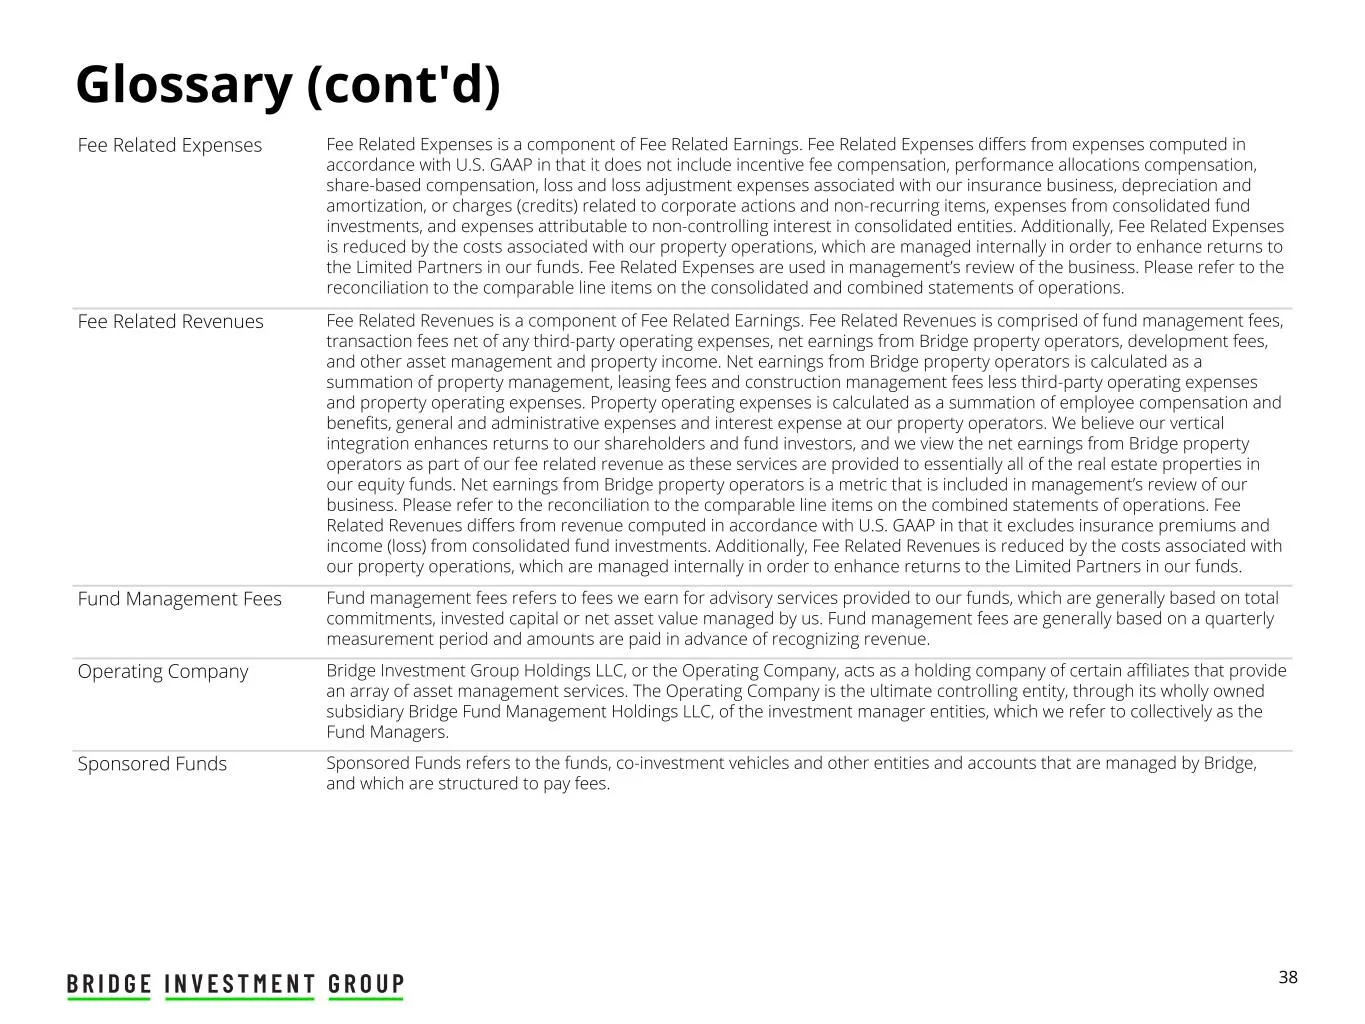
37 Glossary Assets Under Management Assets under management, or AUM, represents the sum of (a) the fair value of the assets of the funds and vehicles we manage, plus (b) the contractual amount of any uncalled capital commitments to those funds and vehicles (including our commitments to the funds and
Slide 40: Glossary (cont'd)
38 Glossary (cont'd) Fee Related Expenses Fee Related Expenses is a component of Fee Related Earnings. Fee Related Expenses differs from expenses computed in accordance with U.S. GAAP in that it does not include incentive fee compensation, performance allocations compensation, share-based compensati
Source: SEC EDGAR · 8-K filed Feb 21, 2024
More decks from Bridge Investment Group Holdings Inc
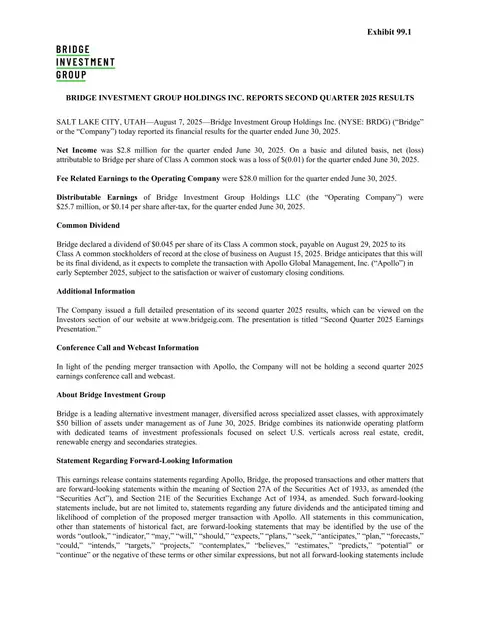 Q2 2025 Earnings Presentation40 slides · Aug 7, 2025
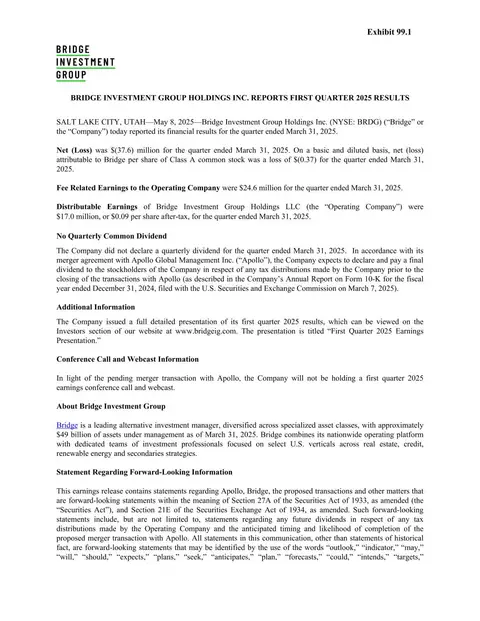 Q1 2025 Earnings Presentation41 slides · May 8, 2025
 Q4 2024 Earnings Presentation34 slides · Feb 24, 2025
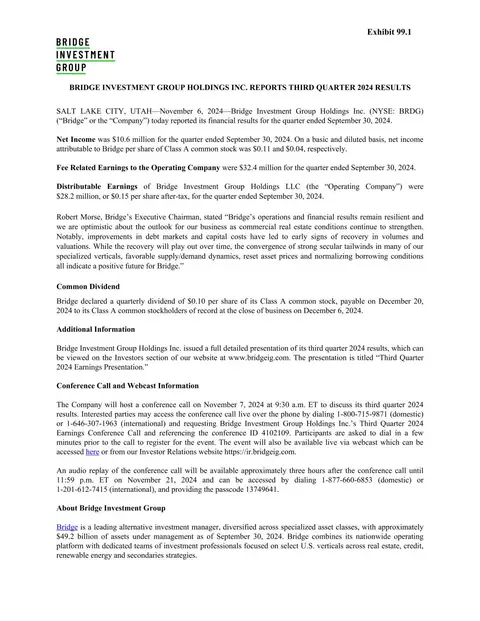 Q3 2024 Earnings Presentation36 slides · Nov 6, 2024
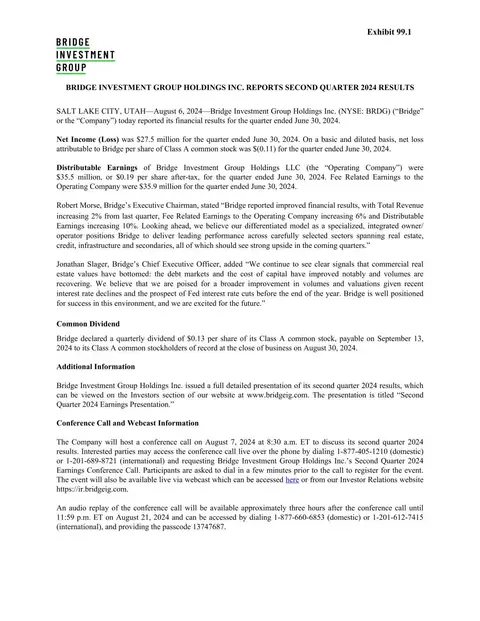 Q2 2024 Earnings Presentation38 slides · Aug 6, 2024
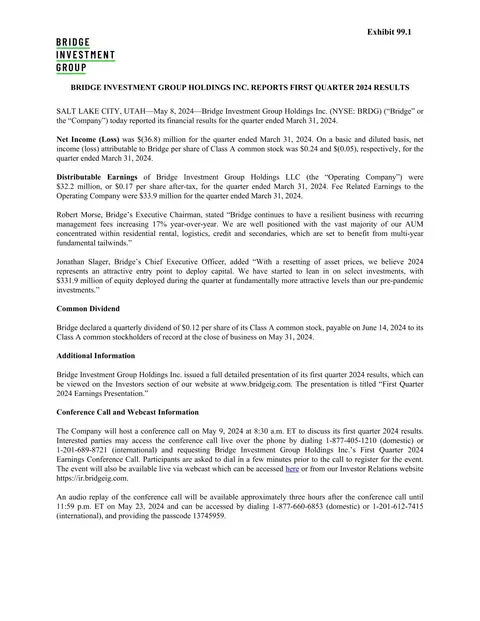 Q1 2024 Earnings Presentation38 slides · May 8, 2024