Ur-Energy Inc. · TSX:URE
Ur-Energy — Investor Presentation (October 2014)
24 slides from Ur-Energy's investor presentation, Oct 3, 2014
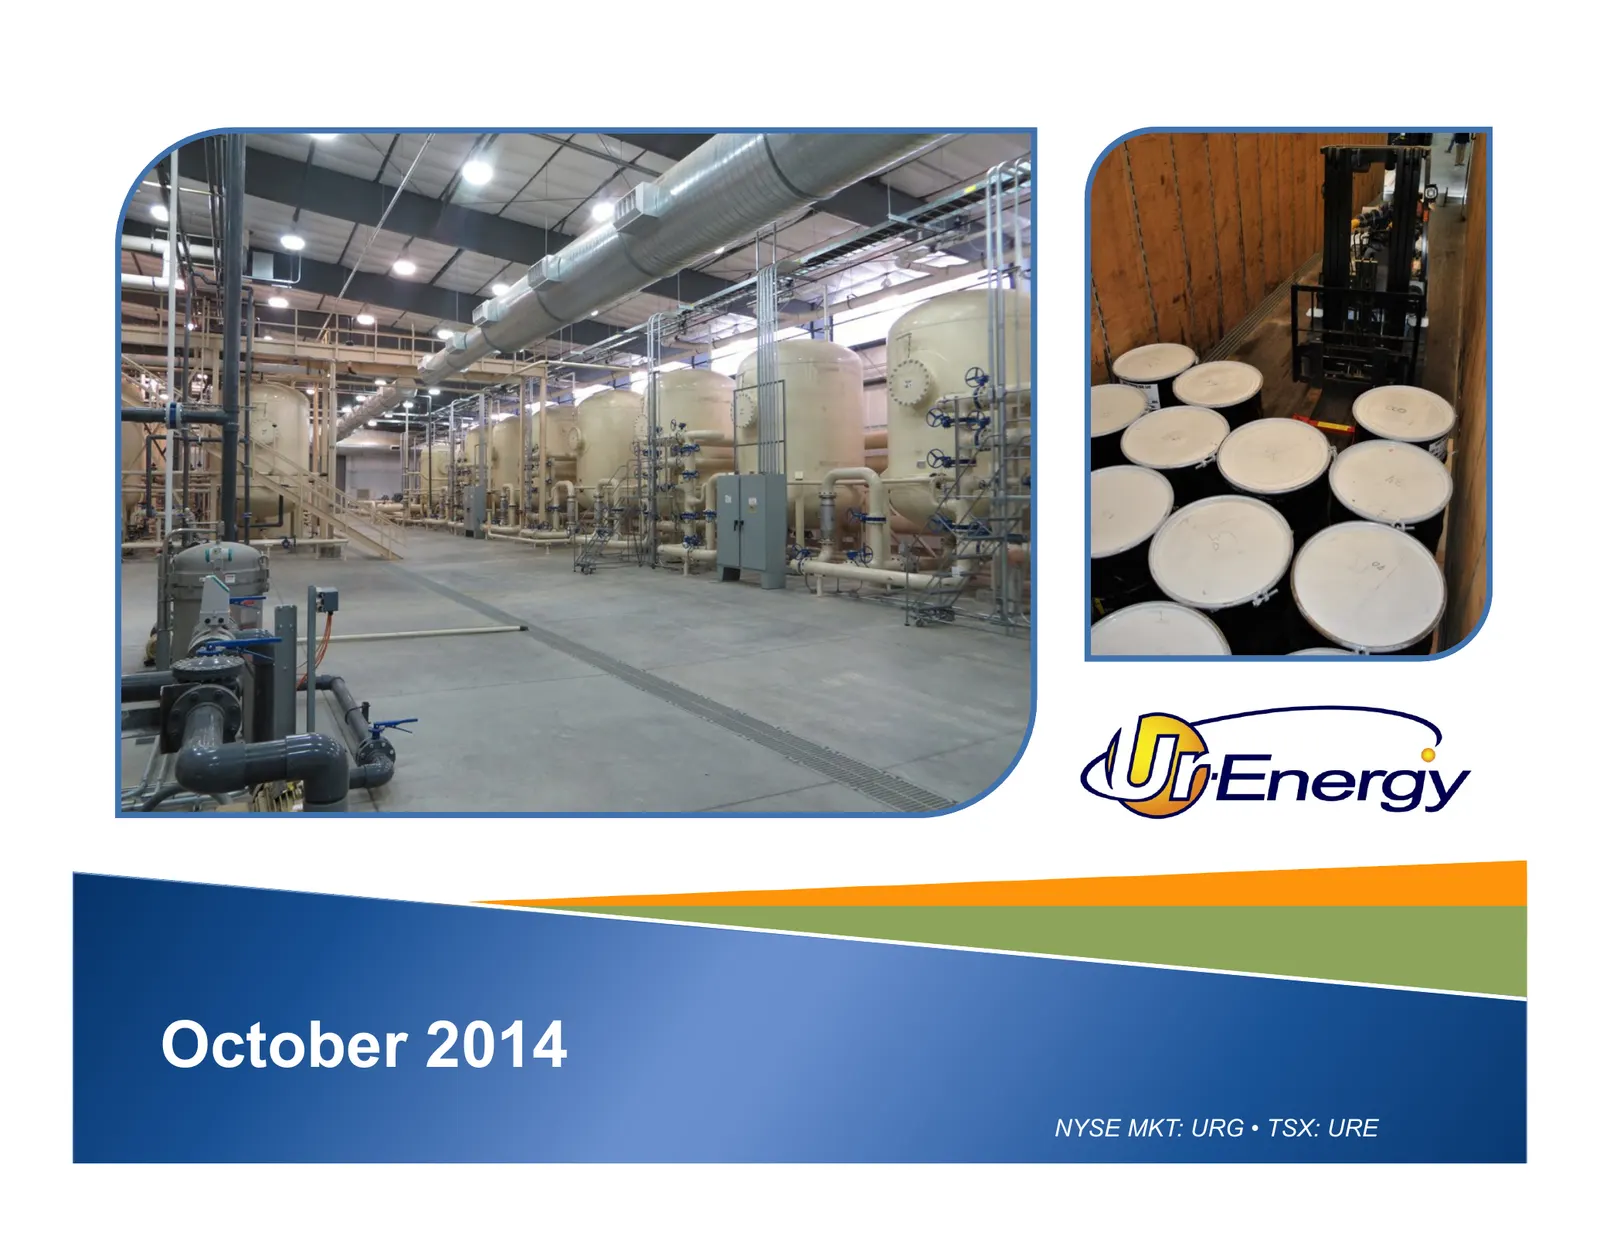
Slide 1: October 2014
October 2014 NYSE MKT: URG • TSX: URE
Slide 2: Forward-looking statements
This presentation contains “forward-looking statements,” within the meaning of applicable securities laws, regarding events or conditions that may occur in the future. Such statements include without limitation the Company’s timeframe for the completion of commissioning and ramp up of production at
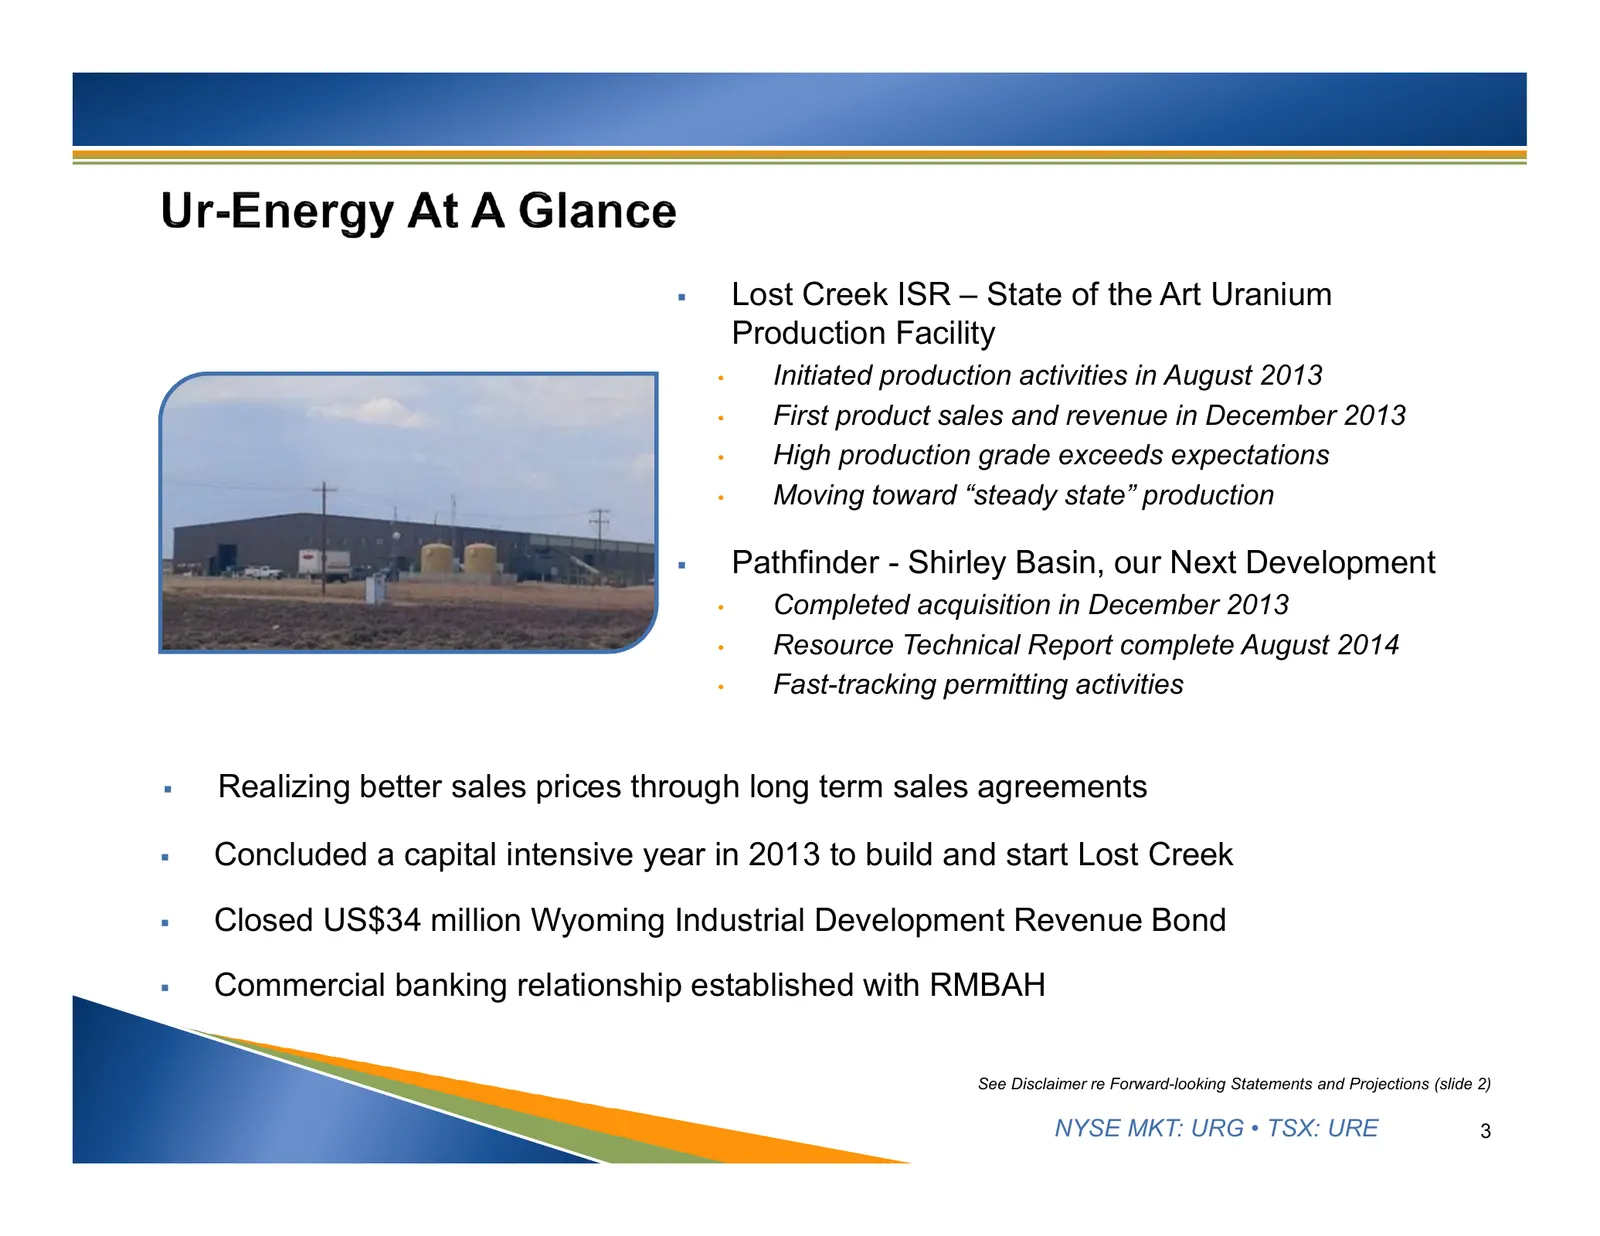
Slide 3: Lost Creek ISR and Pathfinder Shirley Basin highlights
Lost Creek ISR – State of the Art Uranium Production Facility • Initiated production activities in August 2013 • First product sales and revenue in December 2013 • High production grade exceeds expectations • Moving toward “steady state” production Pathfinder - Shirley Basin, our Next Developmen
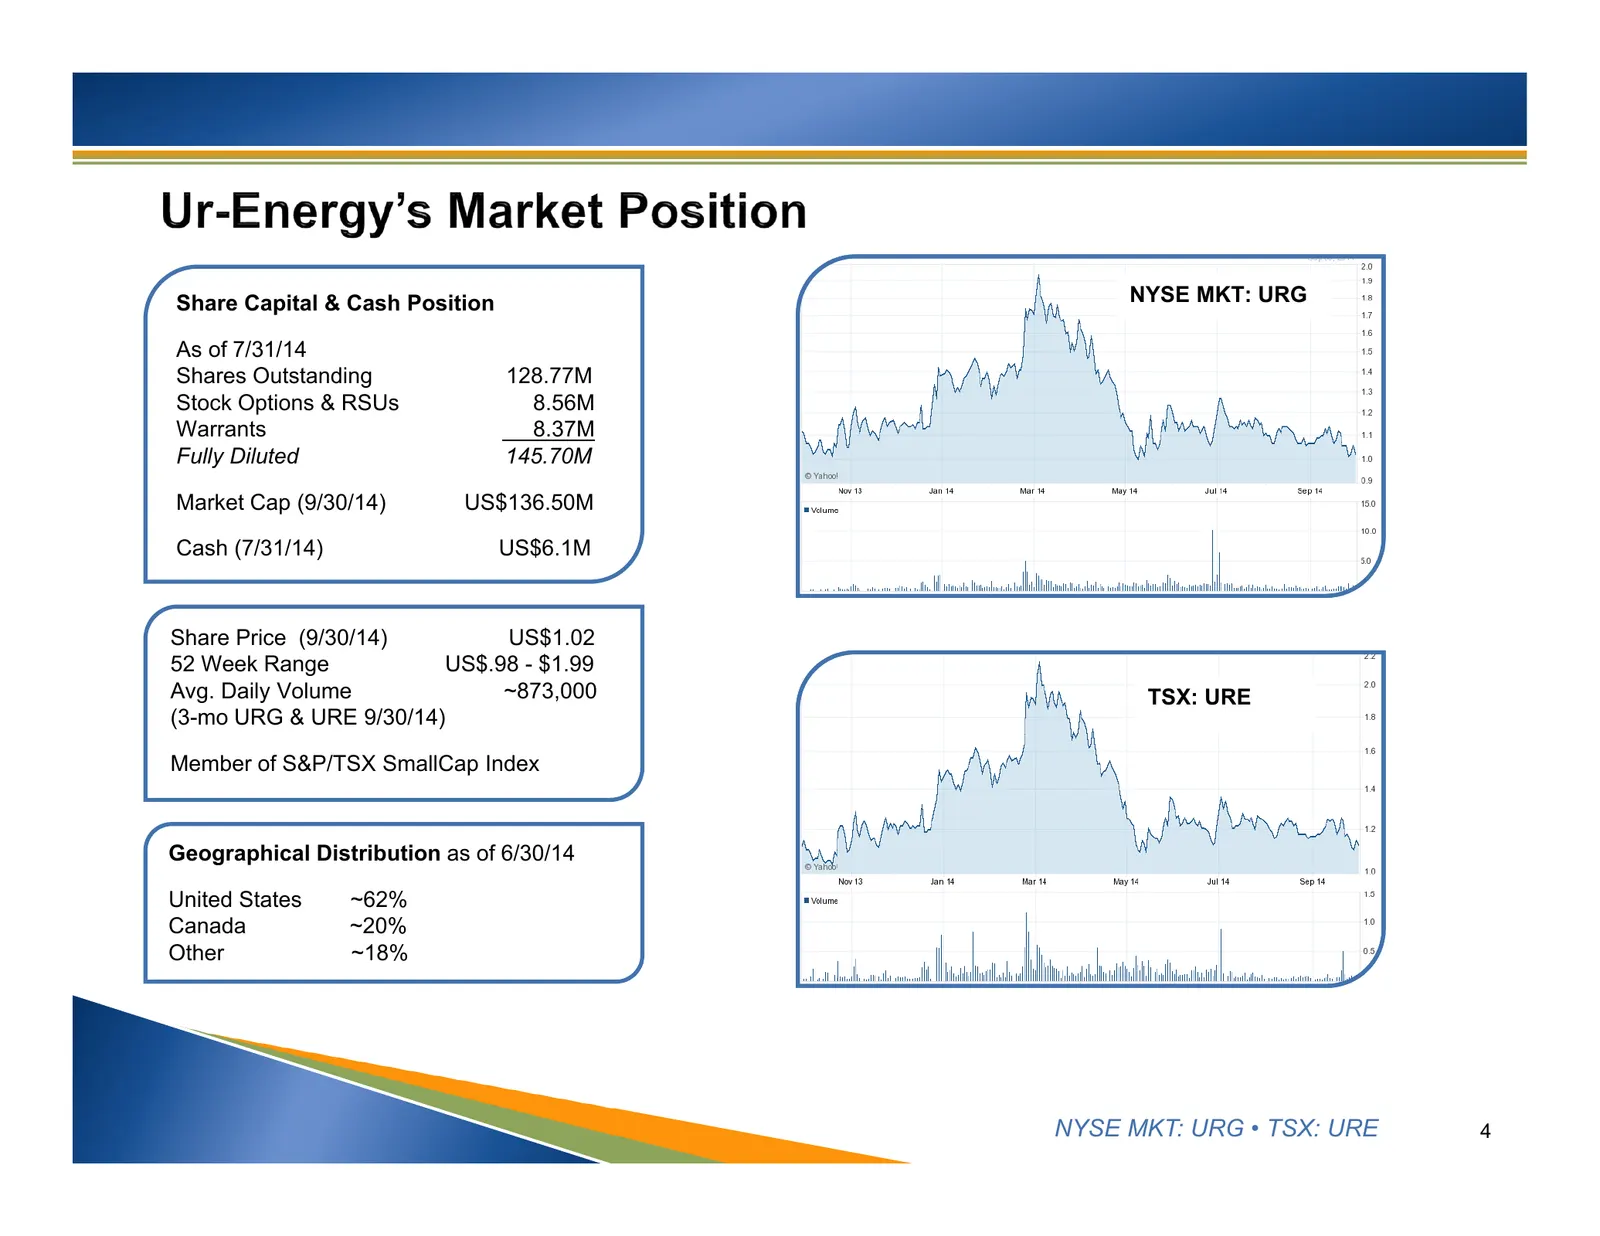
Slide 4: Share Capital & Cash Position
Share Capital & Cash Position NYSE MKT: URG As of 7/31/14 Shares Outstanding 128.77M Stock Options & RSUs 8.56M Warrants 8.37M Fully Diluted 145.70M Market Cap (9/30/14) US$136.50M Cash (7/31/14) US$6.1M Share Price (9/30/14) US$1.02 52 Week Range US$.98 - $1.99 Avg. Daily Volume ~873,000 TSX: URE (
Slide 5: Analyst coverage
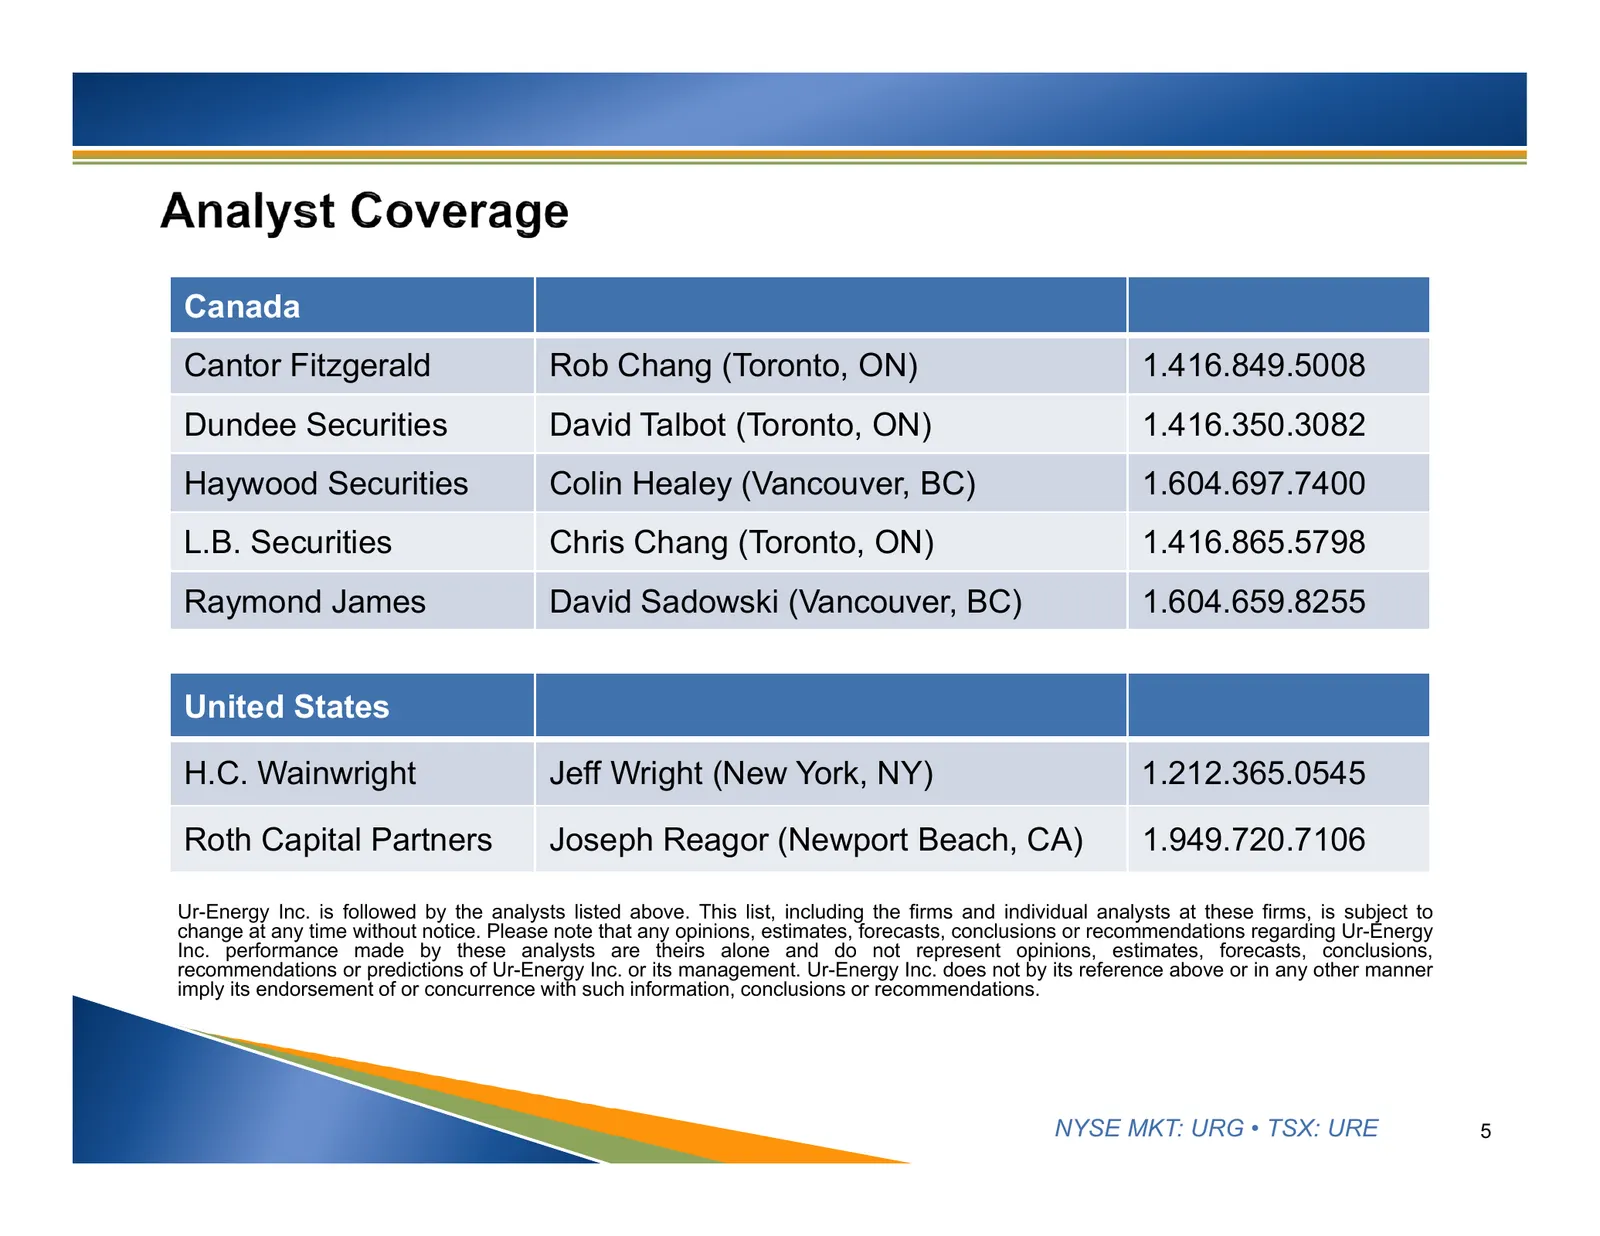
Canada Cantor Fitzgerald Rob Chang (Toronto, ON) 1.416.849.5008 Dundee Securities David Talbot (Toronto, ON) 1.416.350.3082 Haywood Securities Colin Healey (Vancouver, BC) 1.604.697.7400 L.B. Securities Chris Chang (Toronto, ON) 1.416.865.5798 Raymond James David Sadowski (Vancouver, BC) 1.604.659.8
Slide 6: Board of Directors and Officers
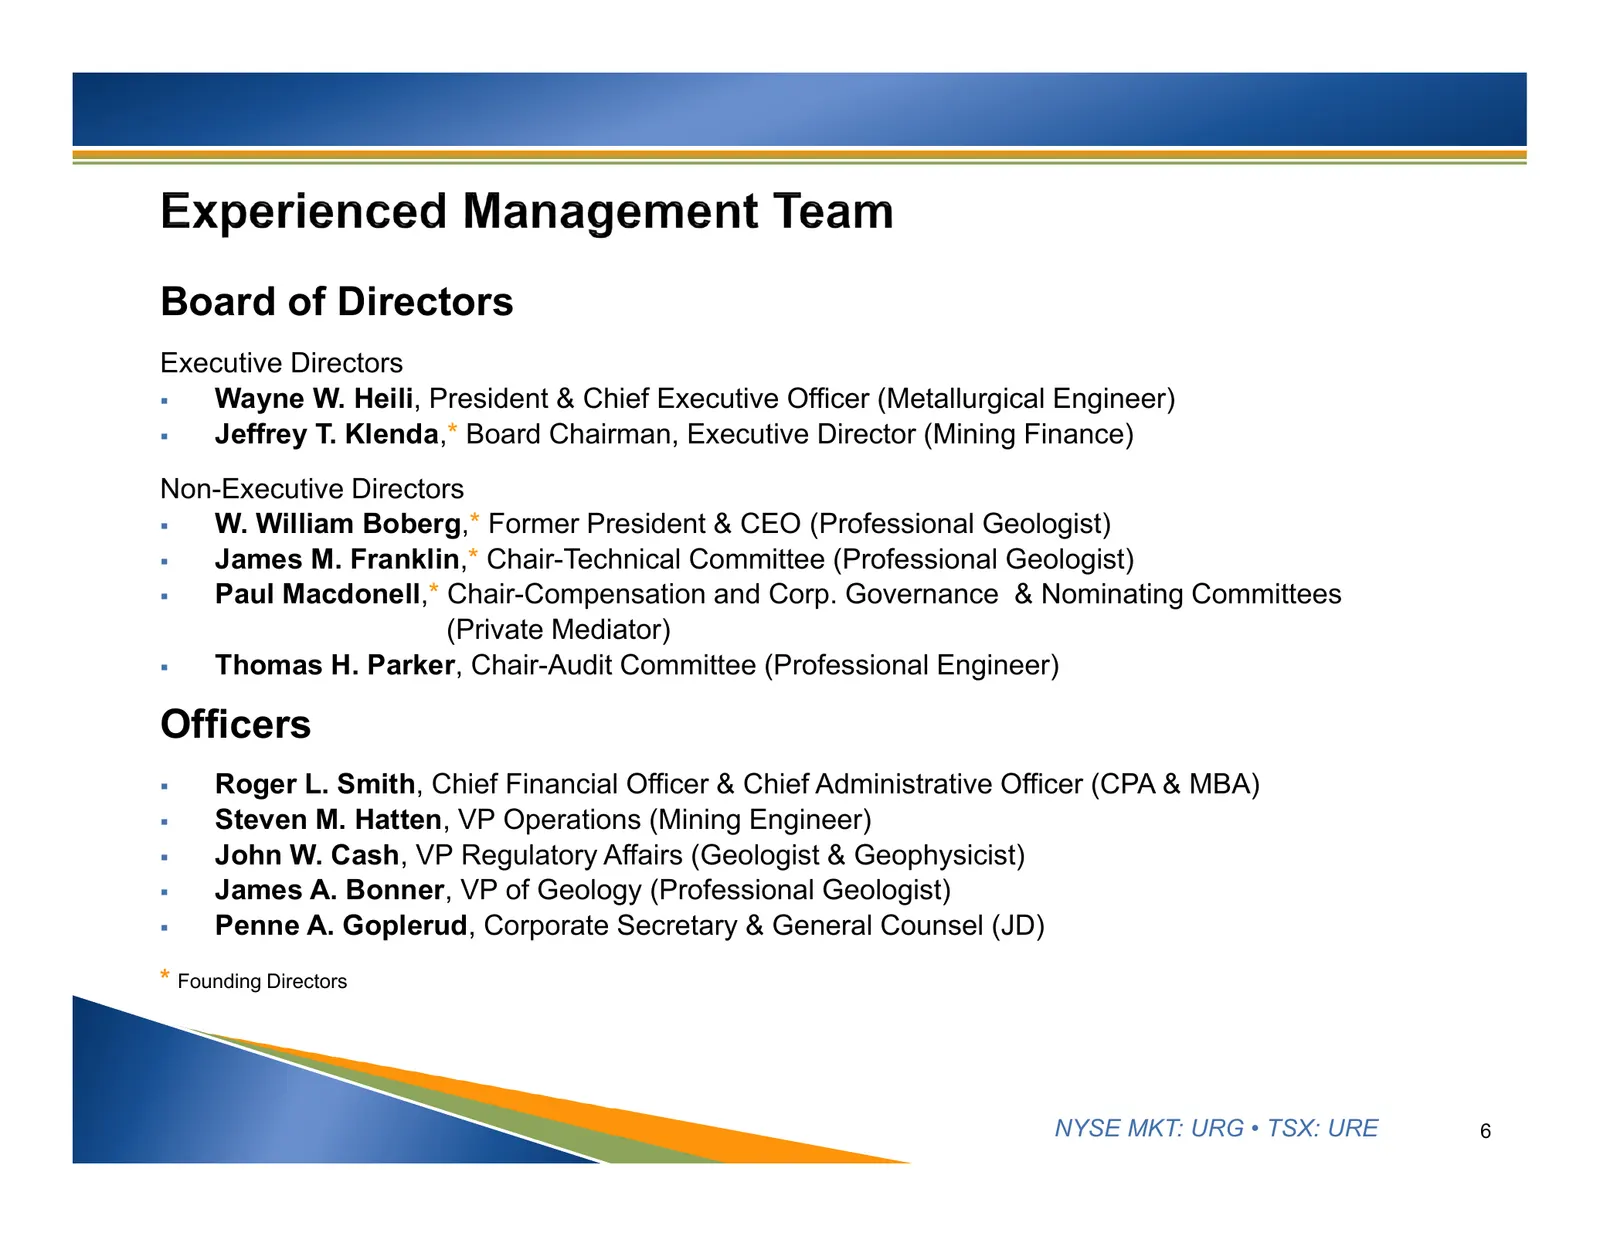
Board of Directors Executive Directors Wayne W. Heili, President & Chief Executive Officer (Metallurgical Engineer) Jeffrey T. Klenda,* Board Chairman, Executive Director (Mining Finance) Non-Executive Directors W. William Boberg,* Former President & CEO (Professional Geologist) James M. Fra
Slide 7: Highly experienced technical and management team
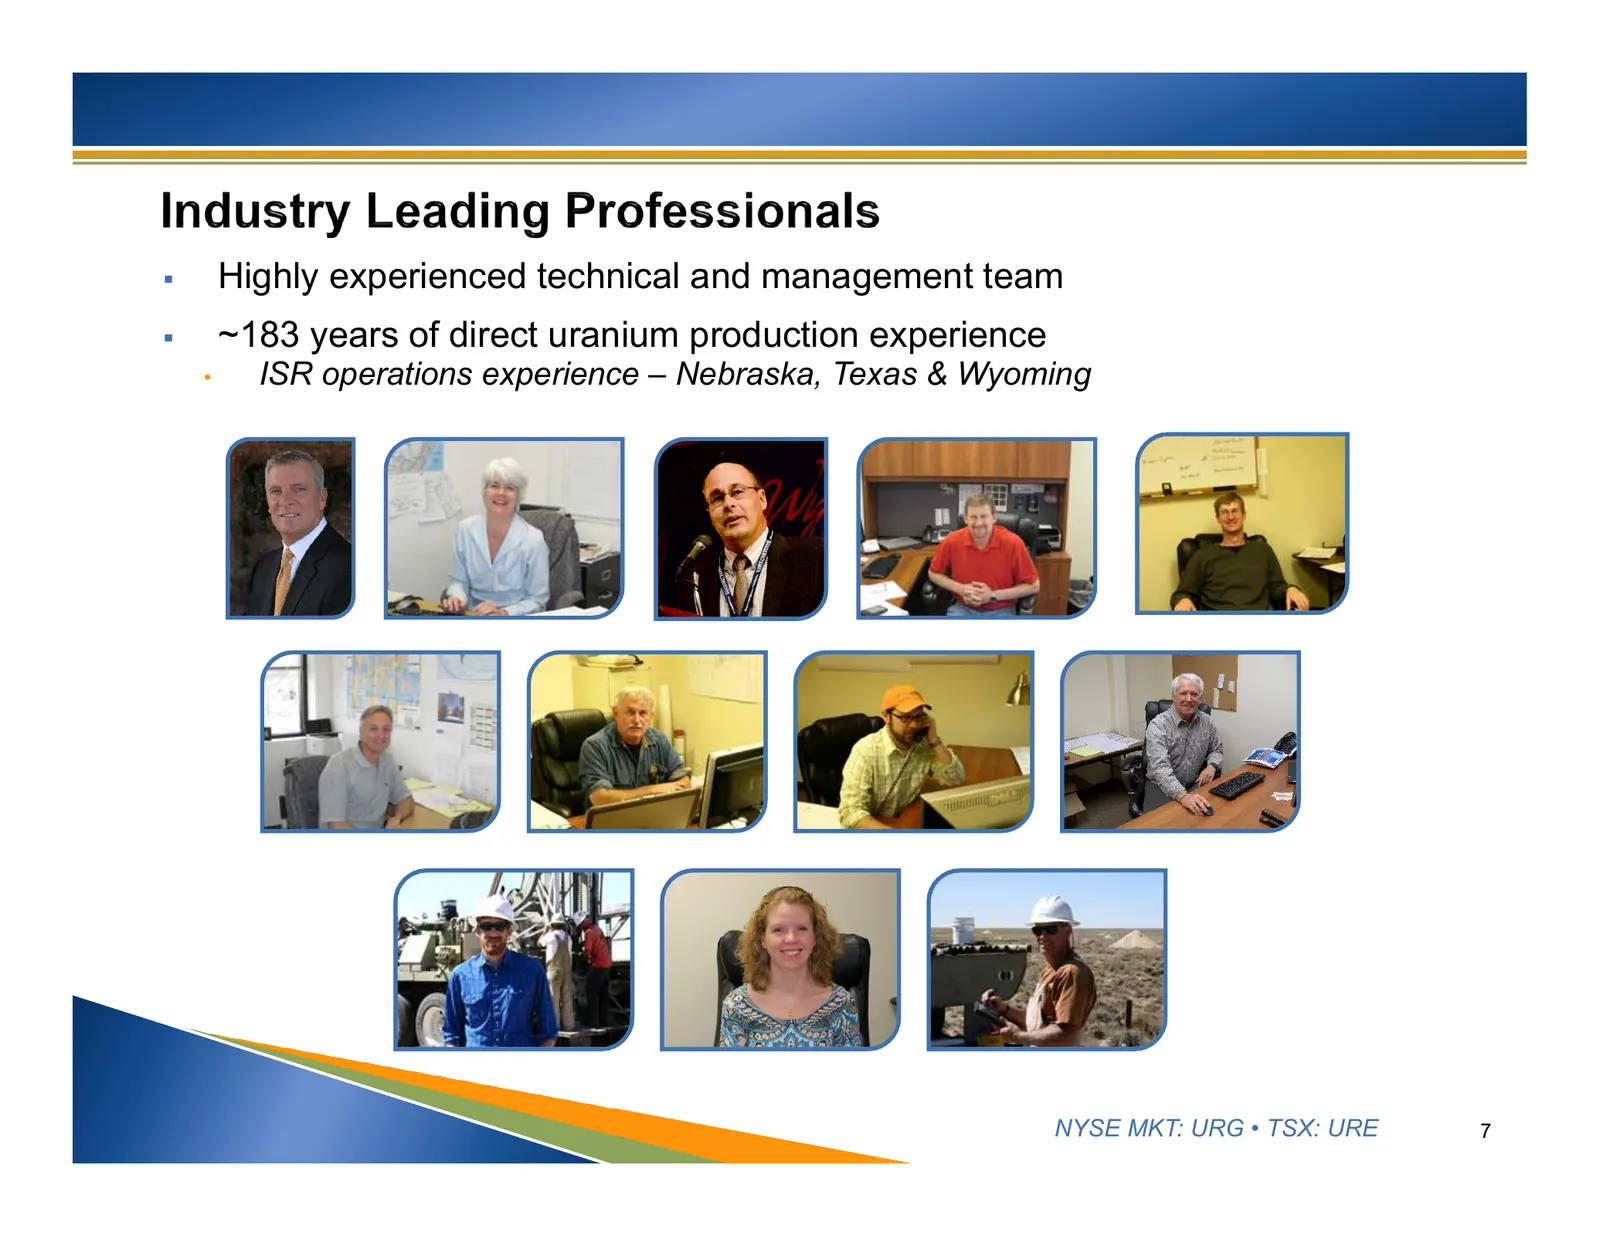
Highly experienced technical and management team ~183 years of direct uranium production experience • ISR operations experience – Nebraska, Texas & Wyoming NYSE MKT: URG • TSX: URE 7
Slide 8: Nuclear reactors worldwide and uranium demand
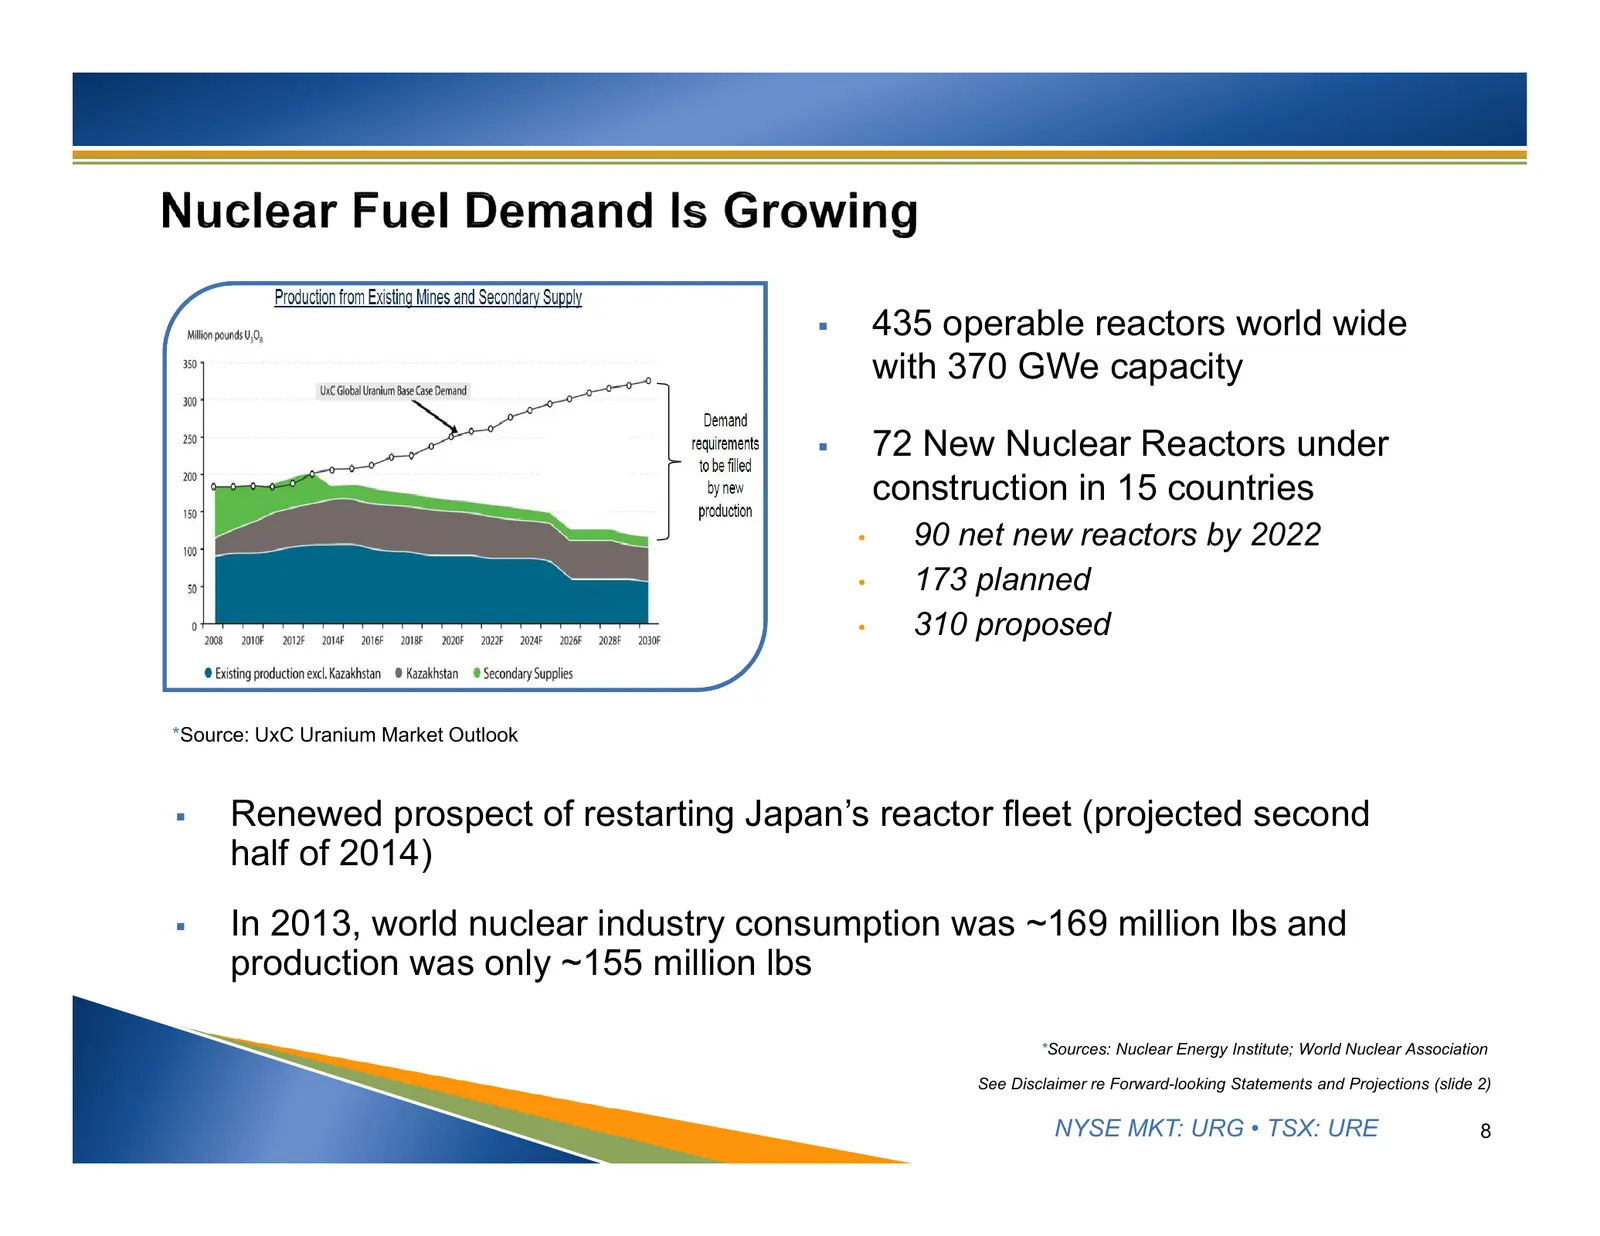
435 operable reactors world wide with 370 GWe capacity 72 New Nuclear Reactors under construction in 15 countries • 90 net new reactors by 2022 • 173 planned • 310 proposed *Source: UxC Uranium Market Outlook Renewed prospect of restarting Japan’s reactor fleet (projected second half of 2014)
Slide 9: Uranium supply: HEU concluded, deferrals
HEU secondary supply concluded in 2013 • Provided 24 Mlbs/yr equivalent for past 20 years Large scale production uneconomical at current prices • Rossing – reduced production rates (6.0 Mlbs/yr) • Paladin – Kayelekera production halted (3.0 Mlbs/yr) Key supply deferrals • BHP Billiton – Olympi
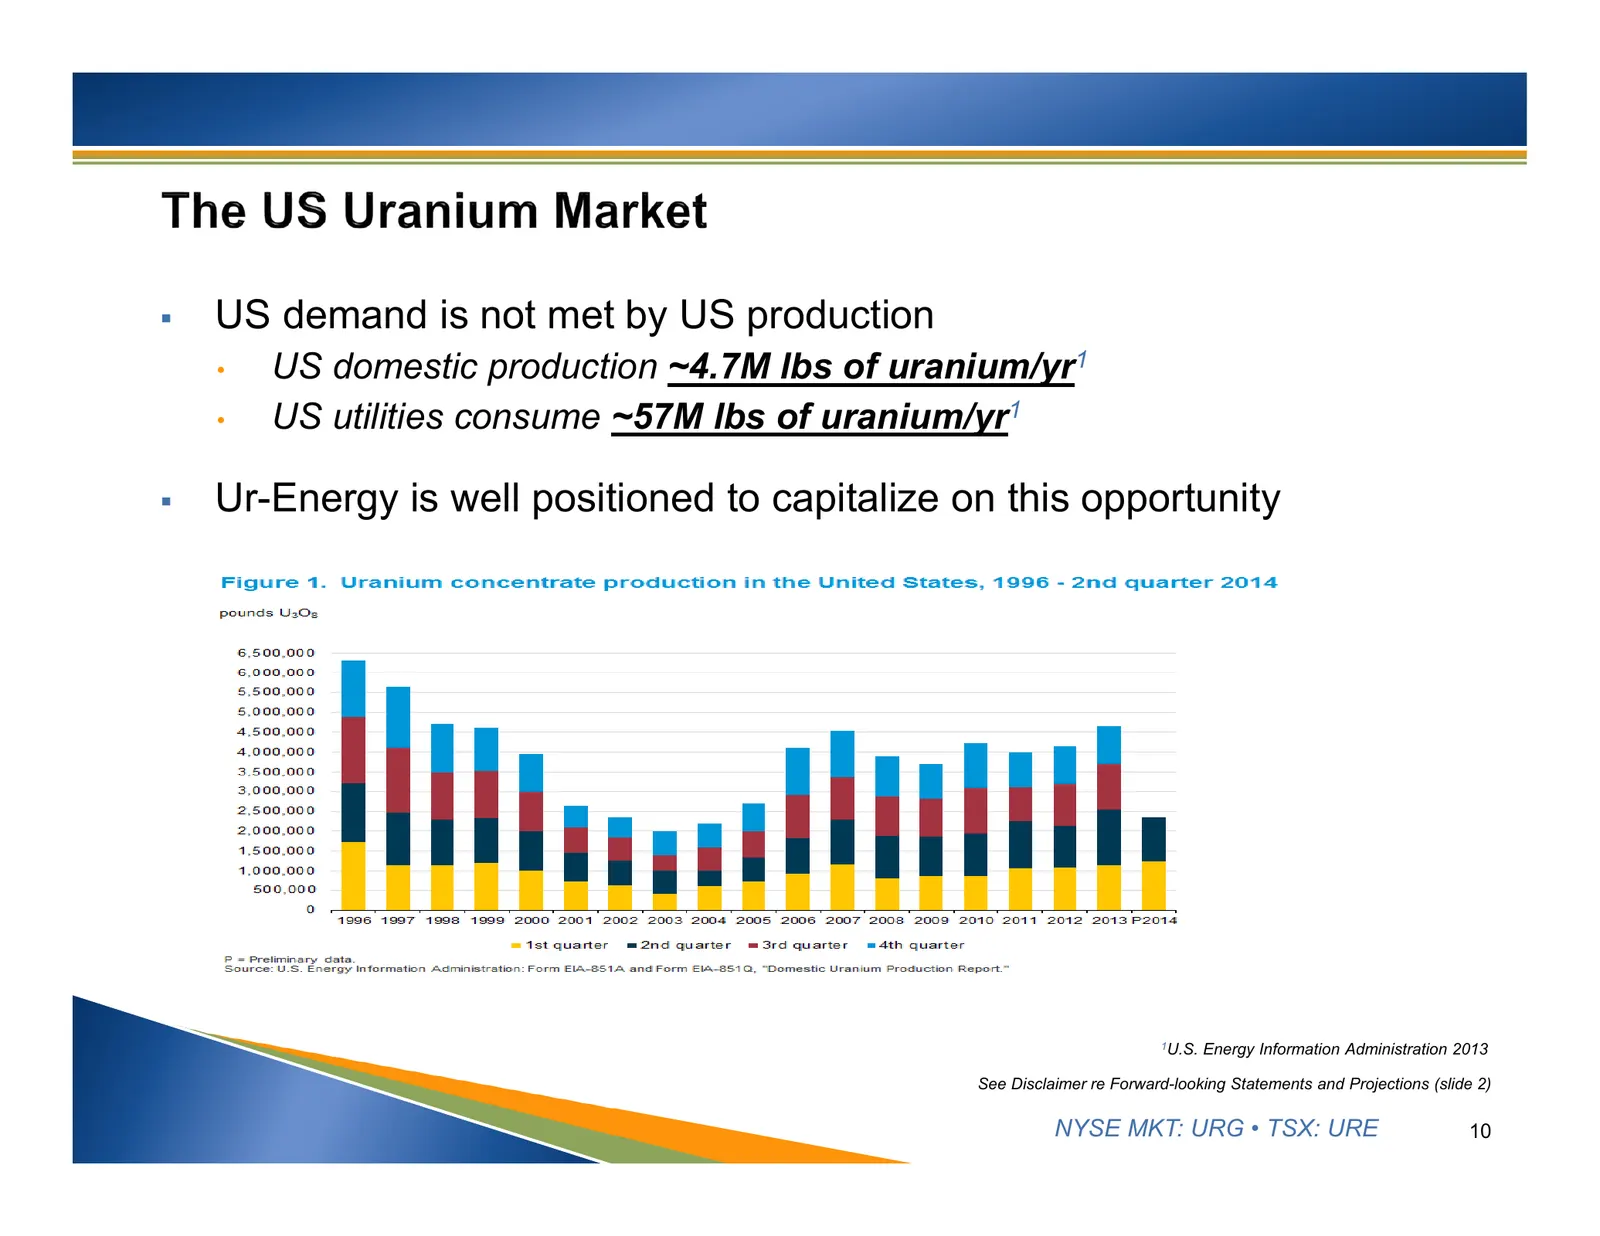
Slide 10: US demand is not met by US production
US demand is not met by US production • US domestic production ~4.7M lbs of uranium/yr1 • US utilities consume ~57M lbs of uranium/yr1 Ur-Energy is well positioned to capitalize on this opportunity 1U.S. Energy Information Administration 2013 See Disclaimer re Forward-looking Statements and Proj
Slide 11: Eight long term sales contracts 2013-2019
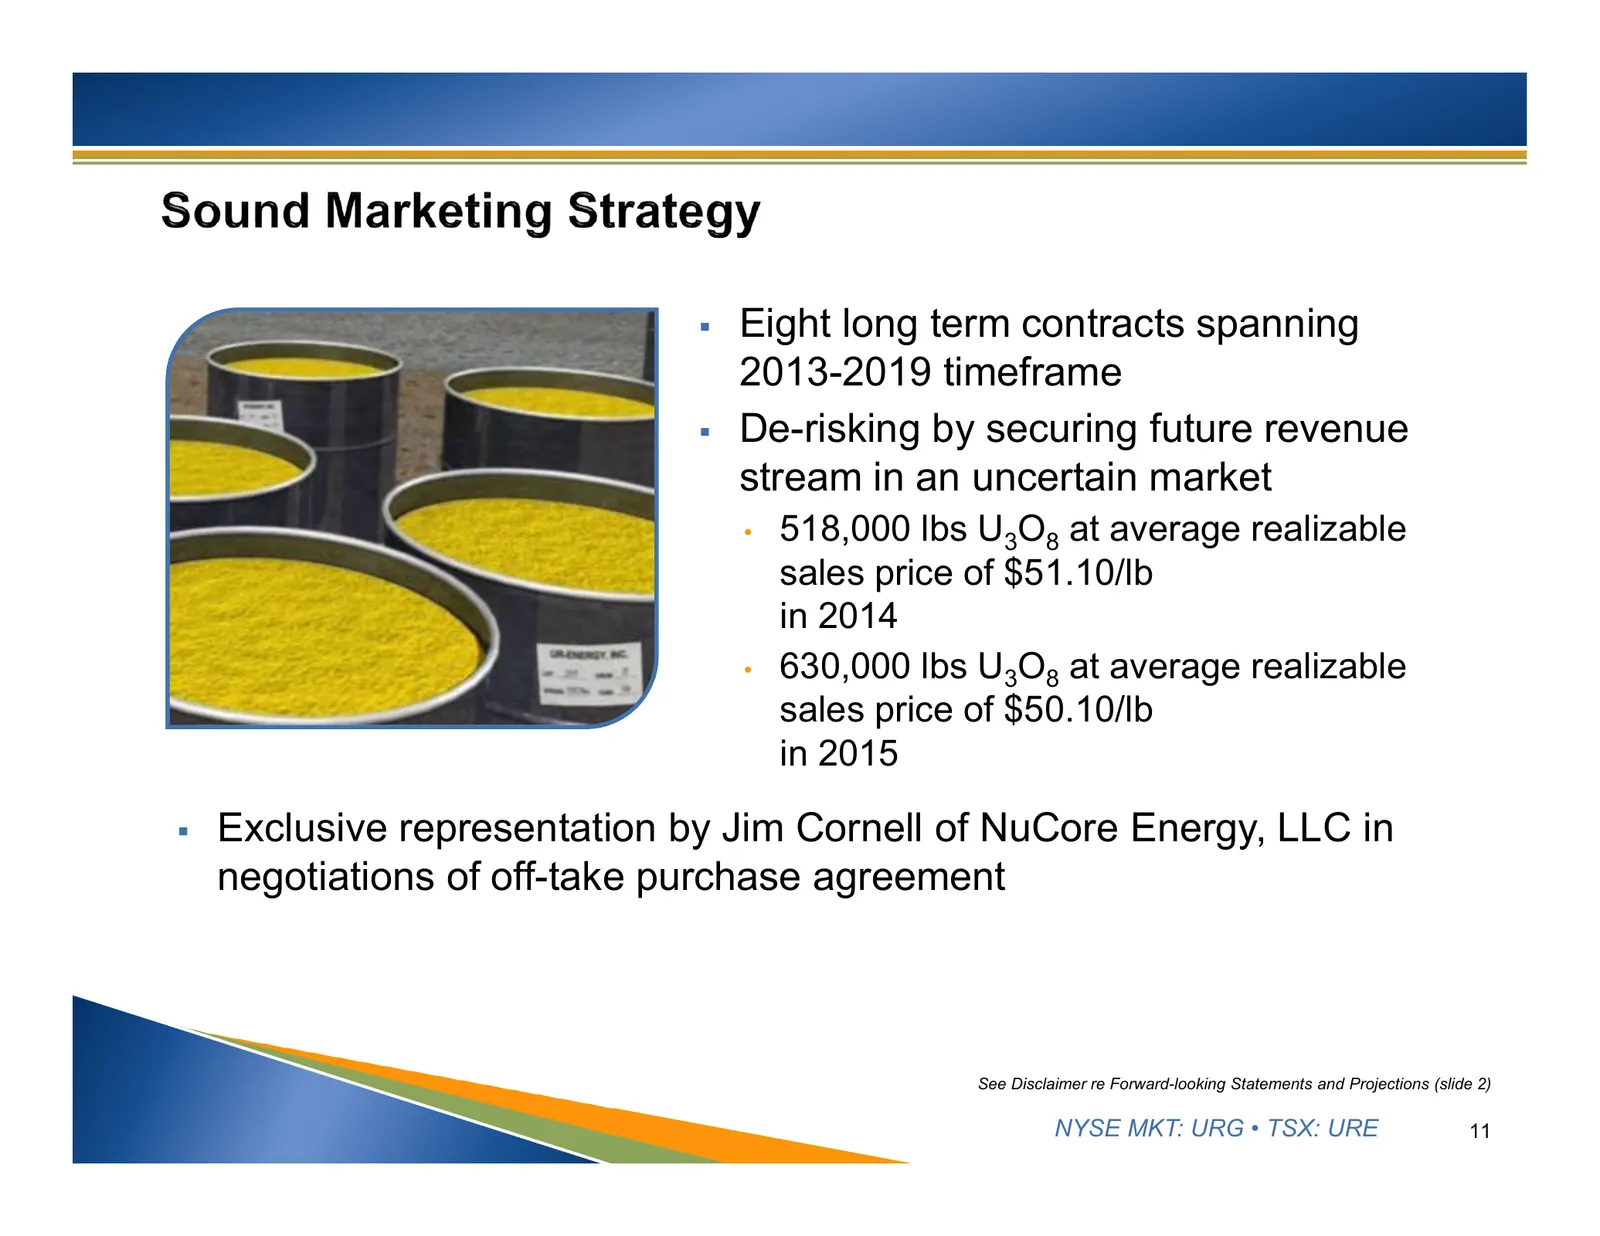
Eight long term contracts spanning 2013-2019 timeframe De-risking by securing future revenue stream in an uncertain market • 518,000 lbs U3O8 at average realizable sales price of $51.10/lb in 2014 • 630,000 lbs U3O8 at average realizable sales price of $50.10/lb in 2015 Exclusive representatio
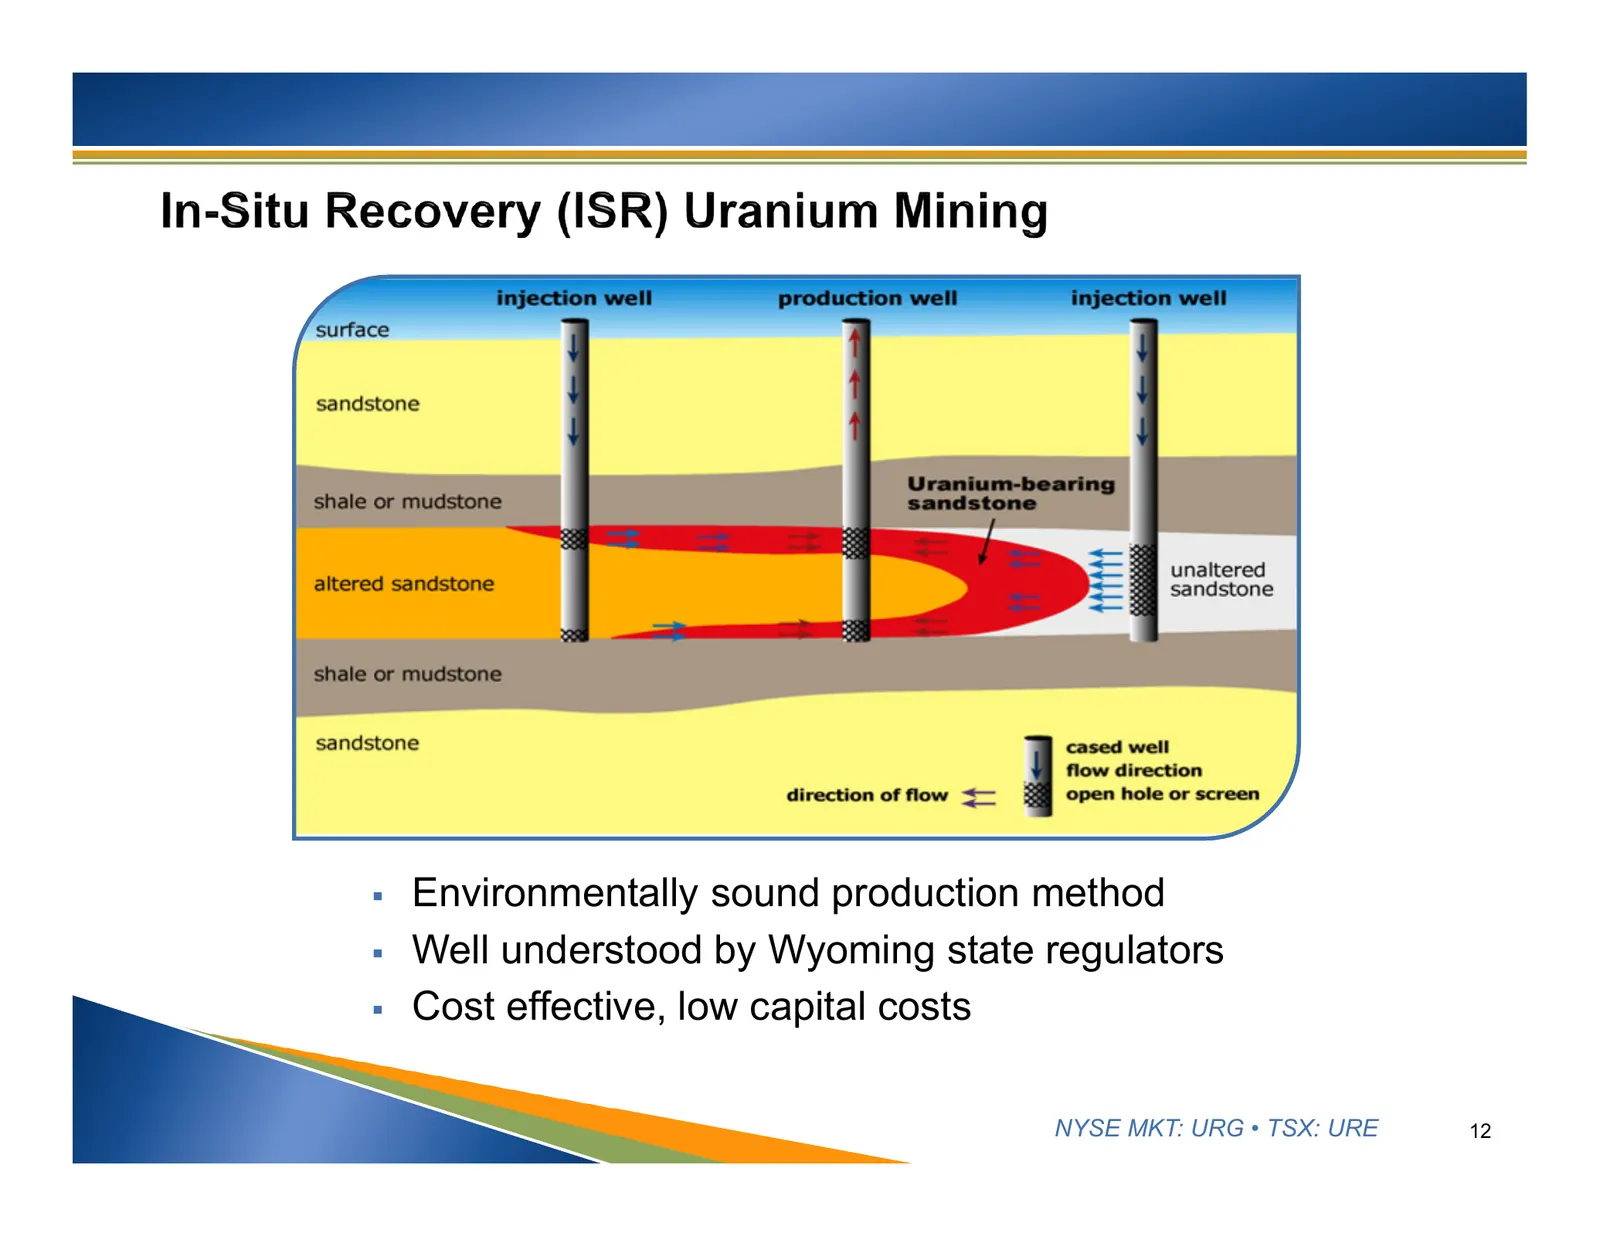
Slide 12: Environmentally sound production method
Environmentally sound production method Well understood by Wyoming state regulators Cost effective, low capital costs NYSE MKT: URG • TSX: URE 12
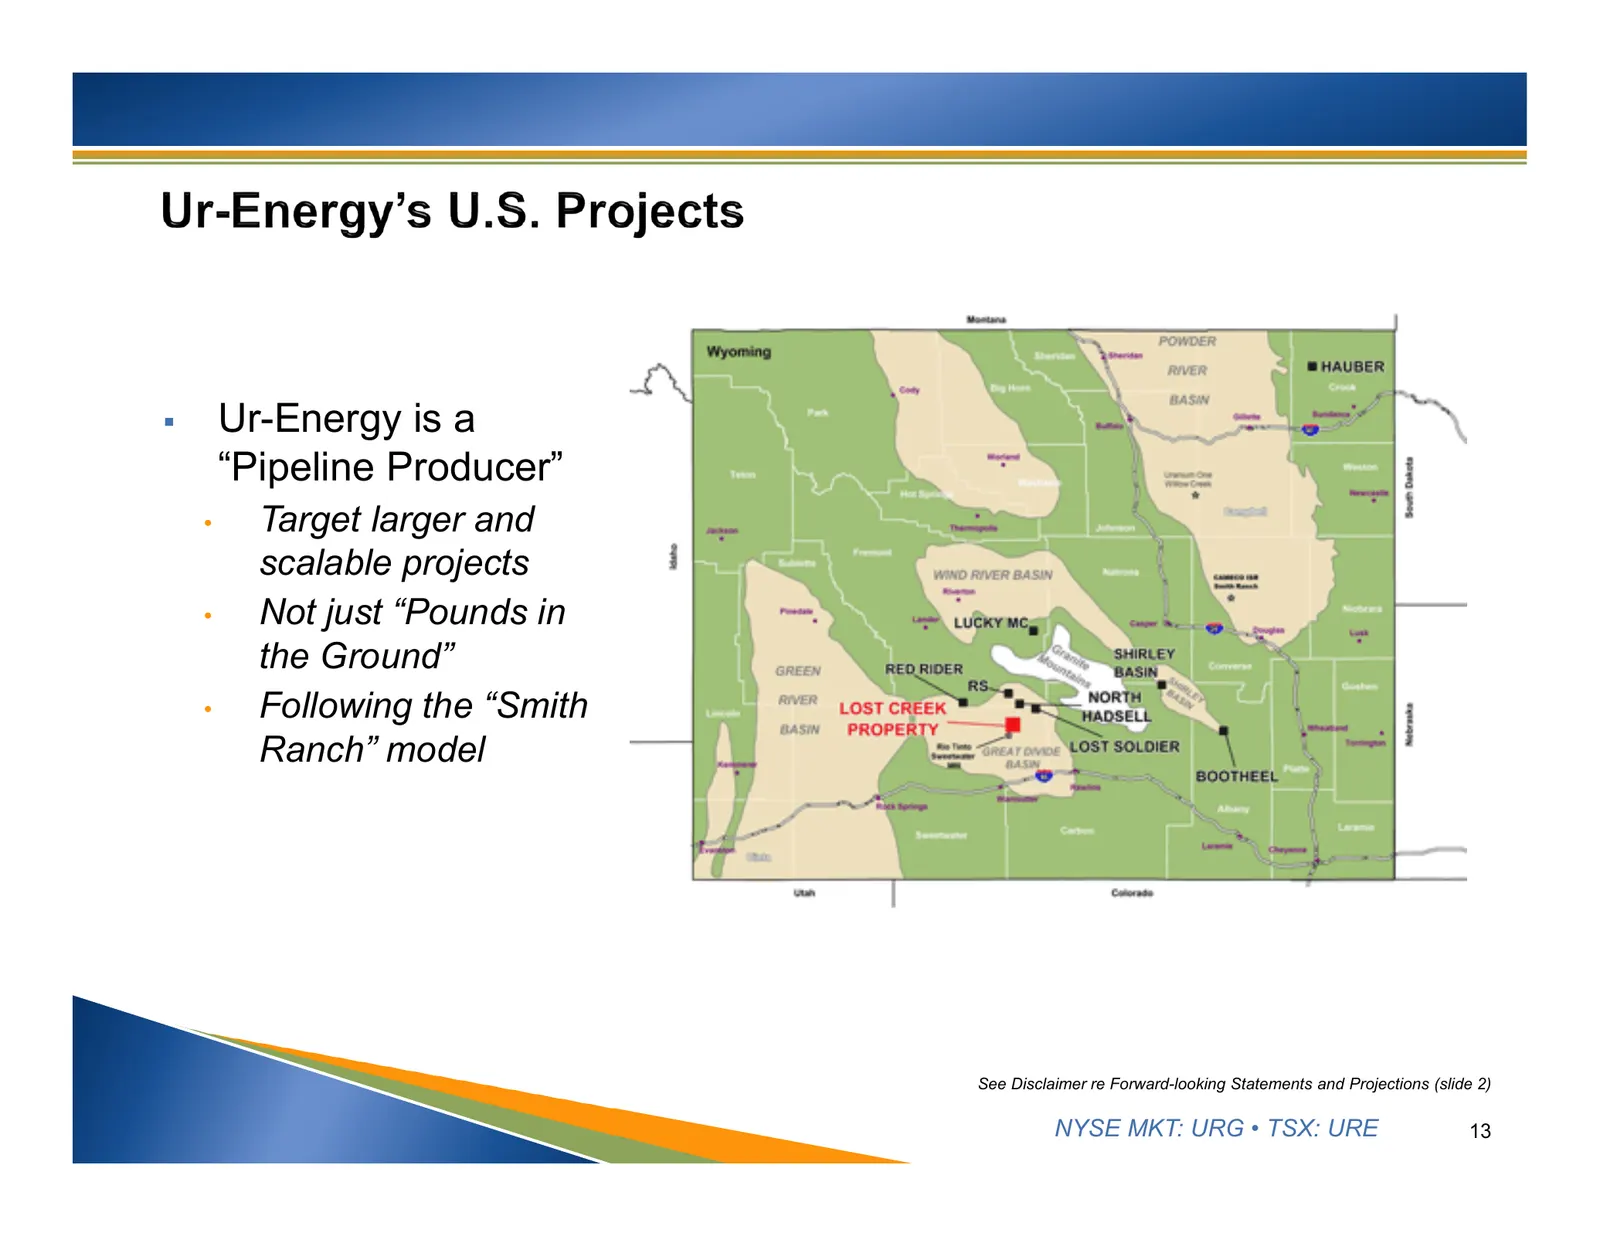
Slide 13: Ur-Energy is a Pipeline Producer
Ur-Energy is a “Pipeline Producer” • Target larger and scalable projects • Not just “Pounds in the Ground” • Following the “Smith Ranch” model See Disclaimer re Forward-looking Statements and Projections (slide 2) NYSE MKT: URG • TSX: URE 13
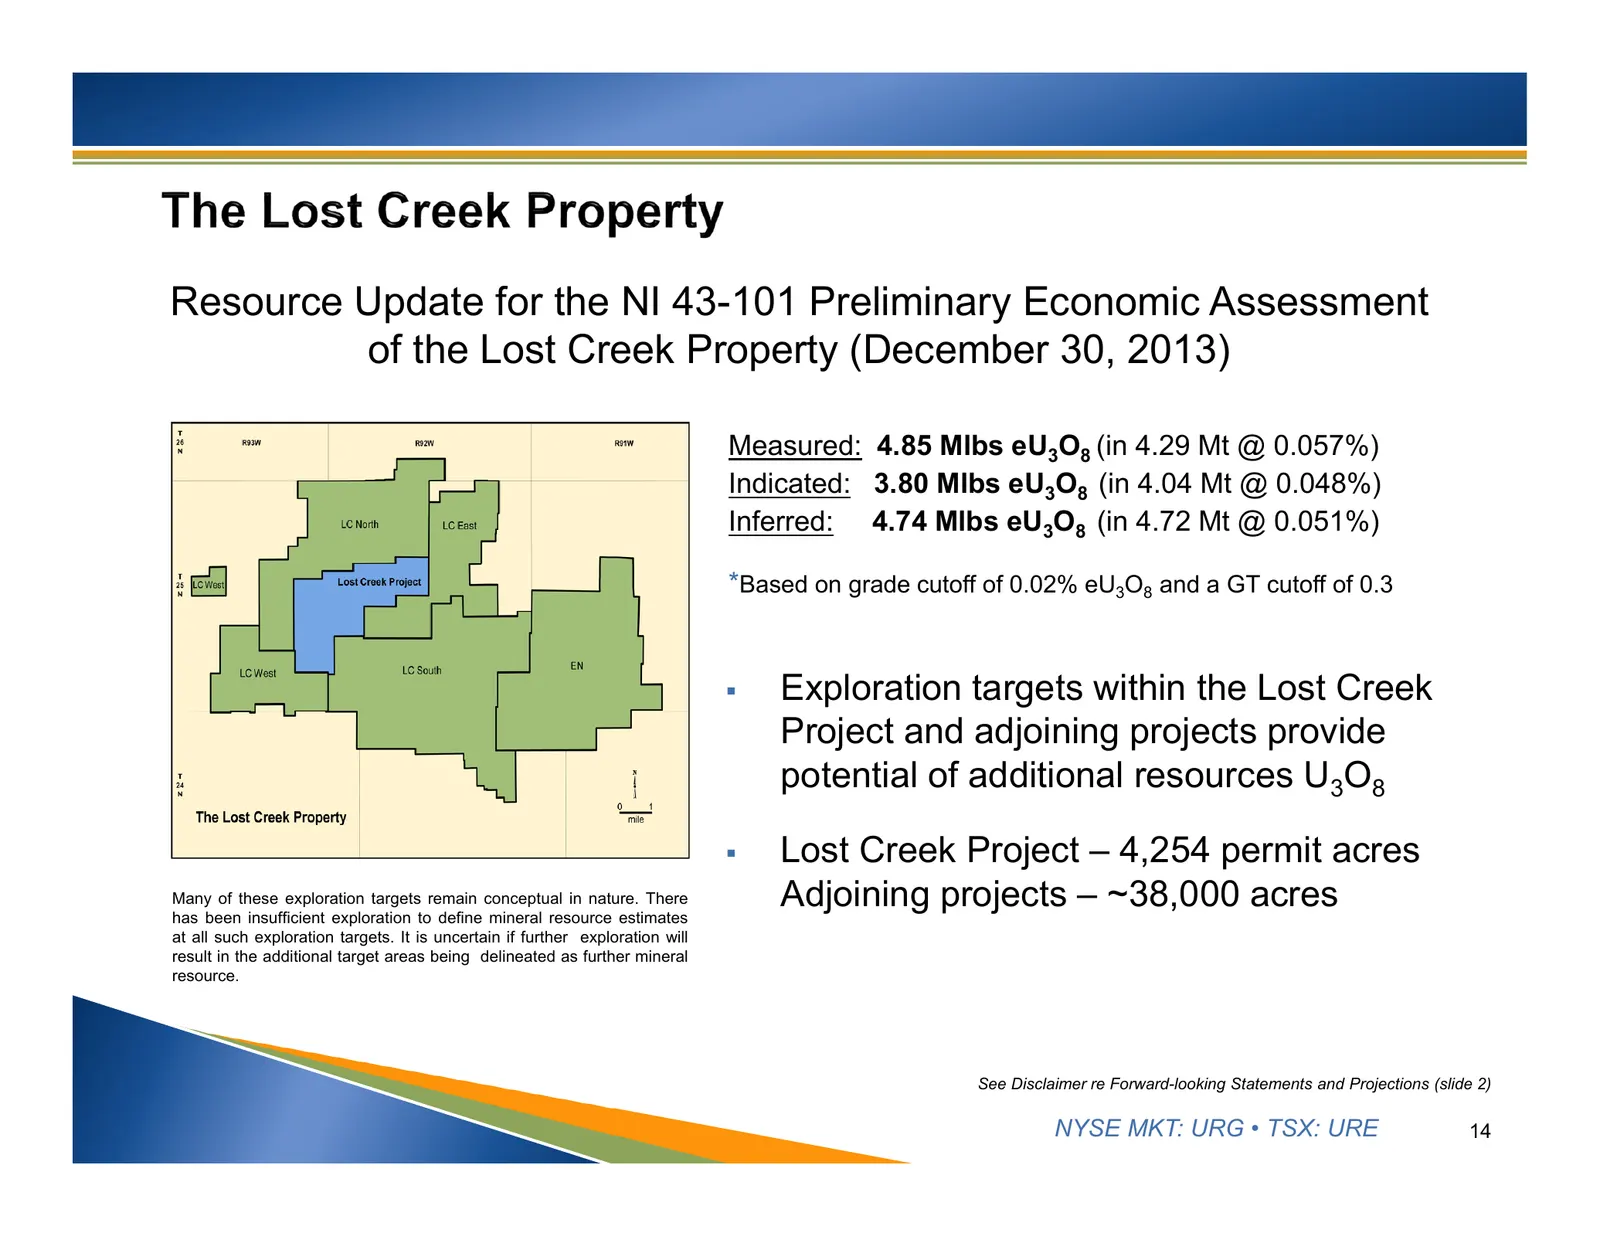
Slide 14: Resource Update for Lost Creek Property PEA
Resource Update for the NI 43-101 Preliminary Economic Assessment of the Lost Creek Property (December 30, 2013) Measured: 4.85 Mlbs eU3O8 (in 4.29 Mt @ 0.057%) Indicated: 3.80 Mlbs eU3O8 (in 4.04 Mt @ 0.048%) Inferred: 4.74 Mlbs eU3O8 (in 4.72 Mt @ 0.051%) *Based on grade cutoff of 0.02% eU3O8 and
Slide 15: December 2013 PEA updates resources and economic analysis
December 30, 2013 PEA* updates resources and economic analysis Estimates 9.2 million pounds recoverable over life of mine Lost Creek Project Economics • Gross Revenues of US$588M LOM • Net Cash flow US$319M • Internal rate of return (IRR) at 74.5% Lowest quartile Uranium Production Costs • Est
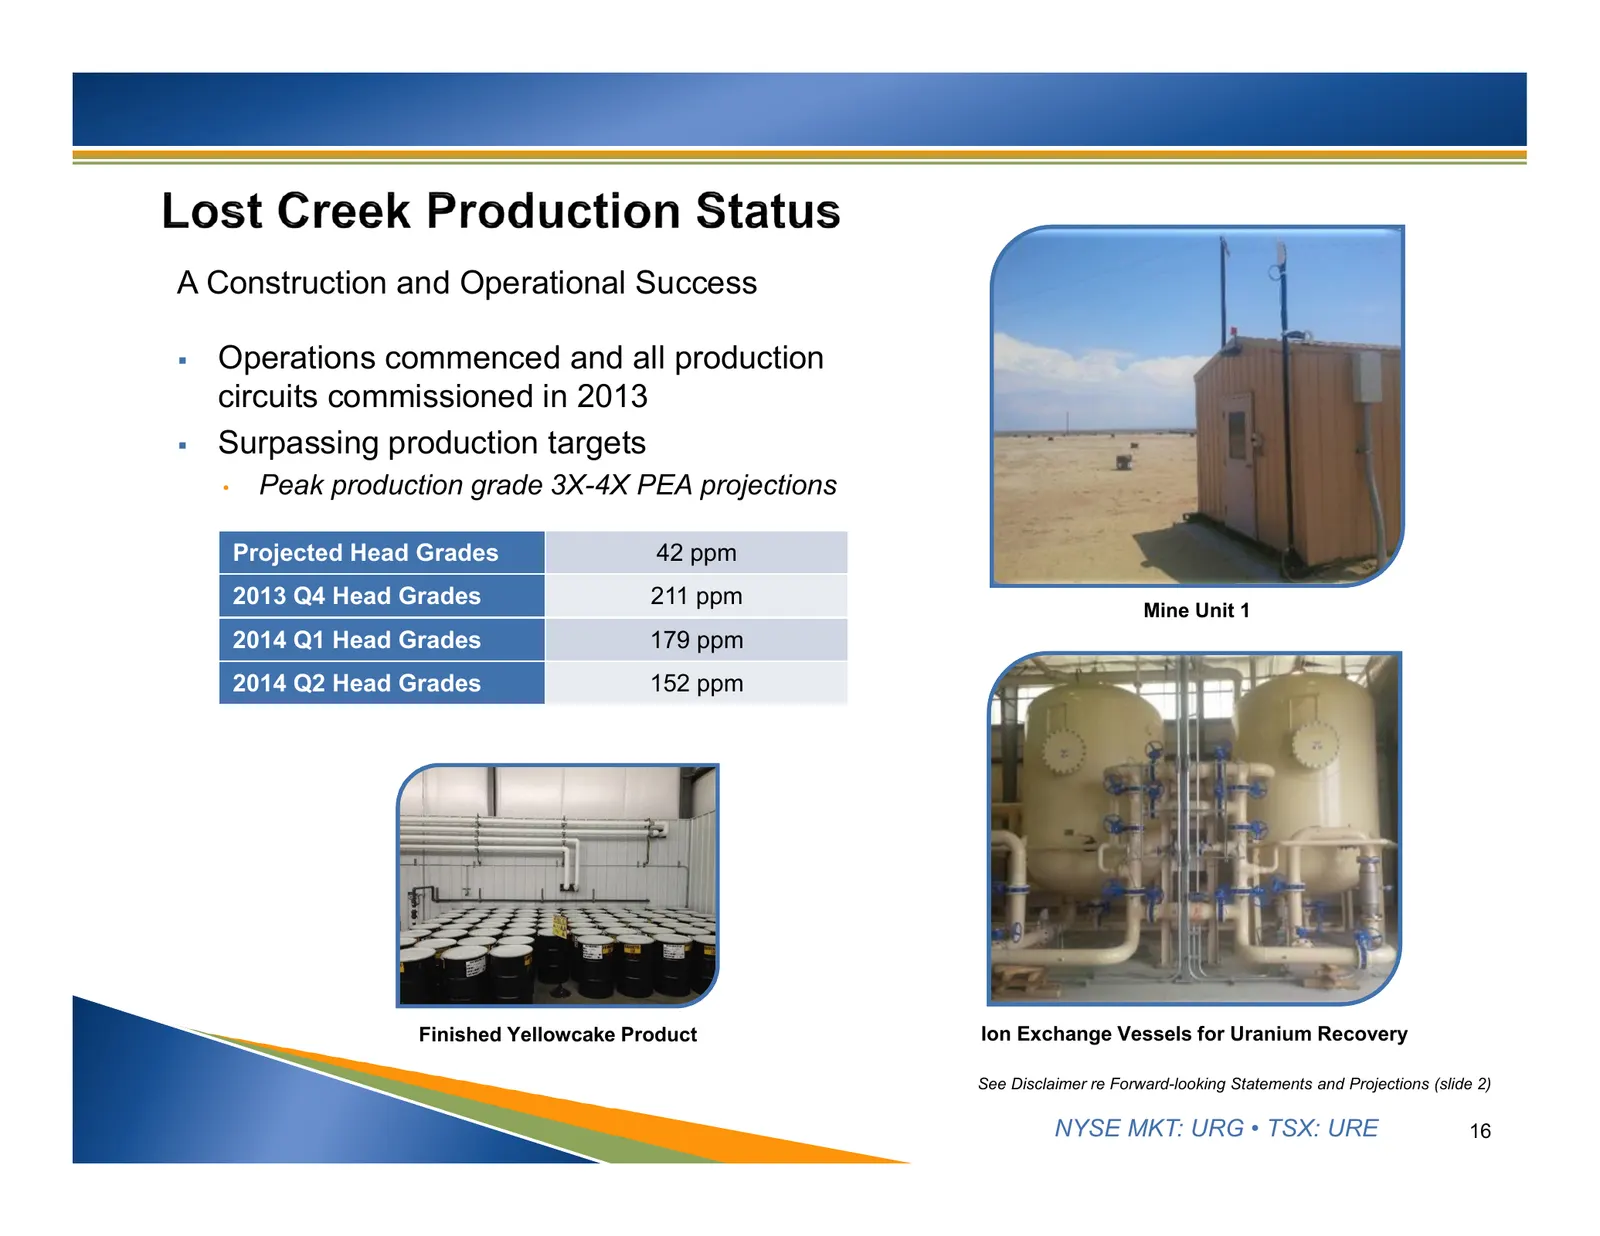
Slide 16: A Construction and Operational Success
A Construction and Operational Success Operations commenced and all production circuits commissioned in 2013 Surpassing production targets • Peak production grade 3X-4X PEA projections Projected Head Grades 42 ppm 2013 Q4 Head Grades 211 ppm Mine Unit 1 2014 Q1 Head Grades 179 ppm 2014 Q2 Head G
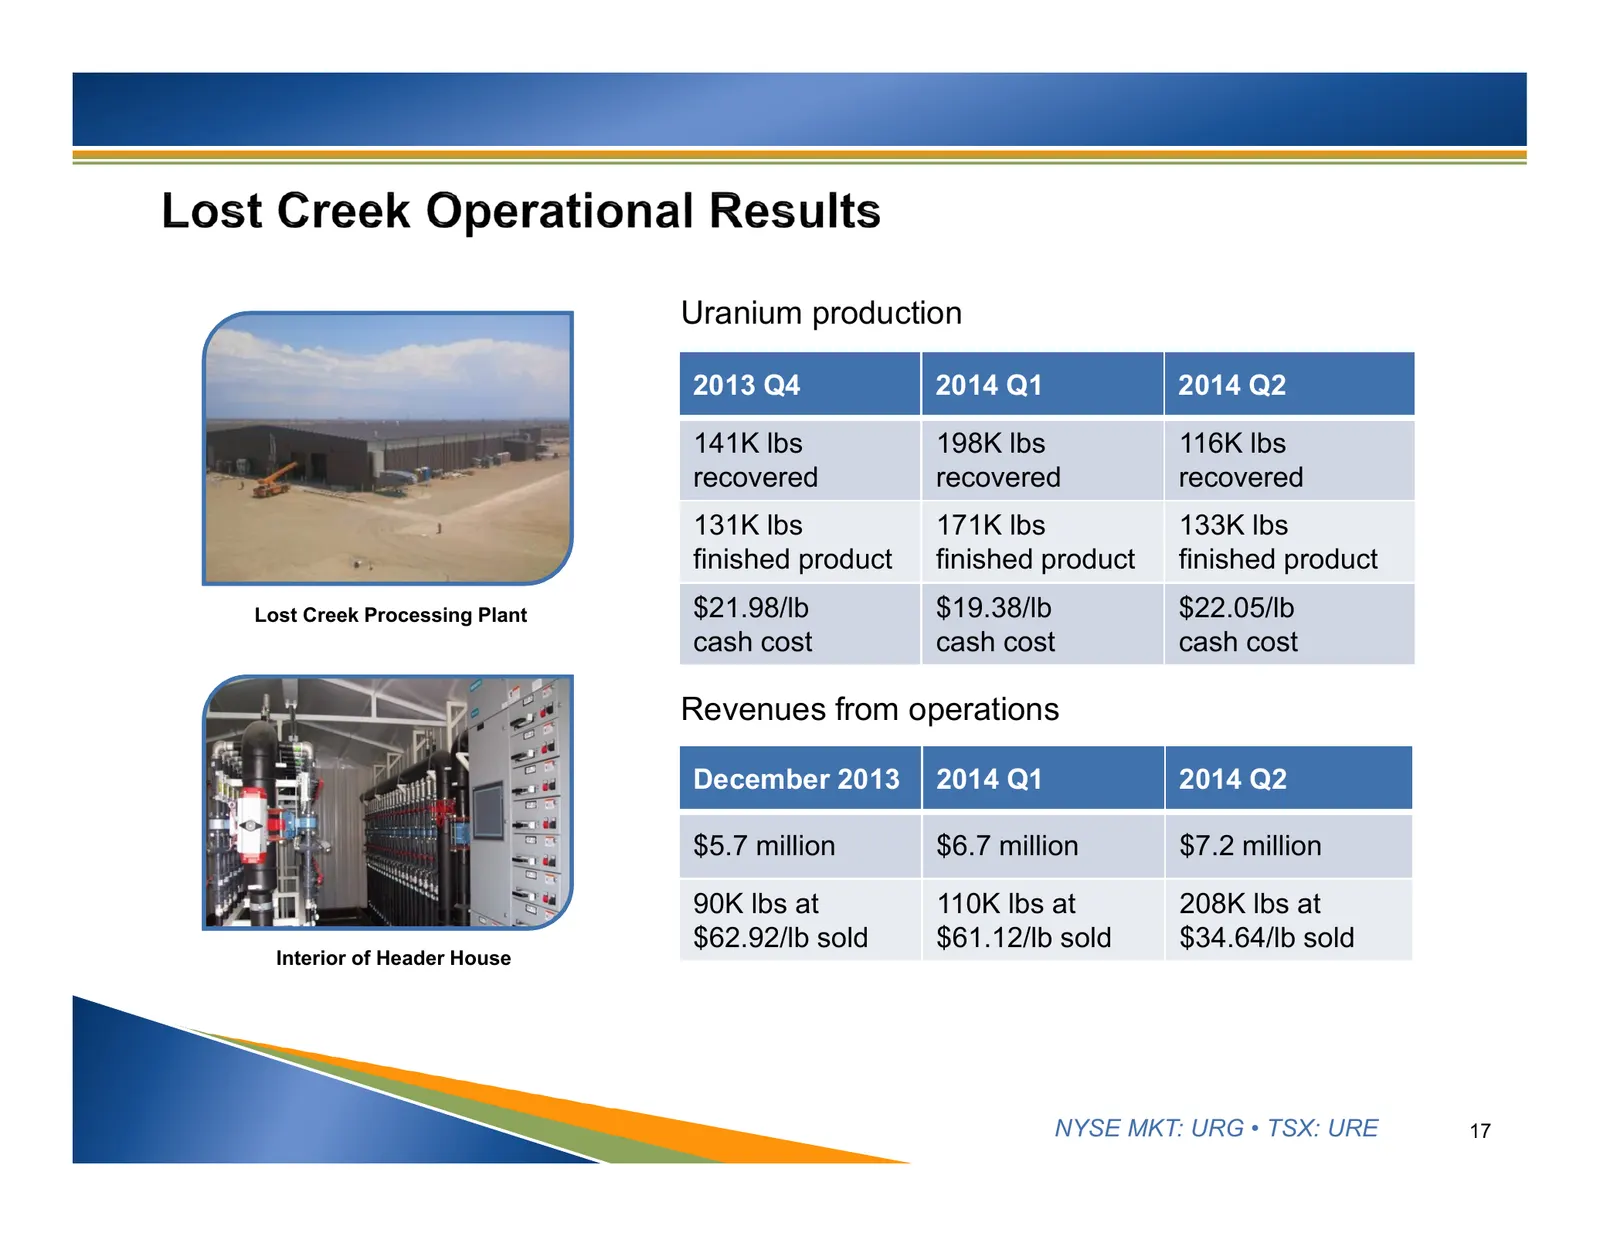
Slide 17: Uranium production and revenues from operations
Uranium production 2013 Q4 2014 Q1 2014 Q2 141K lbs 198K lbs 116K lbs recovered recovered recovered 131K lbs 171K lbs 133K lbs finished product finished product finished product Lost Creek Processing Plant $21.98/lb $19.38/lb $22.05/lb cash cost cash cost cash cost Revenues from operations December
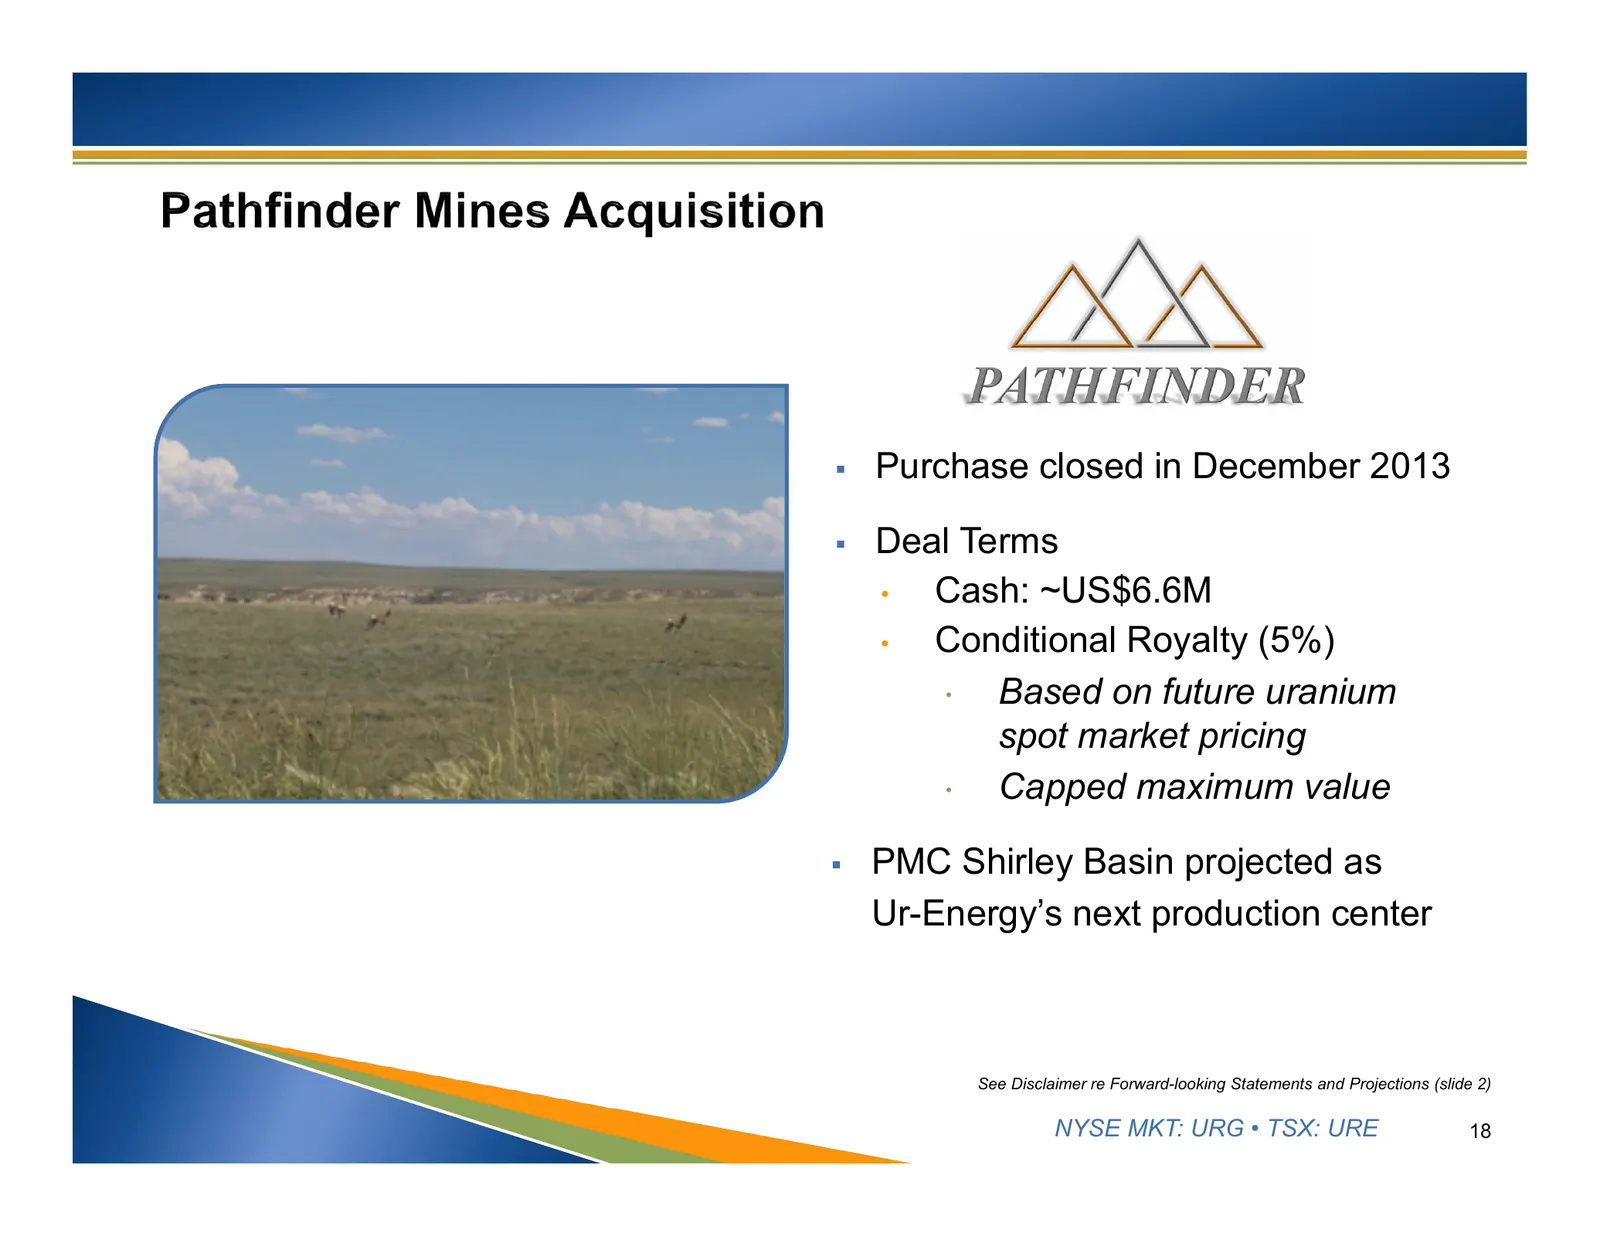
Slide 18: Pathfinder Mines acquisition
Purchase closed in December 2013 Deal Terms • Cash: ~US$6.6M • Conditional Royalty (5%) Based on future uranium spot market pricing Capped maximum value PMC Shirley Basin projected as Ur-Energy’s next production center See Disclaimer re Forward-looking Statements and Projections (slide 2)
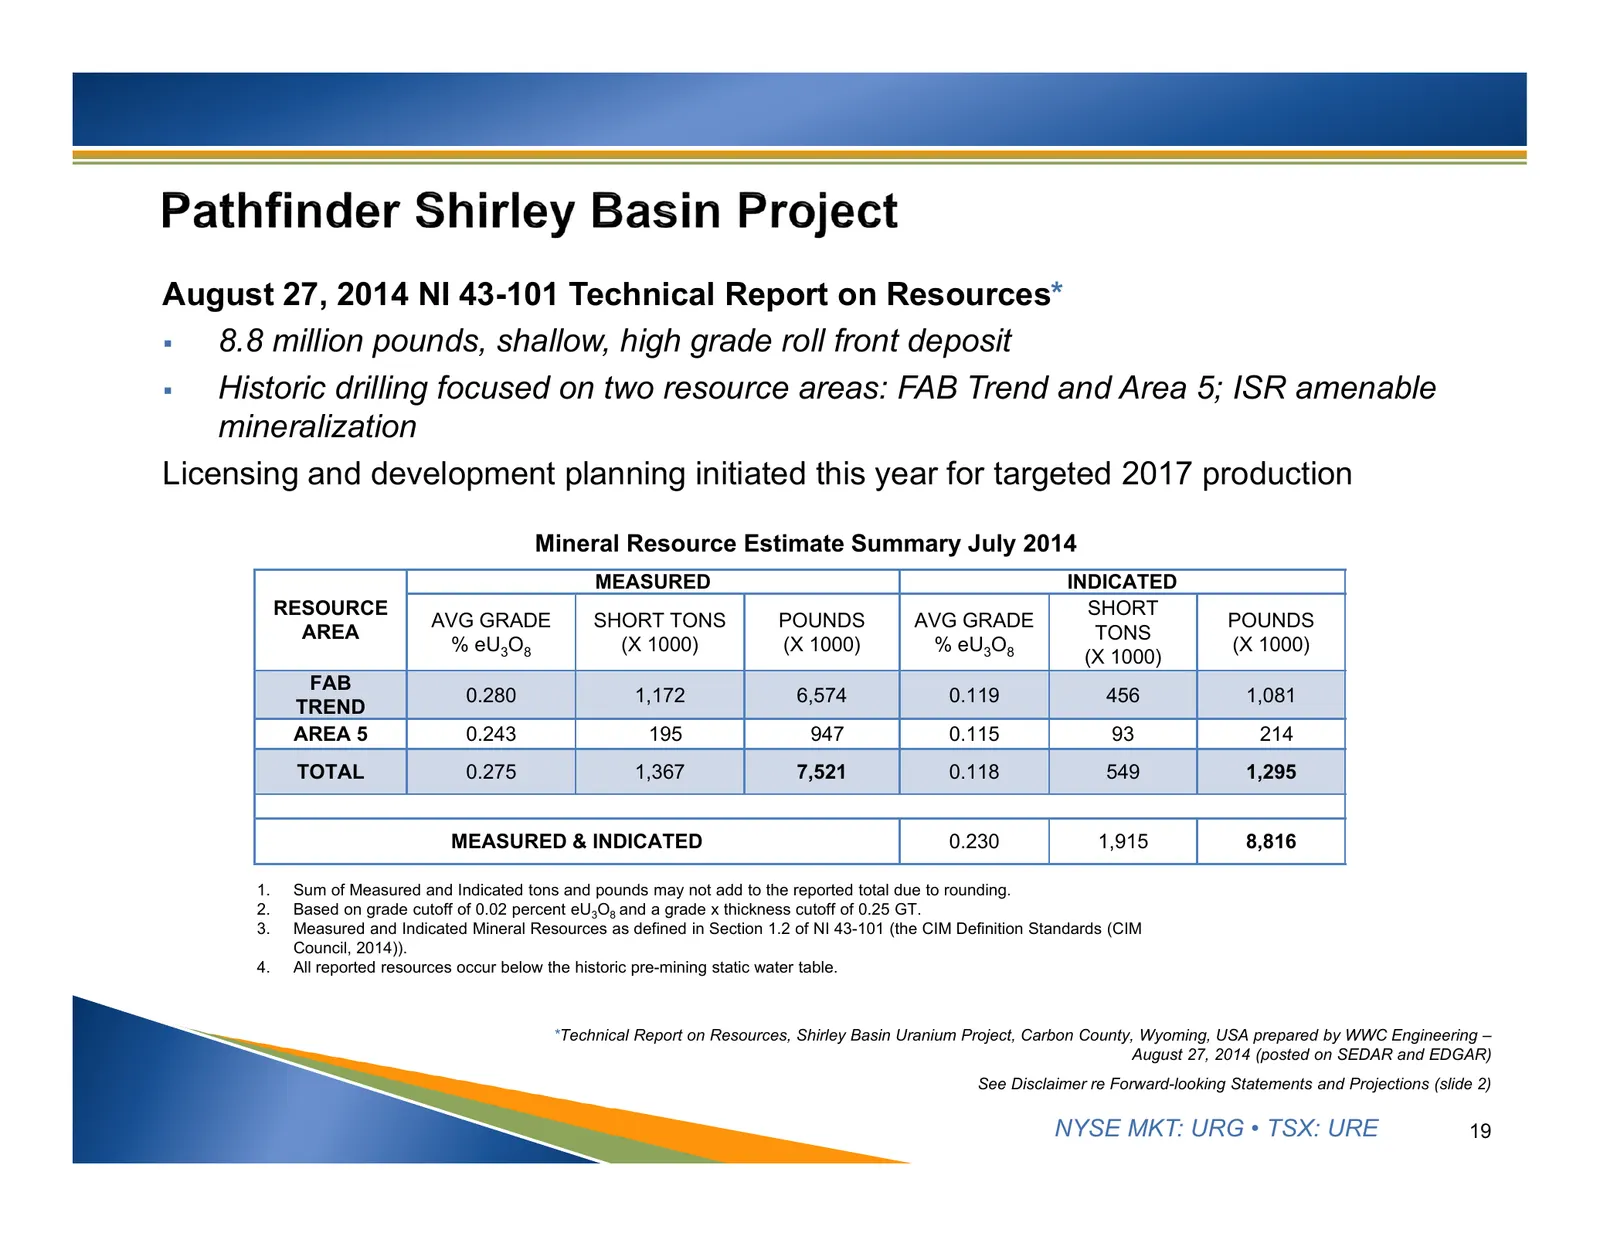
Slide 19: Shirley Basin NI 43-101 Technical Report on Resources
August 27, 2014 NI 43-101 Technical Report on Resources* 8.8 million pounds, shallow, high grade roll front deposit Historic drilling focused on two resource areas: FAB Trend and Area 5; ISR amenable mineralization Licensing and development planning initiated this year for targeted 2017 producti
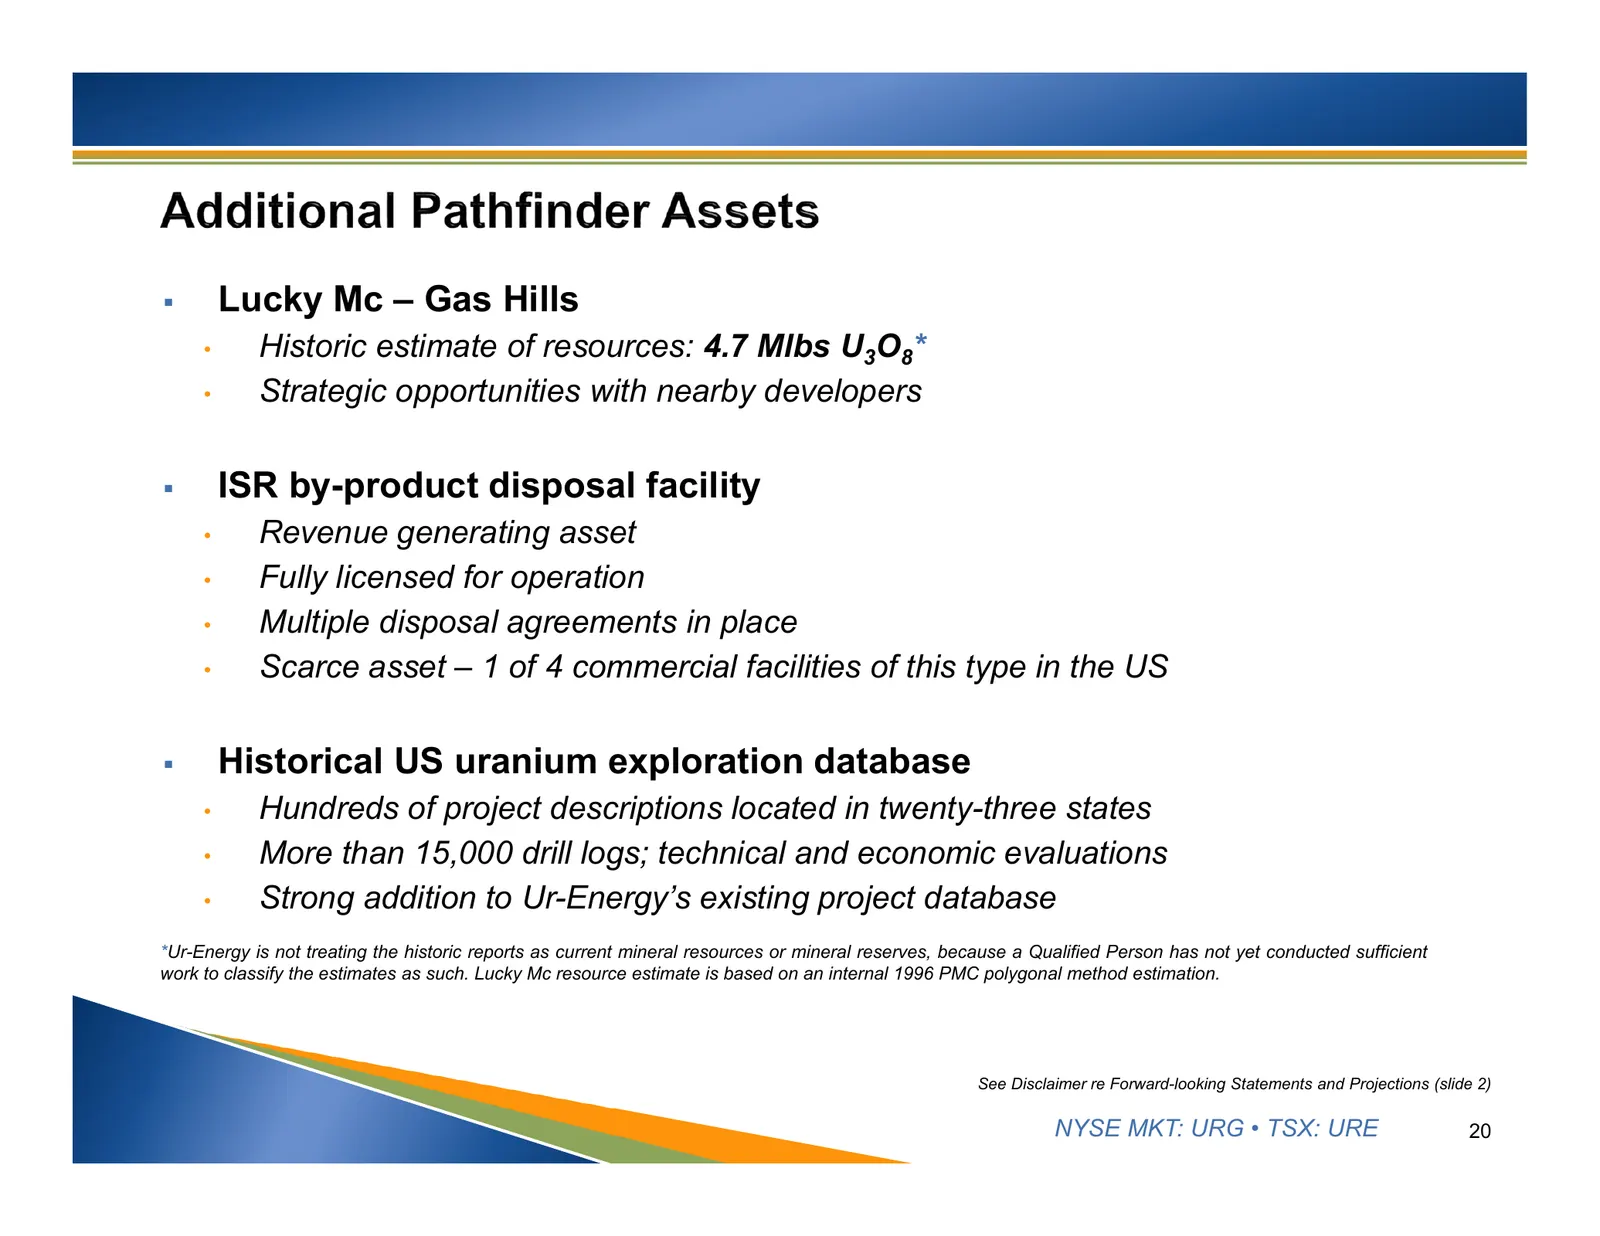
Slide 20: Lucky Mc, disposal facility and exploration database
Lucky Mc – Gas Hills • Historic estimate of resources: 4.7 Mlbs U3O8* • Strategic opportunities with nearby developers ISR by-product disposal facility • Revenue generating asset • Fully licensed for operation • Multiple disposal agreements in place • Scarce asset – 1 of 4 commercial facilities
Slide 21: Lost Soldier project resource
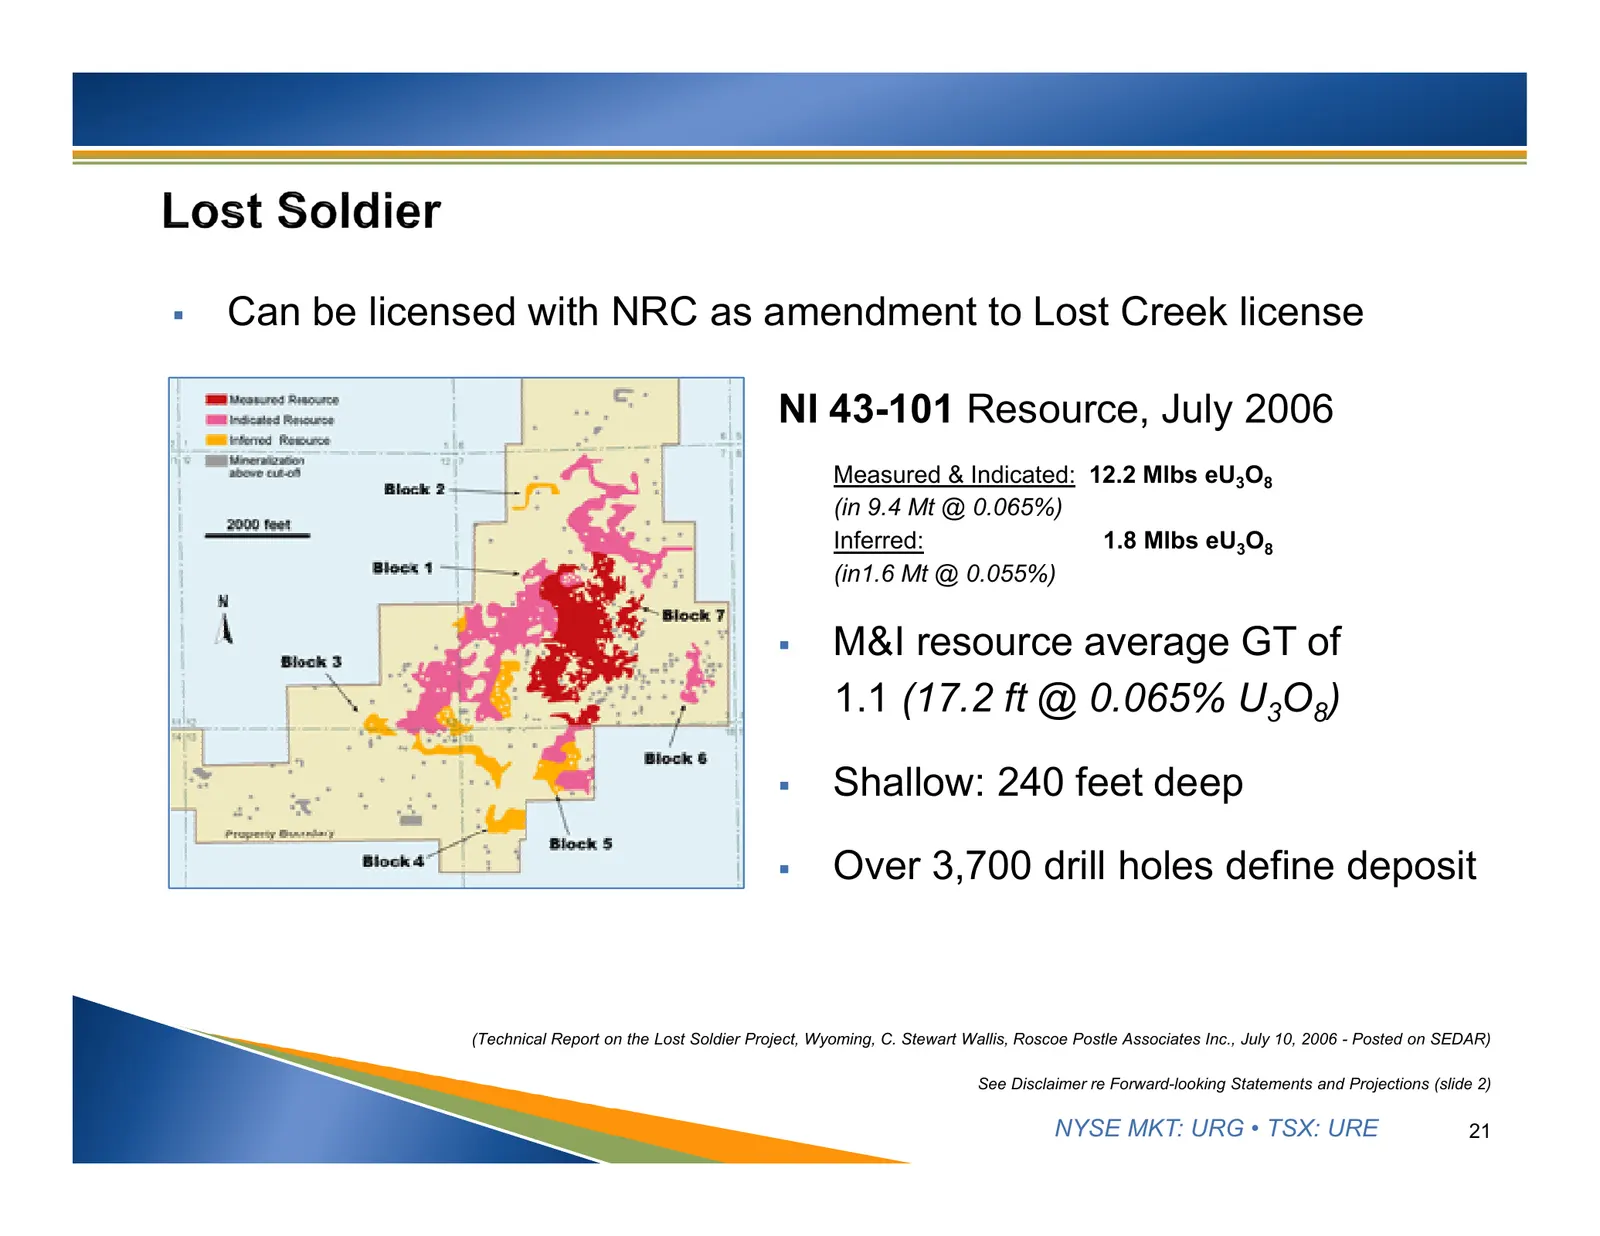
Can be licensed with NRC as amendment to Lost Creek license NI 43-101 Resource, July 2006 Measured & Indicated: 12.2 Mlbs eU3O8 (in 9.4 Mt @ 0.065%) Inferred: 1.8 Mlbs eU3O8 (in1.6 Mt @ 0.055%) M&I resource average GT of 1.1 (17.2 ft @ 0.065% U3O8) Shallow: 240 feet deep Over 3,700 drill hol
Slide 22: Growth oriented technical & management team
Growth oriented technical & management team Proven record of developing projects through to production • Low-cost uranium production center at Lost Creek • Production rates exceeding technical expectations Development (not exploration) project pipeline Pathfinder – Shirley Basin Multiple l
Slide 23: Advance Lost Creek to nameplate production
1. Advance Lost Creek to nameplate production • Ramping up to “steady state” production • Expand resources through drilling programs 2. Pathfinder Mines • Transition to operating and regulatory activities • Resources NI 43-101 compliant 3. Corporate finance – positive cash position • Lost Creek prod
Slide 24: For more information, please contact
For more information, please contact: Wayne Heili, President, Chief Executive Officer & Director Jeff Klenda, Board Chairman & Executive Director Rich Boberg, Director of Investor and Public Relations Charisse Heser, Manager of Investor and Public Relations By Mail: Ur-Energy Corporate Office 10758
Source: Internet Archive copy of ur-energy.com
More decks from Ur-Energy Inc.
 Q3 2026 Earnings Presentation9 slides · Nov 10, 2026
 Investor Presentation (October 2026)24 slides · October 2026
 Q2 2026 Earnings Presentation8 slides · Aug 11, 2026
 Investor Presentation (July 2026)15 slides · Jul 13, 2026
 Investor Presentation (March 2019)23 slides · Mar 7, 2019
 Corporate Update (August 2018)23 slides · Aug 7, 2018