Innolux Corp. · TWSE:3481
Innolux — Q4 2012 Earnings Presentation
19 slides from Innolux's earnings presentation, February 2013

Slide 1: 4Q 2012 Earning Results
4Q 2012 Earning Results February 2013
Slide 2: Disclaimer
Disclaimer Innolux Corporation’s statements of its current expectations and estimates are forward- looking statements subject to significant known and unknown risks and uncertainties and actual results may differ materially from those contained or implied in the forward looking statements. These for
Slide 3: Profits Highlights - QoQ & YoY
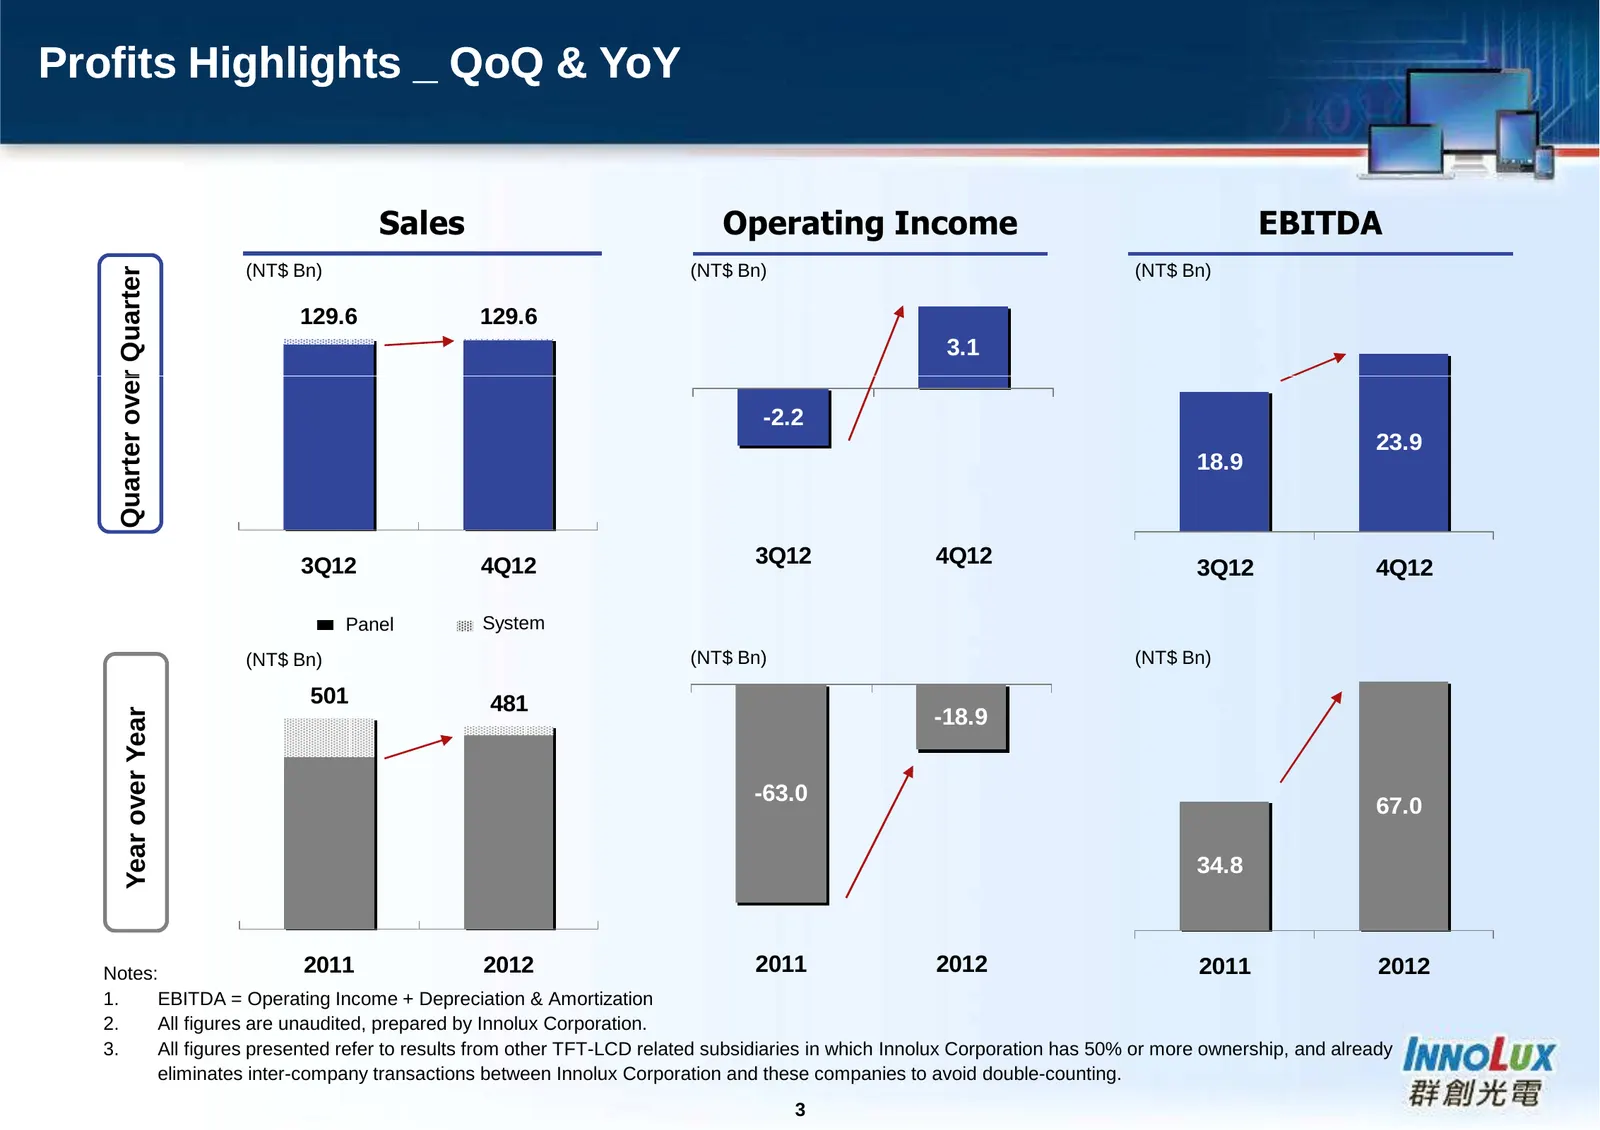
Profits Highlights _ QoQ & YoY Sales Operating Income EBITDA (NT$ Bn) (NT$ Bn) (NT$ Bn) Quarter over Quarter 129.6 129.6 3.1 -2.2 23.9 18.9 3Q12 4Q12 3Q12 4Q12 3Q12 4Q12 Panel System (NT$ Bn) (NT$ Bn) (NT$ Bn) 501 481 Year over Year -18.9 -63.0 67.0 34.8 Notes: 2011 2012 2011 2012 2011 2012 1. EBITD
Slide 4: 4Q 2012 Combined Income Statement - QoQ
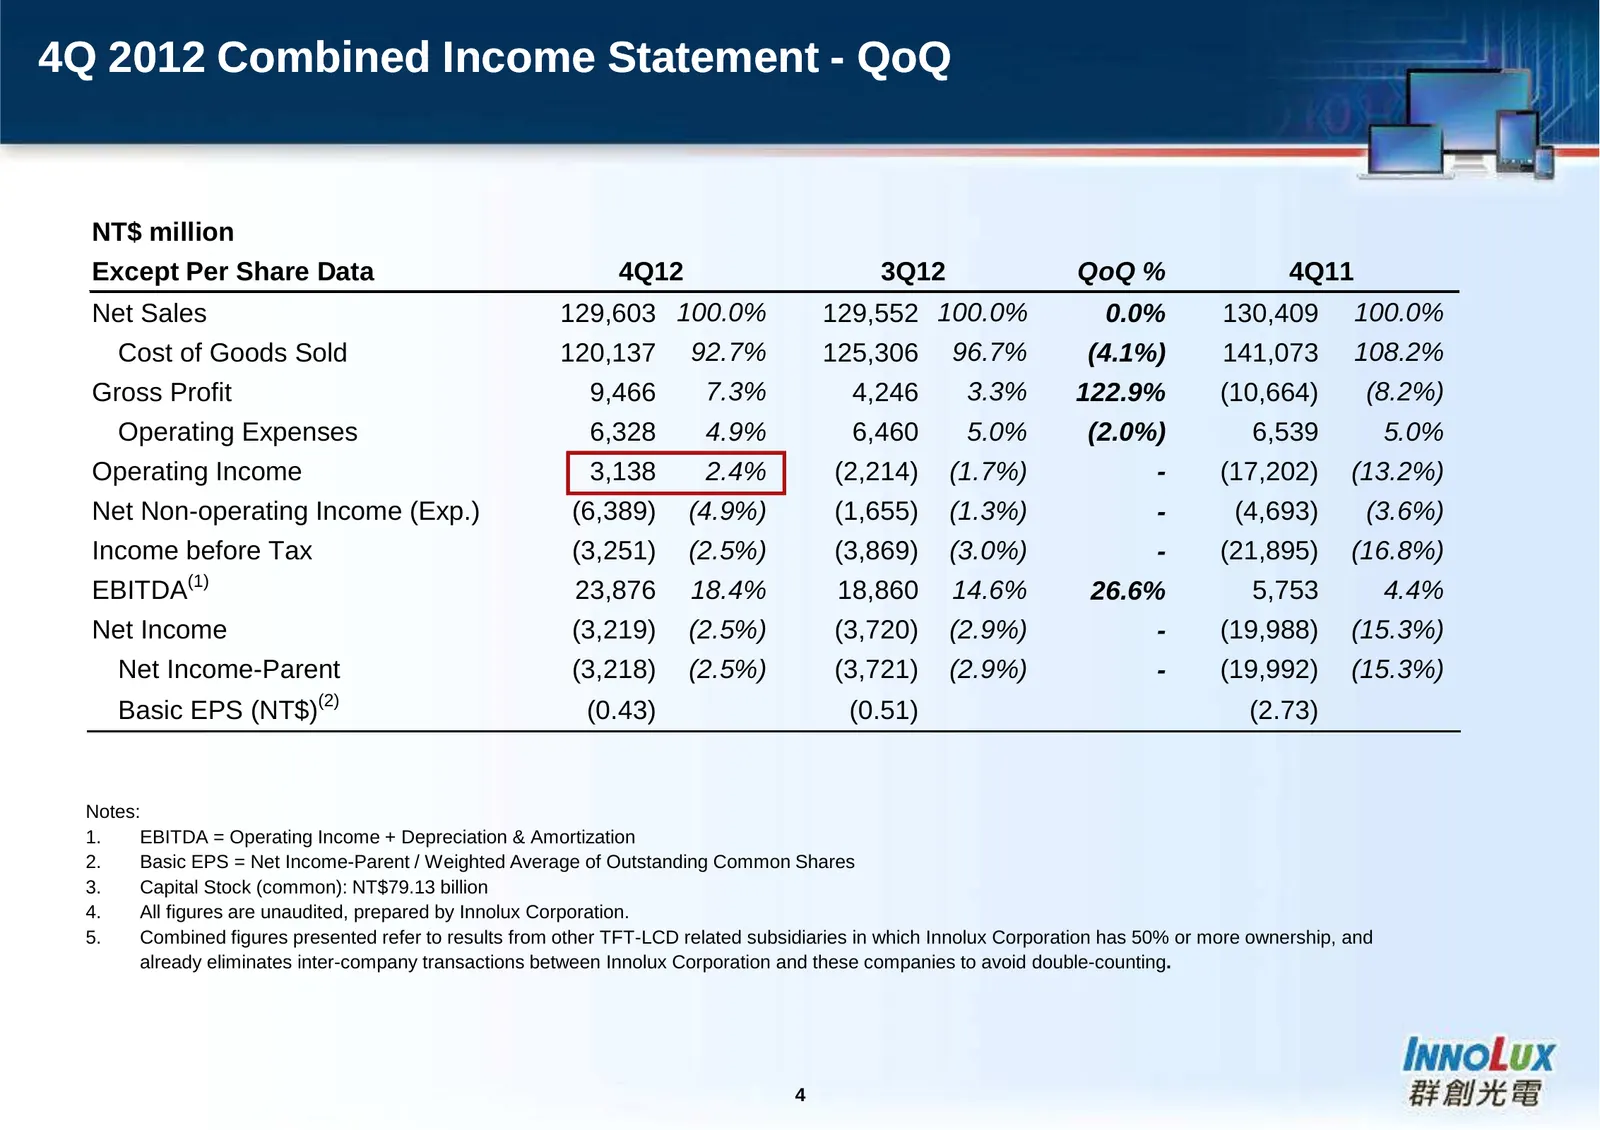
4Q 2012 Combined Income Statement - QoQ NT$ million Except Per Share Data 4Q12 3Q12 QoQ % 4Q11 Net Sales 129,603 100.0% 129,552 100.0% 0.0% 130,409 100.0% Cost of Goods Sold 120,137 92.7% 125,306 96.7% (4.1%) 141,073 108.2% Gross Profit 9,466 7.3% 4,246 3.3% 122.9% (10,664) (8.2%) Operating Expenses
Slide 5: 2012 Combined Income Statement - YoY
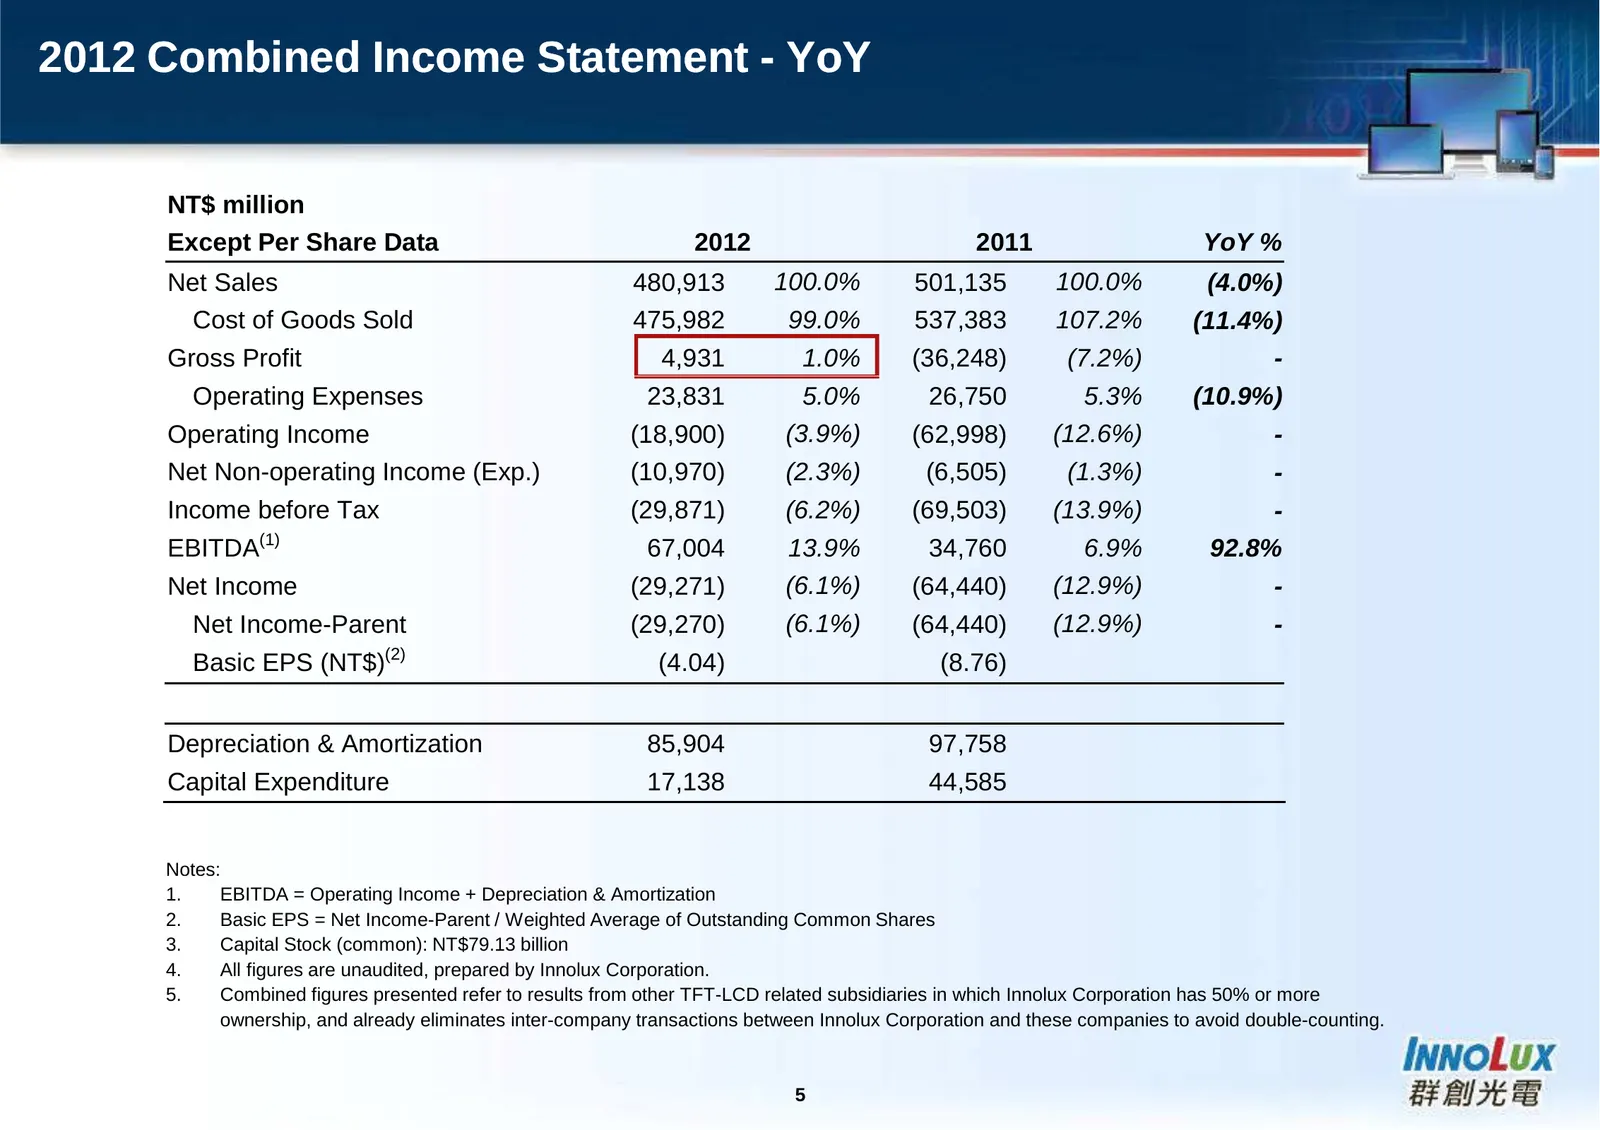
2012 Combined Income Statement - YoY NT$ million Except Per Share Data 2012 2011 YoY % Net Sales 480,913 100.0% 501,135 100.0% (4.0%) Cost of Goods Sold 475,982 99.0% 537,383 107.2% (11.4%) Gross Profit 4,931 1.0% (36,248) (7.2%) - Operating Expenses 23,831 5.0% 26,750 5.3% (10.9%) Operating Income
Slide 6: Operating Income and EBITDA Trends
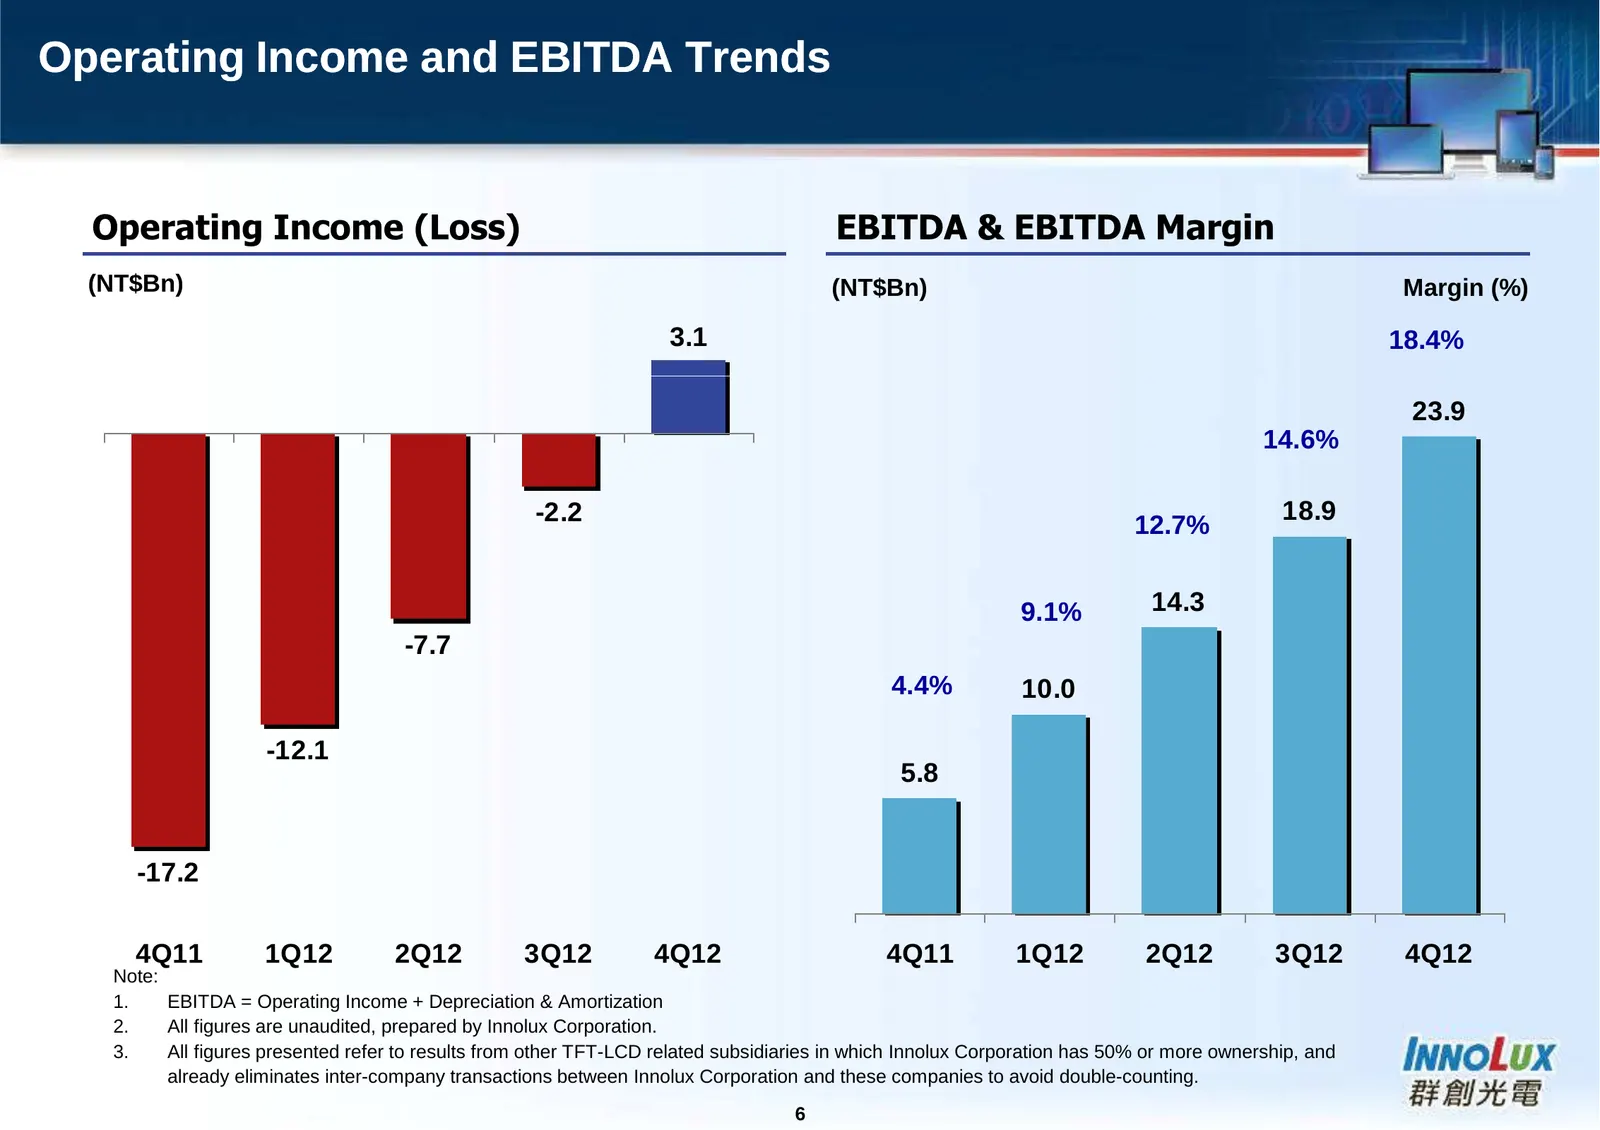
Operating Income and EBITDA Trends Operating Income (Loss) EBITDA & EBITDA Margin (NT$Bn) (NT$Bn) Margin (%) 3.1 18.4% 23.9 14.6% -2.2 18.9 12.7% 9.1% 14.3 -7.7 4.4% 10.0 -12.1 5.8 -17.2 4Q11 1Q12 2Q12 3Q12 4Q12 4Q11 1Q12 2Q12 3Q12 4Q12 Note: 1. EBITDA = Operating Income + Depreciation & Amortizatio
Slide 7: Revenue, Gross Margin, EBITDA Margin, and EPS Trends
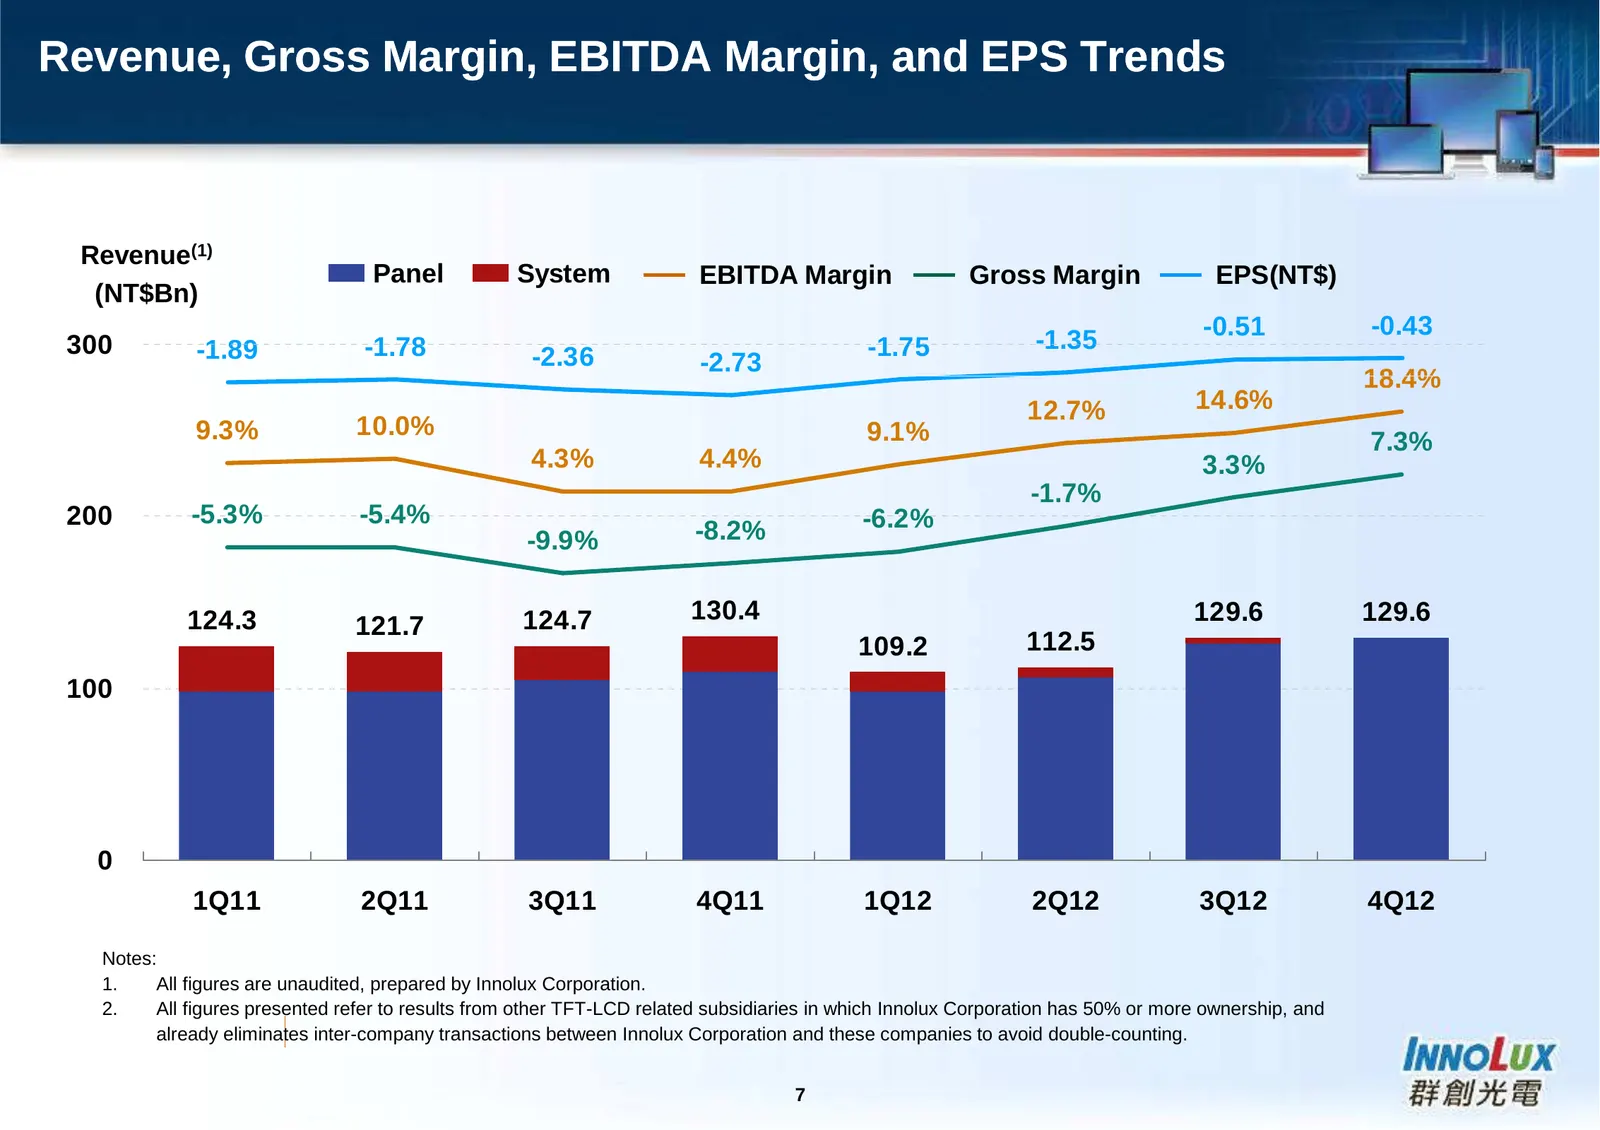
Revenue, Gross Margin, EBITDA Margin, and EPS Trends Revenue(1) 5 Panel System EBITDA Margin Gross Margin EPS(NT$) (NT$Bn) -0.51 -0.43 3000 -1.89 -1.78 -1.75 -1.35 -2.36 -2.73 18.4% 12.7% 14.6% (5) 9.3% 10.0% 9.1% 7.3% 4.3% 4.4% 3.3% -1.7% (10) 200 -5.3% -5.4% -6.2% -9.9% -8.2% (15) 124.3 124.7 130.
Slide 8: 4Q 2012 Combined Balance Sheet Highlights
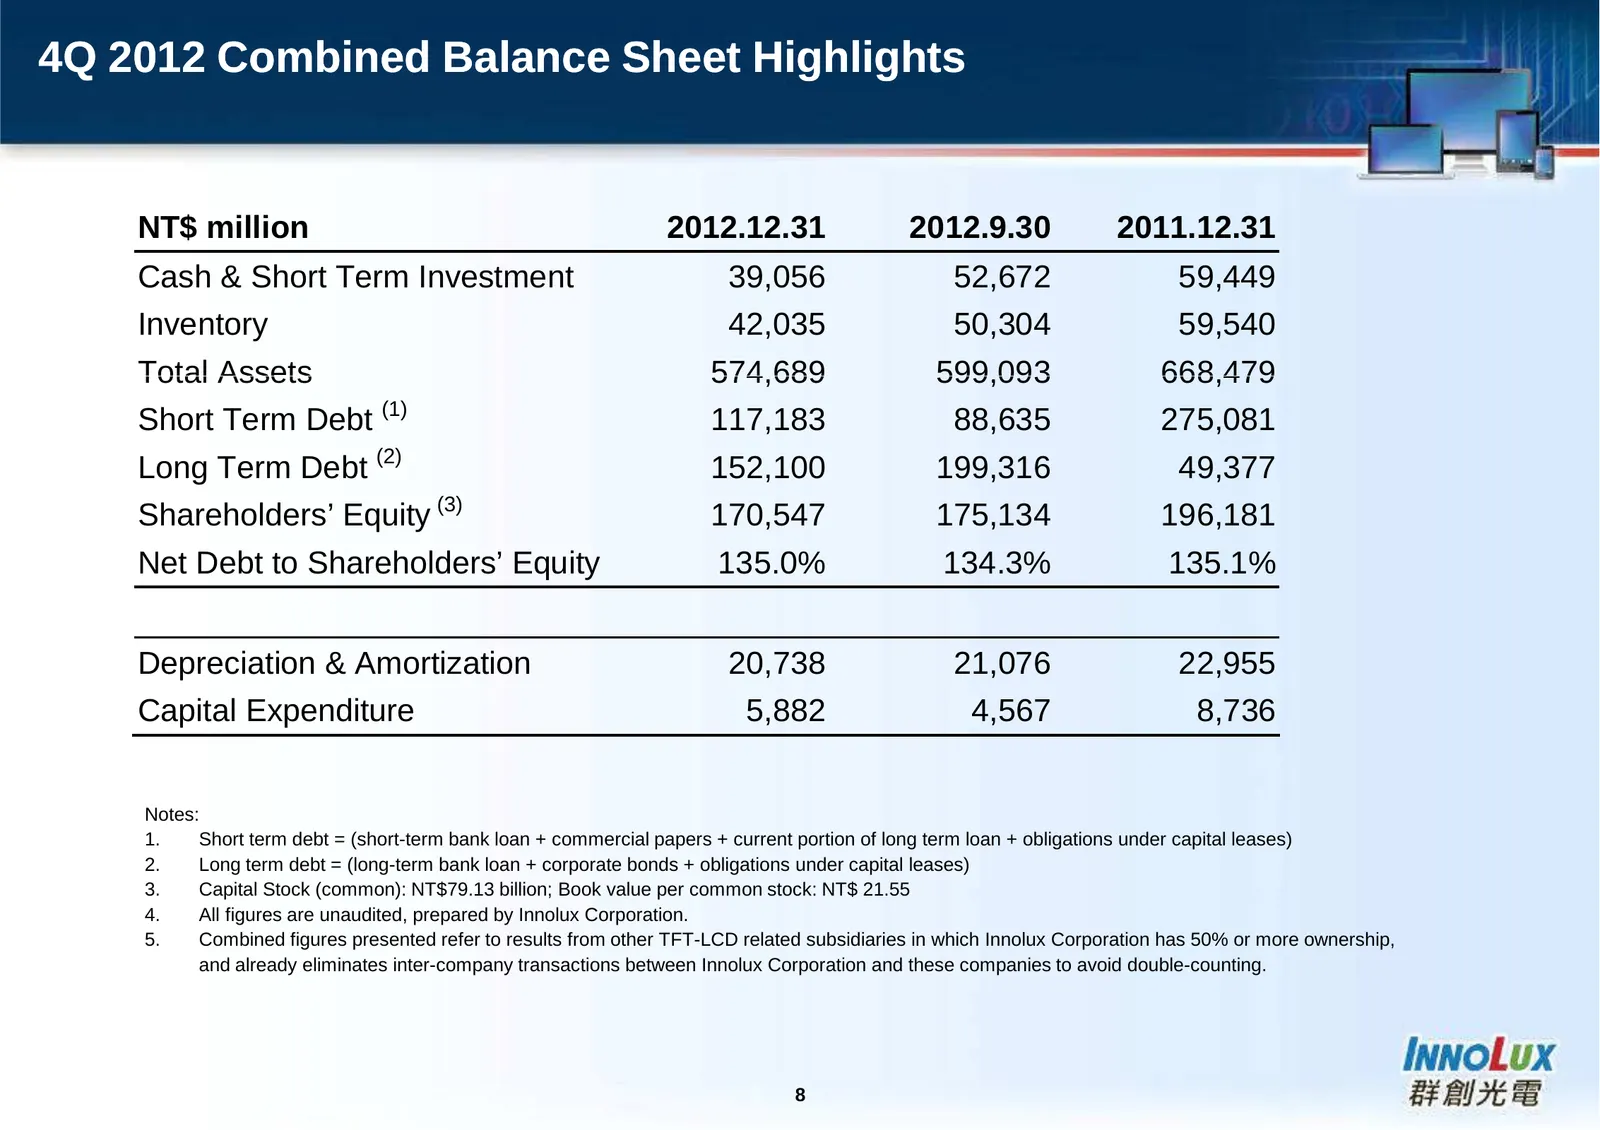
4Q 2012 Combined Balance Sheet Highlights NT$ million 2012.12.31 2012.9.30 2011.12.31 Cash & Short Term Investment 39,056 52,672 59,449 Inventory 42,035 50,304 59,540 Total Assets 574,689 599,093 668,479 Short Term Debt (1) 117,183 88,635 275,081 Long Term Debt (2) 152,100 199,316 49,377 Shareholder
Slide 9: Total Debt and Debt Ratios
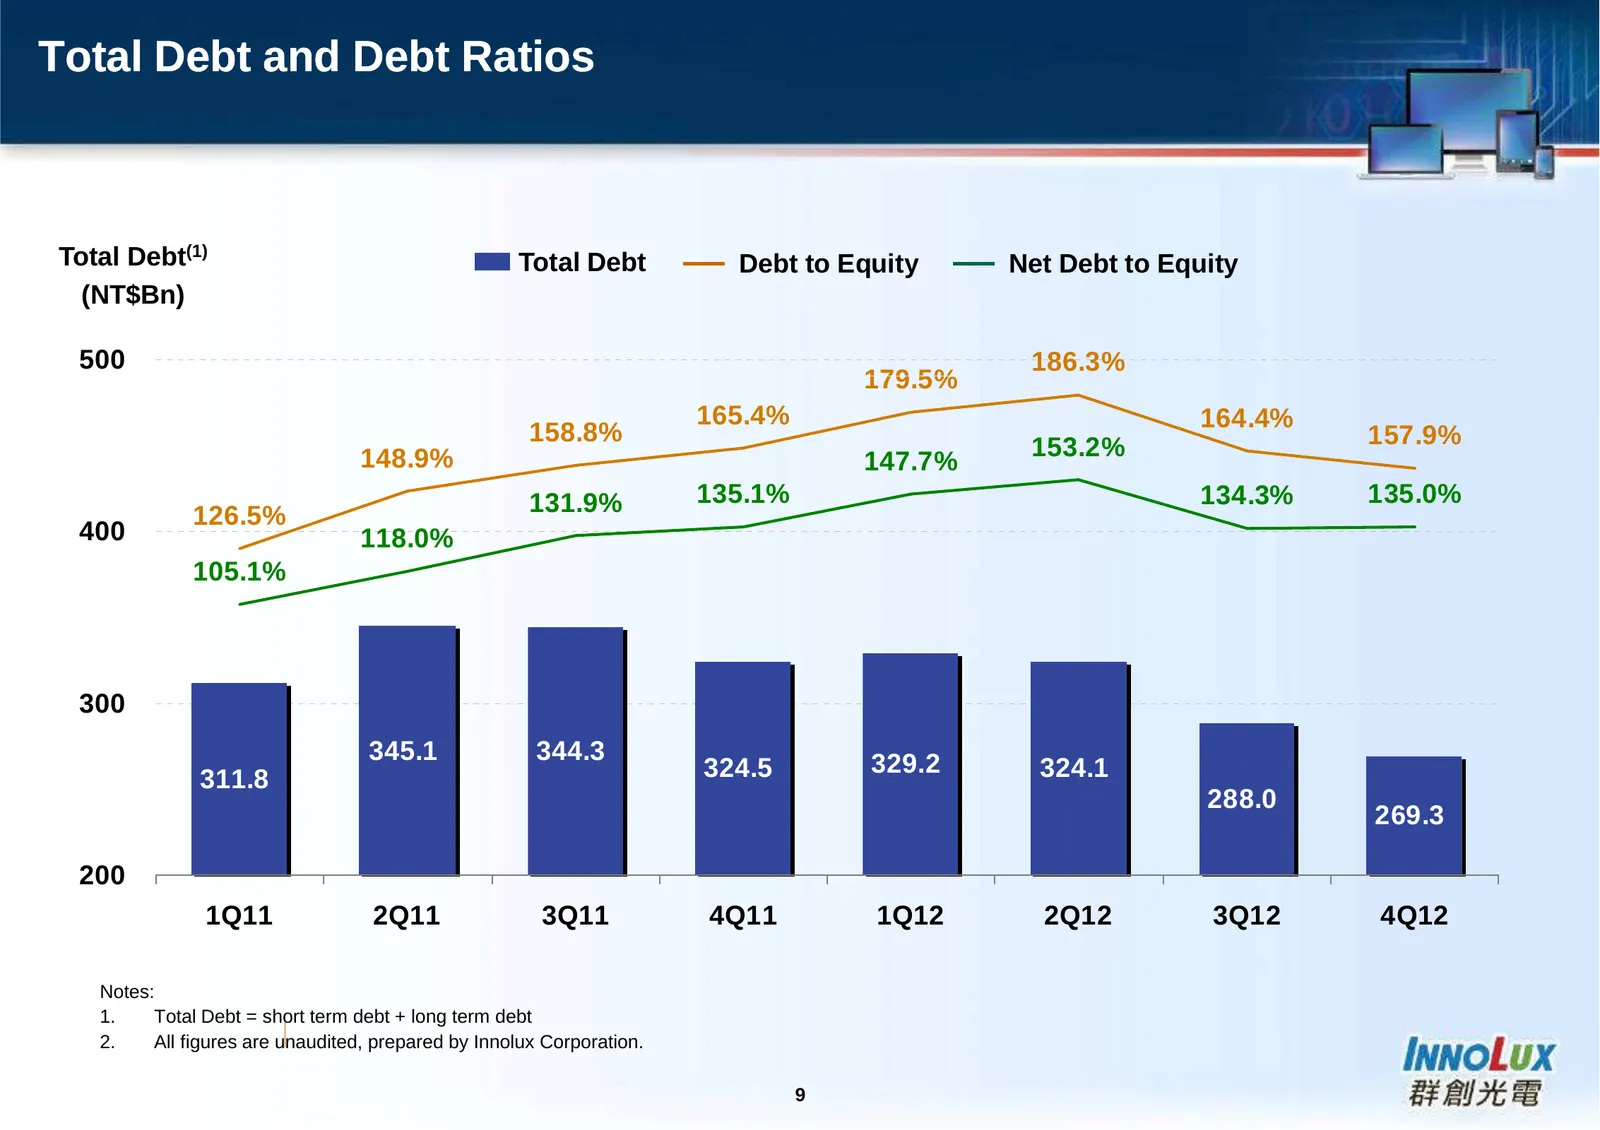
Total Debt and Debt Ratios Total Debt(1) Total Debt Debt to Equity Net Debt to Equity (NT$Bn) 500 186.3% 179.5% 165.4% 164.4% 158.8% 157.9% 148.9% 153.2% 147.7% 131.9% 135.1% 134.3% 135.0% 126.5% 400 118.0% 105.1% 300 345.1 344.3 329.2 311.8 324.5 324.1 288.0 269.3 200 1Q11 2Q11 3Q11 4Q11 1Q12 2Q12
Slide 10: Inventory Trend
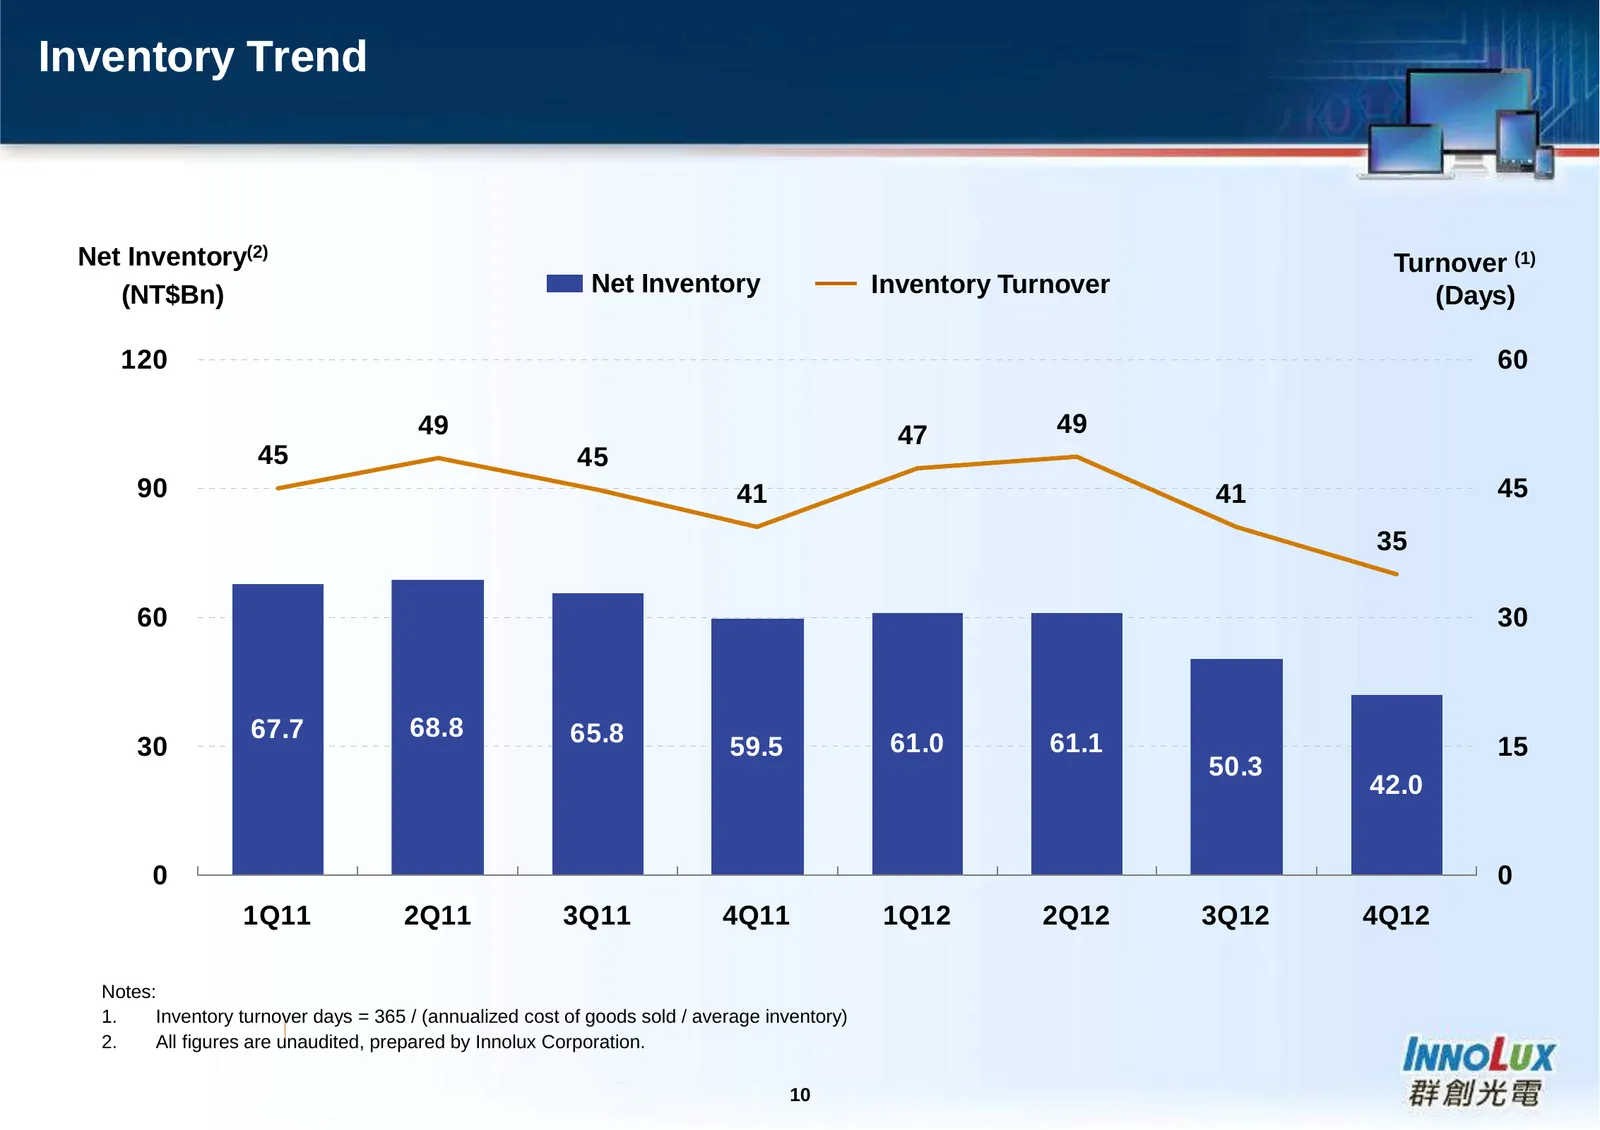
Inventory Trend Net Inventory(2) Turnover (1) (NT$Bn) Net Inventory Inventory Turnover (Days) 120 60 49 47 49 45 45 90 41 41 45 35 60 30 67.7 68.8 65.8 30 59.5 61.0 61.1 15 50.3 42.0 0 0 1Q11 2Q11 3Q11 4Q11 1Q12 2Q12 3Q12 4Q12 Notes: 1. Inventory turnover days = 365 / (annualized cost of goods sold
Slide 11: Large-size Unit Shipments and ASP Trends
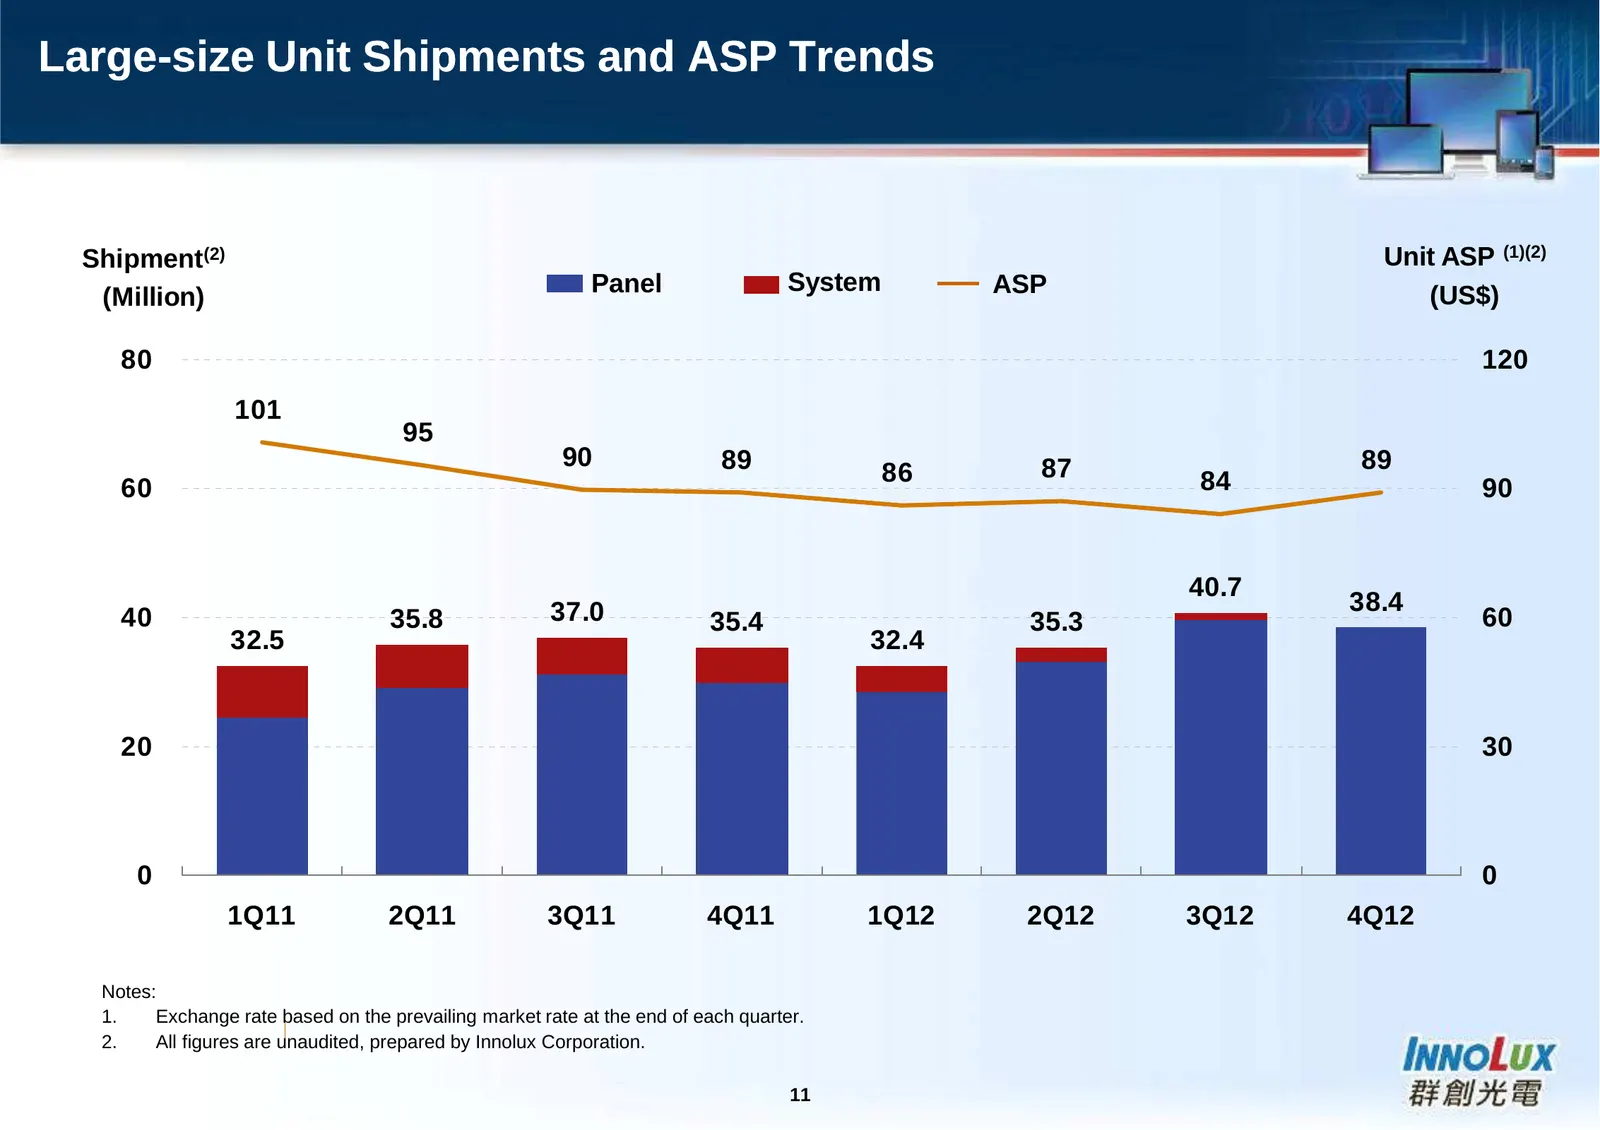
Large-size Unit Shipments and ASP Trends Shipment(2) Unit ASP (1)(2) Panel System ASP (Million) (US$) 80 120 101 95 90 89 87 89 86 84 60 90 40.7 37.0 38.4 40 35.8 35.4 35.3 60 32.5 32.4 20 30 0 0 1Q11 2Q11 3Q11 4Q11 1Q12 2Q12 3Q12 4Q12 Notes: 1. Exchange rate based on the prevailing market rate at t
Slide 12: Small & Medium-Size Unit Shipments and Sales Trends
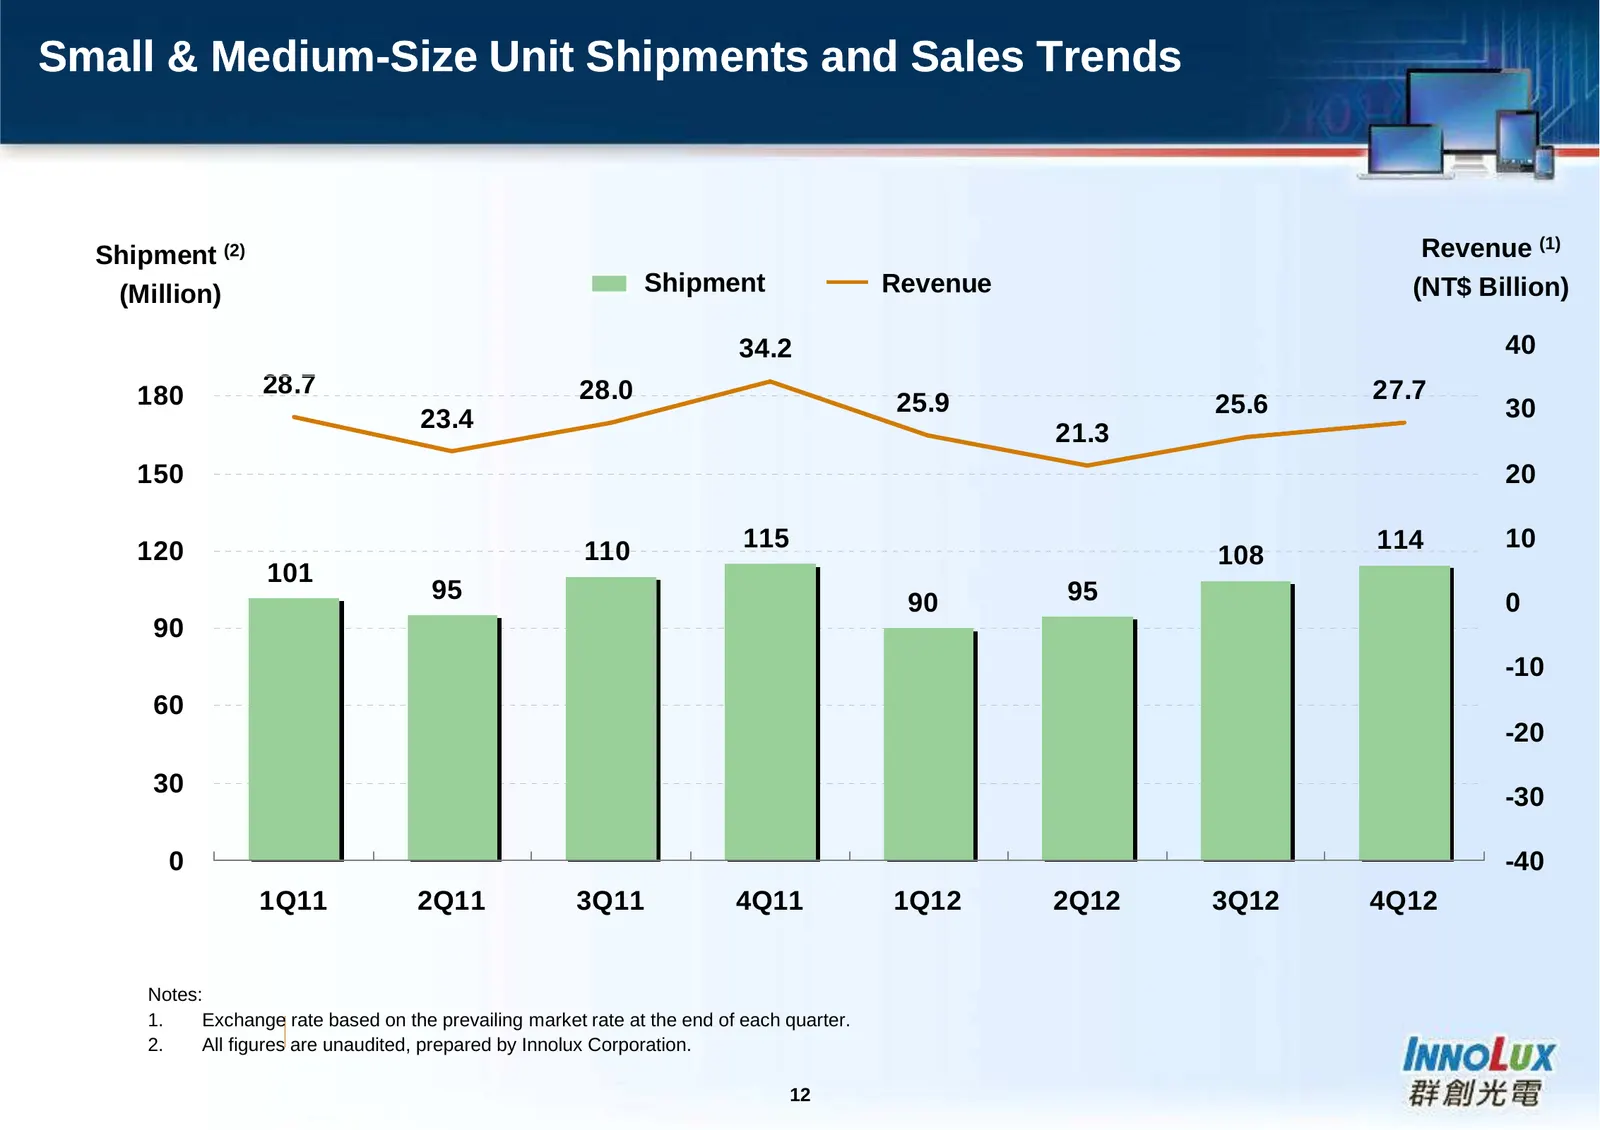
Small & Medium-Size Unit Shipments and Sales Trends Shipment (2) Revenue (1) (Million) Shipment Revenue (NT$ Billion) 34.2 40 180 28.7 28.0 27.7 25.9 25.6 30 23.4 21.3 150 20 120 110 115 114 10 108 101 95 90 95 0 90 -10 60 -20 30 -30 0 -40 1Q11 2Q11 3Q11 4Q11 1Q12 2Q12 3Q12 4Q12 Notes: 1. Exchange r
Slide 13: Touch Module and Sensor Shipment by Application
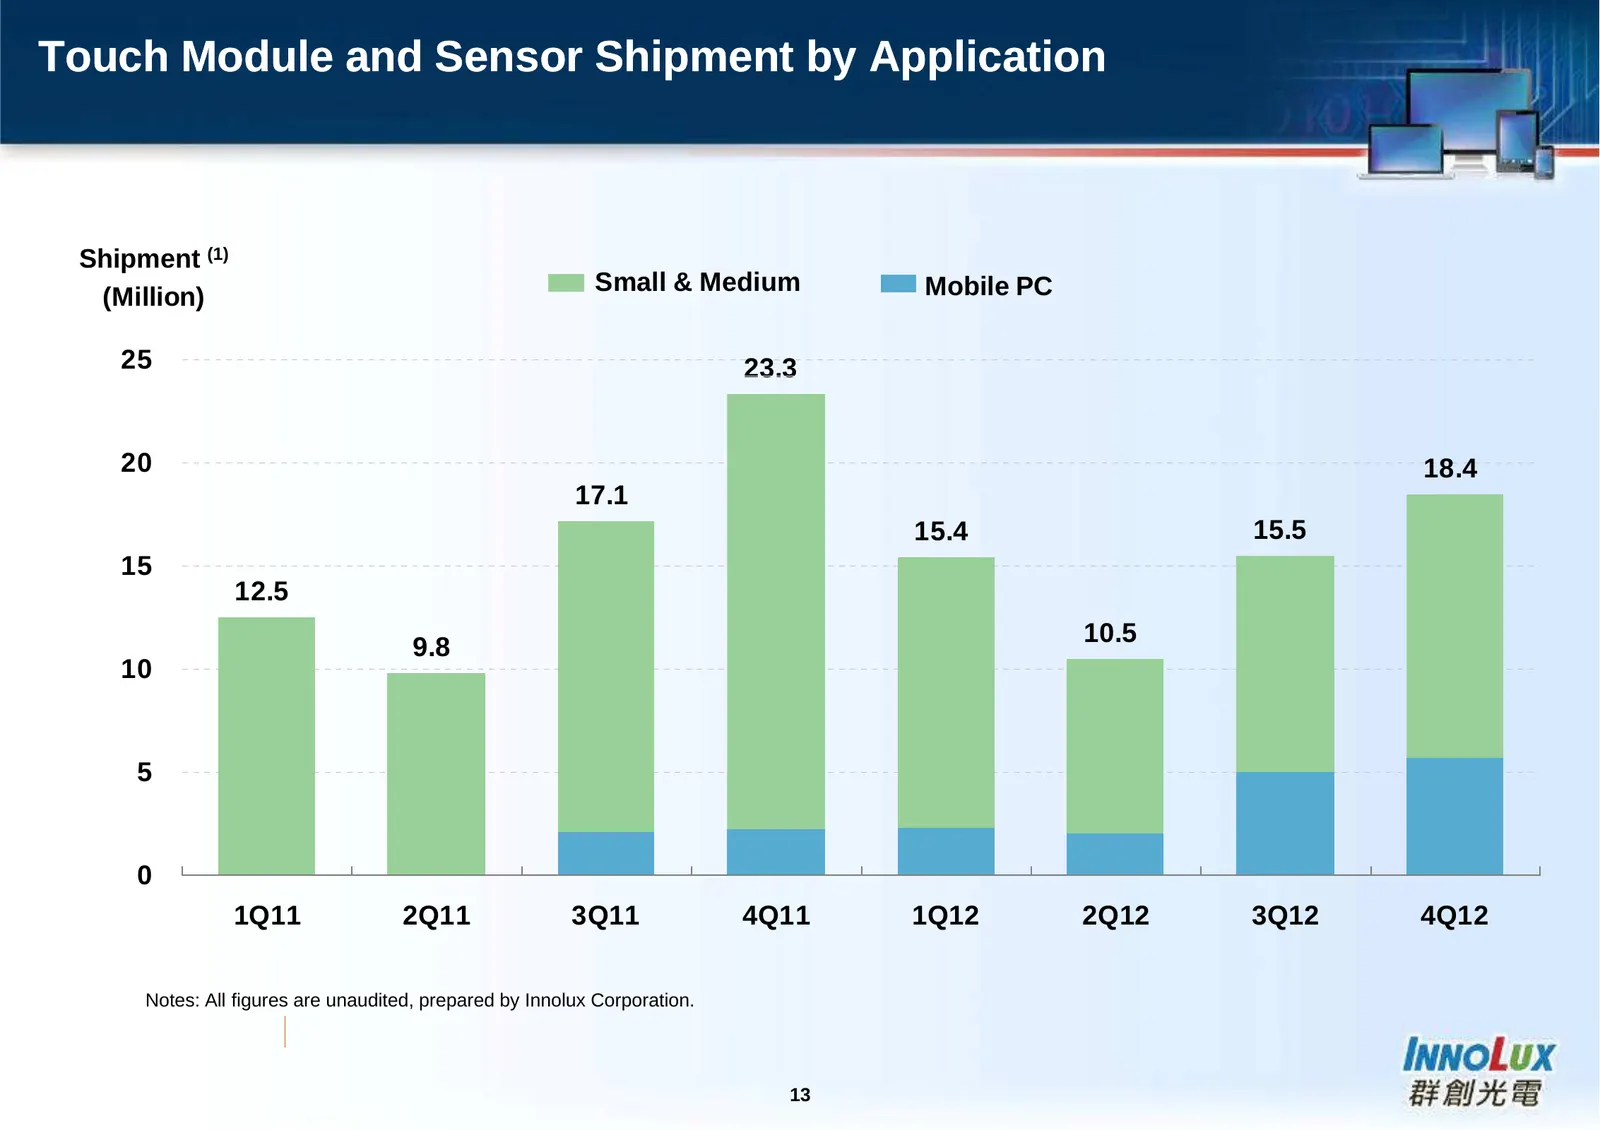
Touch Module and Sensor Shipment by Application Shipment (1) Small & Medium Mobile PC (Million) 25 23.3 20 18.4 17.1 15.4 15.5 15 12.5 10.5 9.8 10 5 0 1Q11 2Q11 3Q11 4Q11 1Q12 2Q12 3Q12 4Q12 Notes: All figures are unaudited, prepared by Innolux Corporation. 13
Slide 14: Sales Breakdown by Size
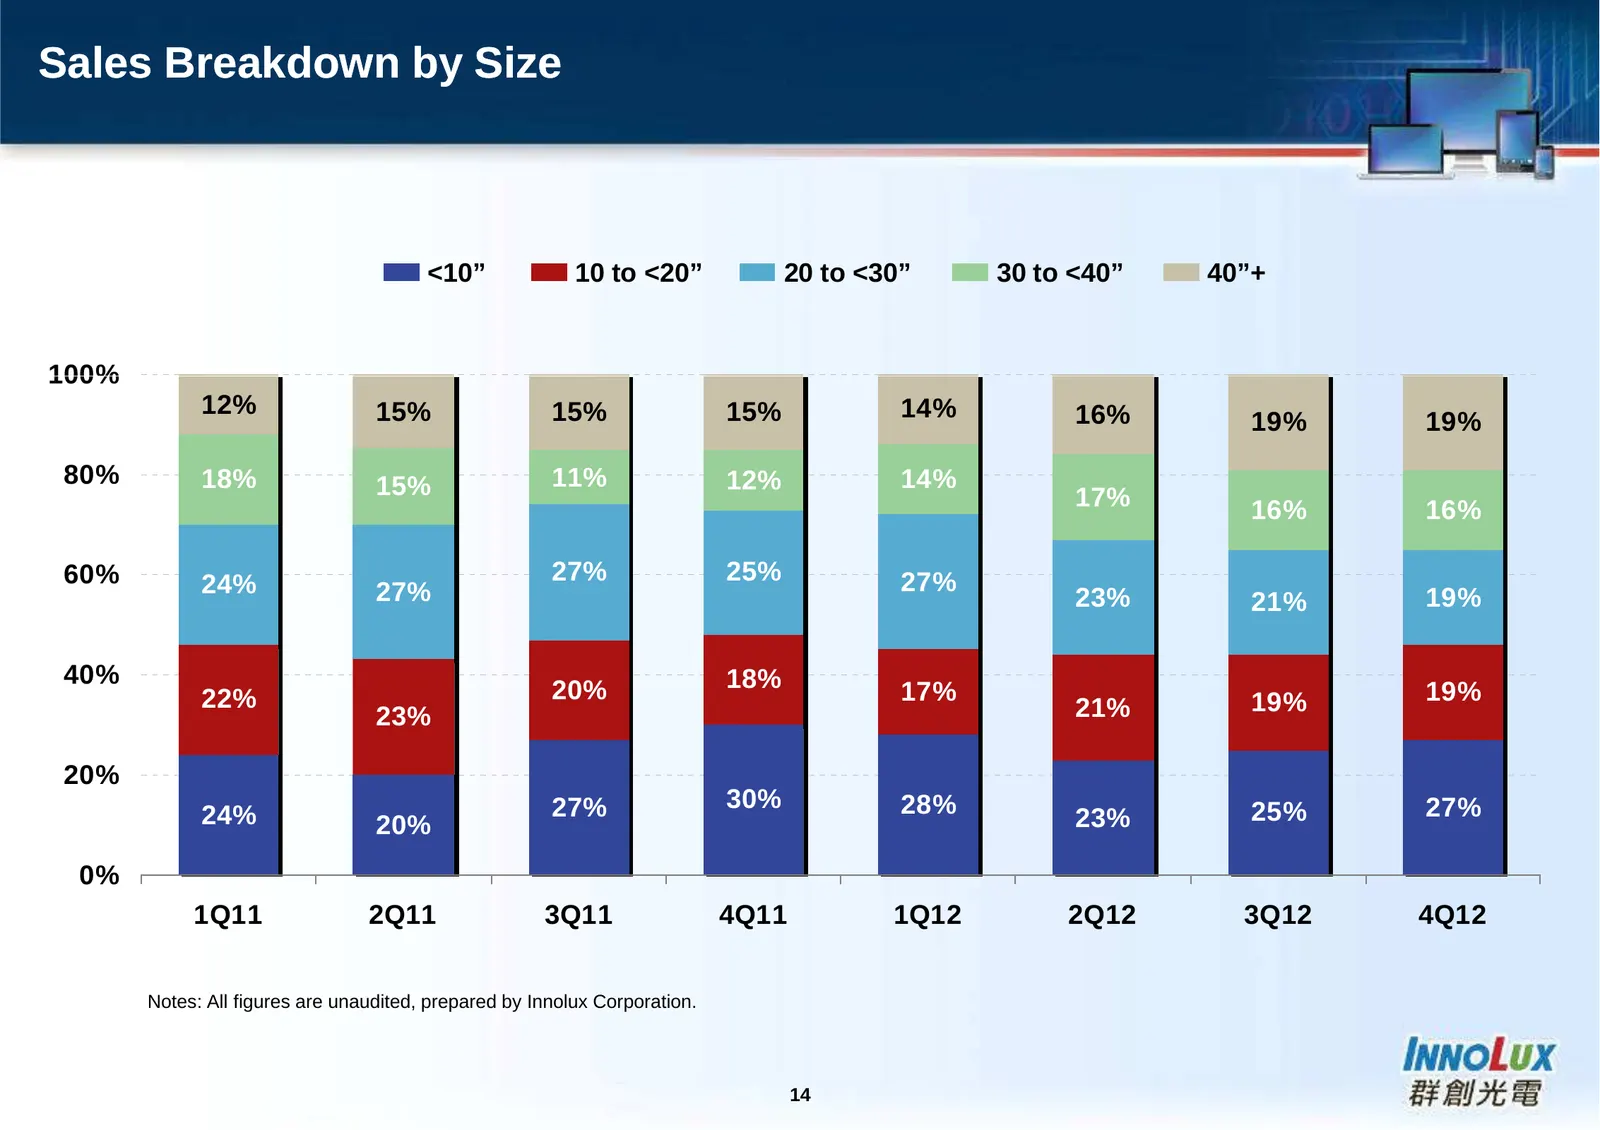
Sales Breakdown by Size <10” 10 to <20” 20 to <30” 30 to <40” 40”+ 100% 12% 15% 15% 15% 14% 16% 19% 19% 80% 18% 15% 11% 12% 14% 17% 16% 16% 60% 24% 27% 25% 27% 27% 23% 21% 19% 40% 18% 22% 20% 17% 19% 19% 23% 21% 20% 27% 30% 28% 25% 27% 24% 20% 23% 0% 1Q11 2Q11 3Q11 4Q11 1Q12 2Q12 3Q12 4Q12 Notes: Al
Slide 15: Sales Breakdown by Application
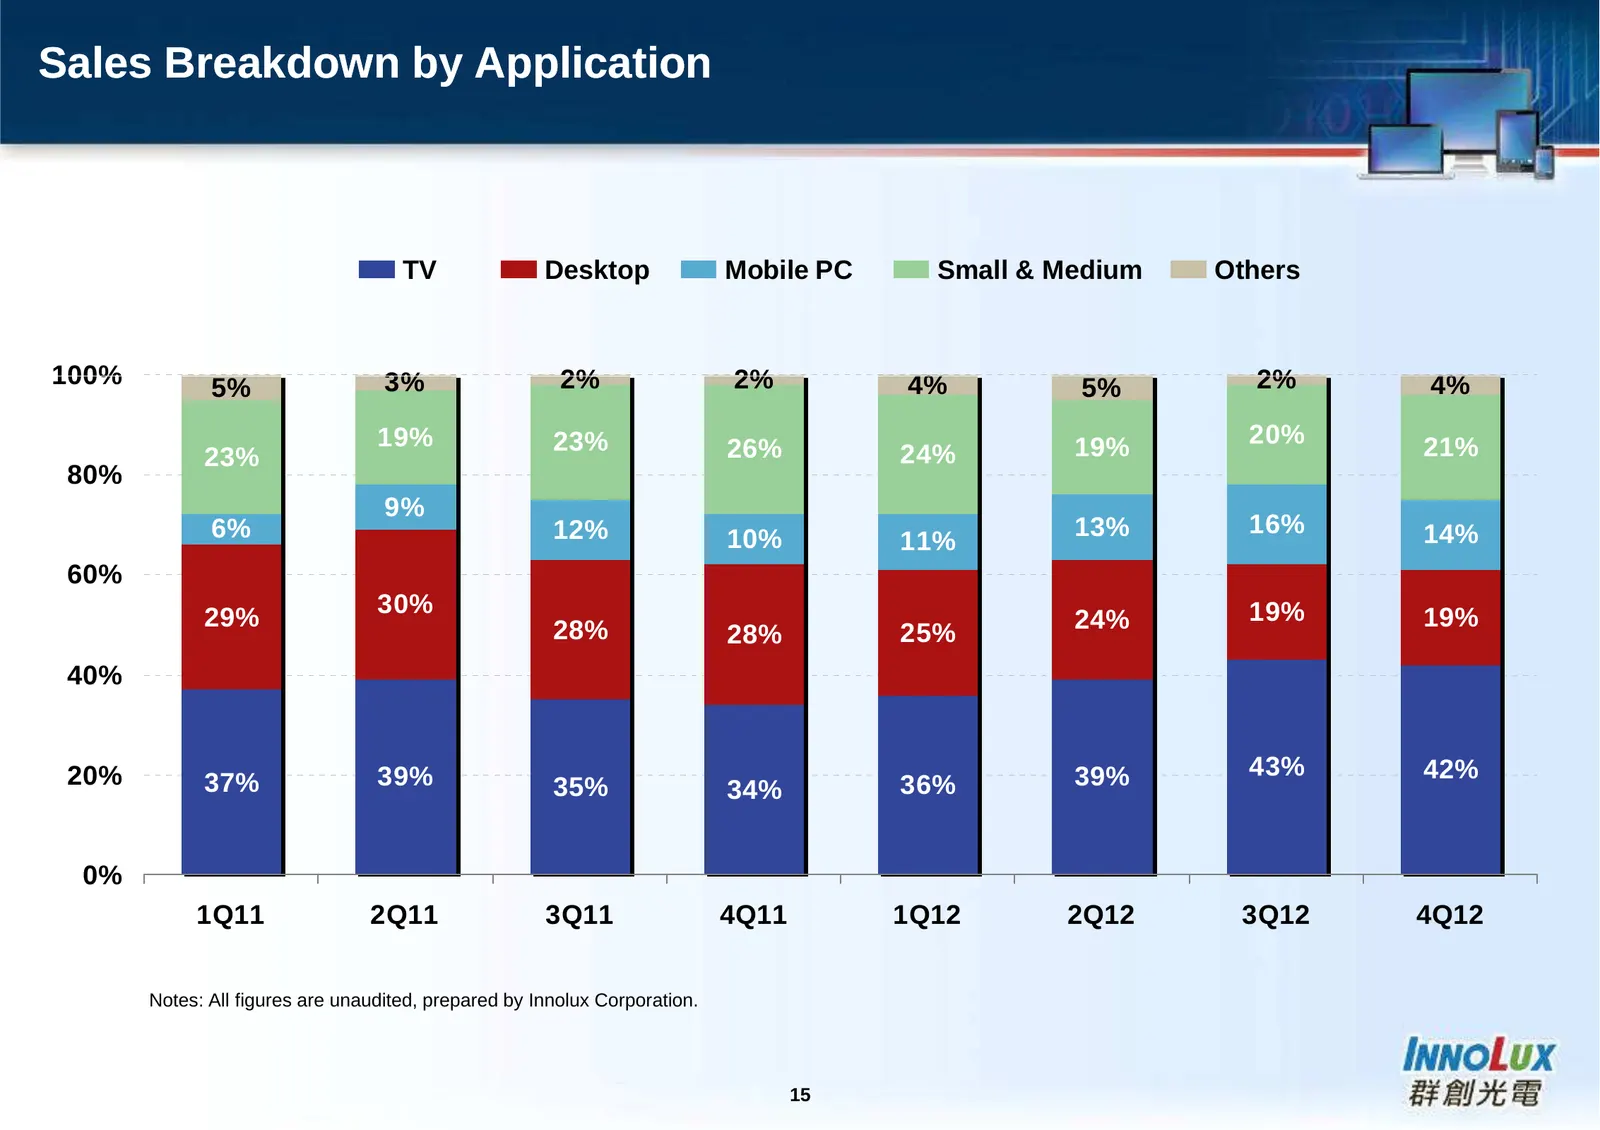
Sales Breakdown by Application TV Desktop Mobile PC Small & Medium Others 100% 5% 3% 2% 2% 4% 5% 2% 4% 19% 23% 19% 20% 21% 23% 26% 24% 80% 9% 6% 12% 13% 16% 14% 10% 11% 60% 29% 30% 19% 19% 28% 25% 24% 28% 40% 20% 39% 39% 43% 42% 37% 35% 34% 36% 0% 1Q11 2Q11 3Q11 4Q11 1Q12 2Q12 3Q12 4Q12 Notes: All f
Slide 16: 2012 Sales by Application
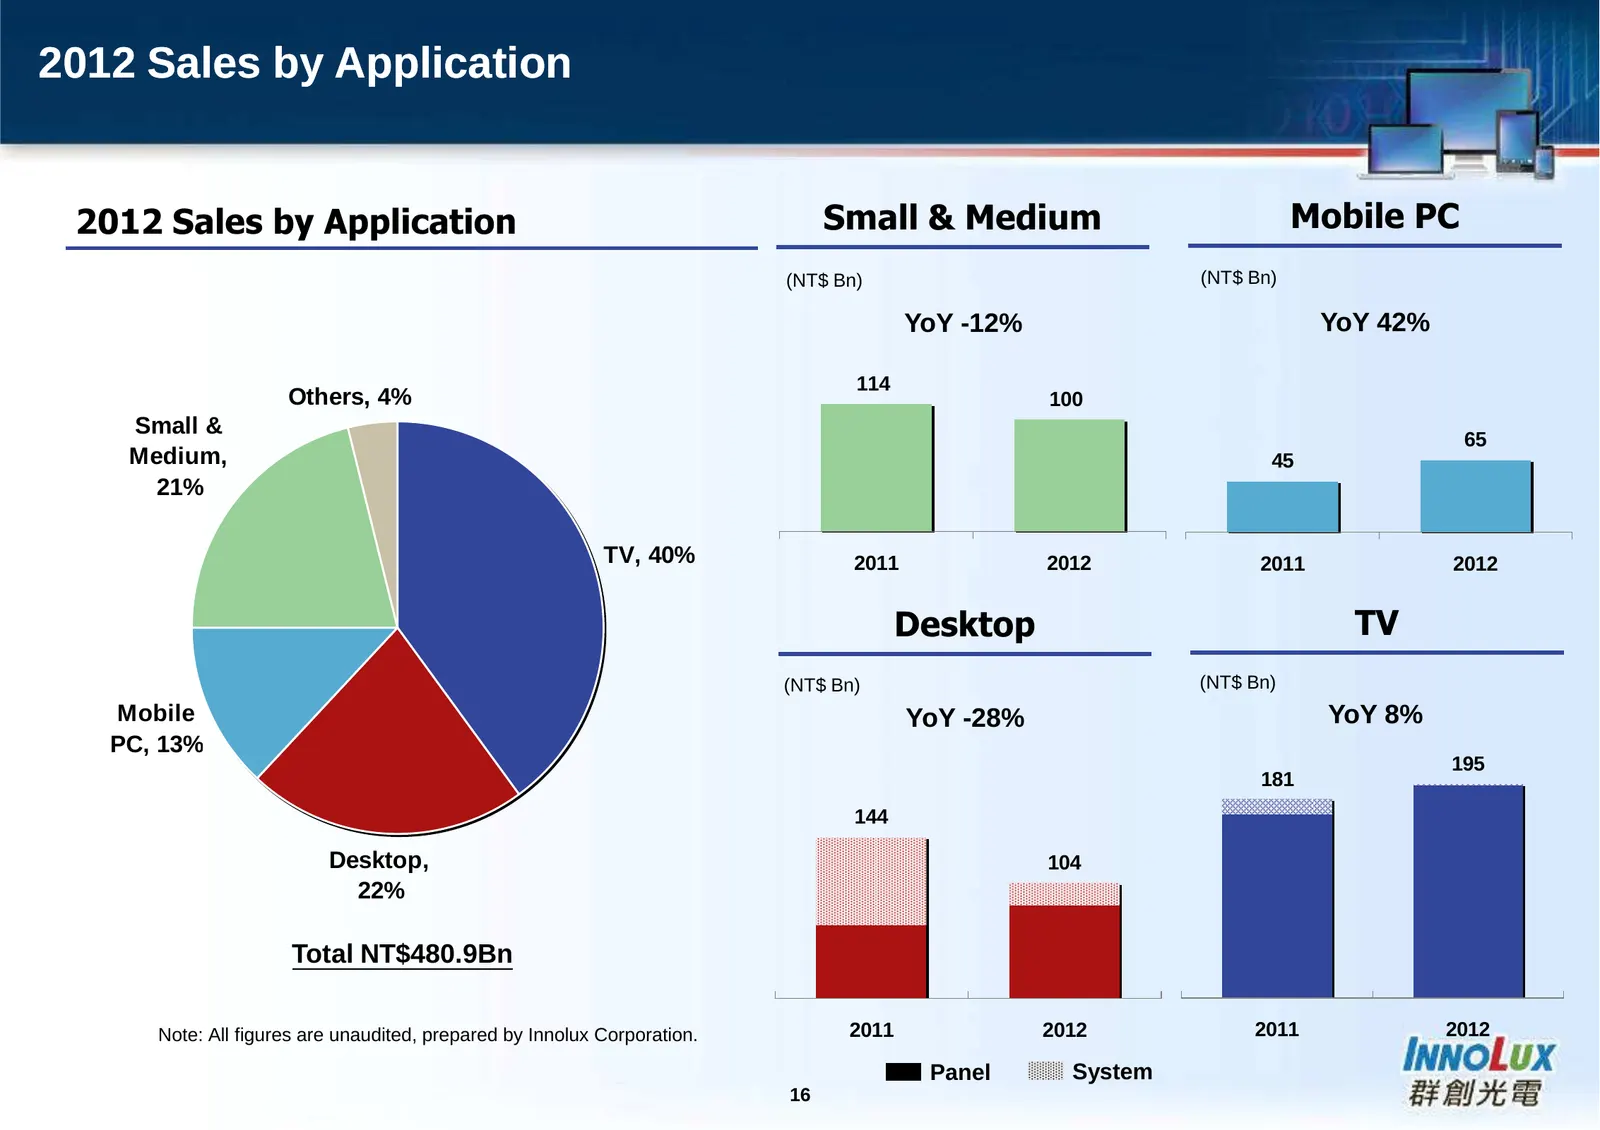
2012 Sales by Application 2012 Sales by Application Small & Medium Mobile PC (NT$ Bn) (NT$ Bn) YoY -12% YoY 42% 114 Others, 4% 100 Small & 65 Medium, 45 21% TV, 40% 2011 2012 2011 2012 Desktop TV (NT$ Bn) (NT$ Bn) Mobile YoY -28% YoY 8% PC, 13% 195 181 144 Desktop, 104 22% Total NT$480.9Bn Note: All
Slide 17: TFT LCD Fabs Update
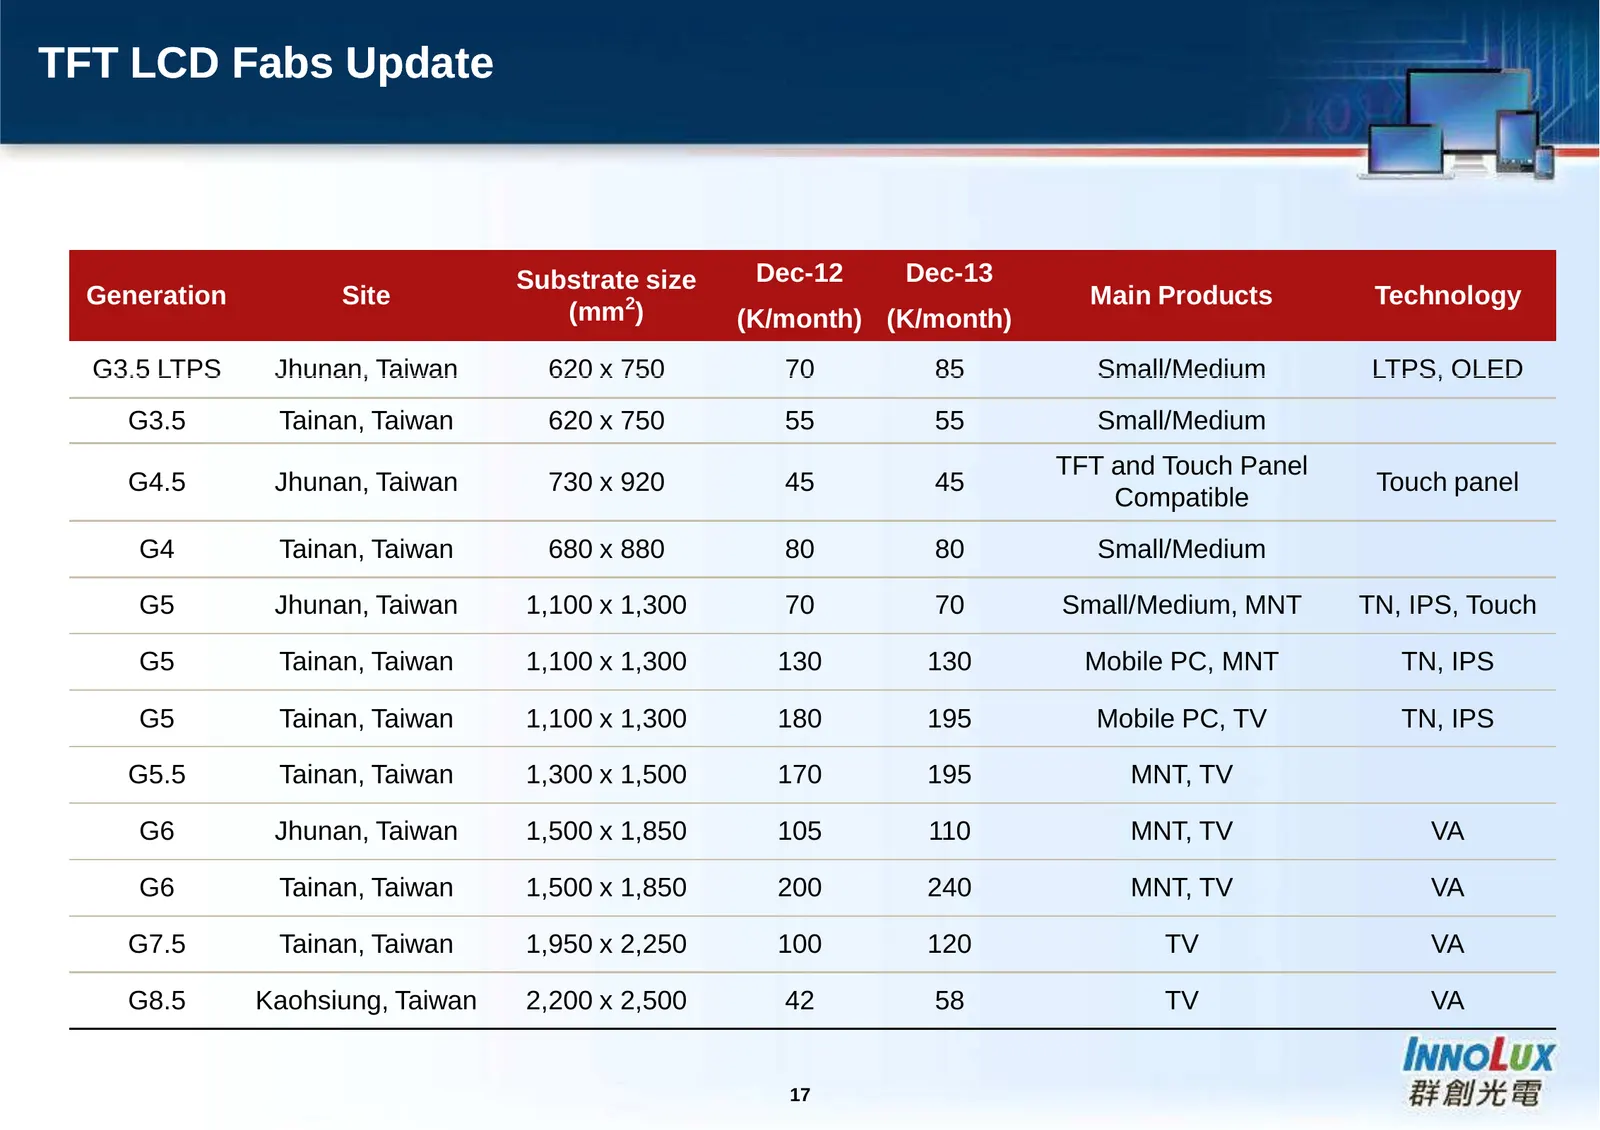
TFT LCD Fabs Update Substrate size Dec-12 Dec-13 Generation Site Main Products Technology (mm2) (K/month) (K/month) G3.5 LTPS Jhunan, Taiwan 620 x 750 70 85 Small/Medium LTPS, OLED G3.5 Tainan, Taiwan 620 x 750 55 55 Small/Medium TFT and Touch Panel G4.5 Jhunan, Taiwan 730 x 920 45 45 Touch panel Co
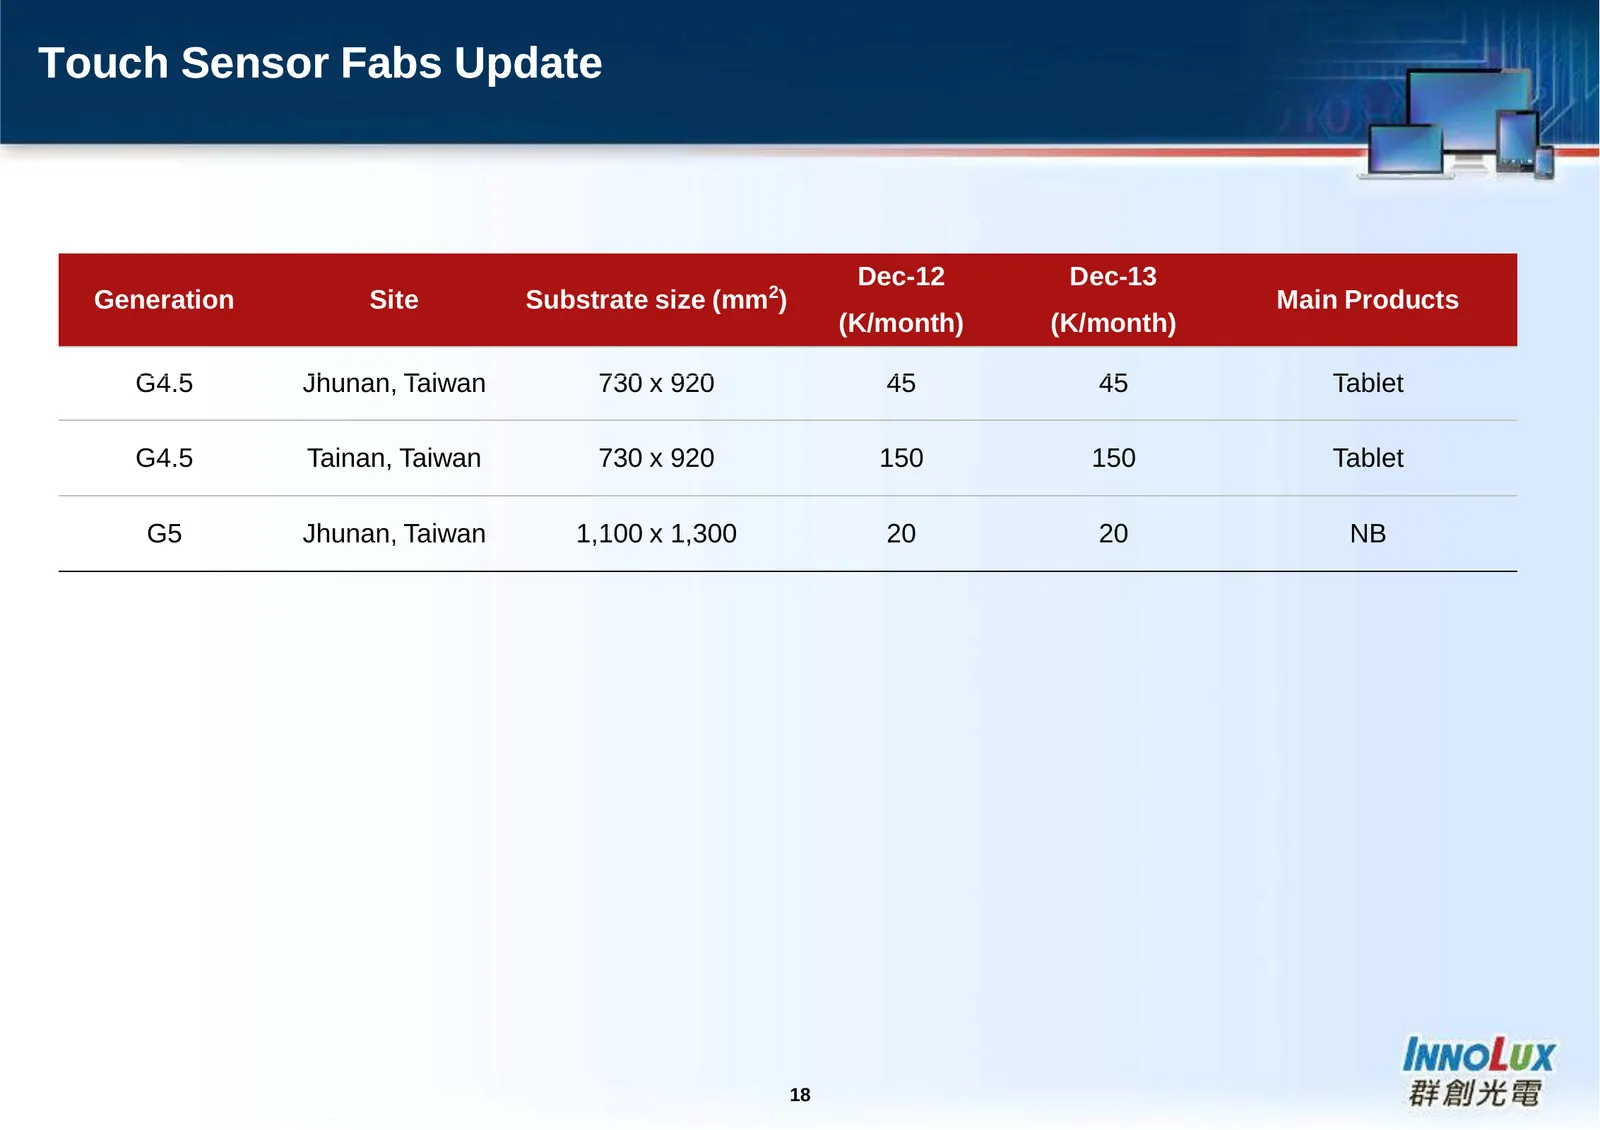
Slide 18: Touch Sensor Fabs Update
Touch Sensor Fabs Update Dec-12 Dec-13 Generation Site Substrate size (mm2) Main Products (K/month) (K/month) G4.5 Jhunan, Taiwan 730 x 920 45 45 Tablet G4.5 Tainan, Taiwan 730 x 920 150 150 Tablet G5 Jhunan, Taiwan 1,100 x 1,300 20 20 NB 18

Slide 19: Q&A
Q&A
Source: Internet Archive copy of innolux.com
More decks from Innolux Corp.
 Investor Presentation (August 2026)18 slides · Aug 18, 2026
 Q4 2024 Earnings Presentation26 slides · Mar 14, 2025
 Q2 2023 Earnings Presentation12 slides · Aug 2, 2023
 FY2021 Earnings Presentation9 slides · Mar 2, 2022
 H2 2021 Earnings Presentation9 slides · Aug 6, 2021
 Q2 2013 Earnings Presentation19 slides · August 2013