PVA TePla AG · XETR:TPE
PVA TePla — H1 2023 Earnings Presentation
14 slides from PVA TePla's earnings presentation, Nov 30, 2023

Slide 1: Company Presentation H1 2023
COMPANY PRESENTATION H1 2023
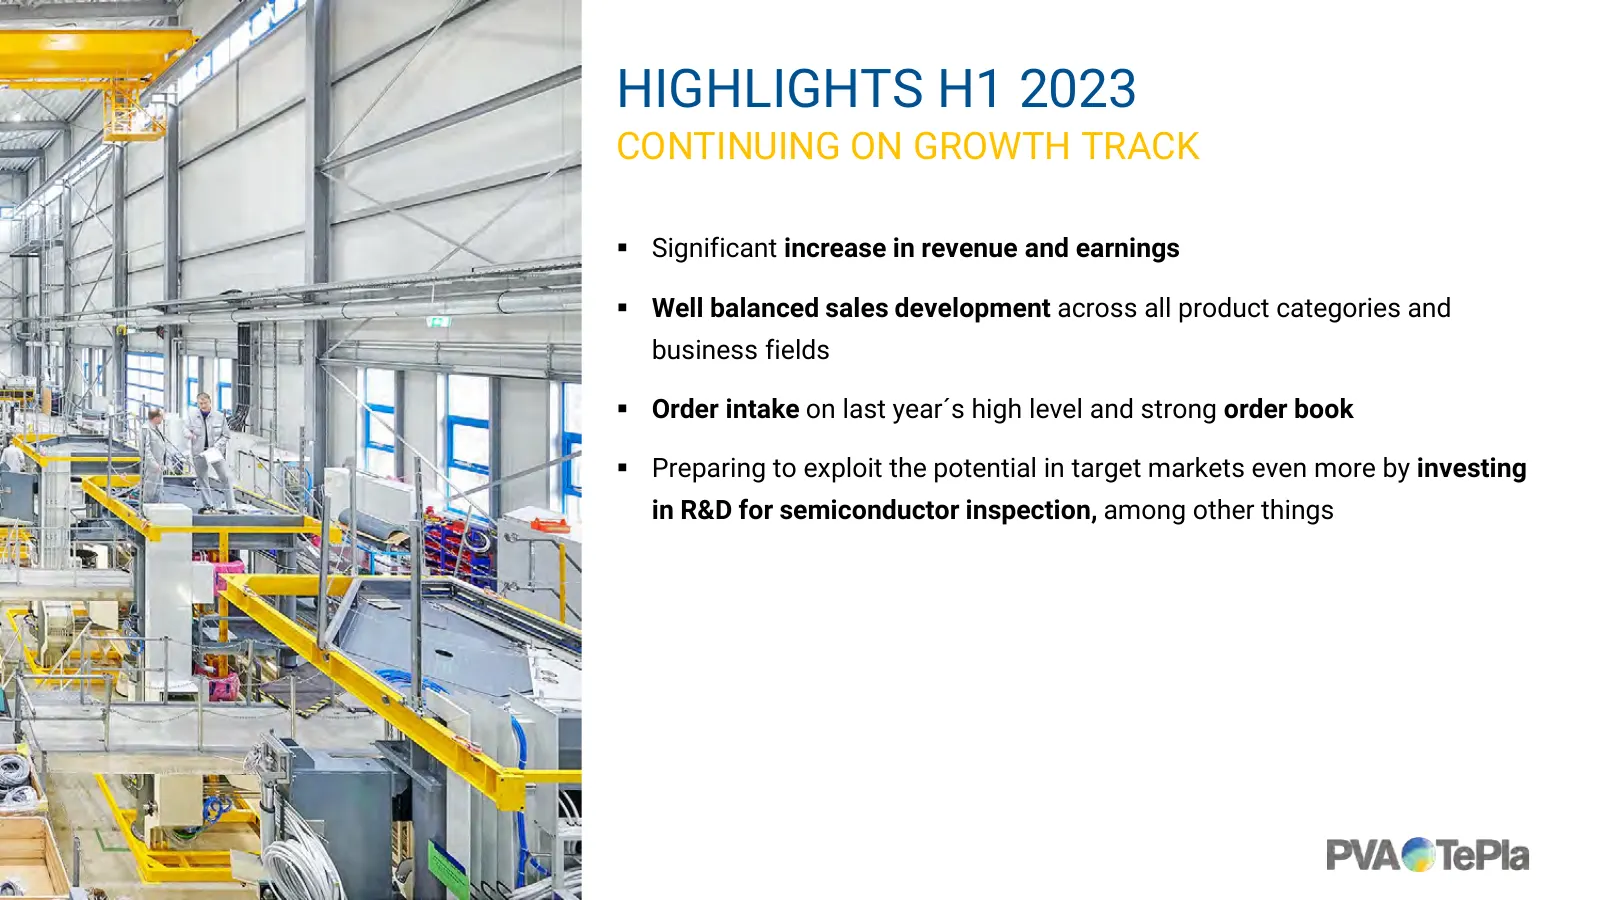
Slide 2: Highlights H1 2023
HIGHLIGHTS H1 2023 CONTINUING ON GROWTH TRACK Significant increase in revenue and earnings Well balanced sales development across all product categories and business fields Order intake on last year´s high level and strong order book Preparing to exploit the potential in target markets even
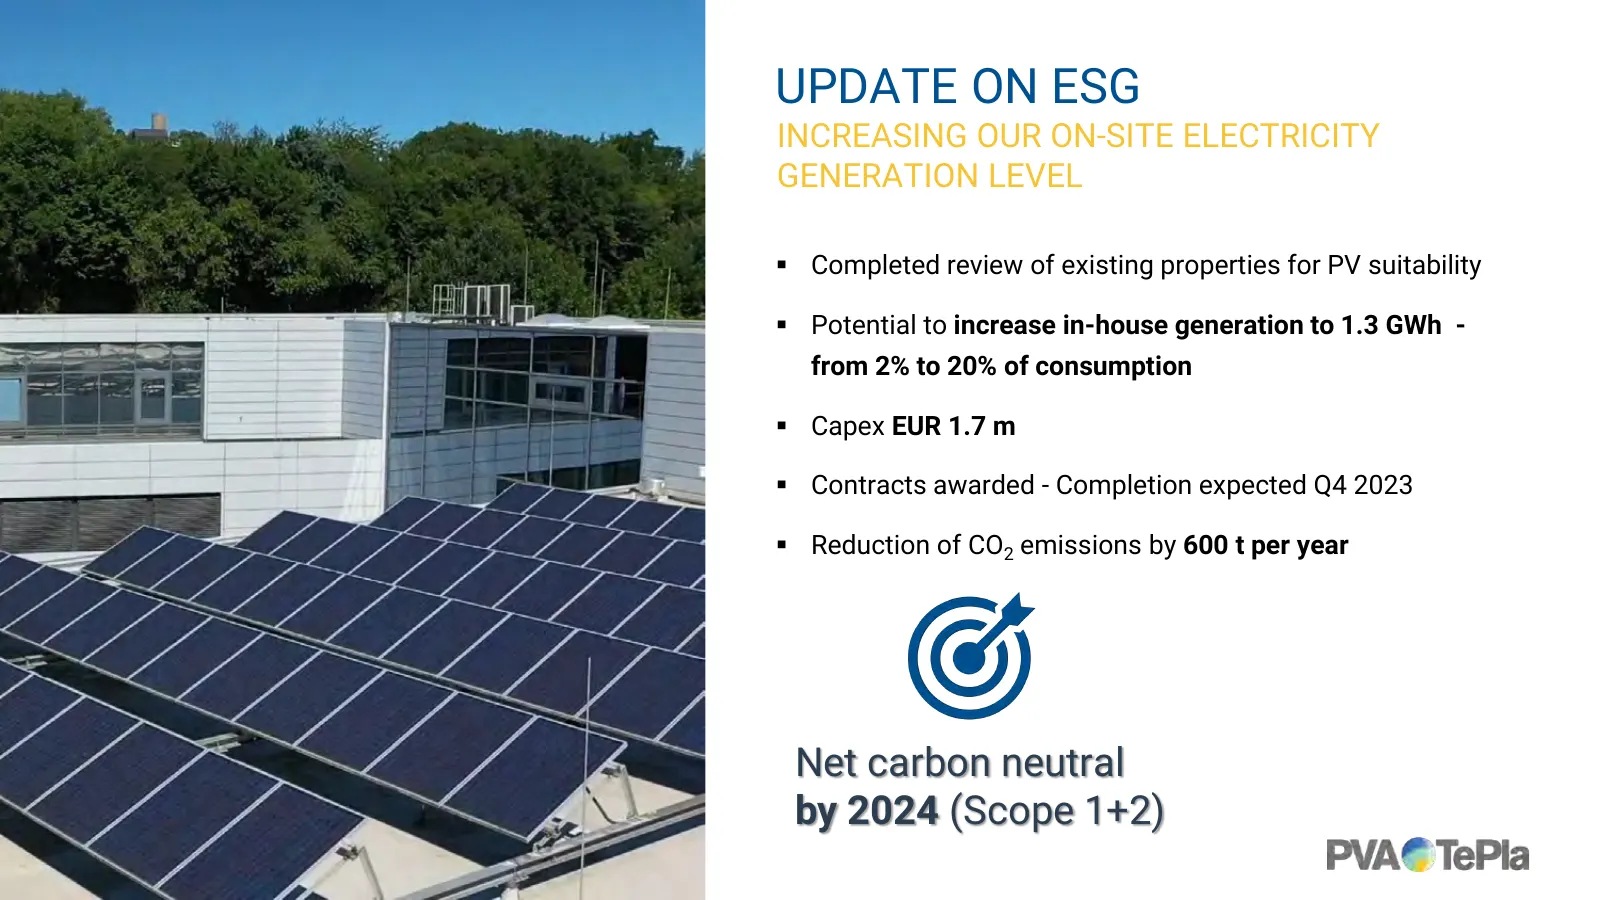
Slide 3: Update on ESG
UPDATE ON ESG INCREASING OUR ON-SITE ELECTRICITY GENERATION LEVEL Completed review of existing properties for PV suitability Potential to increase in-house generation to 1.3 GWh - from 2% to 20% of consumption Capex EUR 1.7 m Contracts awarded - Completion expected Q4 2023 Reduction of CO2
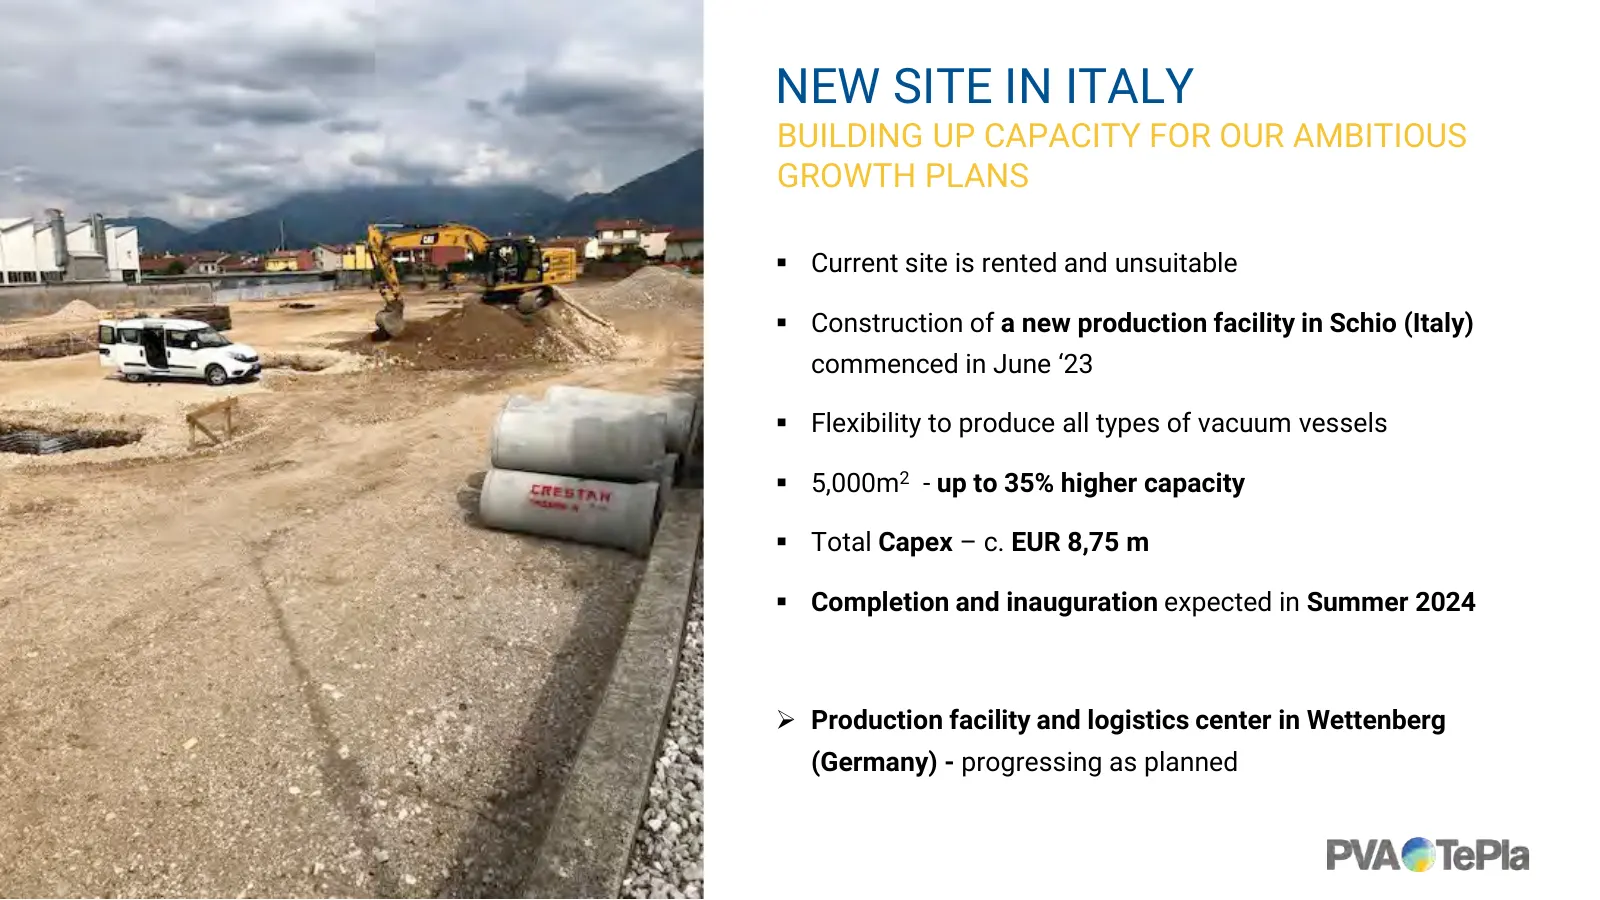
Slide 4: New Site in Italy
NEW SITE IN ITALY BUILDING UP CAPACITY FOR OUR AMBITIOUS GROWTH PLANS Current site is rented and unsuitable Construction of a new production facility in Schio (Italy) commenced in June ‘23 Flexibility to produce all types of vacuum vessels 5,000m2 - up to 35% higher capacity Total Capex –
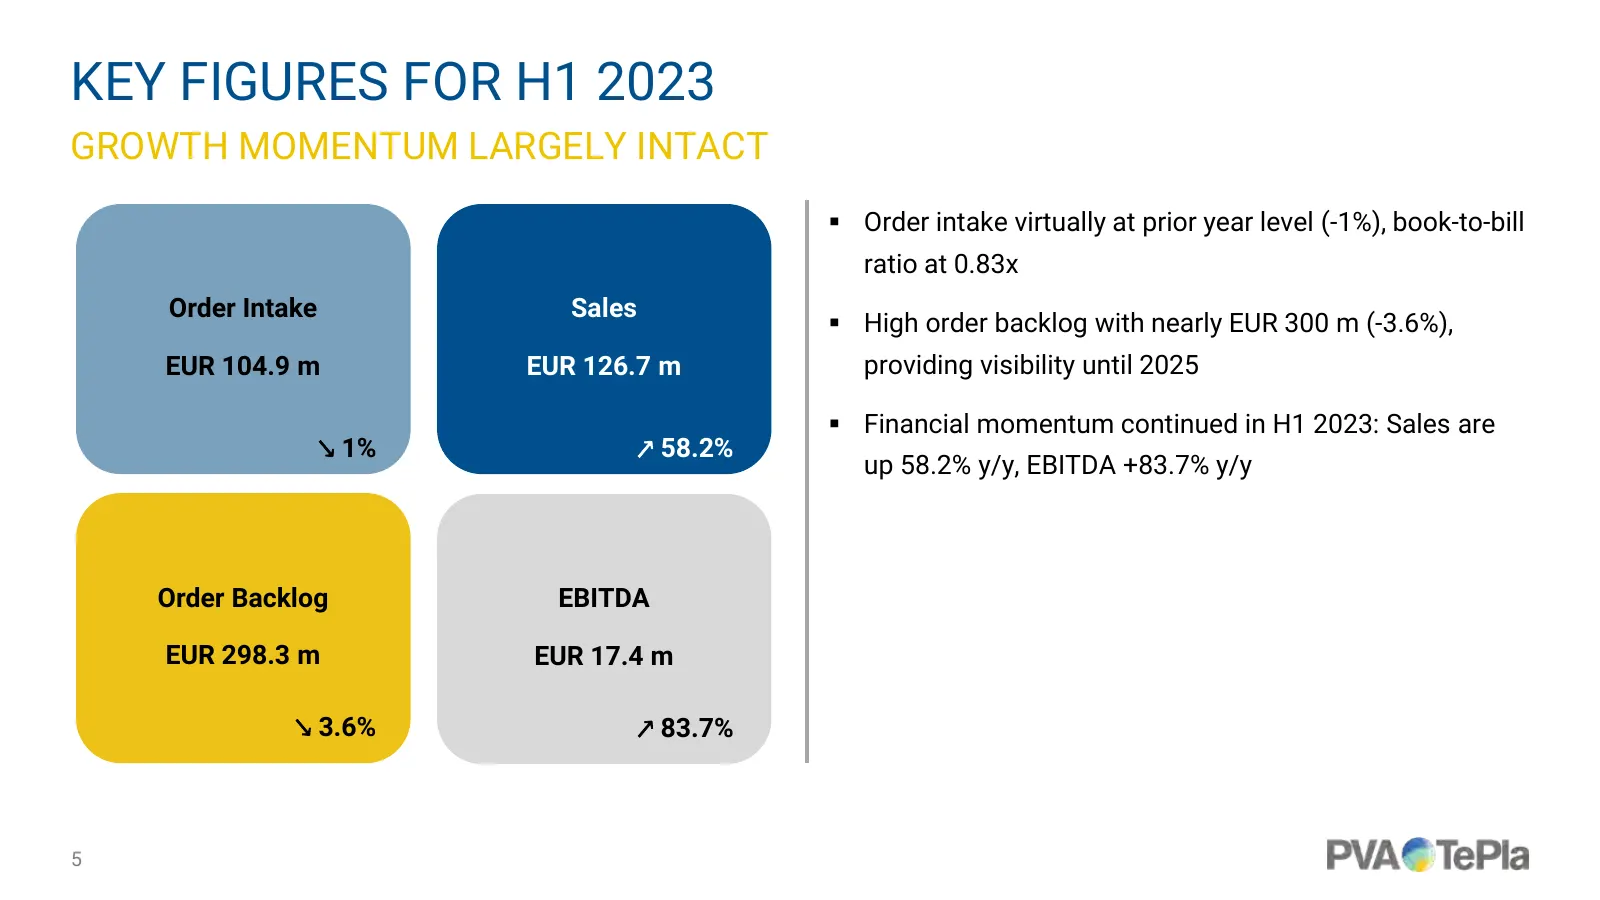
Slide 5: Key Figures for H1 2023
KEY FIGURES FOR H1 2023 GROWTH MOMENTUM LARGELY INTACT Order intake virtually at prior year level (-1%), book-to-bill ratio at 0.83x Order Intake Sales High order backlog with nearly EUR 300 m (-3.6%), EUR 104.9 m EUR 126.7 m providing visibility until 2025 Financial momentum continued in H1 2
Slide 6: Order Intake
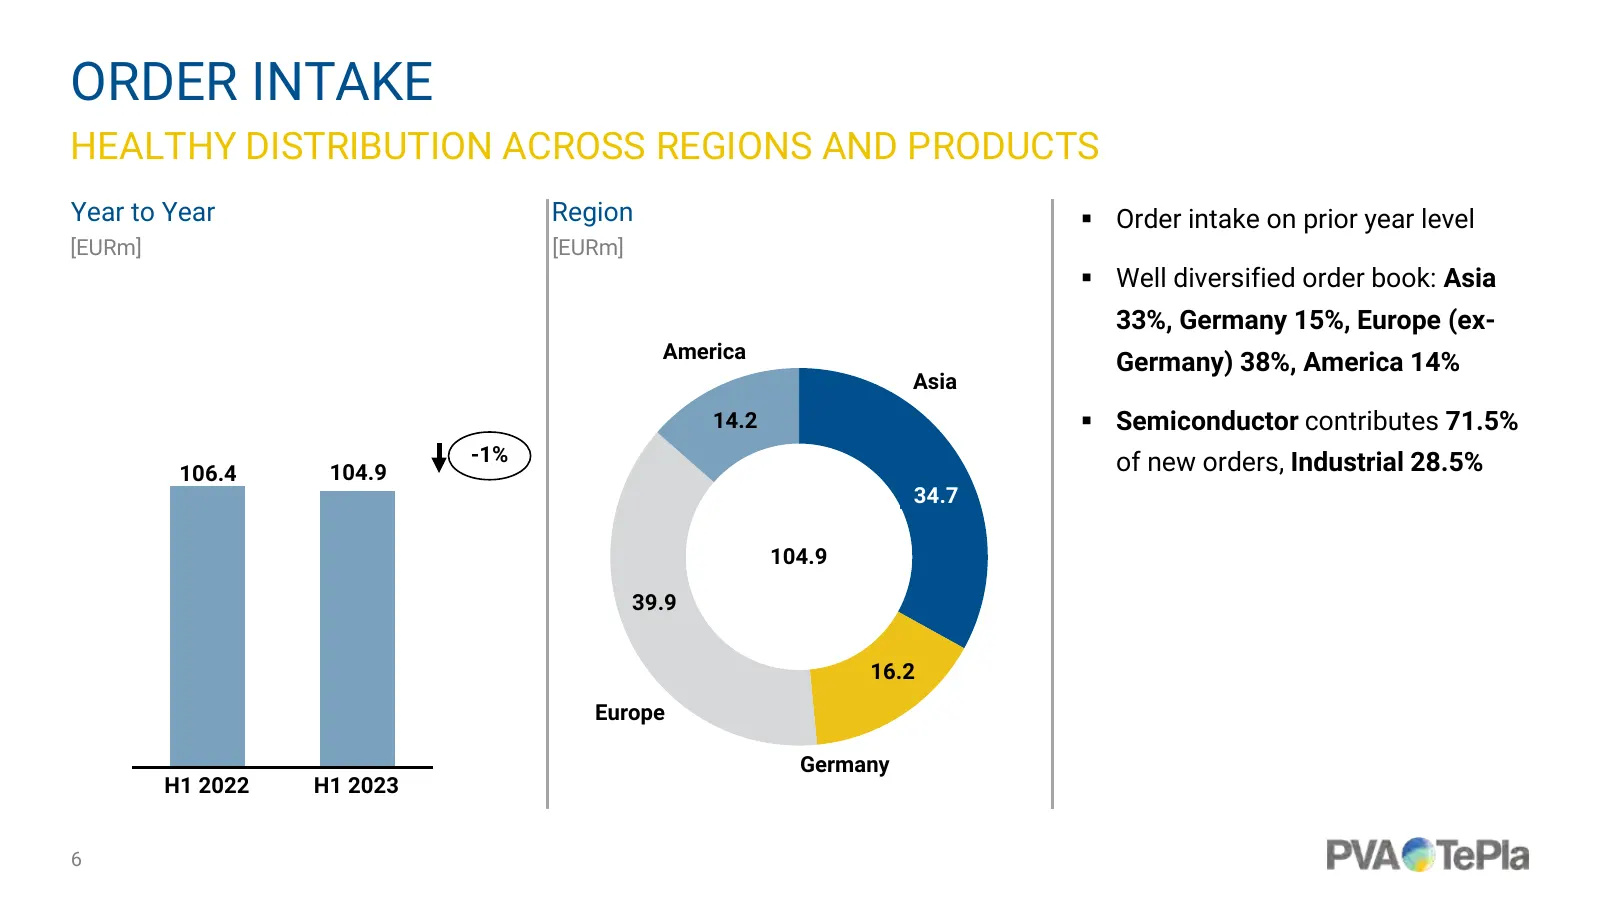
ORDER INTAKE HEALTHY DISTRIBUTION ACROSS REGIONS AND PRODUCTS Year to Year Region Order intake on prior year level [EURm] [EURm] Well diversified order book: Asia 33%, Germany 15%, Europe (ex- America Germany) 38%, America 14% Asia 14.2 Semiconductor contributes 71.5% -1% of new orders, Indust
Slide 7: Group Sales
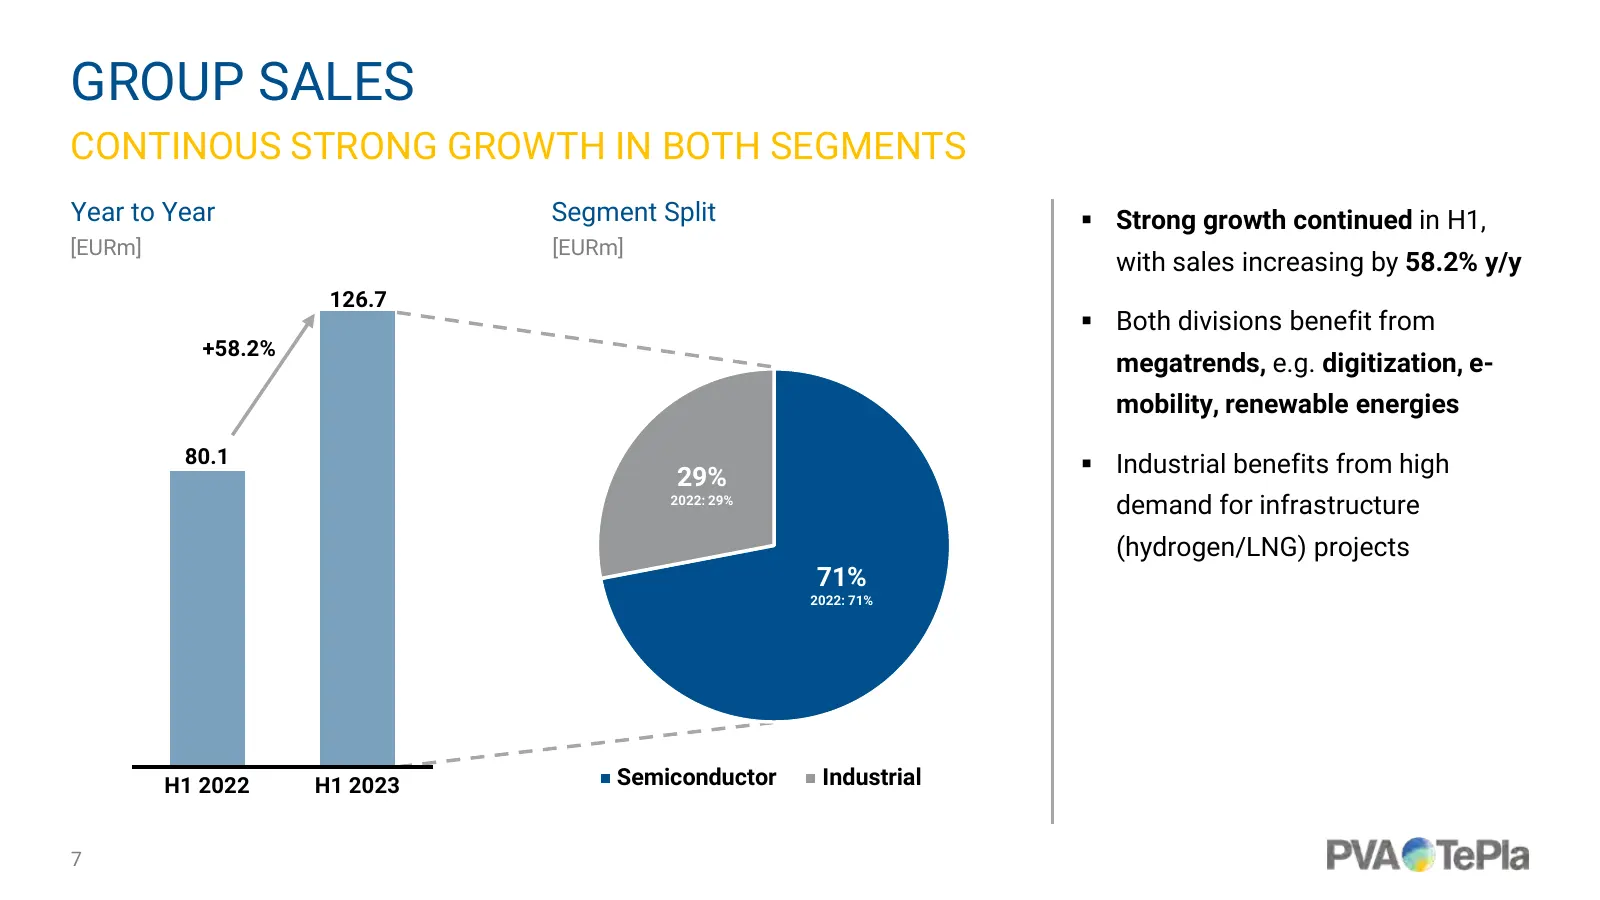
GROUP SALES CONTINOUS STRONG GROWTH IN BOTH SEGMENTS Year to Year Segment Split Strong growth continued in H1, [EURm] [EURm] with sales increasing by 58.2% y/y 126.7 Both divisions benefit from +58.2% megatrends, e.g. digitization, e- mobility, renewable energies 80.1 Industrial benefits from
Slide 8: Group Profit
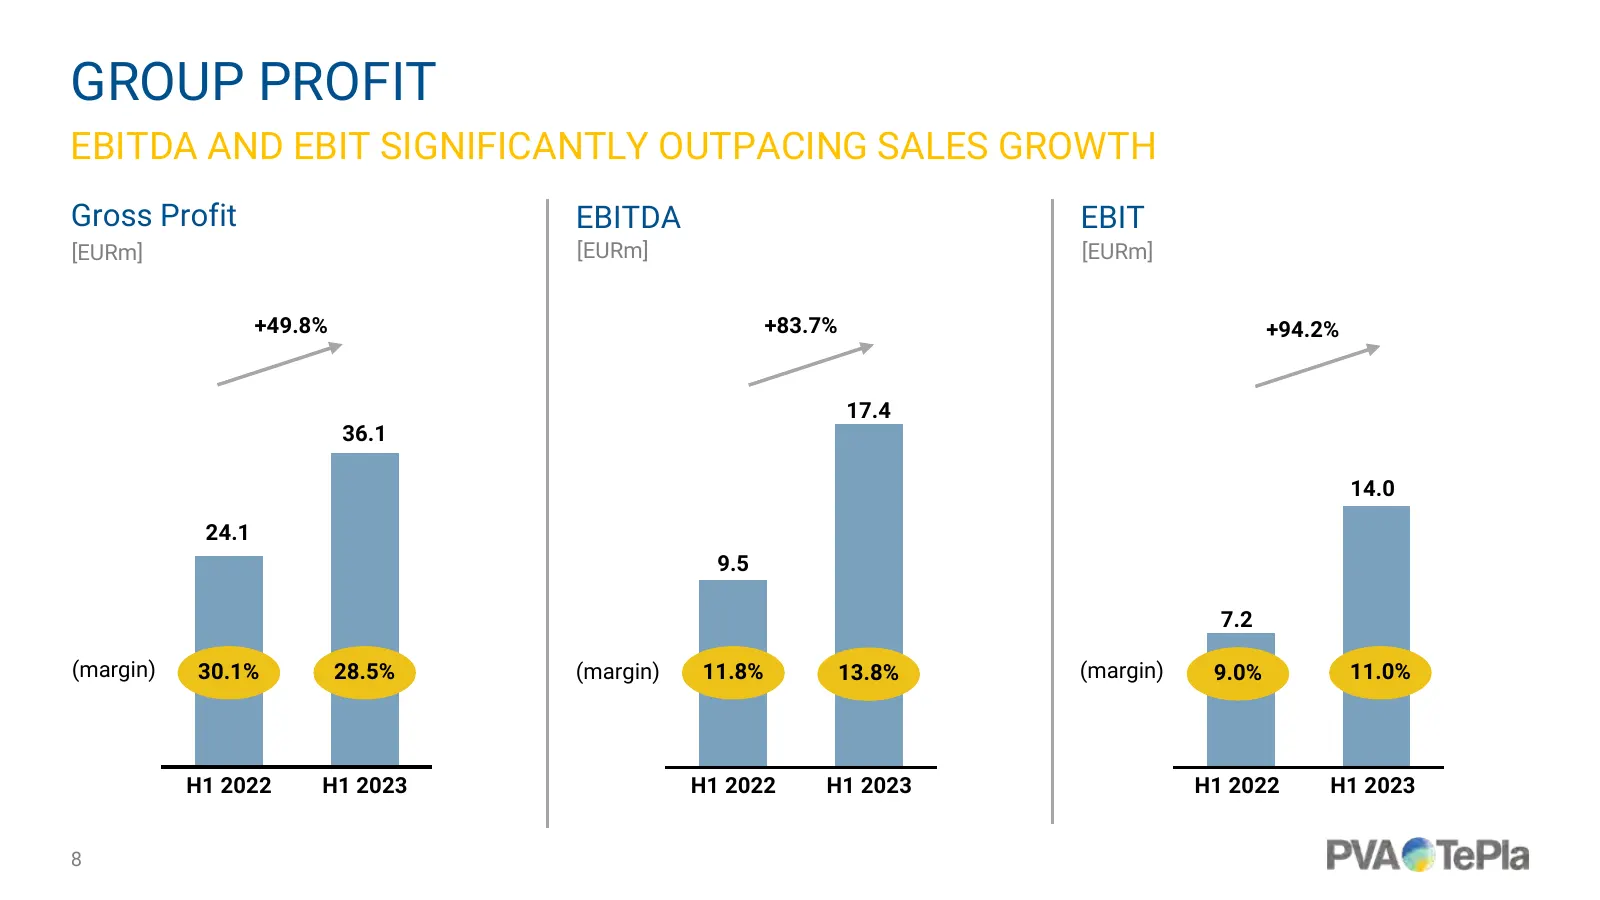
GROUP PROFIT EBITDA AND EBIT SIGNIFICANTLY OUTPACING SALES GROWTH Gross Profit EBITDA EBIT [EURm] [EURm] [EURm] +49.8% +83.7% +94.2% 17.4 36.1 14.0 24.1 9.5 7.2 (margin) 30.1% 28.5% (margin) 11.8% 13.8% (margin) 9.0% 11.0% H1 2022 H1 2023 H1 2022 H1 2023 H1 2022 H1 2023 8
Slide 9: Quarterly Development
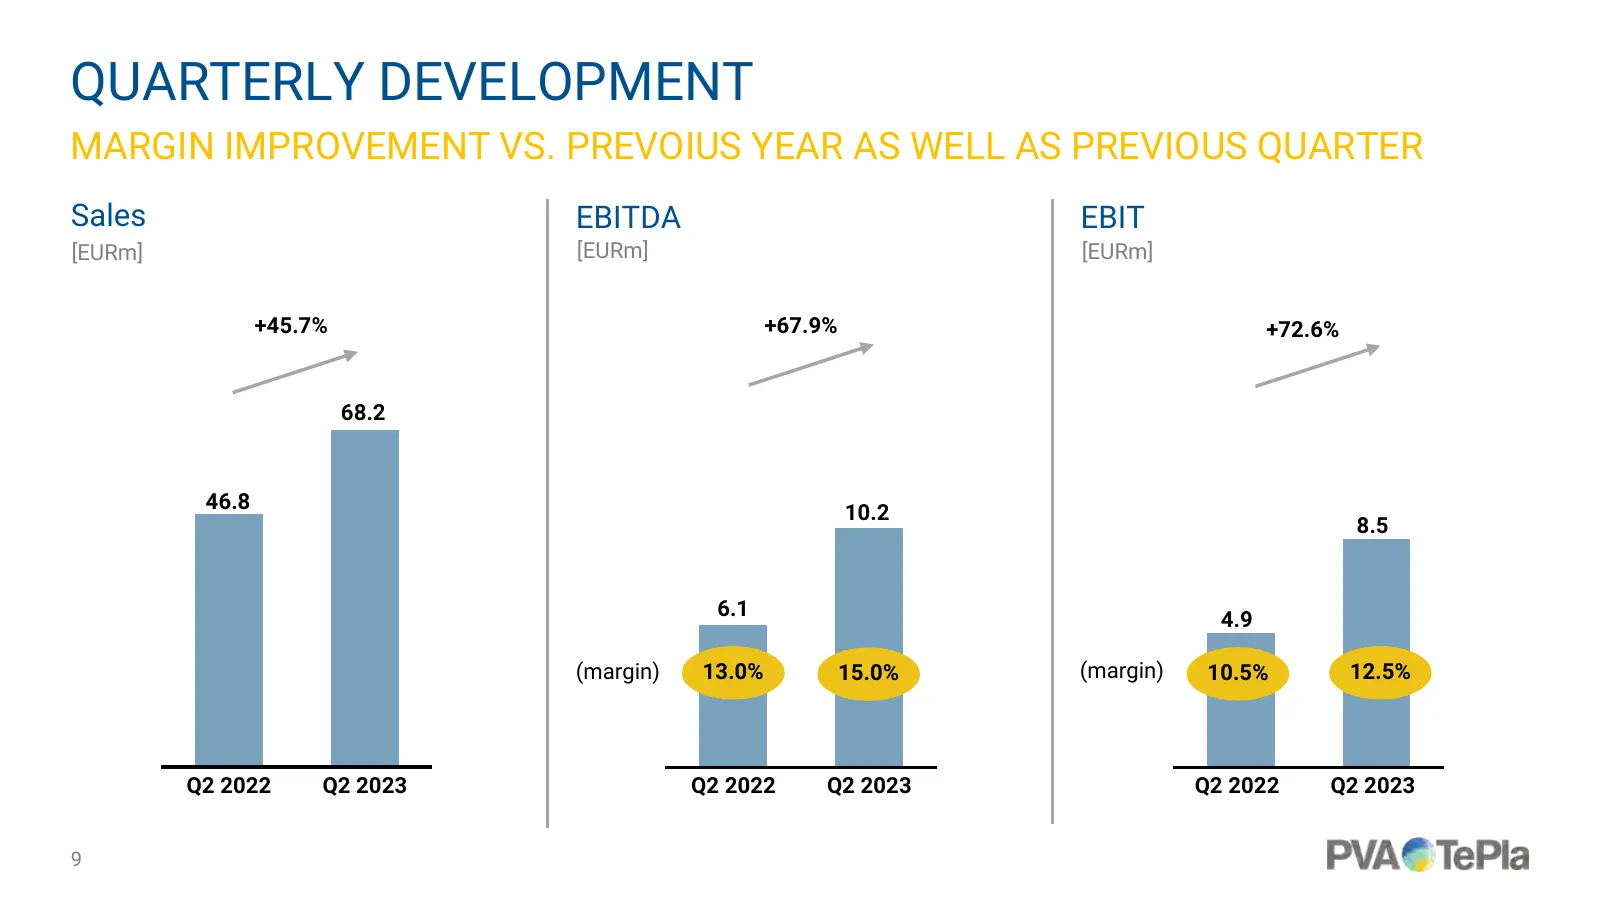
QUARTERLY DEVELOPMENT MARGIN IMPROVEMENT VS. PREVOIUS YEAR AS WELL AS PREVIOUS QUARTER Sales EBITDA EBIT [EURm] [EURm] [EURm] +45.7% +67.9% +72.6% 68.2 46.8 10.2 8.5 6.1 4.9 (margin) 13.0% 15.0% (margin) 10.5% 12.5% Q2 2022 Q2 2023 Q2 2022 Q2 2023 Q2 2022 Q2 2023 9
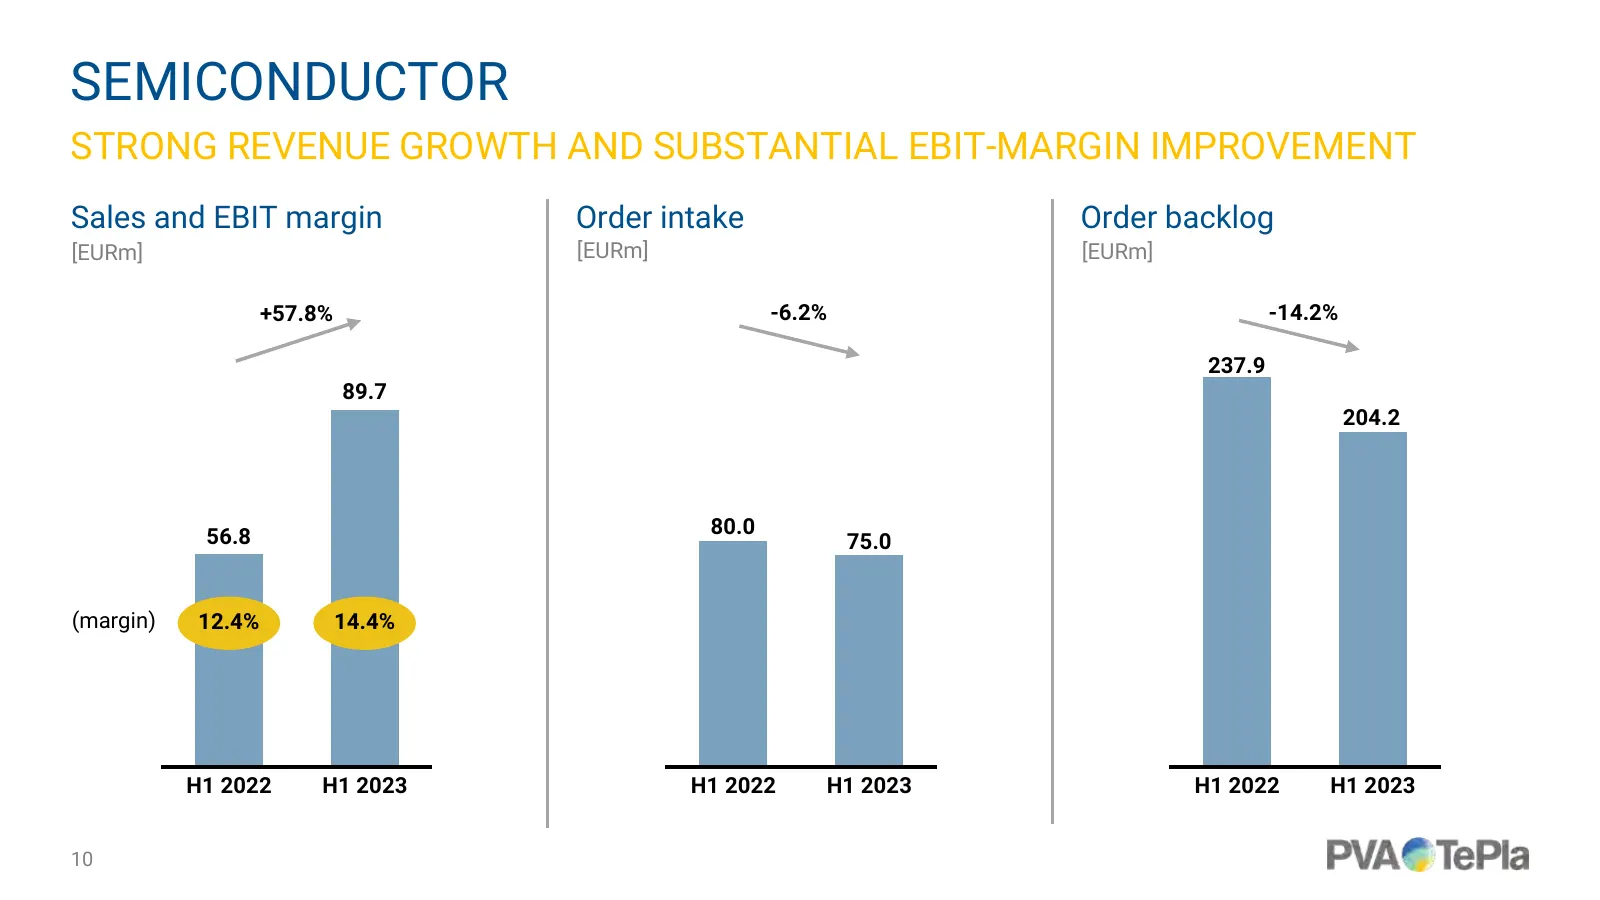
Slide 10: Semiconductor
SEMICONDUCTOR STRONG REVENUE GROWTH AND SUBSTANTIAL EBIT-MARGIN IMPROVEMENT Sales and EBIT margin Order intake Order backlog [EURm] [EURm] [EURm] +57.8% -6.2% -14.2% 237.9 89.7 204.2 56.8 80.0 75.0 (margin) 12.4% 14.4% H1 2022 H1 2023 H1 2022 H1 2023 H1 2022 H1 2023 10
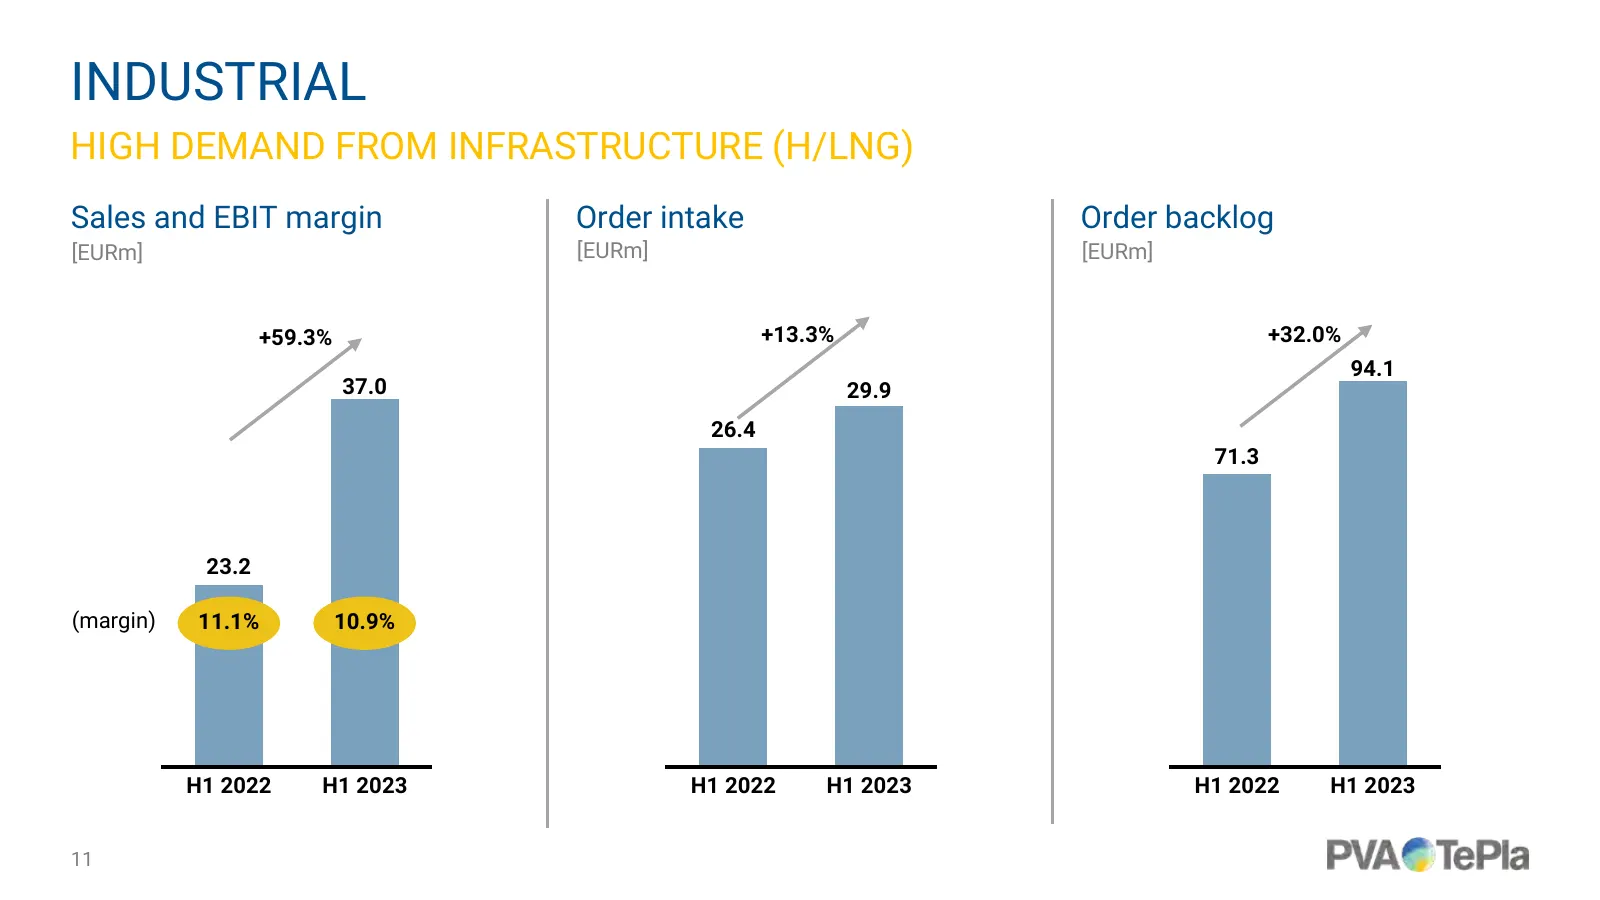
Slide 11: Industrial
INDUSTRIAL HIGH DEMAND FROM INFRASTRUCTURE (H/LNG) Sales and EBIT margin Order intake Order backlog [EURm] [EURm] [EURm] +59.3% +13.3% +32.0% 94.1 37.0 29.9 26.4 71.3 23.2 (margin) 11.1% 10.9% H1 2022 H1 2023 H1 2022 H1 2023 H1 2022 H1 2023 11
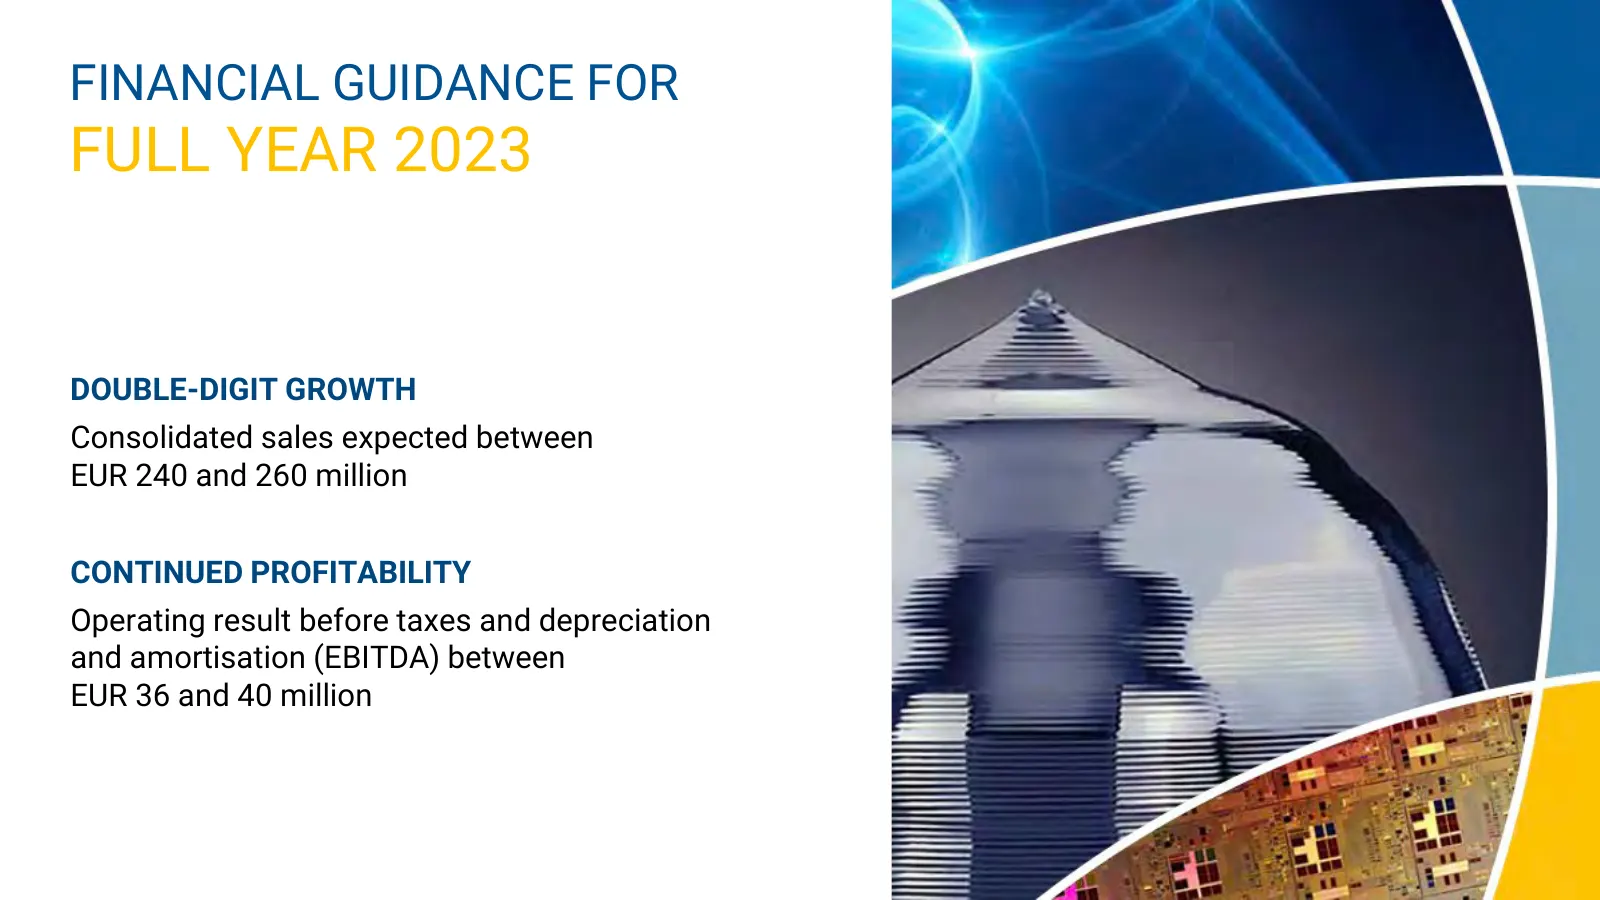
Slide 12: Financial Guidance for Full Year 2023
FINANCIAL GUIDANCE FOR FULL YEAR 2023 DOUBLE-DIGIT GROWTH Consolidated sales expected between EUR 240 and 260 million CONTINUED PROFITABILITY Operating result before taxes and depreciation and amortisation (EBITDA) between EUR 36 and 40 million

Slide 13: Time for Your Questions
TIME FOR YOUR ~)\ QUESTIONS PVA€ TePia
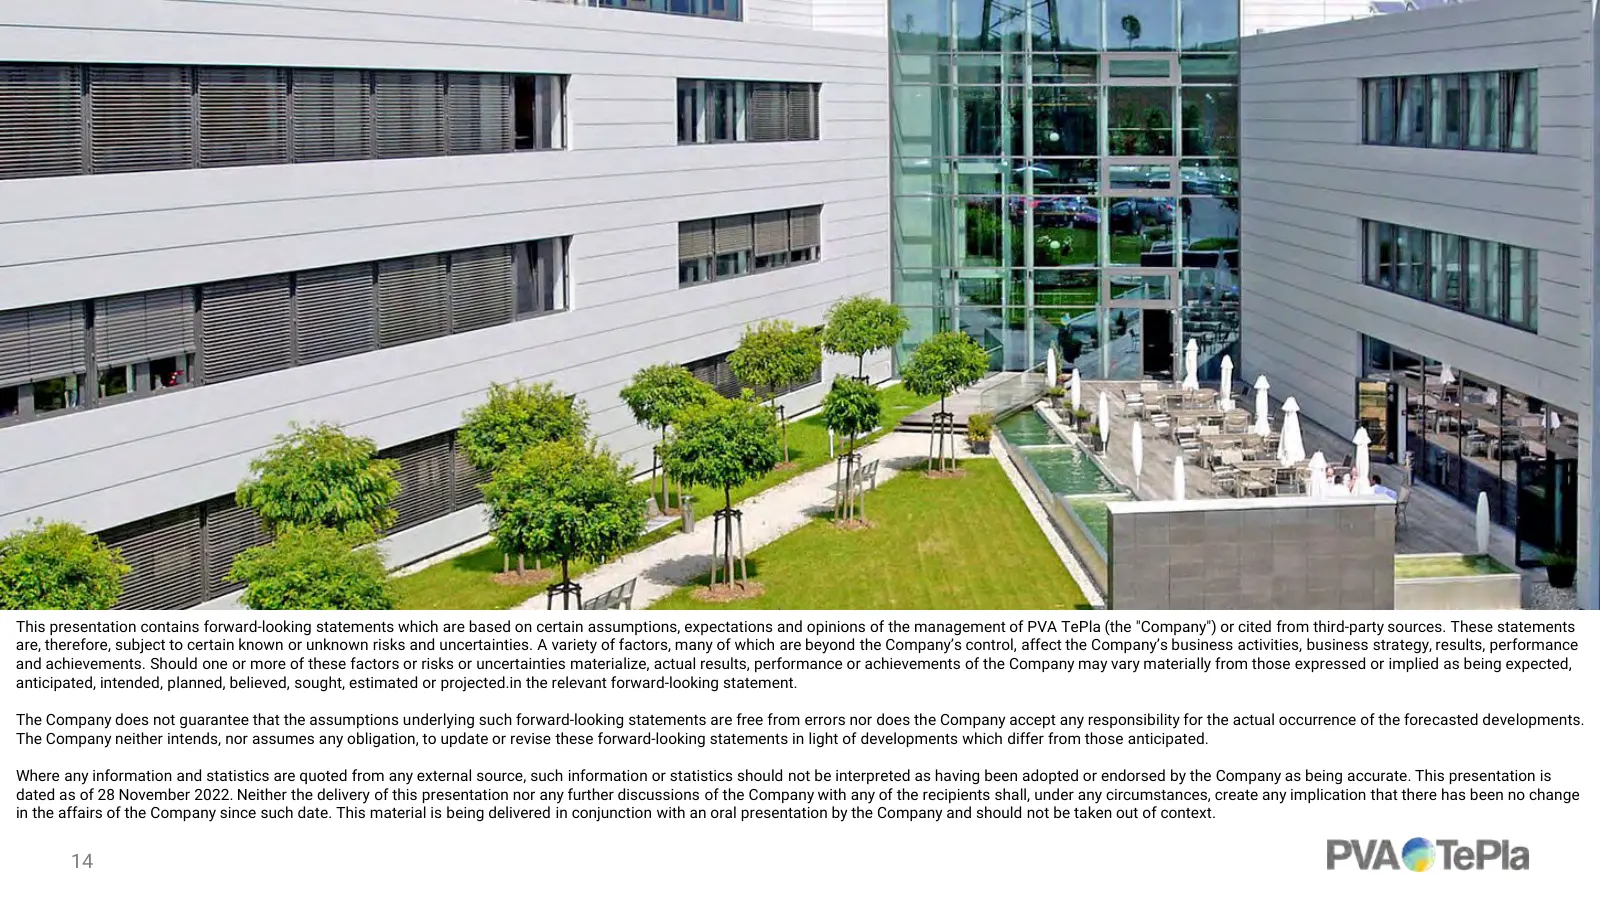
Slide 14: Forward-looking statements disclaimer
This presentation contains forward-looking statements which are based on certain assumptions, expectations and opinions of the management of PVA TePla (the "Company") or cited from third-party sources. These statements are, therefore, subject to certain known or unknown risks and uncertainties. A va
Source: Internet Archive copy of pvatepla.com
More decks from PVA TePla AG
 H1 2026 Earnings Presentation18 slides · Aug 6, 2026
 Shareholder Meeting (June 2026)16 slides · Jun 16, 2026
 Q1 2026 Earnings Presentation20 slides · May 7, 2026
 FY 2025 Earnings Presentation20 slides · Mar 19, 2026
 Q3 2025 Earnings Presentation17 slides · Nov 12, 2025
 Investor Day (September 2025)48 slides · Sep 2, 2025