First Financial Bankshares, Inc. · NASDAQ:FFIN
First Financial Bankshares — Shareholder Meeting (April 2021)
89 slides from First Financial Bankshares's shareholder meeting presentation, Apr 27, 2021
Slide 1: Annual Meeting of Shareholders
ANNUAL MEETING OF SHAREHOLDERS
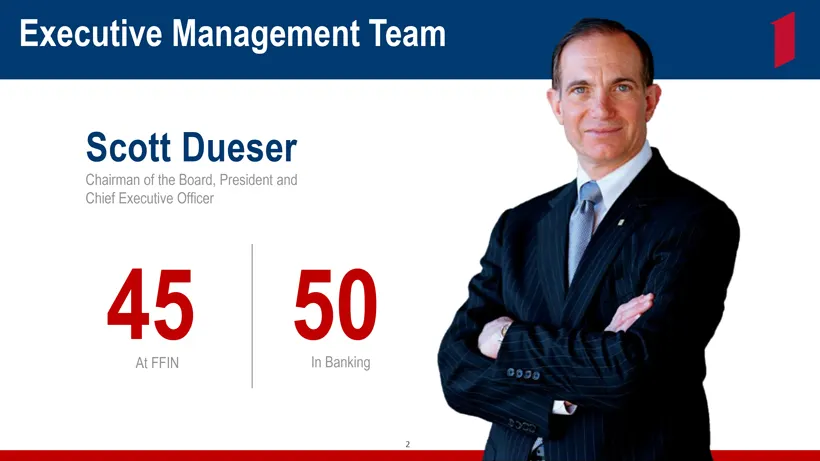
Slide 2: Executive Management Team
Executive Management Team Chairman of the Board, President and Chief Executive Officer 45 50 At FFIN In Banking
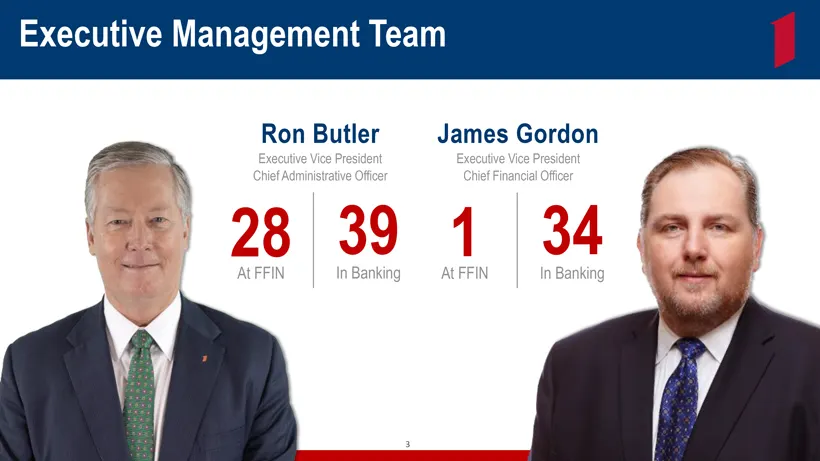
Slide 3: Executive Management Team
Executive Management Team utler James President Executive ative Officer Chief Fin 39 1 In Banking At FFIN
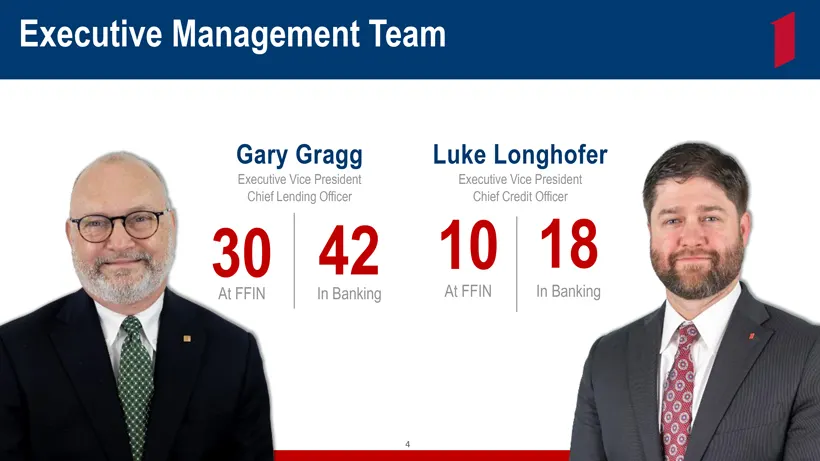
Slide 4: Executive Management Team
Executive Management Team Luke Lo Executive V Chief Cred 10 nking At FFIN 4
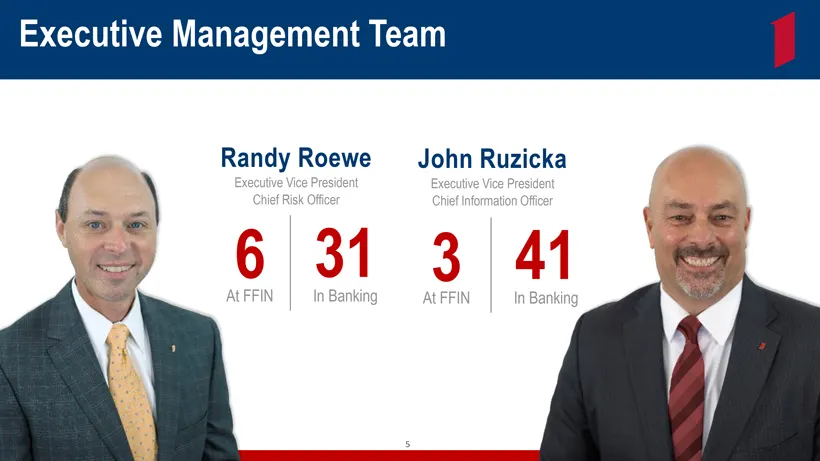
Slide 5: Executive Management Team
Executive Management Team oewe John R President Executive V Officer Chief Information 31 3 In Banking At FFIN
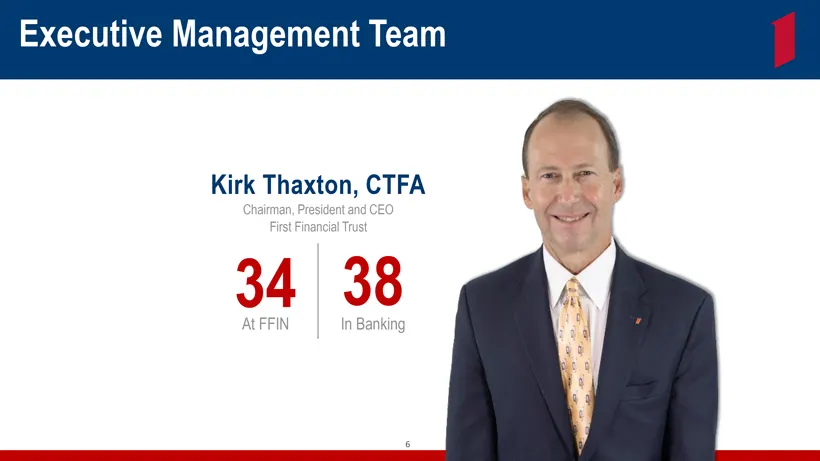
Slide 6: Executive Management Team
Executive Management Team Kirk Thaxton, CT Chairman, President and CEO First Financial Trust 34 38 At FFIN In Banking
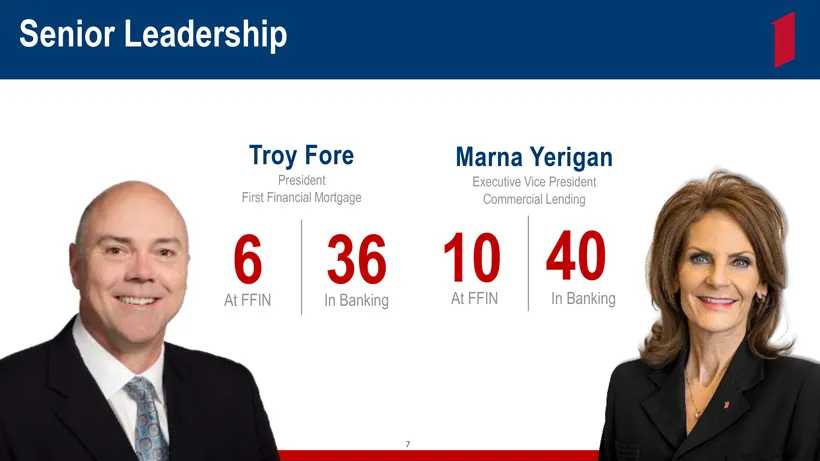
Slide 7: Senior Leadership
Senior Leadership Troy Fore Marna Yerigan President Executive Vice Preside First Financial Mortgage Commercial Lending 6 36 10 40 At FFIN In Banking At FFIN In Ba
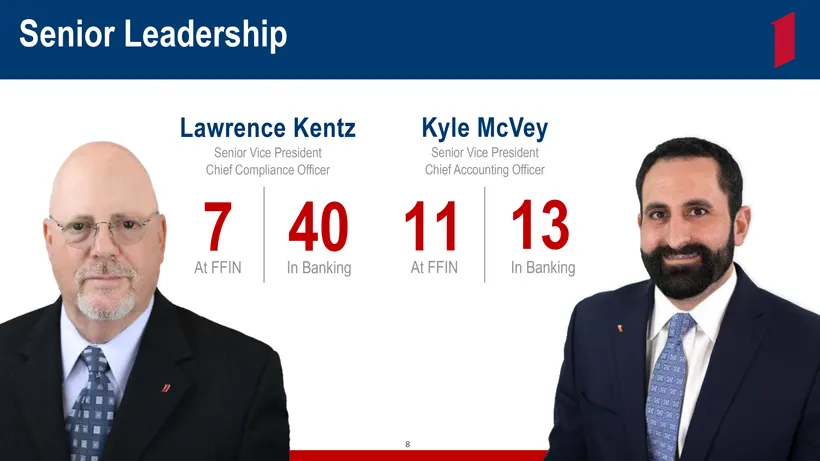
Slide 8: Senior Leadership
-Senior Leadership Lawrence Kentz Kyle McVey ident Senior Vice Preside Officer Chief Accounting Offi 40 11 Banking At FFIN In
Slide 9: Line of Business Executives
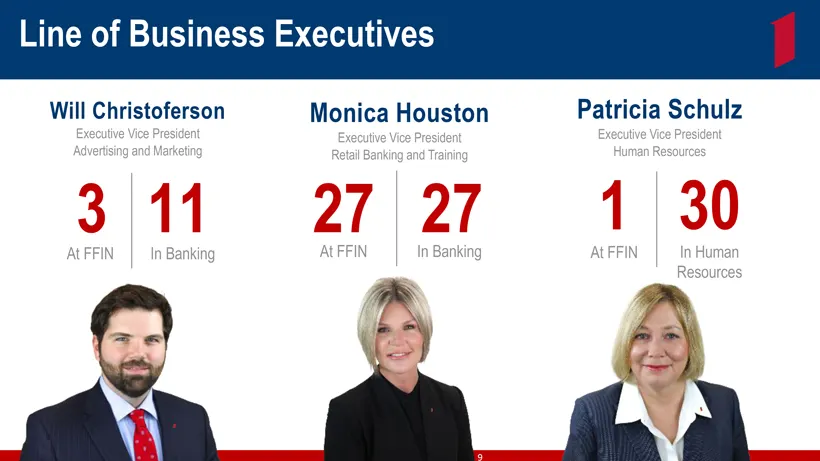
Line of Business Executives Will Christoferson Monica Houston Patricia Schulz Executive Vice President Executive Vice President Executive Vice President Advertising and Marketing Retail Banking and Training Human Resources 3 11 27 27 1 30 At FFIN In Banking At FFIN In Banking At FFIN In Human Resour
Slide 10: Line of Business Executives
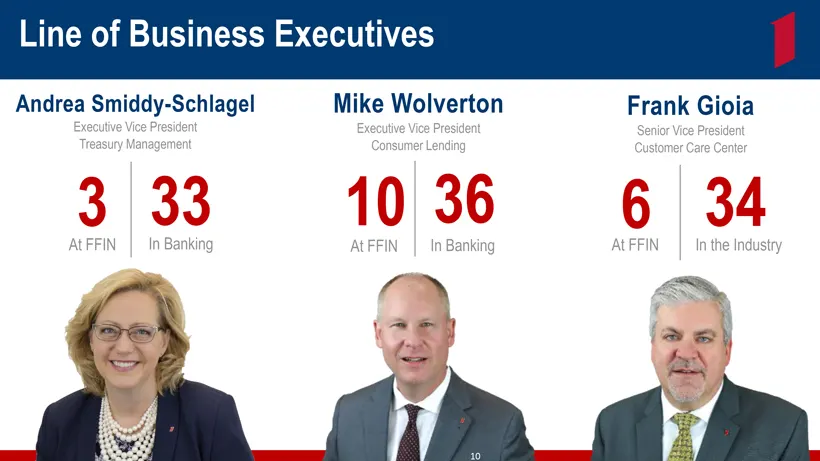
Line of Business Executives Andrea Smiddy -Schlagel Mike Wolverton Frank Gioia Executive Vice President Executive Vice President Senior Vice President Treasury Management Consumer Lending Customer Care Center 3 33 10 36 6 34 At FFIN In Banking At FFIN In Banking At FFIN In the Industry
Slide 11: Line of Business Executives
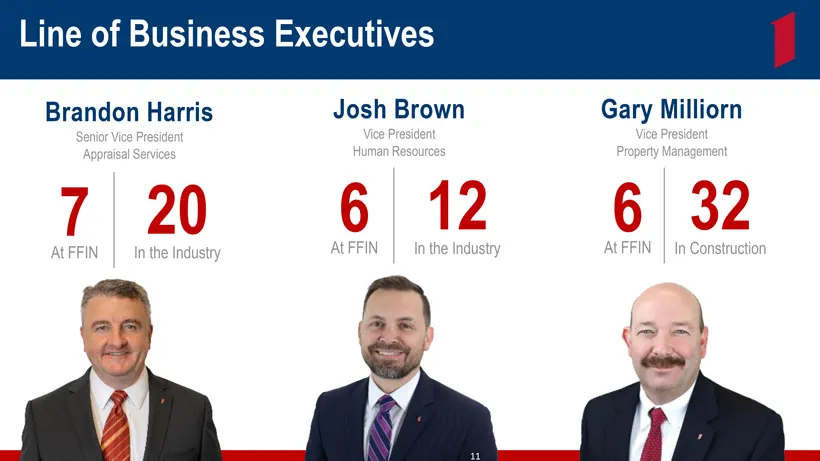
Line of Business Executives Brandon Harris Josh Brown Gary Milliorn Senior Vice President Vice President Vice President Appraisal Services Human Resources Property Management 7 20 6 12 6 32 At FFIN In the Industry At FFIN In the Industry At FFIN In Construction
Slide 12: Experienced Regional CEOs and Presidents
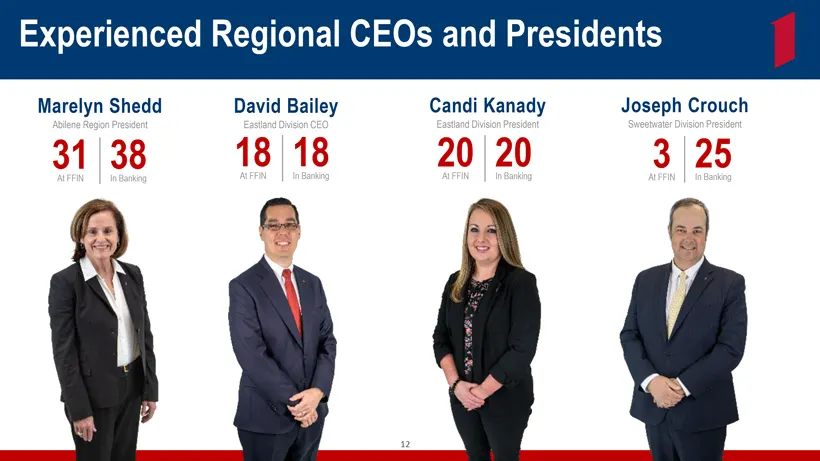
Experienced Regional CEOs and Presidents Marelyn Shedd David Bailey Candi Kanady Joseph Crouch Abilene Region President Eastland Division CEO Eastland Division President Sweetwater Division President 31 38 18 18 20 20 3 25 At FFIN In Banking At FFIN In Banking At FFIN In Banking At FFIN In Banking
Slide 13: Experienced Regional CEOs and Presidents
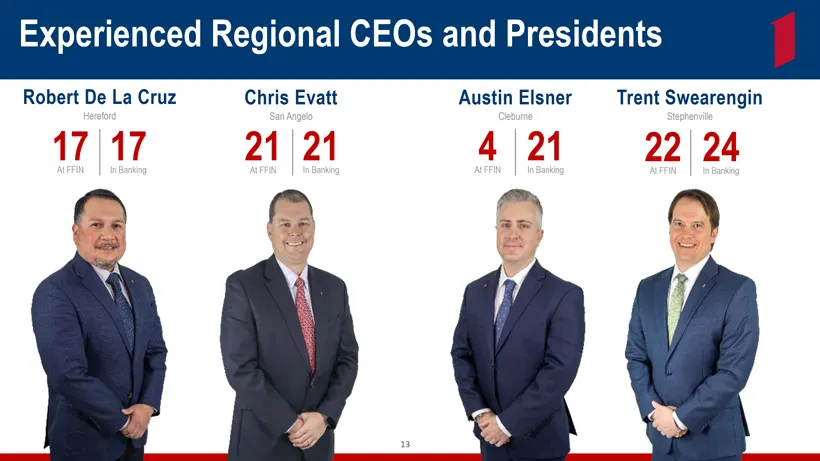
Experienced Regonal CEOs and Presidents Robert De La Cruz Chris Evatt Austin Elsner Trent Swearengin Hereford San Angelo Cleburne Stephenville 17 17 21 21 4 21 22 24 At FFIN In Banking At FFIN In Banking At FFIN In Banking At FFIN In Banking
Slide 14: Experienced Regional CEOs and Presidents
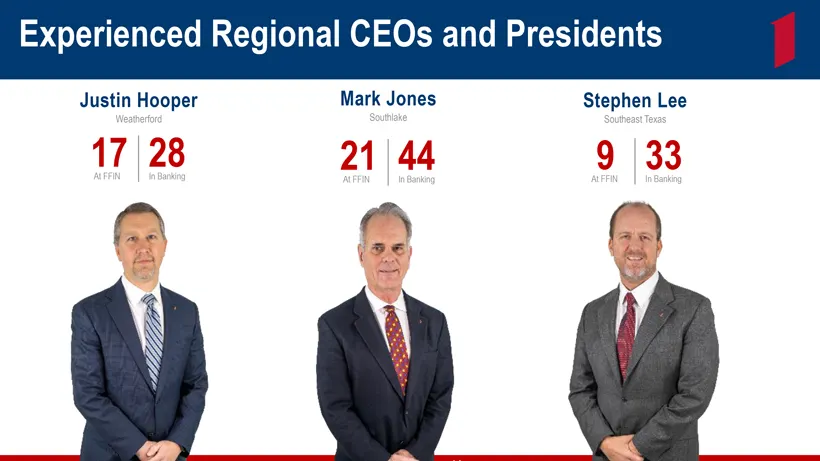
Experienced Regional CEOs and Presidents Justin Hooper Mark Jones Stephen Lee Weatherford Southlake Southeast Texas 17 28 21 44 9 33 At FFIN In Banking At FFIN In Banking At FFIN In Banking
Slide 15: Experienced Regional CEOs and Presidents
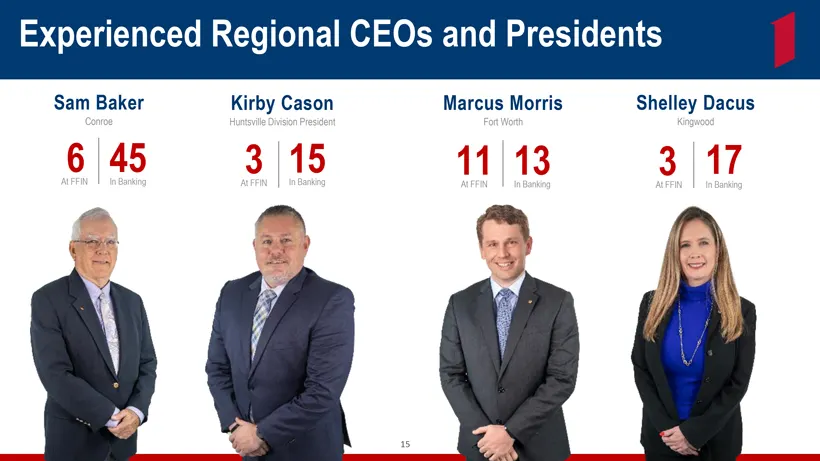
Experienced Regional CEOs and Presidents Sam Baker Kirby Cason Marcus Morris Shelley Dacus Conro Huntsville Division President Fort Worth Kingwood 6 45 3 15 11 13 3 17 At FFIN In BankingAt FFIN In Banking At FFIN In Banking At FFIN In Banking
Slide 16: Experienced Regional CEOs and Presidents
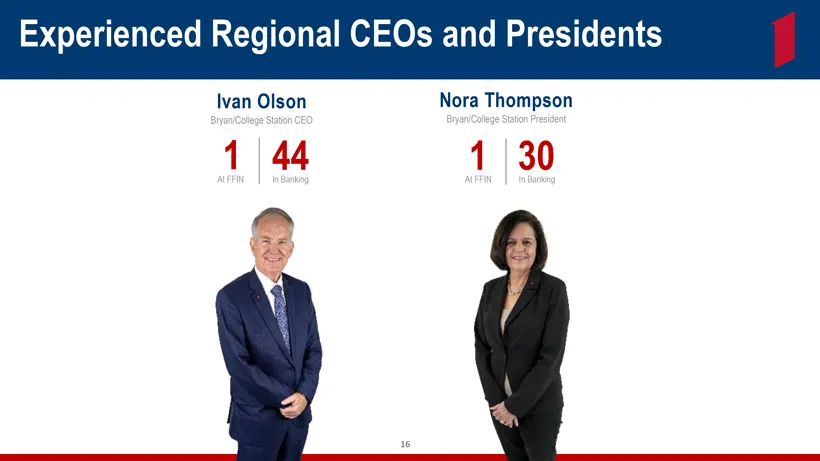
Experienced Regional CEOs and Presidents Ivan Olson Nora Thompson Bryan/College Station CEO Bryan/College Station President 1 44 1 30 At FFIN In Banking At FFIN In Banking
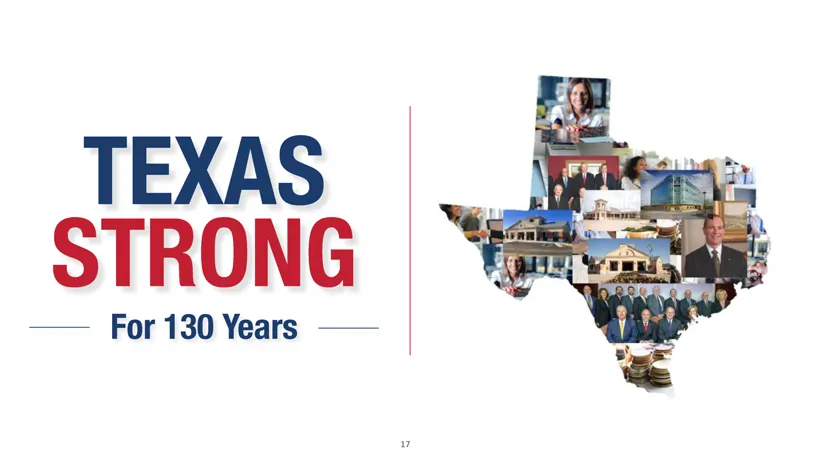
Slide 17: Texas Strong For Years
TEXAS STRONG —— For 130 Years ——
Slide 18: Independent Public Auditors
Independent Public Auditors
Slide 19: Annual Meeting of Shareholders
ANNUAL MEETING OF SHAREHOLDERS
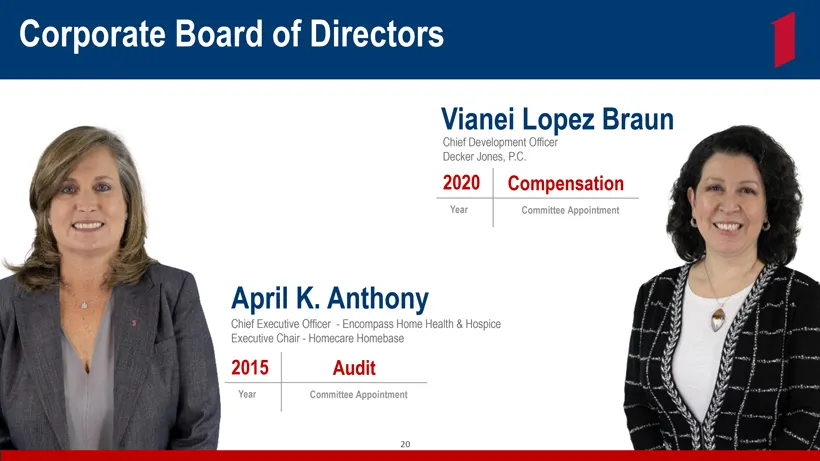
Slide 20: Corporate Board of Directors
Corporate Board of Directors Vianei Lopez Chief Development Officer Decker Jones, P.C. 2020 Compe Year Committee App April K. Anthony ief Executive Officer —Encompass Home Health & Hospice tive Chair—Homecare Homebase 20
Slide 21: Corporate Board of Directors
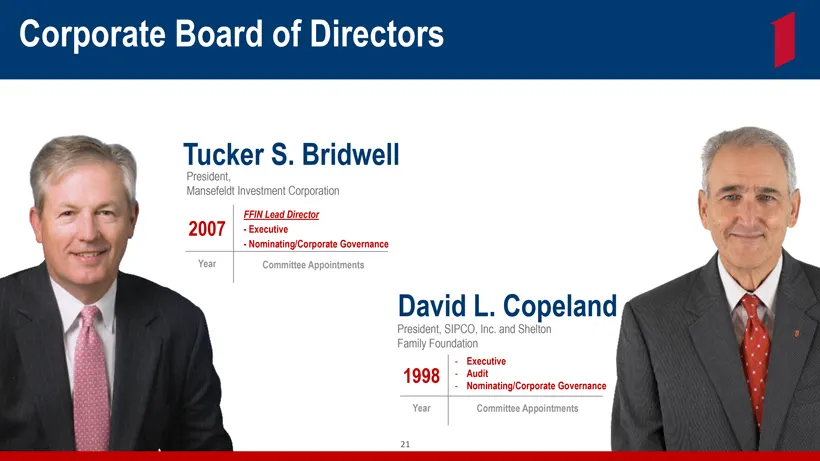
Corporate Board of Directors Tucker S. Bridwell President, Mansefeldt Investment Corporation FFIN Lead Director 2007 - Executive - Nominating/Corporate Governance Year Committee Appointments David L. Copeland President, SIPCO, Inc. and Shelton Family Foundation Executive 1998 Audit Nominating/Corpor
Slide 22: Corporate Board of Directors
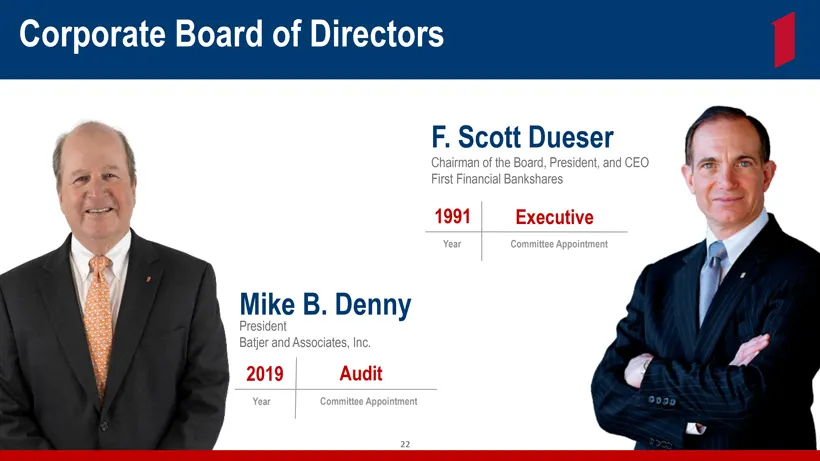
Corporate Board of Directors F. Scott Dueser Chairman of the Board, Preside First Financial Bankshares 1991 Executive Year Committee Appoint Mike B. Denny Batjer and Associates, Inc. 2019 Audit Year Committee Appointment 22
Slide 23: Corporate Board of Directors
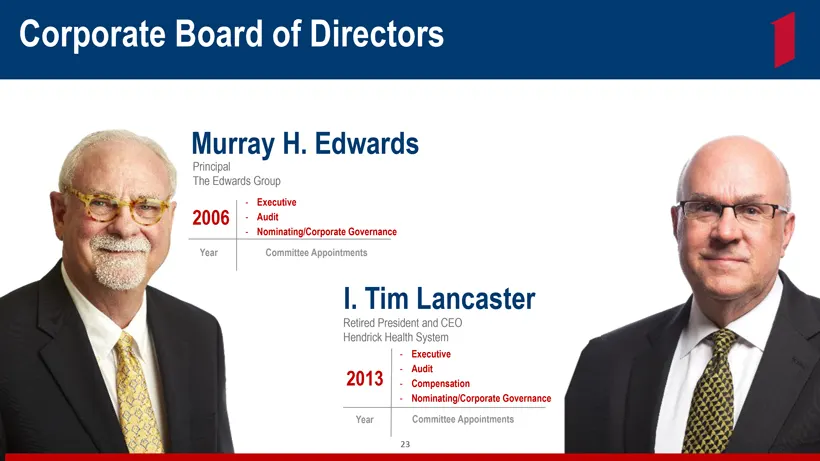
Corporate Board of Directors [Graphic Appears Here] Murray H. Edwards Principal The Edwards Group Executiv Audit Nominating/Corporate Governance Year Committee Appointments I. Tim Lancaster Retired President and CEO Hendrick Health System Executive Audit 2013 Compensation Nominating/Corporate Govern
Slide 24: Corporate Board of Directors
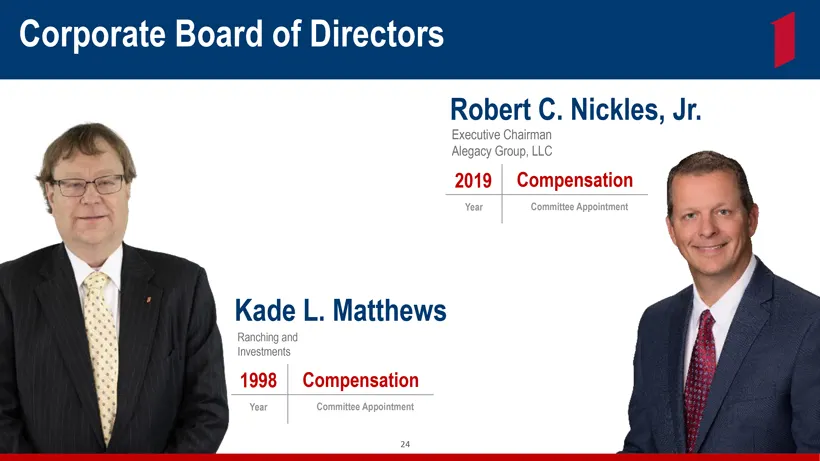
Corporate Board of Directors [Graphic Appears Here] Robert C. Nickles, Jr. Executive Chairman Alegacy Group, LLC 2019 Compensation Year Committee Appointment Kade L. Matthews Ranching and Investments 1998 Compensation Year Committee Appointment 24
Slide 25: Corporate Board of Directors
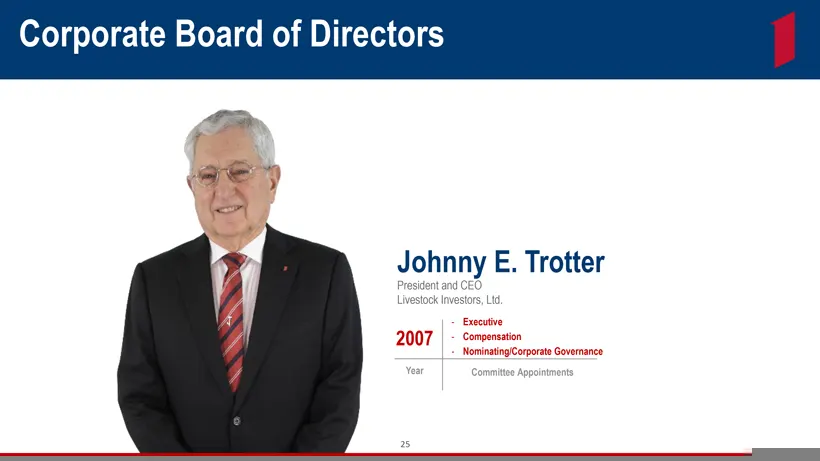
Corporate Board of Directors Johnny E. Trotter President and CEO Livestock Investors, Ltd. Executive 2007 Compensation Nominating/Corporate Governance Year Committee Appointments 25
Slide 26: Annual Meeting of Shareholders
ANNUAL MEETING OF SHAREHOLDERS
Slide 27: 2020 Financial Review
2020 Financial Review James Gordon Chief Financial Officer 27
Slide 28: Forward Looking Statement
Forward Looking Statement Certain statements contained herein may be considered “forward-looking statements” as defined in the Private Securities Litigation Reform Act of 1995. These statements are based upon the belief of the Company’s management, as well as assumptions made beyond information curr
Slide 29: 34th Consecutive Year of Increased Earnings
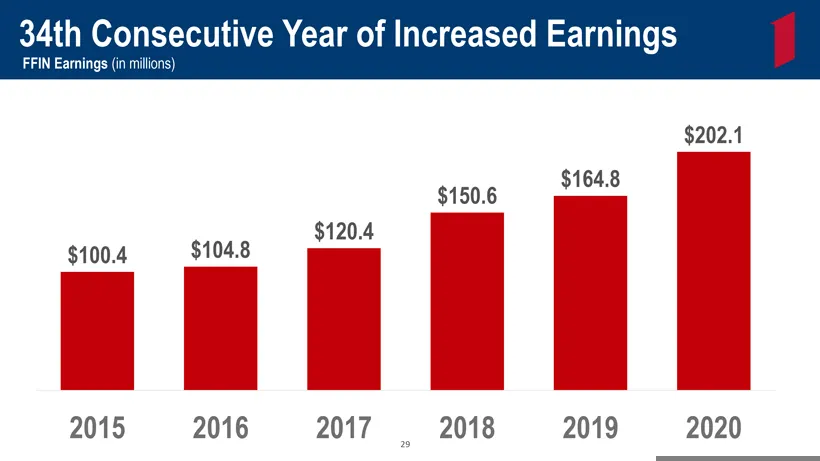
34th Consecutive Year of Increased Earnings FFIN Earnings (in millions) $202.1 $164.8 $150.6 $120.4 $100.4 $104.8 2015 2016 2017 2018 2019 2020 29
Slide 30: Strong Shareholder Earnings
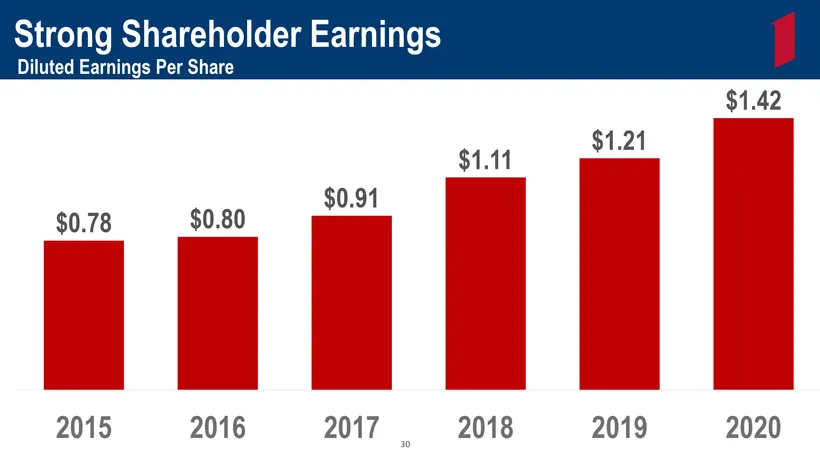
Strong Shareholder Earnings Diluted Earnings Per Share $1.42 $1.21 $1.11 $0.91 $0.78 $0.80 2015 2016 2017 2018 2019 2020 30
Slide 31: Working Harder and Smarter
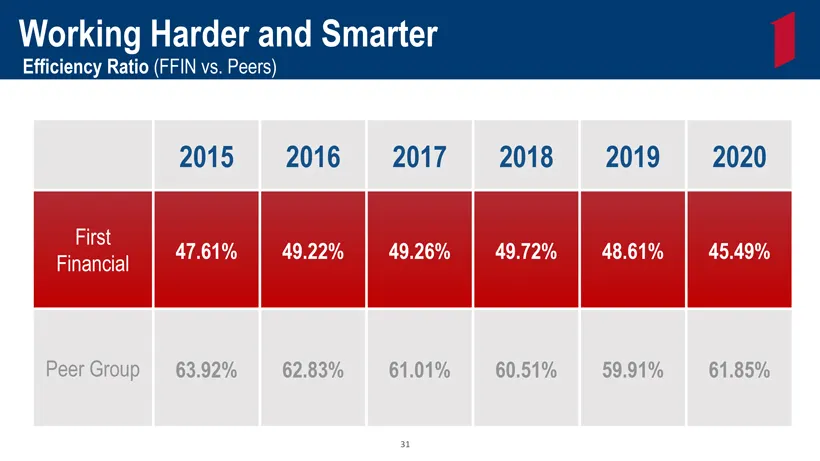
Working Harder and Smarter Efficiency Ratio (FFIN vs. Peers) 2015 2016 2017 2018 2019 2020 First Financial 47.61% 49.22% 49.26% 49.72% 48.61% 45.49% Peer Group 63.92% 62.83% 61.01% 60.51% 59.91% 61.85%
Slide 32: Net Interest Margin
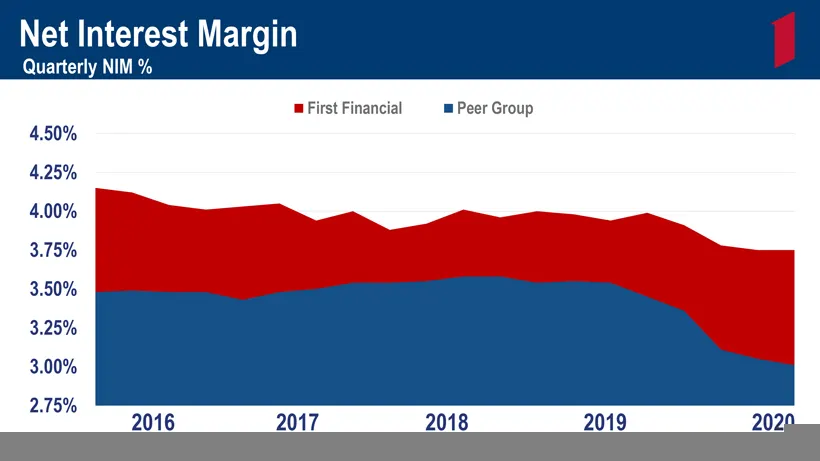
Net Interest Margin Quarterly NIM % First Financial © m Peer Group 4.50% 4.25% 4.00% 3.75% 3.50% 3.25% 3.00% 2.75% 2017
Slide 33: FFIN Outperforms Peers
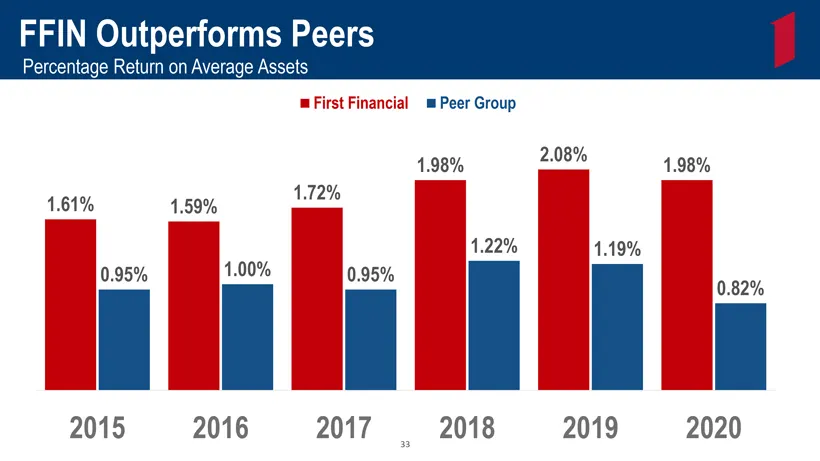
FFIN Outperforms Peers Percentage Return on Average Assets First Financial Peer Group 2.08% 1.98% 1.98% 1.61% 1.59% 1.72% 1.22% 1.19% 0.95% 1.00% 0.95% 0.82% 2015 2016 2017 2018 2019 2020
Slide 34: Strong Return on Capital
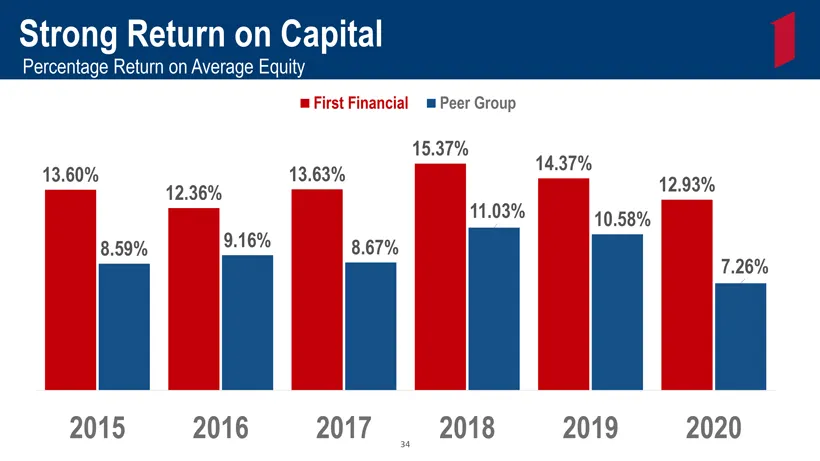
Strong Return on Capital Percentage Return on Average Equity m Peer Group 15.37% 14.37% 13.60% 12.36% 13.63% 42.93% 11.03% 10.58% 8.59% 9.16% 8.67% | | J | 2015 2016 2017 2018 2019 2020
Slide 35: Capital Ratios
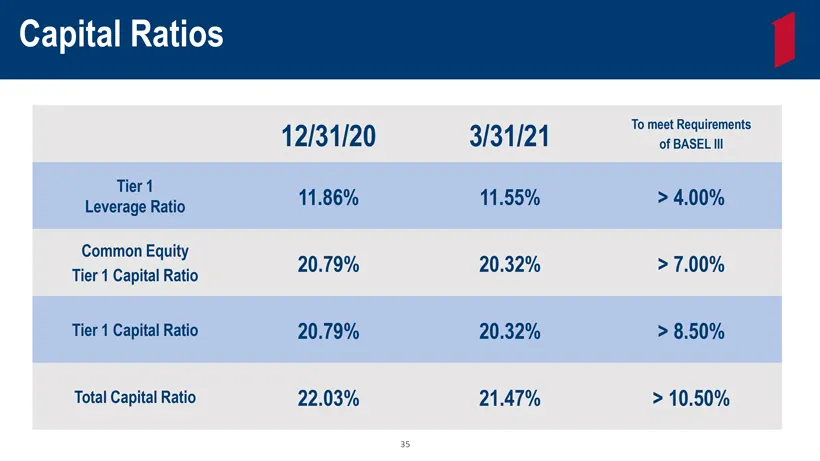
Capital Ratios 12/31/20 3/31/21 To meet Requirements of BASEL III Tier 1 Leverage Ratio 11.86% 11.55% > 4.00% Common Equity Tier 1 Capital Ratio 20.79% 20.32% > 7.00% Tier 1 Capital Ratio 20.79% 20.32% > 8.50% Total Capital Ratio 22.03% 21.47% > 10.50%
Slide 36: Total Asset Growth
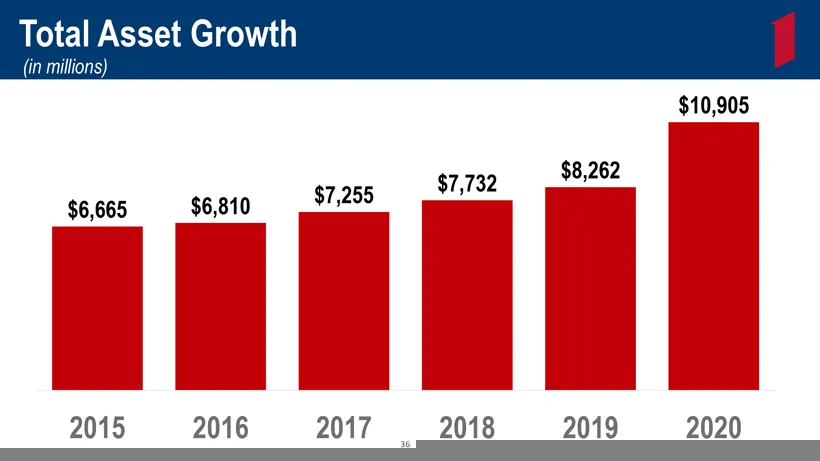
Total Asset Growth (in millions) $10,905 $8,262 $7,732 $6,810 $7,255 $6,665 2015 2016 2017 2018 2019 2020
Slide 37: Total Loan Growth
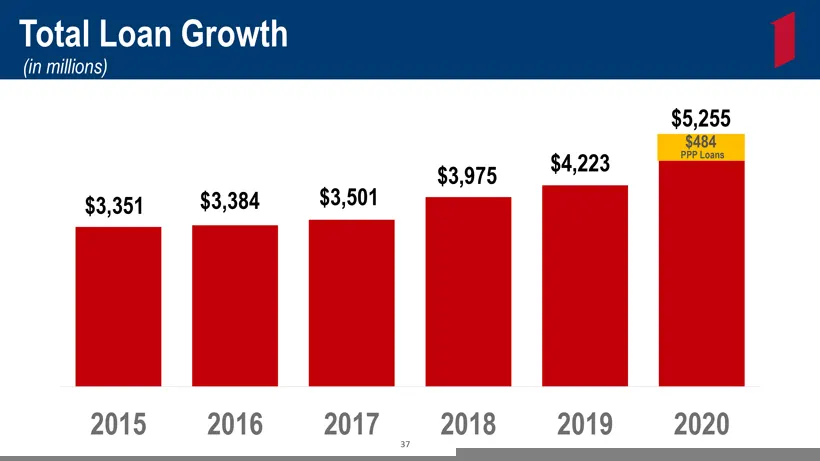
Total Loan Growth (in millions) $5,255 $484 $4,223 PPP Loans $3,975 $3,351 $3,384 $3,501 2015 2016 2017 2018 2019 2020
Slide 38: Sound Lending Practices
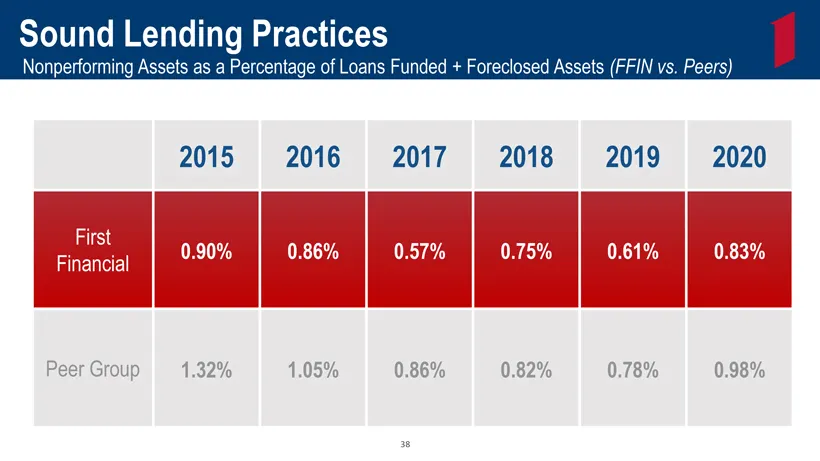
Sound Lending Practices Nonperforming Assets as a Percentage of Loans Funded + Foreclosed Assets (FFIN vs. Peers) 2015 2016 2017 2018 2019 2020 First Financial 0.90% 0.86% 0.57% 0.75% 0.61% 0.83% Peer Group 1.32% 1.05% 0.86% 0.82% 0.78% 0.98%
Slide 39: Interest Bearing Deposits
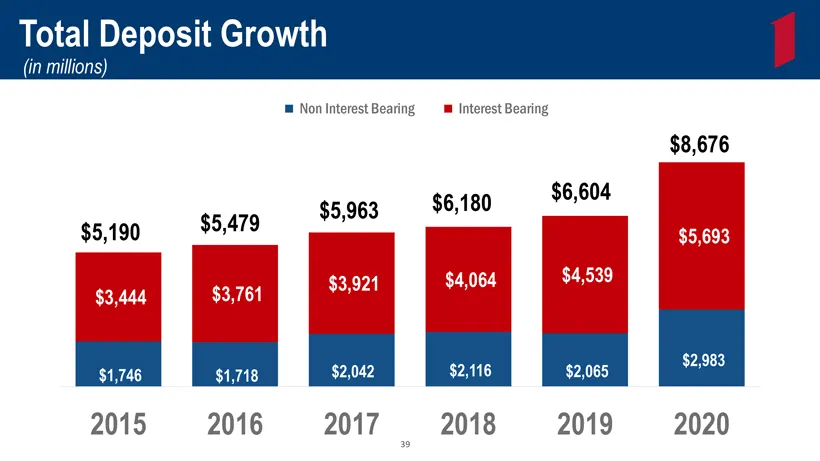
on Interest Bearing Interest Bearing
Slide 40: 1st Quarter 2021 Financial Review
1st Quarter 2021 Financial Review
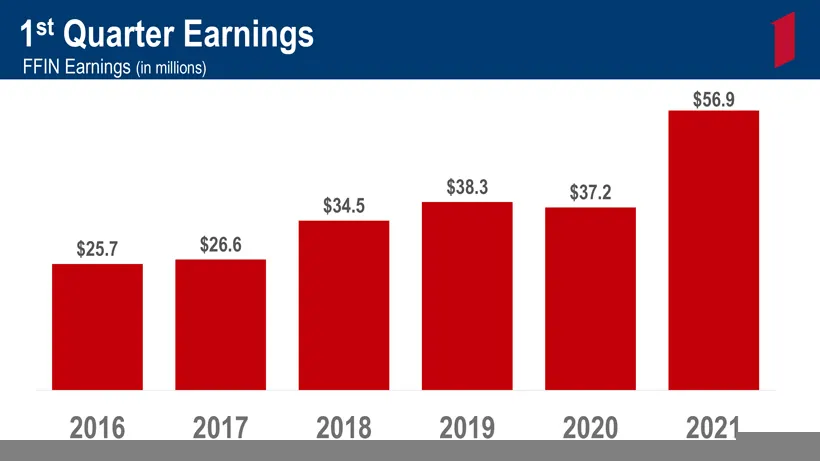
Slide 41: 1st Quarter Earnings
st Quarter Earnings FFIN Earnings (in millions) $56.9 $34.5 $38.3 $37.2 $25.7 $26.6 2016 2017 2018 2019 2020 2021
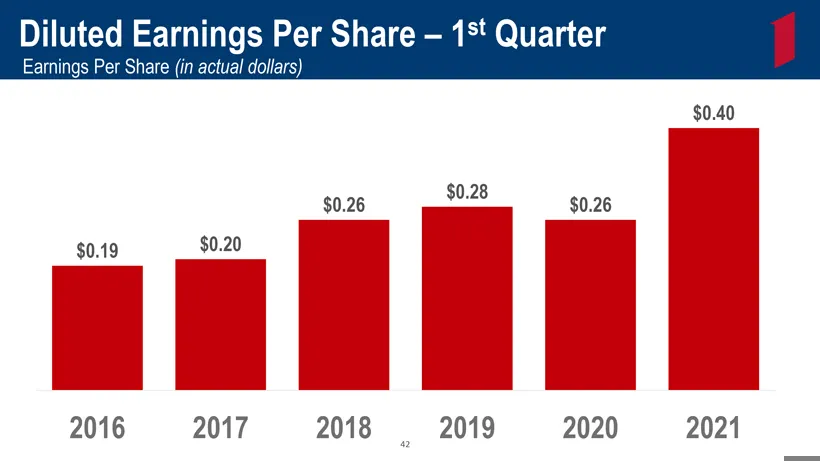
Slide 42: Diluted Earnings Per Share – 1st Quarter
Diluted Earnings Per Share – 1st Quarter Earnings Per Share (in actual dollars) $0.40 $0.28 $0.26 $0.26 $0.19 $0.20 2016 2017 2018 2019 2020 2021
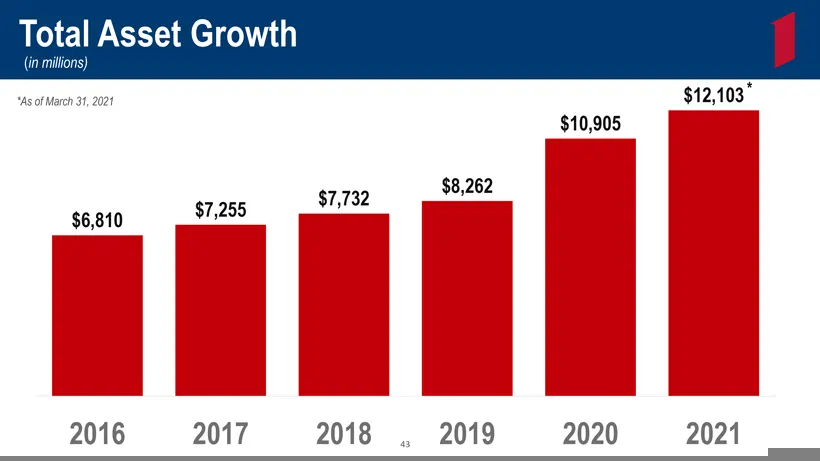
Slide 43: Total Asset Growth
Total Asset Growth (in millions) *As of March 31, 2021 $12,103 * $10,905 $8,262 $7,732 $7,255 $6,810 2016 2017 2018
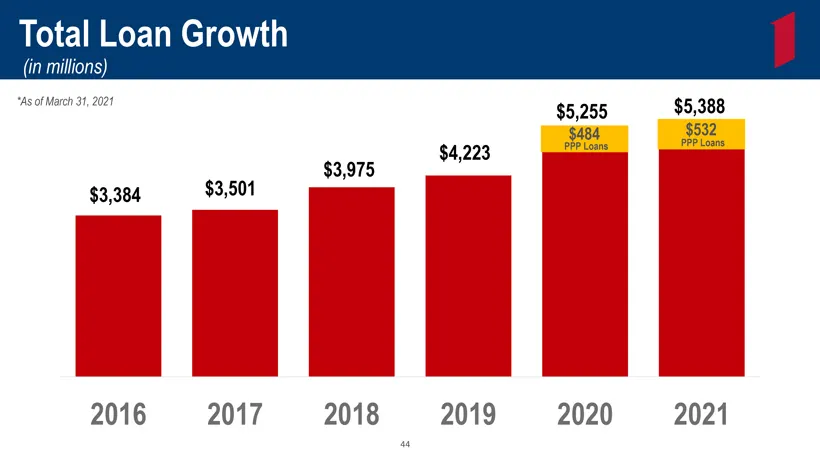
Slide 44: Total Loan Growth
2019 2020 2021 Total Loan Growth (in millions) *As of March 31, 2021 $5,255 $5,388 $484 $532 $4,223 PPP Loans PPP Loans $3,975 $3,384 $3,501 2016 2017 2018 2019 2020 2021
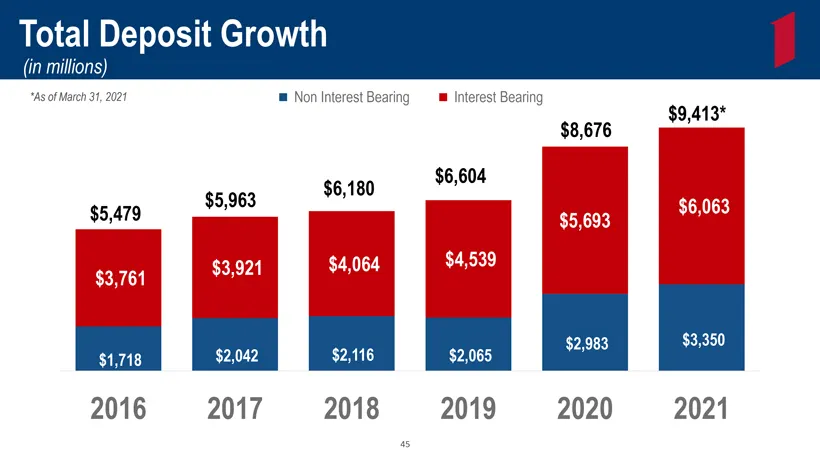
Slide 45: Non-Interest Bearing Deposits
Non Interest Bearing Interest Bearing
Slide 46: 2020 Trust Review
2020 Review Kirk W. Thaxton, CTFA President and CEO First Financial Trust
Slide 47: Growth in Trust Assets
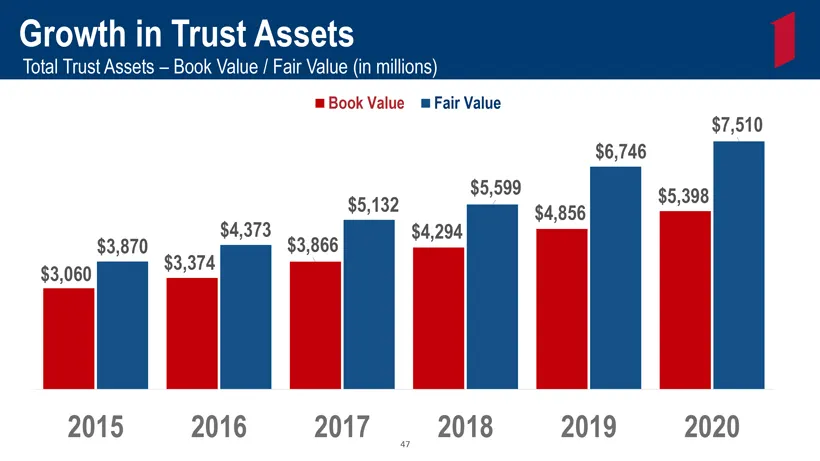
Growth in Trust Assets Total Trust Assets — Book Value / Fair Value (in millions) m Fair Value $7,510 $6,746 $5,599 $5,398 $5,132 $4,856 B $3,870 $4,373 $3,866 $4,204 mem $3,374 - L | I! 2015 2016 2017 2018 2019 2020
Slide 48: Total Trust Fees
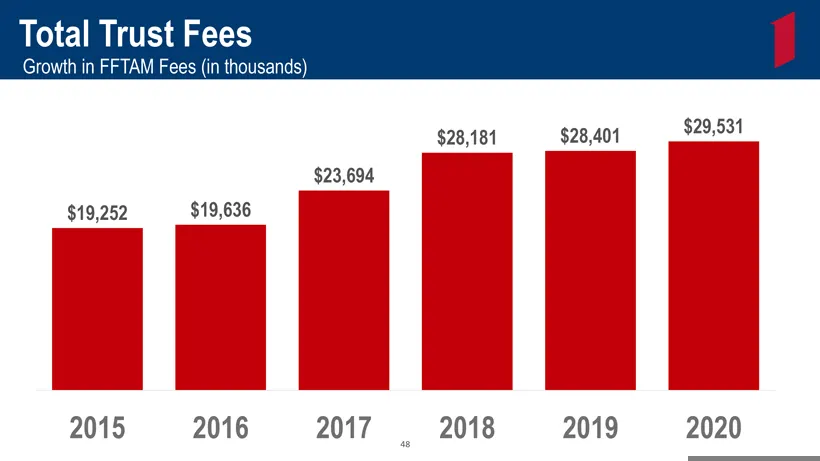
Total Trust Fees Growth in FFTAM Fees (in thousands) $28,181 $28,401 $29,531 $23,694 $19,252 $19,636 2015 2016 2017 2018 2019 2020
Slide 49: Revenue from Mineral Management
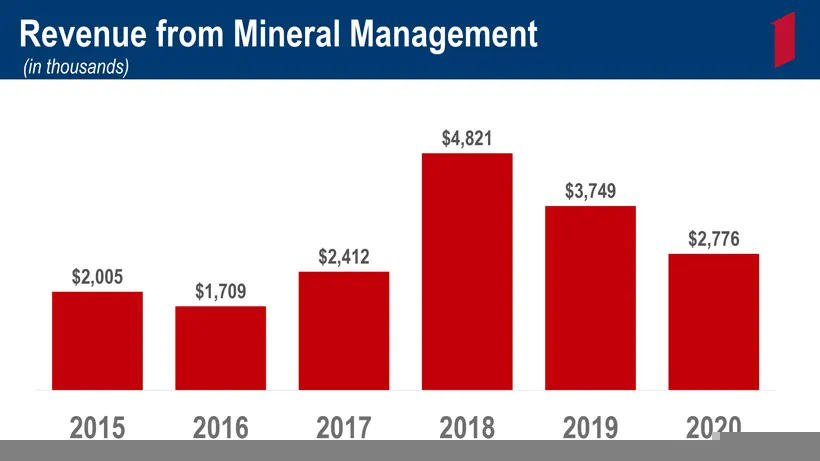
Revenue from Mineral Management (in thousands) $4,821 $3,749 $2,412 $2,776 $2,005 $1,709 2015 2016 2017 2018 2019 2020
Slide 50: Total Trust Net Income
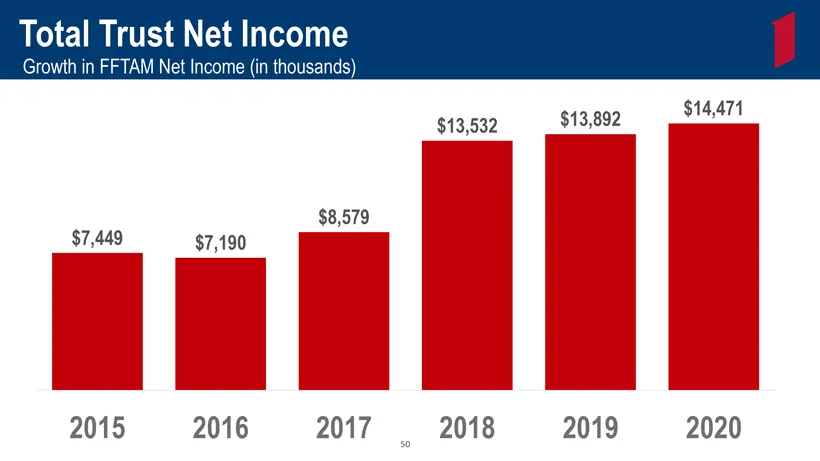
Total Trust Net Income Growth in FFTAM Net Income (in thousands) $13,532 $13,892 $14,471 $8,579 $7,449 $7,190 2015 2016 2017 2018 2019 2020

Slide 51: First Financial: Your Future First
FIRST FINANCIAL YOUR FUTURE FIRST
Slide 52: Managed Equity Styles
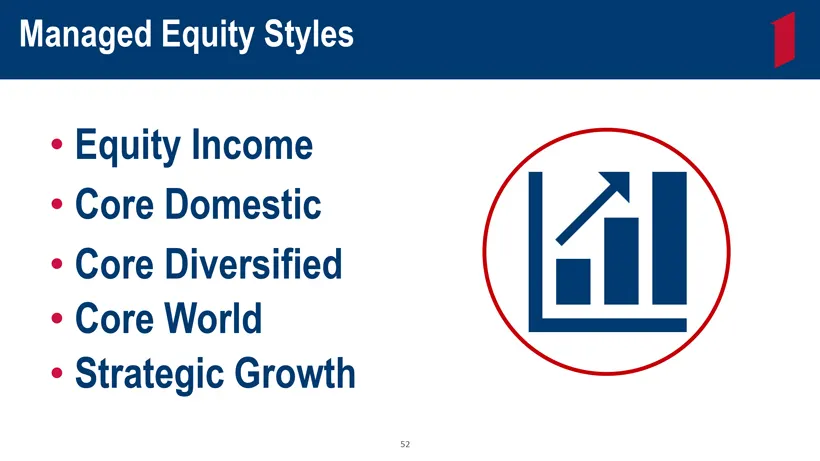
Managed Equity Styles Equity Income Core Domestic Core Diversified Core World Strategic Growth

Slide 53: First Financial: Your Future First
FIRST FINANCIAL YOUR FUTURE FIRST
Slide 54: Trust Locations
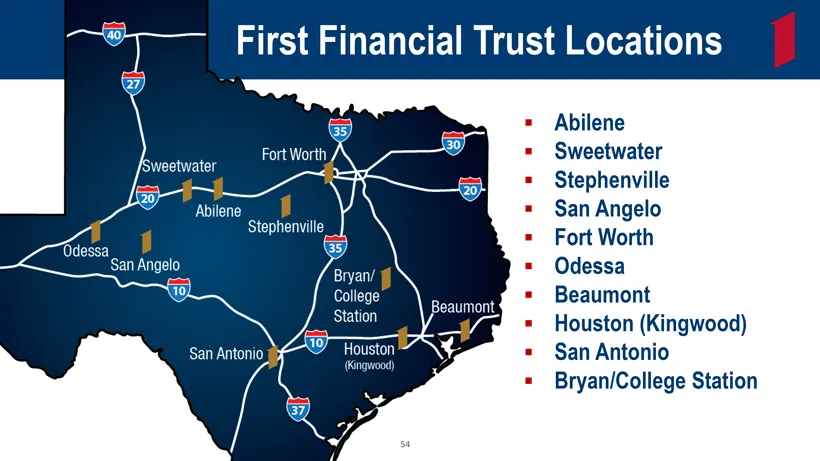
rust Locations Abilene Sweetwater Stephenville San Angelo Fort Worth Odessa Beaumont Houston (Kingwood) San Antonio Bryan/College Station
Slide 55: Trust Foundations
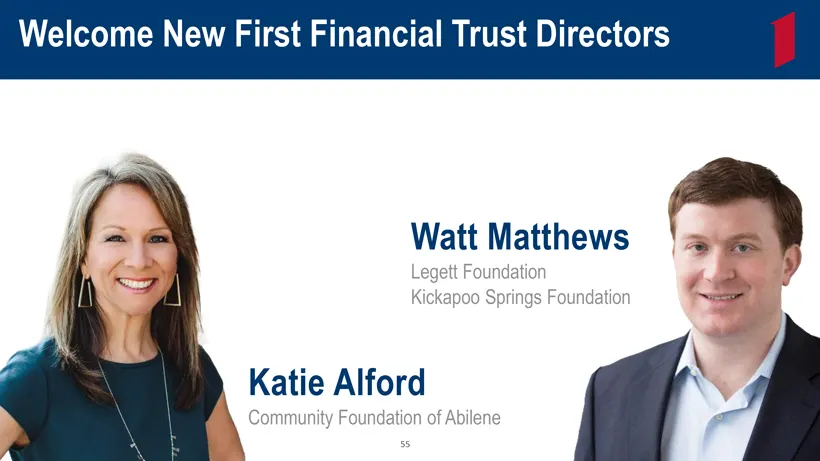
Watt Matthews Legett Foundation Kickapoo Springs Foundation Katie Alford
Slide 56: Book Value of Trust Assets
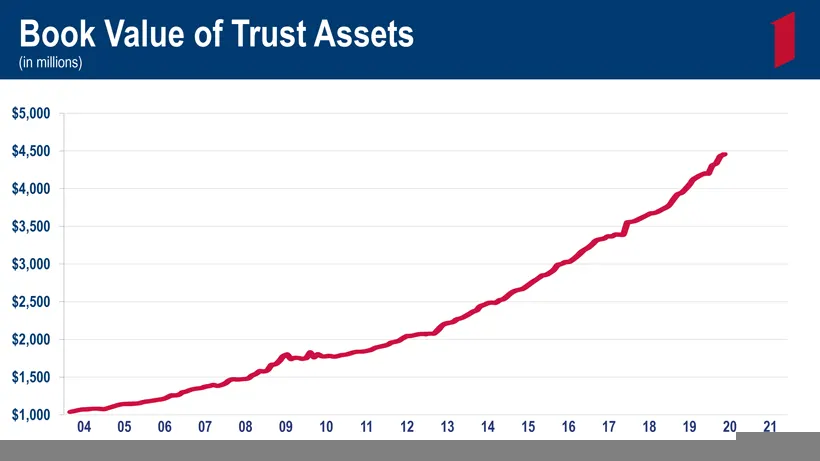
Book Value of Trust Assets (in millions) $5,000 $4,500 $4,000 $3,500 $3,000$2,500 $2,000 $1,500 $1,500 $1,000

Slide 57: First Financial: Your Future First
FIRST FINANCIAL YOUR FUTURE FIRST
Slide 58: Annual Meeting of Shareholders
ANNUAL MEETING OF SHAREHOLDERS
Slide 59: 34th Consecutive Year of Increased Earnings
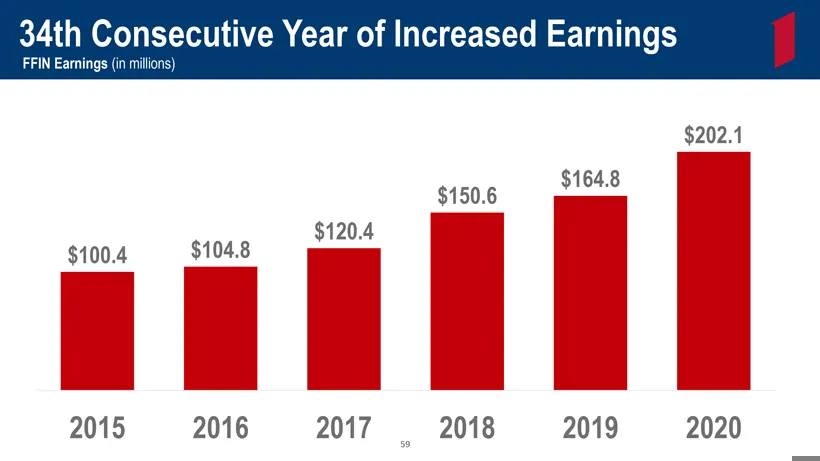
34th Consecutive Year of Increased Earnings FFIN Earnings (in millions) $202.1 $164.8 $150.6 $120.4 $100.4 $104.8 2015 2016 2017 2018 2019 2020 59
Slide 60: Total Return on Investment
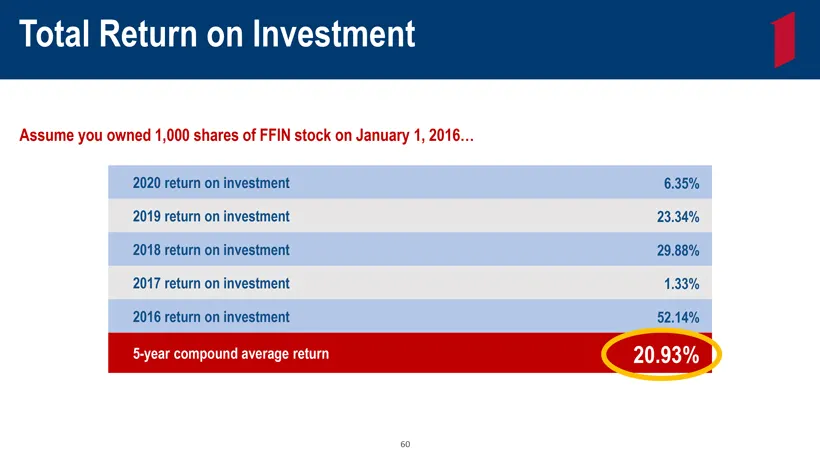
Total Return on Investment Assume you owned 1,000 shares of FFIN stock on January 1, 2016…
Slide 61: Annual Return Since 1973
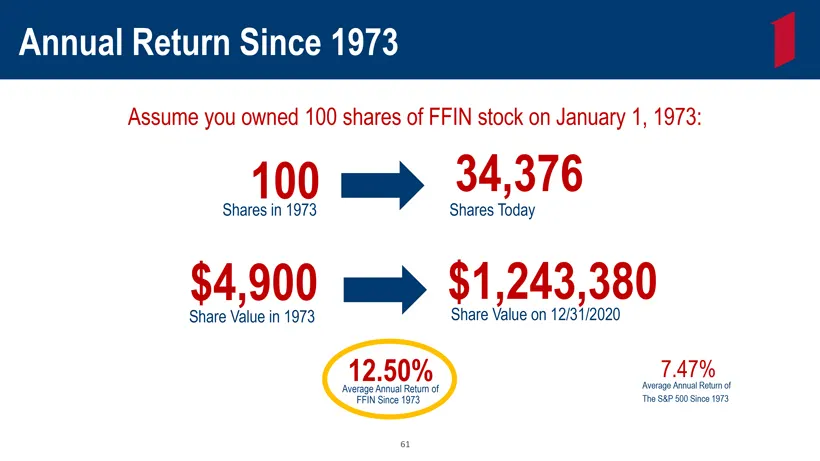
Annual Return Since 1973 Assume you owned 100 shares of FFIN stock on January 1, 1973: 100 mmp 34,376 Shares in 1973 Shares Today $4,900 mmp $1,243,380 Share Value in 1973 Share Value on 12/31/2020
Slide 62: Strong Stock Performance
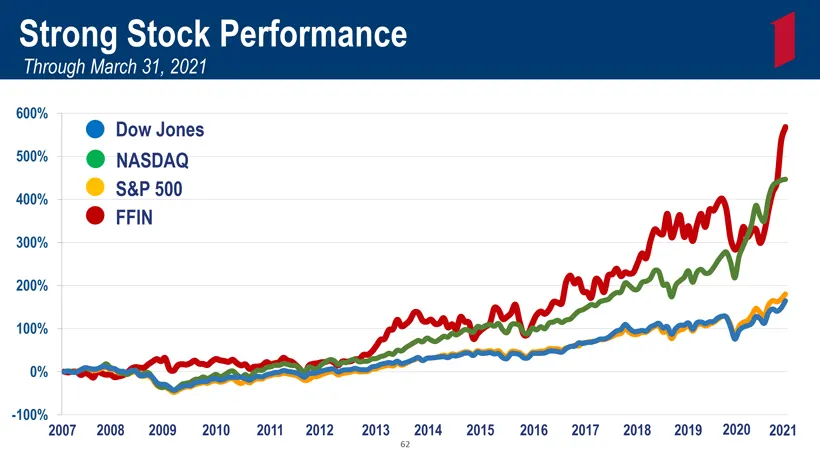
Strong Stock Performance Through March 31, 2021 600% @ Dow Jones Sou% @ NASDAQ som © S&P 500 @ FFIN 300% 200% 100% 0% 100% 2007 2008 ©2009-2010» 2041-2012 »= 2013-2014 2015» 2016 «2017-2018 += 2019-2020 2021
Slide 63: COVID-19 Government Loan Program Performance
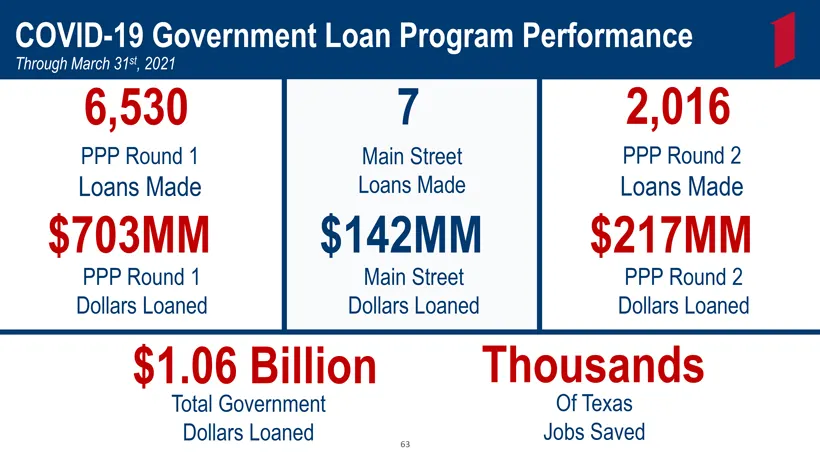
COVID-19 Government Loan Program Performance Through March 31st, 2021 6,530 PPP Round 1Loans Made $703MM PPP Round 1Dollars Loaned 7 Main Street Loans Made $142MM Main Street Dollars Loaned 2,016 PPP Round 2 Loans Made $217MM PPP Round 2 Dollars Loaned $1.06 Billion Total Government Dollars Loaned T
Slide 64: Top Rated Bank by Bank Director
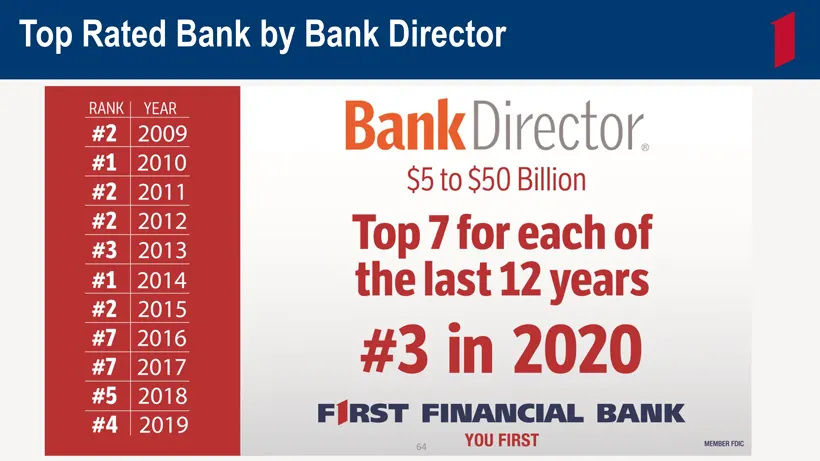
Top Rated Bank by Bank Director

Slide 65: America's Best Banks—Newsweek
America’s Best Banks—Newsweek

Slide 66: Texas Strong For Years: Accomplishments
TEXAS —— For 130 Years —— Accomplishments i
Slide 67: The Bank and Trust, Bryan/College Station
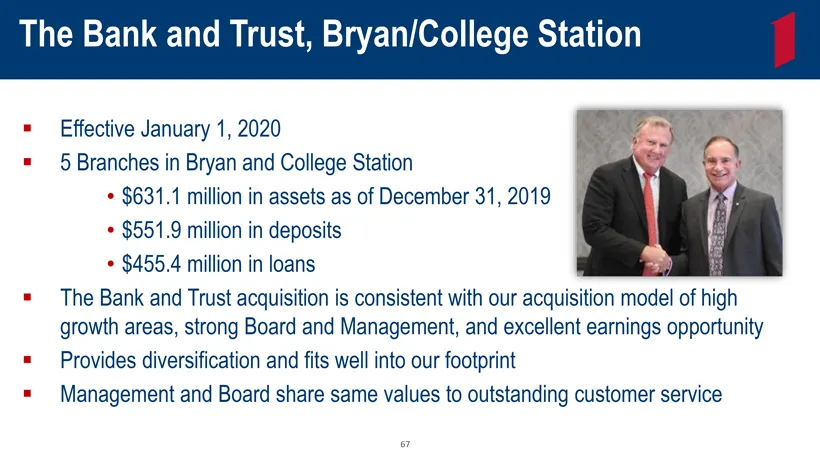
The Bank and Trust, Bryan/College Station Effective January 1, 2020 5 Branches in Bryan and College Station $631.1 million in assets as of December 31, 2019 $551.9 million in deposits $455.4 million in loans The Bank and Trust acquisition is consistent with our acquisition model of high growth areas
Slide 68: www.ffin.com/locations
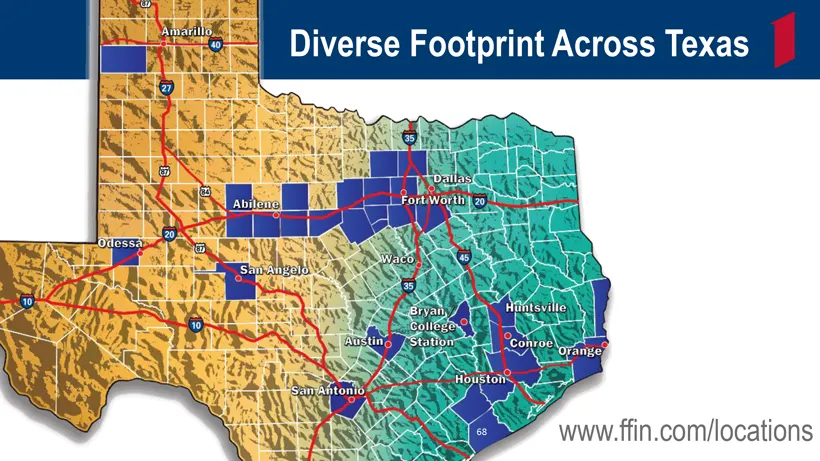
© www.ffin.com/locations

Slide 69: New Locations and Buildings
TEXAS —— For 130 Years —— New Locations and Buildi
Slide 70: Mortgage Office
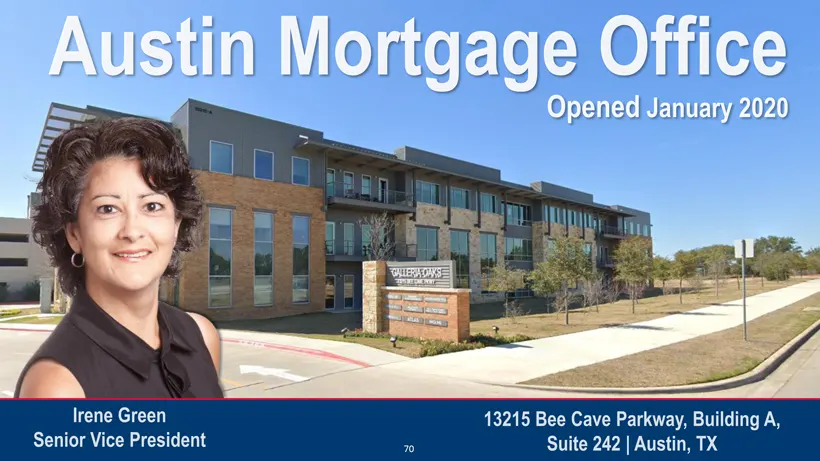
n Mortgage Office Opened January 2020 Irene Green 13215 Bee Cave Parkway, Building A, Senior Vice President 70 Suite 242 | Austin, TX
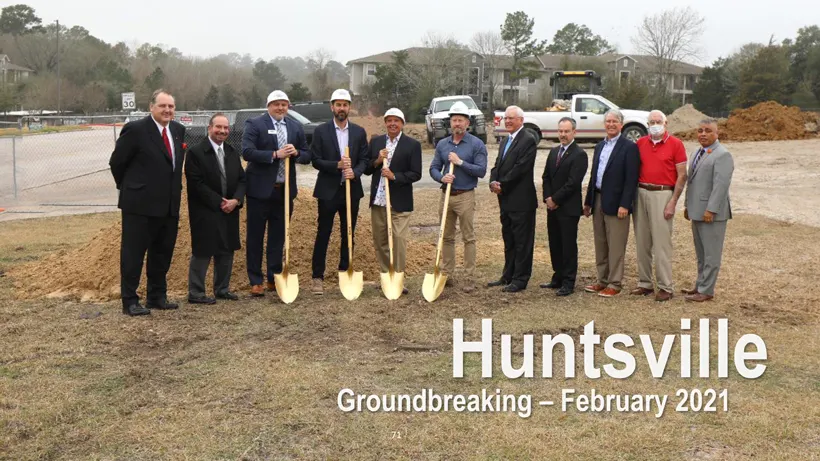
Slide 71: Huntsville Groundbreaking
February 2021 Huntsville” _- Groundbreaking
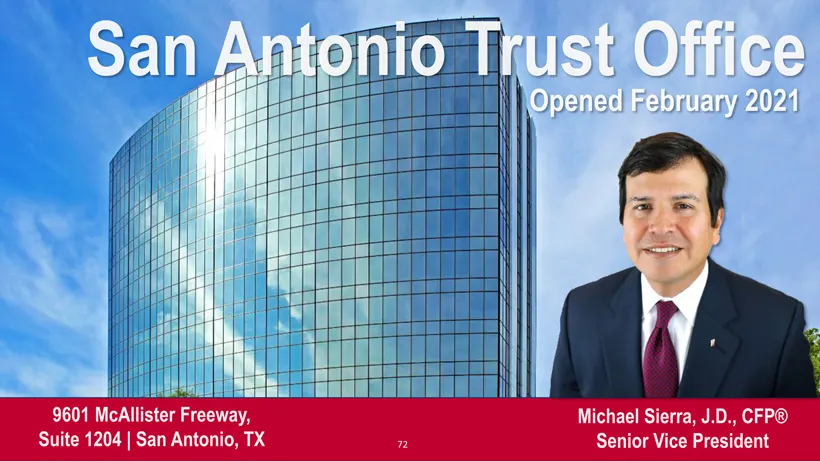
Slide 72: San Antonio Office
9601 McAllister Freeway, Michael Sierra, J.D., CFP© Suite 1204 | San Antonio, TX Senior Vice President
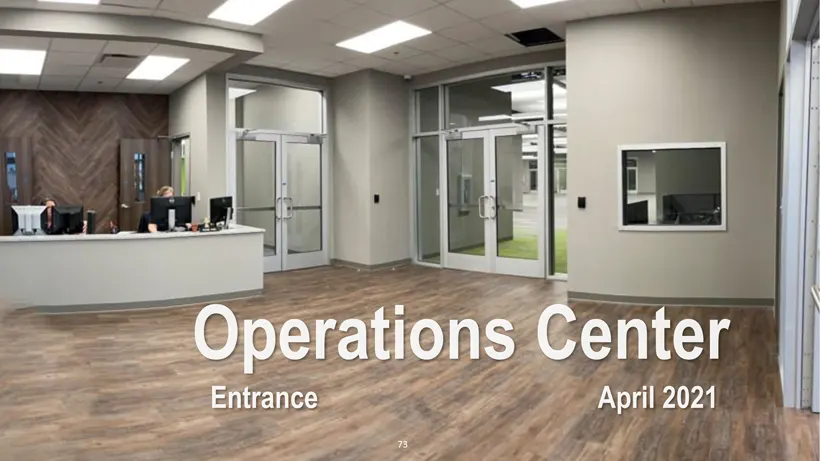
Slide 73: Operations Center Entrance
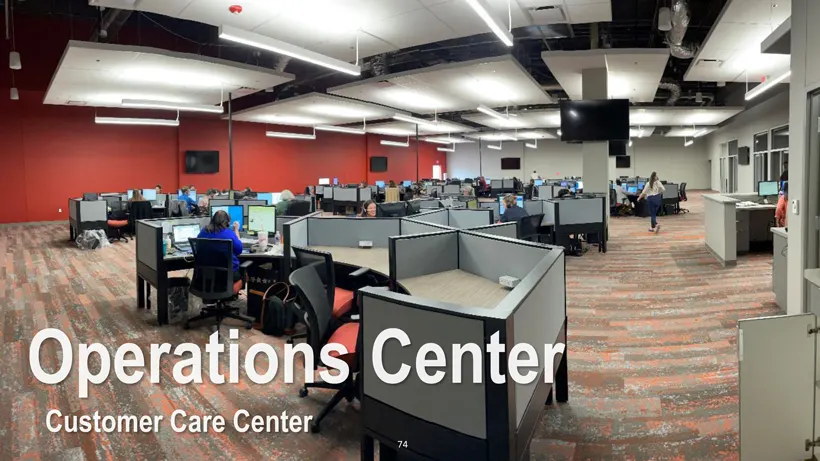
Slide 74: Operations Center Customer Care Center
Slide 75: Texas Strong For Years: Management Changes
TEXAS —— For 130 Years —— Management Ch;
Slide 76: Management Changes May 2020
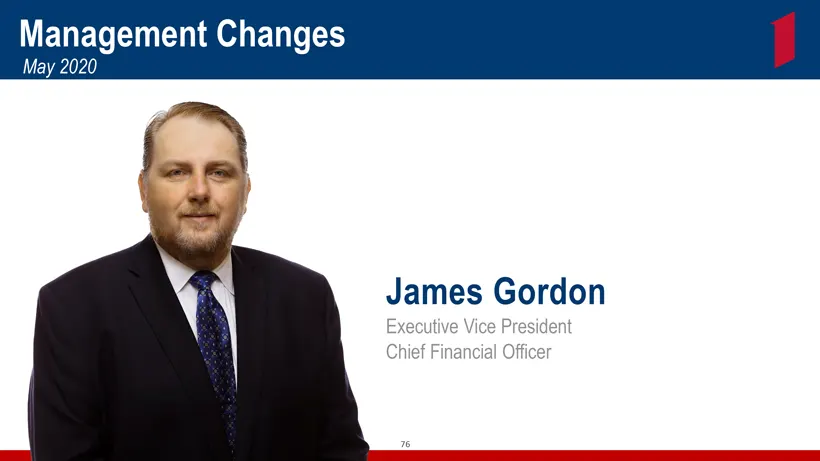
Management Changes May 2020 James Gordon Executive Vice President Chief Financial Officer 76
Slide 77: Management Changes May 2020
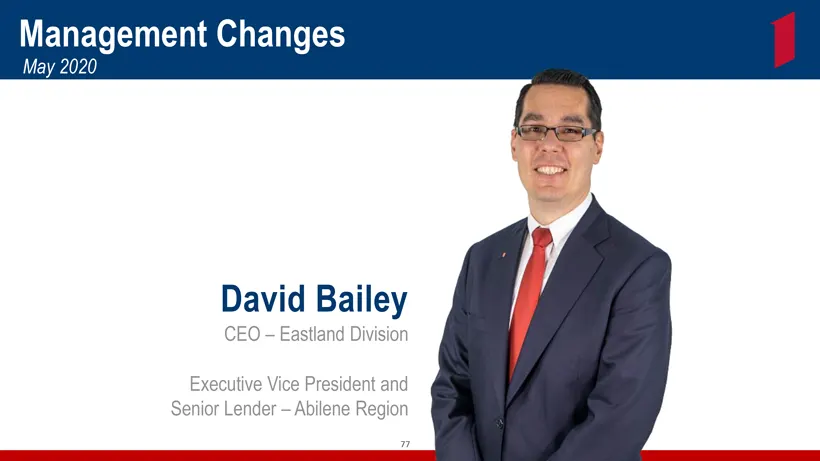
Management Changes May 2020 David Bailey CEO – Eastland Division Executive Vice President and Senior Lender – Abilene Region 77
Slide 78: Management Changes May 2020
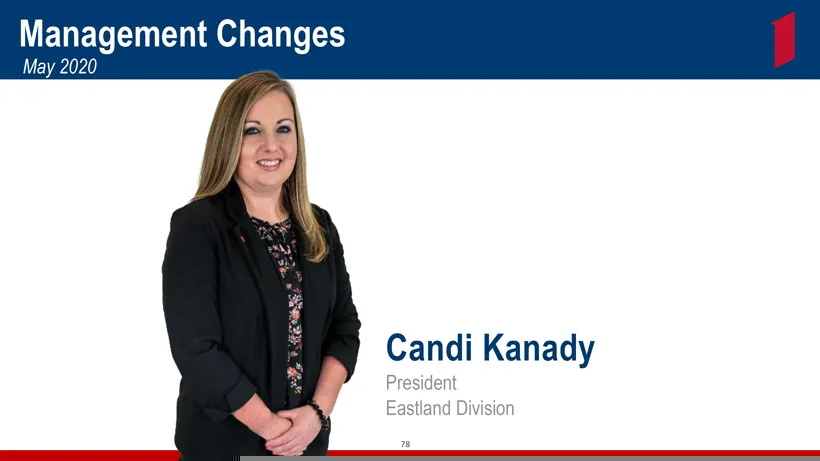
Management Changes May 2020 Candi Kanady President Eastland Division 78
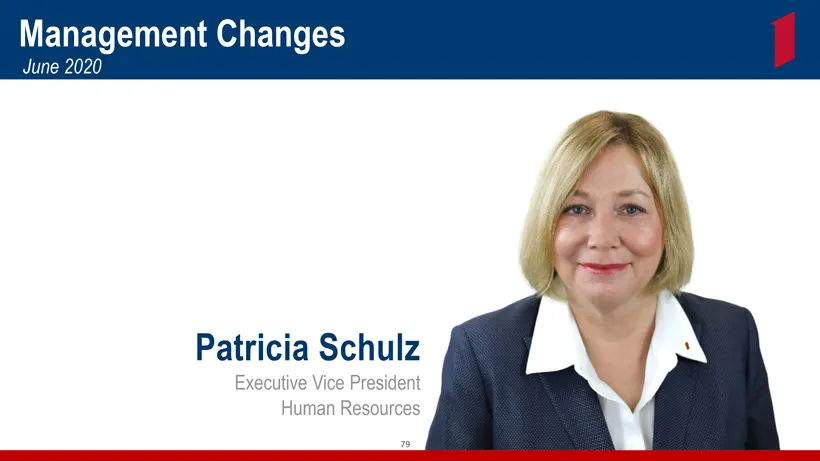
Slide 79: Management Changes June 2020
Management Changes June 2020 jm =\\ \ h=h Patricia Schulz /
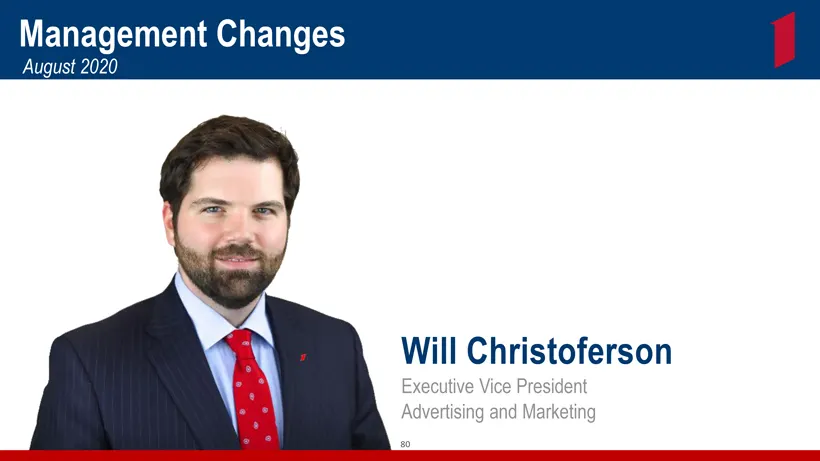
Slide 80: Management Changes August 2020
Management Changes August 2020 Will Christoferson Executive Vice President Advertising and Marketing 80
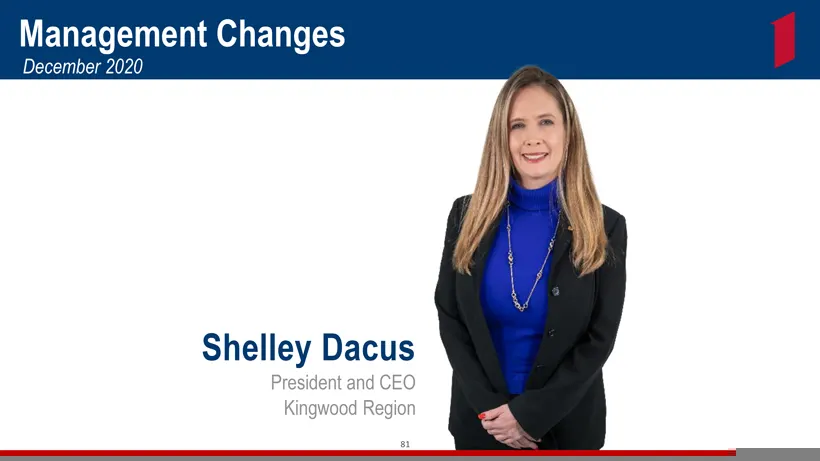
Slide 81: Management Changes December 2020
Management Changes December 2020 Shelley Dacus President and CEO Kingwood Region 81
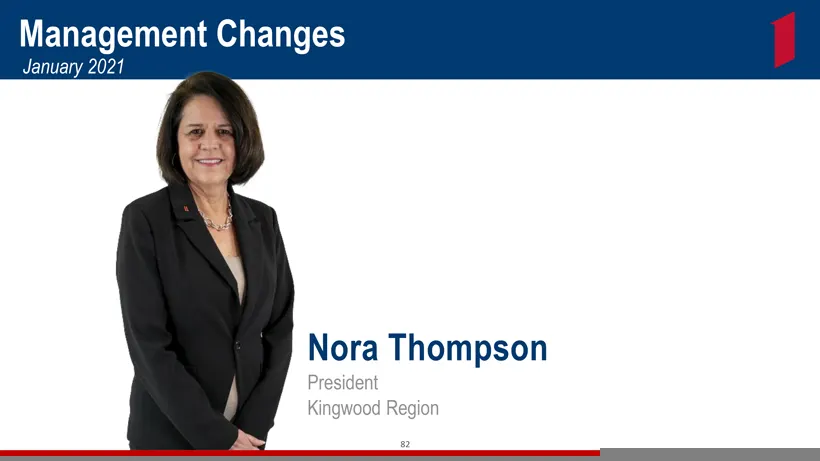
Slide 82: Management Changes January 2021
Management Changes January 2021 Nora Thompson President Kingwood Region 82
Slide 83: The First Financial Training Program
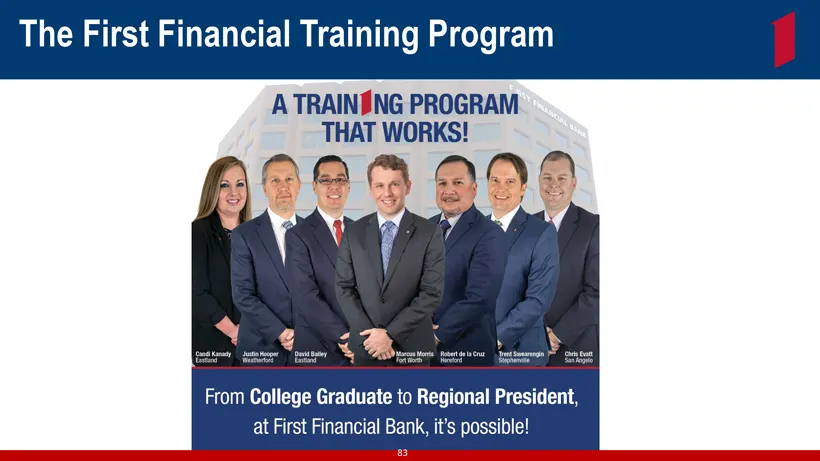
The First Financial Training Program
Slide 84: The 2020 Walter Johnson Award
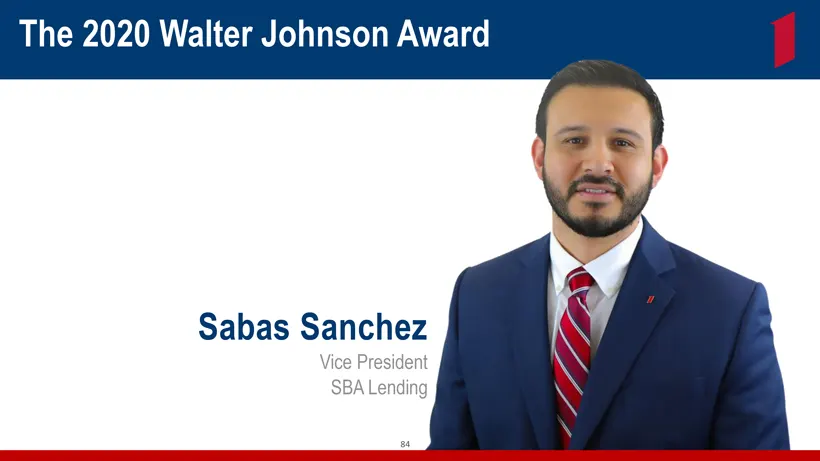
The 2020 Walter Johnson Award Sabas Sanchez
Slide 85: Diversity Inclusion
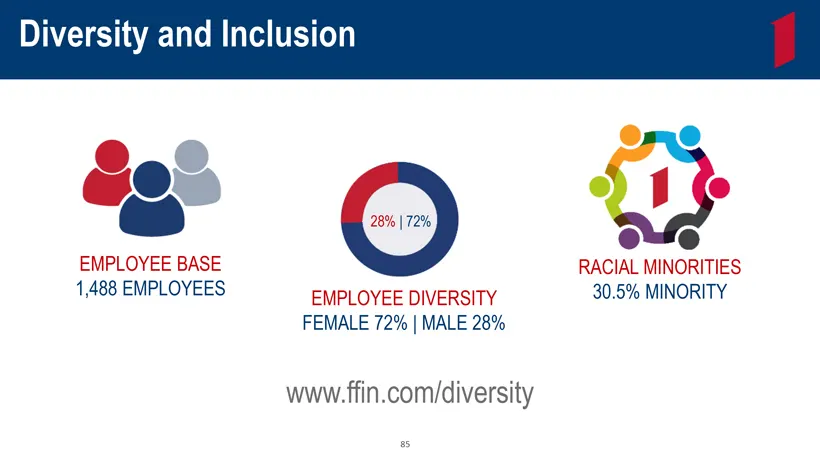
Diversity Inclusion ra é @ 28% | 72% owe EMPLOYEE BASE RACIAL MINORITIES 1,488 EMPLOYEES EMPLOYEE DIVERSITY hs FEMALE 72% | MALE 28% www.ffin.com/diversity
Slide 86: Annual Dividends Declared per Share
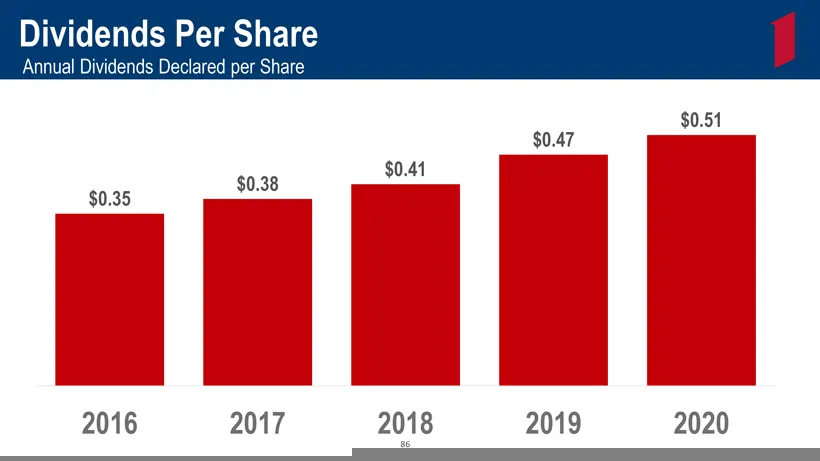
Dividends Per Share Annual Dividends Declared per Share $0.51 0.47 $0.41 $0.38 $0.35 2016 2017 2018 2019 2020 86
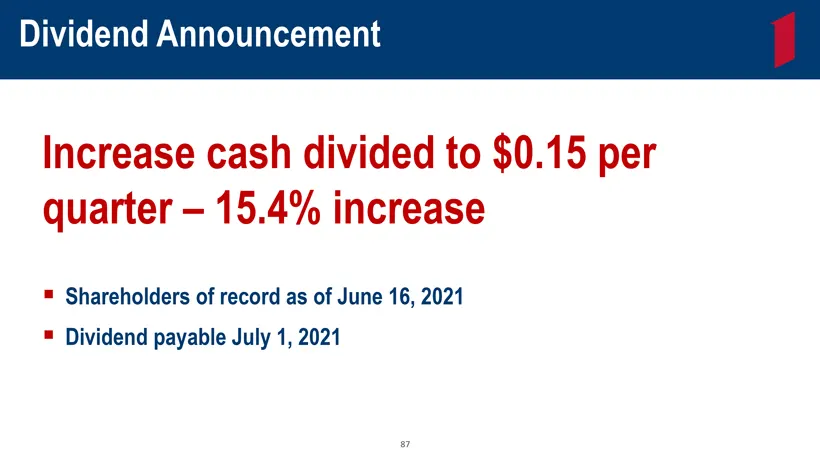
Slide 87: Dividend Announcement
Dividend Announcement cash divided to $0.15 per 15.4% increase Shareholders of record as of June 16, 2021 Dividend payable July 1, 2021 87
Slide 88: Texas Strong For Years: Looking Ahead
TEXAS —— For 130 Years —— Lookin,

Slide 89: First Financial Bankshares, Inc.
Source: SEC EDGAR · 8-K filed Apr 27, 2021
More decks from First Financial Bankshares, Inc.
 Shareholder Meeting (2026)98 slides · Aug 6, 2026
 Investor Presentation (2026)40 slides · Aug 6, 2026
 Investor Presentation (2026)39 slides · Aug 6, 2026
 Q2 2026 Earnings Presentation39 slides · July 2026
 Shareholder Meeting (April 2026)98 slides · Apr 30, 2026
 Shareholder Meeting (April 2025)106 slides · Apr 30, 2025