Erbud S.A. · GPW:ERB
Erbud — H1 2026 Earnings Presentation
49 slides from Erbud's earnings presentation, 2026

Slide 1: Investor Presentation H1 2026
Investor Presentation H1 2026
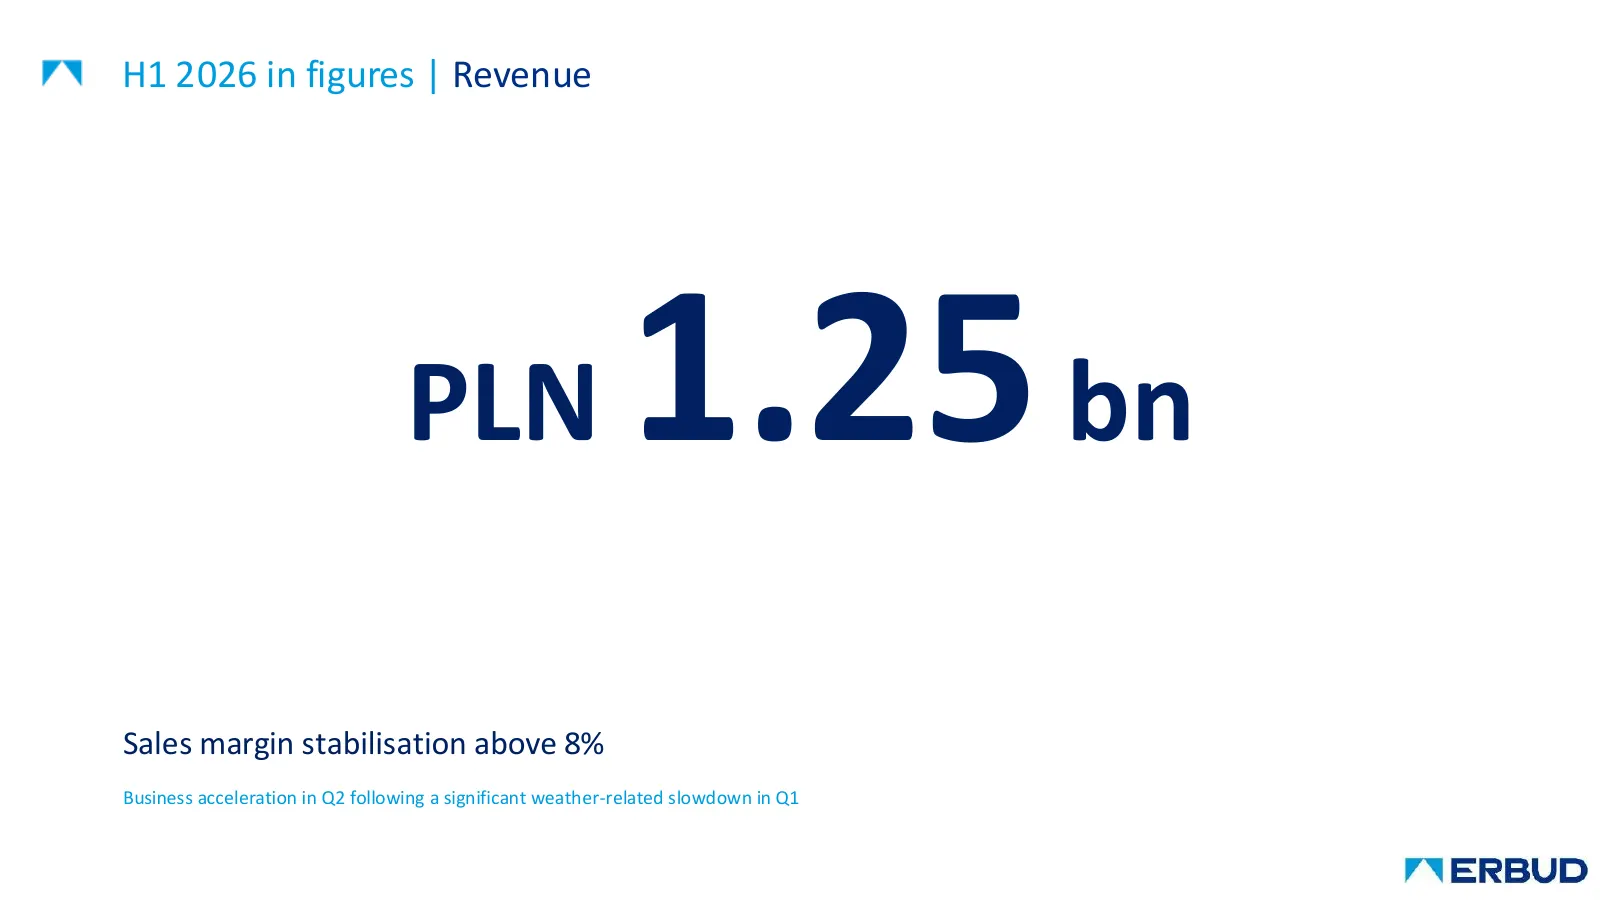
Slide 2: H1 2026 in figures | Revenue
H1 2026 in figures | Revenue PLN 1.25 bn Sales margin stabilisation above 8% Business acceleration in Q2 following a significant weather-related slowdown in Q1
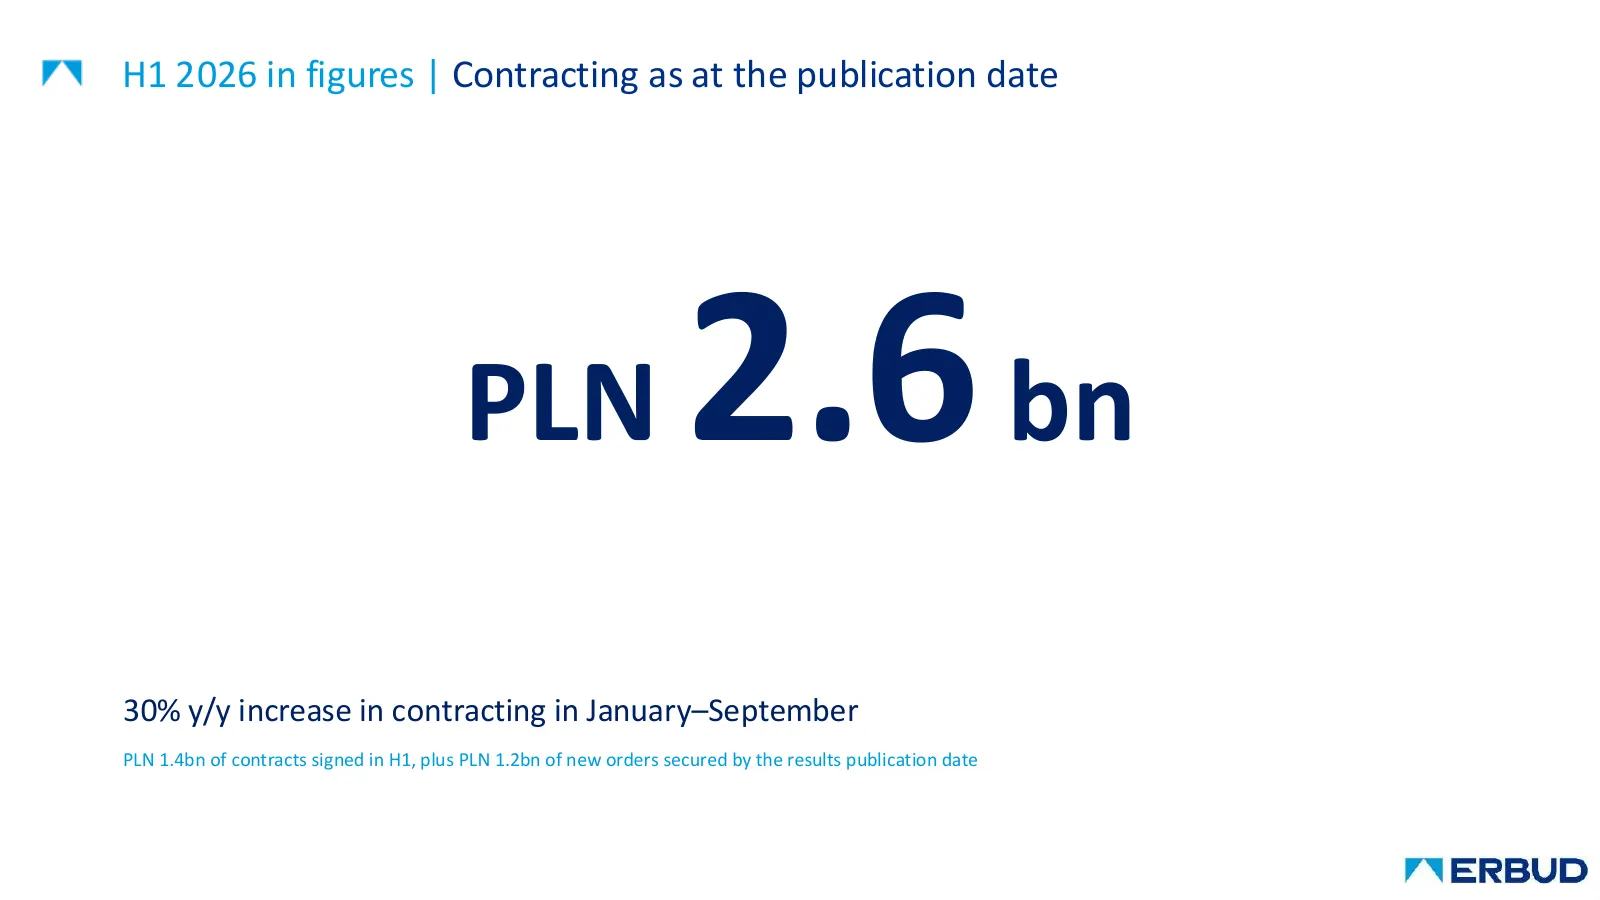
Slide 3: H1 2026 in figures | Contracting as at the publication date
H1 2026 in figures | Contracting as at the publication date PLN 2.6 bn 30% y/y increase in contracting in January–September PLN 1.4bn of contracts signed in H1, plus PLN 1.2bn of new orders secured by the results publication date
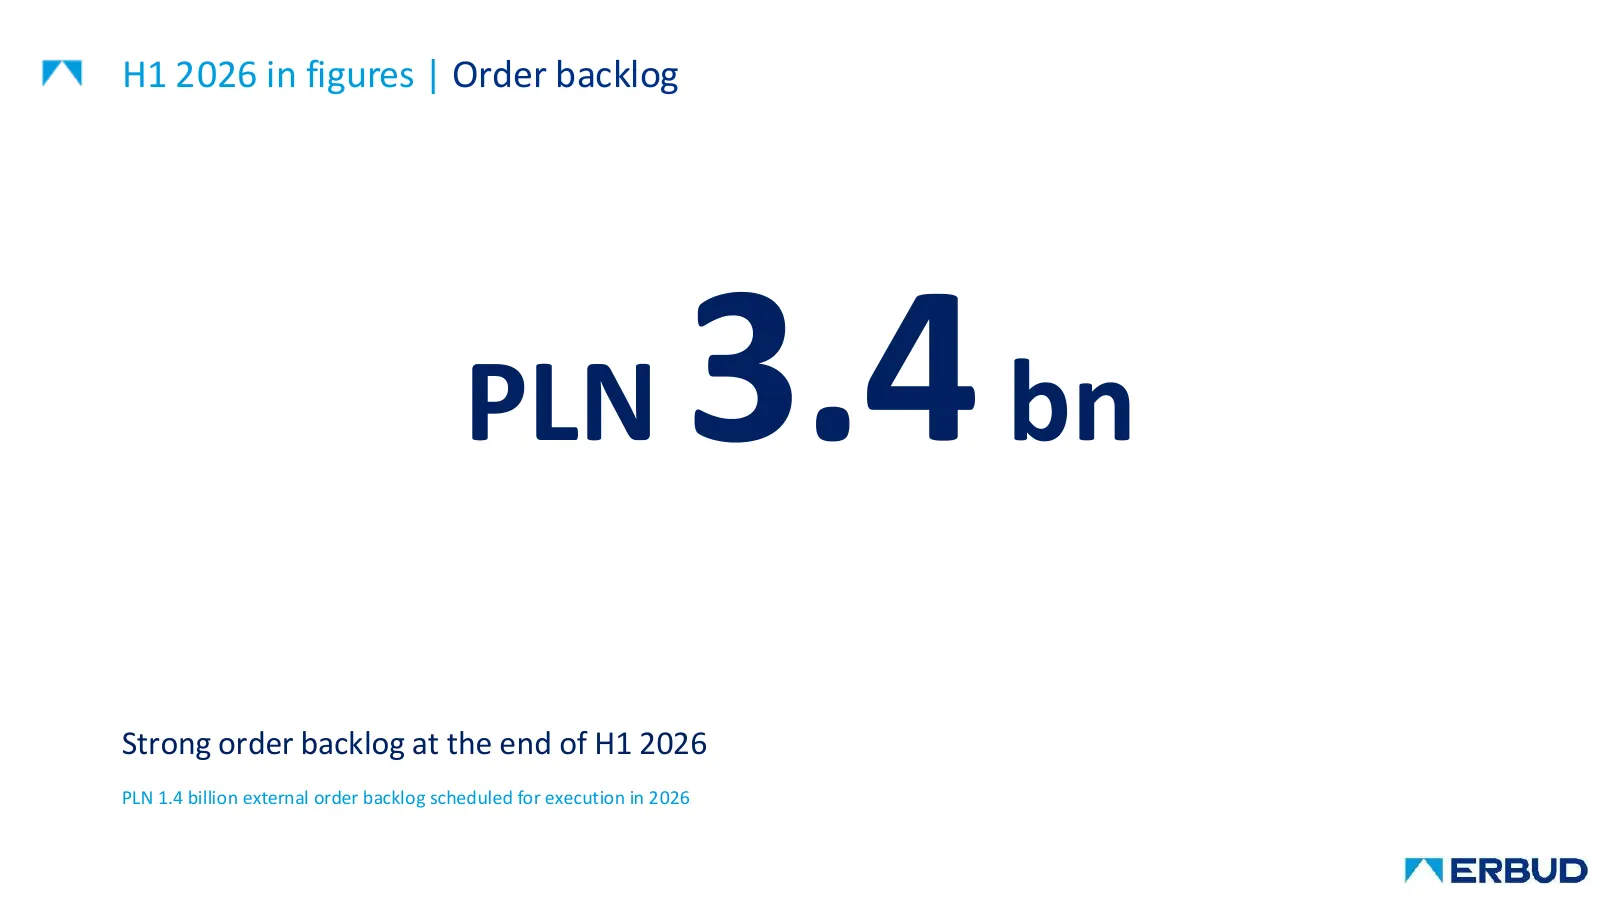
Slide 4: H1 2026 in figures | Order backlog
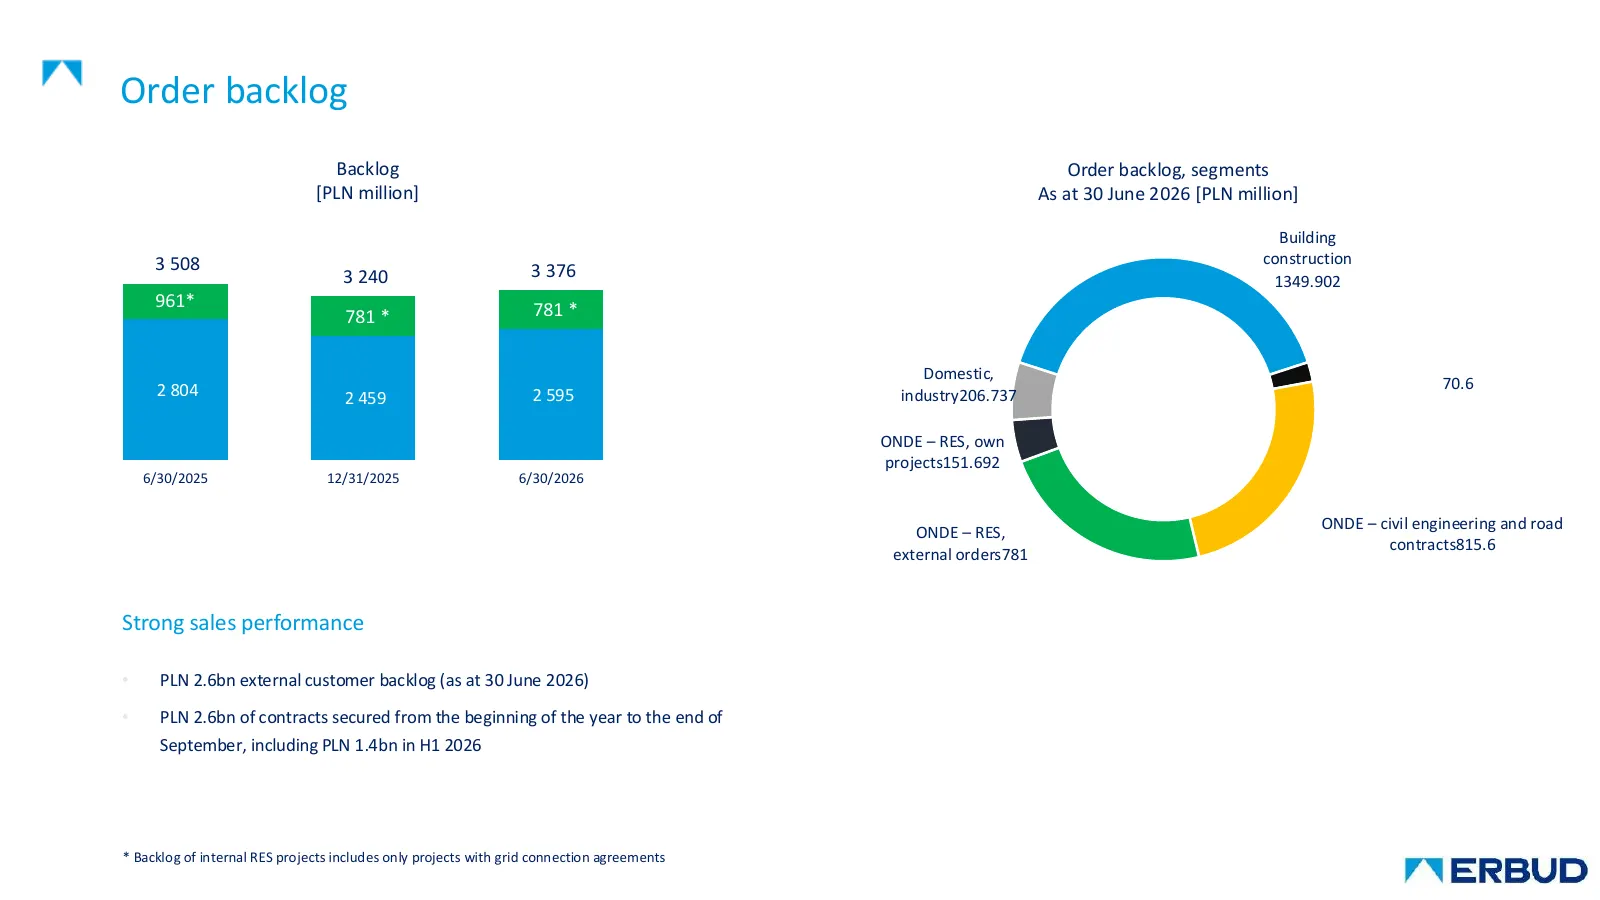
H1 2026 in figures | Order backlog PLN 3.4 bn Strong order backlog at the end of H1 2026 PLN 1.4 billion external order backlog scheduled for execution in 2026
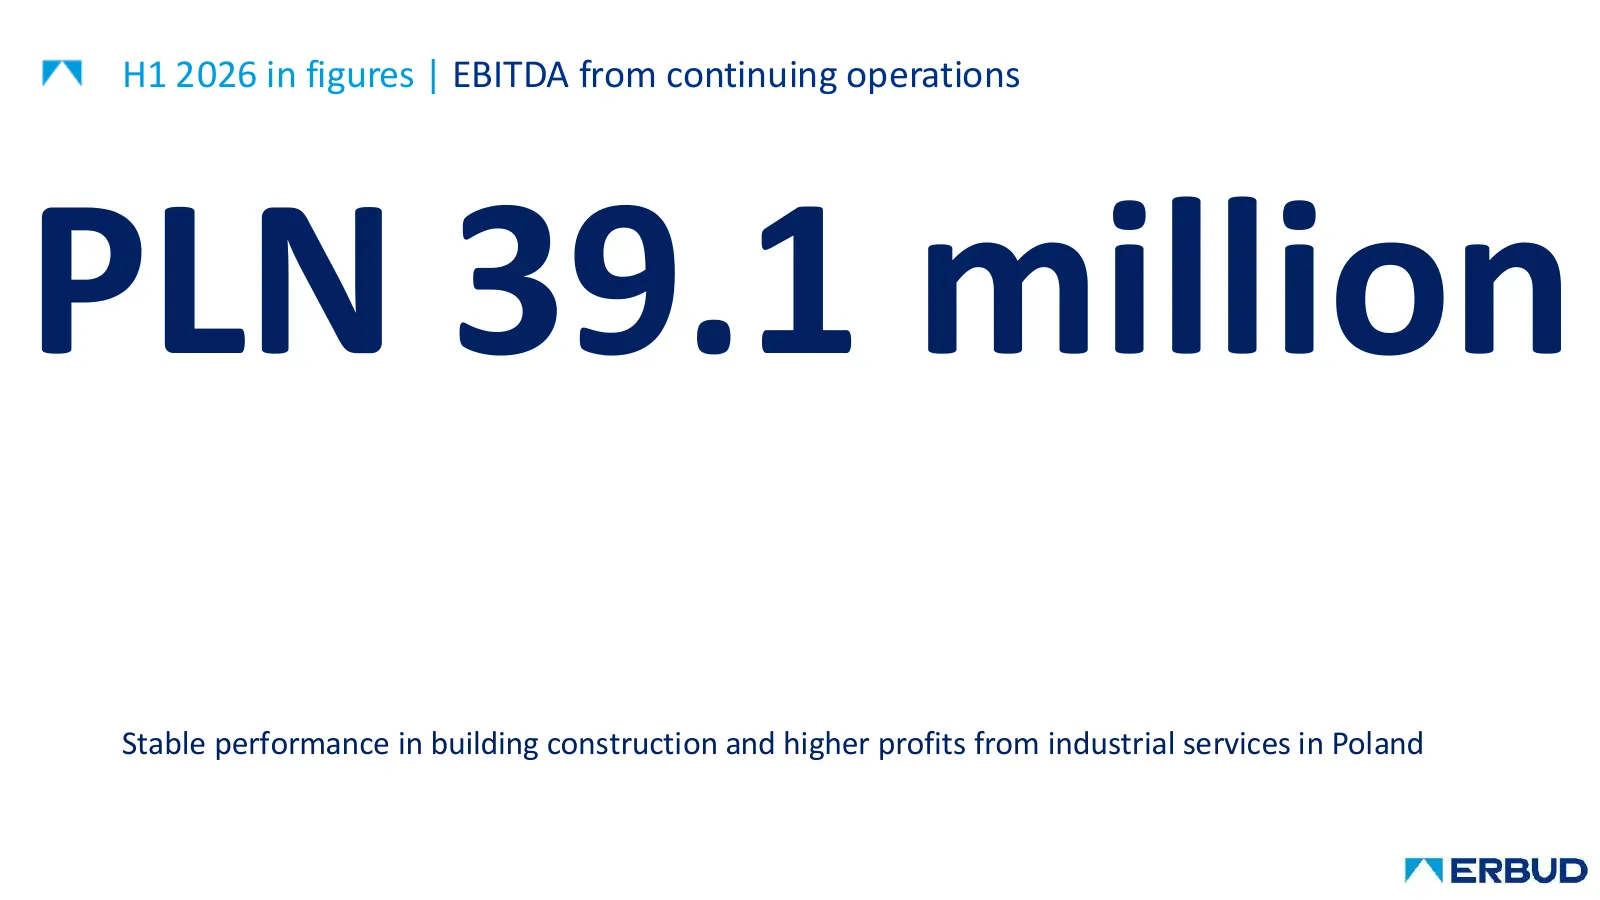
Slide 5: H1 2026 in figures | EBITDA from continuing operations
H1 2026 in figures | EBITDA from continuing operations PLN 39.1 million Stable performance in building construction and higher profits from industrial services in Poland
Slide 6: Agenda
AGENDANDA • Market environment • Challenges and opportunities • Financial results • The four divisions of the ERBUD Group • Statement of financial situation • Summary
Slide 7: Macroeconomic situation | GDP and CPI
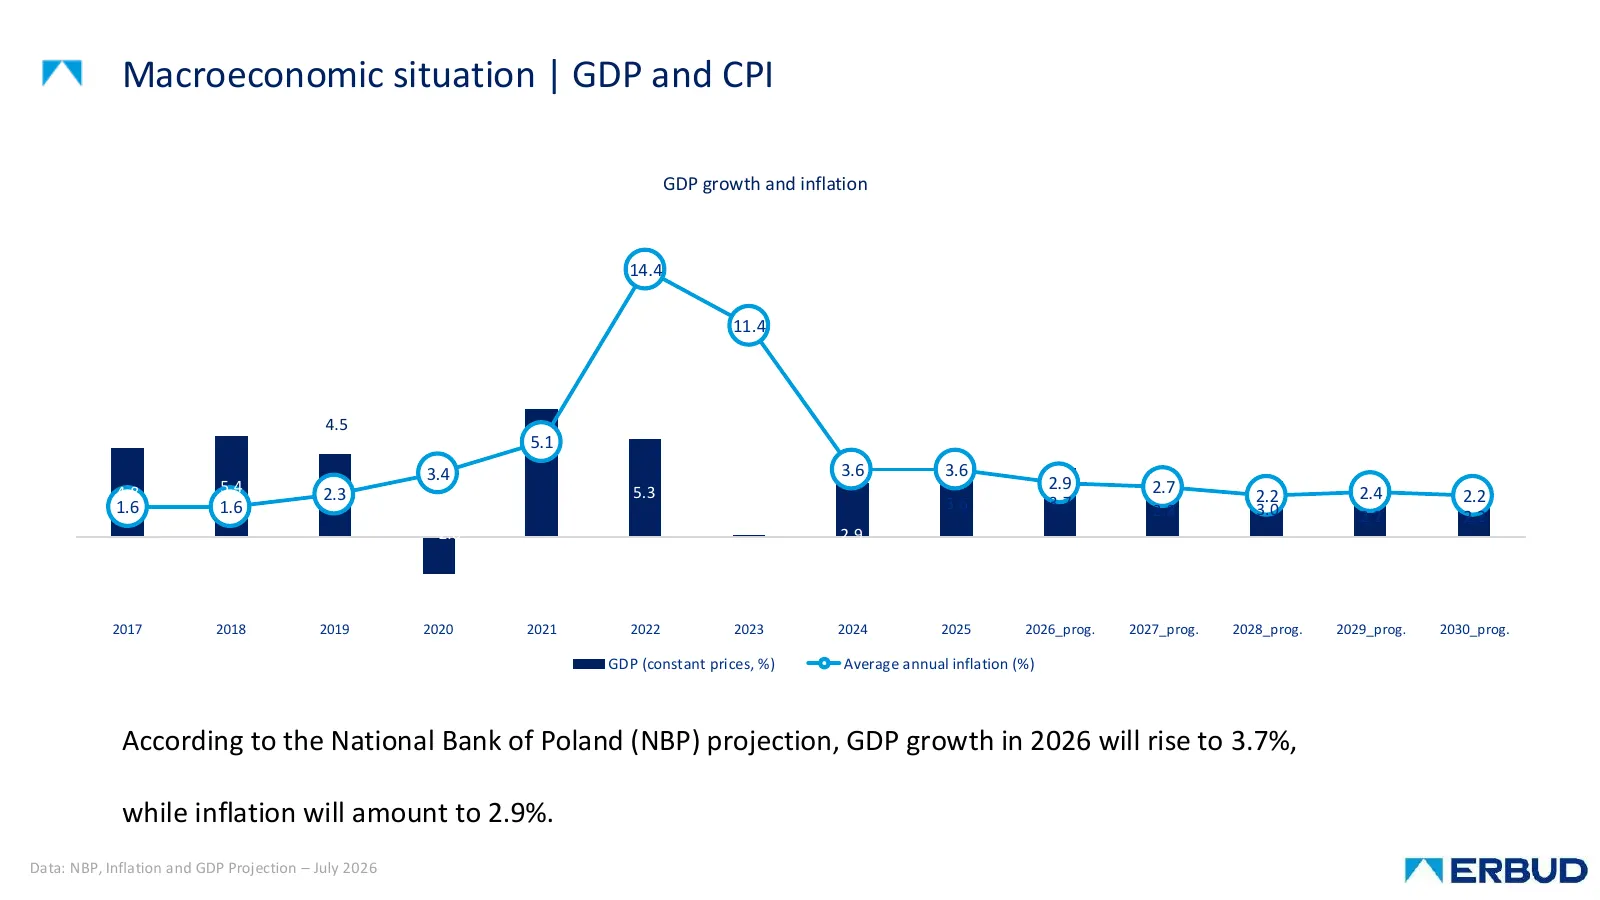
Macroeconomic situation | GDP and CPI GDP growth and inflation 14.4 11.4 4.5 5.1 6.9 3.4 3.6 3.6 4.8 5.4 5.3 2.9 2.7 2.4 2.3 3.6 3.7 2.2 2.2 1.6 1.6 2.8 3.0 2.2 2.2 -2.0 2.9 0.1 2017 2018 2019 2020 2021 2022 2023 2024 2025 2026_prog. 2027_prog. 2028_prog. 2029_prog. 2030_prog. GDP (constant prices,
Slide 8: Macroeconomic situation | Construction and assembly output
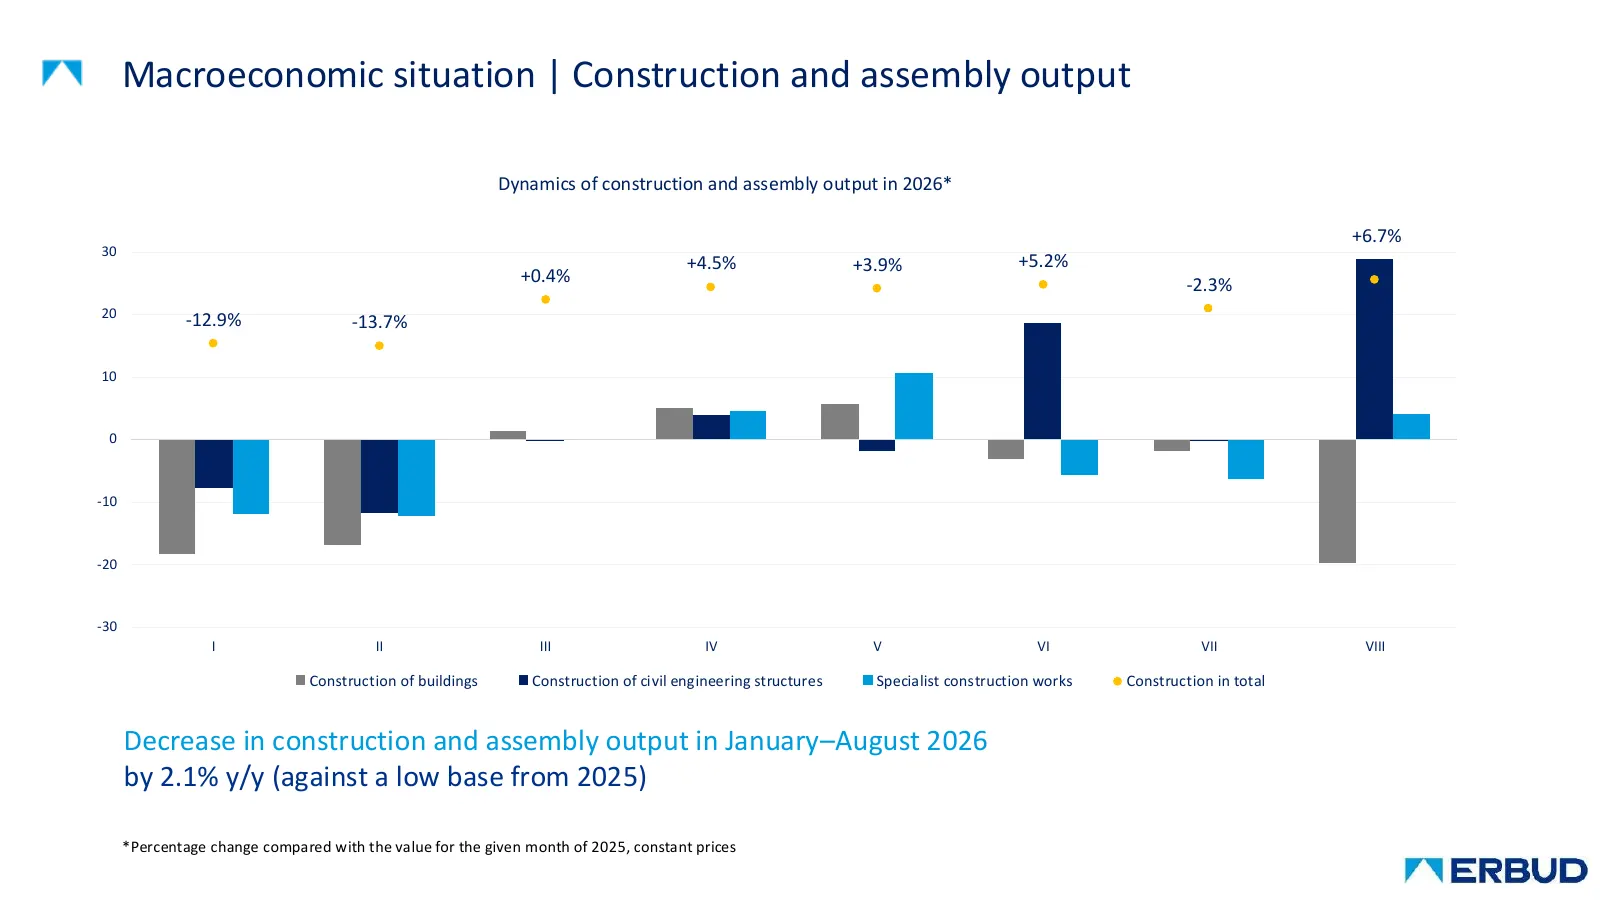
Macroeconomic situation | Construction and assembly output Dynamics of construction and assembly output in 2026* +6.7% 30 +4.5% +3.9% +5.2% +0.4% -2.3% 20 -12.9% -13.7% 10 0 -10 -20 -30 I II III IV V VI VII VIII Construction of buildings Construction of civil engineering structures Specialist constr
Slide 9: Macroeconomic situation | Business climate in construction
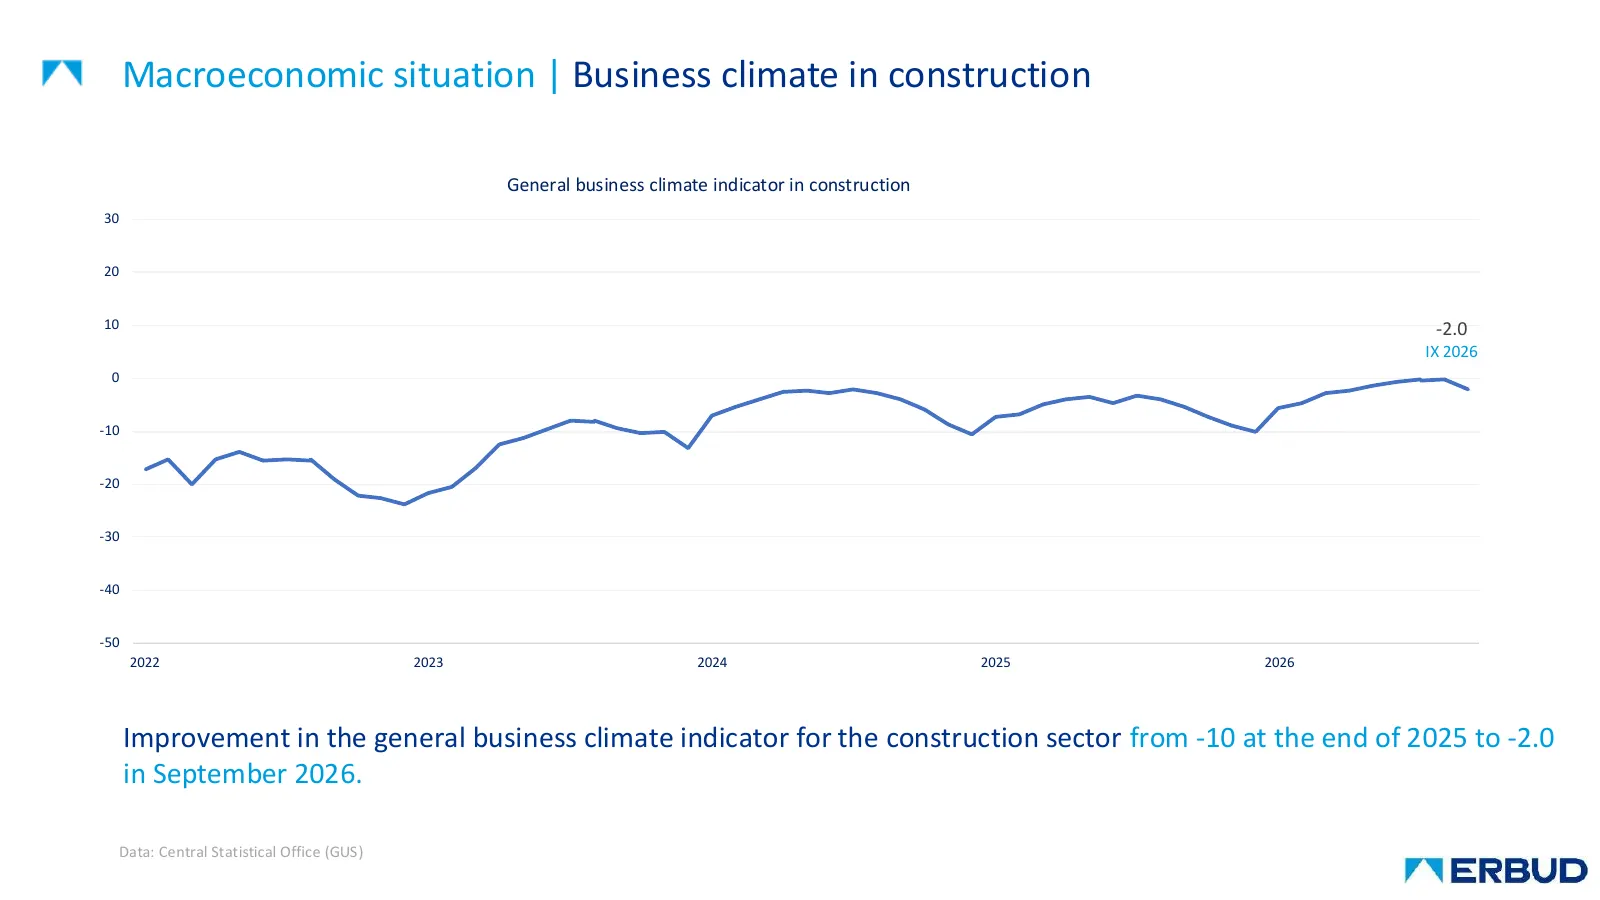
Macroeconomic situation | Business climate in construction General business climate indicator in construction 30 20 10 -2.0 IX 2026 0 -10 -20 -30 -40 -50 2022 2023 2024 2025 2026 Improvement in the general business climate indicator for the construction sector from -10 at the end of 2025 to -2.0 in
Slide 10: Challenges
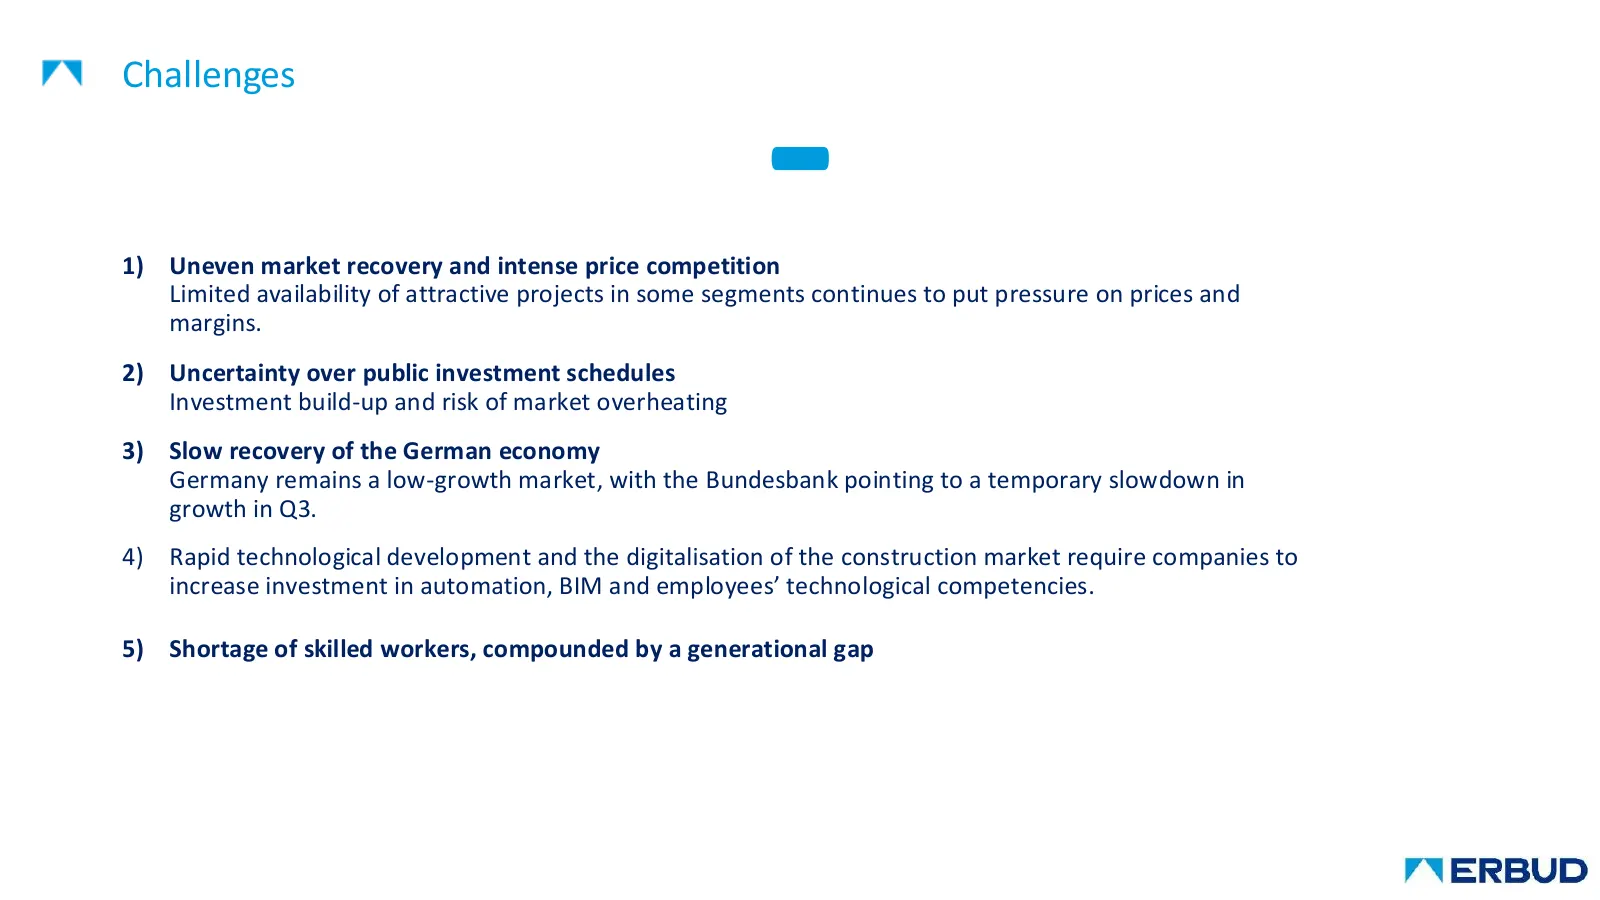
- Challenges 1) Uneven market recovery and intense price competition Limited availability of attractive projects in some segments continues to put pressure on prices and margins. 2) Uncertainty over public investment schedules Investment build-up and risk of market overheating 3) Slow recovery of th
Slide 11: Opportunities
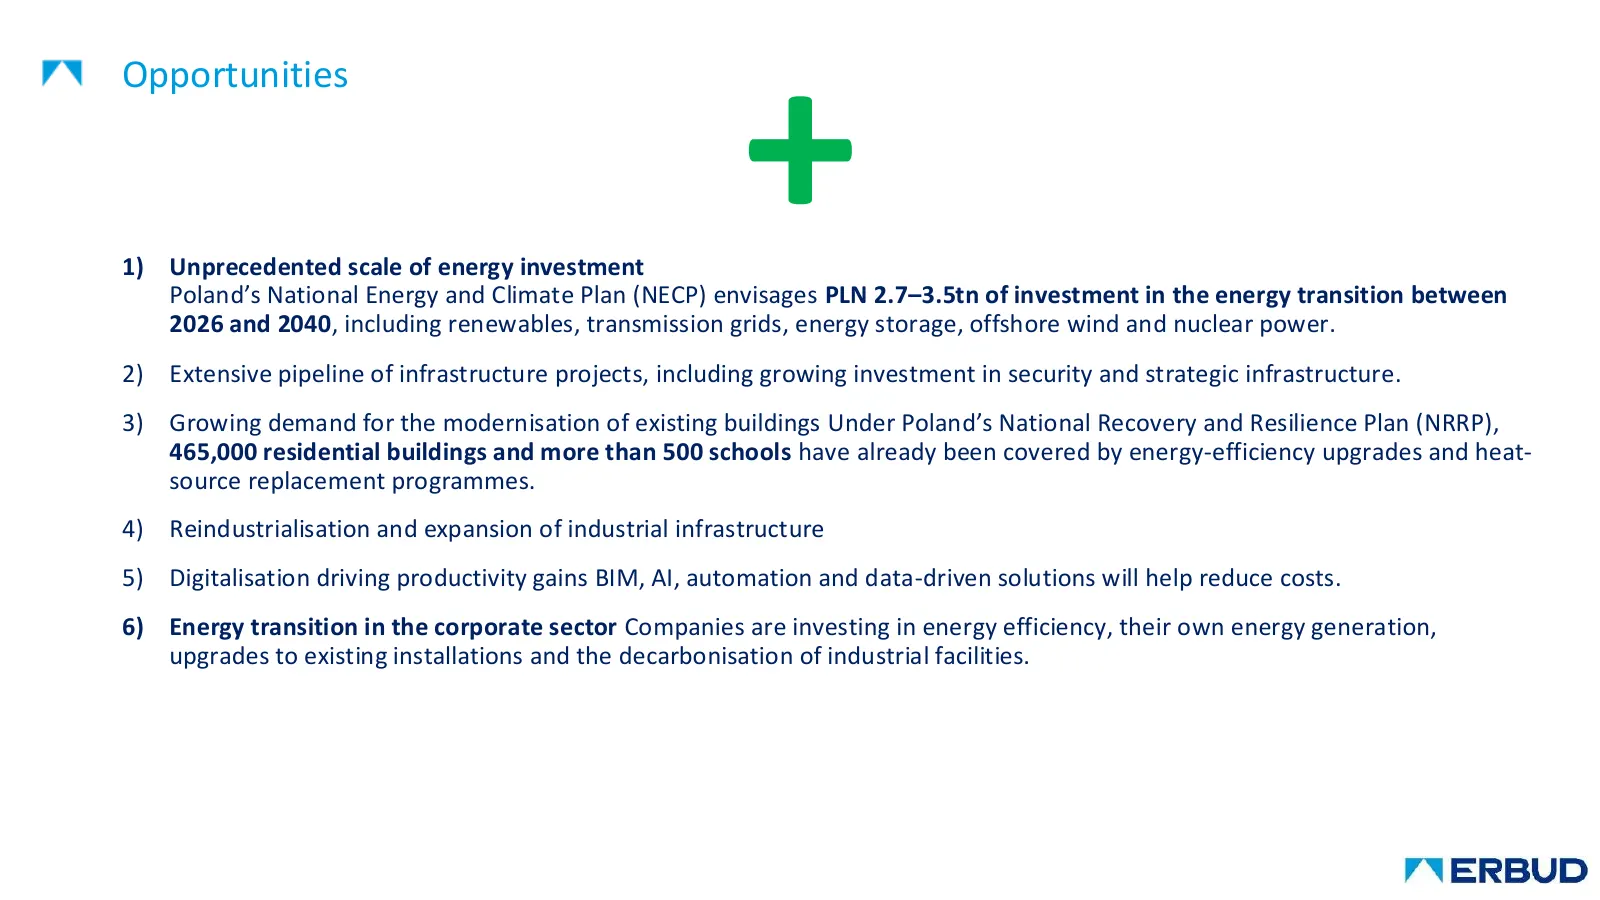
+ Opportunities 1) Unprecedented scale of energy investment Poland’s National Energy and Climate Plan (NECP) envisages PLN 2.7–3.5tn of investment in the energy transition between 2026 and 2040, including renewables, transmission grids, energy storage, offshore wind and nuclear power. 2) Extensive p
Slide 12: Financial results ERBUD Group H1 2026
Financial results ERBUD Group H1 2026 2026
Slide 13: Results from continuing operations – H1 2026
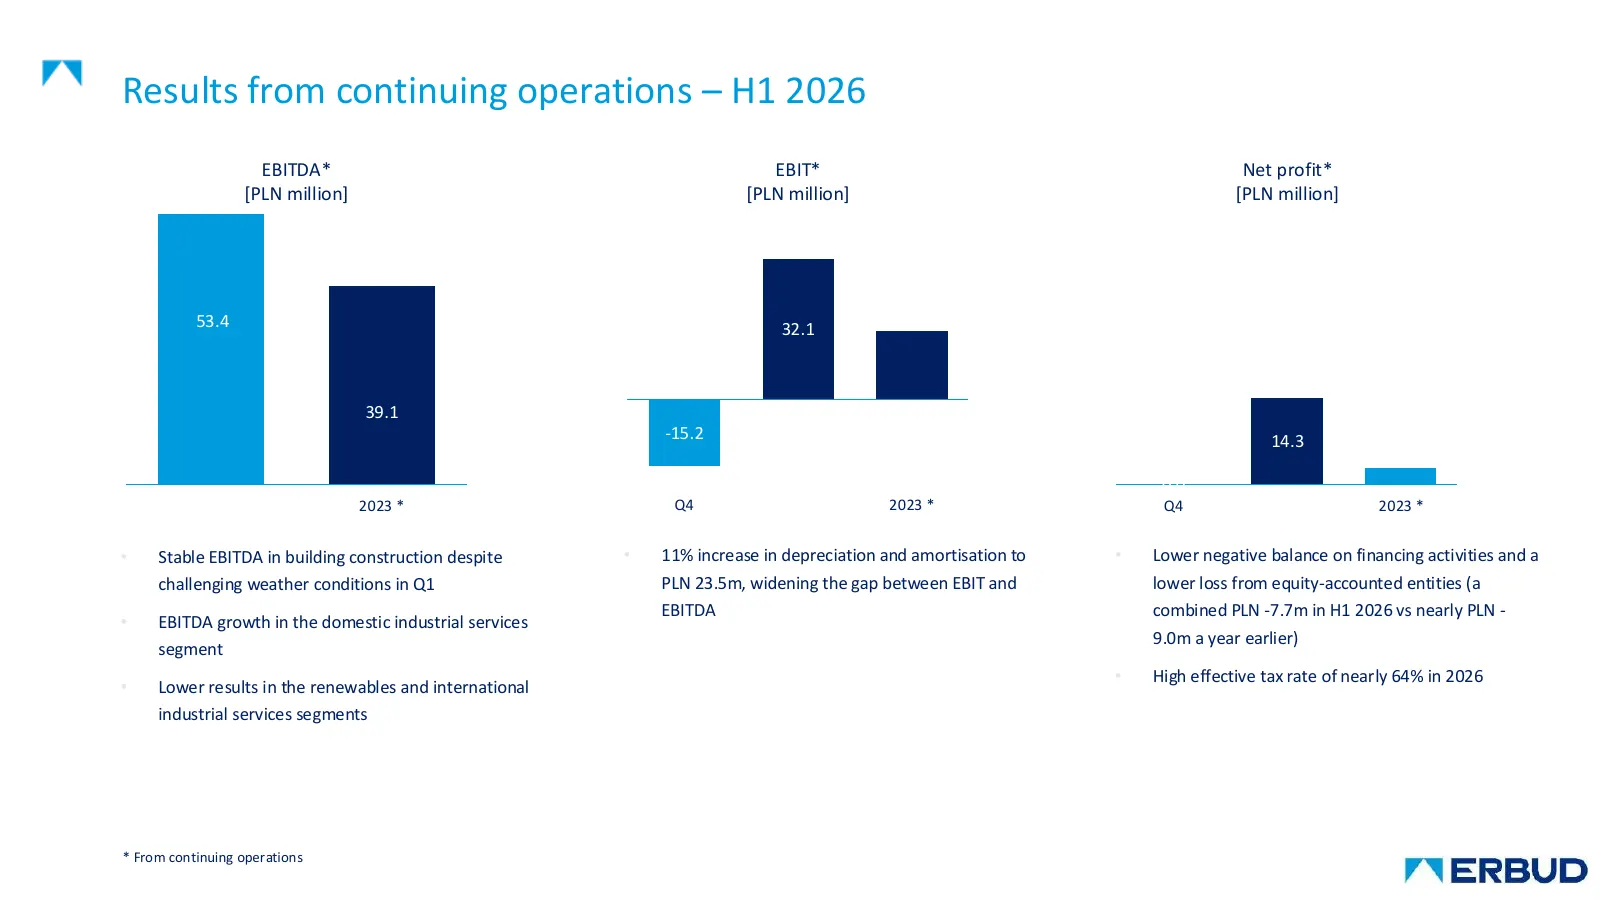
Results from continuing operations – H1 2026 EBITDA* EBIT* Net profit* [PLN million] [PLN million] [PLN million] 53.4 32.1 39.1 -15.2 14.3 0.0 2023 * Q4 2023 * Q4 2023 * • Stable EBITDA in building construction despite • 11% increase in depreciation and amortisation to • Lower negative balance on fi
Slide 14: Results from continuing operations – Q2 2026
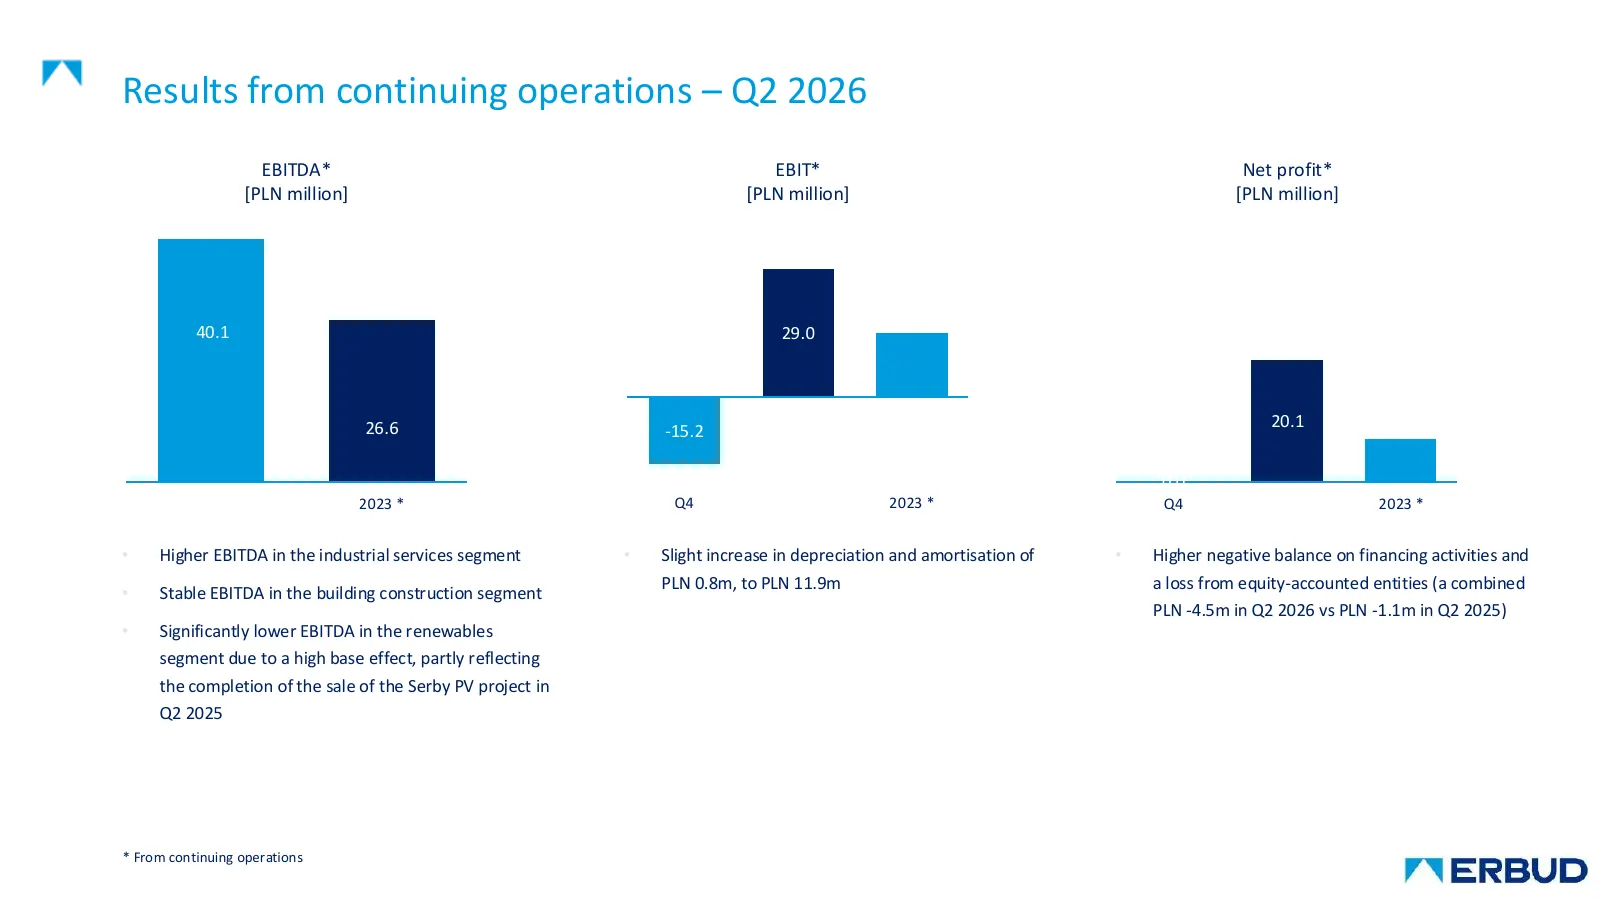
Results from continuing operations – Q2 2026 EBITDA* EBIT* Net profit* [PLN million] [PLN million] [PLN million] 40.1 29.0 26.6 20.1 -15.2 0.0 2023 * Q4 2023 * Q4 2023 * • Higher EBITDA in the industrial services segment • Slight increase in depreciation and amortisation of • Higher negative balance
Slide 15: Revenue
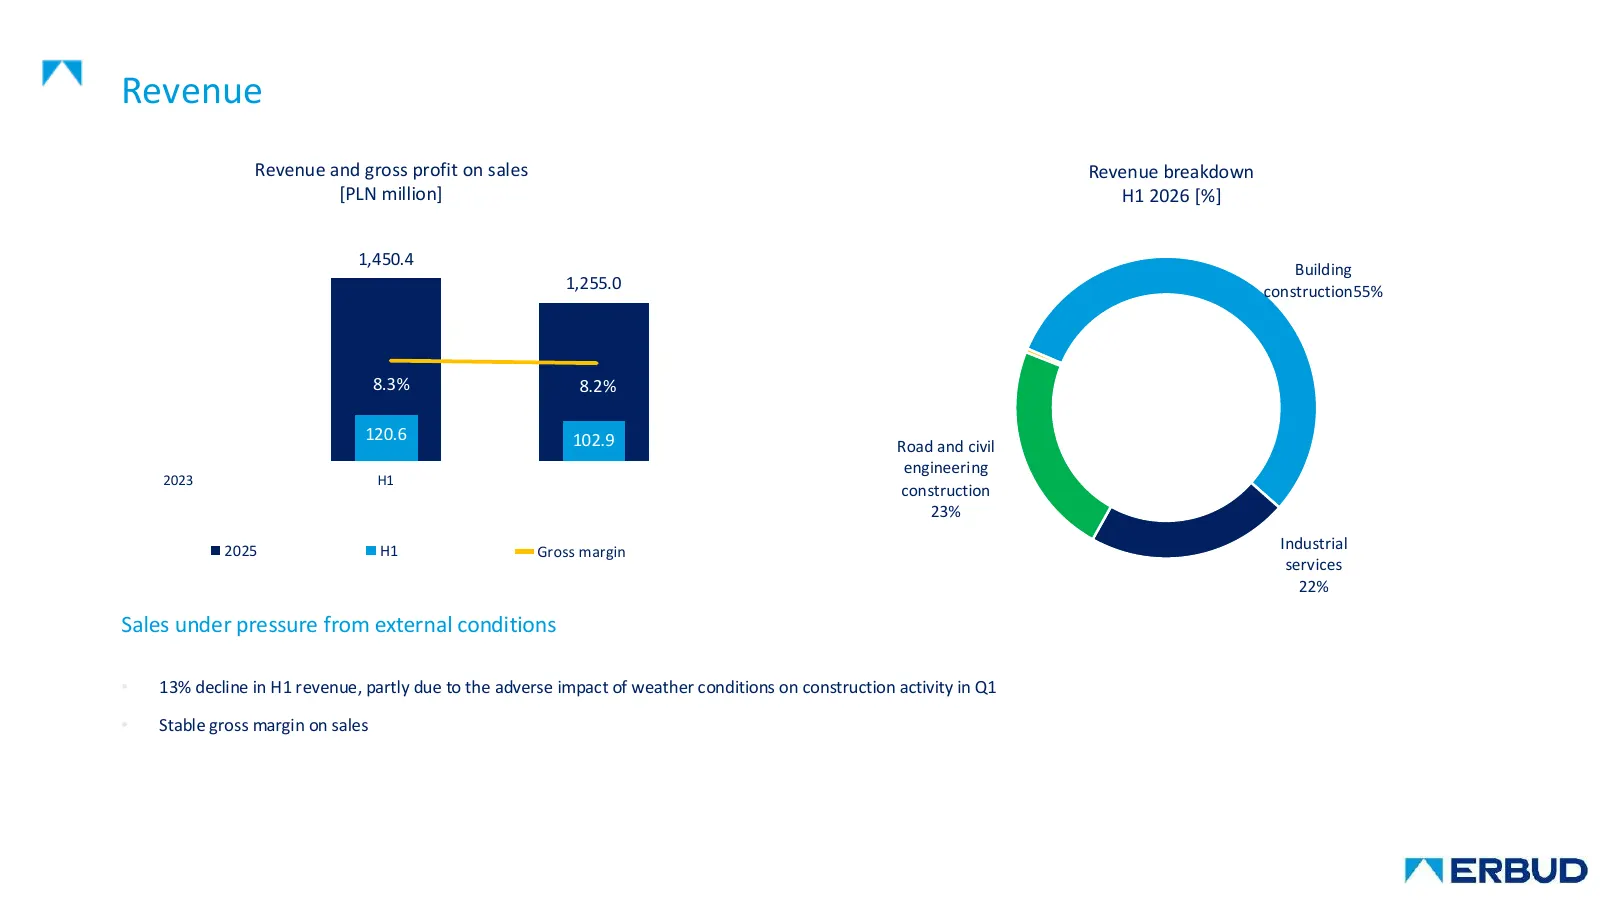
Revenue Revenue and gross profit on sales Revenue breakdown [PLN million] H1 2026 [%] 1,450.4 Building 1,255.0 construction55% 8.3% 8.2% 120.6 102.9 Road and civil engineering 2023 H1 construction 23% 2025 H1 Gross margin Industrial services 22% Sales under pressure from external conditions • 13% de
Slide 16: Borrowings
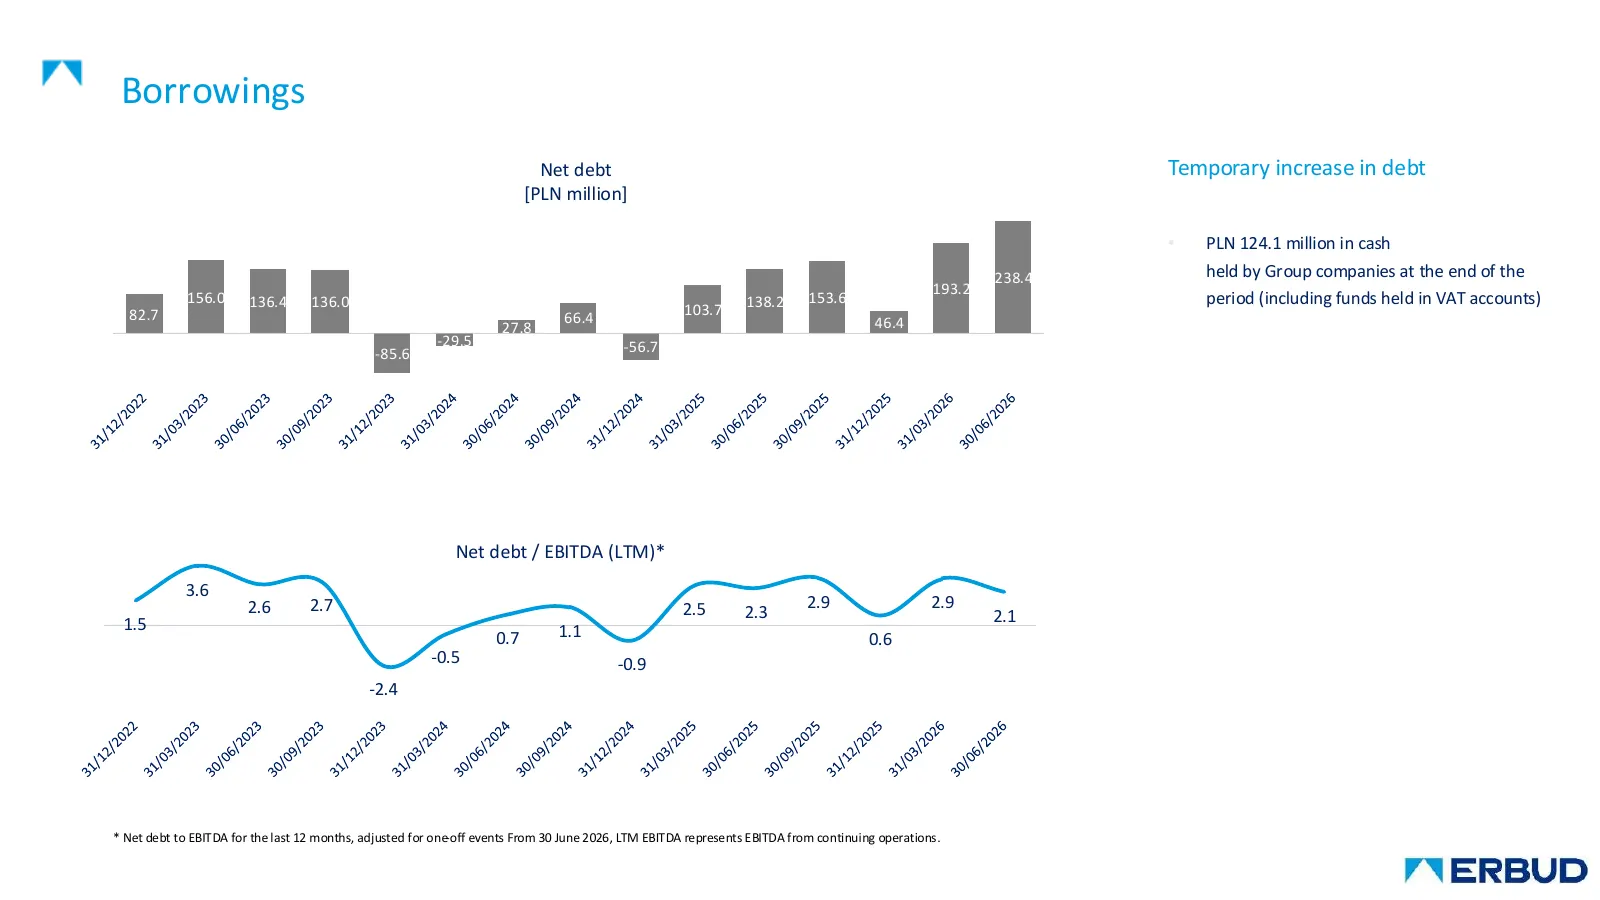
Borrowings Net debt Temporary increase in debt [PLN million] • PLN 124.1 million in cash 238.4 held by Group companies at the end of the 193.2 156.0 136.4 136.0 138.2 153.6 period (including funds held in VAT accounts) 82.7 103.7 66.4 46.4 27.8 -29.5 -56.7 -85.6 Net debt / EBITDA (LTM)* 3.6 2.6 2.7
Slide 17: Cash flows
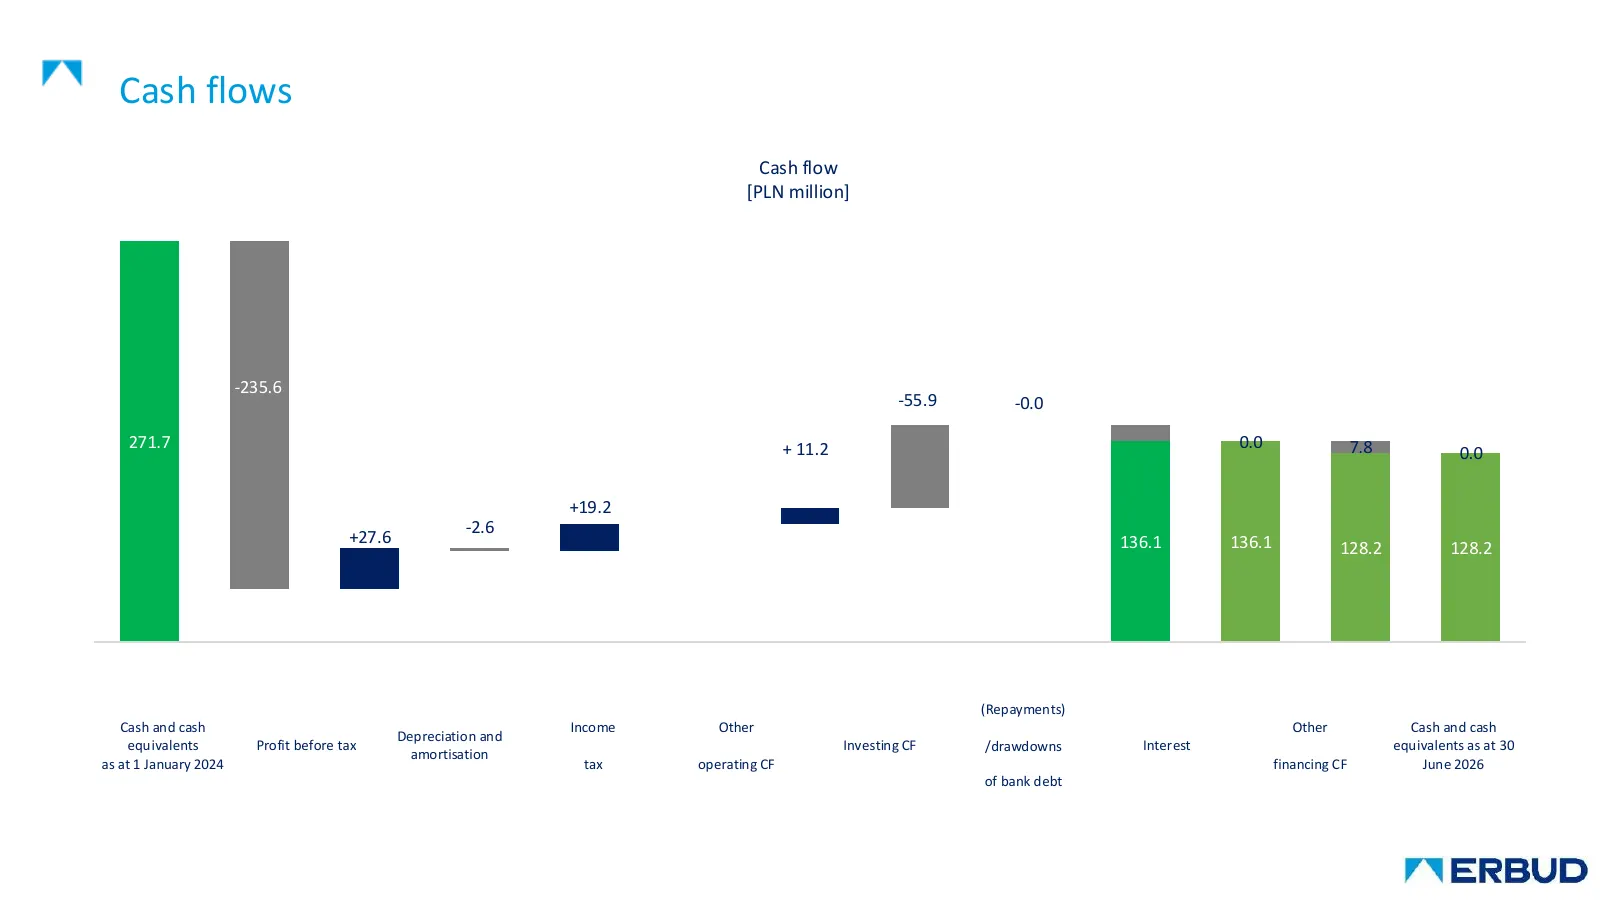
Cash flows Cash flow [PLN million] -235.6 -55.9 -0.0 271.7 + 11.2 0.0 7.8 0.0 +19.2 -2.6 147.4 +27.6 136.1 136.1 128.2 128.2 91.5 (Repayments) Cash and cash Income Other Other Cash and cash Depreciation and equivalents Profit before tax Investing CF /drawdowns Interest equivalents as at 30 amortisat
Slide 18: Order backlog
Order backlog Backlog Order backlog, segments [PLN million] As at 30 June 2026 [PLN million] Building 3 508 construction 3 240 3 376 1349.902 961* 781 * 781 * Domestic, 2 804 70.6 2 459 2 595 industry206.737 ONDE – RES, own projects151.692 6/30/2025 12/31/2025 6/30/2026 ONDE – civil engineering and
Slide 19
Slide 20: Three business divisions of the ERBUD Group
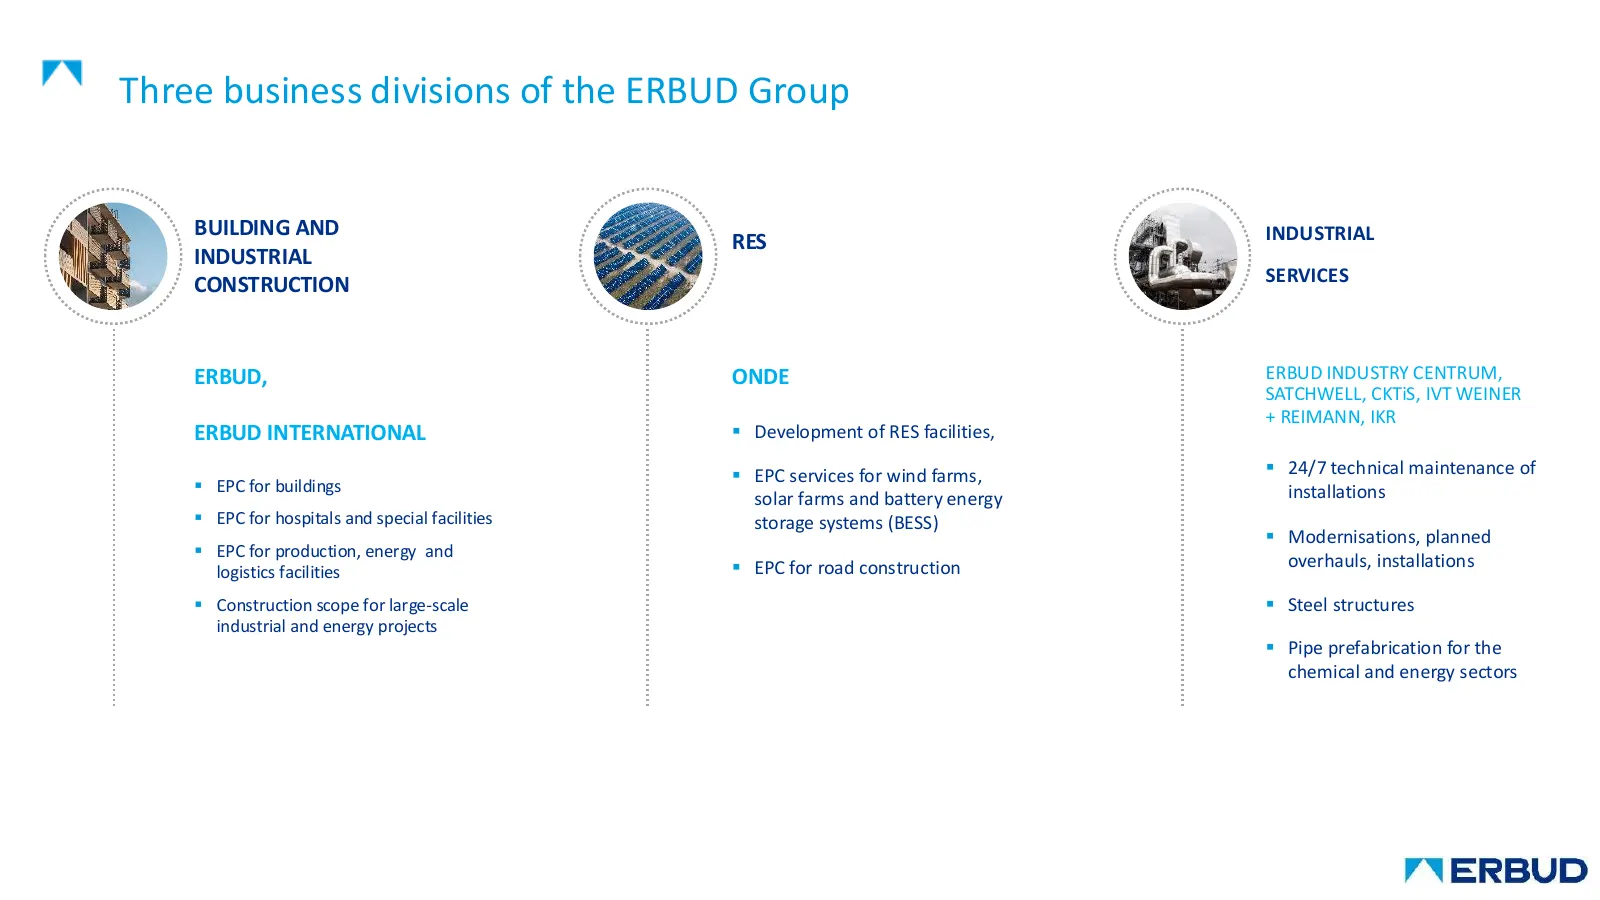
Three business divisions of the ERBUD Group BUILDING AND INDUSTRIAL RES INDUSTRIAL CONSTRUCTION SERVICES ERBUD, ONDE ERBUD INDUSTRY CENTRUM, SATCHWELL, CKTiS, IVT WEINER + REIMANN, IKR ERBUD INTERNATIONAL ▪ Development of RES facilities, ▪ EPC services for wind farms, ▪ 24/7 technical maintenance of
Slide 21: tf ma
tf ma
Slide 22: Building construction
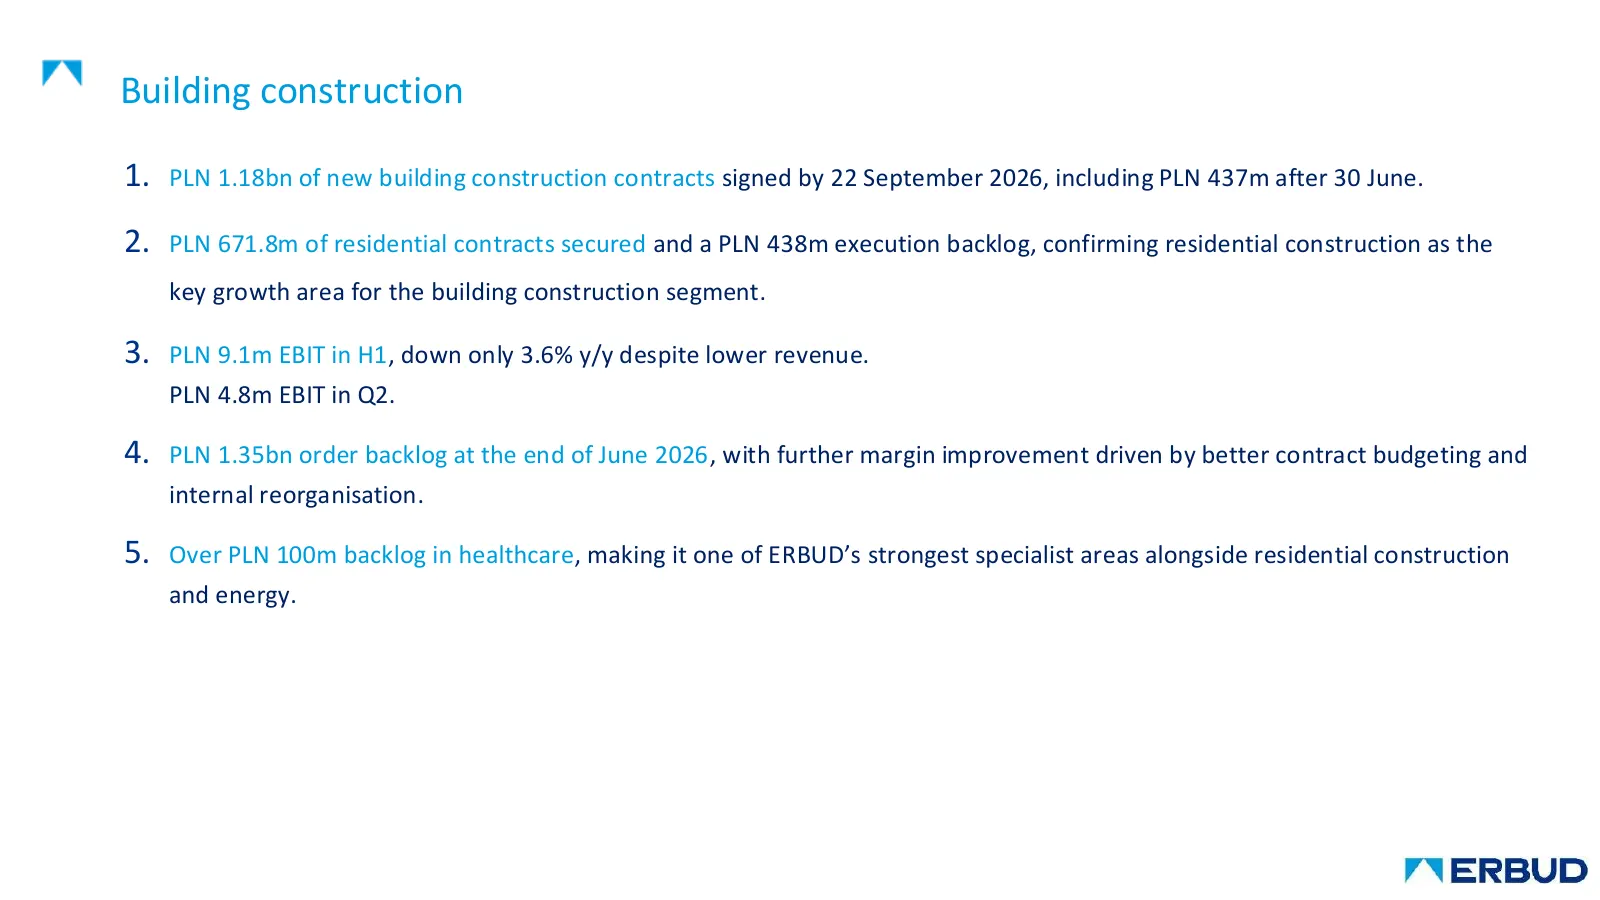
Building construction 1. PLN 1.18bn of new building construction contracts signed by 22 September 2026, including PLN 437m after 30 June. 2. PLN 671.8m of residential contracts secured and a PLN 438m execution backlog, confirming residential construction as the key growth area for the building const
Slide 23: Building construction
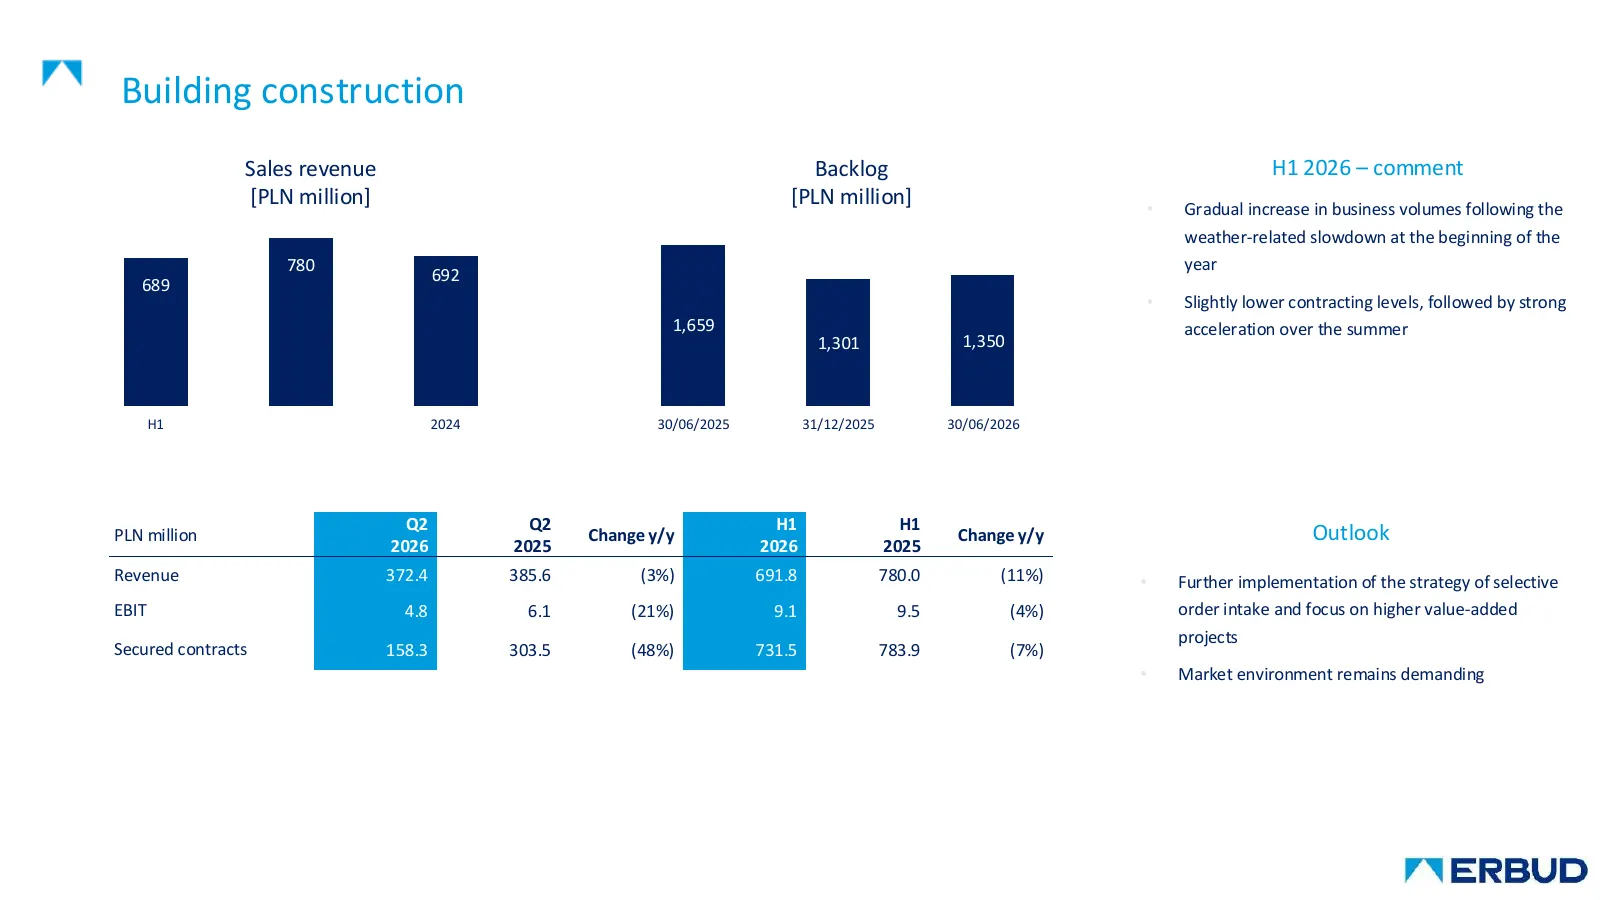
Building construction Sales revenue Backlog H1 2026 – comment [PLN million] [PLN million] • Gradual increase in business volumes following the weather-related slowdown at the beginning of the 780 year 692 689 • Slightly lower contracting levels, followed by strong 1,659 acceleration over the summer

Slide 24
Slide 25: Industrial services
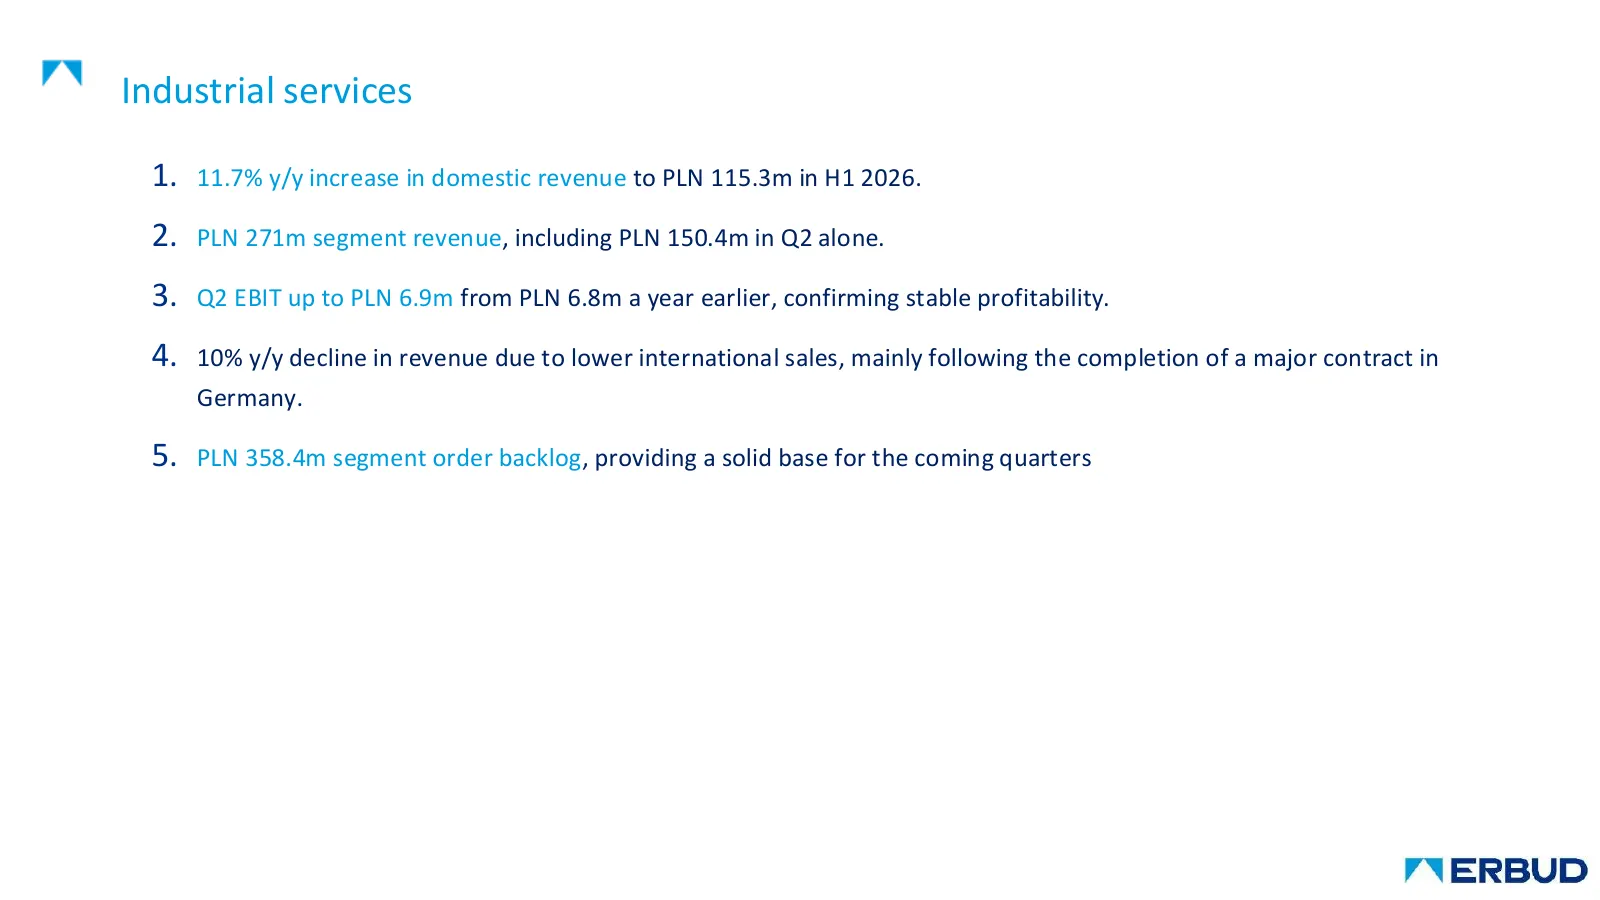
Industrial services 1. 11.7% y/y increase in domestic revenue to PLN 115.3m in H1 2026. 2. PLN 271m segment revenue, including PLN 150.4m in Q2 alone. 3. Q2 EBIT up to PLN 6.9m from PLN 6.8m a year earlier, confirming stable profitability. 4. 10% y/y decline in revenue due to lower international sal
Slide 26: Industrial services
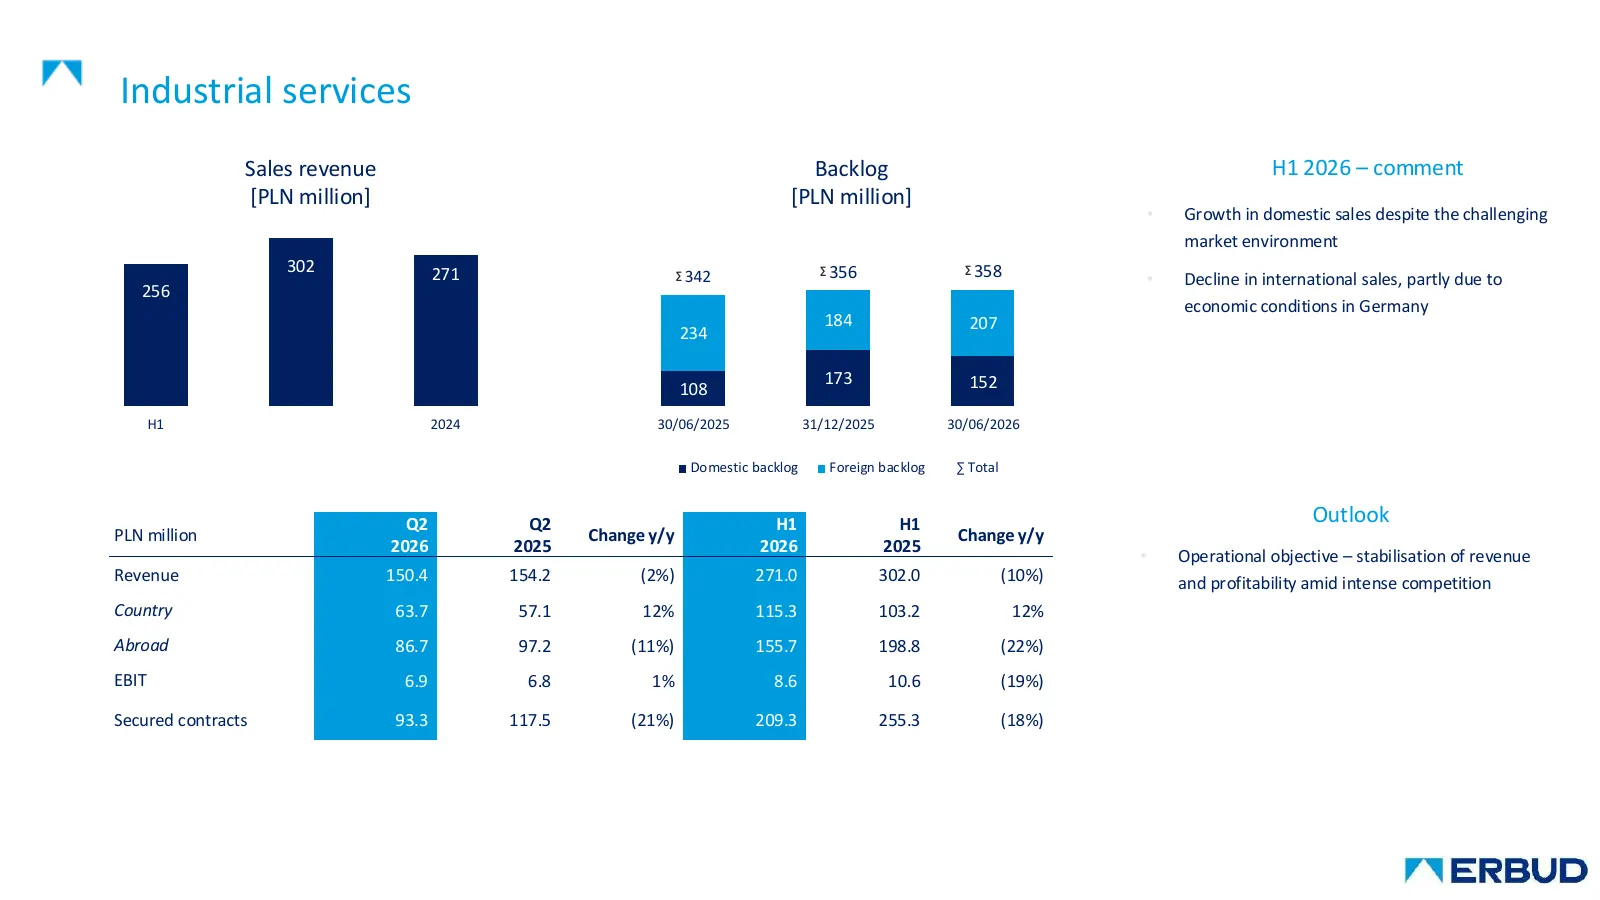
Industrial services Sales revenue Backlog H1 2026 – comment [PLN million] [PLN million] • Growth in domestic sales despite the challenging market environment 302 271 ∑ 342 ∑ 356 ∑ 358 • Decline in international sales, partly due to 256 economic conditions in Germany 184 207 234 173 152 108 H1 2024 3
Slide 27
Slide 28: RES
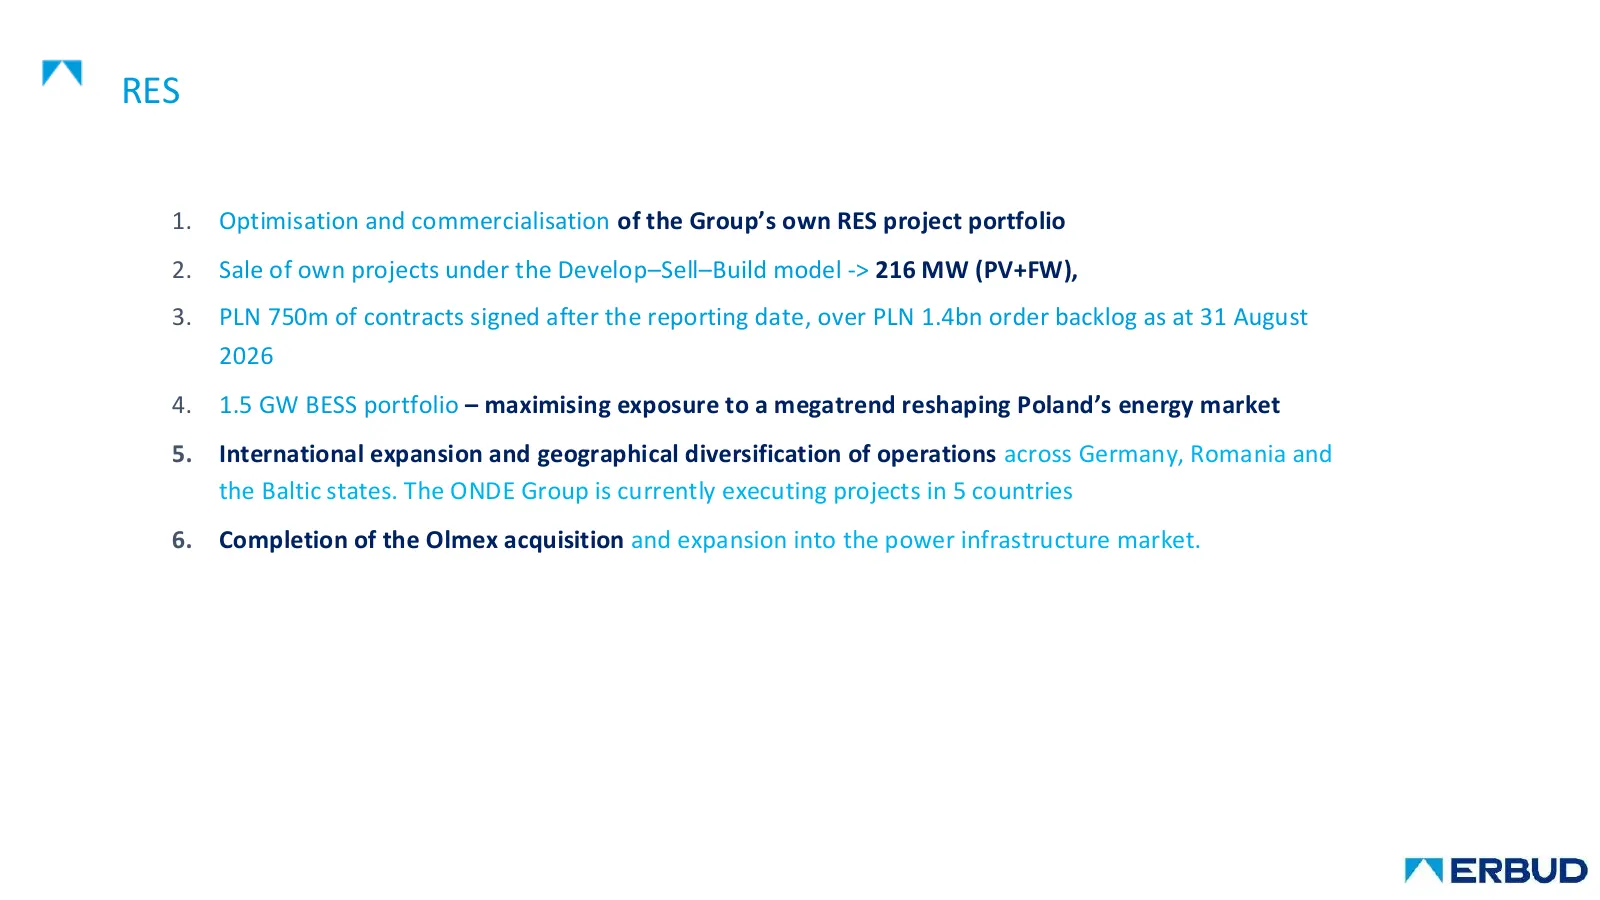
RES 1. Optimisation and commercialisation of the Group’s own RES project portfolio 2. Sale of own projects under the Develop–Sell–Build model -> 216 MW (PV+FW), 3. PLN 750m of contracts signed after the reporting date, over PLN 1.4bn order backlog as at 31 August 2026 4. 1.5 GW BESS portfolio – maxi
Slide 29: Results from discontinued operations – MOD21
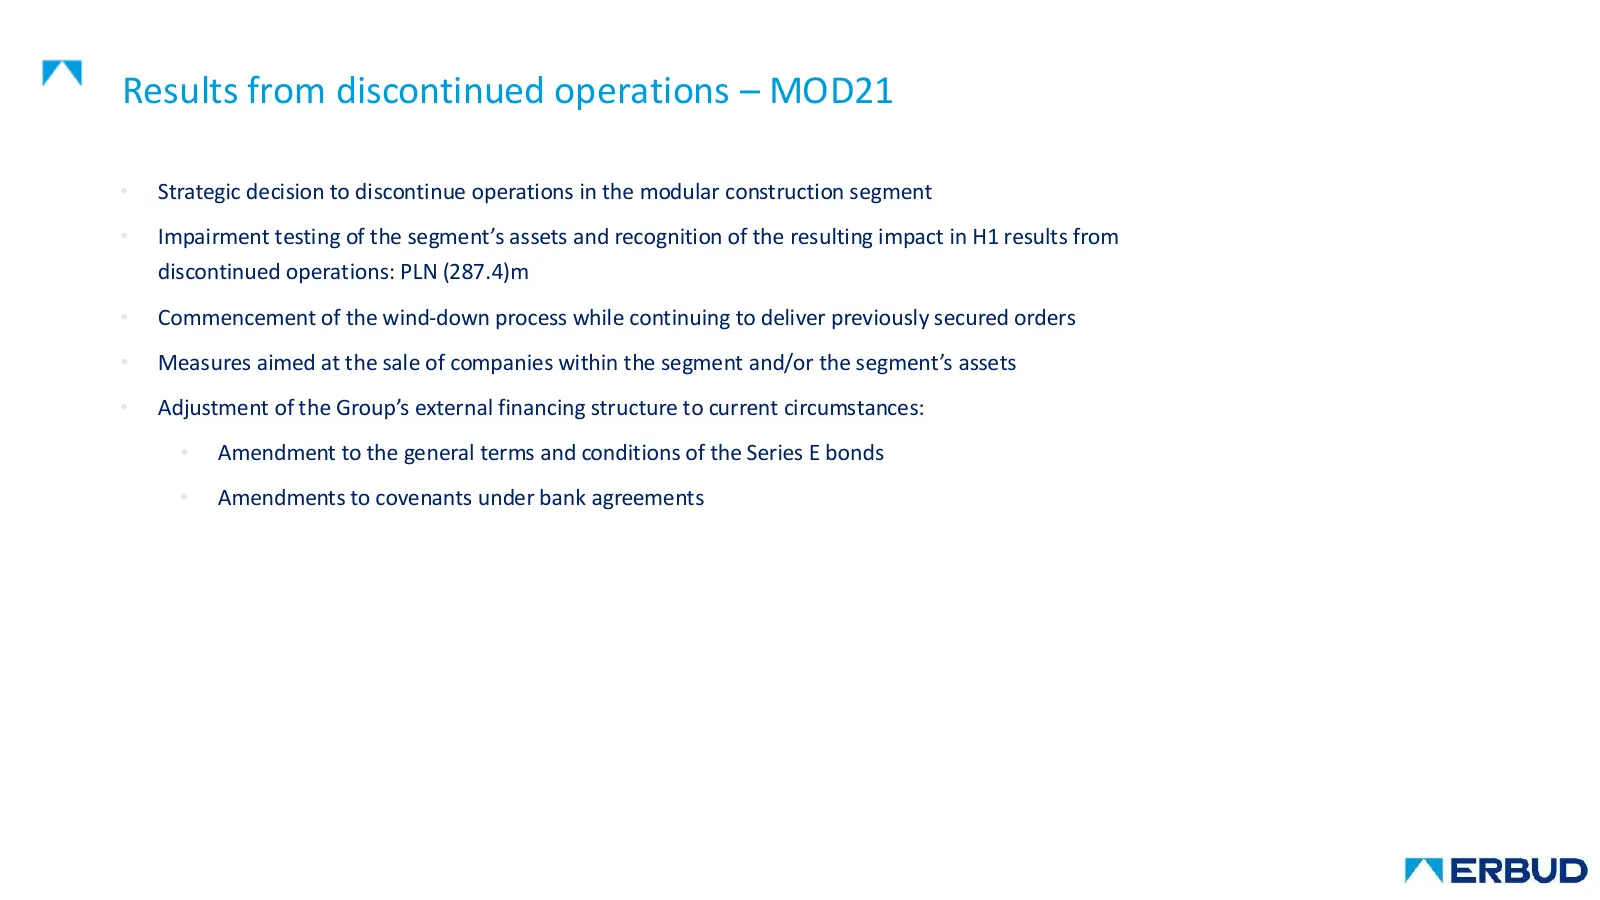
Results from discontinued operations – MOD21 • Strategic decision to discontinue operations in the modular construction segment • Impairment testing of the segment’s assets and recognition of the resulting impact in H1 results from discontinued operations: PLN (287.4)m • Commencement of the wind-dow
Slide 30: ERBUD Group – Summary
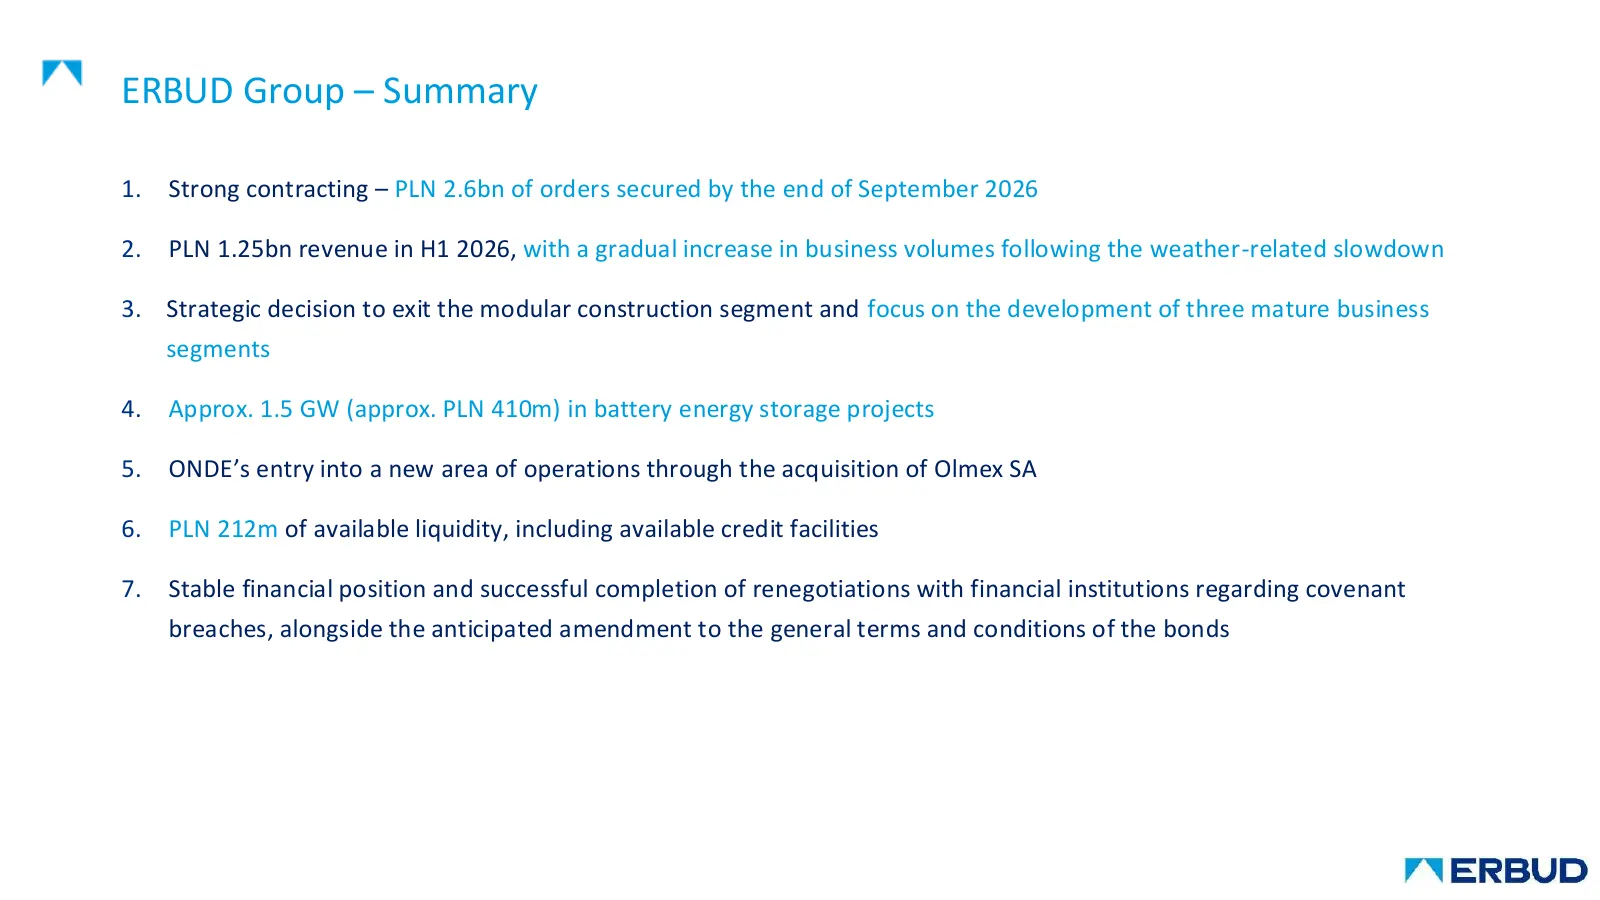
ERBUD Group – Summary 1. Strong contracting – PLN 2.6bn of orders secured by the end of September 2026 2. PLN 1.25bn revenue in H1 2026, with a gradual increase in business volumes following the weather-related slowdown 3. Strategic decision to exit the modular construction segment and focus on the
Slide 31: Operating and financial results for H1 2026 ONDE Group
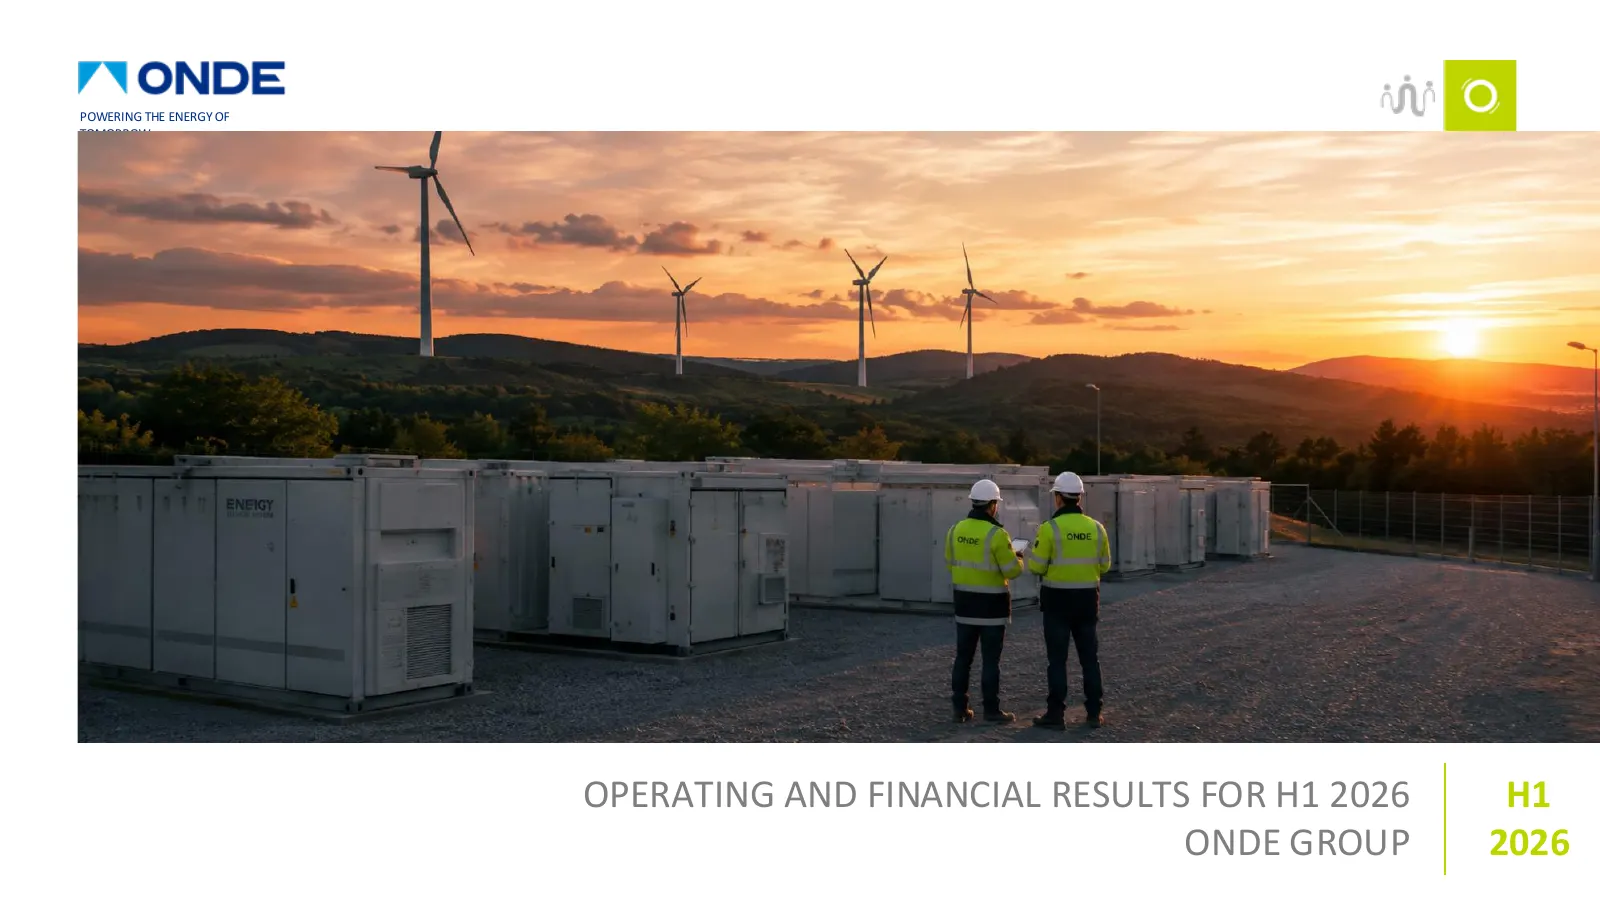
POWERING THE ENERGY OF TOMORROW OPERATING AND FINANCIAL RESULTS FOR H1 2026 H1 ONDE GROUP 2026
Slide 32: H1 2026 in figures | Revenue
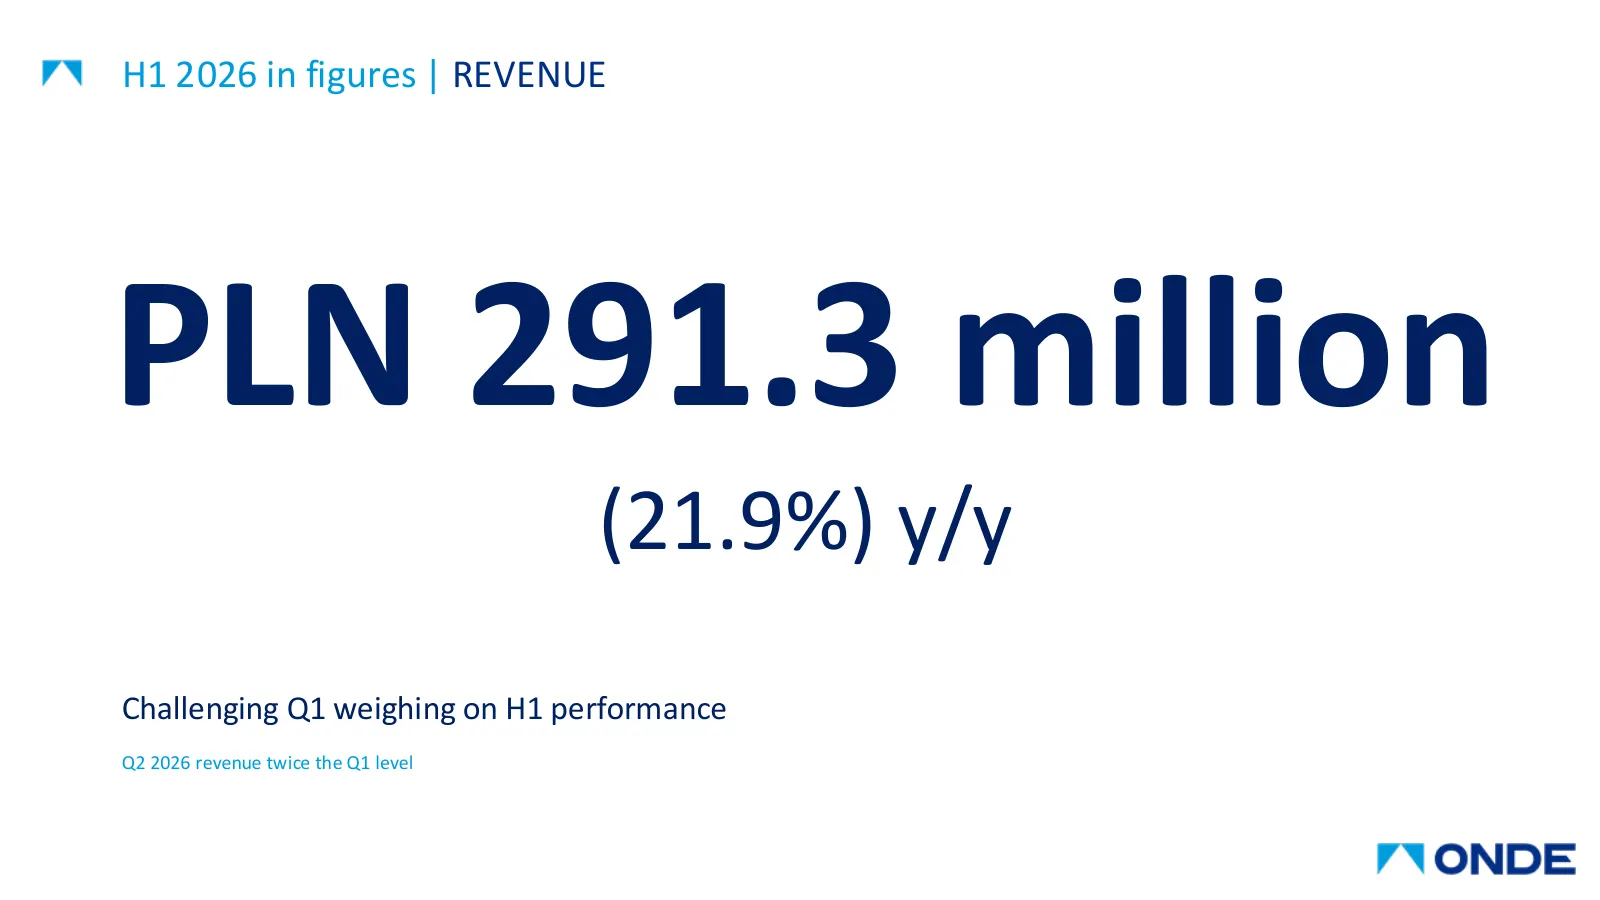
H1 2026 in figures | REVENUE PLN 291.3 million (21.9%) y/y Challenging Q1 weighing on H1 performance Q2 2026 revenue twice the Q1 level
Slide 33: H1 2026 in figures | Order backlog
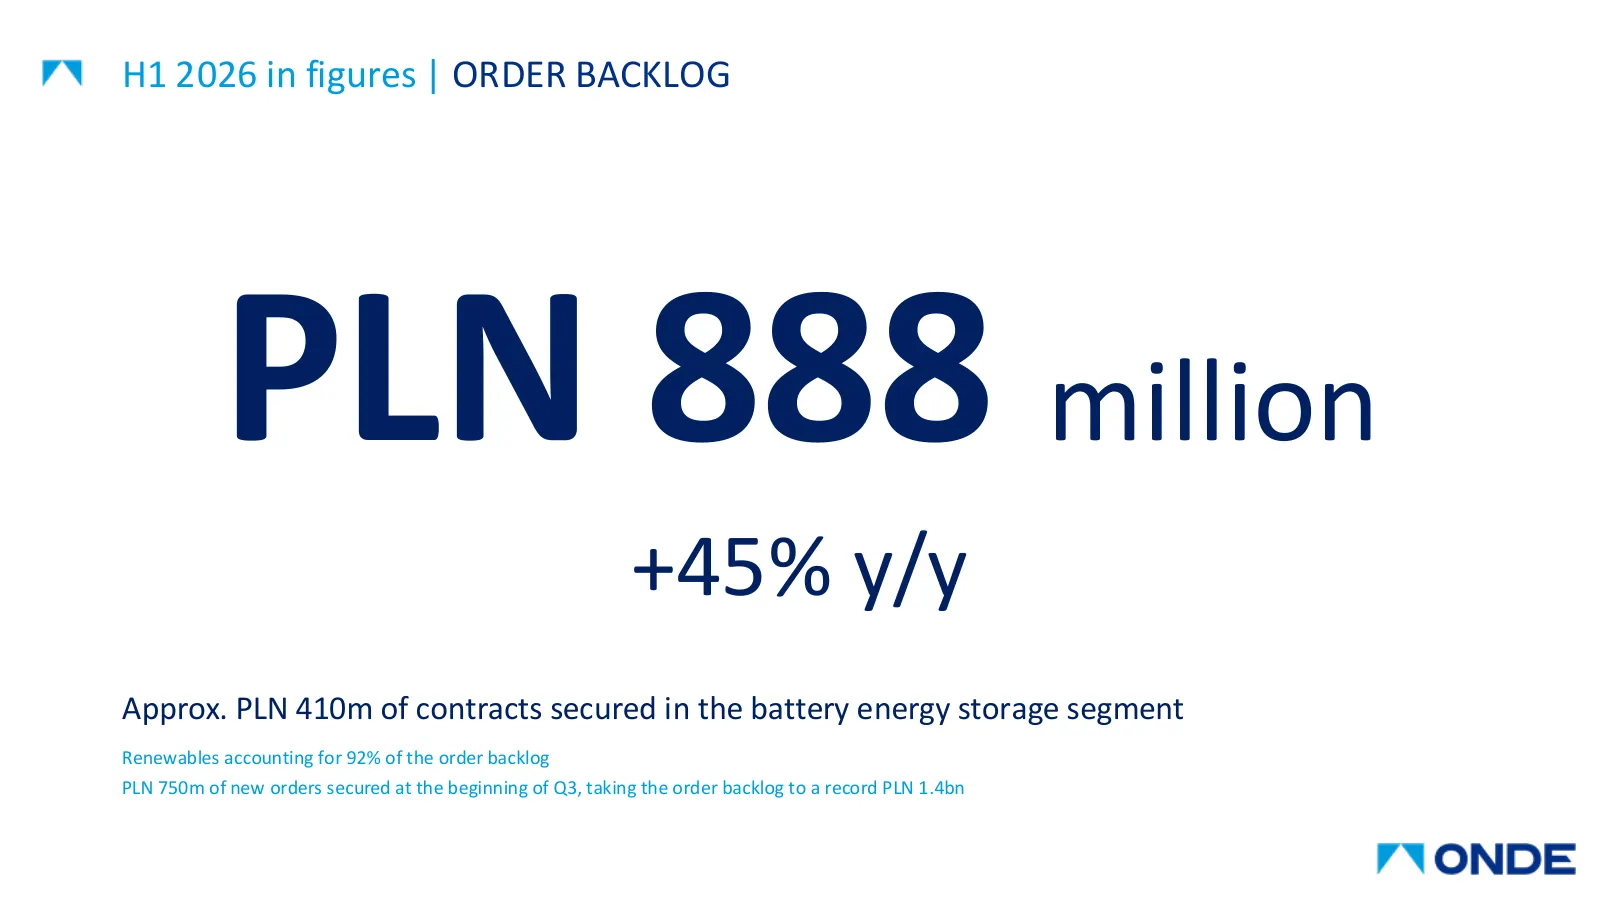
H1 2026 in figures | ORDER BACKLOG PLN 888 million +45% y/y Approx. PLN 410m of contracts secured in the battery energy storage segment Renewables accounting for 92% of the order backlog PLN 750m of new orders secured at the beginning of Q3, taking the order backlog to a record PLN 1.4bn
Slide 34: H1 2026 in figures | EBITDA
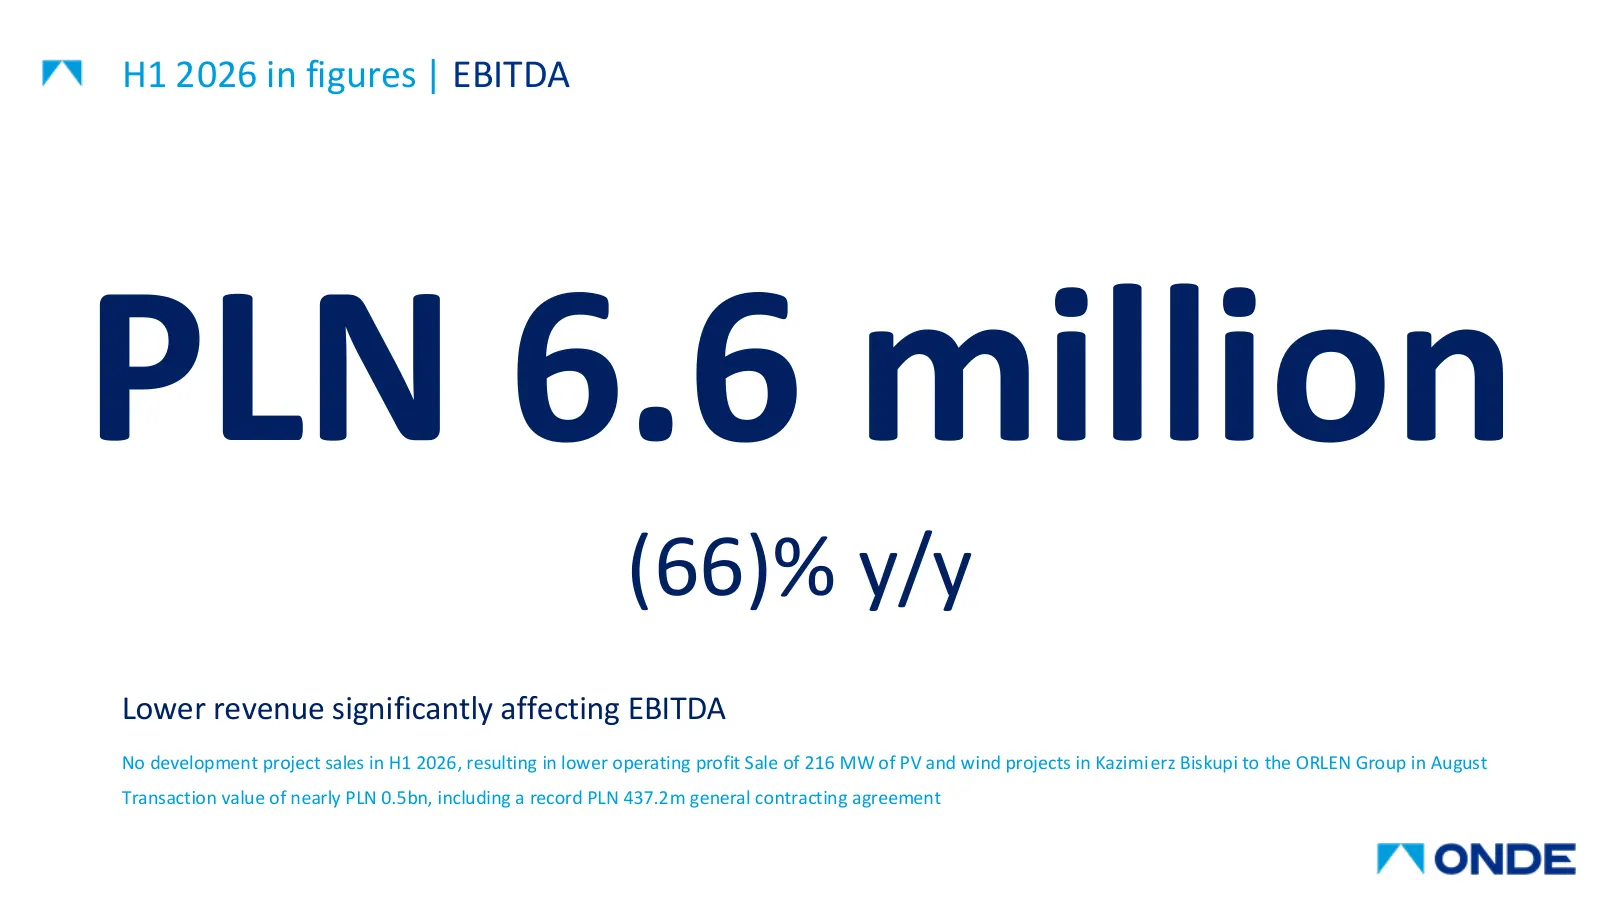
H1 2026 in figures | EBITDA PLN 6.6 million (66)% y/y Lower revenue significantly affecting EBITDA No development project sales in H1 2026, resulting in lower operating profit Sale of 216 MW of PV and wind projects in Kazimierz Biskupi to the ORLEN Group in August Transaction value of nearly PLN 0.5
Slide 35: H1 2026 in figures | Proprietary renewables projects
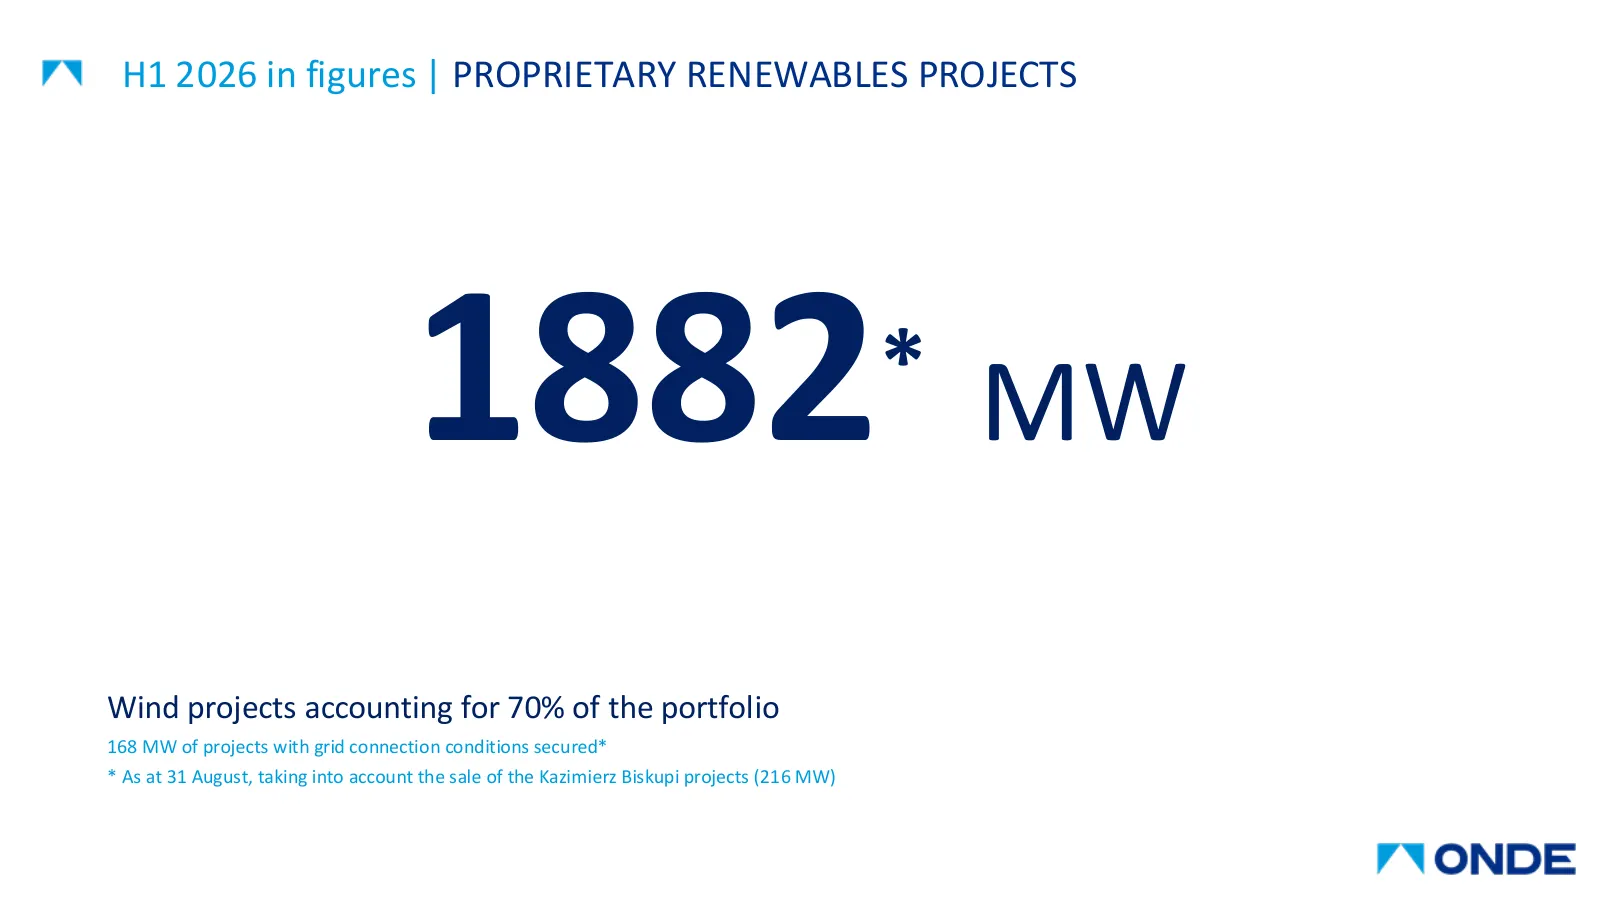
H1 2026 in figures | PROPRIETARY RENEWABLES PROJECTS 1882 * MW Wind projects accounting for 70% of the portfolio 168 MW of projects with grid connection conditions secured* * As at 31 August, taking into account the sale of the Kazimierz Biskupi projects (216 MW)
Slide 36: Revenue – structure and segment operating profitability
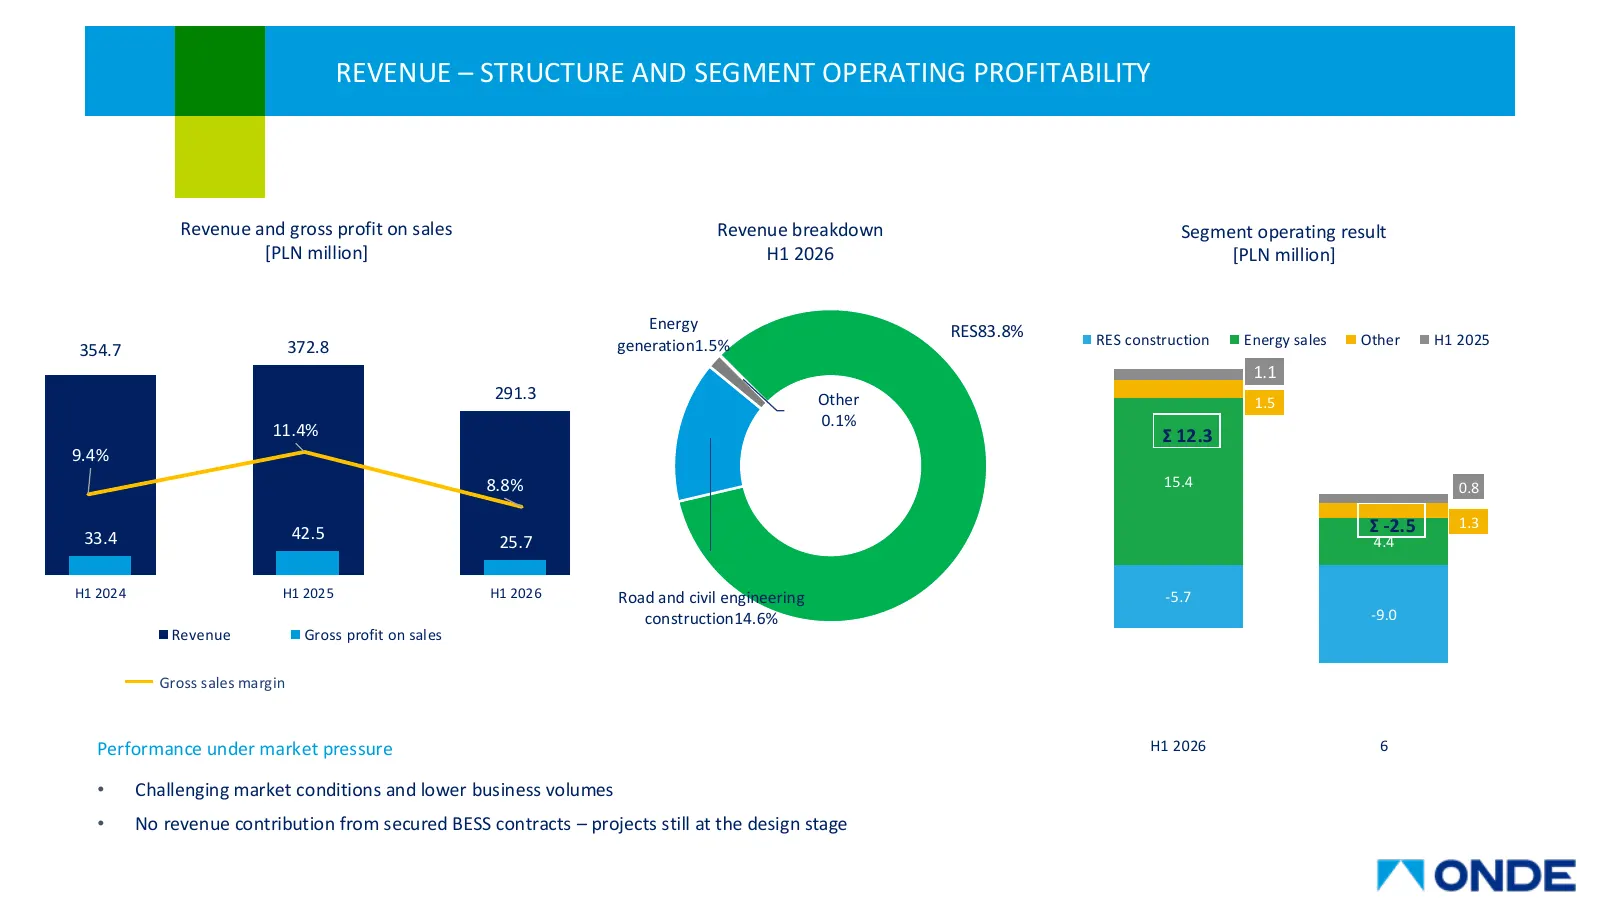
REVENUE – STRUCTURE AND SEGMENT OPERATING PROFITABILITY Revenue and gross profit on sales Revenue breakdown Segment operating result [PLN million] H1 2026 [PLN million] Energy RES83.8% generation1.5% RES construction Energy sales Other H1 2025 354.7 372.8 1.1 291.3 Other 1.5 0.1% 11.4% Σ 12.3 9.4% 8
Slide 37: ONDE results for H1 2026
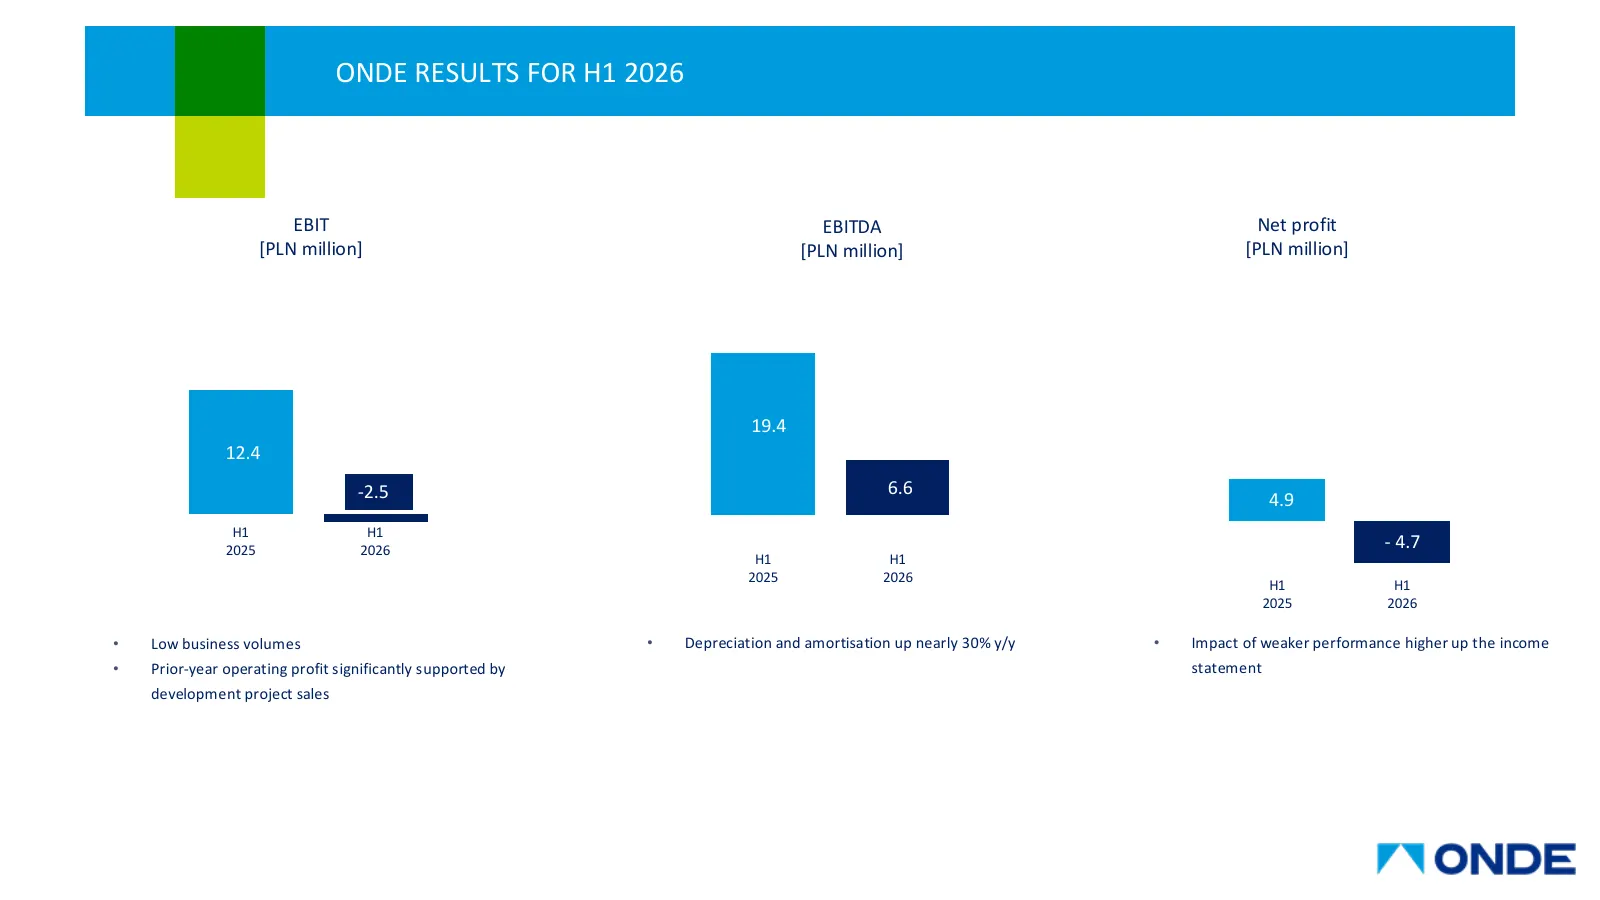
ONDE RESULTS FOR H1 2026 EBIT EBITDA Net profit [PLN million] [PLN million] [PLN million] 19.4 12.4 -2.5 6.6 4.9 H1 H1 2025 2026 - 4.7 H1 H1 2025 2026 H1 H1 2025 2026 • Low business volumes • Depreciation and amortisation up nearly 30% y/y • Impact of weaker performance higher up the income • Prior-
Slide 38: ONDE profit for Q2 2026
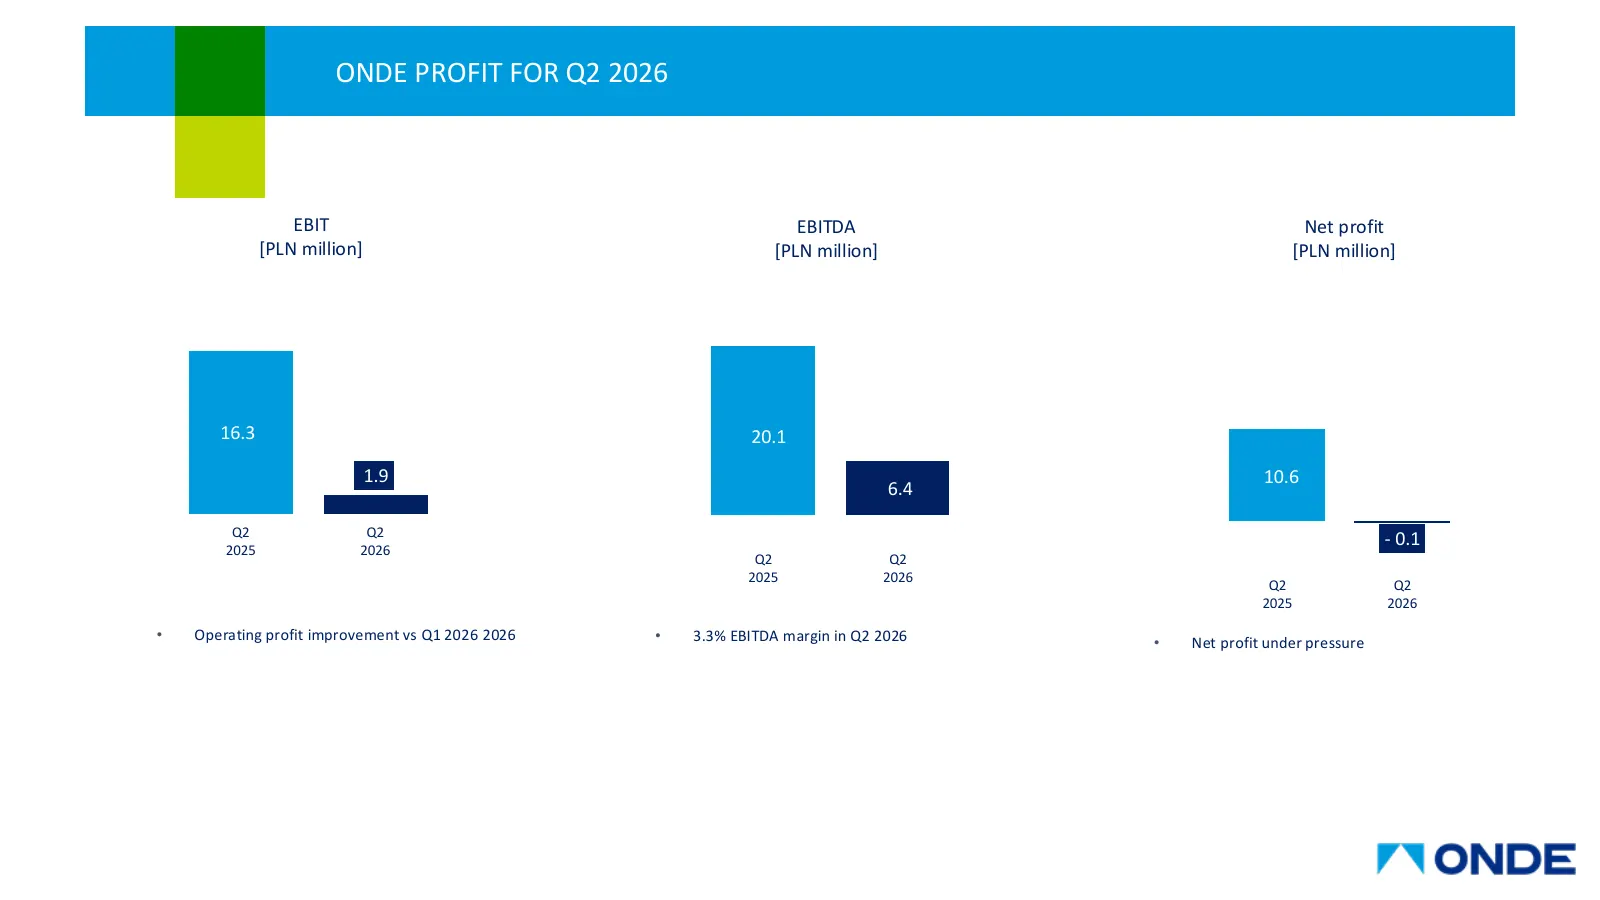
ONDE PROFIT FOR Q2 2026 EBIT EBITDA Net profit [PLN million] [PLN million] [PLN million] 16.3 20.1 1.9 10.6 6.4 Q2 Q2 - 0.1 2025 2026 Q2 Q2 2025 2026 Q2 Q2 2025 2026 • Operating profit improvement vs Q1 2026 2026 • 3.3% EBITDA margin in Q2 2026 • Net profit under pressure
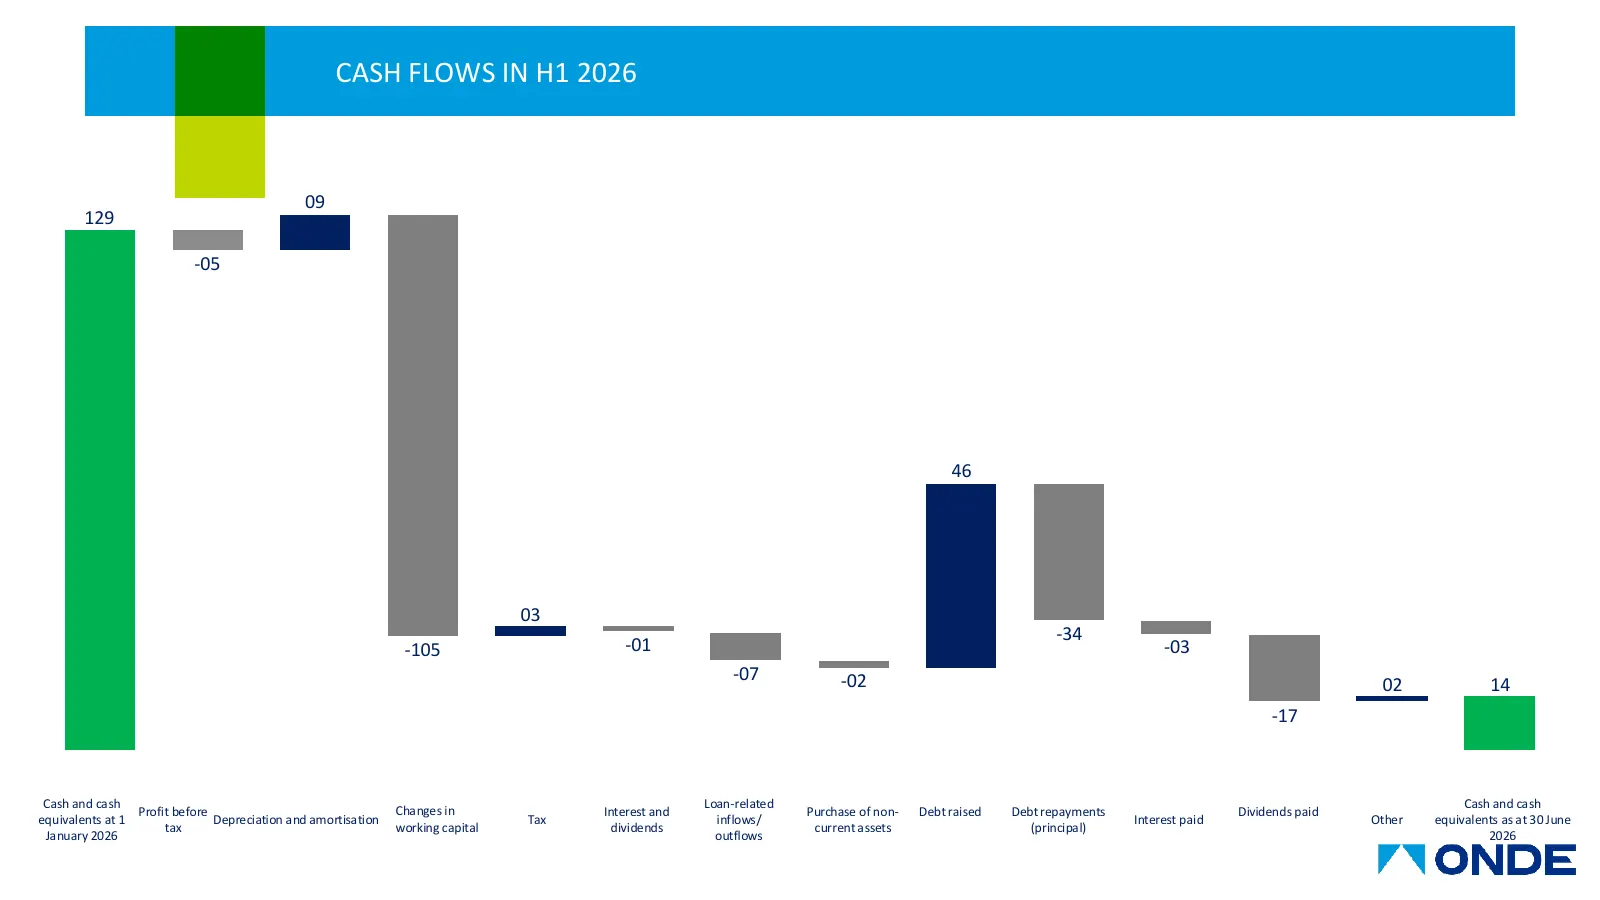
Slide 39: Cash flows in H1 2026
CASH FLOWS IN H1 2026 09 129 -05 46 03 -34 -105 -01 -03 -07 -02 02 14 -17 Cash and cash Loan-related Cash and cash Profit before Changes in Interest and Purchase of non- Debt raised Debt repayments Dividends paid equivalents at 1 Depreciation and amortisation Tax inflows/ Interest paid Other equival
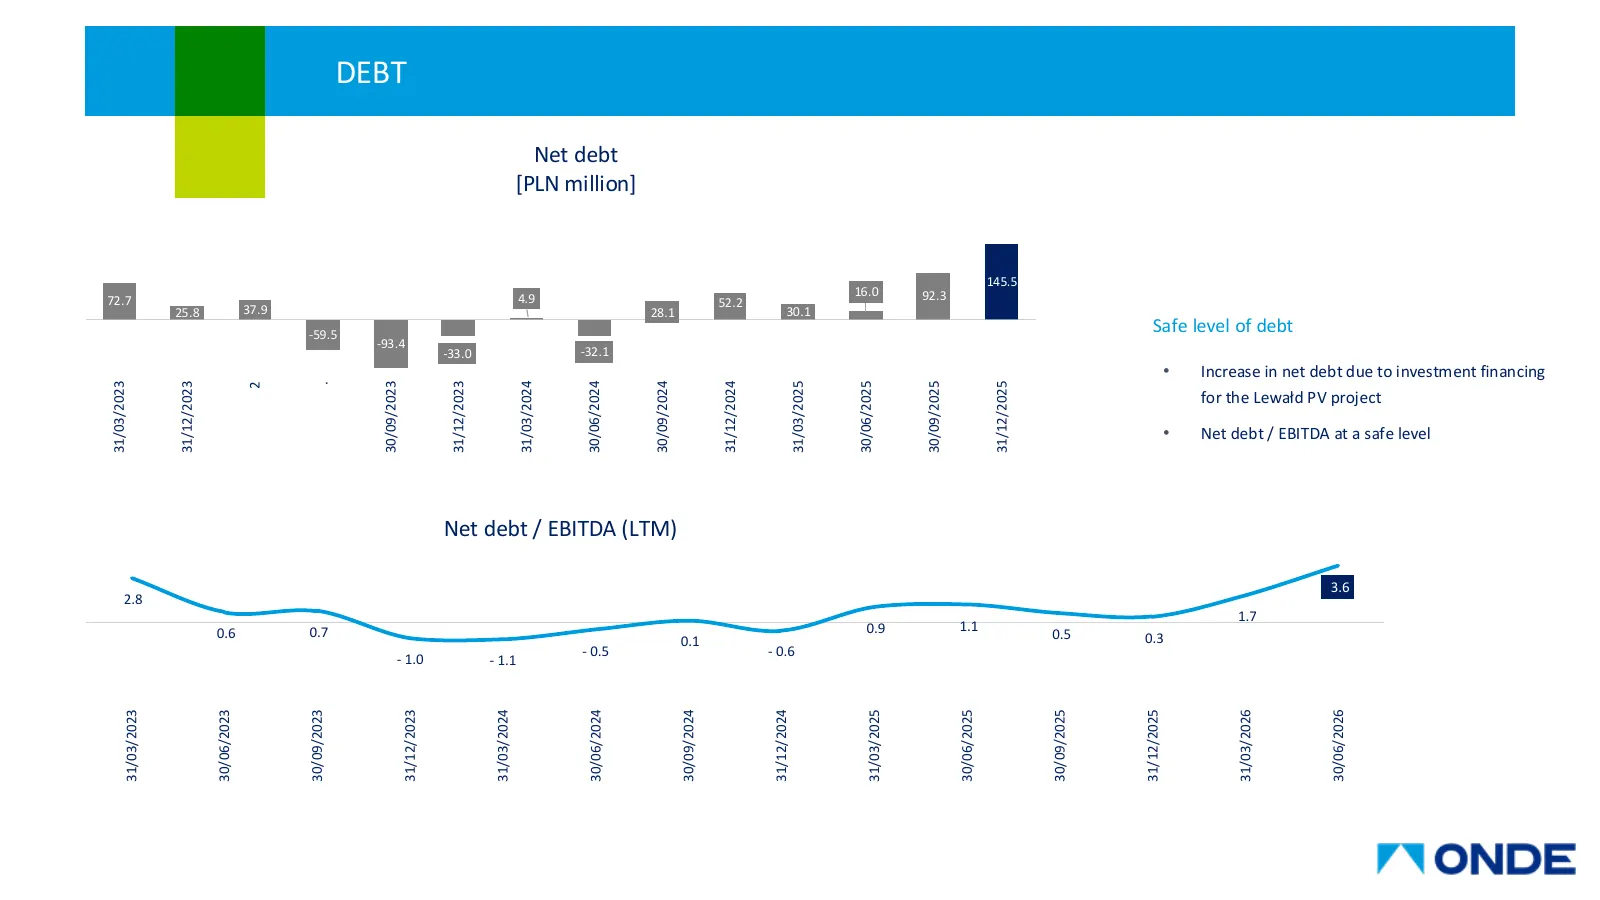
Slide 40: Debt
DEBT Net debt [PLN million] 145.5 4.9 16.0 92.3 72.7 52.2 25.8 37.9 28.1 30.1 -59.5 Safe level of debt -93.4 -33.0 -32.1 • Increase in net debt due to investment financing 31/03/2024 30/06/2024 31/03/2023 31/12/2023 30/09/2023 31/12/2023 30/09/2024 31/12/2024 31/03/2025 30/06/2025 30/09/2025 31/12/2
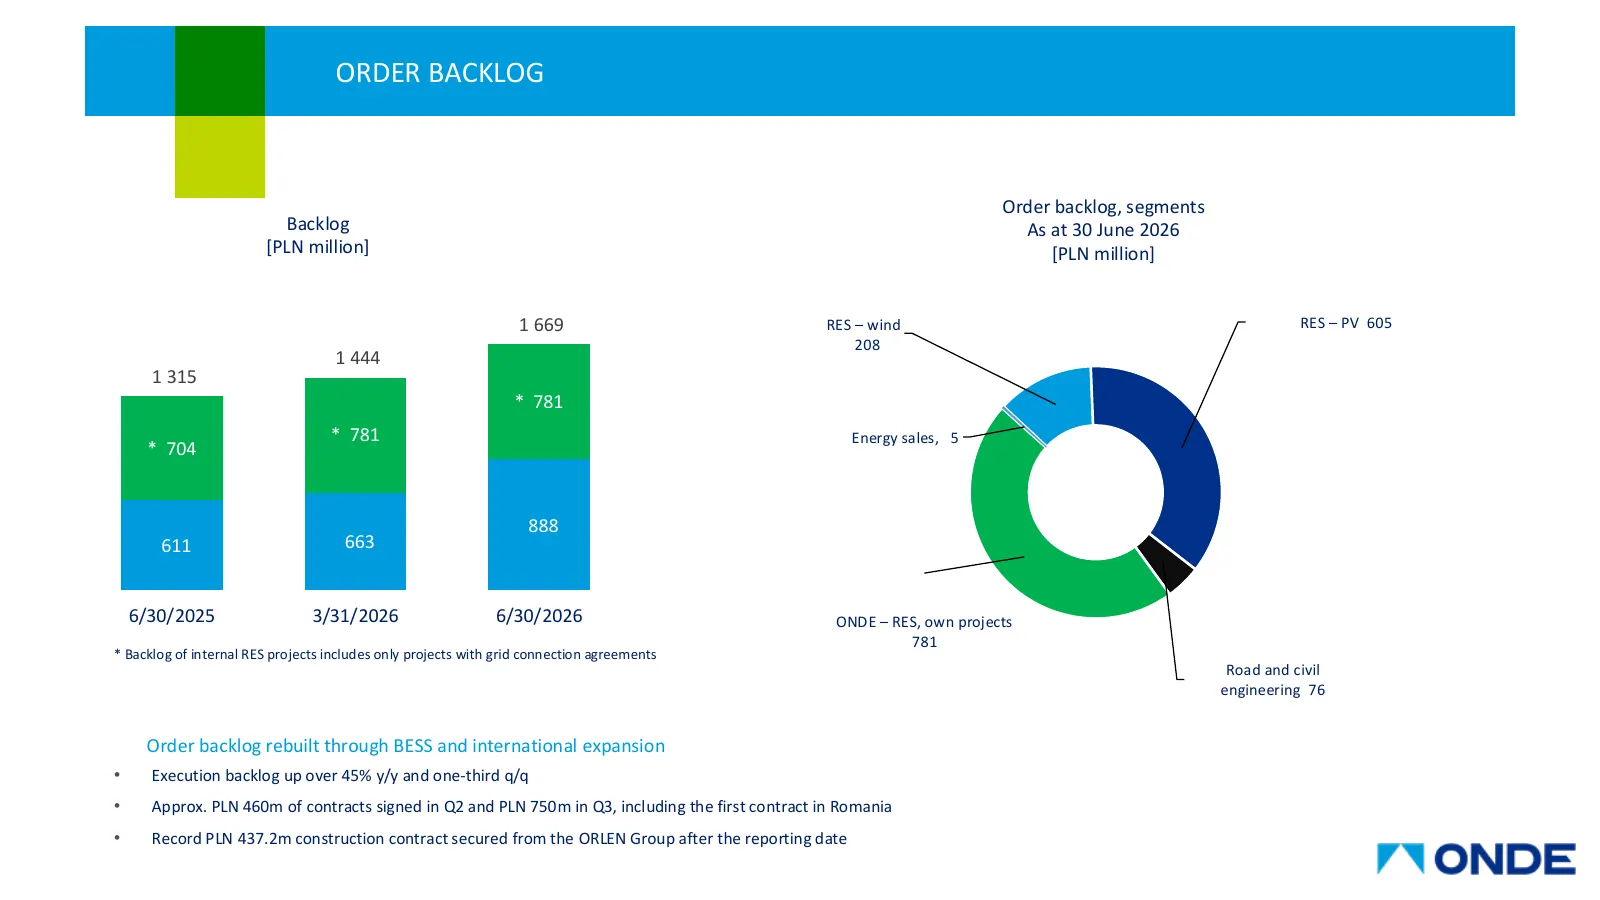
Slide 41: Order backlog
ORDER BACKLOG Order backlog, segments Backlog As at 30 June 2026 [PLN million] [PLN million] 1 669 RES – wind RES – PV 605 208 1 444 1 315 * 781 * 781 Energy sales, 5 * 704 888 611 663 6/30/2025 3/31/2026 6/30/2026 ONDE – RES, own projects 781 * Backlog of internal RES projects includes only project
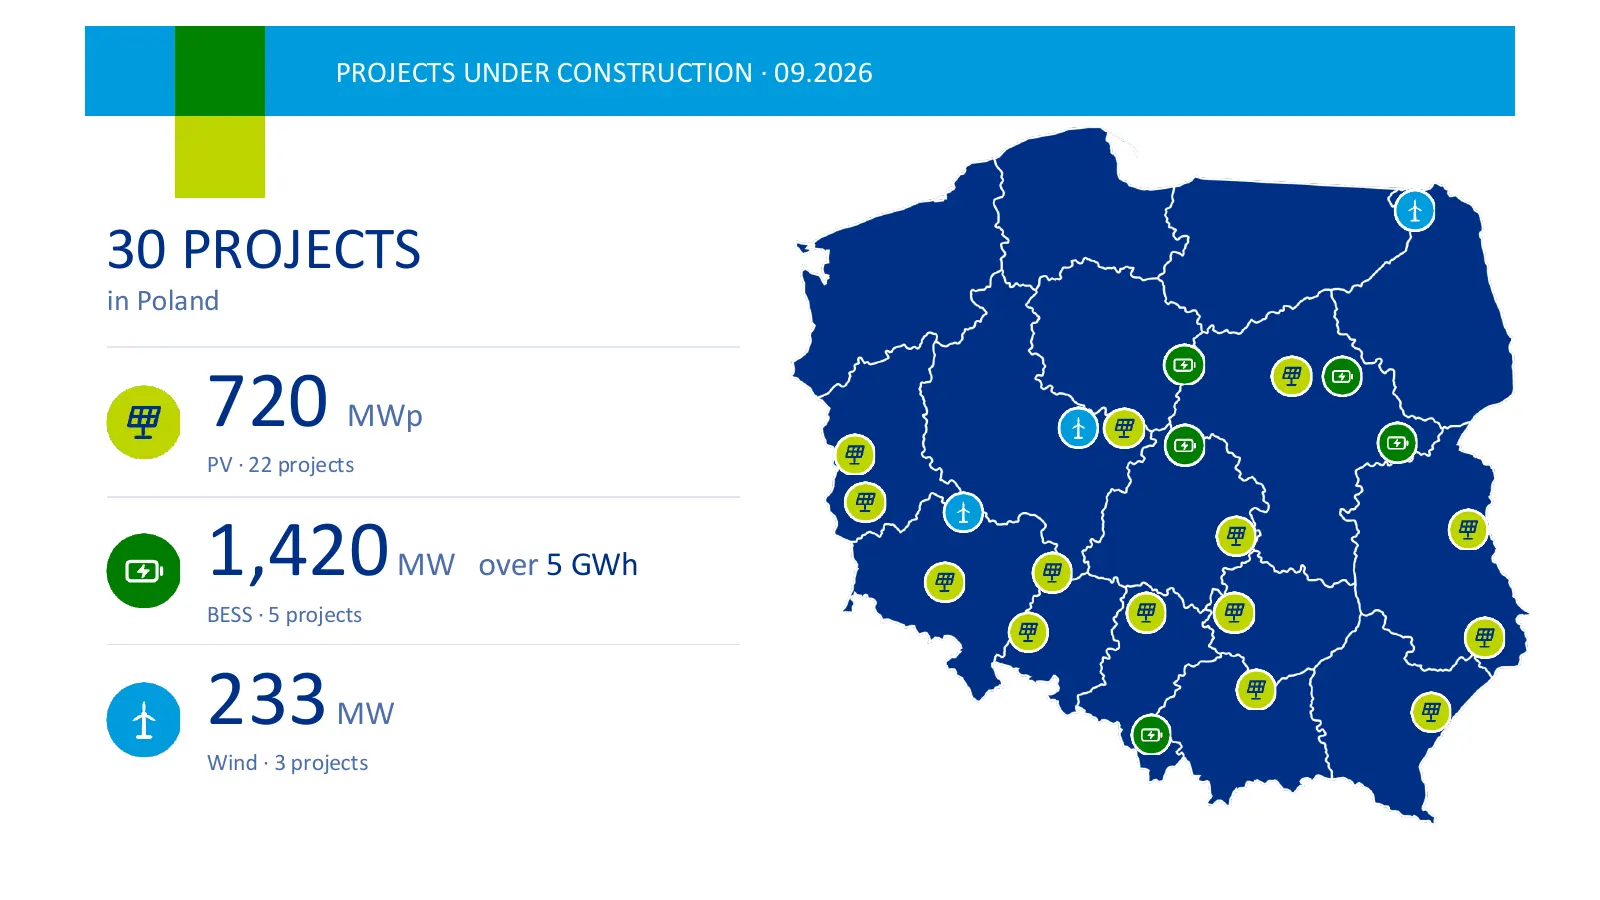
Slide 42: Projects under construction in Poland
PROJECTS UNDER CONSTRUCTION · 09.2026 30 PROJECTS in Poland 720 MWp PV · 22 projects 1,420 MW over 5 GWh BESS · 5 projects 233 MW Wind · 3 projects
Slide 43: Wind projects outside Poland
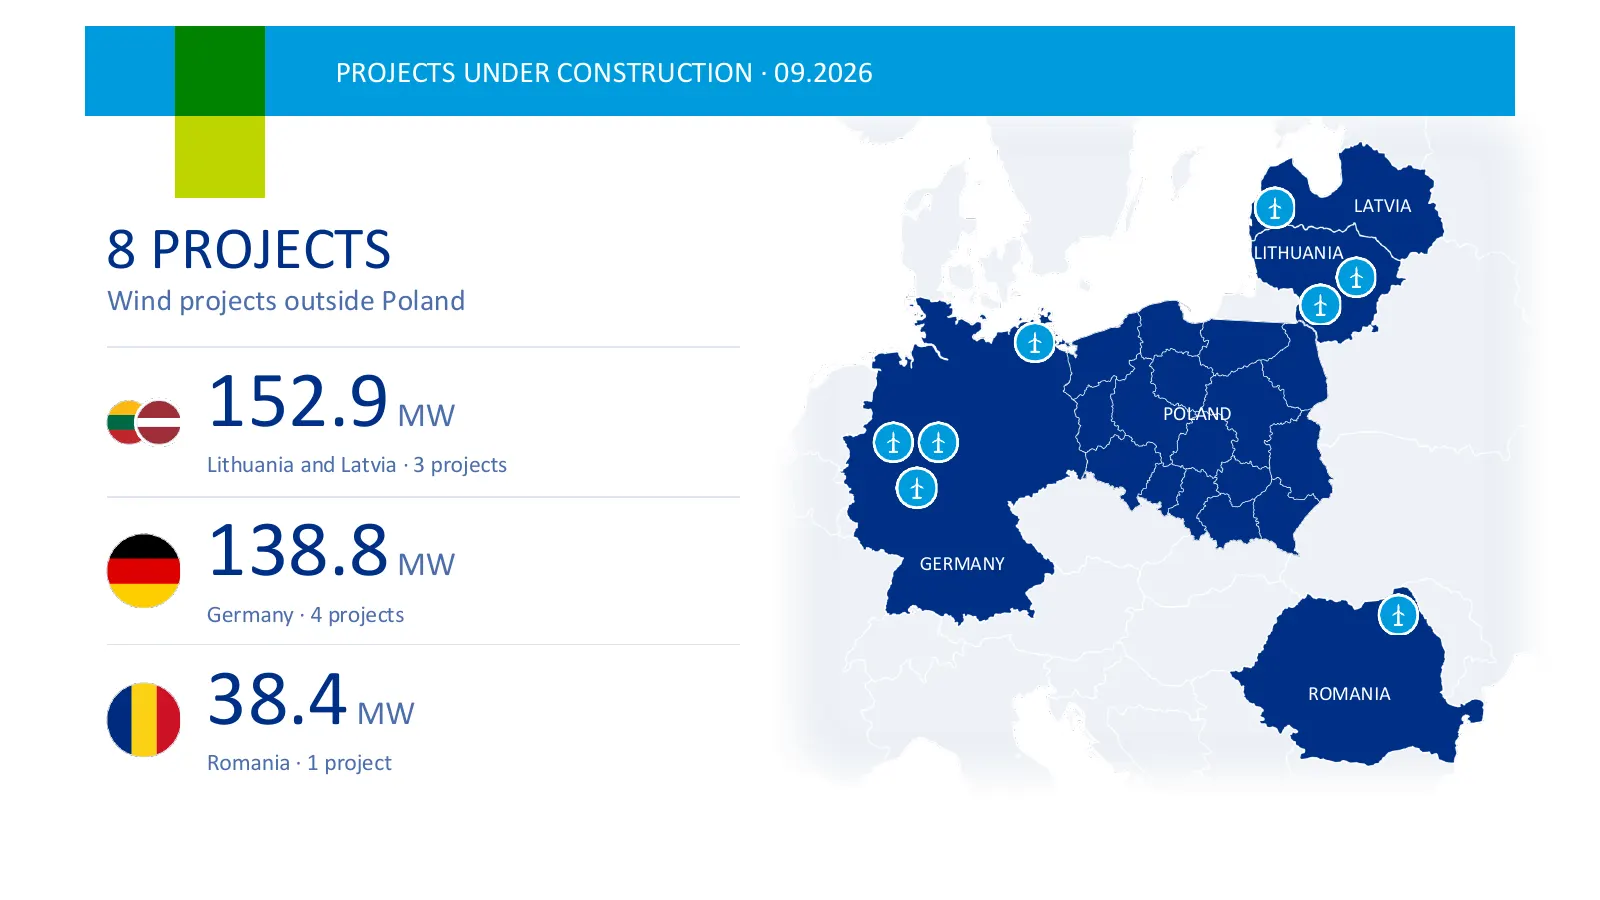
PROJECTS UNDER CONSTRUCTION · 09.2026 LATVIA 8 PROJECTS LITHUANIA Wind projects outside Poland 152.9 MW POLAND Lithuania and Latvia · 3 projects 138.8 MW GERMANY Germany · 4 projects 38.4 MW ROMANIA Romania · 1 project
Slide 44: Progress of RES development projects
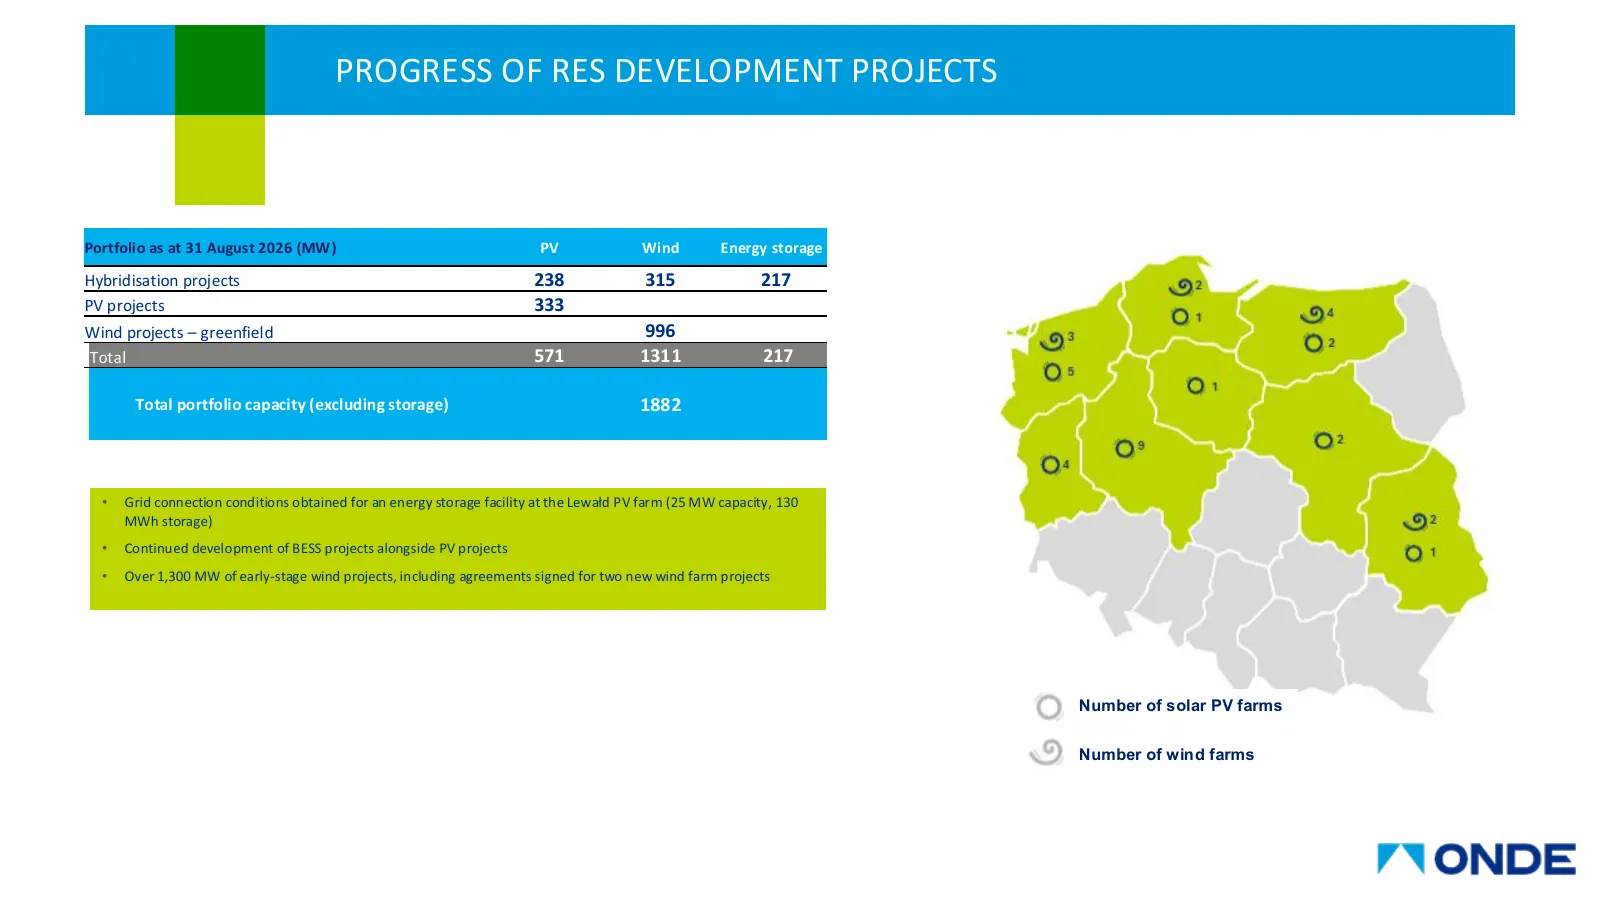
PROGRESS OF RES DEVELOPMENT PROJECTS Portfolio as at 31 August 2026 (MW) PV Wind Energy storage Hybridisation projects 238 315 217 PV projects 333 Wind projects – greenfield 996 Total 571 1311 217 Total portfolio capacity (excluding storage) 1882 • Grid connection conditions obtained for an energy s
Slide 45: Summary and outlook | Operating activities
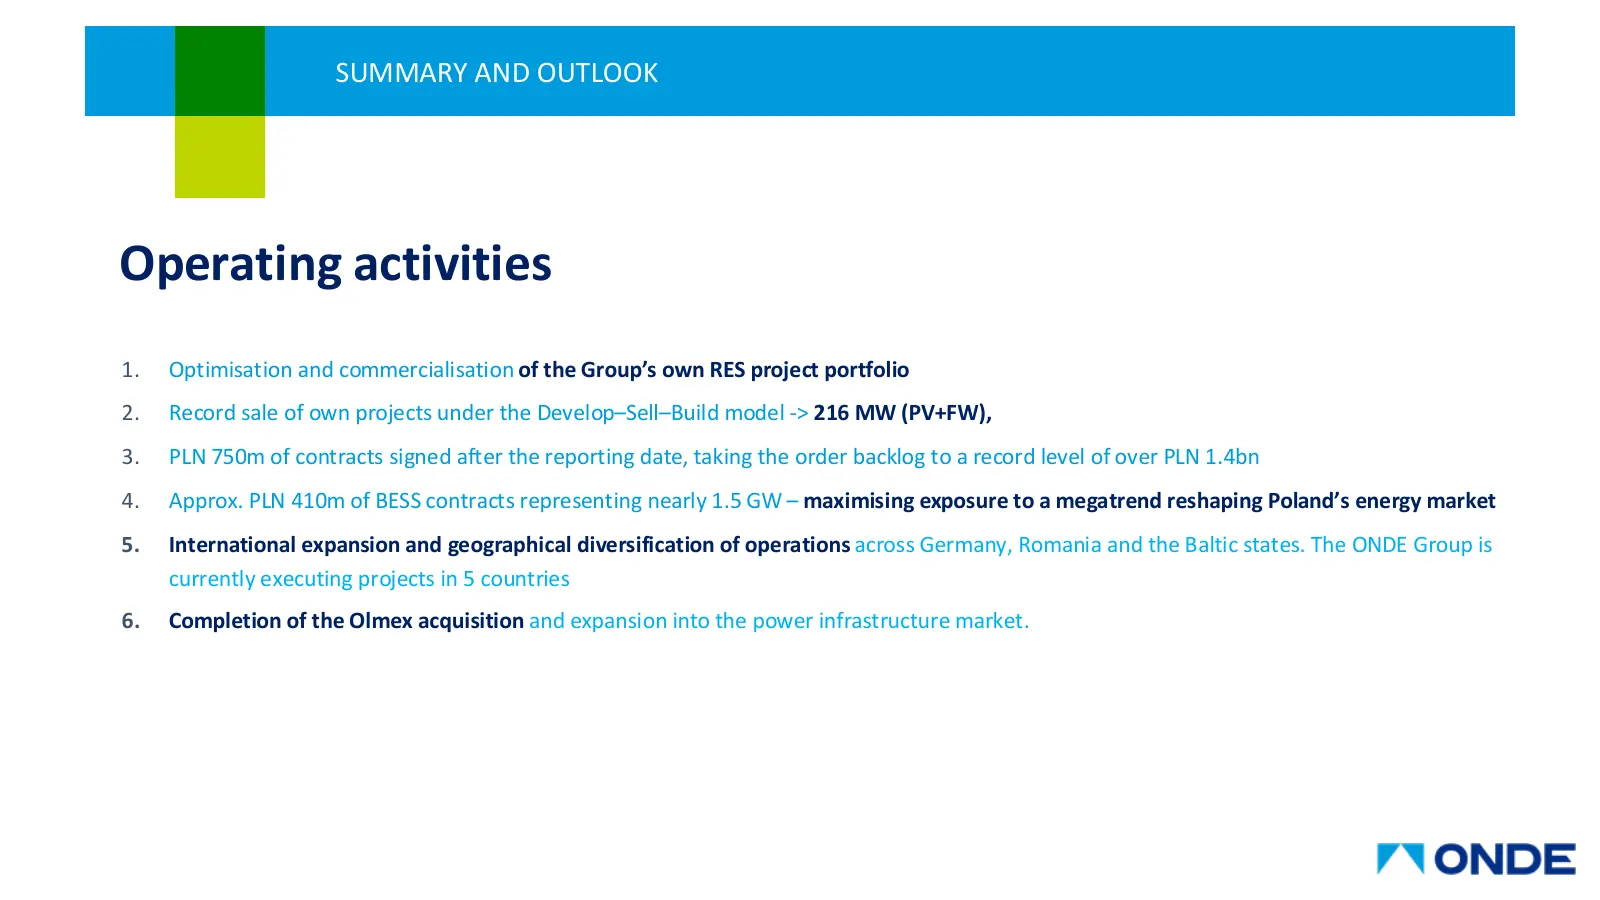
SUMMARY AND OUTLOOK Operating activities 1. Optimisation and commercialisation of the Group’s own RES project portfolio 2. Record sale of own projects under the Develop–Sell–Build model -> 216 MW (PV+FW), 3. PLN 750m of contracts signed after the reporting date, taking the order backlog to a record
Slide 46: Plans and outlook | Market environment
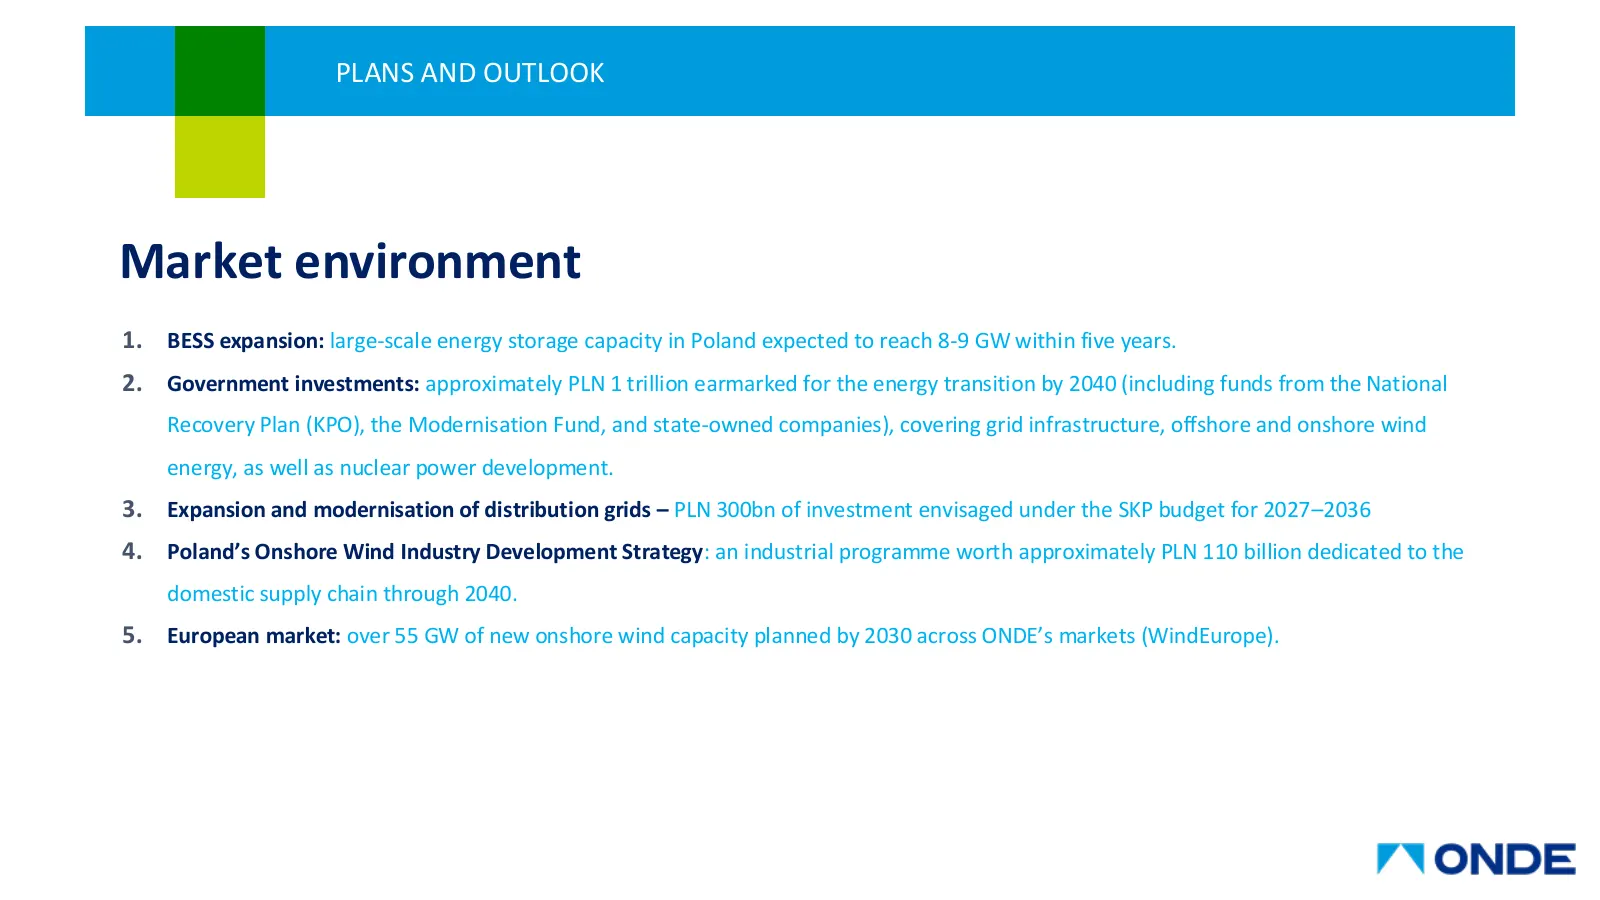
PLANS AND OUTLOOK Market environment 1. BESS expansion: large-scale energy storage capacity in Poland expected to reach 8-9 GW within five years. 2. Government investments: approximately PLN 1 trillion earmarked for the energy transition by 2040 (including funds from the National Recovery Plan (KPO)
Slide 47: Statement of financial position – selected data
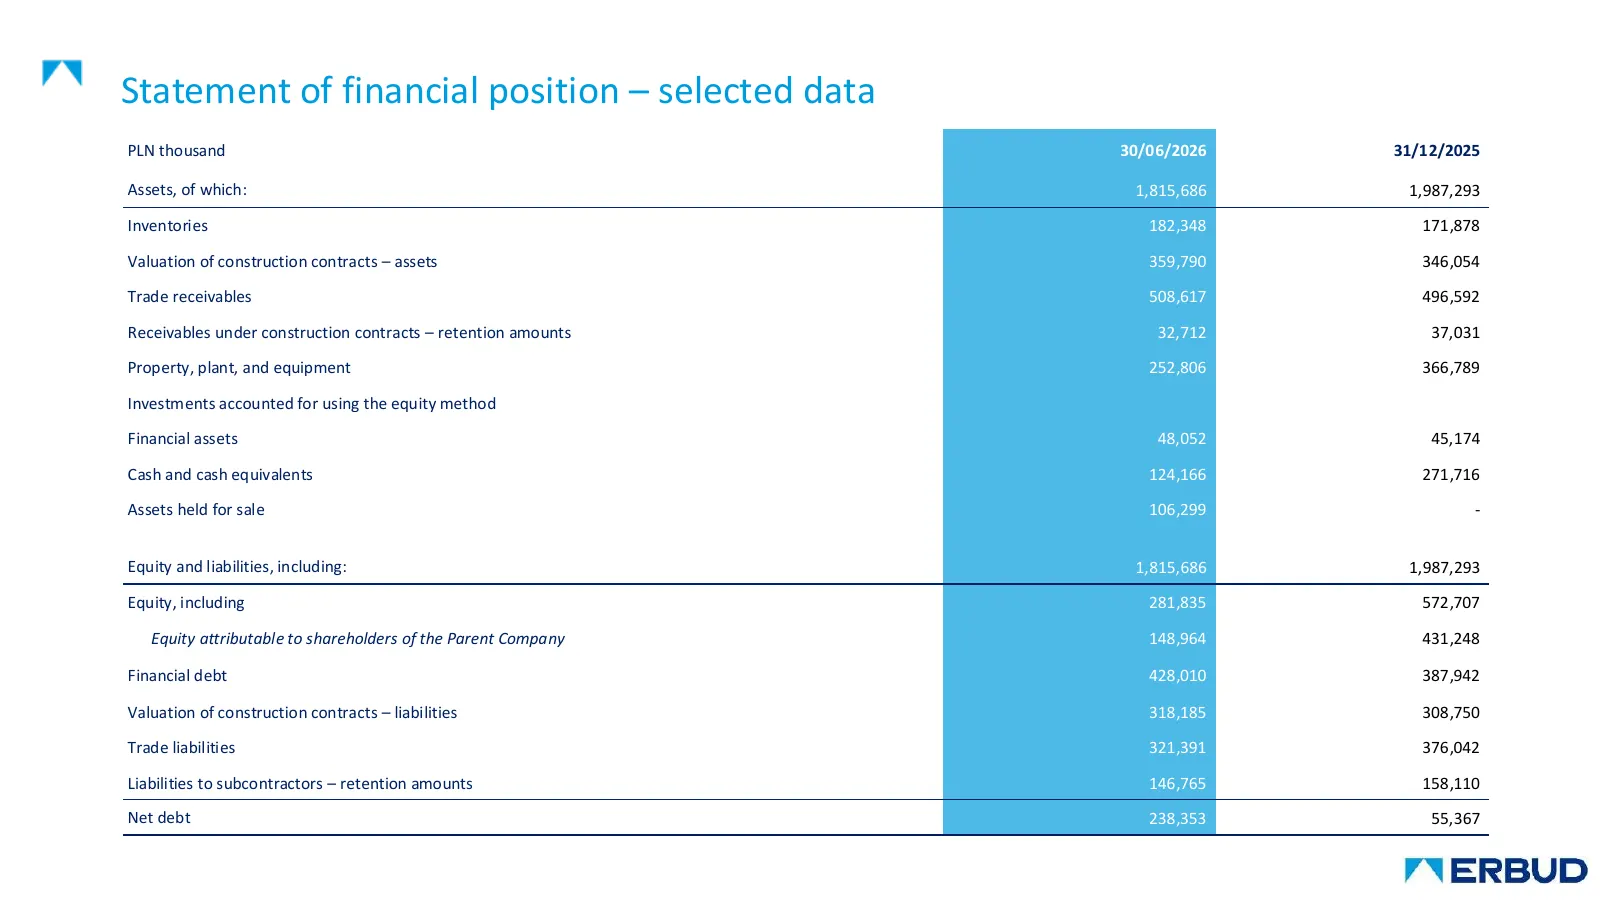
Statement of financial position – selected data PLN thousand 30/06/2026 31/12/2025 Assets, of which: 1,815,686 1,987,293 Inventories 182,348 171,878 Valuation of construction contracts – assets 359,790 346,054 Trade receivables 508,617 496,592 Receivables under construction contracts – retention amo
Slide 48: Statement of financial position – selected data
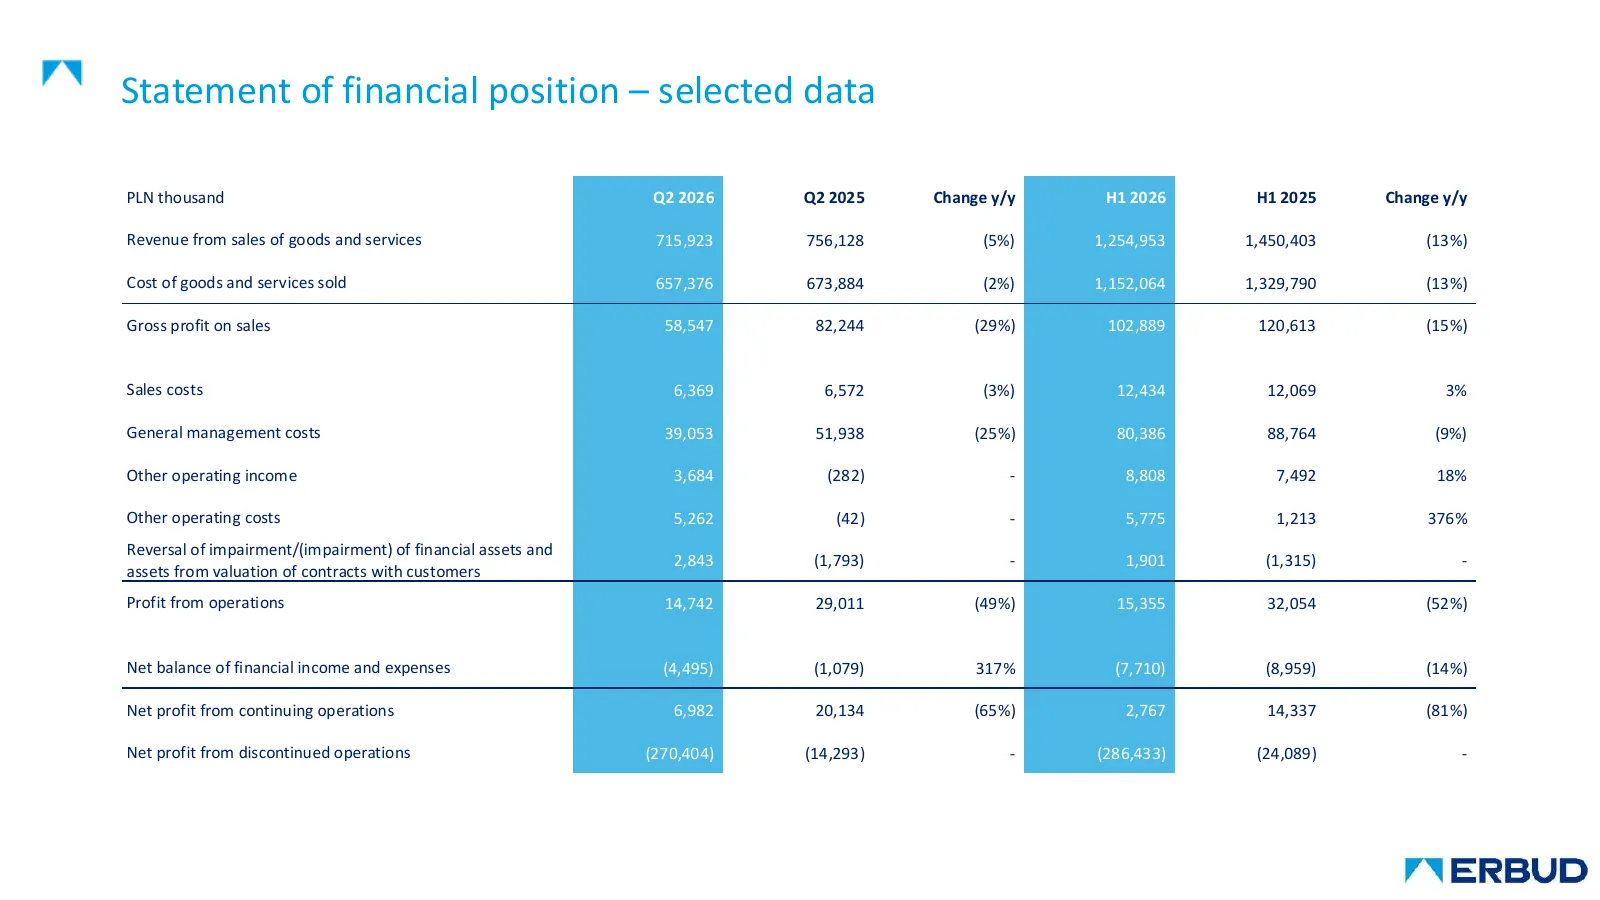
Statement of financial position – selected data PLN thousand Q2 2026 Q2 2025 Change y/y H1 2026 H1 2025 Change y/y Revenue from sales of goods and services 715,923 756,128 (5%) 1,254,953 1,450,403 (13%) Cost of goods and services sold 657,376 673,884 (2%) 1,152,064 1,329,790 (13%) Gross profit on sa

Slide 49: Contact: Investor relations
CONTACT: CONTACT: INVESTOR RELATIONS MEDIA RELATIONS (ERBUD) (ERBUD) Agnieszka Głowacka Marcin Kasprzak Vice President of the Management marcin.kasprzak@erbud.pl Board 792 280 805 CONTACT: CONTACT: INVESTOR RELATIONS MEDIA RELATIONS (ONDE) (ONDE) Paweł Przybylski Daniel Mackiewicz President of the M
Source: company website