PT Bank Negara Indonesia (Persero) Tbk Class B · IDX:BBNI
PT Bank Negara Indonesia (Persero) Tbk Class B — Q1 2011 Earnings Presentation
48 slides from PT Bank Negara Indonesia (Persero) Tbk Class B's earnings presentation, Apr 27, 2011
Slide 1: Corporate Presentation 1Q 2011
Corporate Presentation 1Q 2011 PT Bank Negara Indonesia (Persero) Tbk Disclaimer: This report has been prepared by PT Bank Negara Indonesia (Persero) Tbk (Bank BNI) independently and is circulated for the purpose of general information only, It is not intended to the specific person who may receive
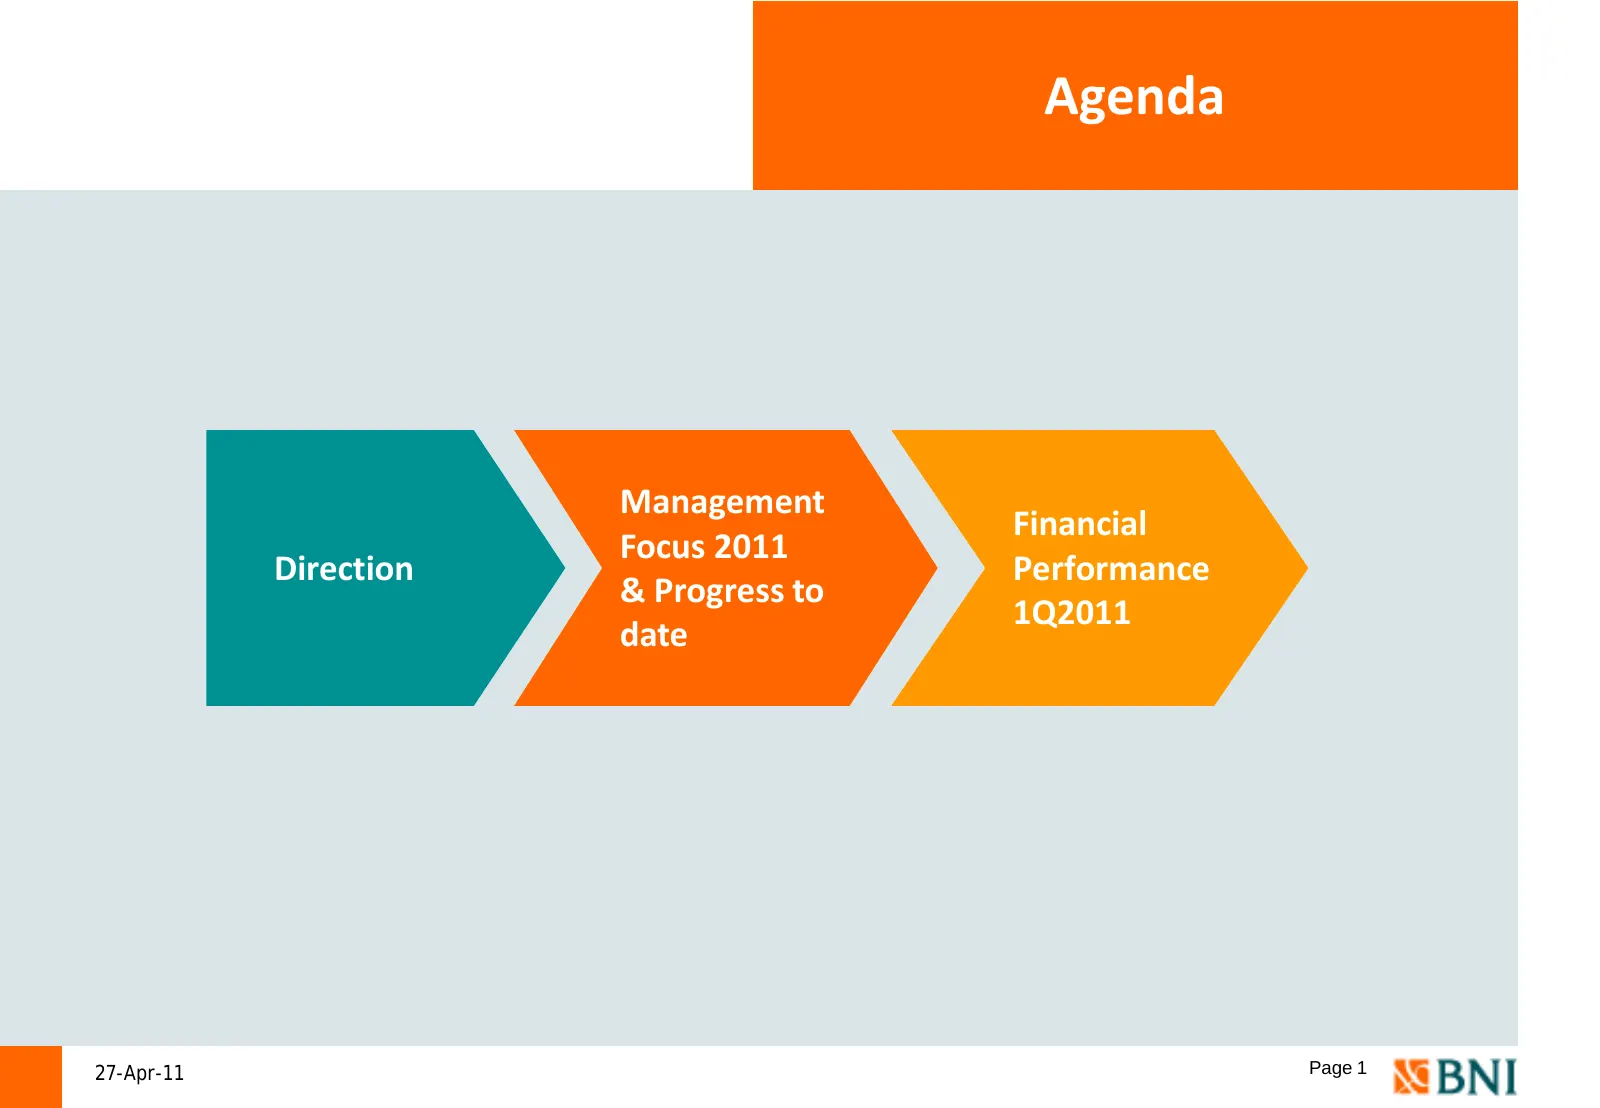
Slide 2: Agenda
Agenda Management Financial Focus 2011 Direction Performance & Progress to 1Q2011 date 27-Apr-11 Page 1
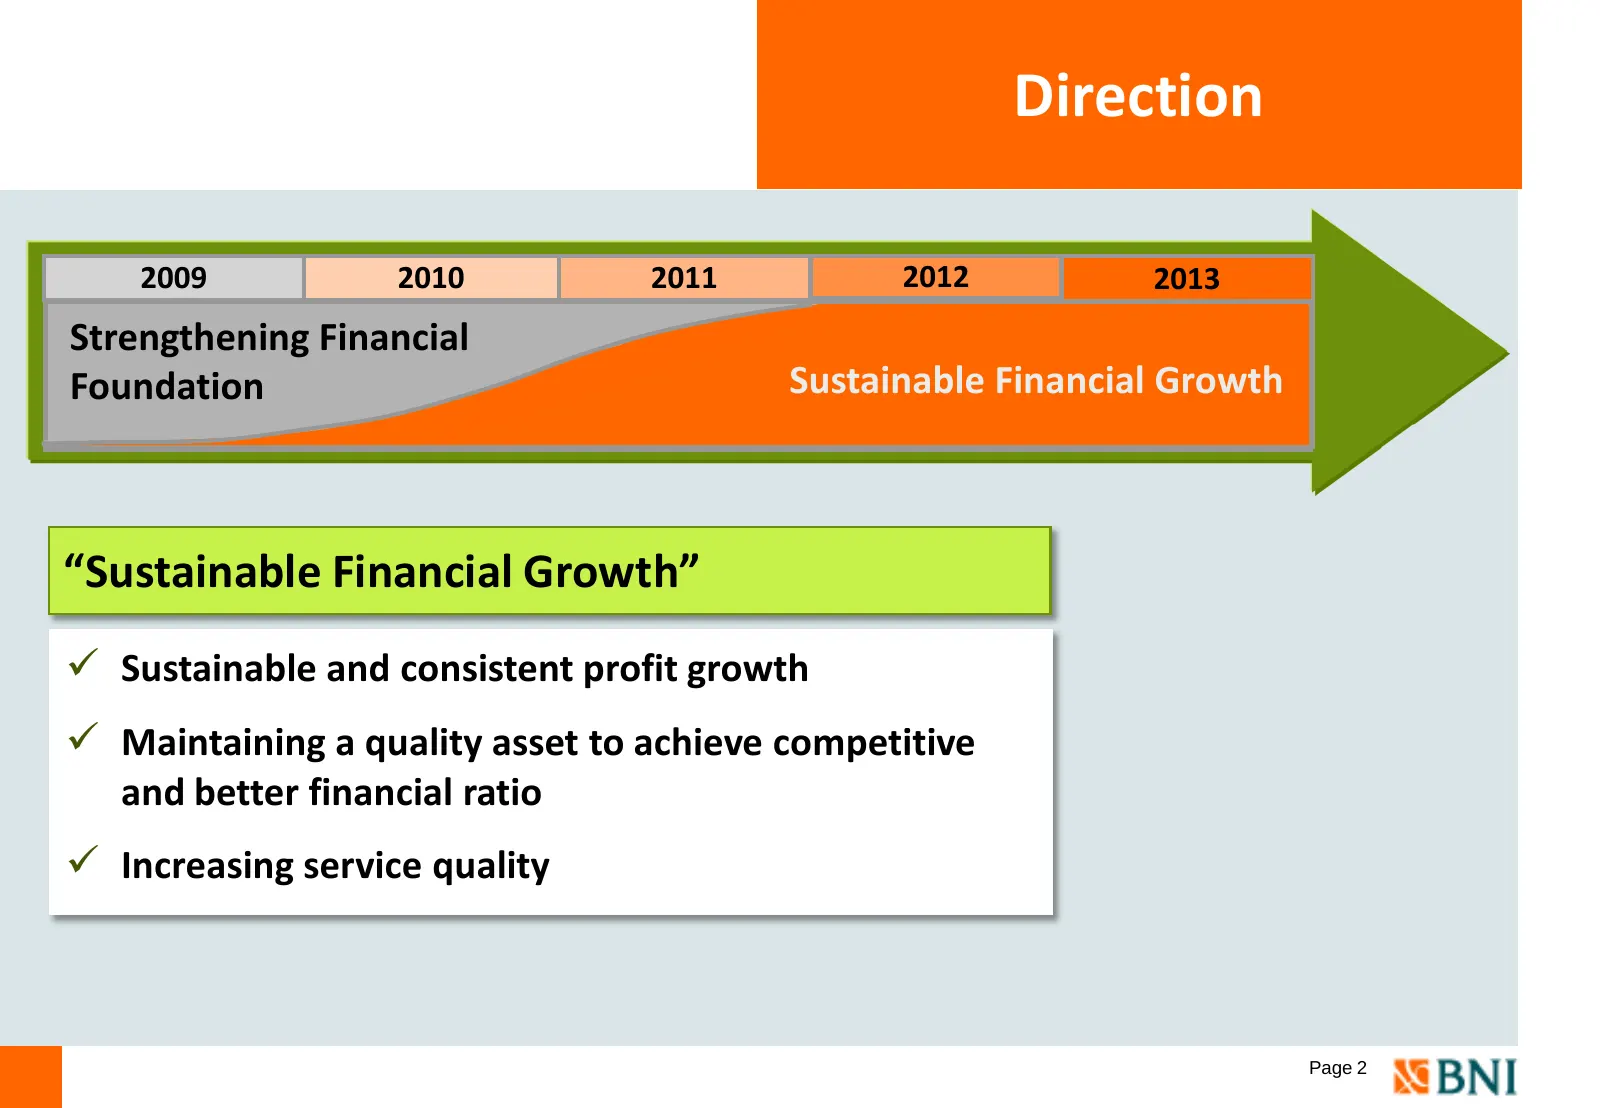
Slide 3: Direction
Direction 2009 2010 2011 2012 2013 Strengthening Financial Foundation Sustainable Financial Growth “Sustainable Financial Growth” Sustainable and consistent profit growth Maintaining a quality asset to achieve competitive and better financial ratio Increasing service quality Page 2
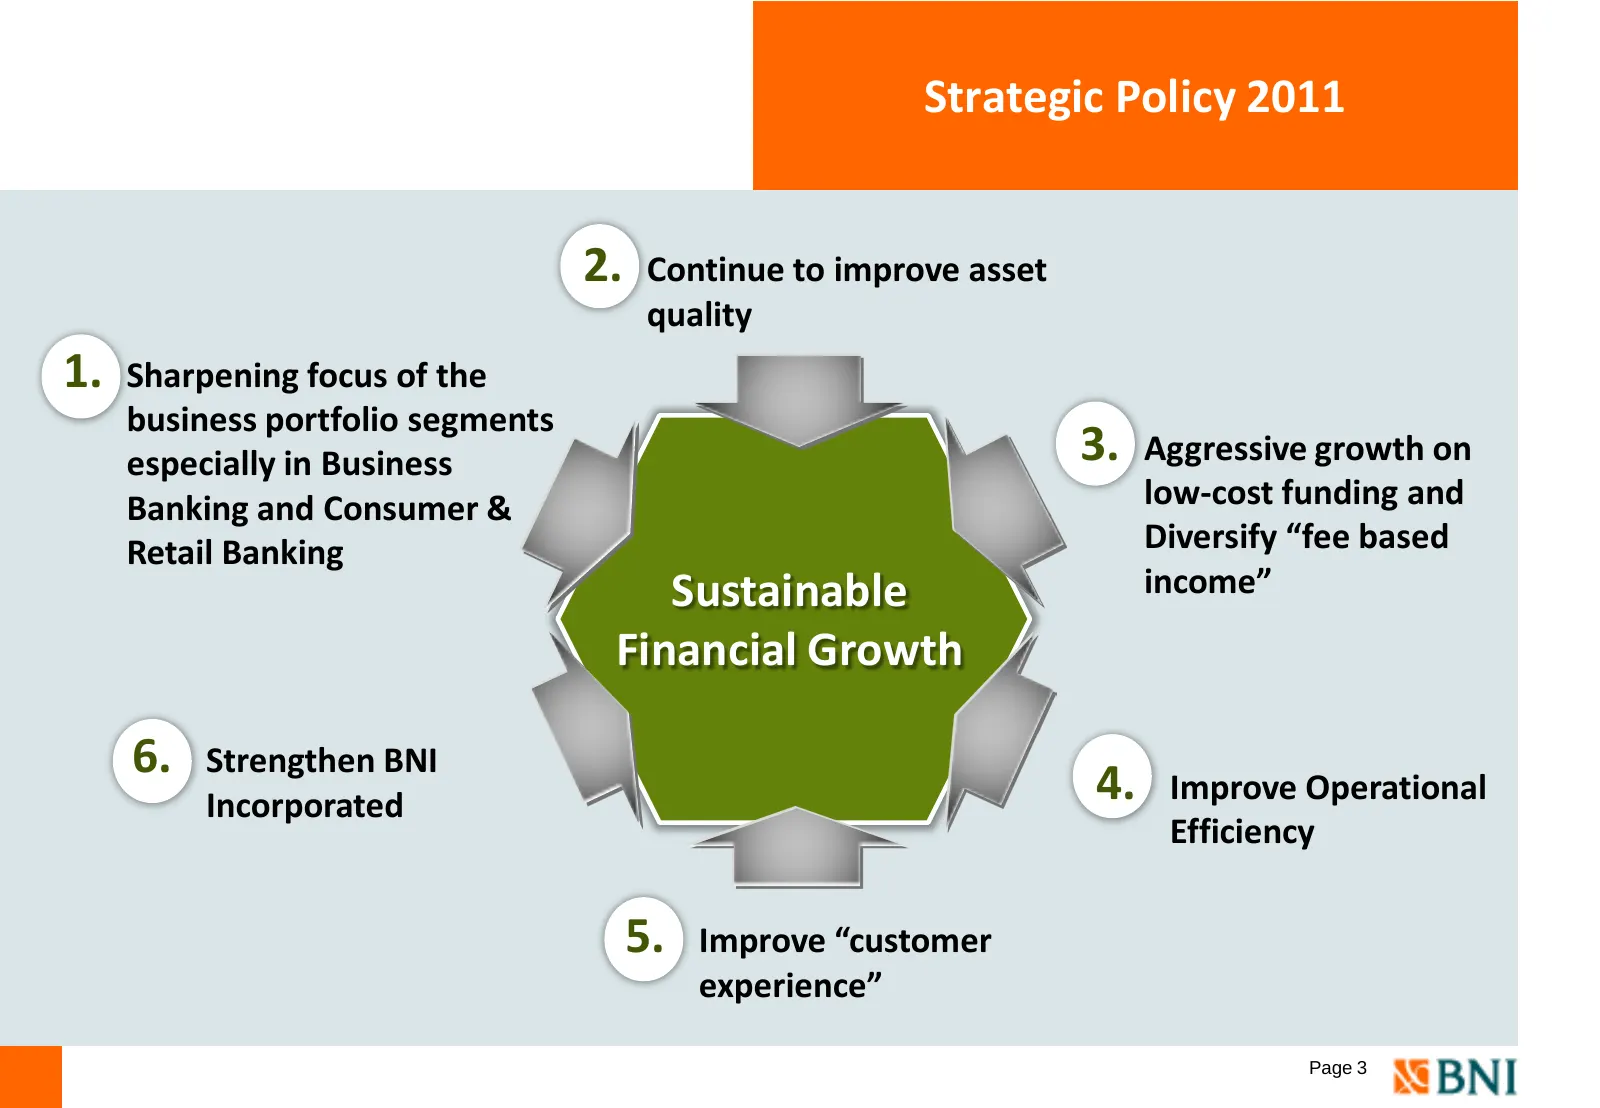
Slide 4: Strategic Policy 2011
Strategic Policy 2011 2. Continue to improve asset quality 1. Sharpening focus of the business portfolio segments especially in Business 3. Aggressive growth on Banking and Consumer & low-cost funding and Retail Banking Diversify “fee based Sustainable income” Financial Growth 6. Strengthen BNI Inco
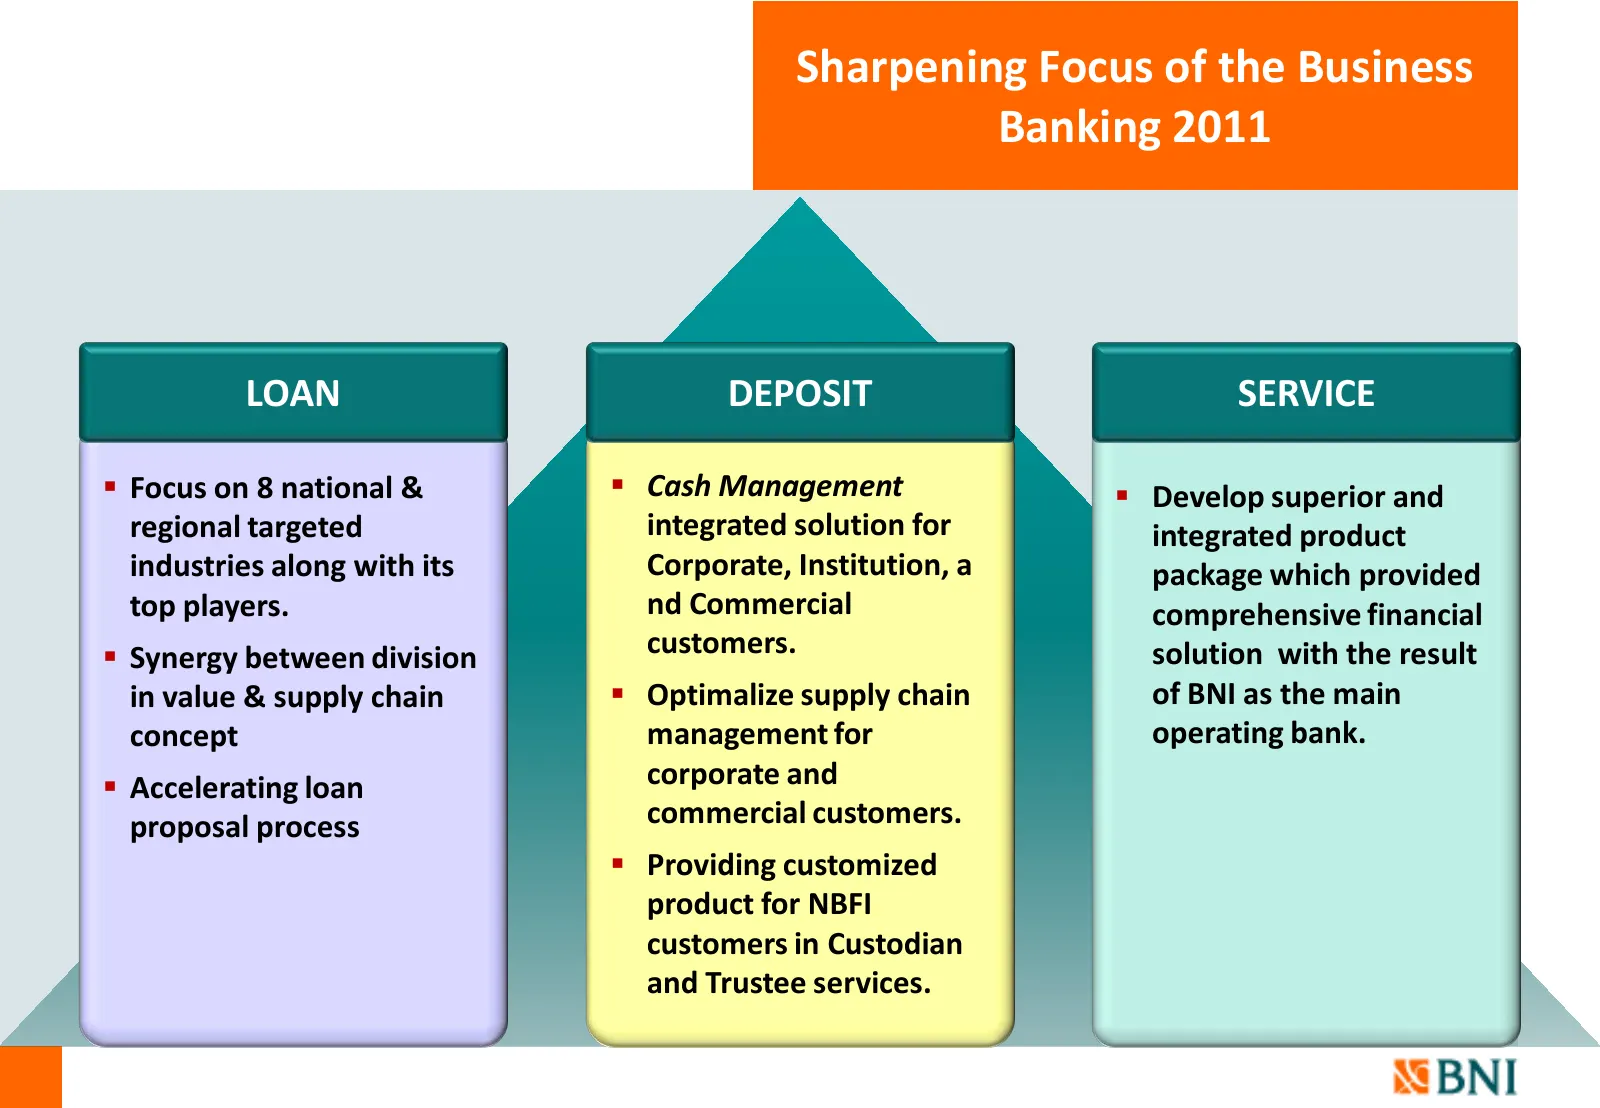
Slide 5: Sharpening Focus of the Business Banking 2011
Sharpening Focus of the Business Banking 2011 LOAN DEPOSIT SERVICE Focus on 8 national & Cash Management Develop superior and regional targeted integrated solution for integrated product industries along with its Corporate, Institution, a package which provided top players. nd Commercial compr
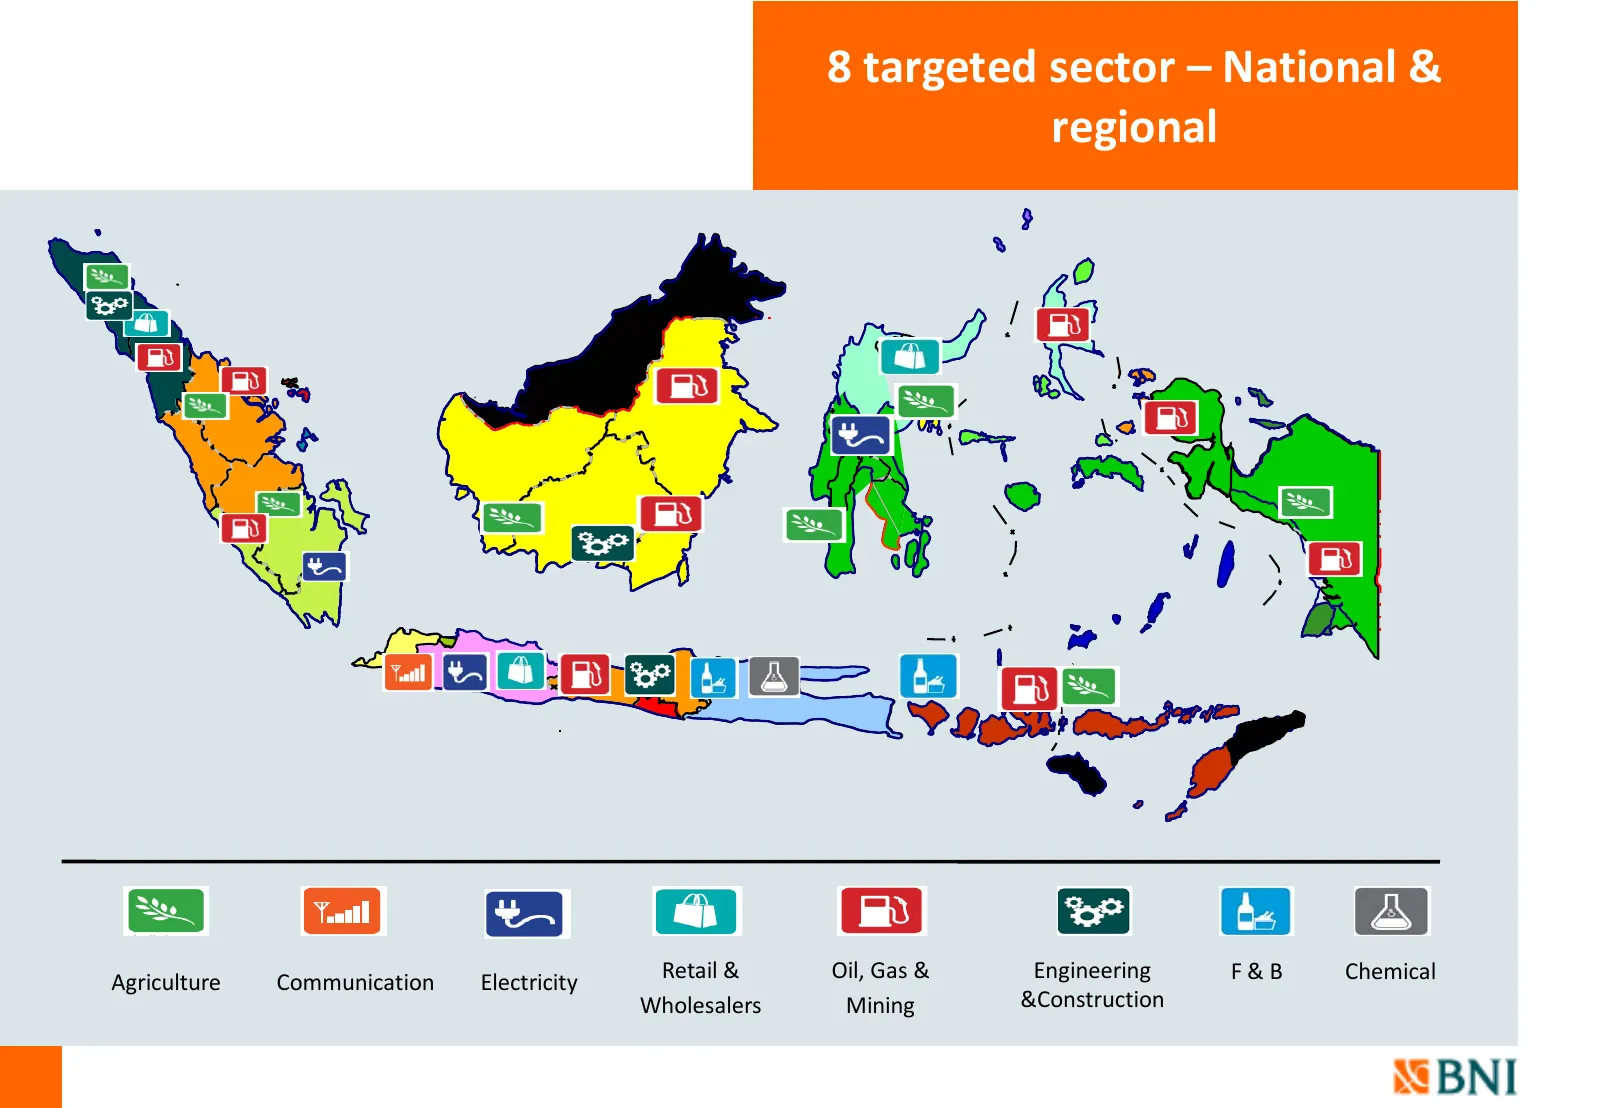
Slide 6: 8 targeted sector – National & regional
8 targeted sector – National & regional Retail & Oil, Gas & Engineering F&B Chemical Agriculture Communication Electricity Wholesalers Mining &Construction
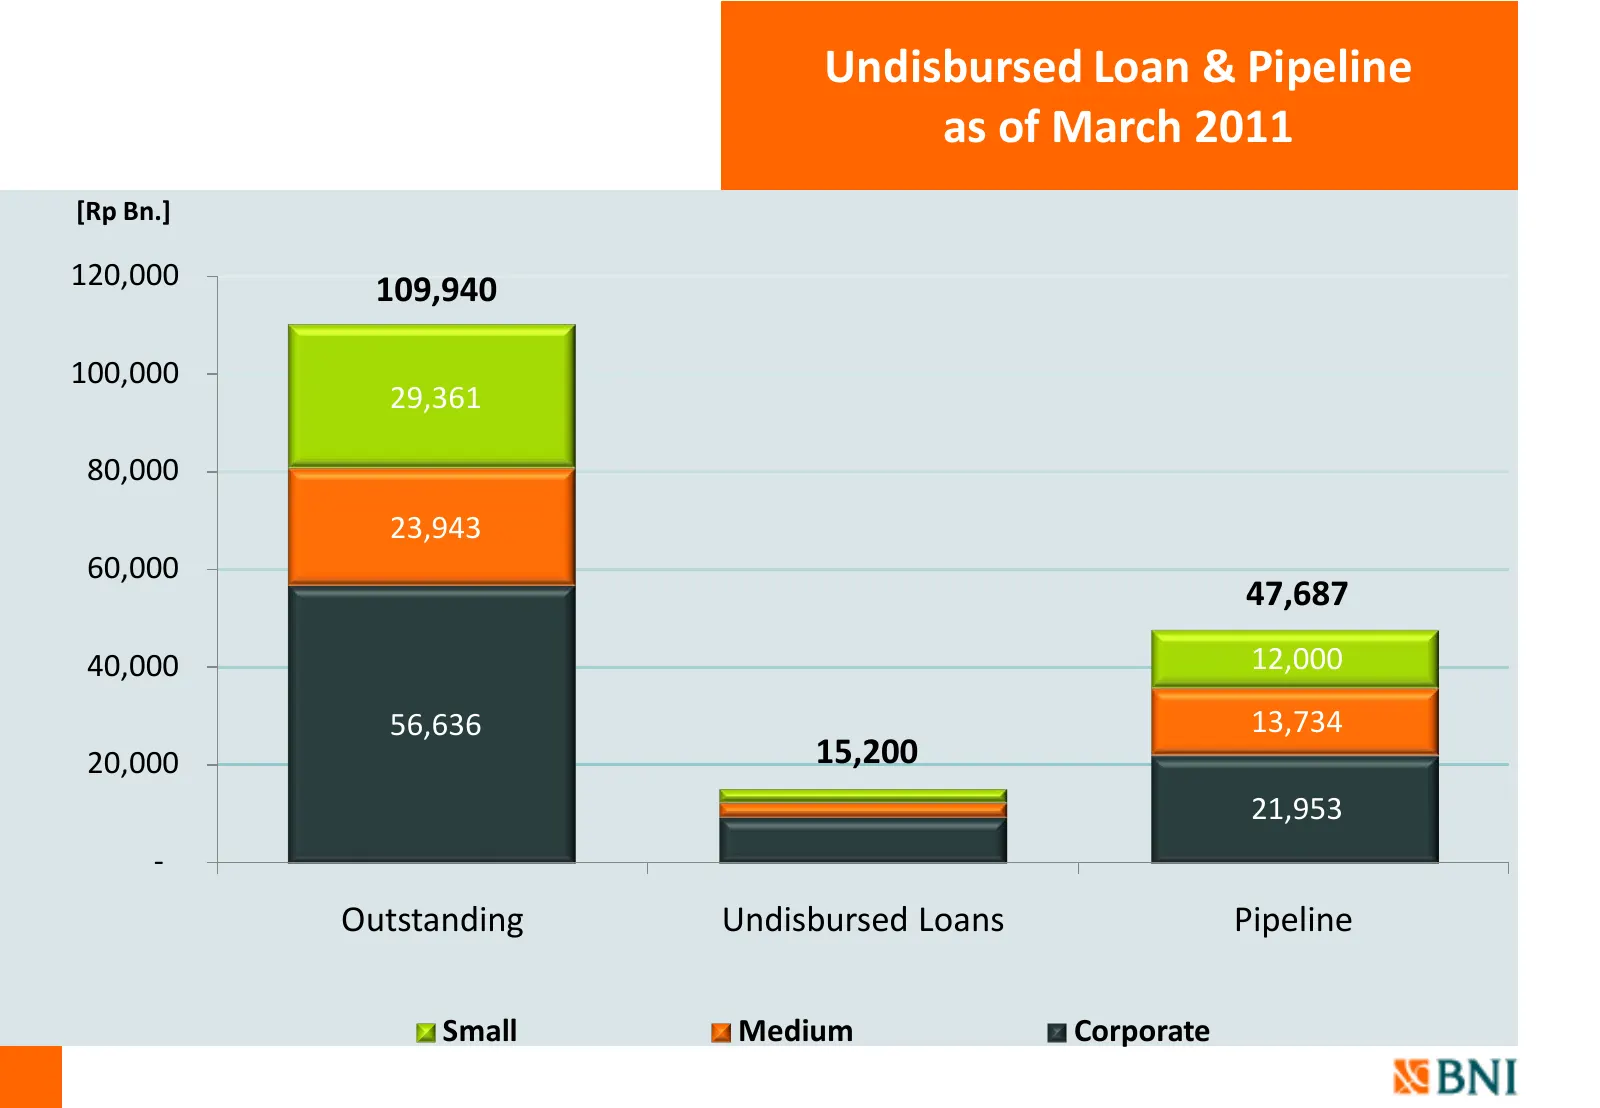
Slide 7: Undisbursed Loan & Pipeline as of March 2011
Undisbursed Loan & Pipeline as of March 2011 [Rp Bn.] 120,000 109,940 100,000 29,361 80,000 23,943 60,000 47,687 40,000 12,000 56,636 13,734 20,000 15,200 21,953 - Outstanding Undisbursed Loans Pipeline Small Medium Corporate
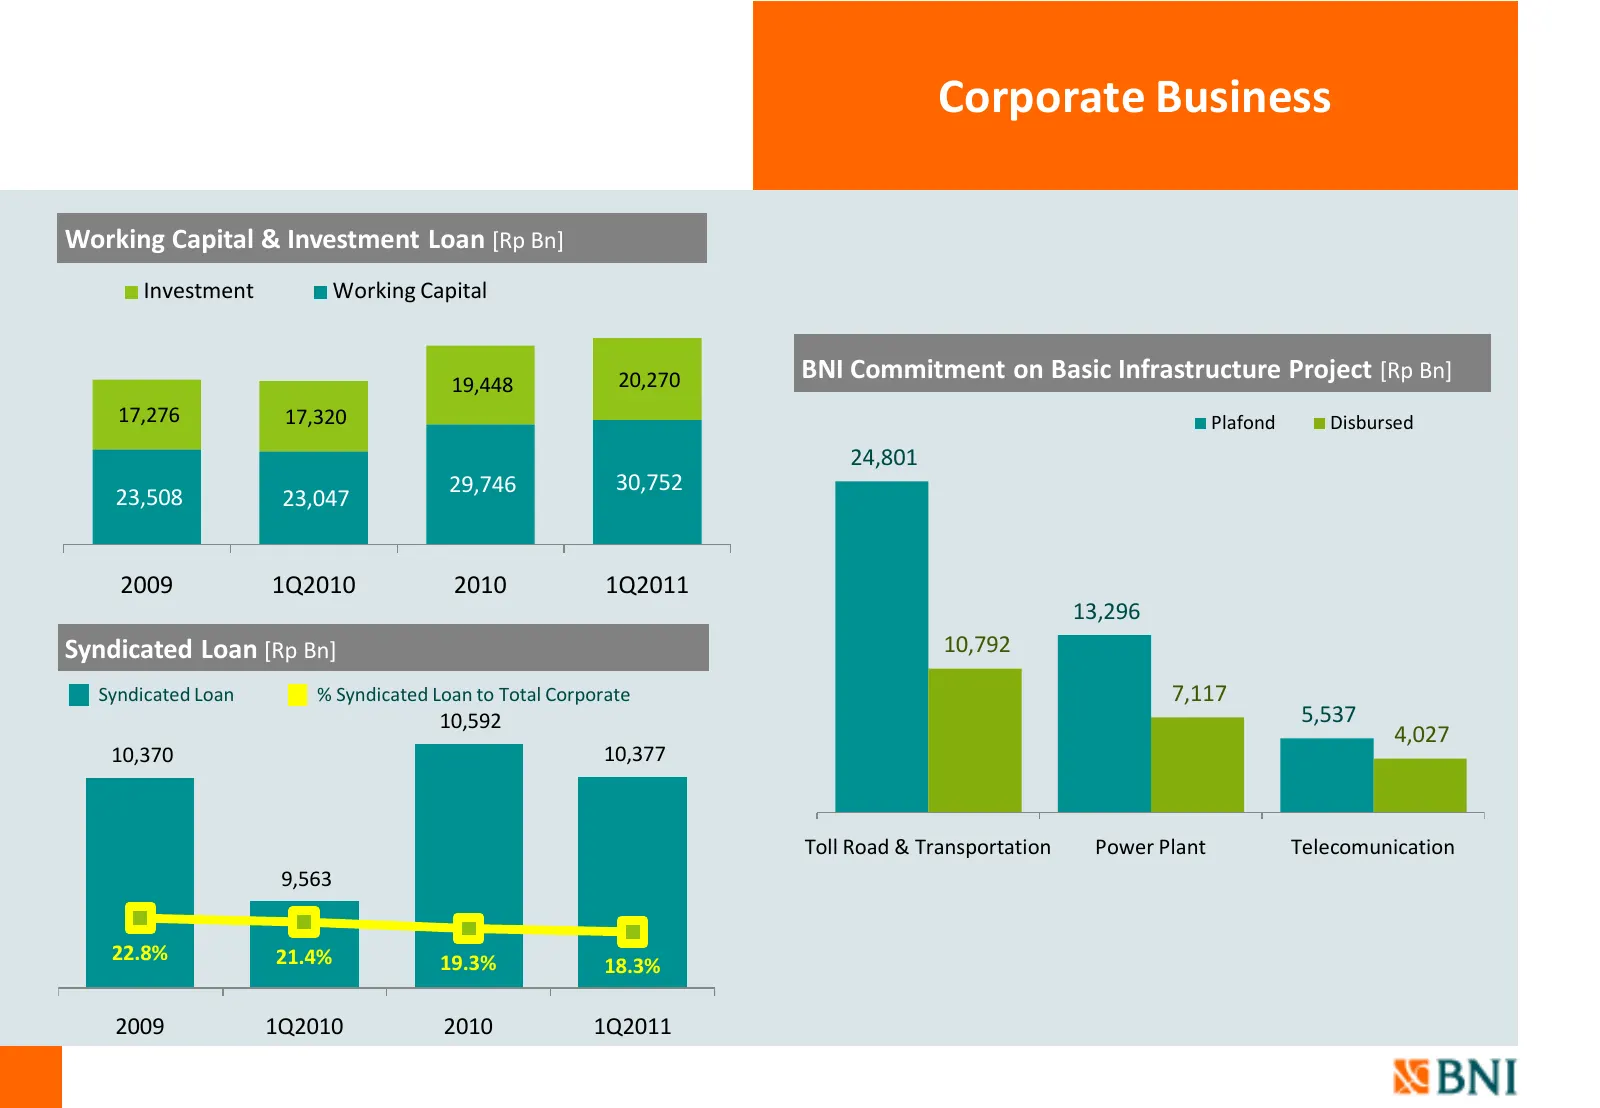
Slide 8: Corporate Business
Corporate Business Working Capital & Investment Loan [Rp Bn] Investment Working Capital 20,270 BNI Commitment on Basic Infrastructure Project [Rp Bn] 19,448 17,276 17,320 Plafond Disbursed 24,801 29,746 30,752 23,508 23,047 2009 1Q2010 2010 1Q2011 13,296 Syndicated Loan [Rp Bn] 10,792 Syndicated Loa
Slide 9: SME Business
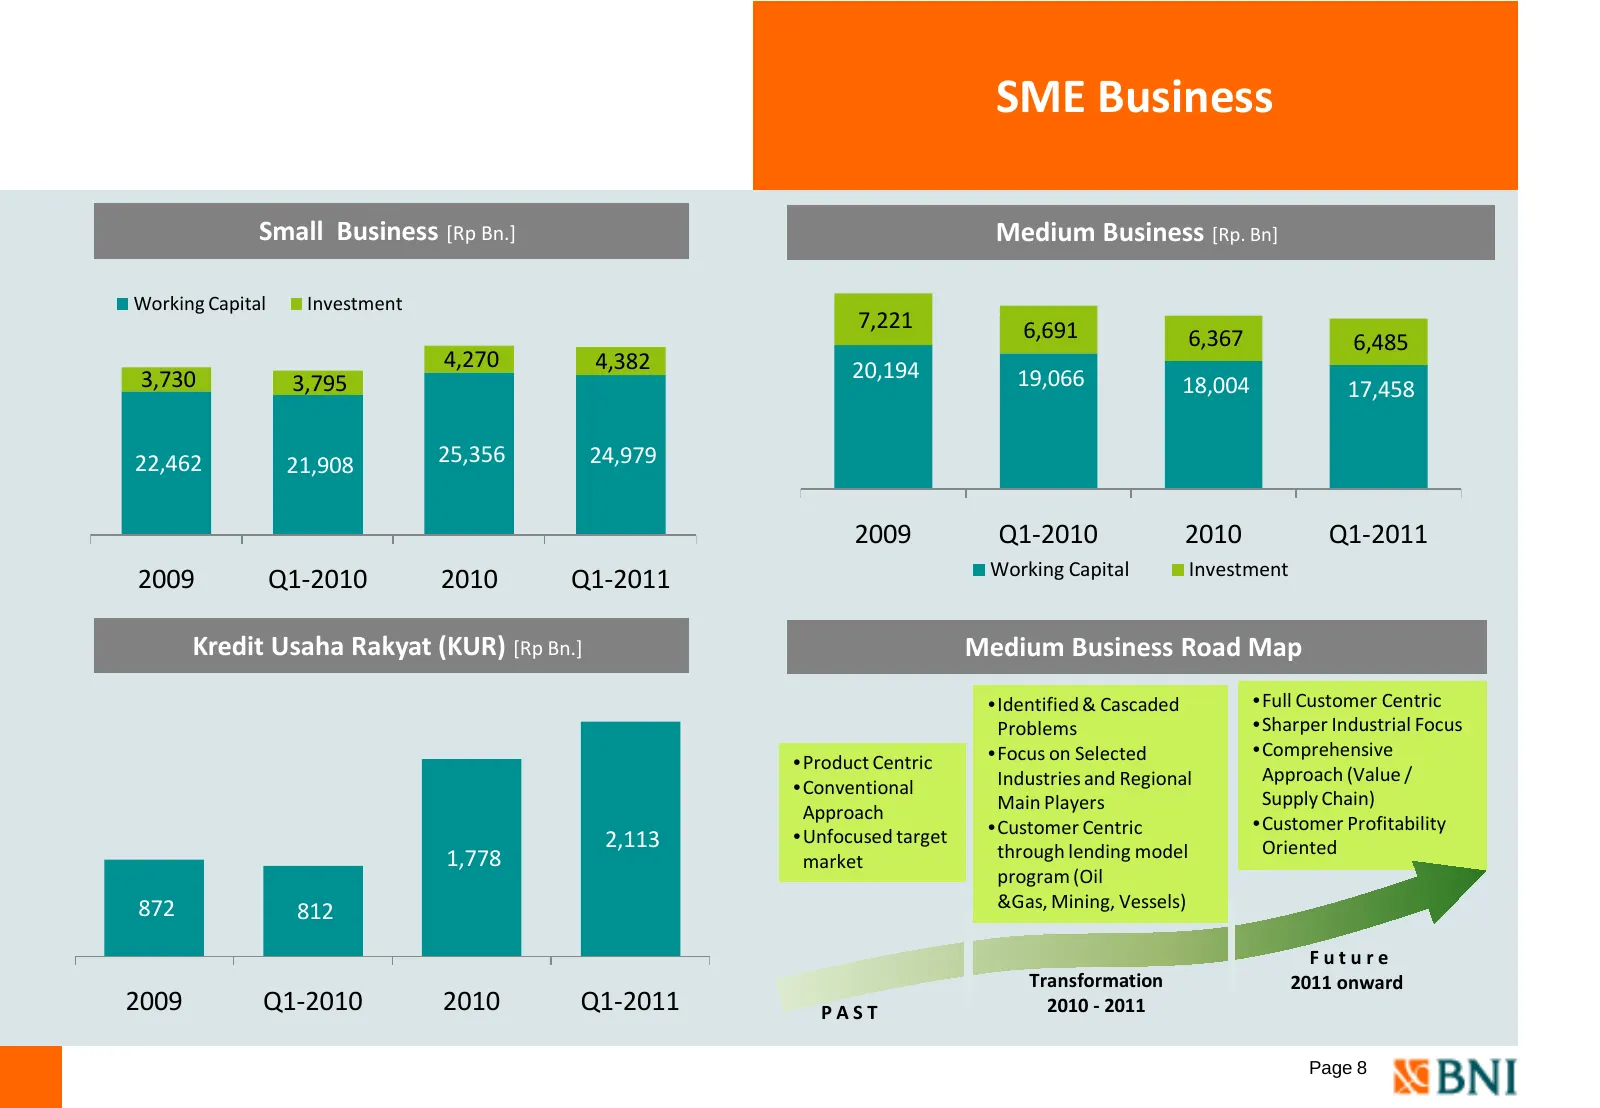
SME Business Small Business [Rp Bn.] Medium Business [Rp. Bn] Working Capital Investment 7,221 6,691 6,367 6,485 4,270 4,382 20,194 3,730 3,795 19,066 18,004 17,458 22,462 21,908 25,356 24,979 2009 Q1-2010 2010 Q1-2011 Working Capital Investment 2009 Q1-2010 2010 Q1-2011 Kredit Usaha Rakyat (KUR) [R
Slide 10: Transactional Banking Business
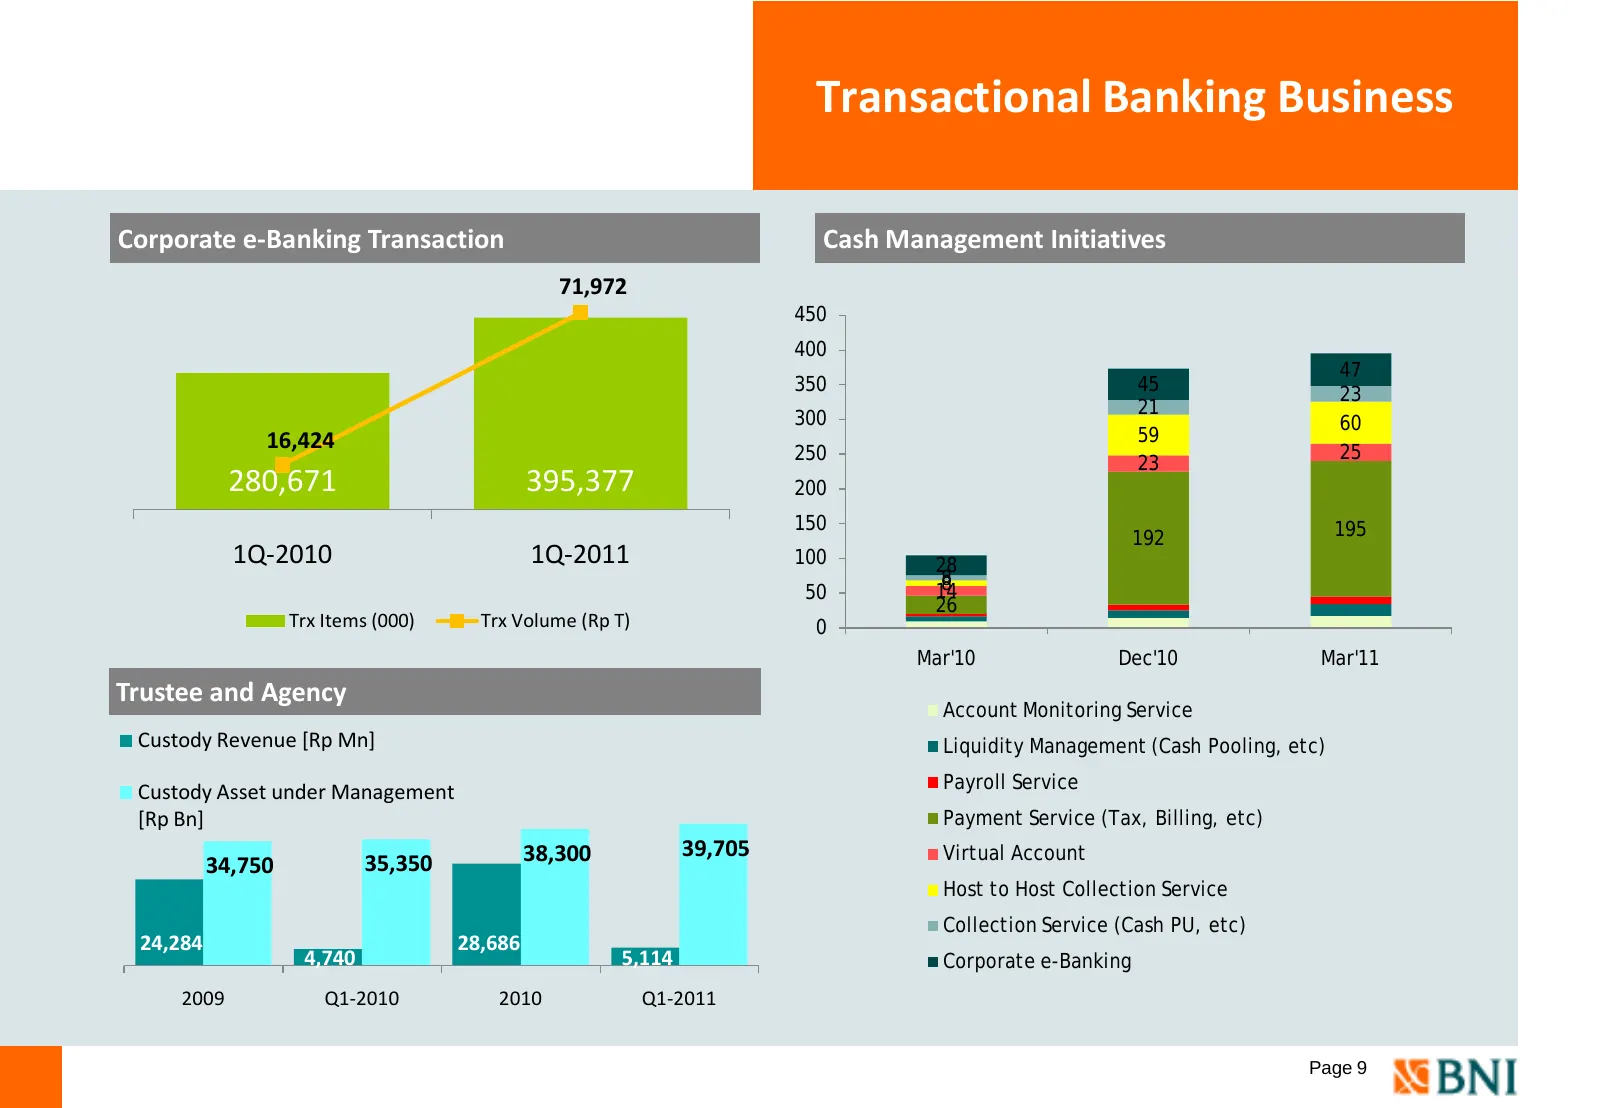
Transactional Banking Business Corporate e-Banking Transaction Cash Management Initiatives 71,972 450 400 47 350 45 23 21 300 60 16,424 59 250 25 23 280,671 395,377 200 150 195 192 1Q-2010 1Q-2011 100 28 8 8 50 14 26 Trx Items (000) Trx Volume (Rp T) 0 Mar'10 Dec'10 Mar'11 Trustee and Agency Account
Slide 11: Consumer Loan
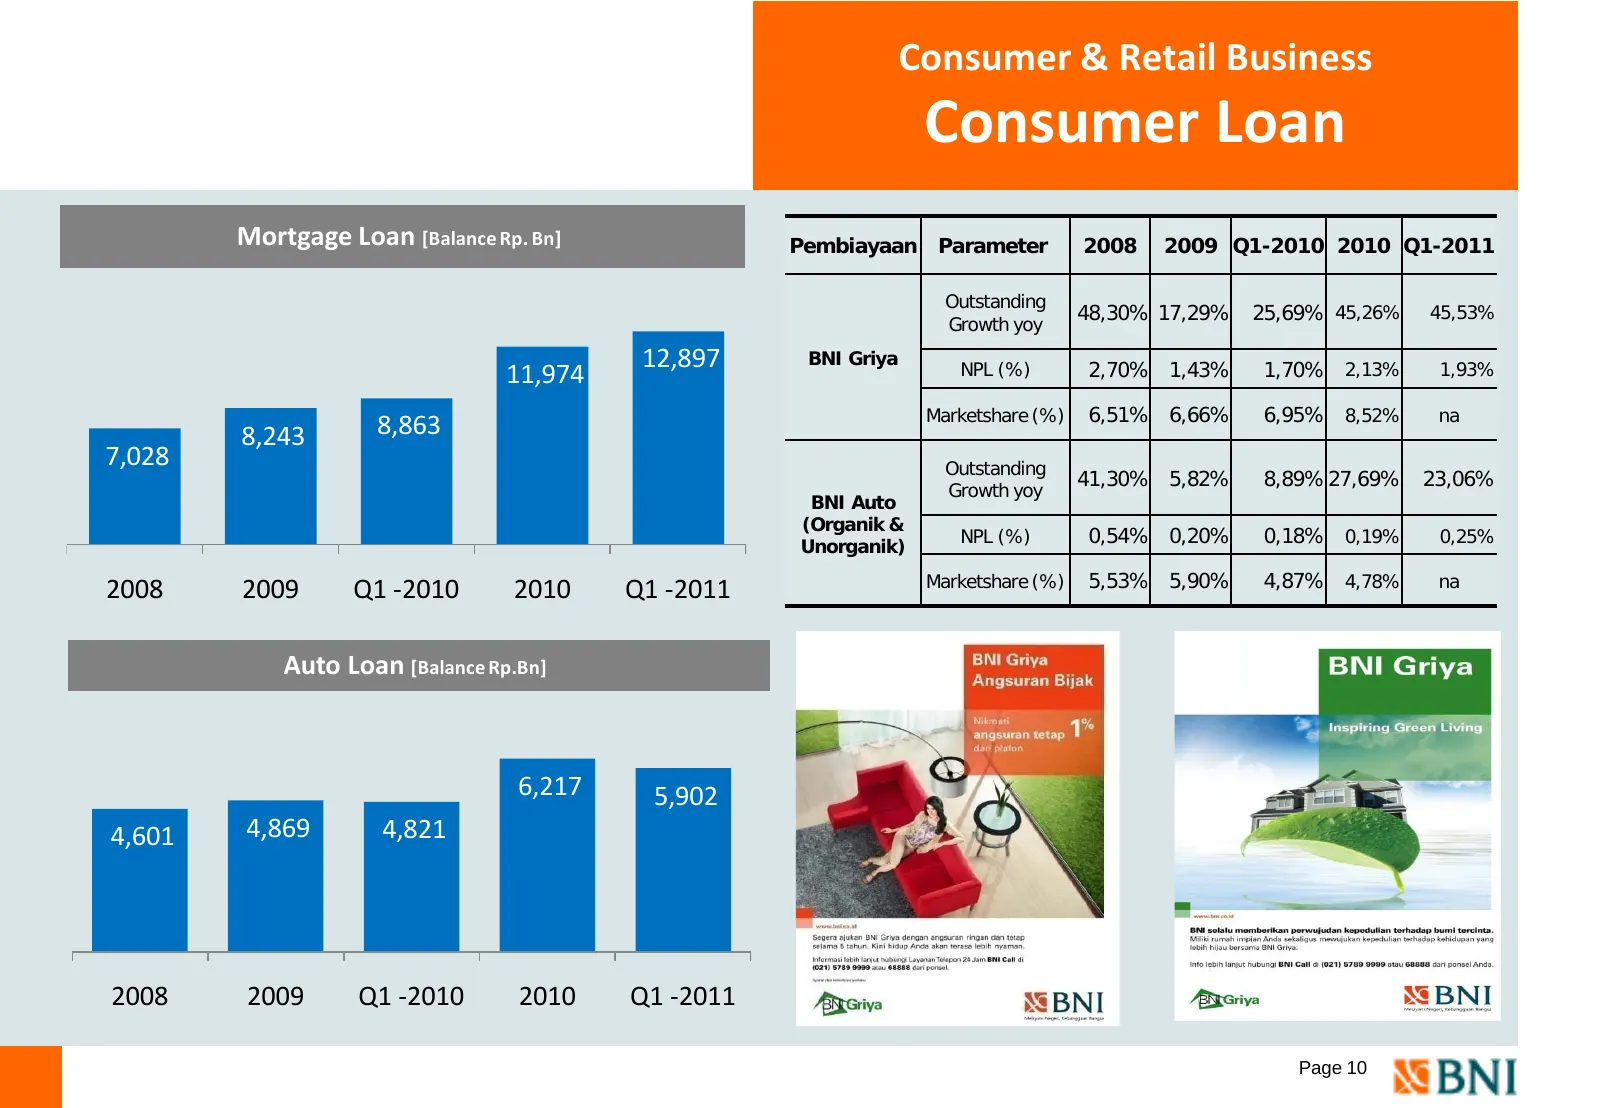
Consumer & Retail Business Consumer Loan Mortgage Loan [Balance Rp. Bn] Pembiayaan Parameter 2008 2009 Q1-2010 2010 Q1-2011 Outstanding 48,30% 17,29% 25,69% 45,26% 45,53% Growth yoy 12,897 BNI Griya 2,70% 1,43% 1,70% 2,13% 11,974 NPL (%) 1,93% Marketshare (%) 6,51% 6,66% 6,95% 8,52% na 8,243 8,863 7
Slide 12: BNI Credit Card grew faster than industry in all key Business Indicators
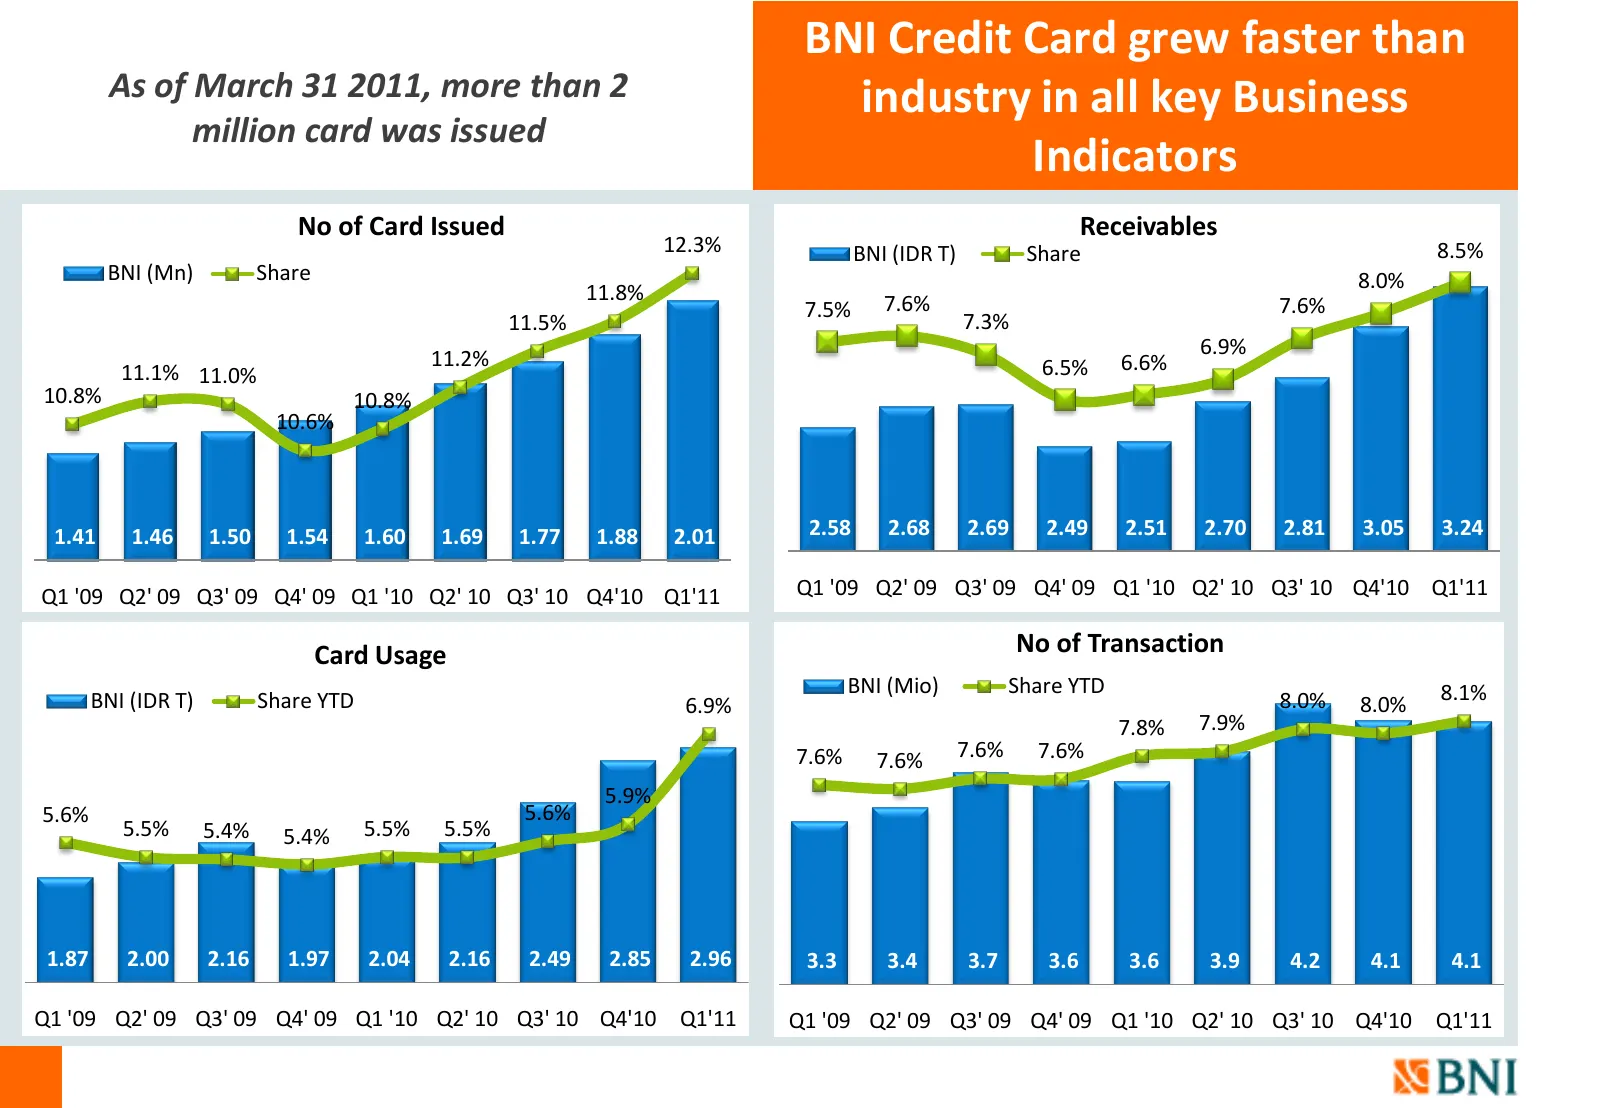
BNI Credit Card grew faster than As of March 31 2011, more than 2 industry in all key Business million card was issued Indicators No of Card Issued Receivables 12.3% BNI (IDR T) Share 8.5% BNI (Mn) Share 8.0% 11.8% 7.6% 7.5% 7.6% 11.5% 7.3% 11.2% 6.9% 11.1% 11.0% 6.5% 6.6% 10.8% 10.8% 10.6% 1.41 1.4
Slide 13: Savings
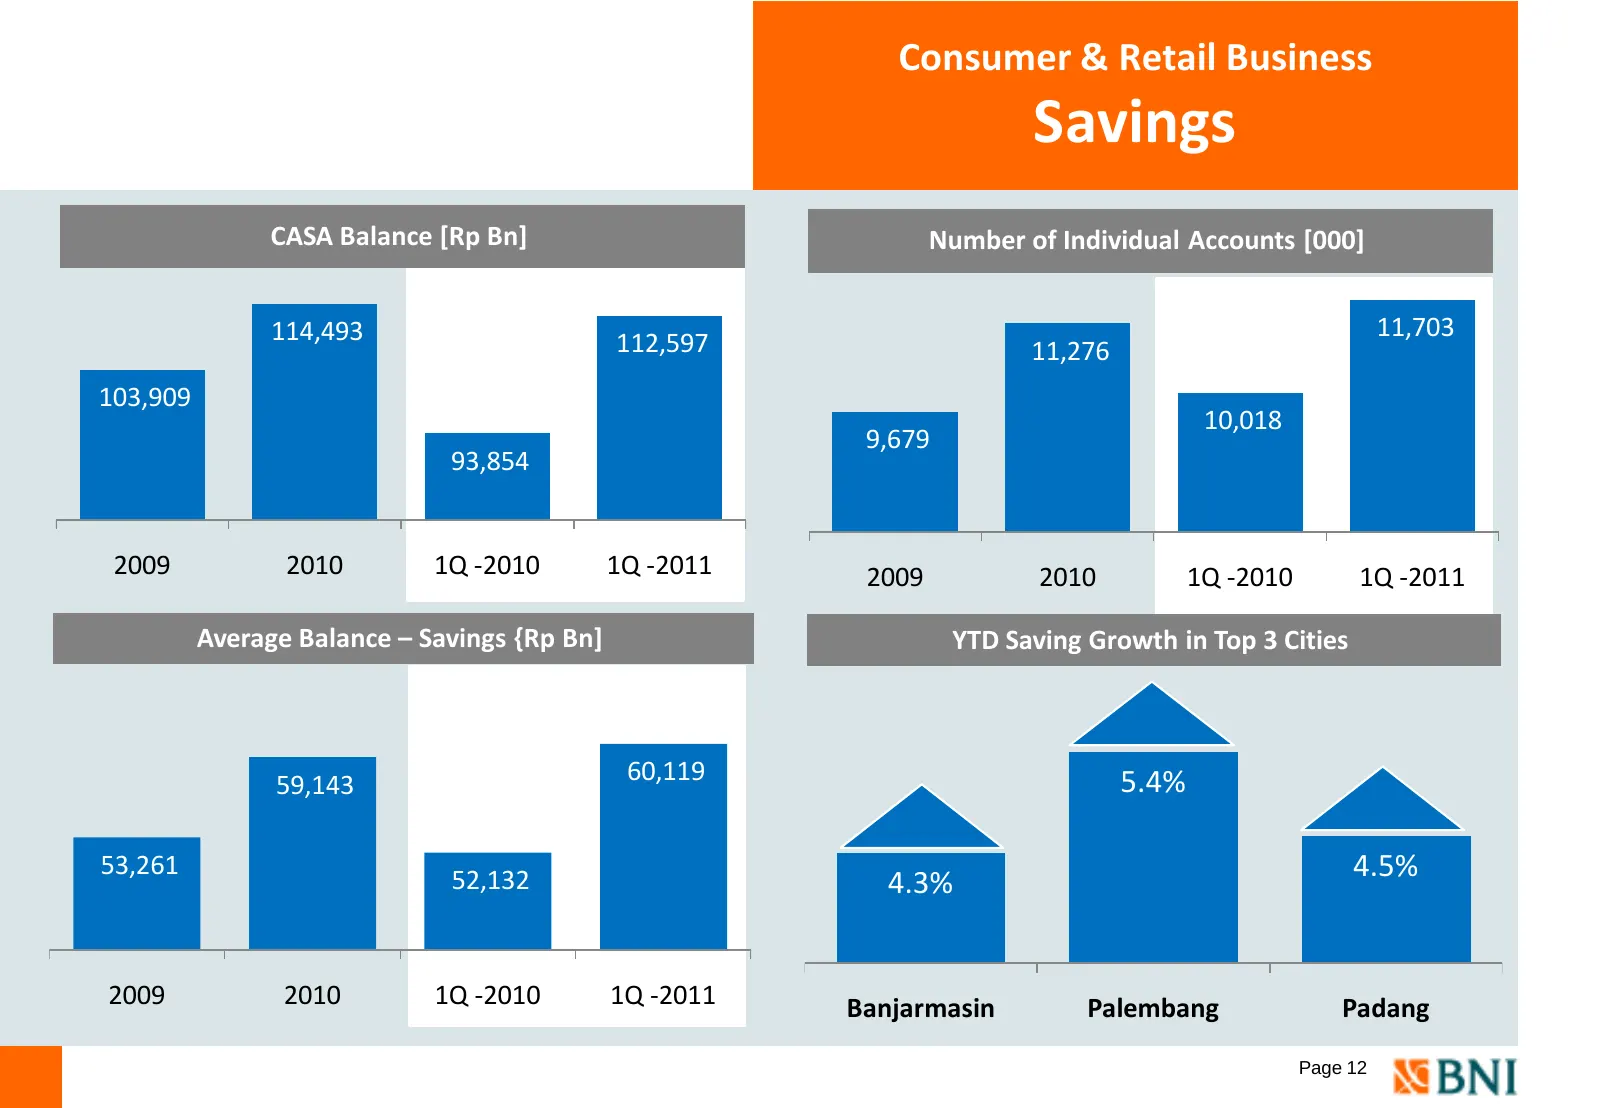
Consumer & Retail Business Savings CASA Balance [Rp Bn] Number of Individual Accounts [000] 114,493 11,703 112,597 11,276 103,909 10,018 9,679 93,854 2009 2010 1Q -2010 1Q -2011 2009 2010 1Q -2010 1Q -2011 Average Balance – Savings {Rp Bn] YTD Saving Growth in Top 3 Cities 59,143 60,119 5.4% 53,261
Slide 14: Performance Bancassurance per Channel
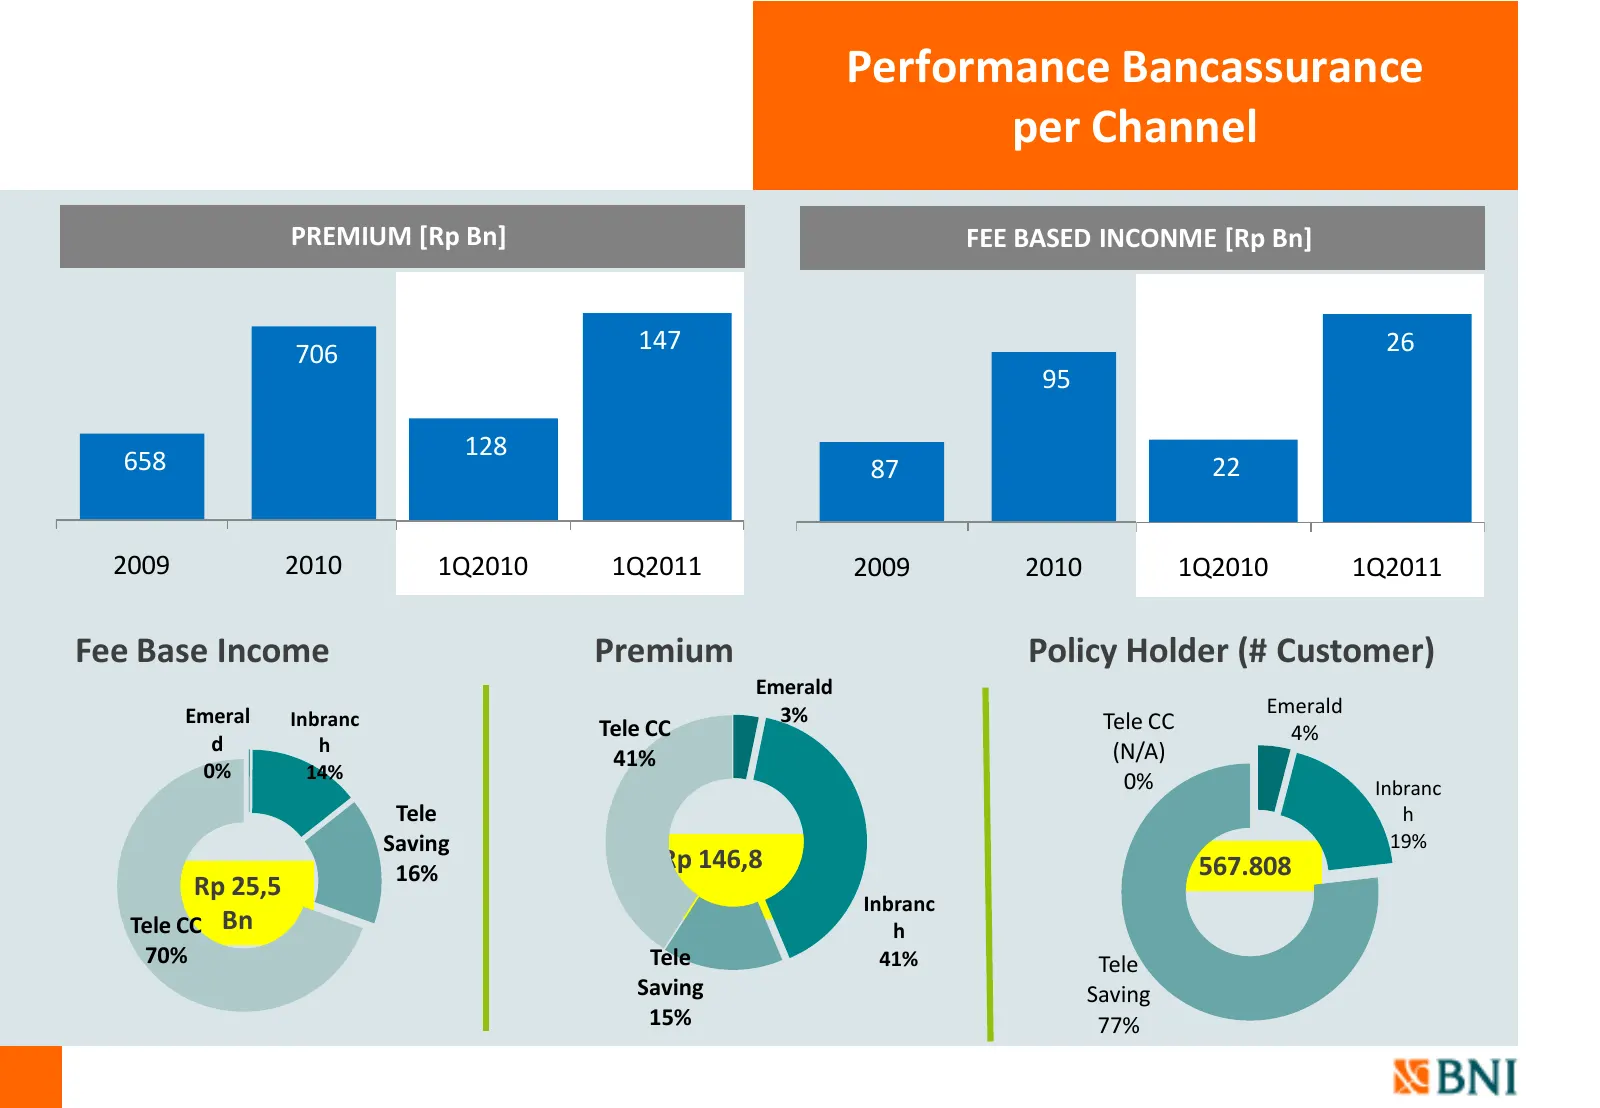
Performance Bancassurance per Channel PREMIUM [Rp Bn] FEE BASED INCONME [Rp Bn] 706 147 26 95 128 658 87 22 2009 2010 1Q2010 1Q2011 2009 2010 1Q2010 1Q2011 Fee Base Income Premium Policy Holder (# Customer) Emerald Emeral 3% Emerald Inbranc Tele CC Tele CC d 4% h (N/A) 41% 0% 14% 0% Inbranc Tele h S
Slide 15: E-banking transactions
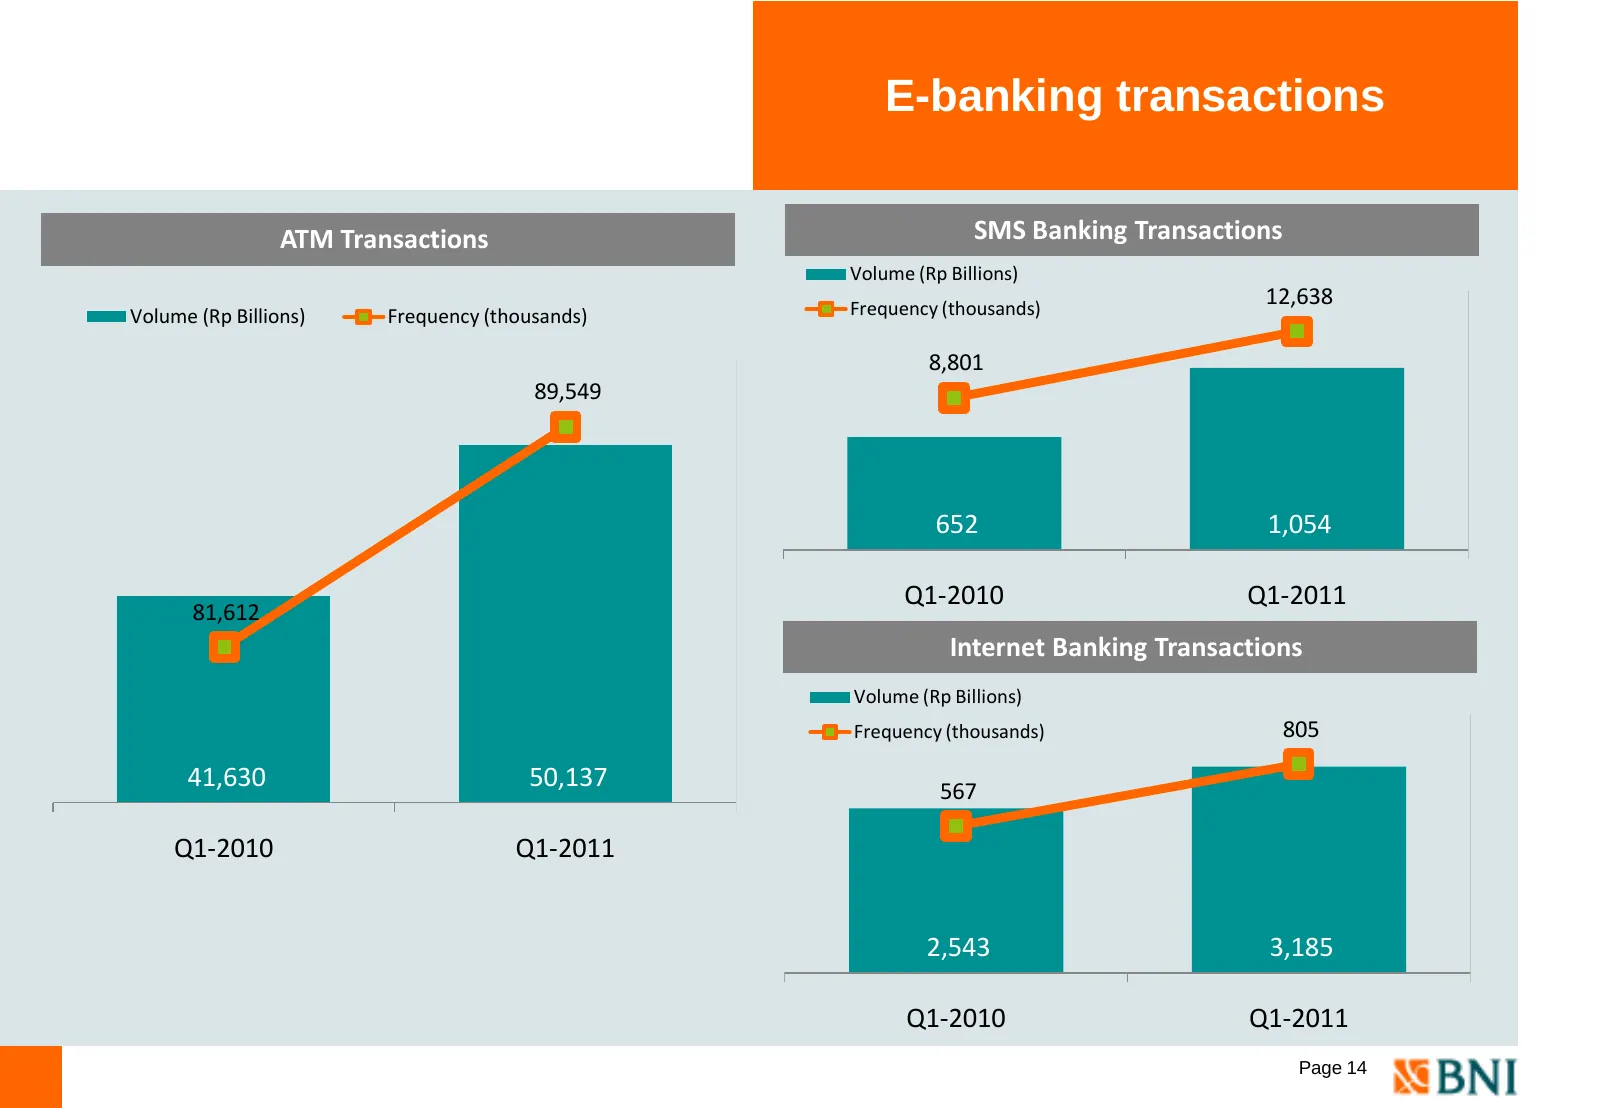
E-banking transactions ATM Transactions SMS Banking Transactions Volume (Rp Billions) Frequency (thousands) 12,638 Volume (Rp Billions) Frequency (thousands) 8,801 89,549 652 1,054 Q1-2010 Q1-2011 81,612 Internet Banking Transactions Volume (Rp Billions) Frequency (thousands) 805 41,630 50,137 567 Q
Slide 16: Consumer & Retail Business Initiative
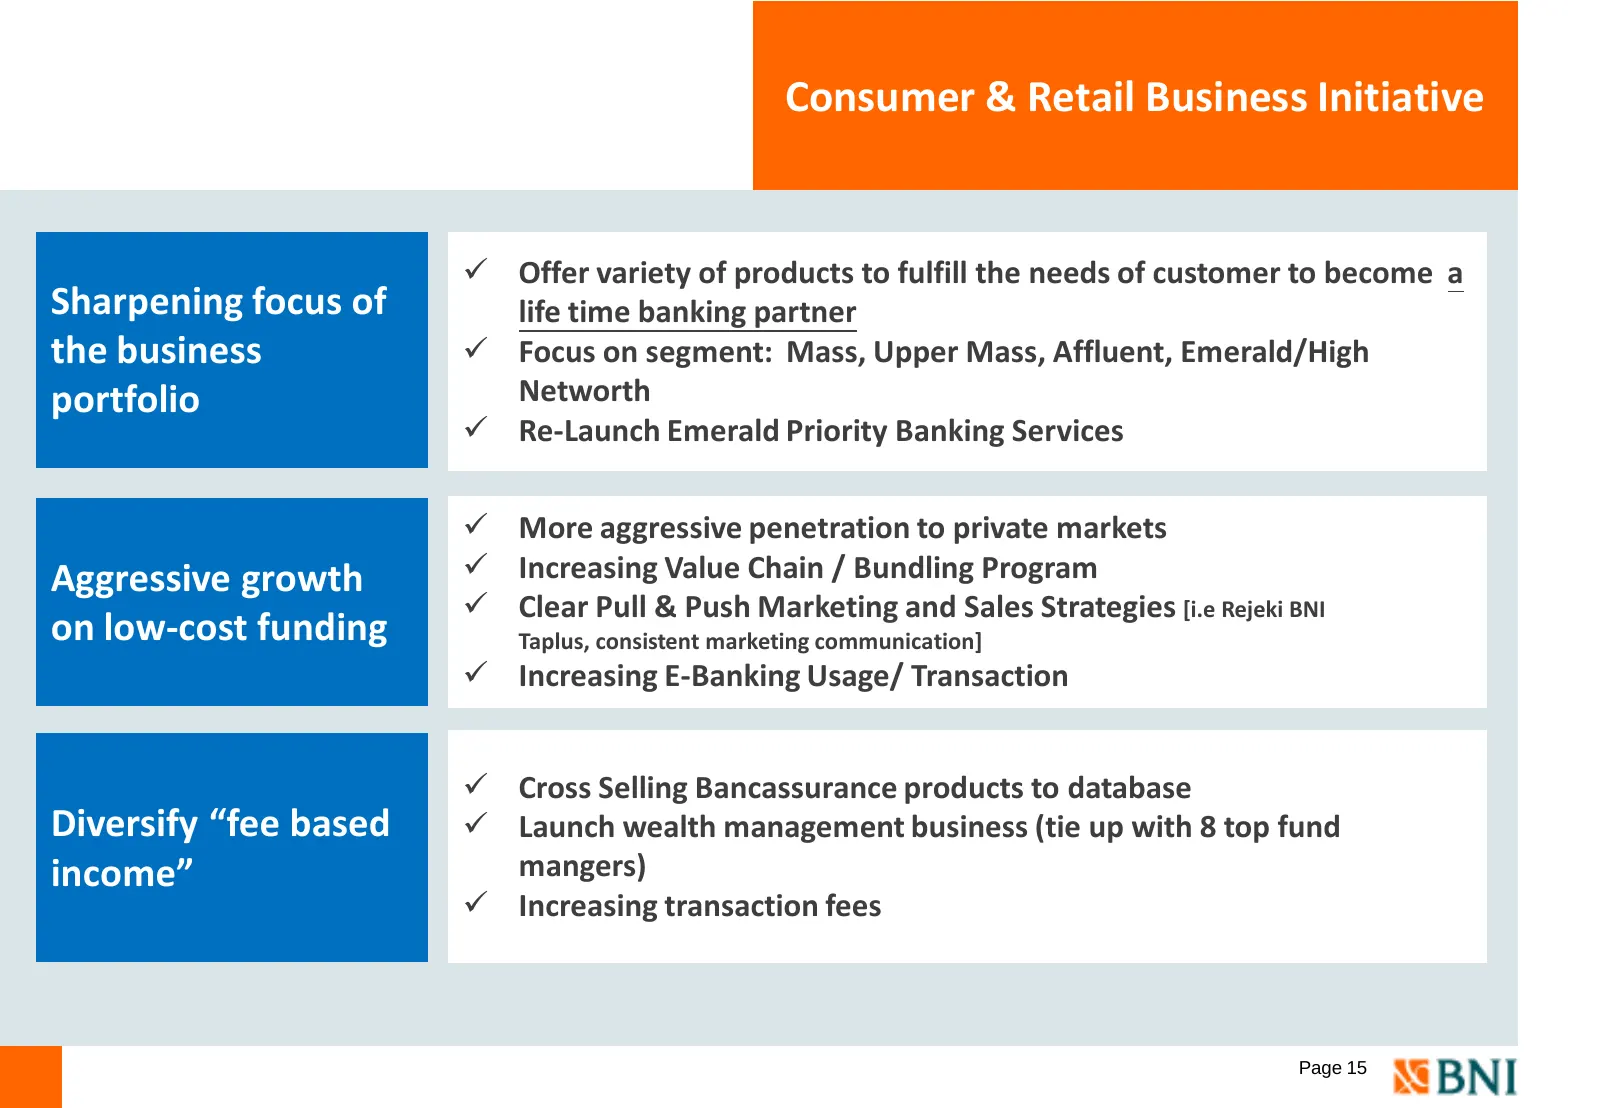
Consumer & Retail Business Initiative Offer variety of products to fulfill the needs of customer to become a Sharpening focus of life time banking partner the business Focus on segment: Mass, Upper Mass, Affluent, Emerald/High portfolio Networth Re-Launch Emerald Priority Banking Services Mo
Slide 17: International Business
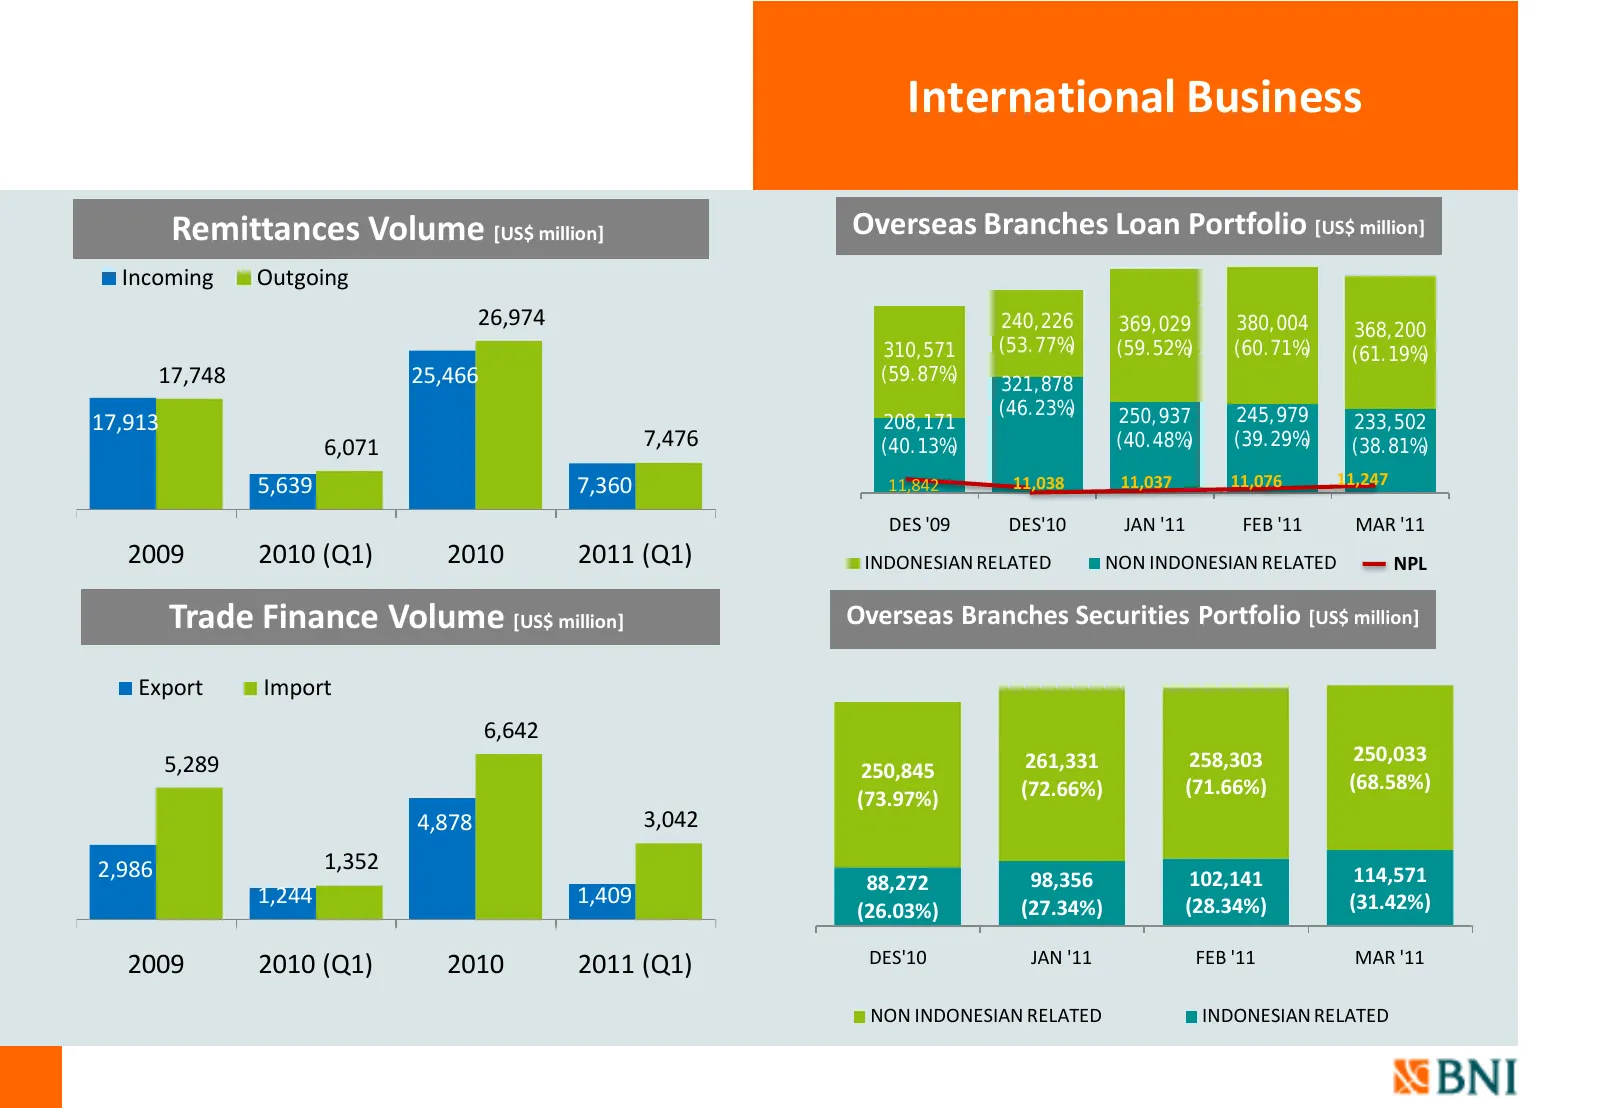
International Business Remittances Volume [US$ million] Overseas Branches Loan Portfolio [US$ million] Incoming Outgoing 26,974 240,226 369,029 380,004 368,200 310,571 (53.77%) (59.52%) (60.71%) (61.19%) 17,748 25,466 (59.87%) 321,878 (46.23%) 250,937 245,979 17,913 208,171 233,502 6,071 7,476 (40.1
Slide 18: Government Bond
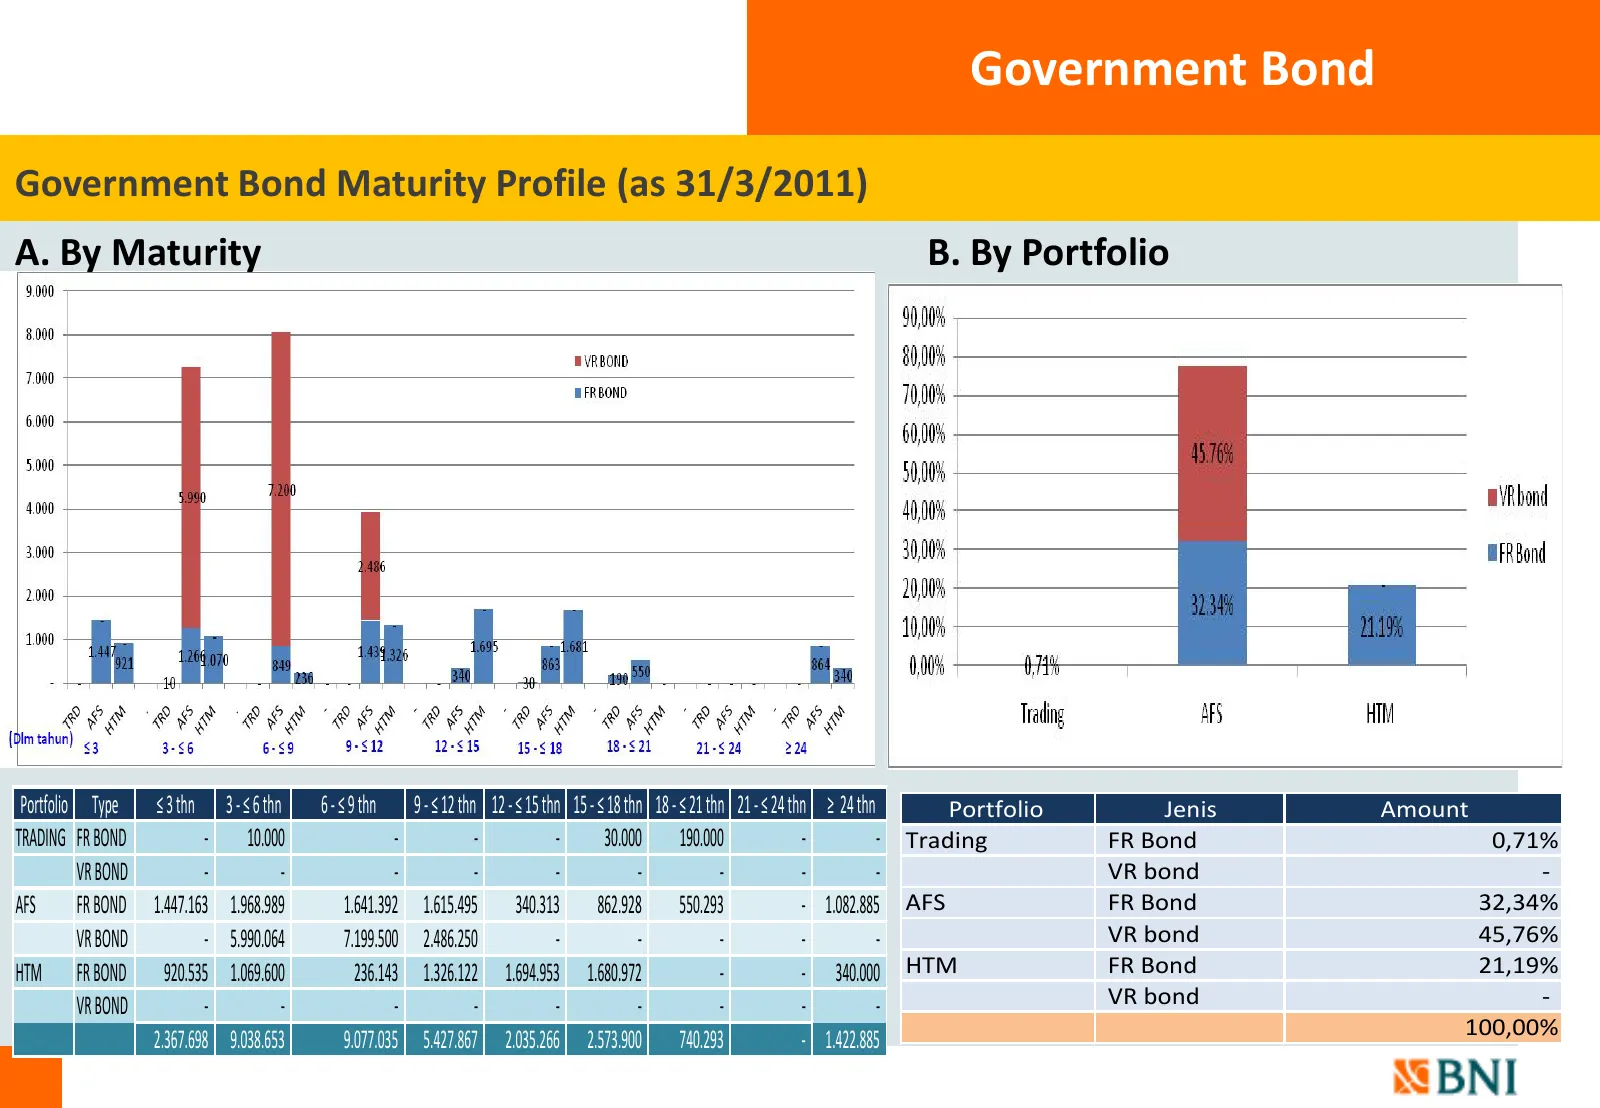
Government Bond Government Bond Maturity Profile (as 31/3/2011) A. By Maturity B. By Portfolio Portfolio Type ≤ 3 thn 3 - ≤ 6 thn 6 - ≤ 9 thn 9 - ≤ 12 thn 12 - ≤ 15 thn 15 - ≤ 18 thn 18 - ≤ 21 thn 21 - ≤ 24 thn ≥ 24 thn Portfolio Jenis Amount TRADING FR BOND - 10.000 - - - 30.000 190.000 - - Trading
Slide 19: Treasury Business
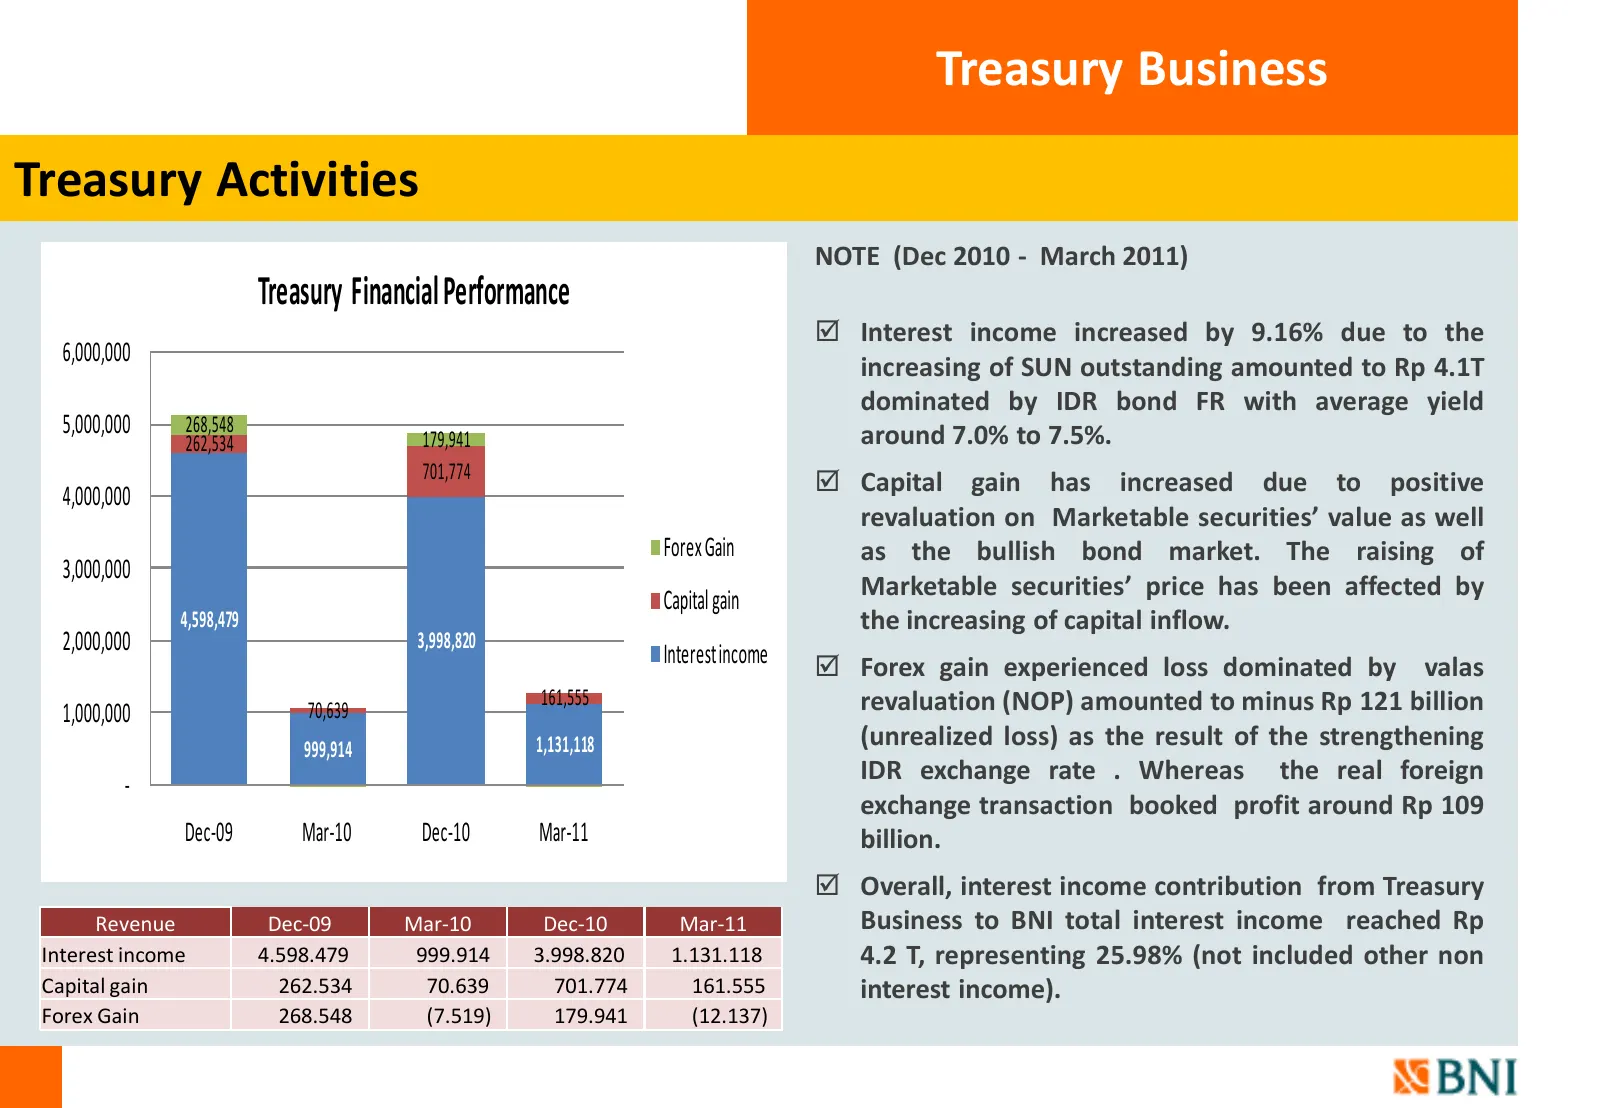
Treasury Business Treasury Activities NOTE (Dec 2010 - March 2011) Treasury Financial Performance Interest income increased by 9.16% due to the 6,000,000 increasing of SUN outstanding amounted to Rp 4.1T dominated by IDR bond FR with average yield 5,000,000 268,548 179,941 around 7.0% to 7.5%. 262
Slide 20: Improvements on Credit Risk Management
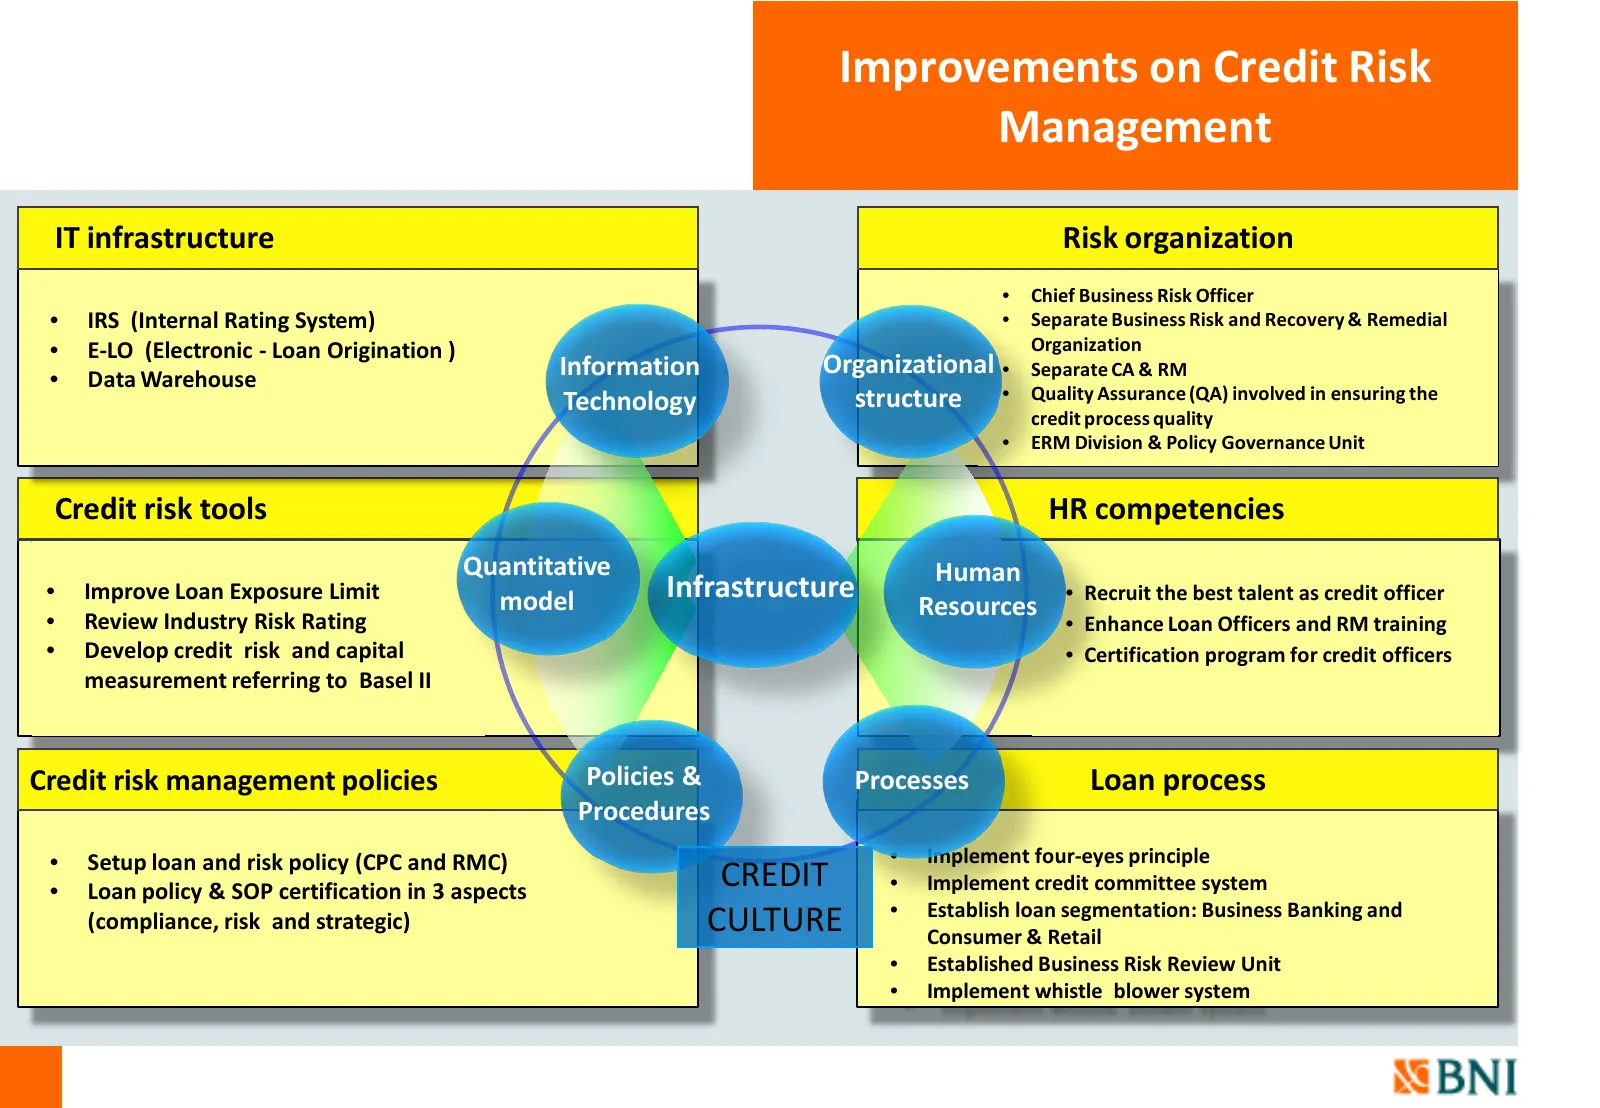
Improvements on Credit Risk Management IT infrastructure Risk organization • Chief Business Risk Officer • IRS (Internal Rating System) • Separate Business Risk and Recovery & Remedial • E-LO (Electronic - Loan Origination ) Organization Information Organizational • Separate CA & RM • Data Warehouse
Slide 21: NPL by Segments
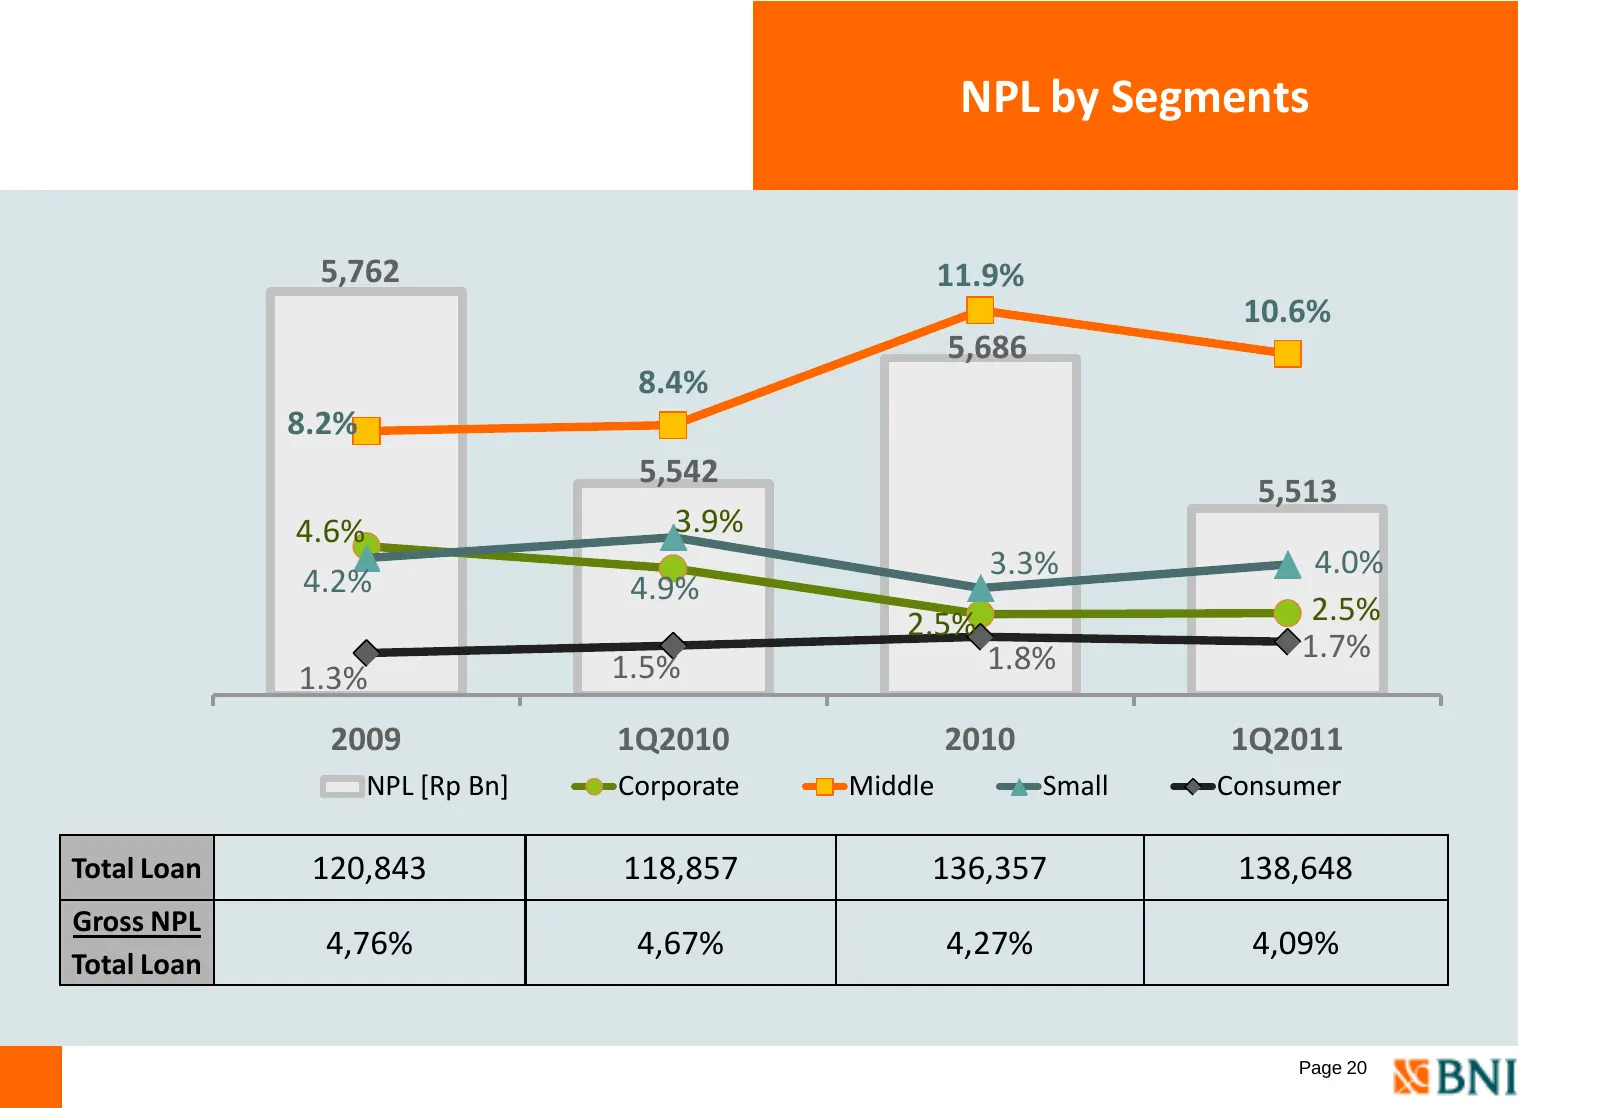
NPL by Segments 5,762 11.9% 10.6% 5,686 8.4% 8.2% 5,542 5,513 4.6% 3.9% 3.3% 4.0% 4.2% 4.9% 2.5% 2.5% 1.8% 1.7% 1.3% 1.5% 2009 1Q2010 2010 1Q2011 NPL [Rp Bn] Corporate Middle Small Consumer Total Loan 120,843 118,857 136,357 138,648 Gross NPL 4,76% 4,67% 4,27% 4,09% Total Loan Page 20
Slide 22: NPL and Coverage
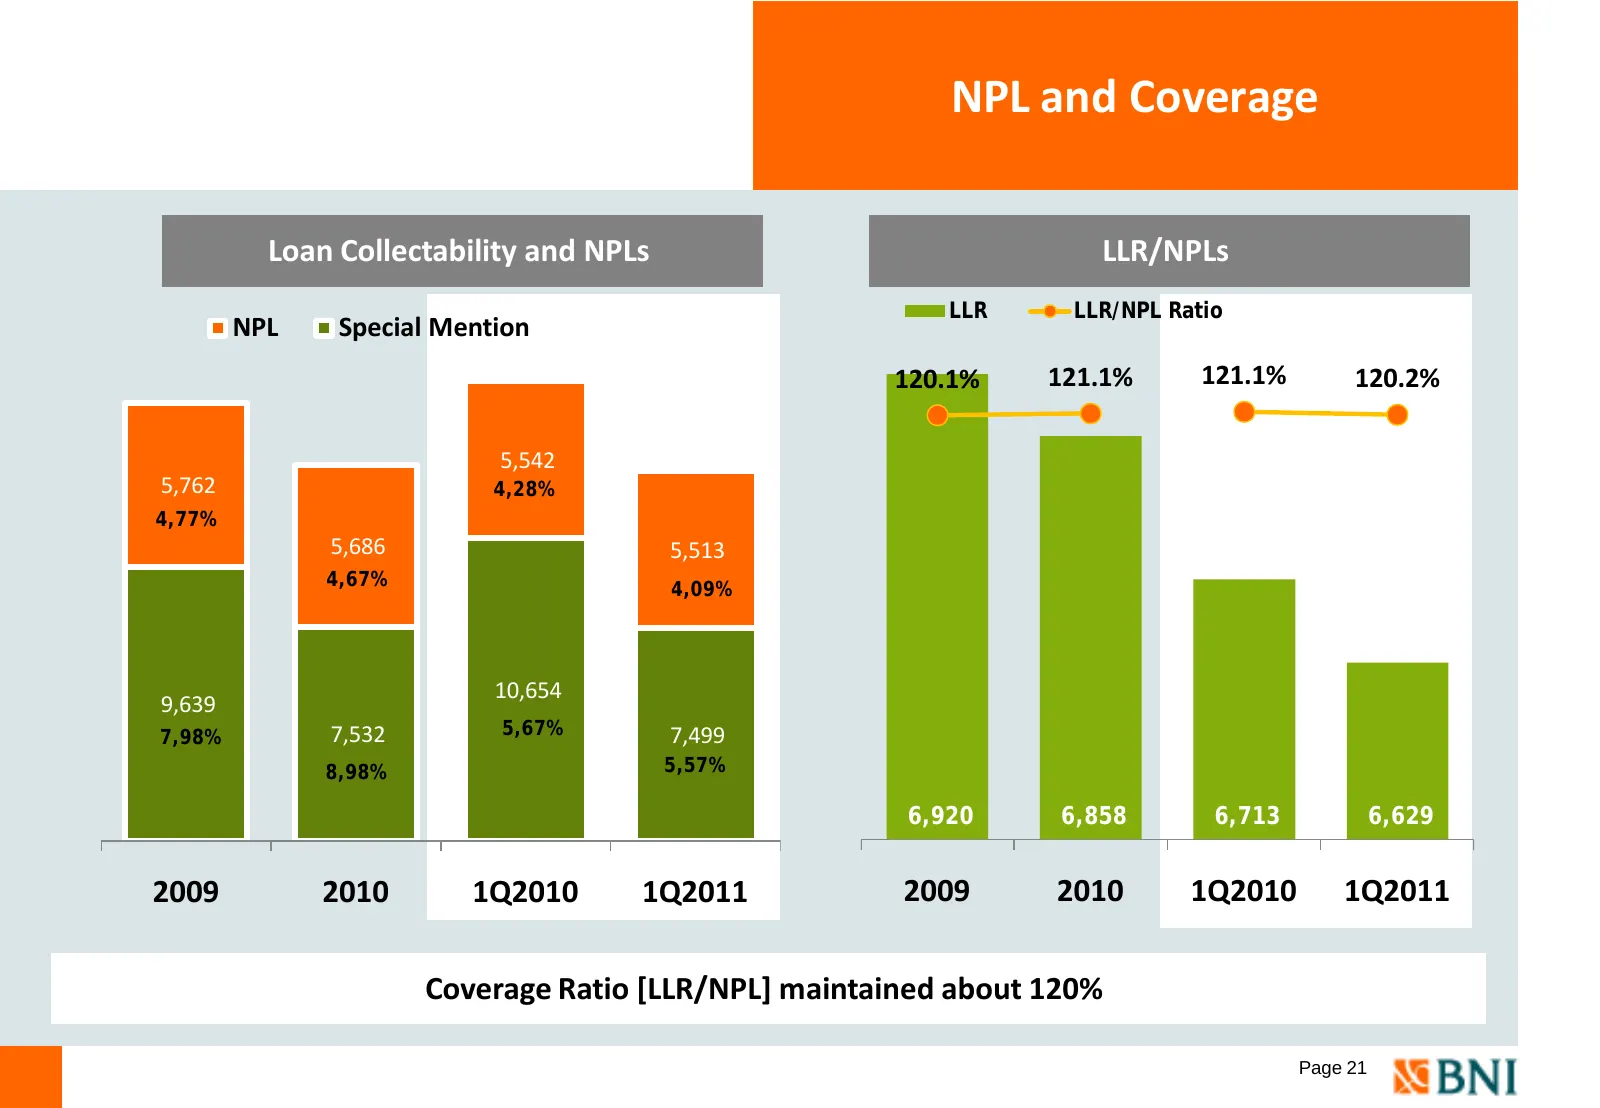
NPL and Coverage Loan Collectability and NPLs LLR/NPLs LLR LLR/NPL Ratio NPL Special Mention 120.1% 121.1% 121.1% 120.2% 5,542 5,762 4,28% 4,77% 5,686 5,513 4,67% 4,09% 10,654 9,639 7,98% 7,532 5,67% 7,499 8,98% 5,57% 6,920 6,858 6,713 6,629 2009 2010 1Q2010 1Q2011 2009 2010 1Q2010 1Q2011 Coverage R
Slide 23: Asset Recovery
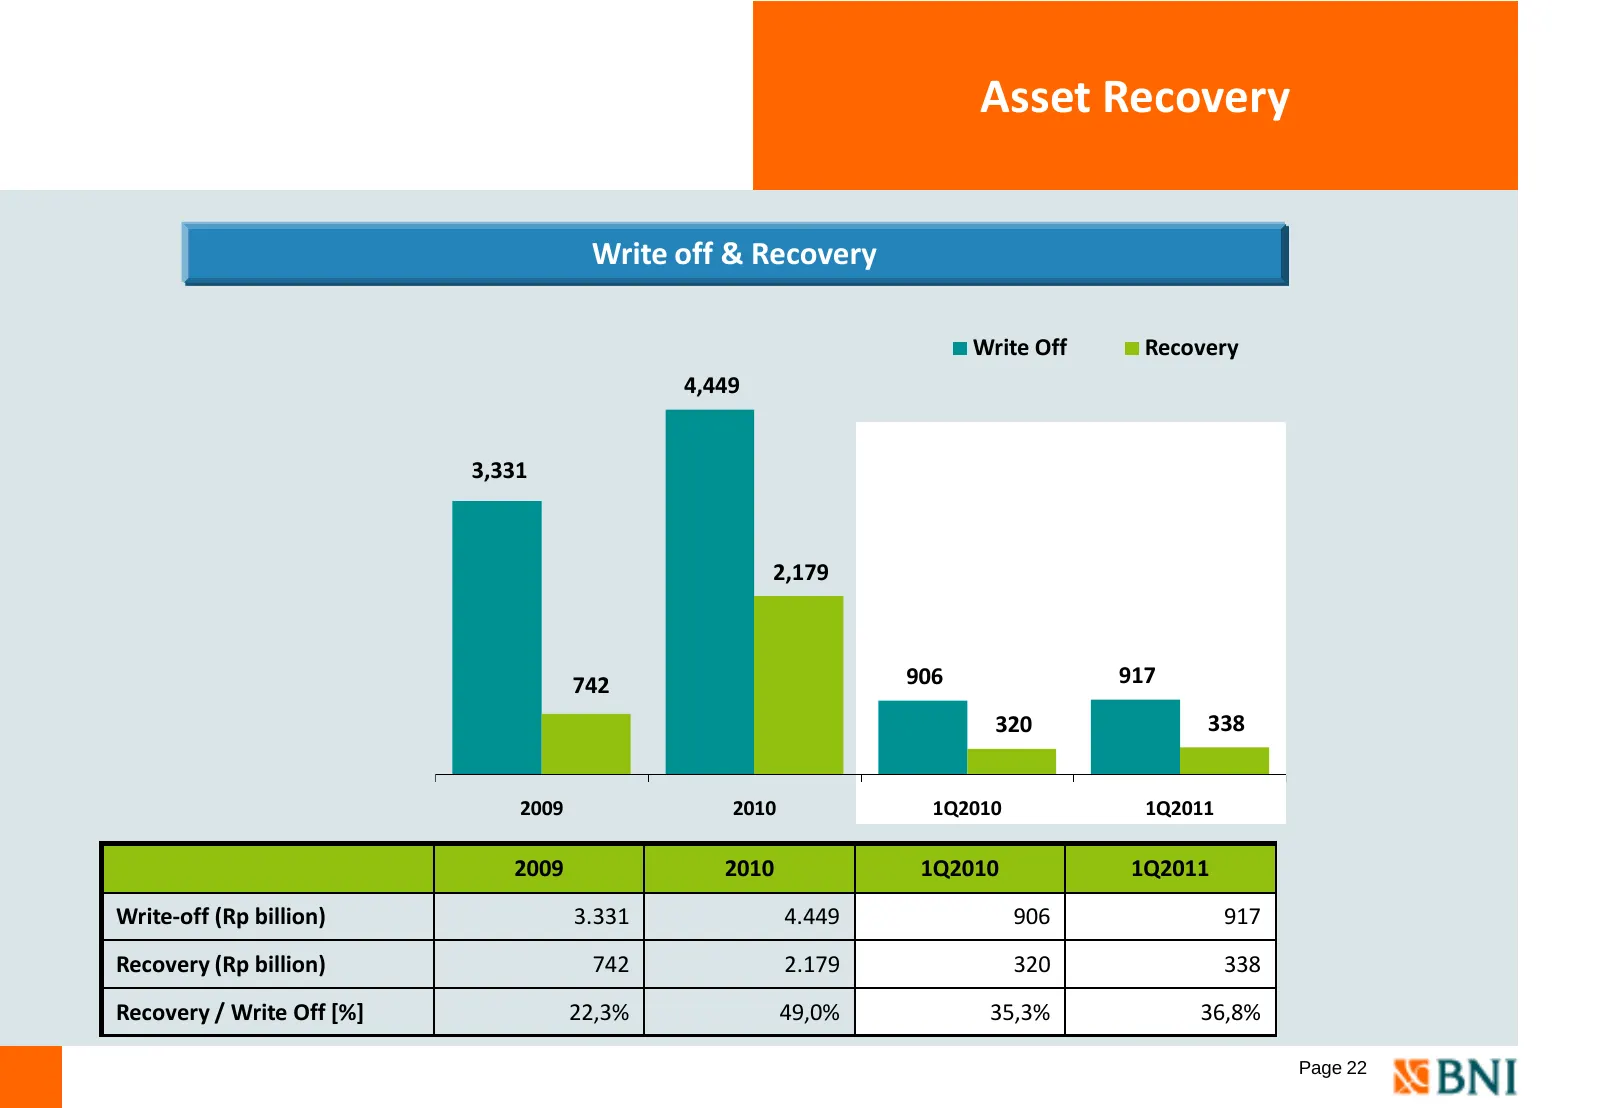
Asset Recovery Write off & Recovery Write Off Recovery 4,449 3,331 2,179 742 906 917 320 338 2009 2010 1Q2010 1Q2011 2009 2010 1Q2010 1Q2011 Write-off (Rp billion) 3.331 4.449 906 917 Recovery (Rp billion) 742 2.179 320 338 Recovery / Write Off [%] 22,3% 49,0% 35,3% 36,8% Page 22
Slide 24: Network & Distribution
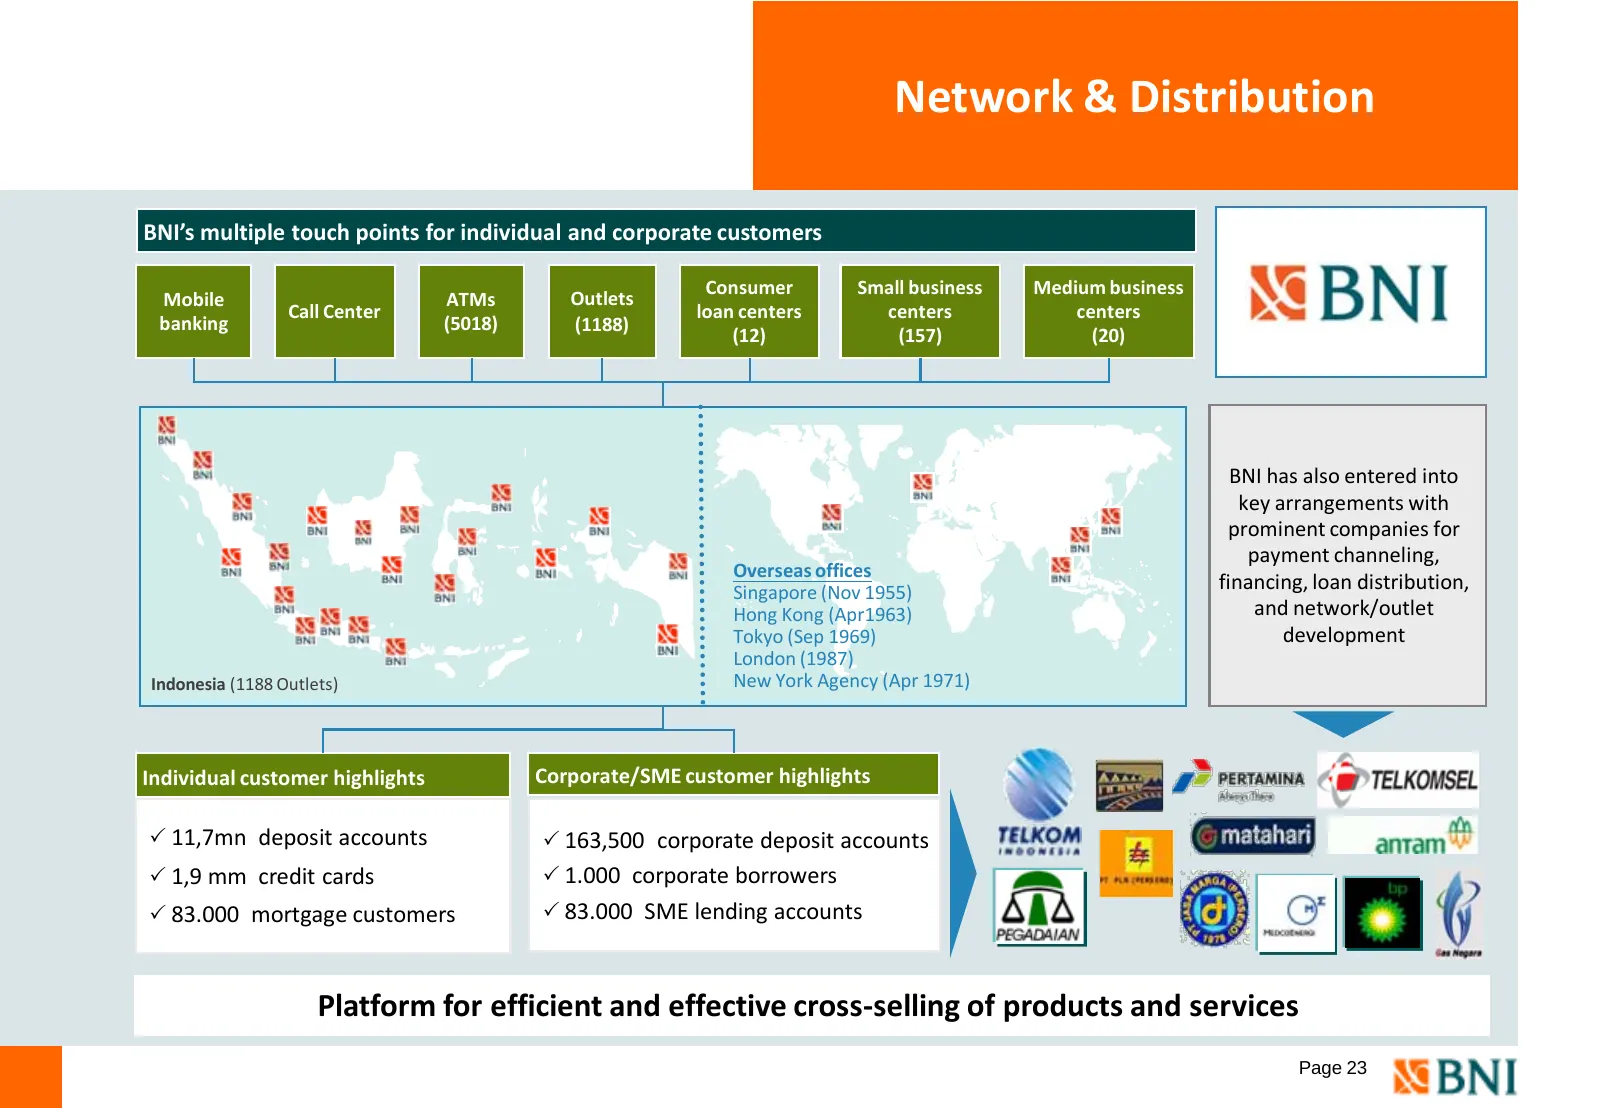
Network & Distribution BNI’s multiple touch points for individual and corporate customers Consumer Small business Medium business Mobile ATMs Outlets Call Center loan centers centers centers banking (5018) (1188) (12) (157) (20) BNI has also entered into key arrangements with prominent companies for
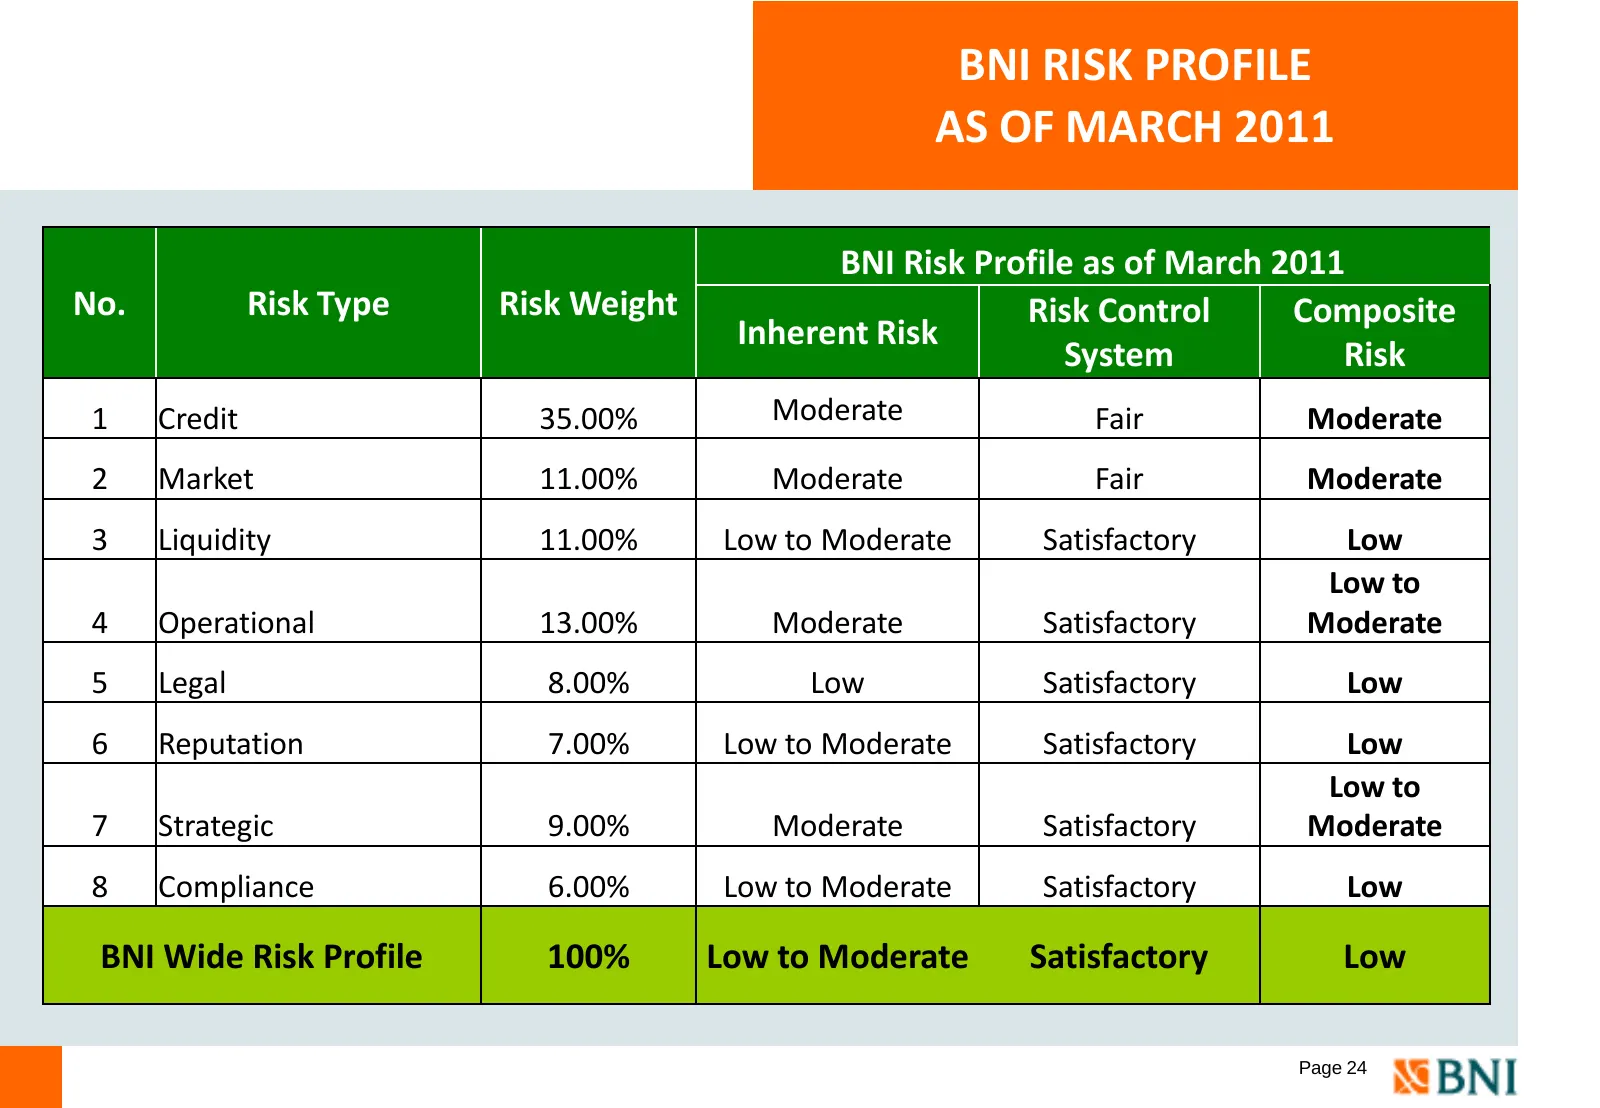
Slide 25: BNI Risk Profile as of March 2011
BNI RISK PROFILE AS OF MARCH 2011 BNI Risk Profile as of March 2011 No. Risk Type Risk Weight Risk Control Composite Inherent Risk System Risk 1 Credit 35.00% Moderate Fair Moderate 2 Market 11.00% Moderate Fair Moderate 3 Liquidity 11.00% Low to Moderate Satisfactory Low Low to 4 Operational 13.00%
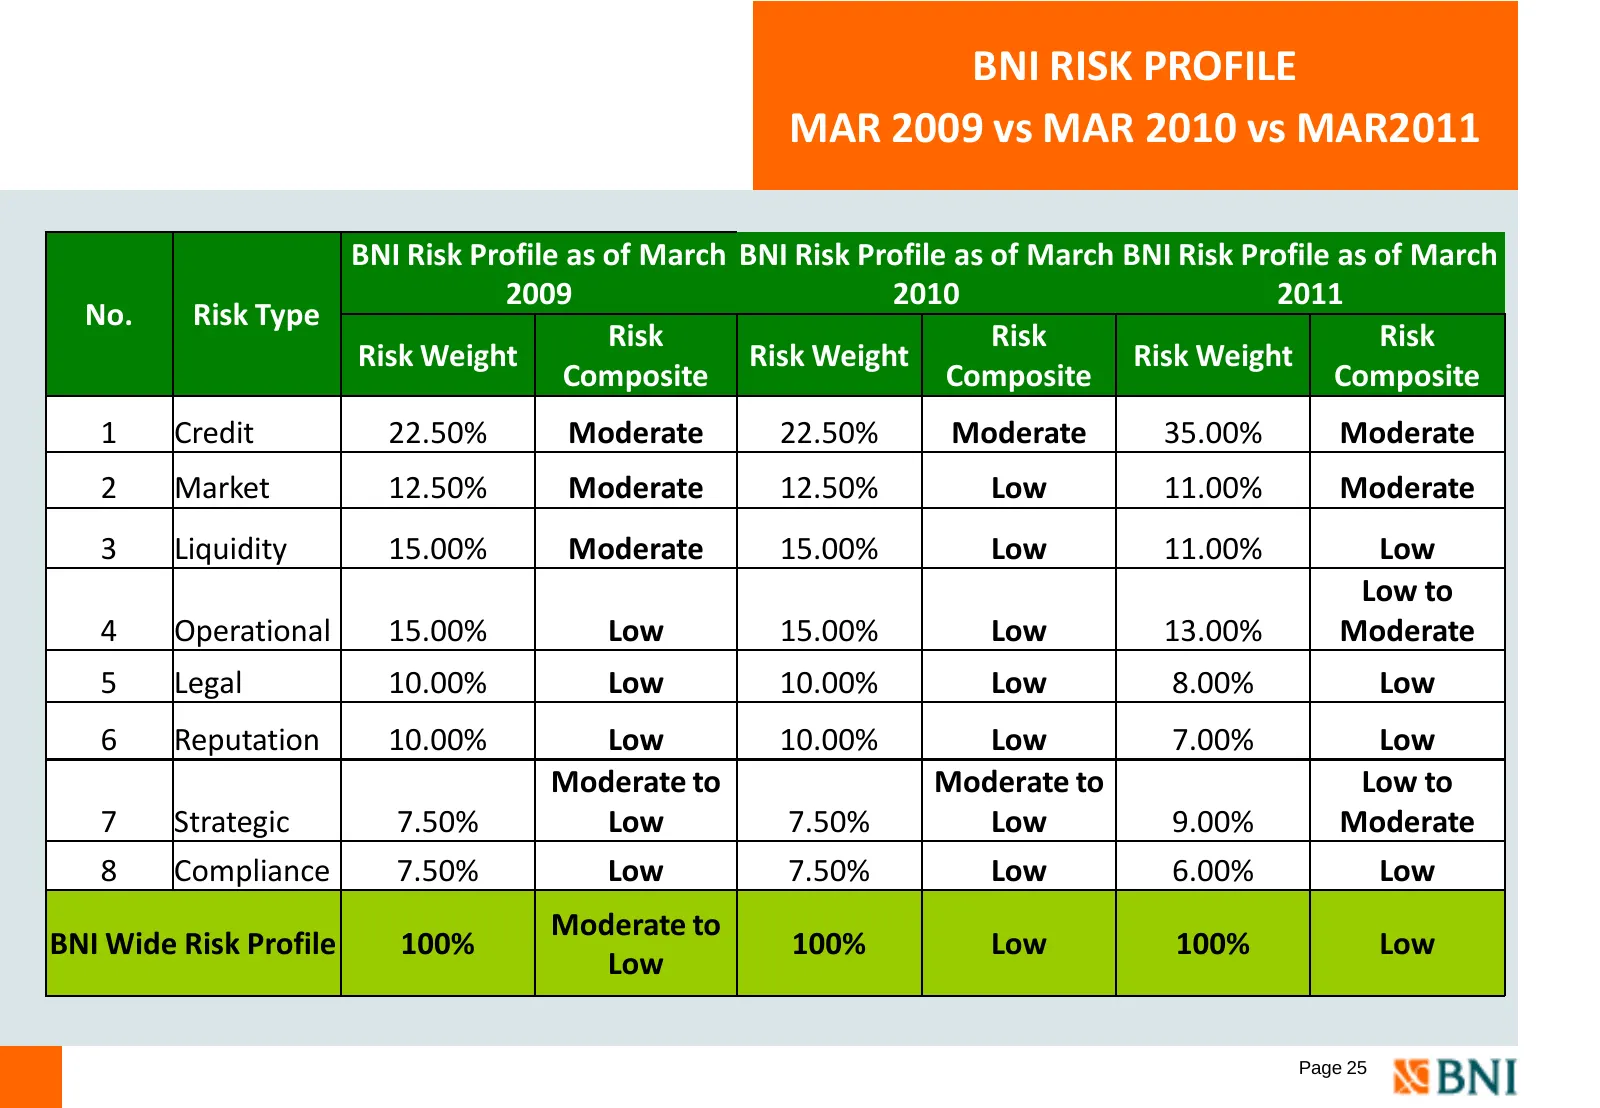
Slide 26: BNI Risk Profile Mar 2009 vs Mar 2010 vs Mar 2011
BNI RISK PROFILE MAR 2009 vs MAR 2010 vs MAR2011 BNI Risk Profile as of March BNI Risk Profile as of March BNI Risk Profile as of March 2009 2010 2011 No. Risk Type Risk Risk Risk Risk Weight Risk Weight Risk Weight Composite Composite Composite 1 Credit 22.50% Moderate 22.50% Moderate 35.00% Modera
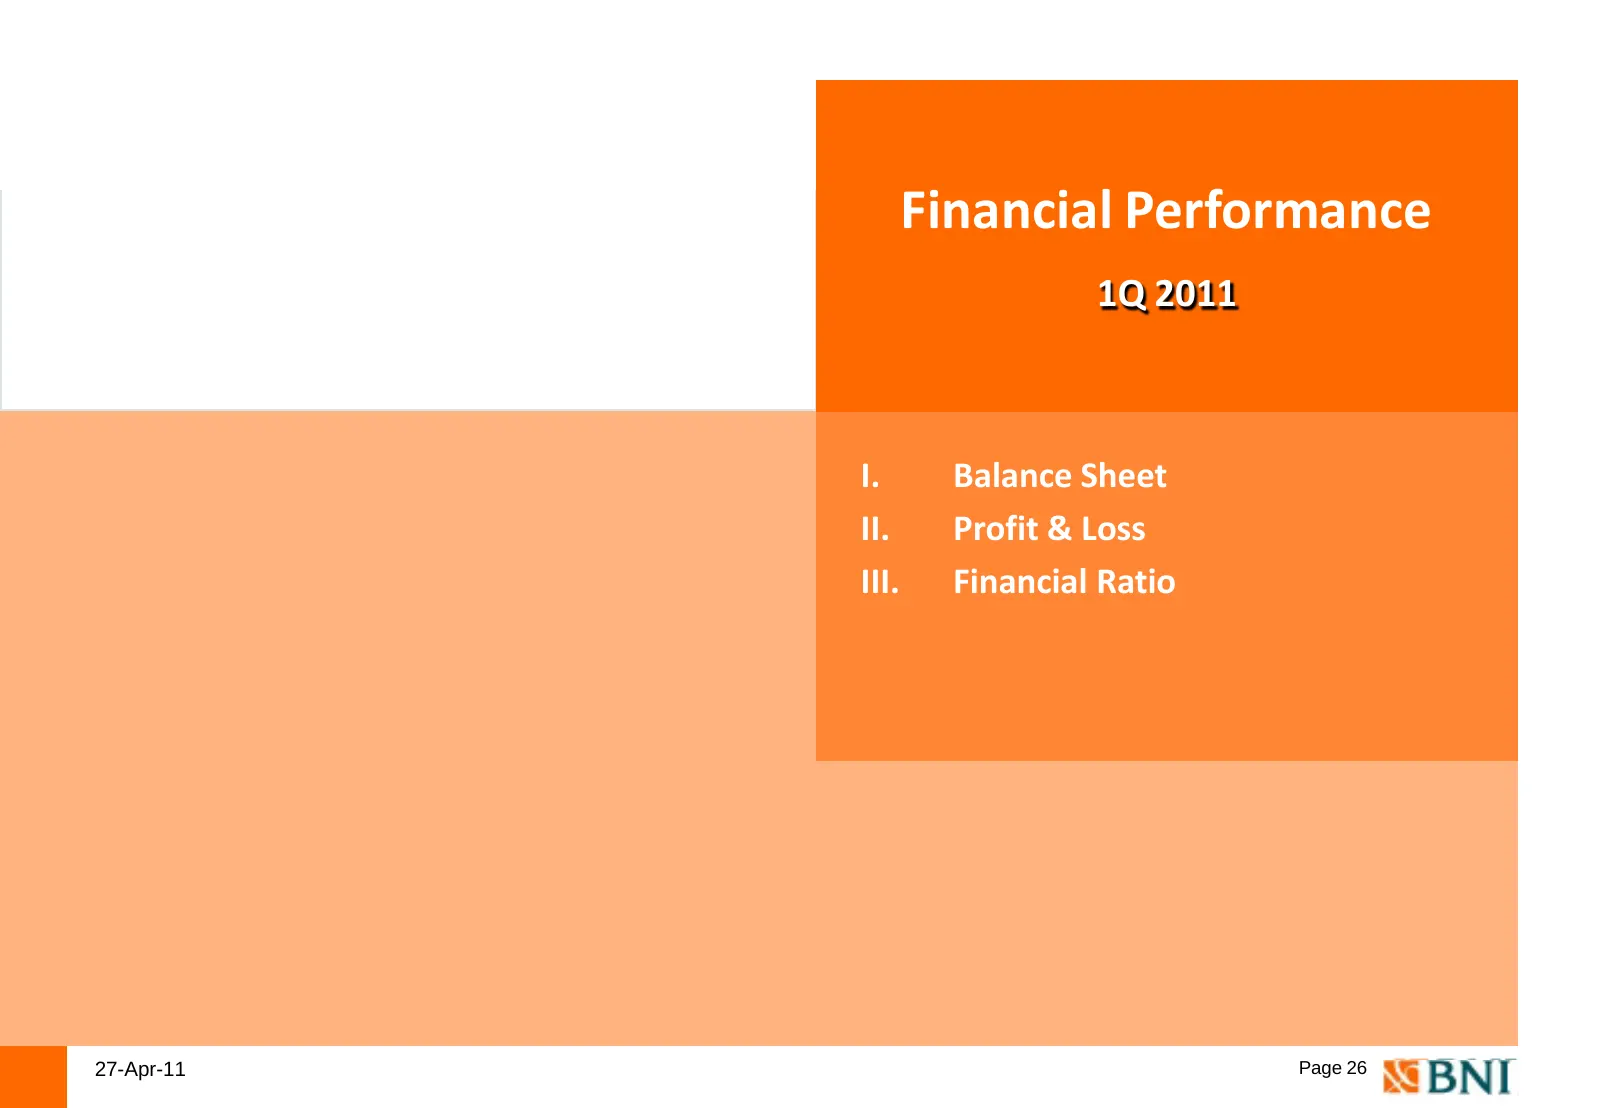
Slide 27: Financial Performance 1Q 2011
Financial Performance 1Q 2011 I. Balance Sheet II. Profit & Loss III. Financial Ratio 27-Apr-11 Page 26
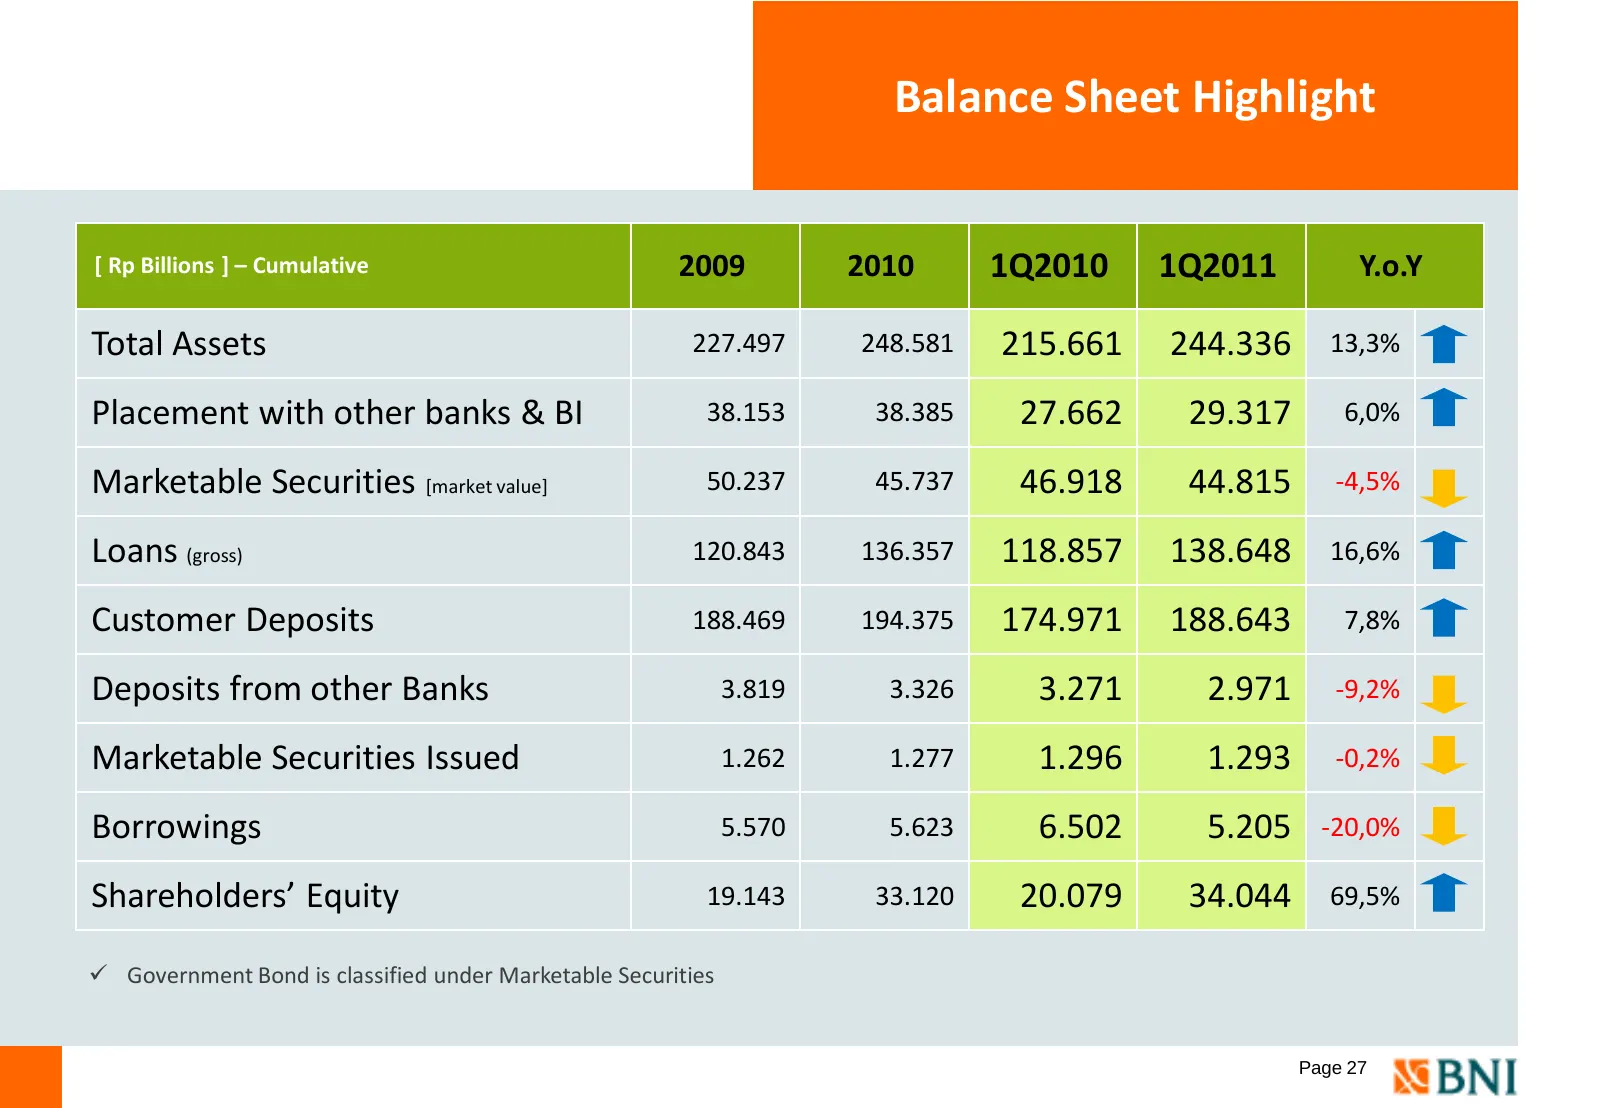
Slide 28: Balance Sheet Highlight
Balance Sheet Highlight [ Rp Billions ] – Cumulative 2009 2010 1Q2010 1Q2011 Y.o.Y Total Assets 227.497 248.581 215.661 244.336 13,3% Placement with other banks & BI 38.153 38.385 27.662 29.317 6,0% Marketable Securities [market value] 50.237 45.737 46.918 44.815 -4,5% Loans (gross) 120.843 136.357
Slide 29: Loan Composition
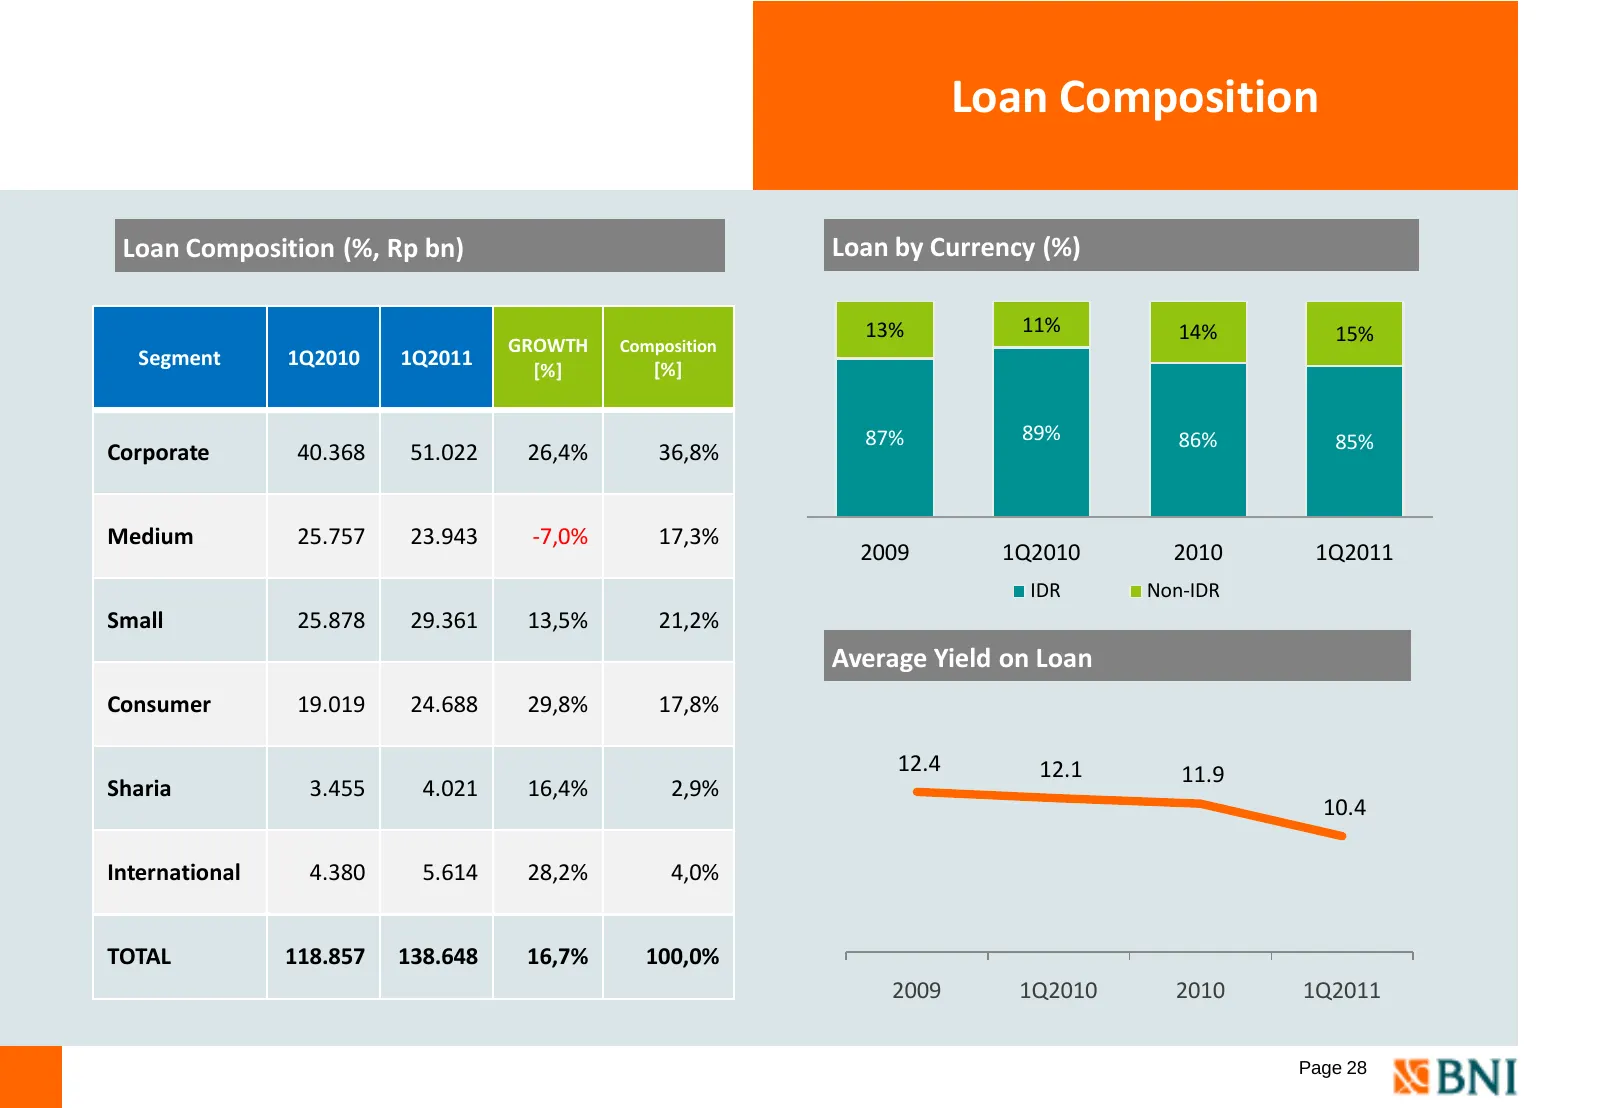
Loan Composition Loan Composition (%, Rp bn) Loan by Currency (%) 13% 11% 14% 15% GROWTH Composition Segment 1Q2010 1Q2011 [%] [%] 87% 89% 86% 85% Corporate 40.368 51.022 26,4% 36,8% Medium 25.757 23.943 -7,0% 17,3% 2009 1Q2010 2010 1Q2011 IDR Non-IDR Small 25.878 29.361 13,5% 21,2% Average Yield on
Slide 30: Loan diversifications
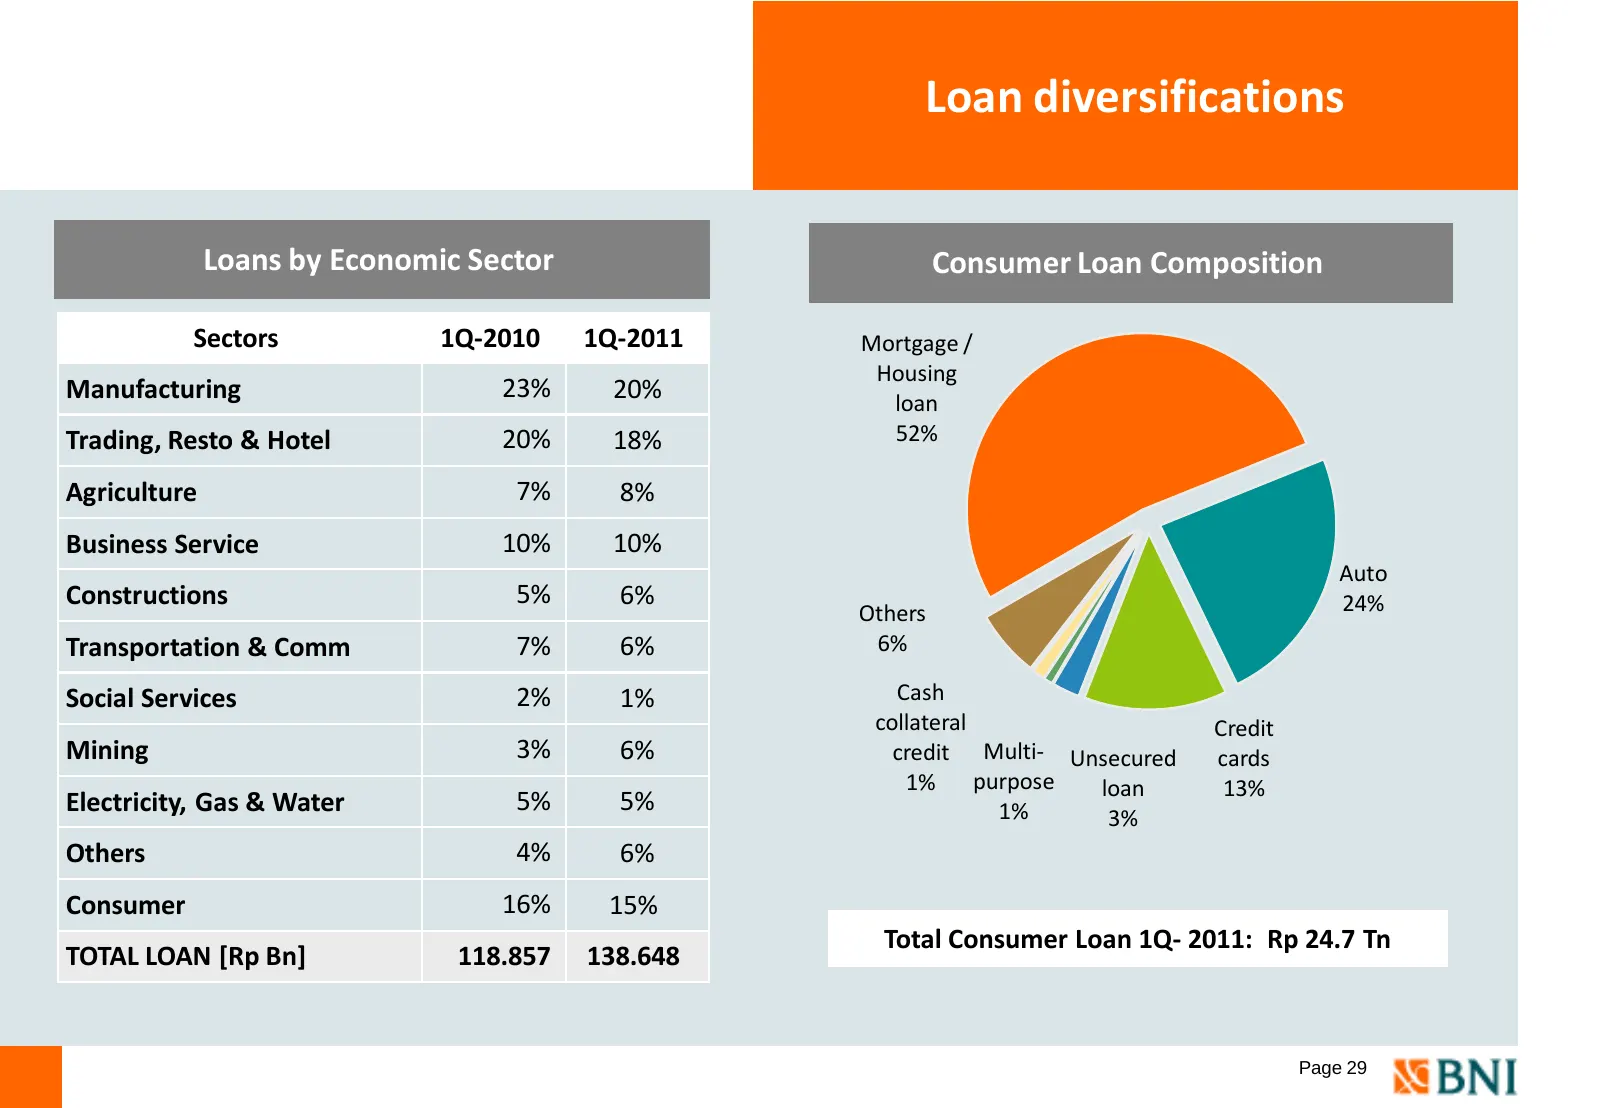
Loan diversifications Loans by Economic Sector Consumer Loan Composition Sectors 1Q-2010 1Q-2011 Mortgage / Housing Manufacturing 23% 20% loan Trading, Resto & Hotel 20% 18% 52% Agriculture 7% 8% Business Service 10% 10% Auto Constructions 5% 6% 24% Others Transportation & Comm 7% 6% 6% Social Servi
Slide 31: Marketable Securities
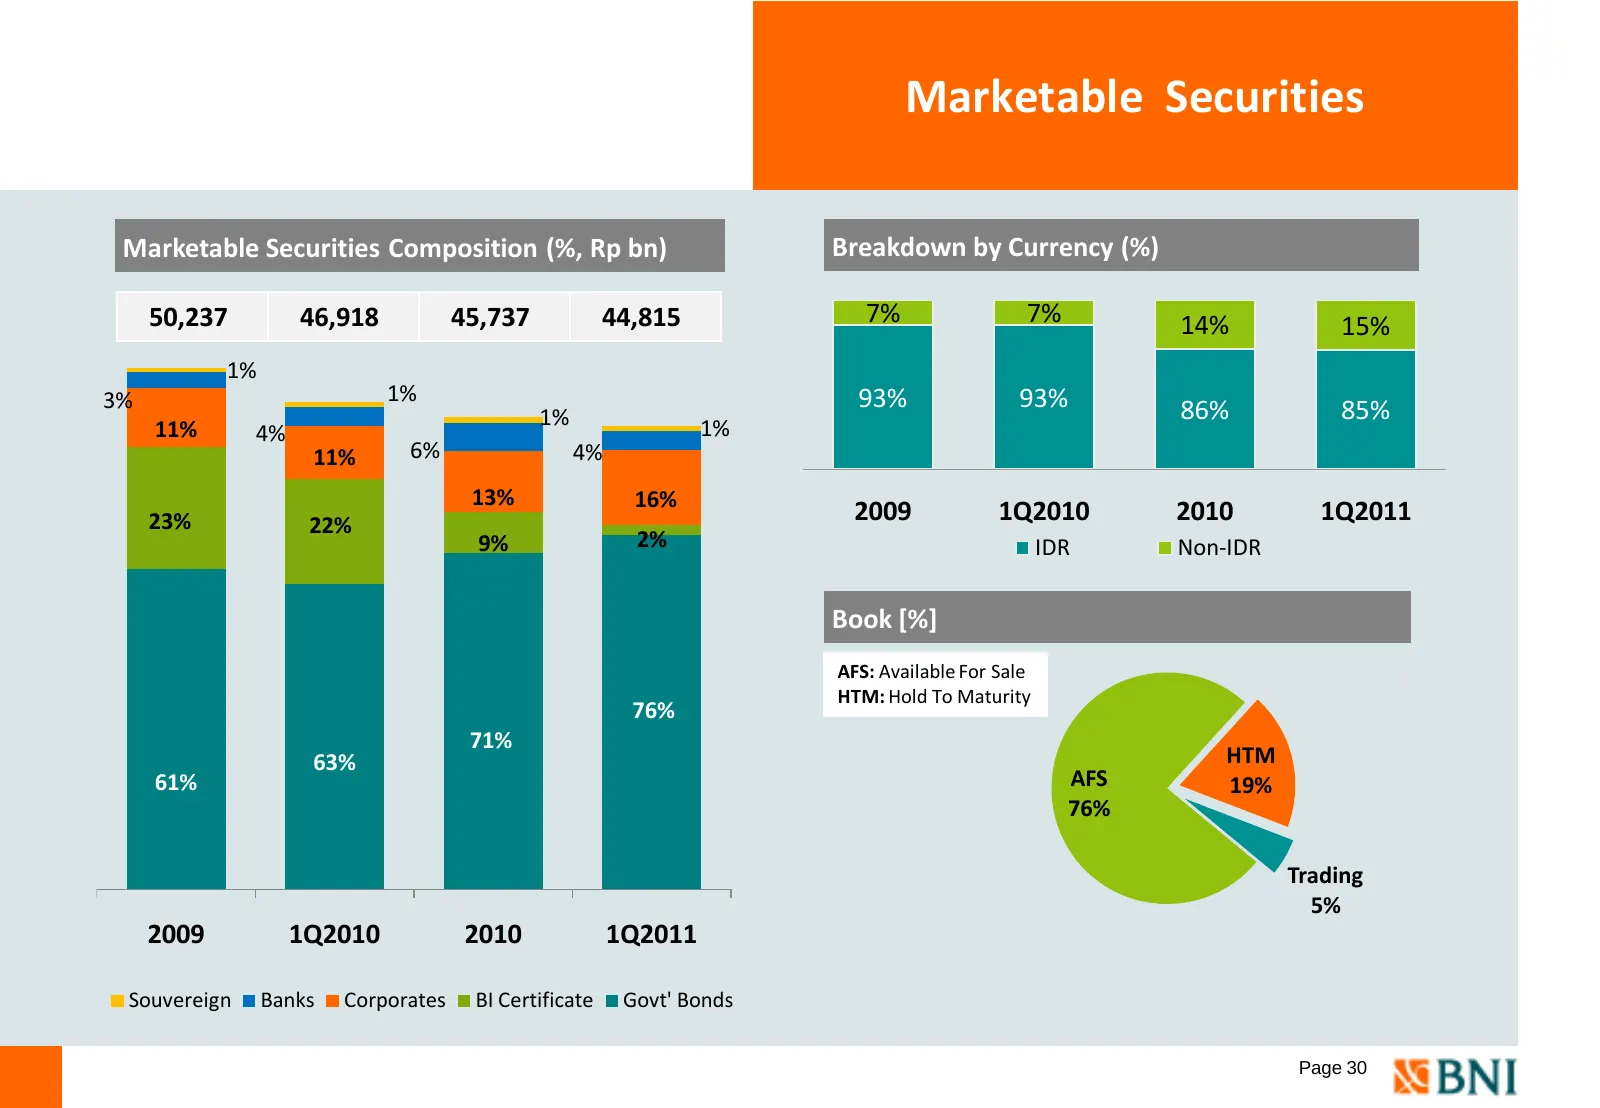
Marketable Securities Marketable Securities Composition (%, Rp bn) Breakdown by Currency (%) 50,237 46,918 45,737 44,815 7% 7% 14% 15% 1% 3% 1% 93% 93% 1% 86% 85% 11% 4% 1% 11% 6% 4% 13% 16% 23% 22% 2009 1Q2010 2010 1Q2011 9% 2% IDR Non-IDR Book [%] AFS: Available For Sale HTM: Hold To Maturity 76%
Slide 32: Customer Deposit
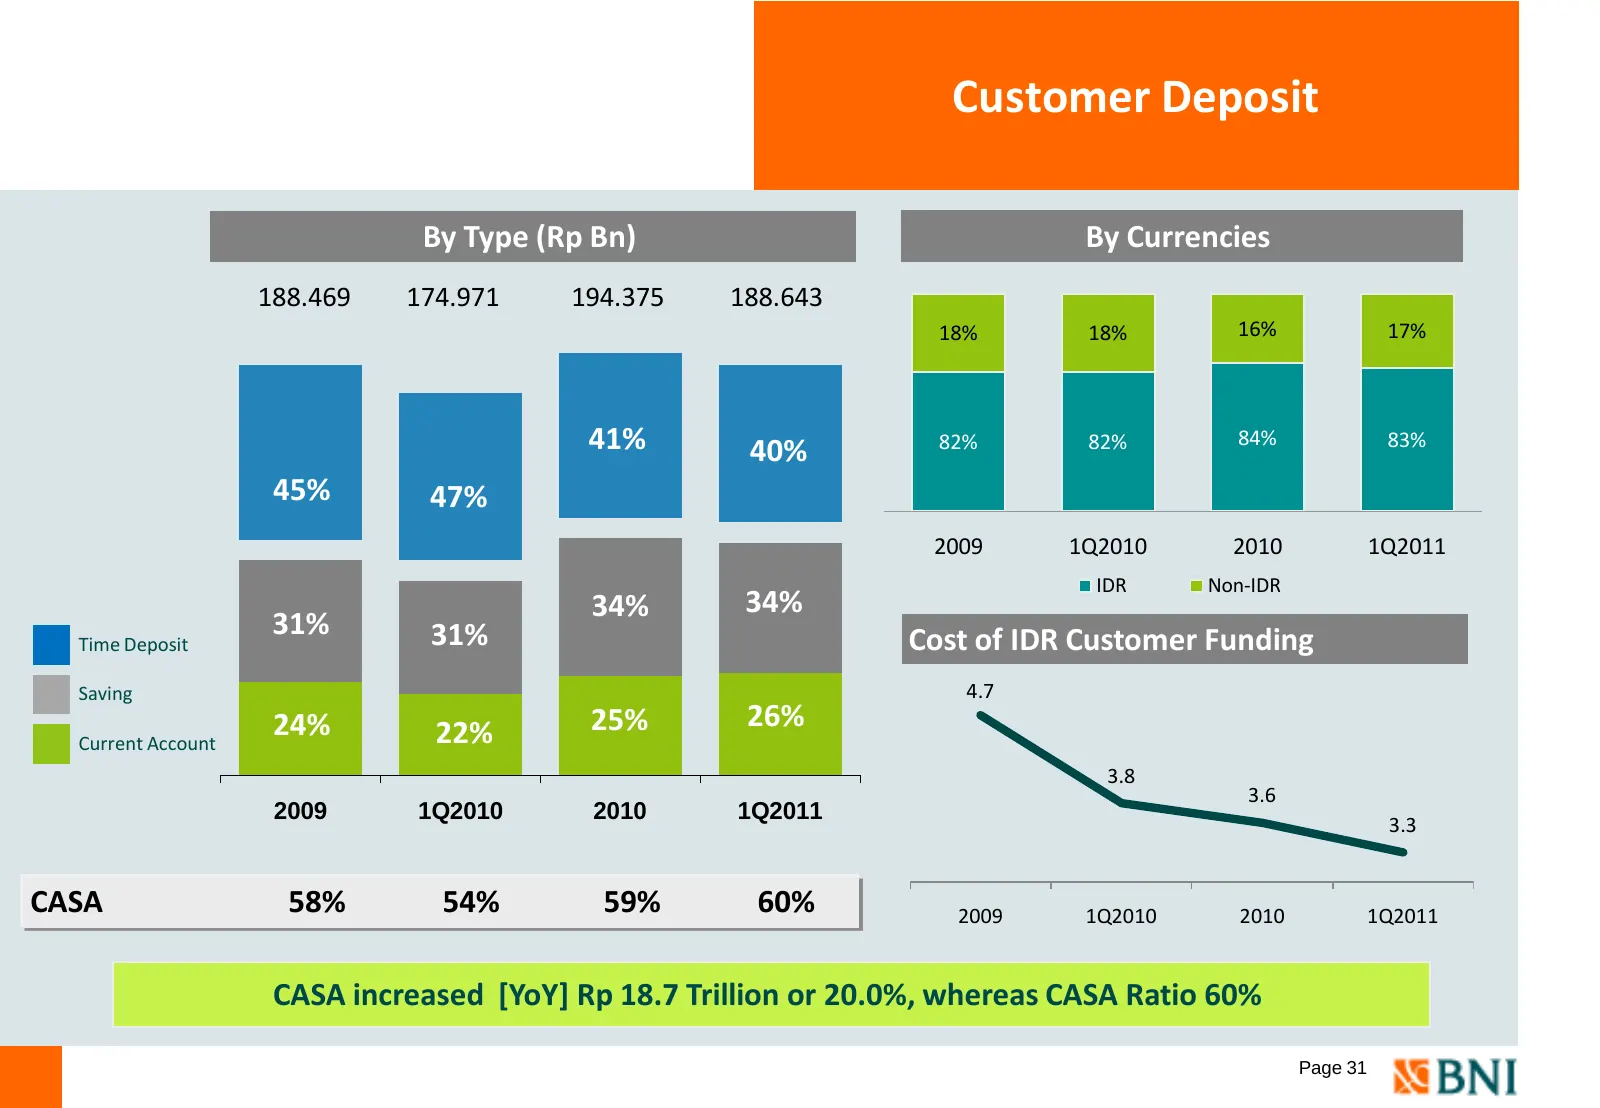
Customer Deposit By Type (Rp Bn) By Currencies 188.469 174.971 194.375 188.643 18% 18% 16% 17% 41% 40% 82% 82% 84% 83% 45% 47% 2009 1Q2010 2010 1Q2011 IDR Non-IDR 34% 34% 31% 31% Cost of IDR Customer Funding Time Deposit Saving 4.7 24% 25% 26% Current Account 22% 3.8 3.6 2009 1Q2010 2010 1Q2011 3.3
Slide 33: Liquidity & Capital
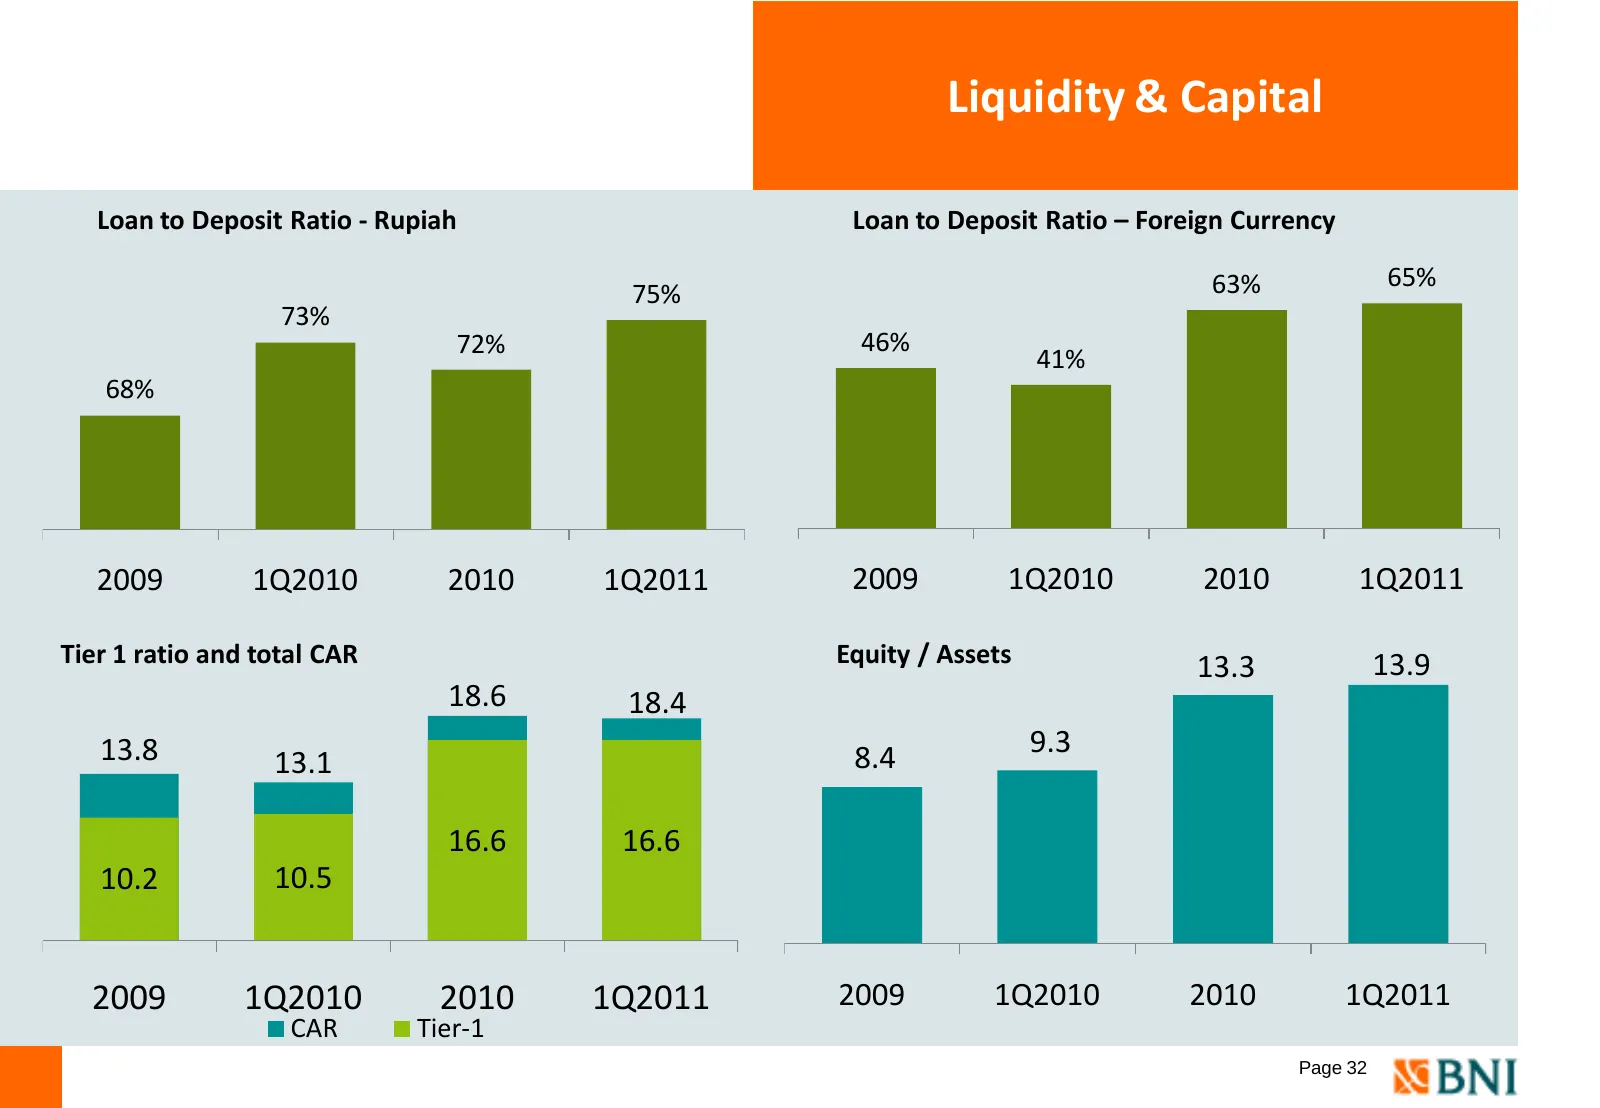
Liquidity & Capital Loan to Deposit Ratio - Rupiah Loan to Deposit Ratio – Foreign Currency 63% 65% 75% 73% 72% 46% 41% 68% 2009 1Q2010 2010 1Q2011 2009 1Q2010 2010 1Q2011 Tier 1 ratio and total CAR Equity / Assets 13.3 13.9 18.6 18.4 13.8 9.3 13.1 8.4 16.6 16.6 10.2 10.5 2009 1Q2010 2010 1Q2011 200
Slide 34: Profit & Loss Highlight
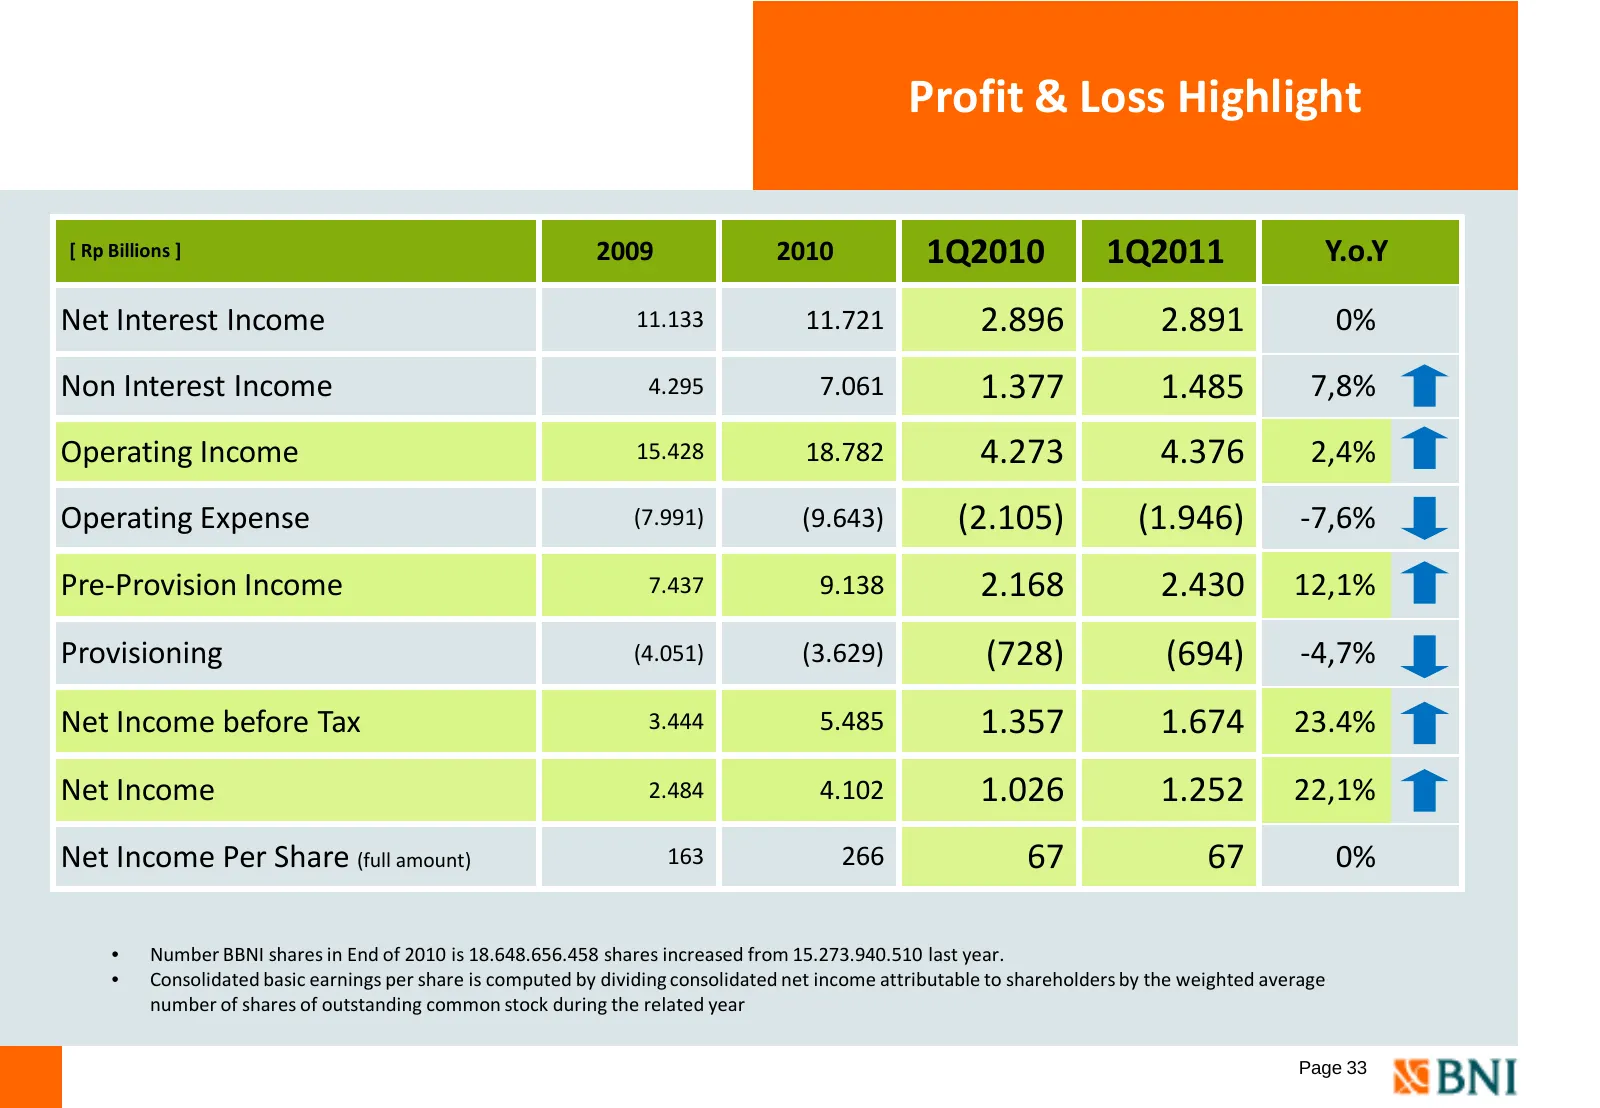
Profit & Loss Highlight [ Rp Billions ] 2009 2010 1Q2010 1Q2011 Y.o.Y Net Interest Income 11.133 11.721 2.896 2.891 0% Non Interest Income 4.295 7.061 1.377 1.485 7,8% Operating Income 15.428 18.782 4.273 4.376 2,4% Operating Expense (7.991) (9.643) (2.105) (1.946) -7,6% Pre-Provision Income 7.437 9
Slide 35: Interest Income/Expense Composition
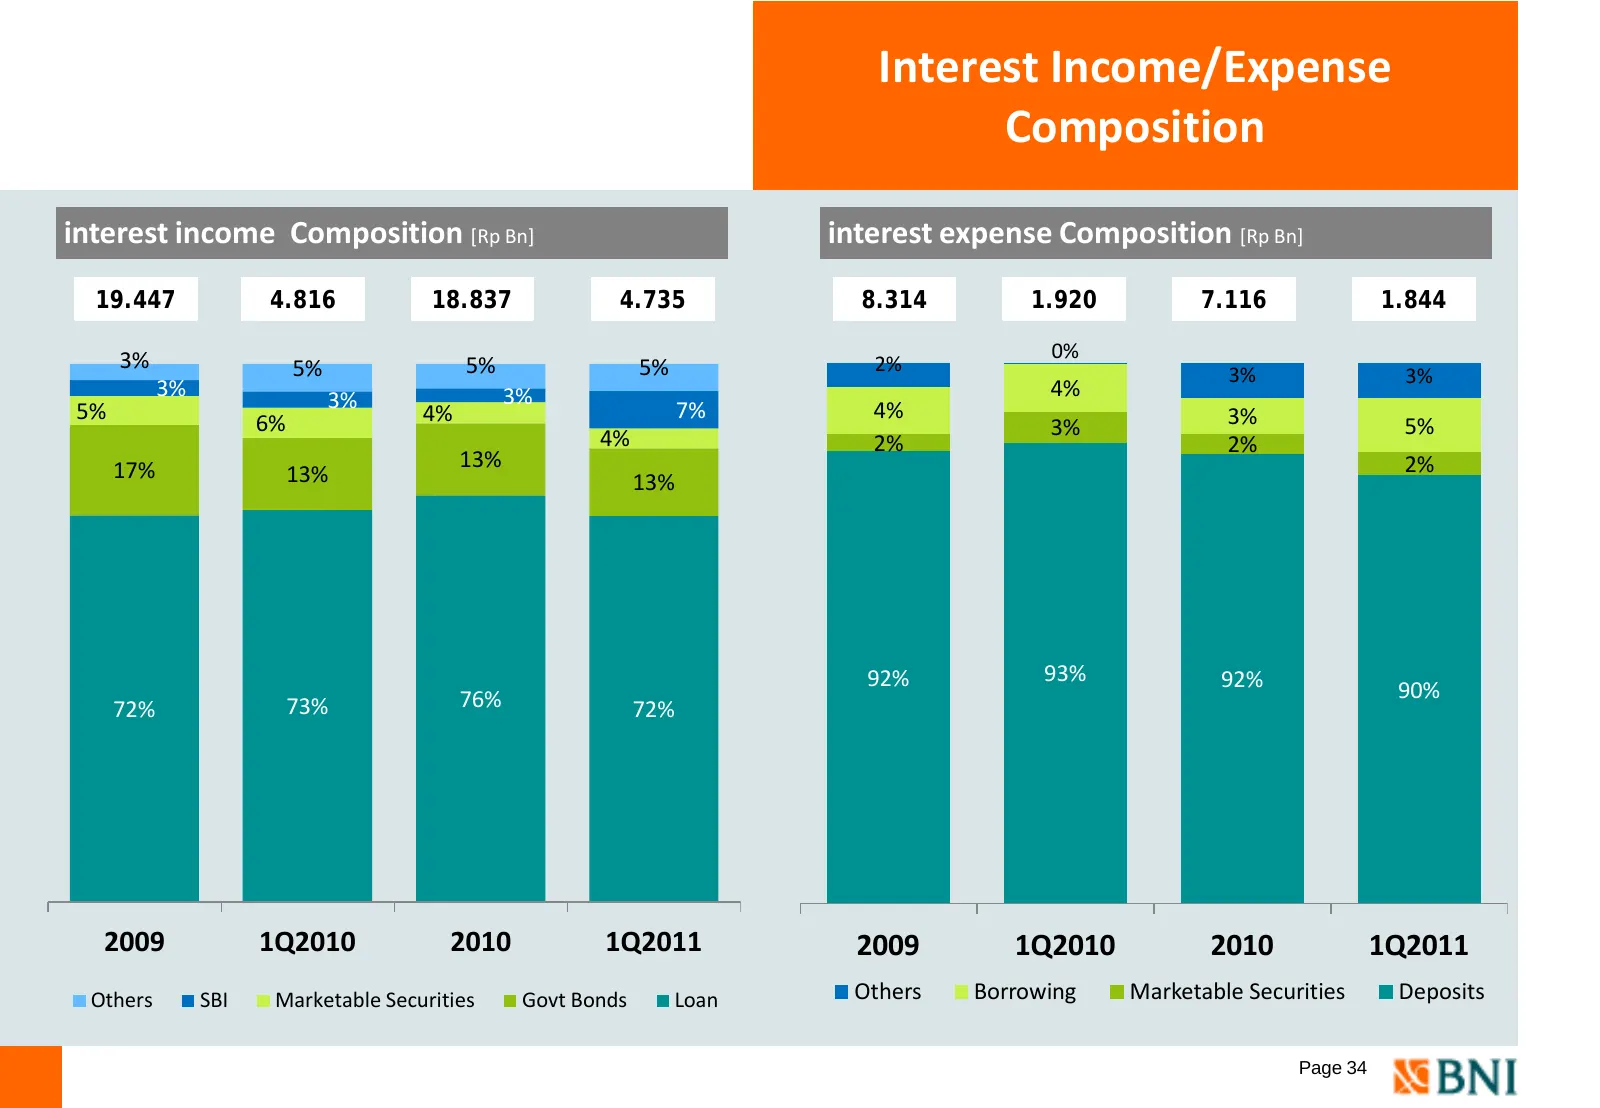
Interest Income/Expense Composition interest income Composition [Rp Bn] interest expense Composition [Rp Bn] 19.447 4.816 18.837 4.735 8.314 1.920 7.116 1.844 3% 0% 5% 5% 5% 2% 3% 3% 3% 3% 3% 4% 5% 4% 7% 4% 3% 6% 3% 5% 4% 2% 2% 17% 13% 2% 13% 13% 92% 93% 92% 76% 90% 72% 73% 72% 2009 1Q2010 2010 1Q20
Slide 36: Non Interest Income
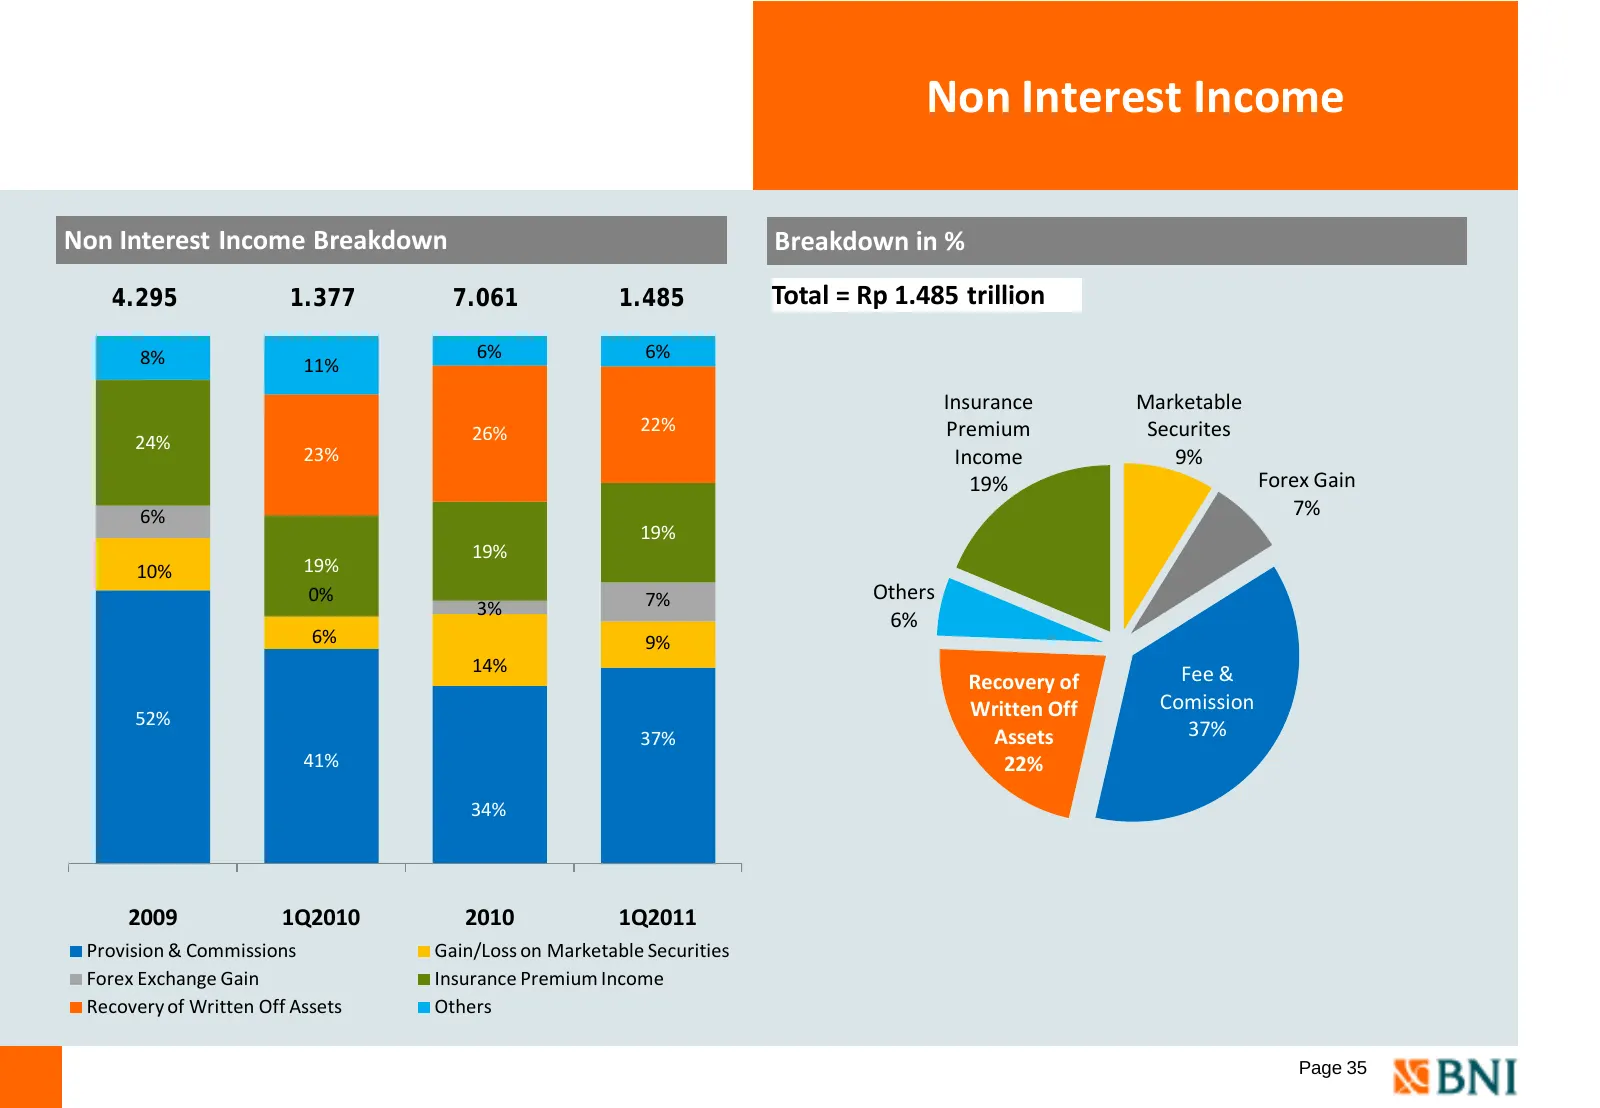
Non Interest Income Non Interest Income Breakdown Breakdown in % 4.295 1.377 7.061 1.485 Total = Rp 1.485 trillion 8% 6% 6% 11% Insurance Marketable 26% 22% Premium Securites 24% 23% Income 9% 19% Forex Gain 6% 7% 19% 19% 10% 19% 0% 7% Others 3% 6% 6% 9% 14% Fee & Recovery of Written Off Comission 5
Slide 37: Operating Expense
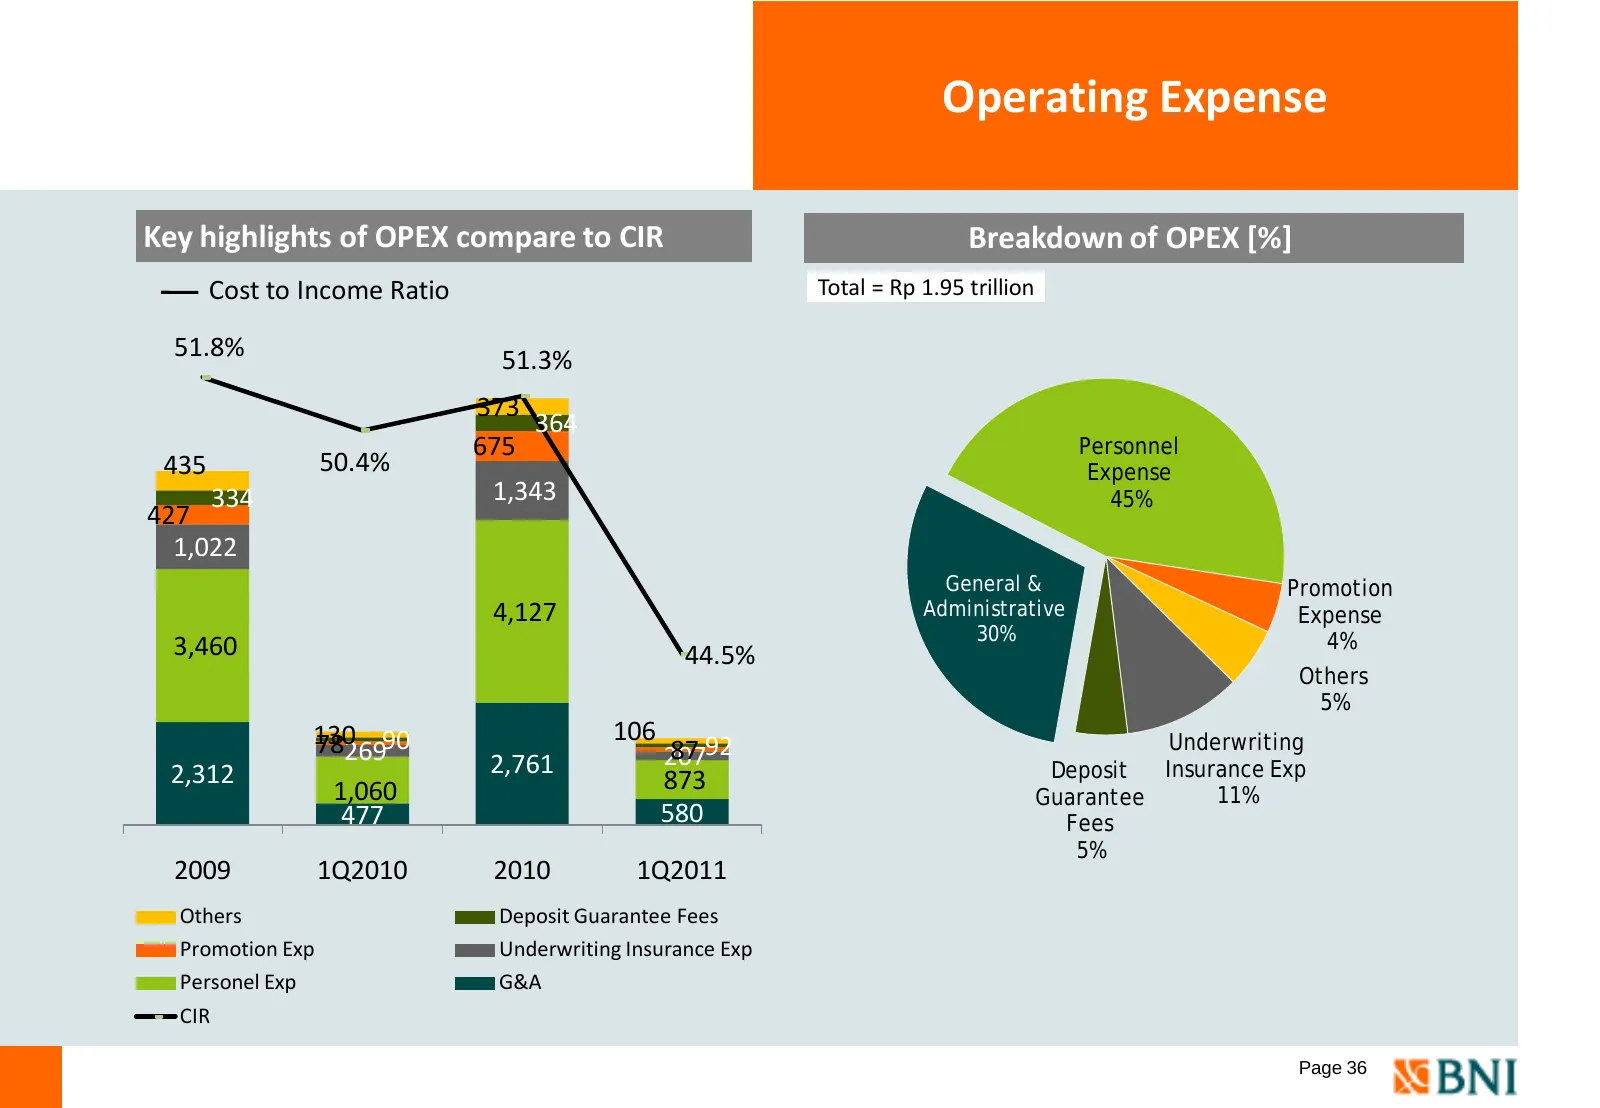
Operating Expense Key highlights of OPEX compare to CIR Breakdown of OPEX [%] Cost to Income Ratio Total = Rp 1.95 trillion 51.8% 51.3% 373 364 675 Personnel 435 50.4% Expense 334 1,343 45% 427 1,022 General & Promotion 4,127 Administrative Expense 30% 4% 3,460 44.5% Others 5% 130 7826990 106 2,761
Slide 38: Financial Ratios [%]
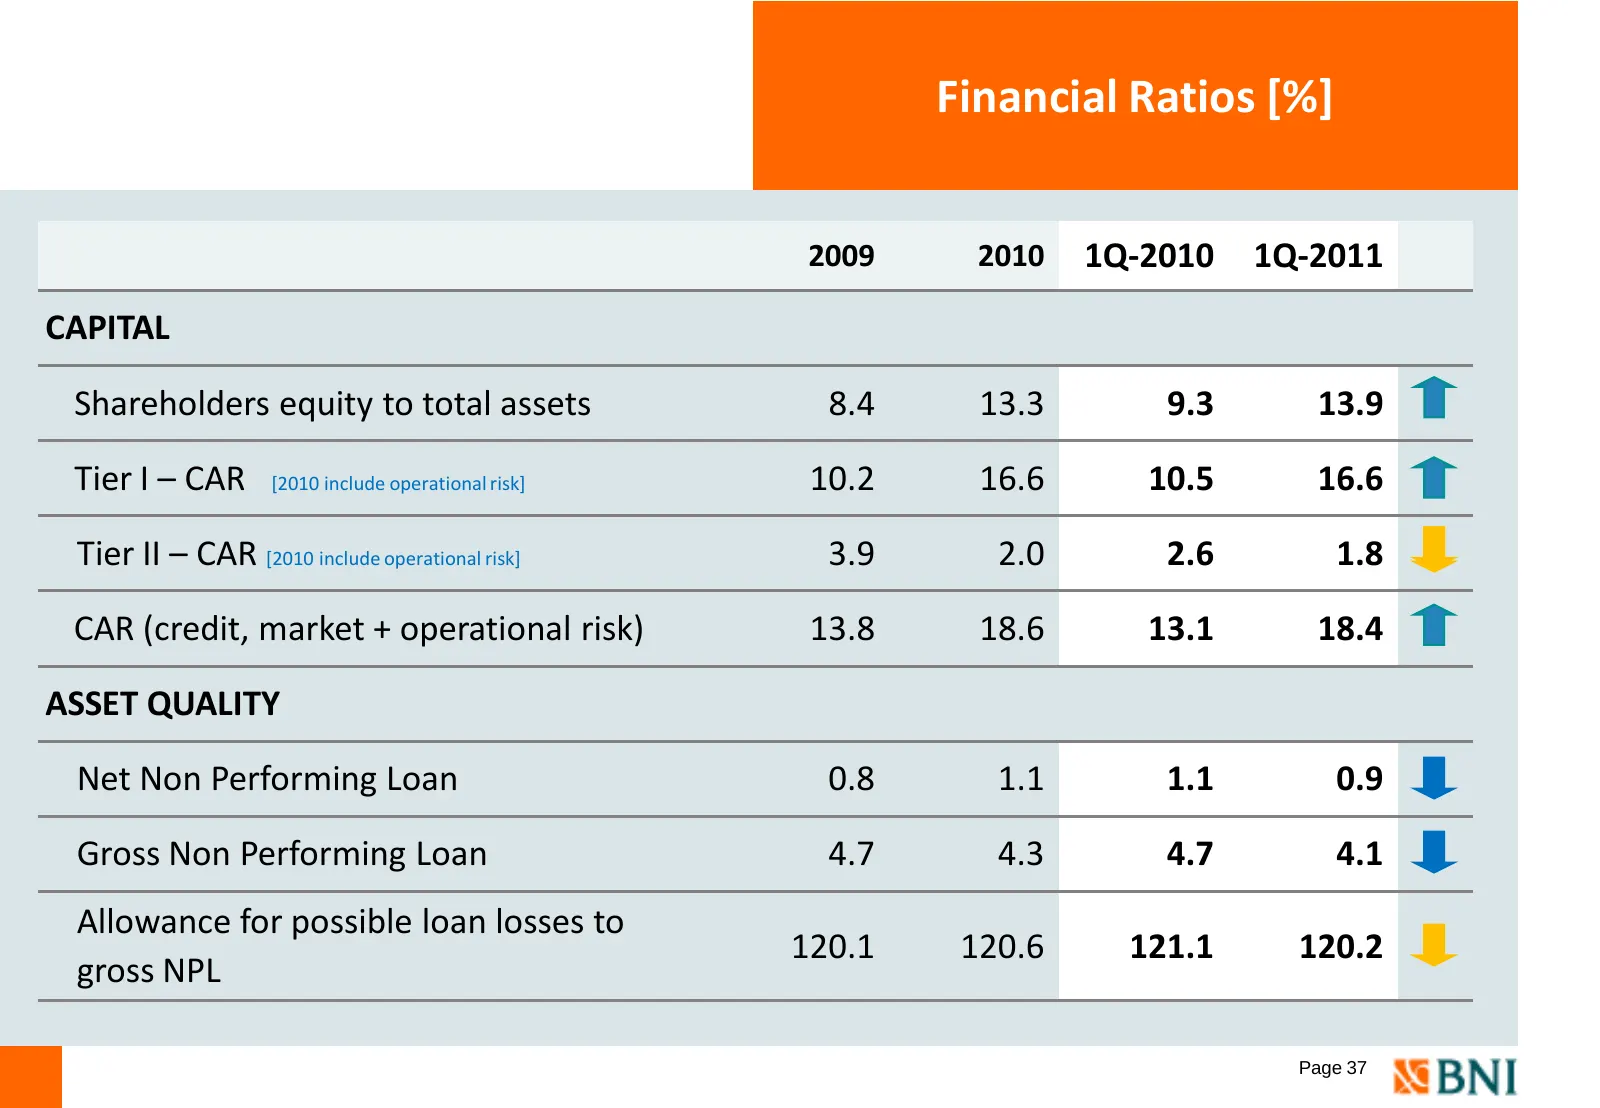
Financial Ratios [%] 2009 2010 1Q-2010 1Q-2011 CAPITAL Shareholders equity to total assets 8.4 13.3 9.3 13.9 Tier I – CAR [2010 include operational risk] 10.2 16.6 10.5 16.6 Tier II – CAR [2010 include operational risk] 3.9 2.0 2.6 1.8 CAR (credit, market + operational risk) 13.8 18.6 13.1 18.4 ASSE
Slide 39: Financial Ratios [%]
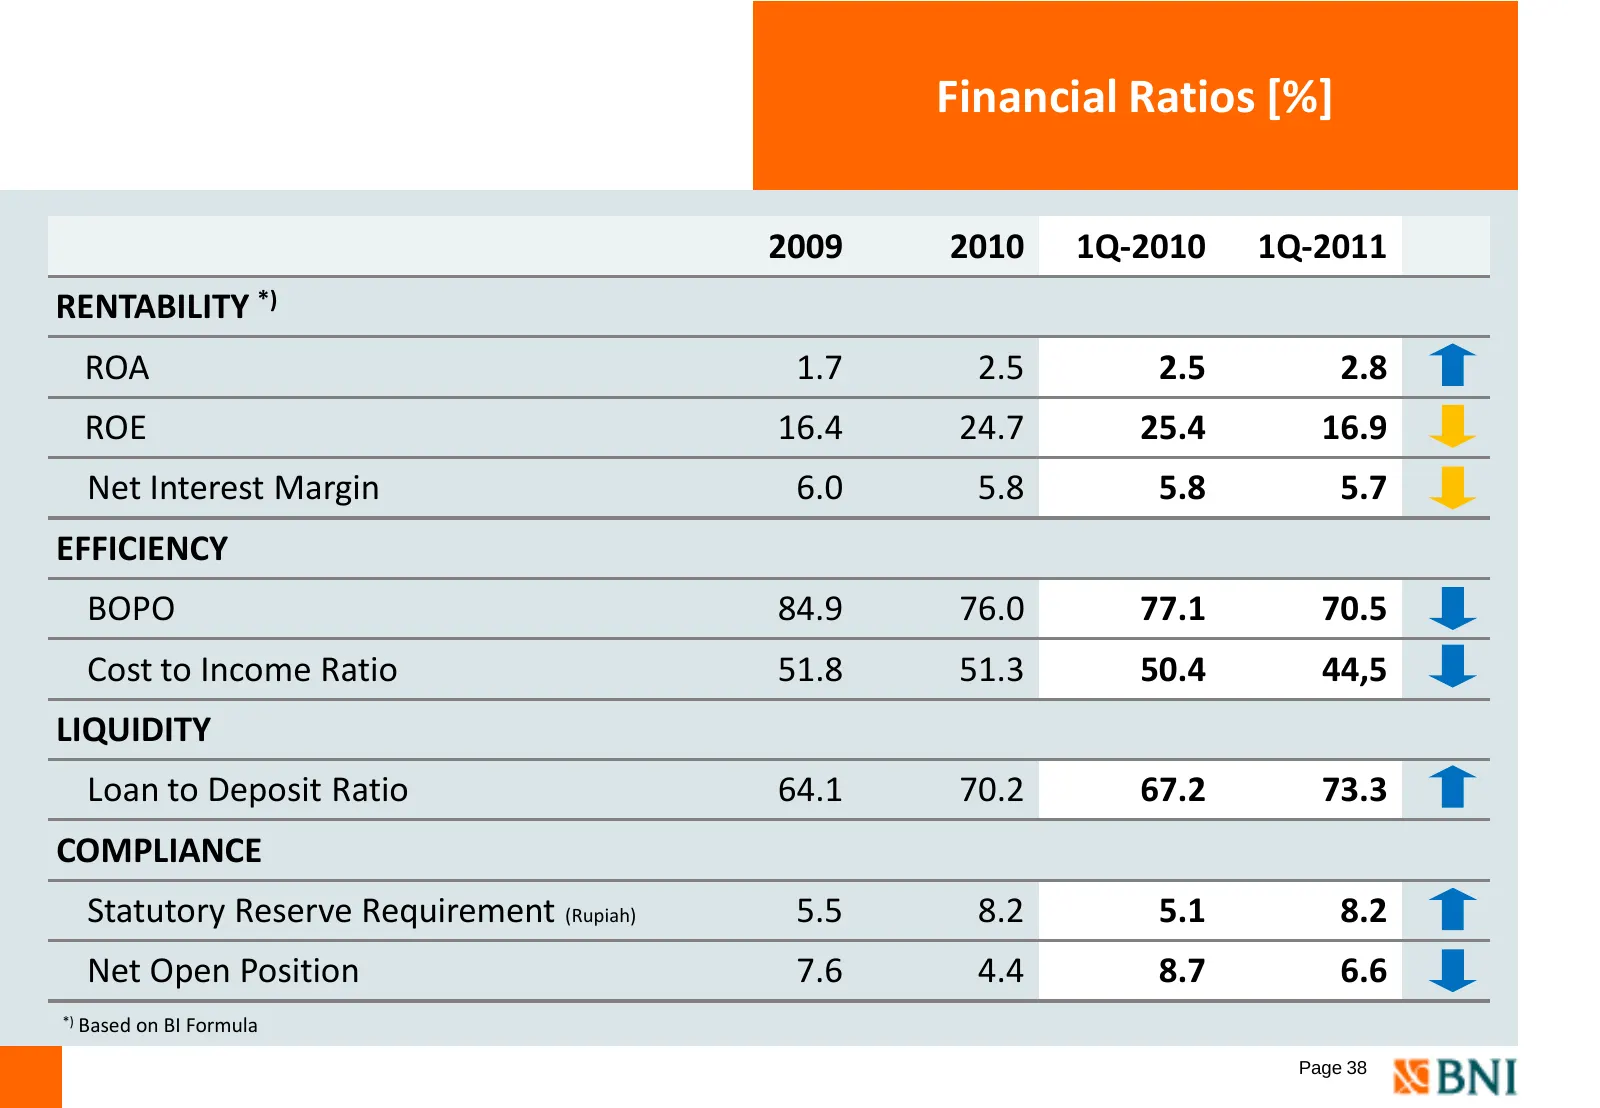
Financial Ratios [%] 2009 2010 1Q-2010 1Q-2011 RENTABILITY *) ROA 1.7 2.5 2.5 2.8 ROE 16.4 24.7 25.4 16.9 Net Interest Margin 6.0 5.8 5.8 5.7 EFFICIENCY BOPO 84.9 76.0 77.1 70.5 Cost to Income Ratio 51.8 51.3 50.4 44,5 LIQUIDITY Loan to Deposit Ratio 64.1 70.2 67.2 73.3 COMPLIANCE Statutory Reserve
Slide 40: BNI Shares
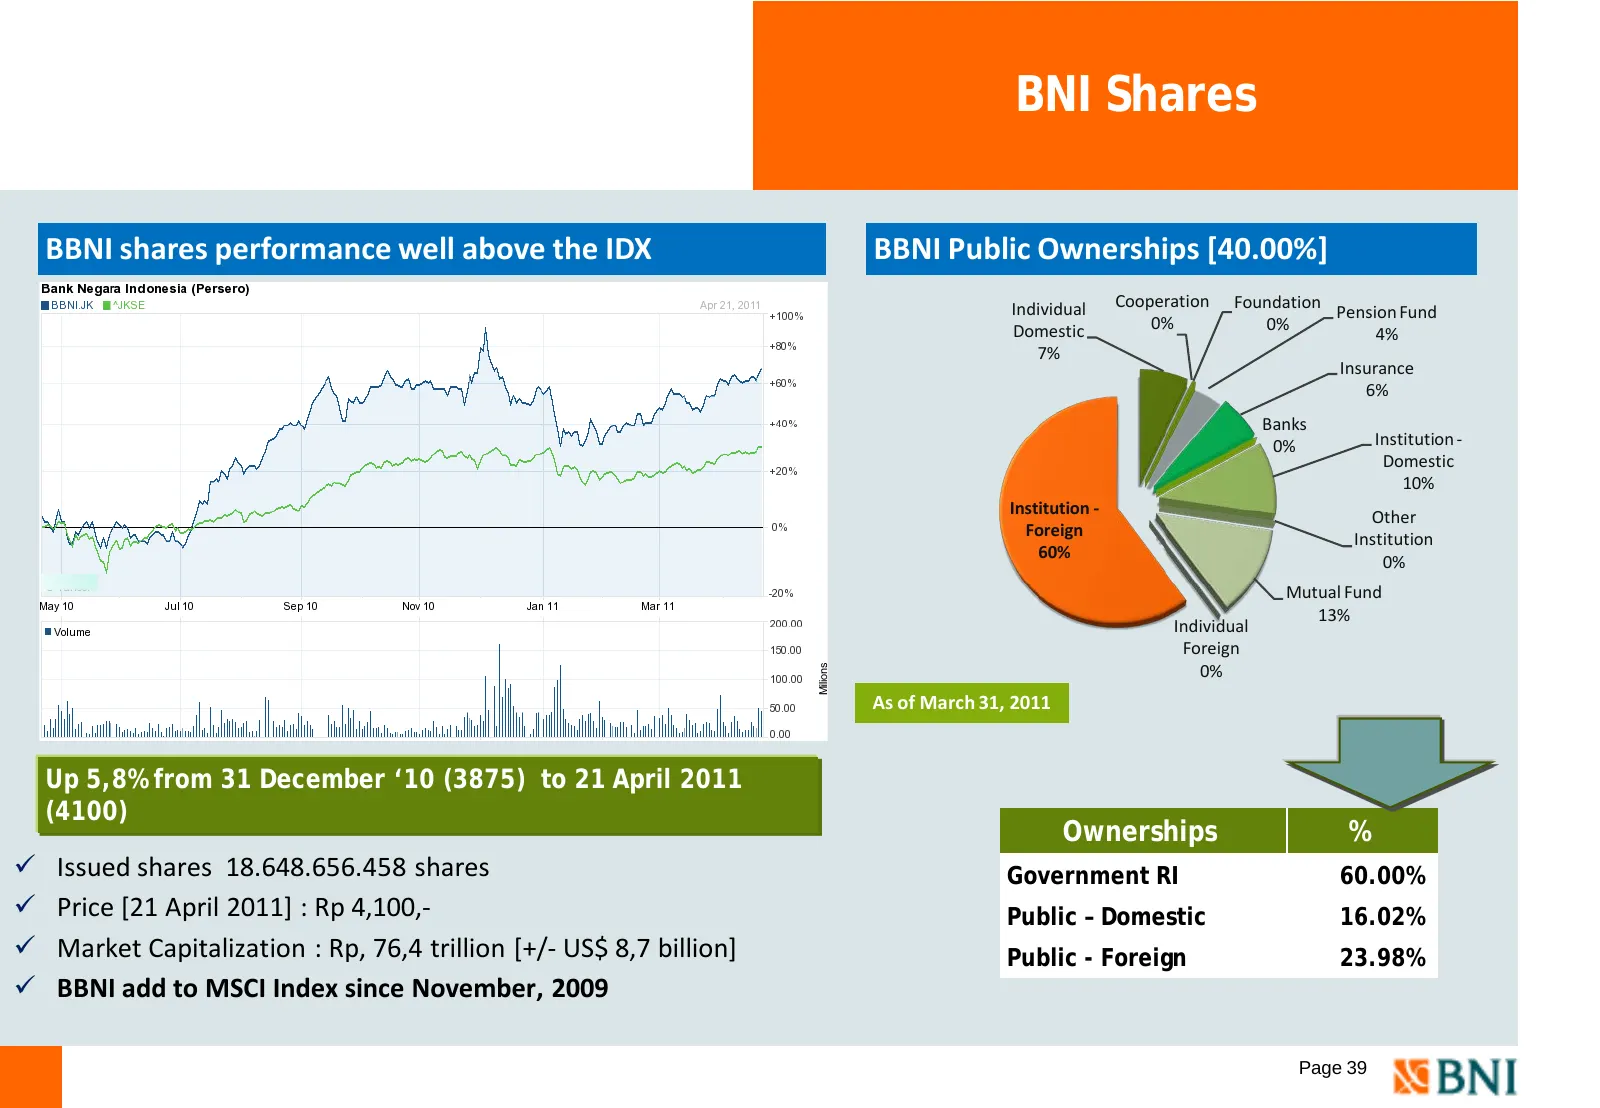
BNI Shares BBNI shares performance well above the IDX BBNI Public Ownerships [40.00%] Individual Cooperation Foundation Pension Fund Domestic 0% 0% 4% 7% Insurance 6% Banks 0% Institution - Domestic 10% Institution - Other Foreign Institution 60% 0% Mutual Fund 13% Individual Foreign 0% As of March
Slide 41: Progress to Date
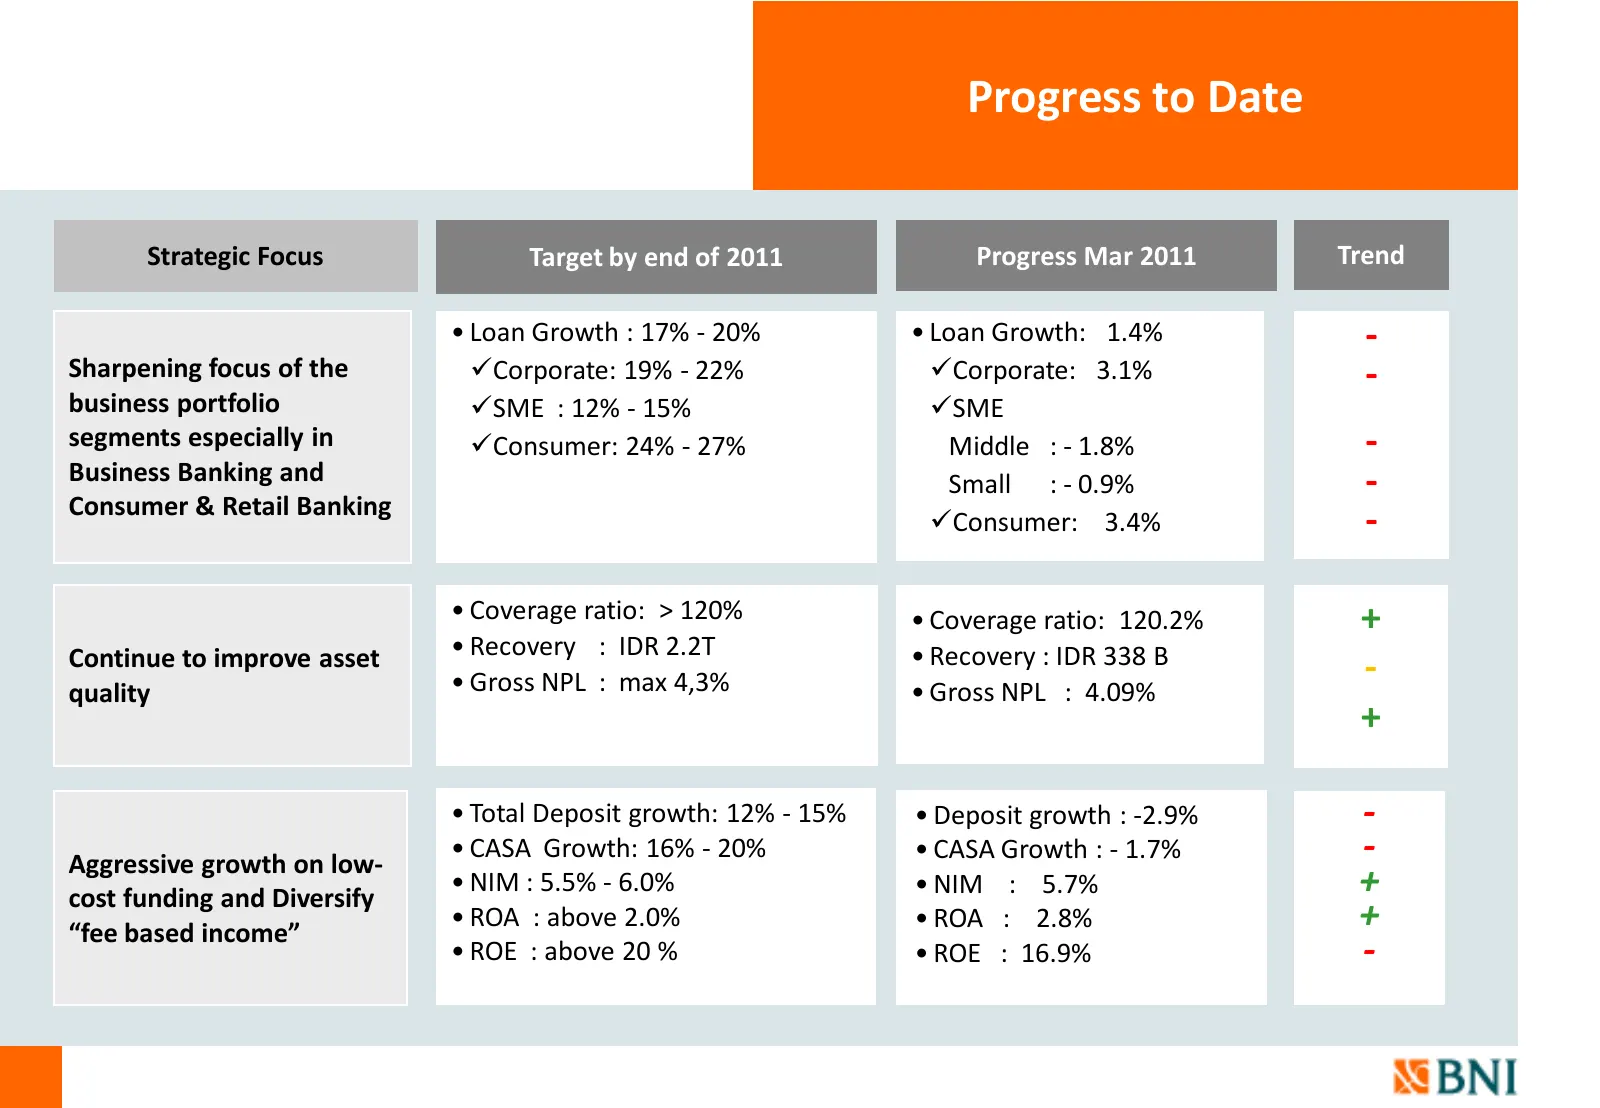
Progress to Date Strategic Focus Target by end of 2011 Progress Mar 2011 Trend • Loan Growth : 17% - 20% • Loan Growth: 1.4% - Sharpening focus of the Corporate: 19% - 22% Corporate: 3.1% - business portfolio SME : 12% - 15% SME segments especially in Consumer: 24% - 27% Middle : - 1.8% - Busin
Slide 42: Progress to date
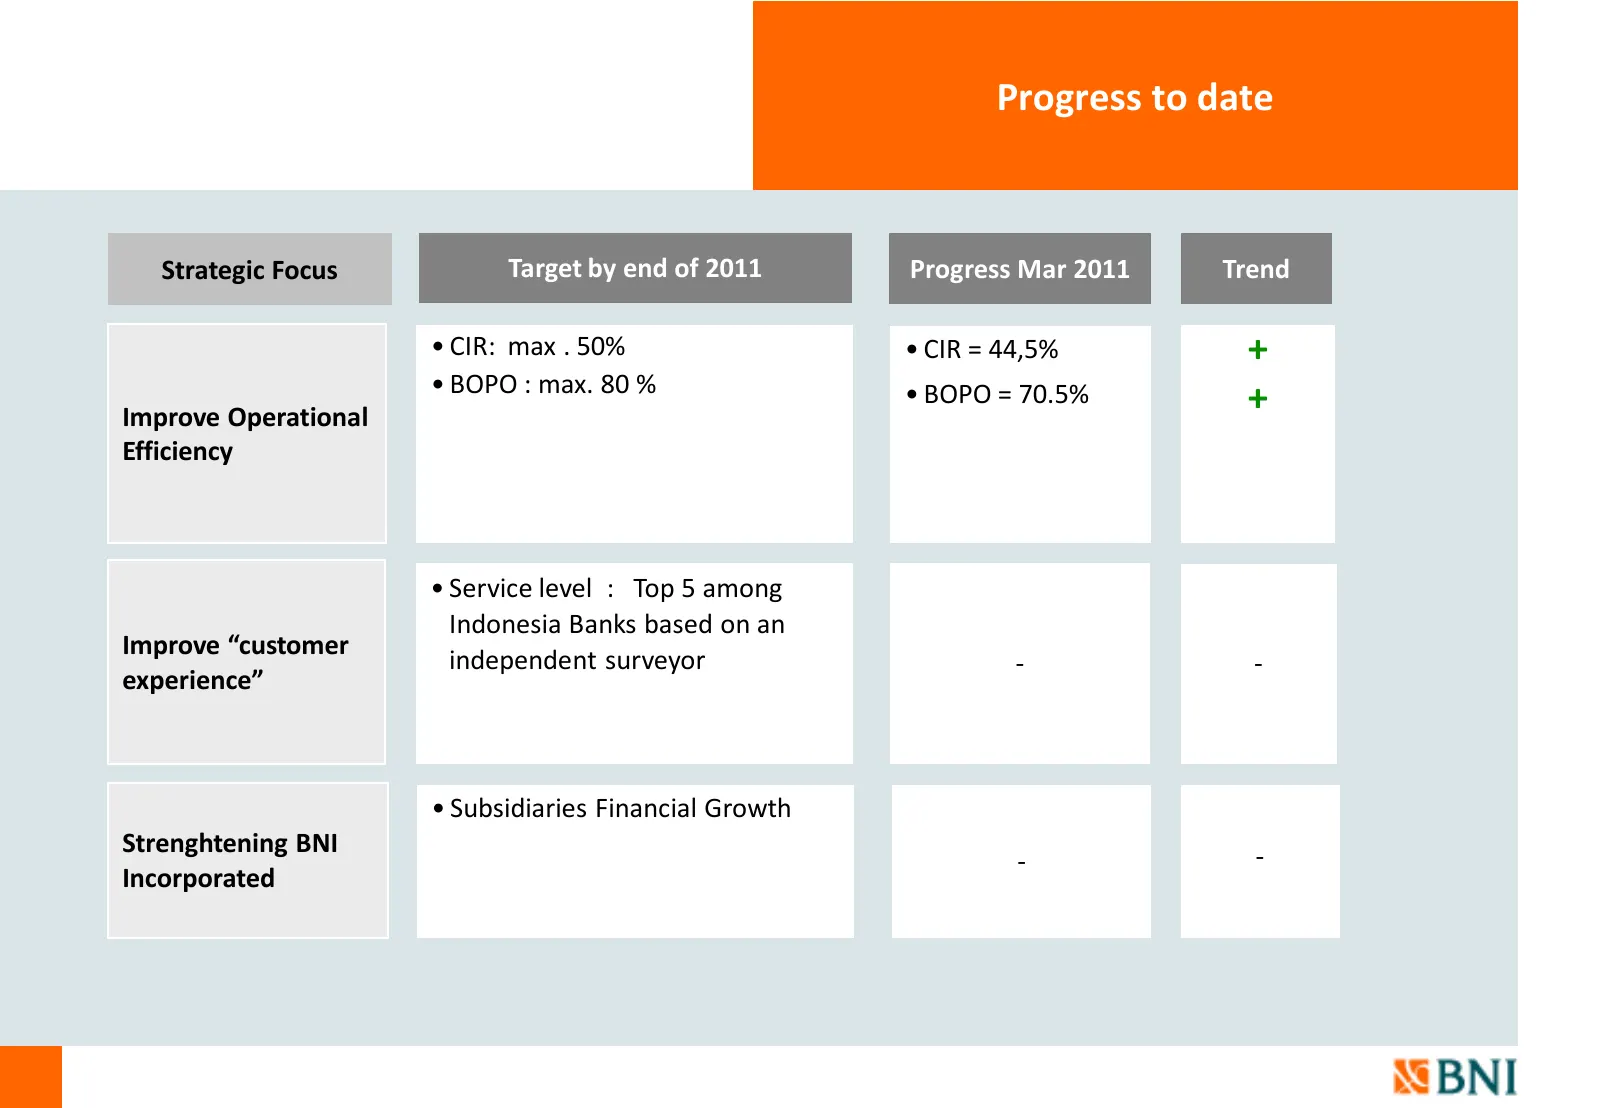
Progress to date Strategic Focus Target by end of 2011 Progress Mar 2011 Trend • CIR: max . 50% • CIR = 44,5% + • BOPO : max. 80 % Improve Operational • BOPO = 70.5% + Efficiency • Service level : Top 5 among Indonesia Banks based on an Improve “customer independent surveyor - - experience” • Subsid
Slide 43: APPENDIX: BNI in Brief
APPENDIX Section BNI in Brief Page 42
Slide 44: Senior management team
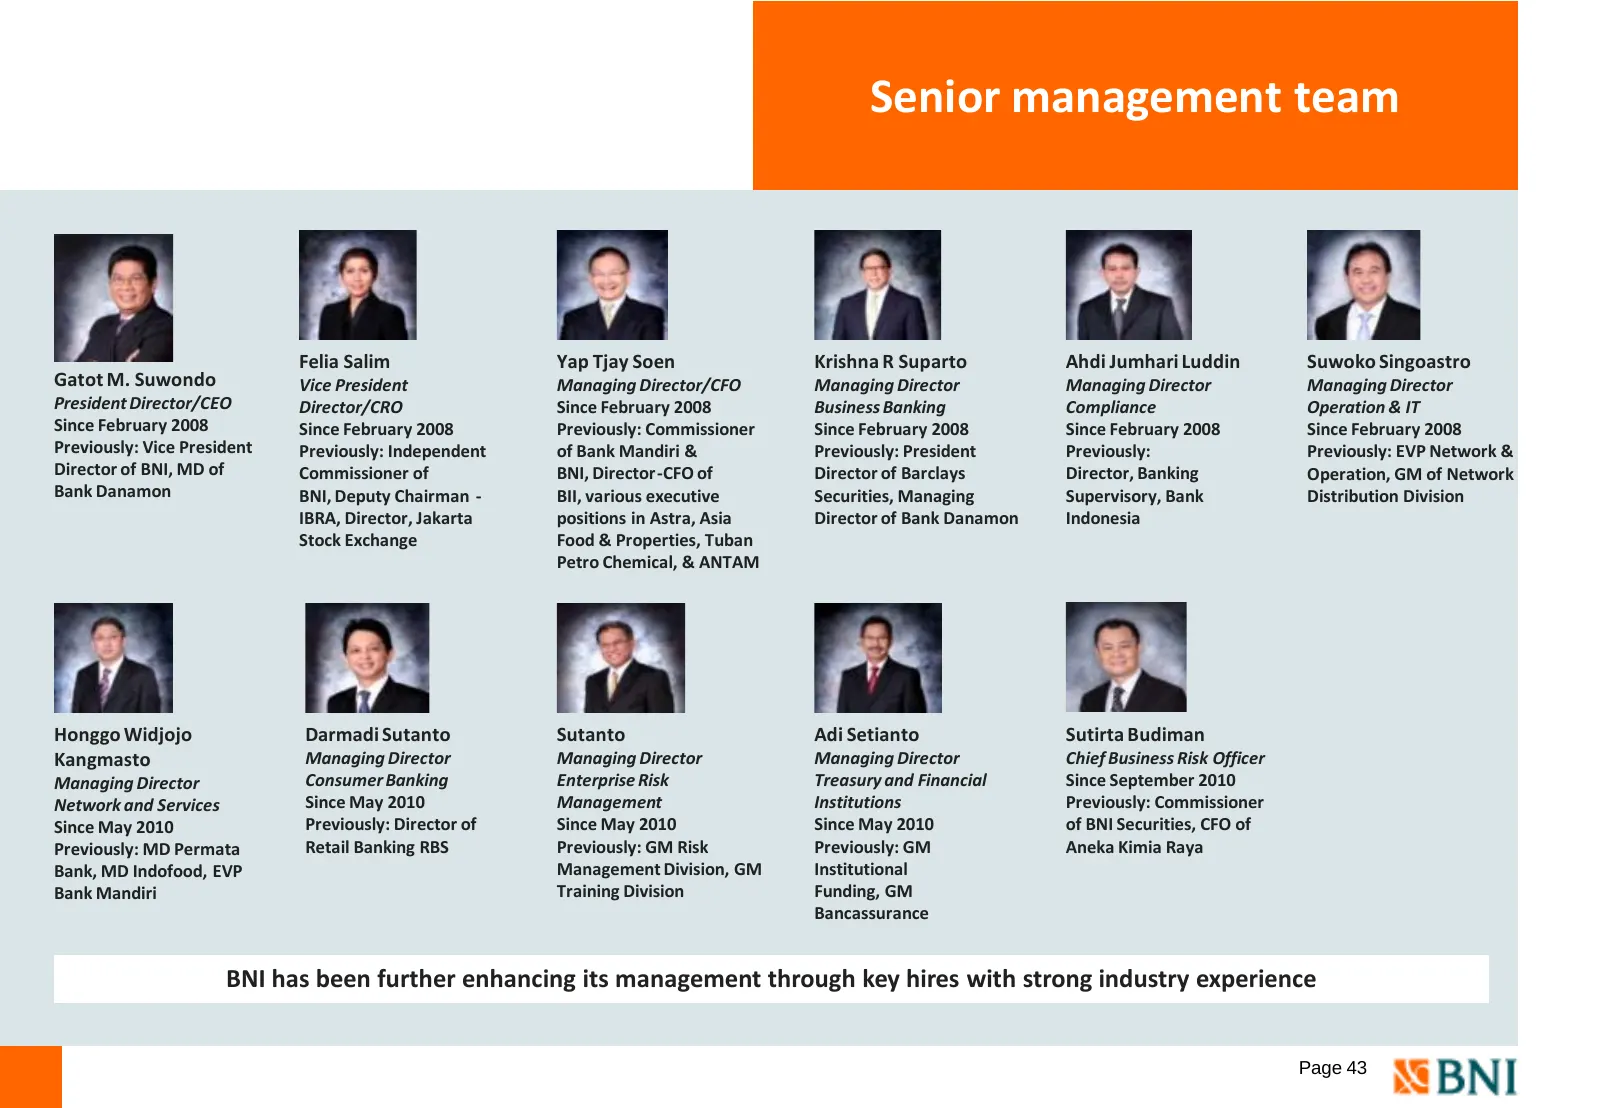
Senior management team Felia Salim Yap Tjay Soen Krishna R Suparto Ahdi Jumhari Luddin Suwoko Singoastro Gatot M. Suwondo Vice President Managing Director/CFO Managing Director Managing Director Managing Director President Director/CEO Director/CRO Since February 2008 Business Banking Compliance Ope
Slide 45: Board of Commissioners
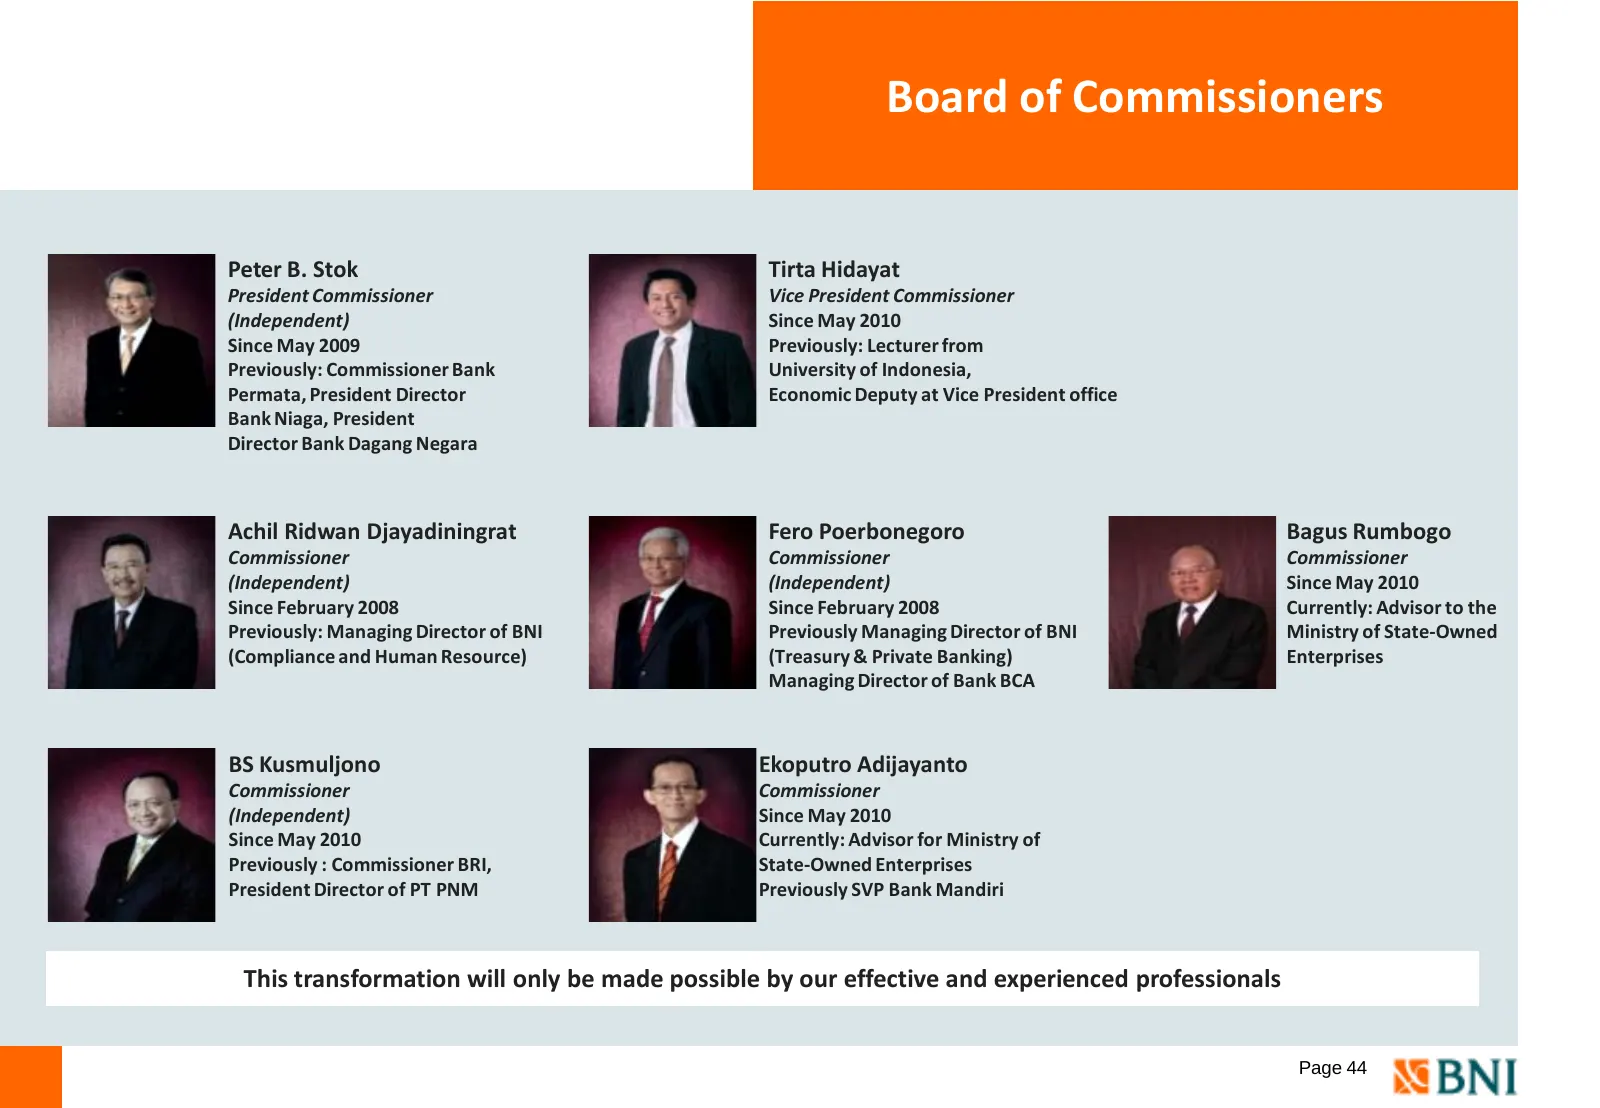
Board of Commissioners Peter B. Stok Tirta Hidayat President Commissioner Vice President Commissioner (Independent) Since May 2010 Since May 2009 Previously: Lecturer from Previously: Commissioner Bank University of Indonesia, Permata, President Director Economic Deputy at Vice President office Bank
Slide 46: BNI has a long track record in the Indonesian banking sector
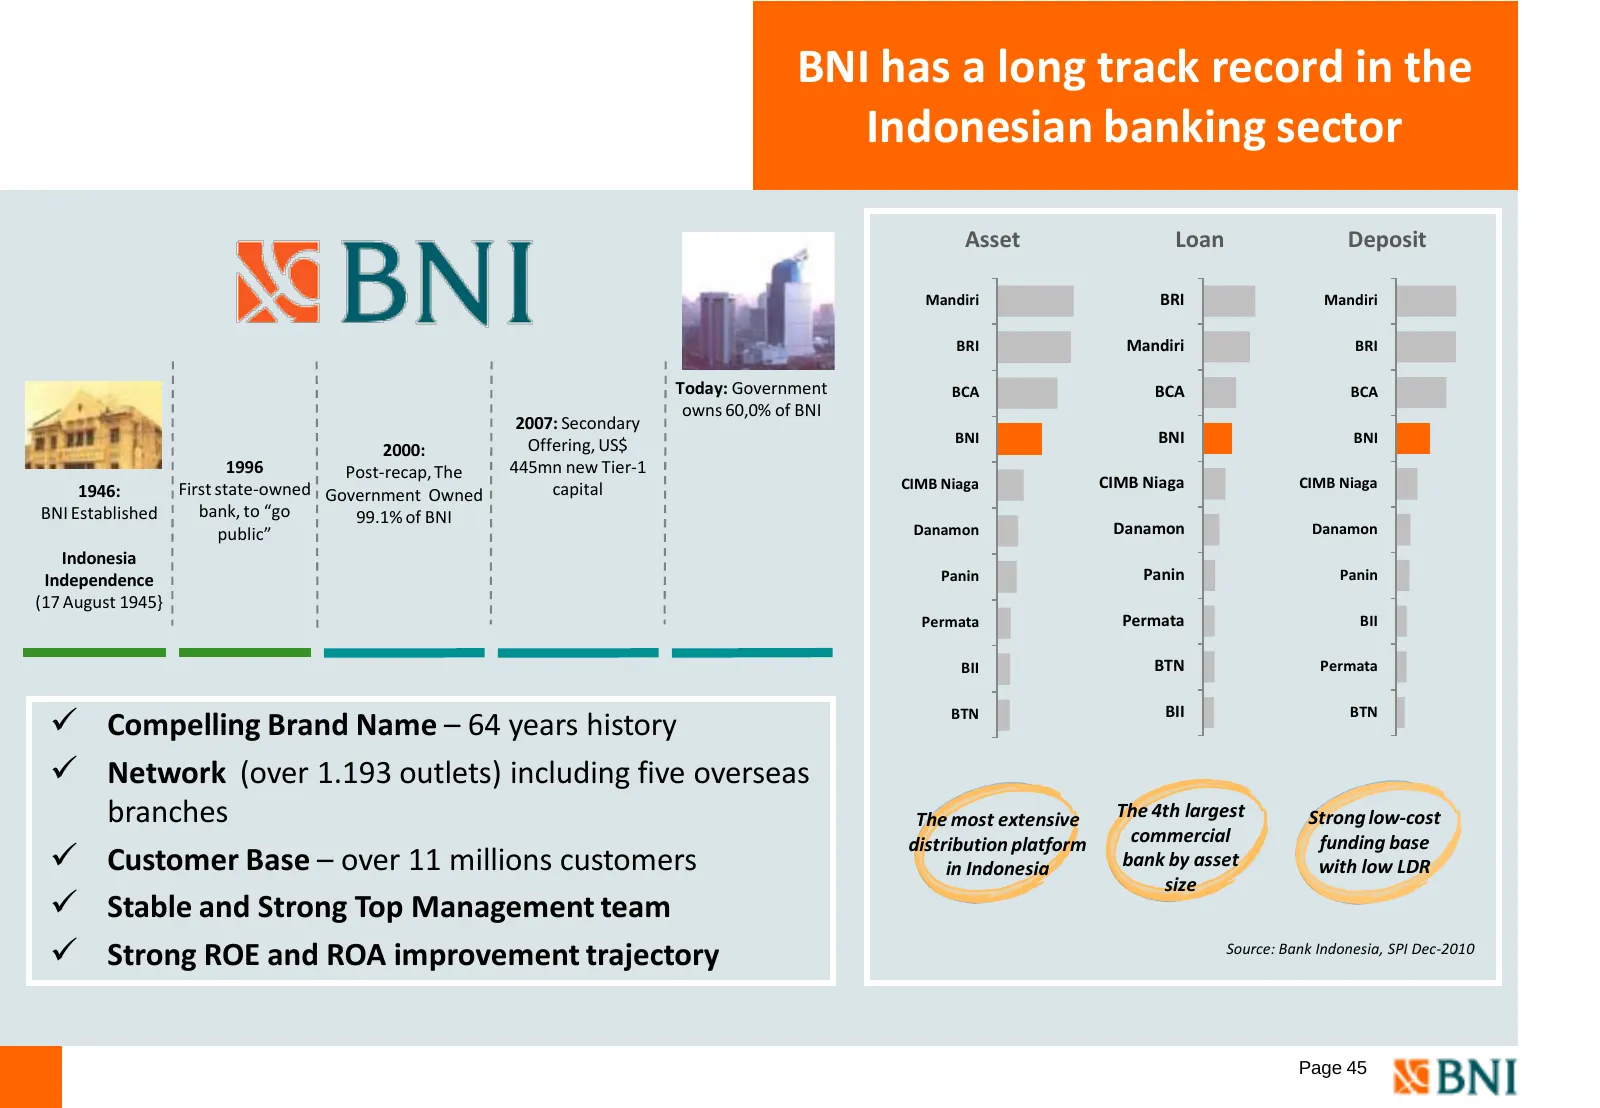
BNI has a long track record in the Indonesian banking sector Asset Loan Deposit Mandiri BRI Mandiri BRI Mandiri BRI Today: Government BCA BCA BCA owns 60,0% of BNI 2007: Secondary Offering, US$ BNI BNI BNI 2000: 1996 Post-recap, The 445mn new Tier-1 1946: First state-owned Government Owned capital C
Slide 47: Offering leading products…
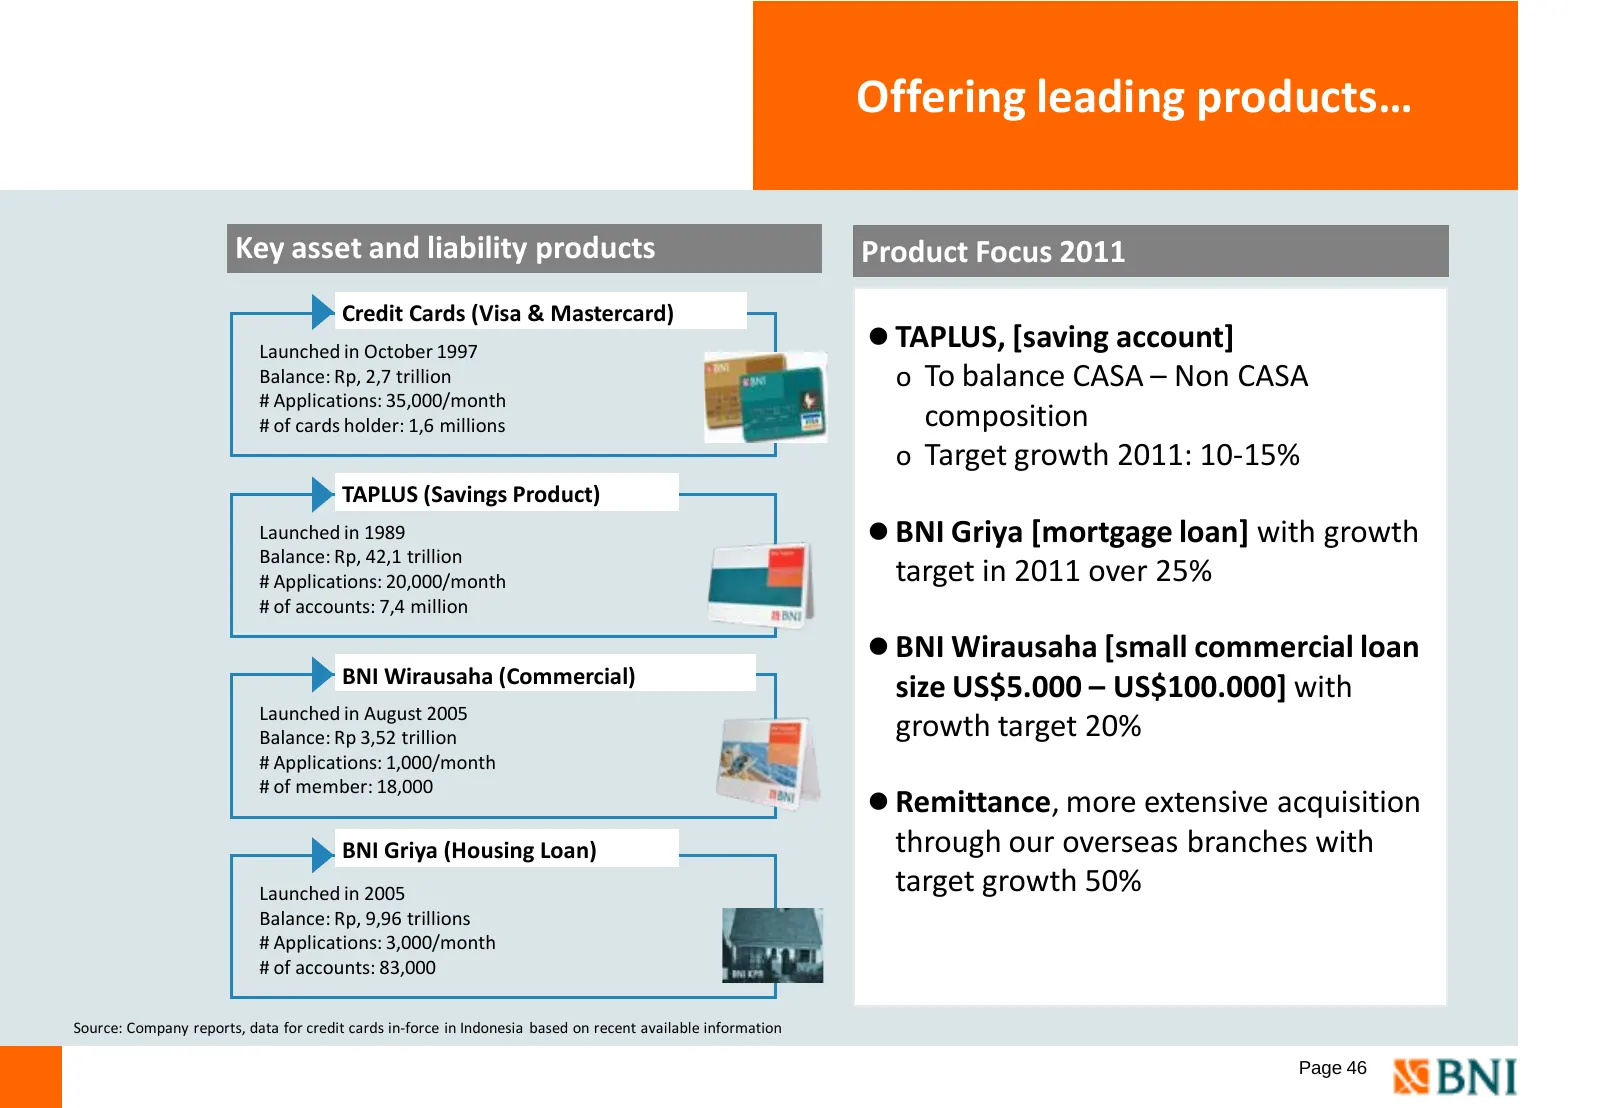
Offering leading products… Key asset and liability products Product Focus 2011 Credit Cards (Visa & Mastercard) Launched in October 1997 TAPLUS, [saving account] Balance: Rp, 2,7 trillion o To balance CASA – Non CASA # Applications: 35,000/month # of cards holder: 1,6 millions composition o Target
Slide 48: BNI ratings
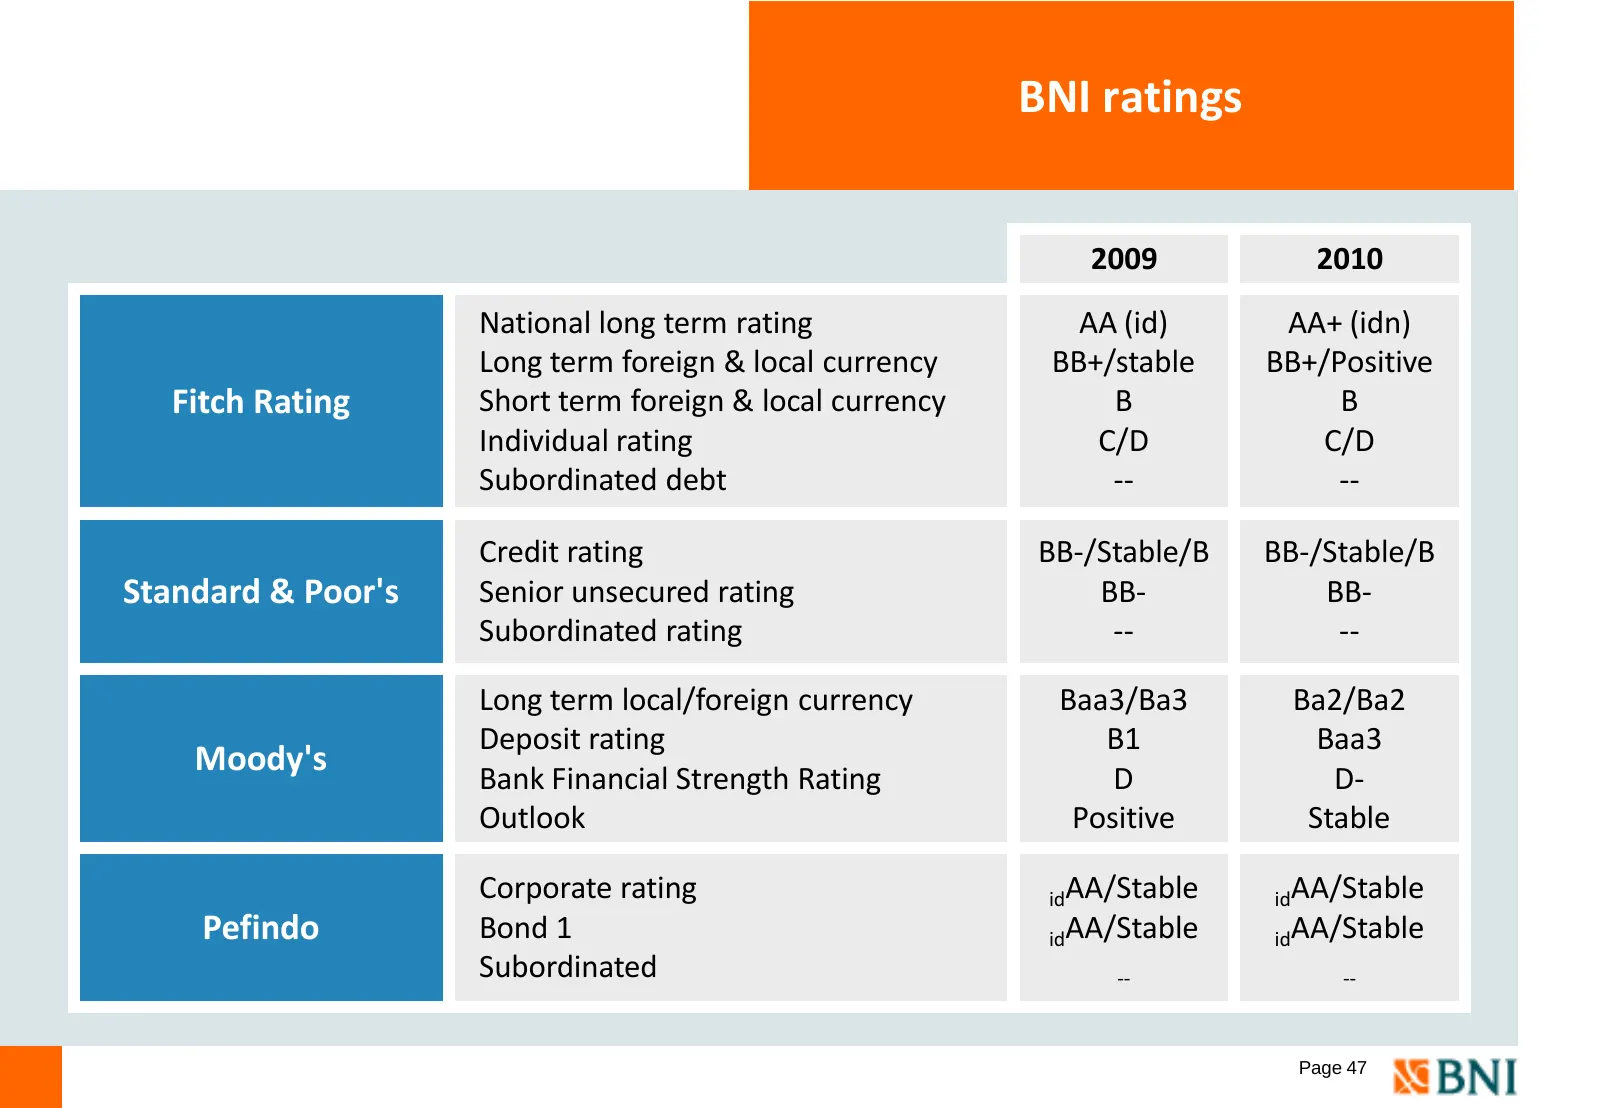
BNI ratings 2009 2010 National long term rating AA (id) AA+ (idn) Long term foreign & local currency BB+/stable BB+/Positive Fitch Rating Short term foreign & local currency B B Individual rating C/D C/D Subordinated debt -- -- Credit rating BB-/Stable/B BB-/Stable/B Standard & Poor's Senior unsecur
Source: Internet Archive copy of bni.co.id
More decks from PT Bank Negara Indonesia (Persero) Tbk Class B
 Q1 2025 Earnings Presentation68 slides · Apr 28, 2025
 FY2024 Earnings Presentation71 slides · Jan 22, 2025
 Q1 2024 Earnings Presentation72 slides · Apr 29, 2024
 Q3 2023 Earnings Presentation74 slides · Oct 31, 2023
 Q1 2023 Earnings Presentation69 slides · May 18, 2023
 FY2022 Earnings Presentation69 slides · Jan 24, 2023