Flutter Entertainment plc · NYSE:FLUT
Flutter Entertainment — Paddy Power — FY2009 Earnings Presentation
30 slides from Flutter Entertainment's earnings presentation, 2010
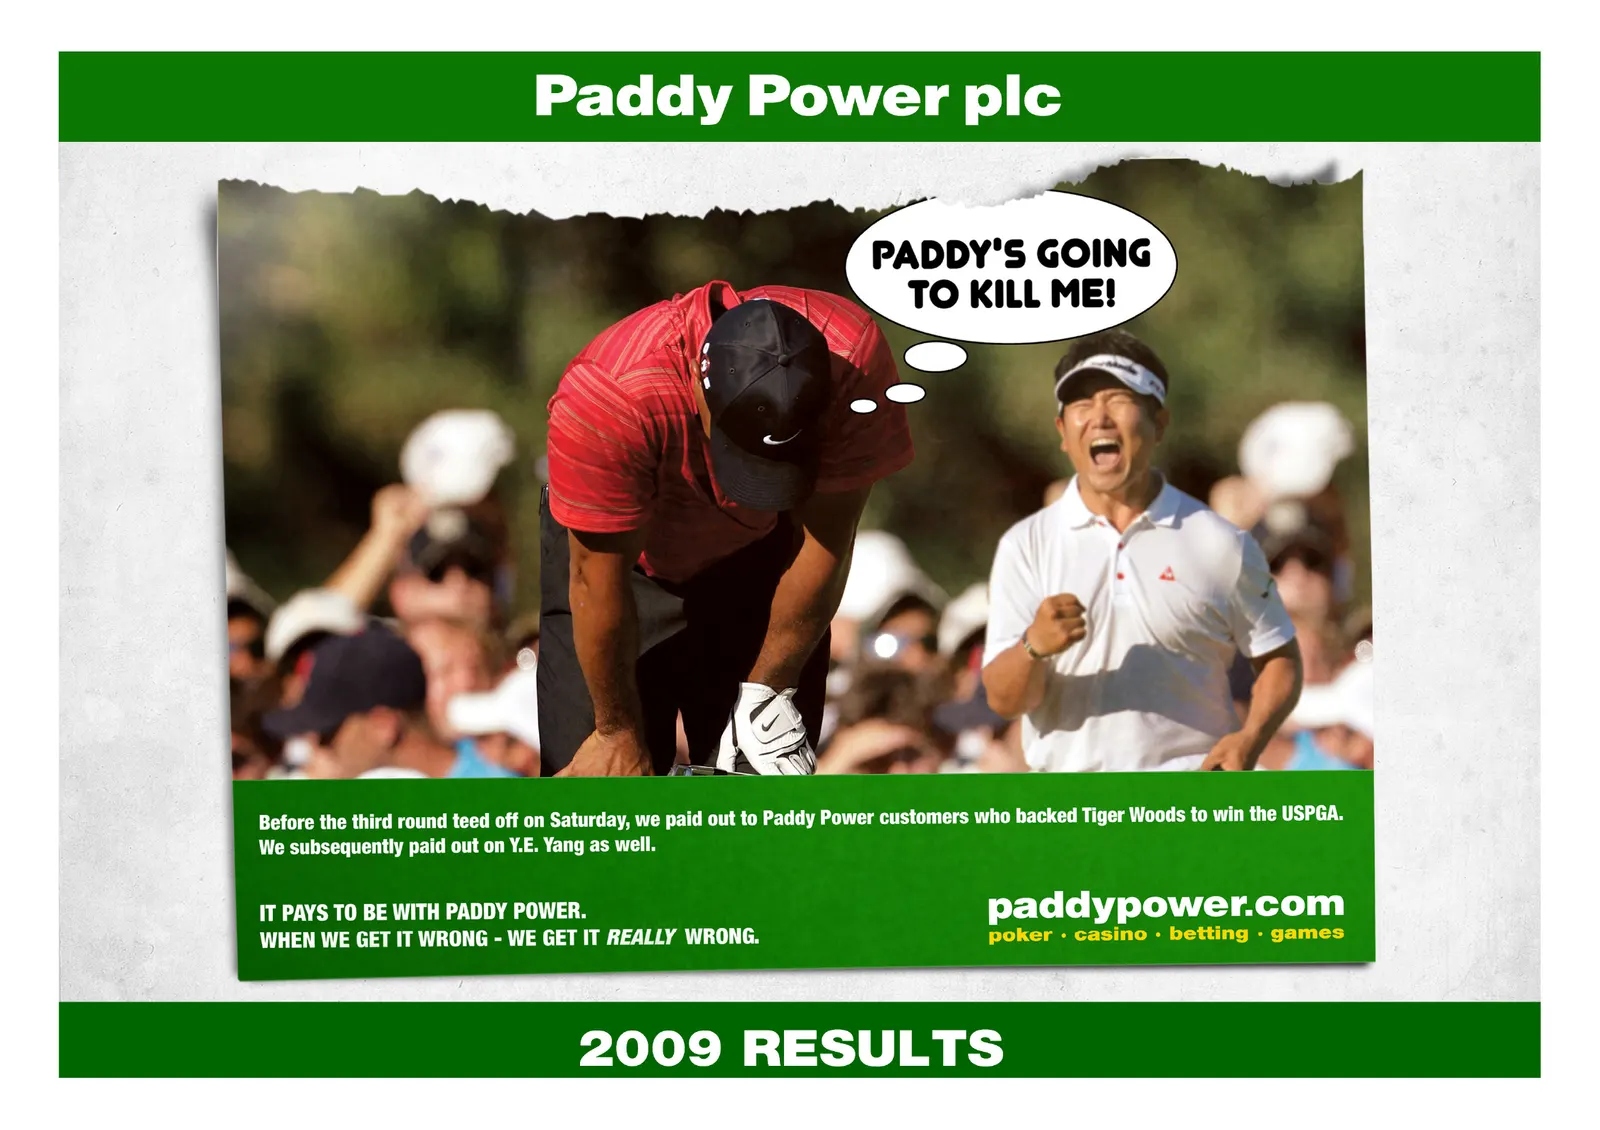
Slide 1: 2009 Results
Paddy Power pic PADDY'S GOING TO KILL ME! Before the third round teed off on Saturday, we paid out to Paddy Power customers who backed Tiger Woods to win the USPGA. We subsequently paid out on Y.E. Yang as well. IT PAYS TO BE WITH PADDY POWER. paddypower.com WHEN WE GET IT WRONG - WE GET IT REALLY W
Slide 2: Introduction
Introduction Introduction Financial Performance Divisional Review Strategy & Outlook Page 1
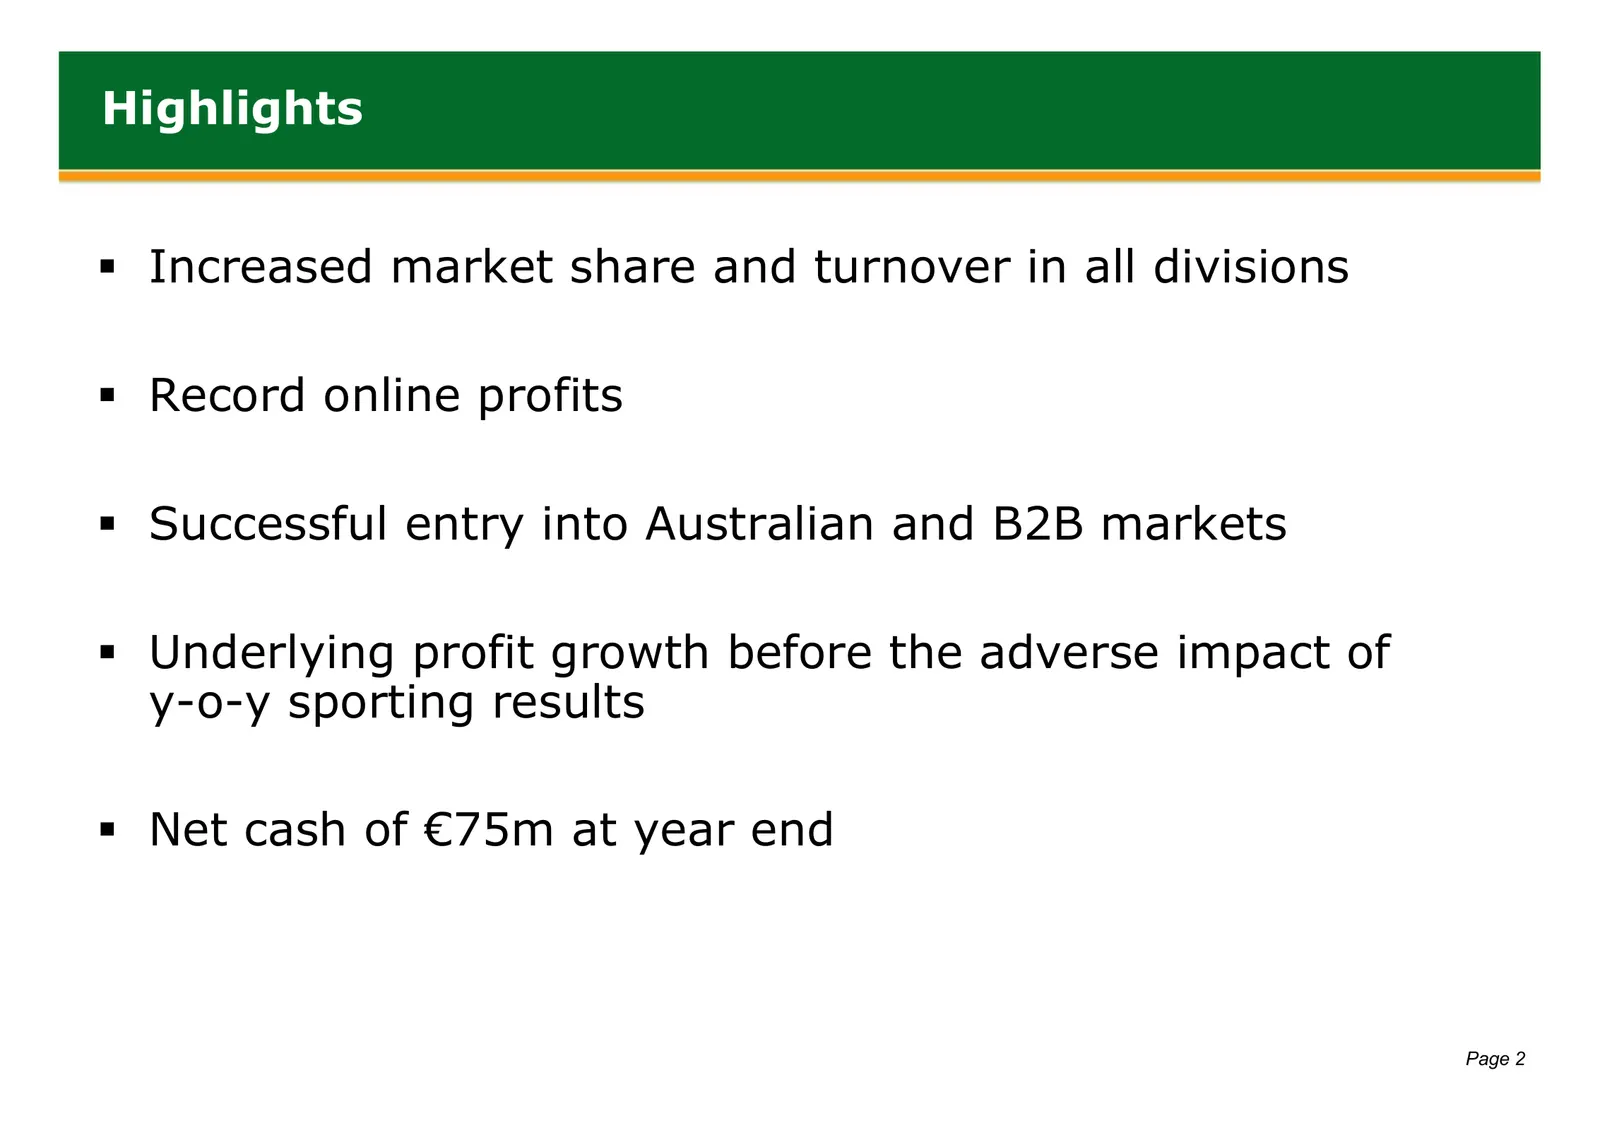
Slide 3: Highlights
Highlights Increased market share and turnover in all divisions Record online profits Successful entry into Australian and B2B markets Underlying profit growth before the adverse impact of y-o-y sporting results Net cash of €75m at year end Page 2
Slide 4: Financial Performance
Financial Performance Introduction Financial Performance Divisional Review Strategy & Outlook Page 3
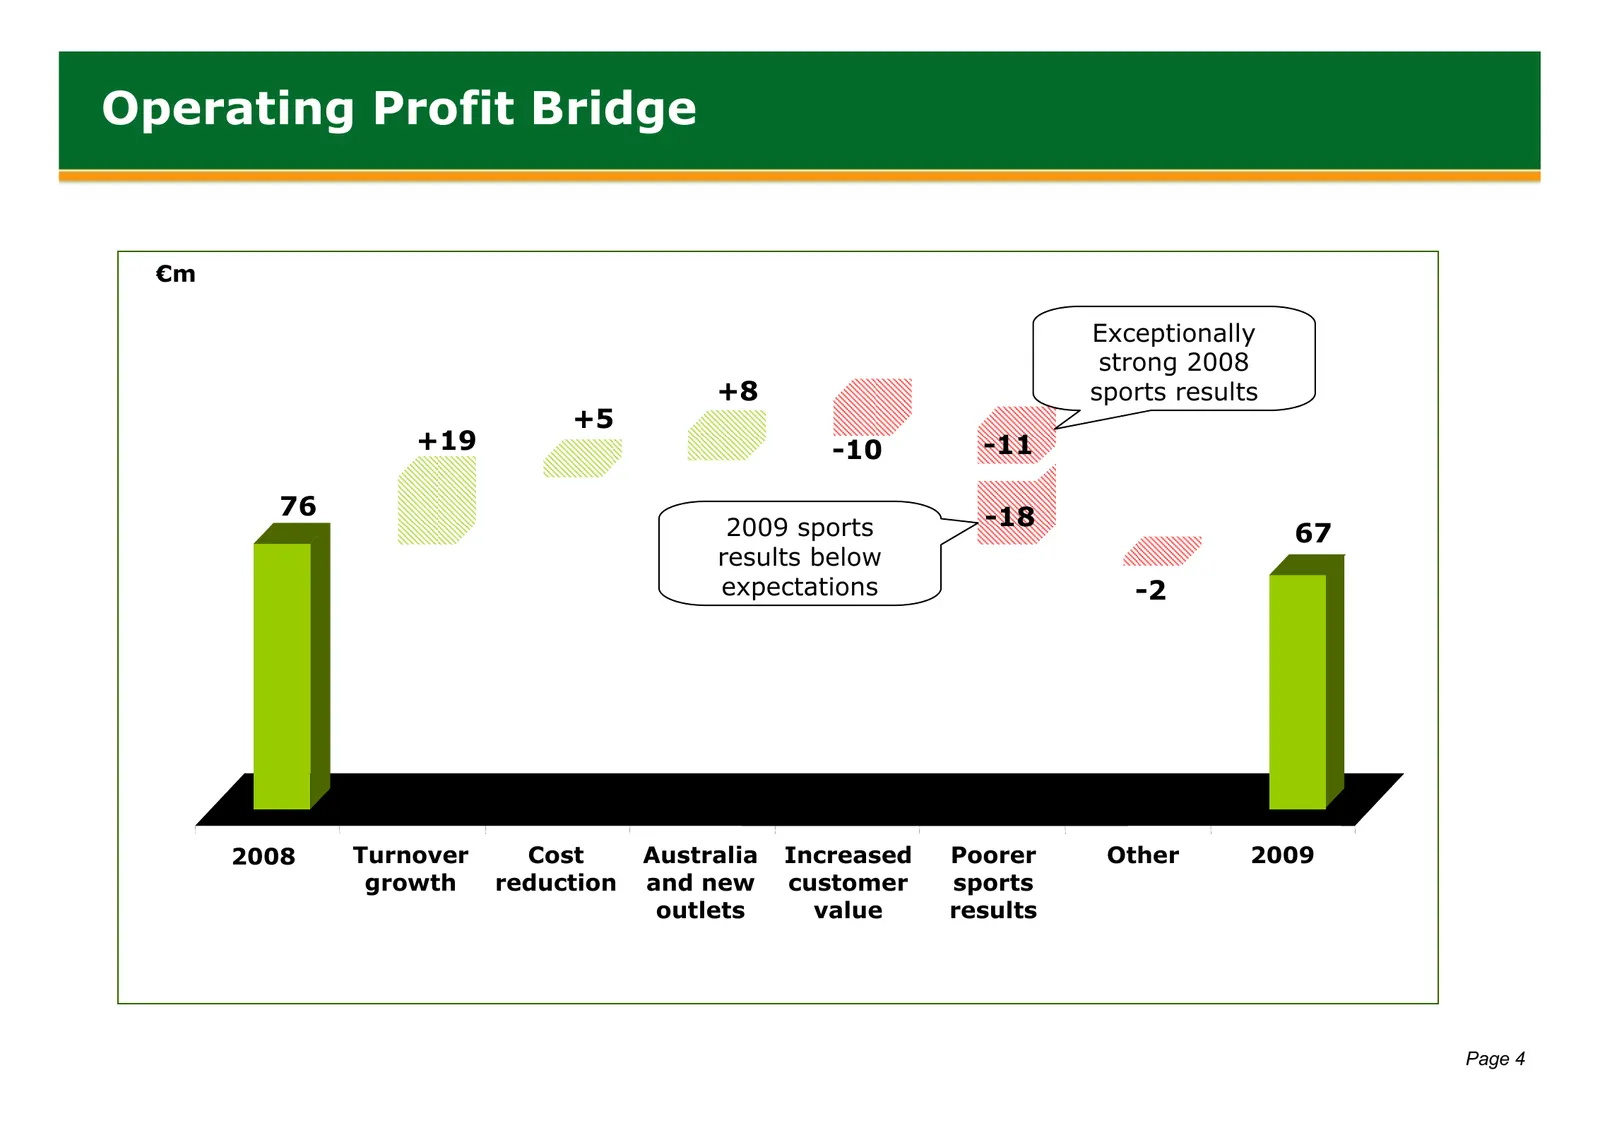
Slide 5: Operating Profit Bridge
Operating Profit Bridge €m Exceptionally strong 2008 +8 sports results +5 +19 -10 -11 76 -18 2009 sports 67 results below expectations -2 2008 Turnover Cost Australia Increased Poorer Other 2009 growth reduction and new customer sports outlets value results Page 4
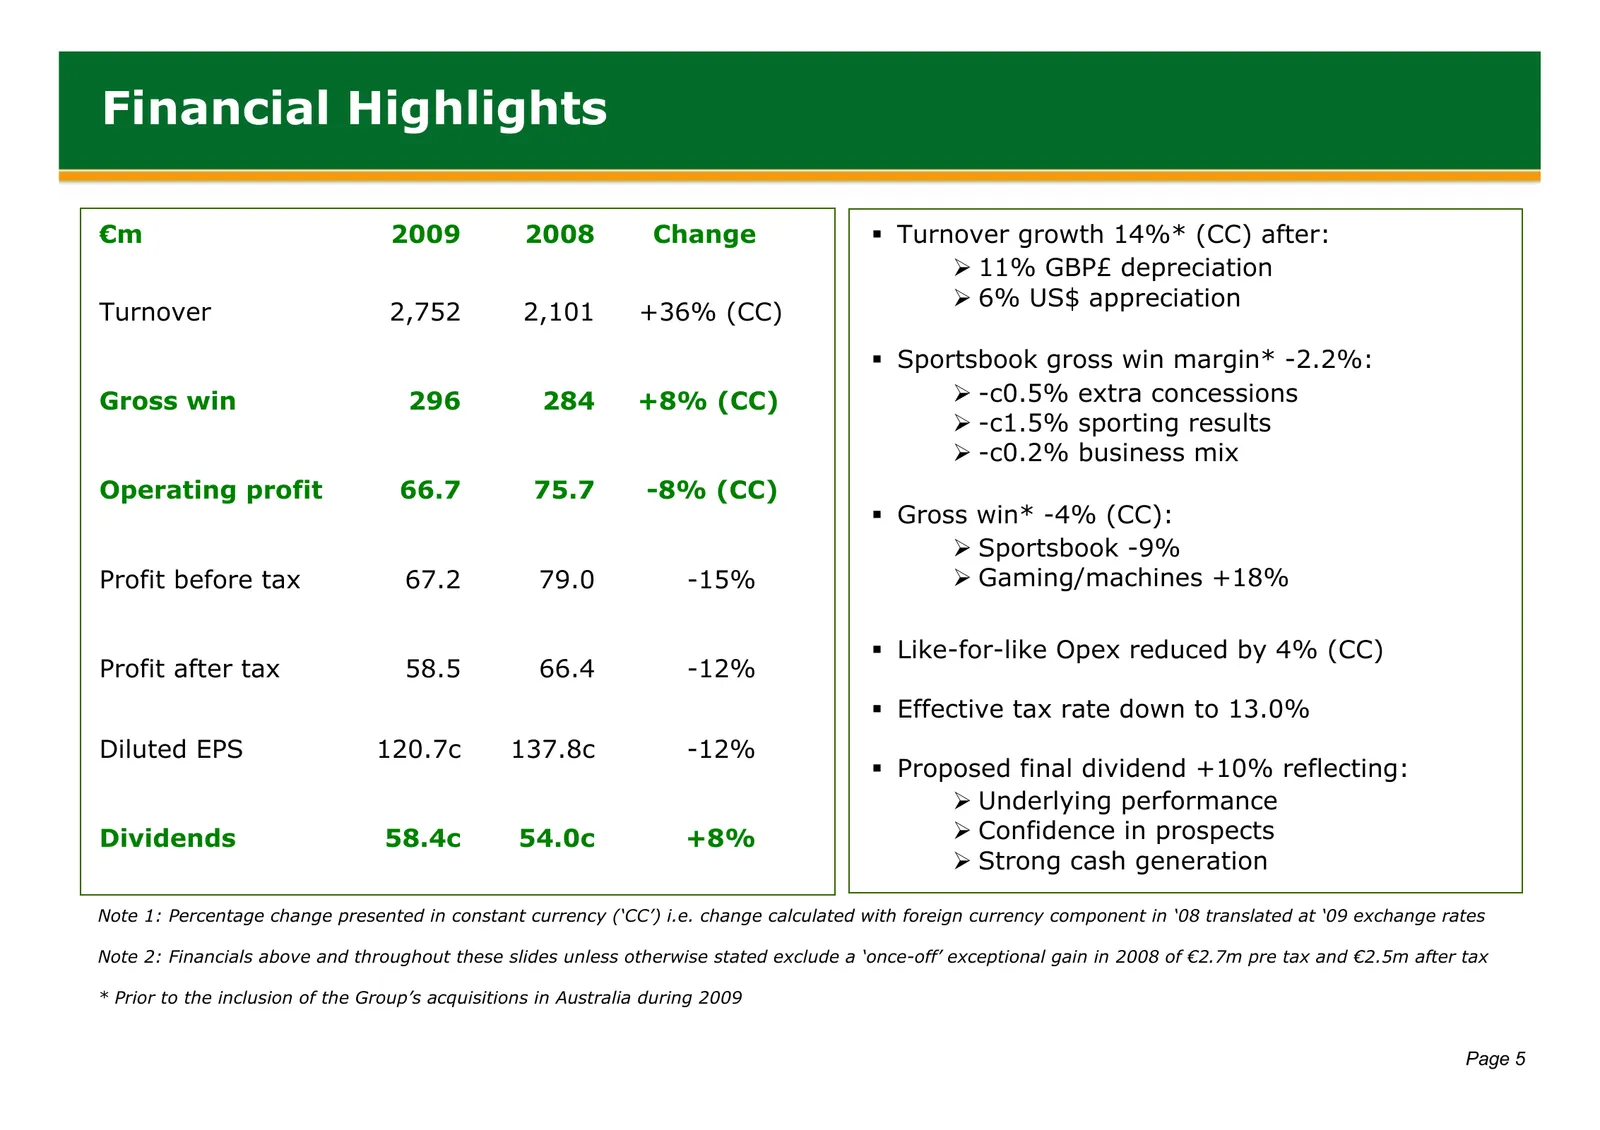
Slide 6: Financial Highlights
Financial Highlights €m 2009 2008 Change Turnover growth 14%* (CC) after: ¾ 11% GBP£ depreciation ¾ 6% US$ appreciation Turnover 2,752 2,101 +36% (CC) Sportsbook gross win margin* -2.2%: Gross win 296 284 +8% (CC) ¾ -c0.5% extra concessions ¾ -c1.5% sporting results ¾ -c0.2% business mix Operati
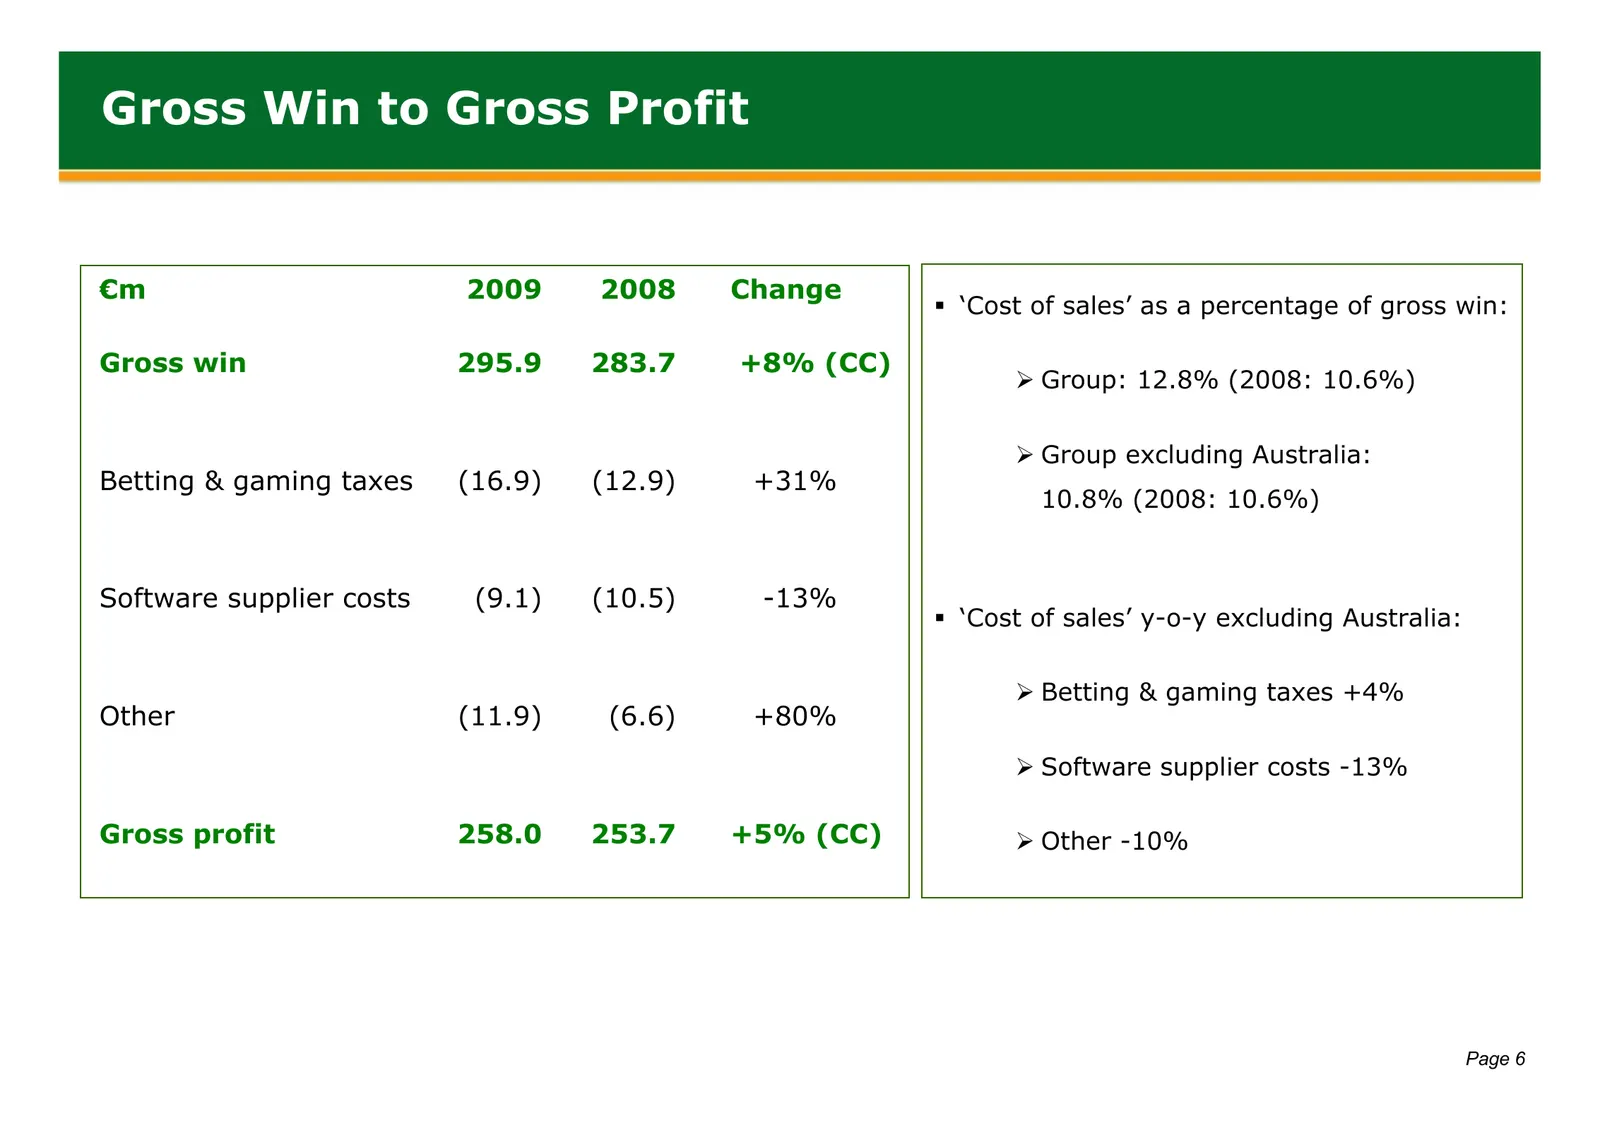
Slide 7: Gross Win to Gross Profit
Gross Win to Gross Profit €m 2009 2008 Change ‘Cost of sales’ as a percentage of gross win: Gross win 295.9 283.7 +8% (CC) ¾ Group: 12.8% (2008: 10.6%) ¾ Group excluding Australia: Betting & gaming taxes (16.9) (12.9) +31% 10.8% (2008: 10.6%) Software supplier costs (9.1) (10.5) -13% ‘Cost of sa
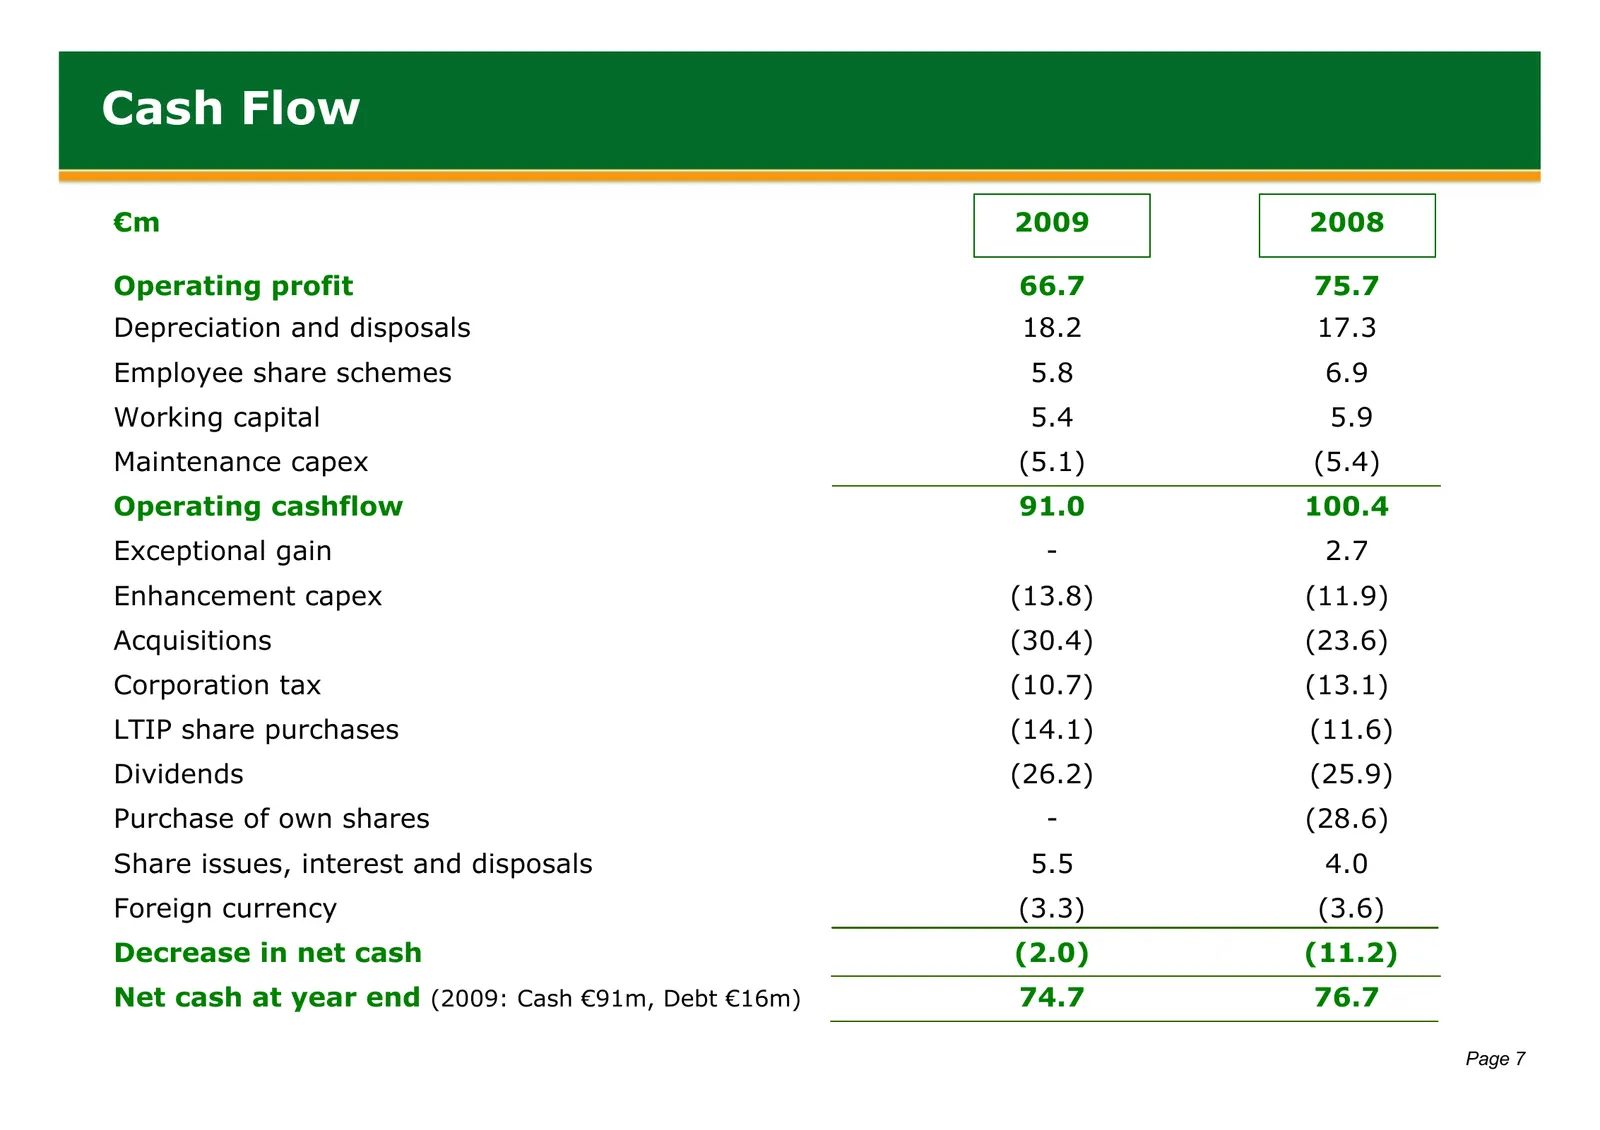
Slide 8: Cash Flow
Cash Flow €m 2009 2008 Operating profit 66.7 75.7 Depreciation and disposals 18.2 17.3 Employee share schemes 5.8 6.9 Working capital 5.4 5.9 Maintenance capex (5.1) (5.4) Operating cashflow 91.0 100.4 Exceptional gain - 2.7 Enhancement capex (13.8) (11.9) Acquisitions (30.4) (23.6) Corporation tax
Slide 9: Capital Expenditure
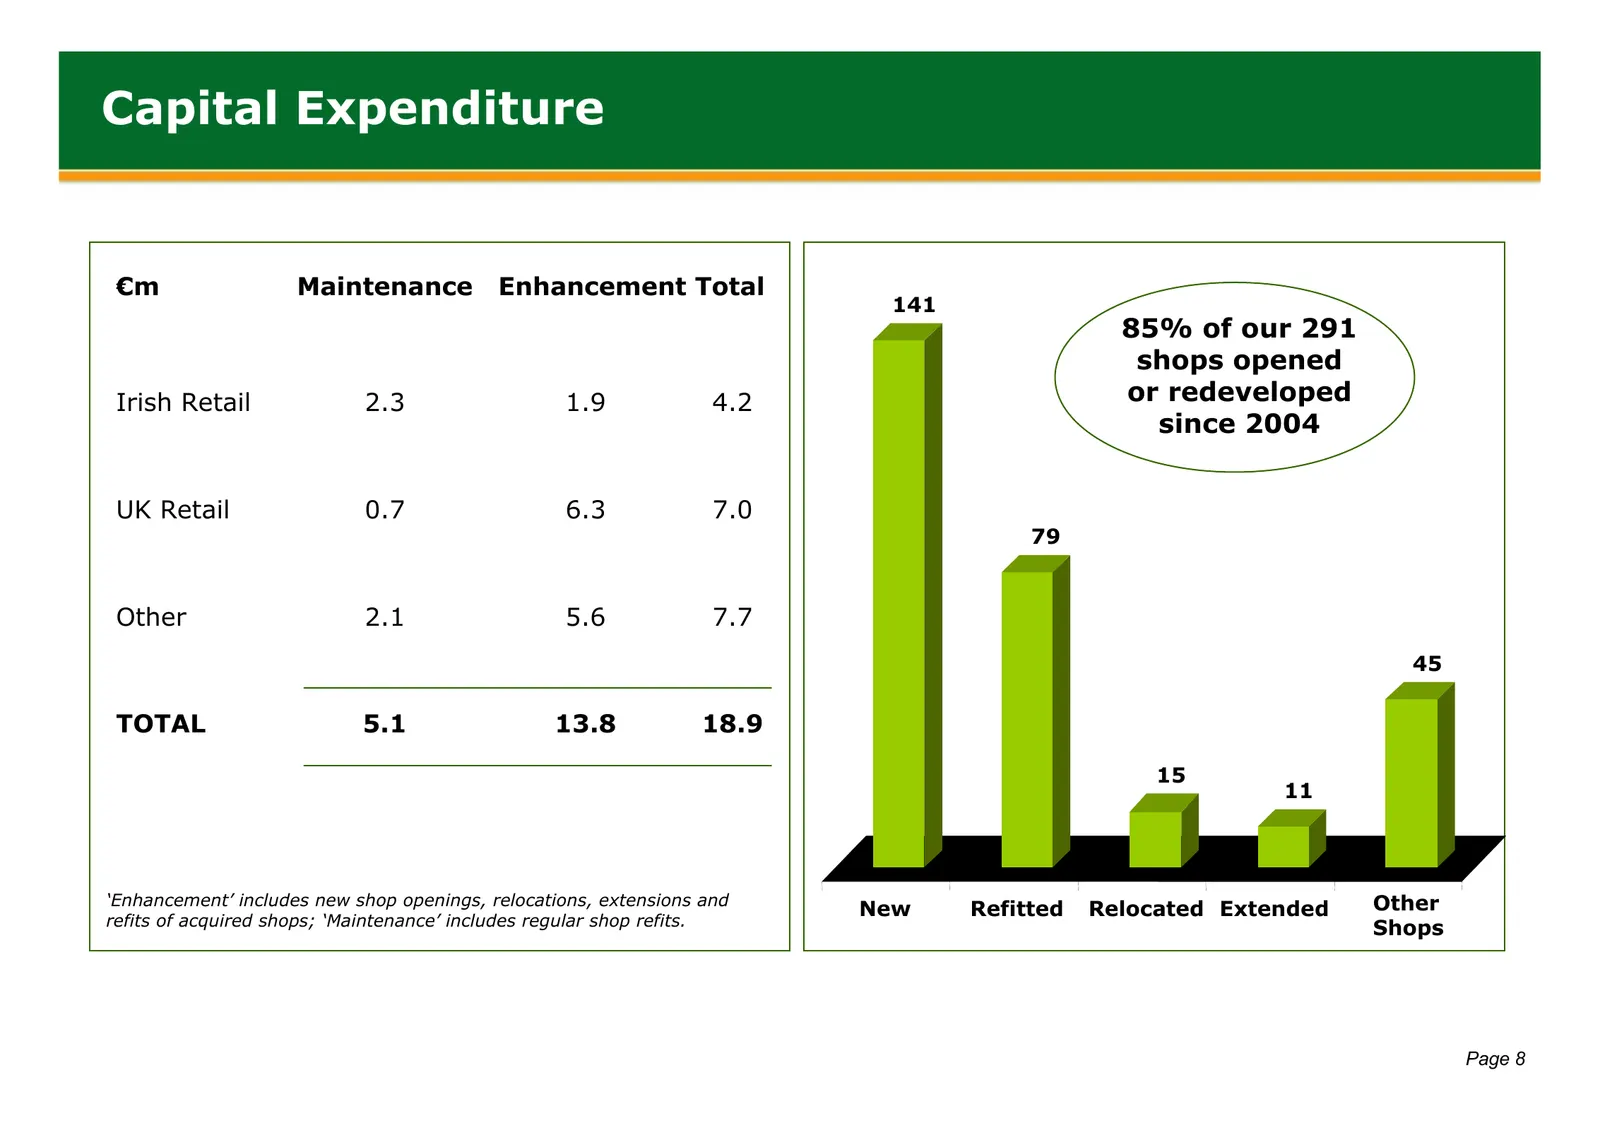
Capital Expenditure €m Maintenance Enhancement Total 141 85% of our 291 shops opened Irish Retail 2.3 1.9 4.2 or redeveloped since 2004 UK Retail 0.7 6.3 7.0 79 Other 2.1 5.6 7.7 45 TOTAL 5.1 13.8 18.9 15 11 ‘Enhancement’ includes new shop openings, relocations, extensions and Other New Refitted Rel
Slide 10: Divisional Review
Divisional Review Introduction Financial Performance Divisional Review Strategy & Outlook Page 9
Slide 11: Gross Win Percentages
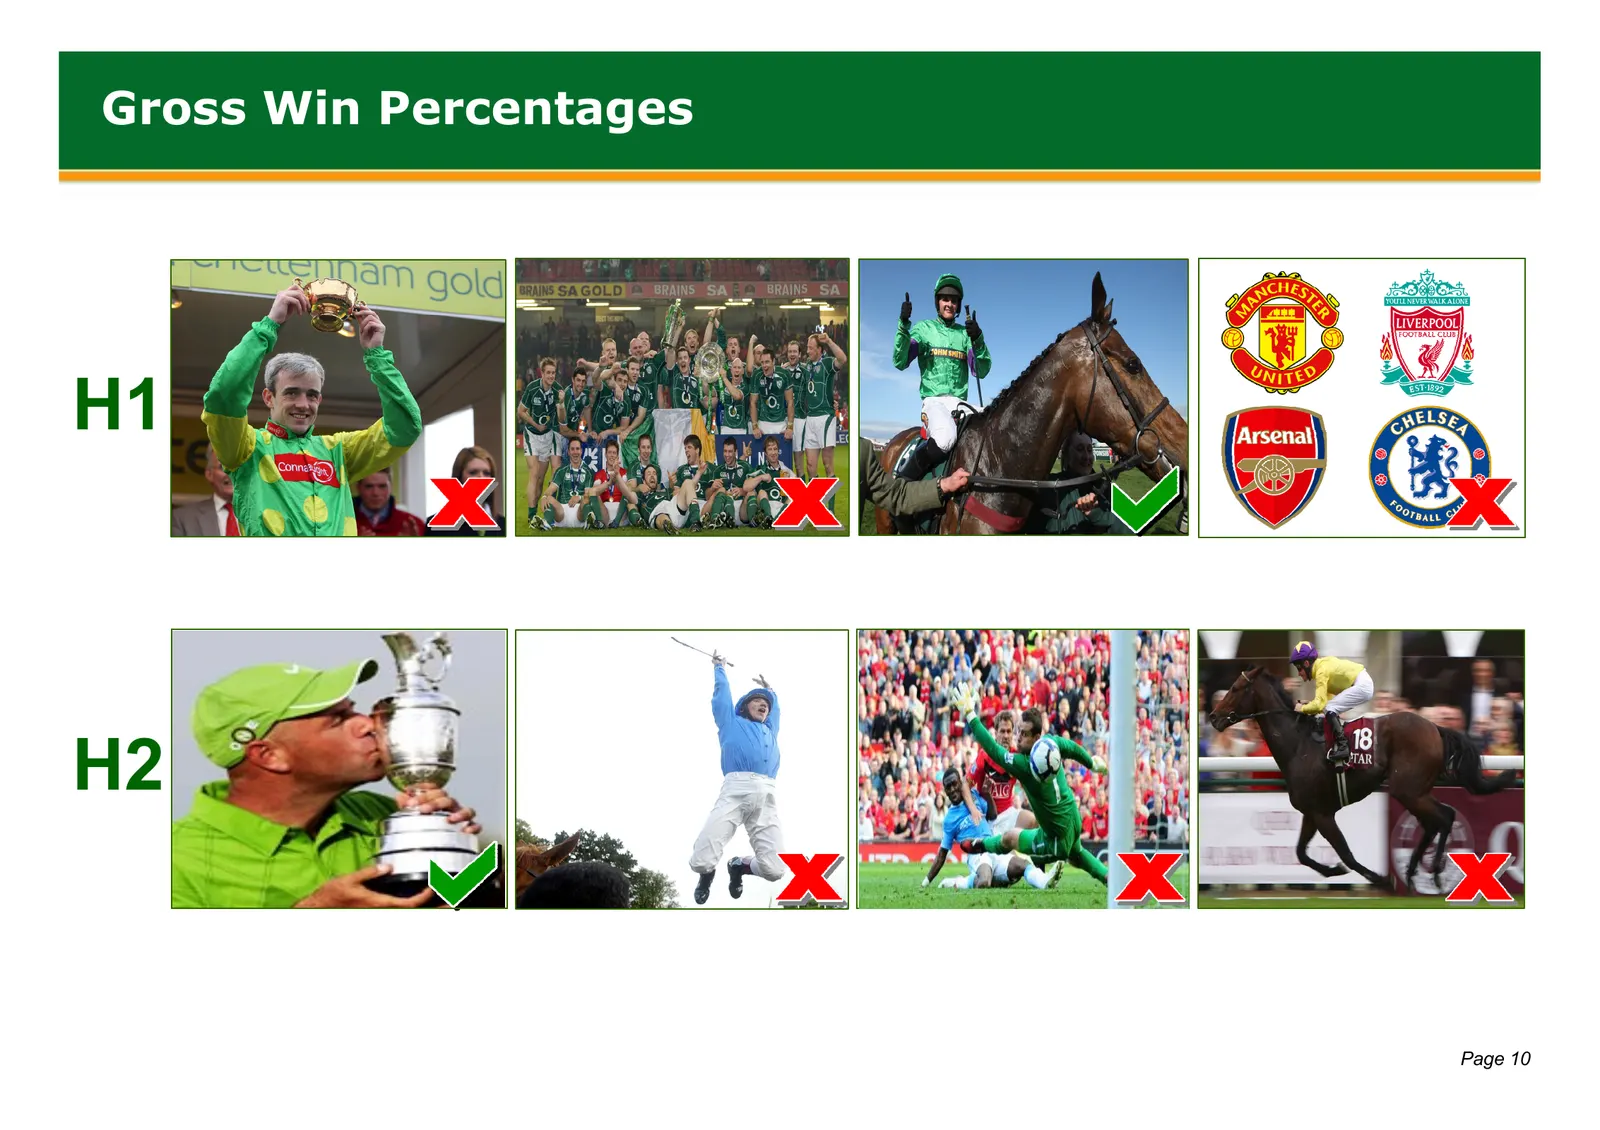
Gross Win Percentages H1 H2 Page 10
Slide 12: Divisional Summary
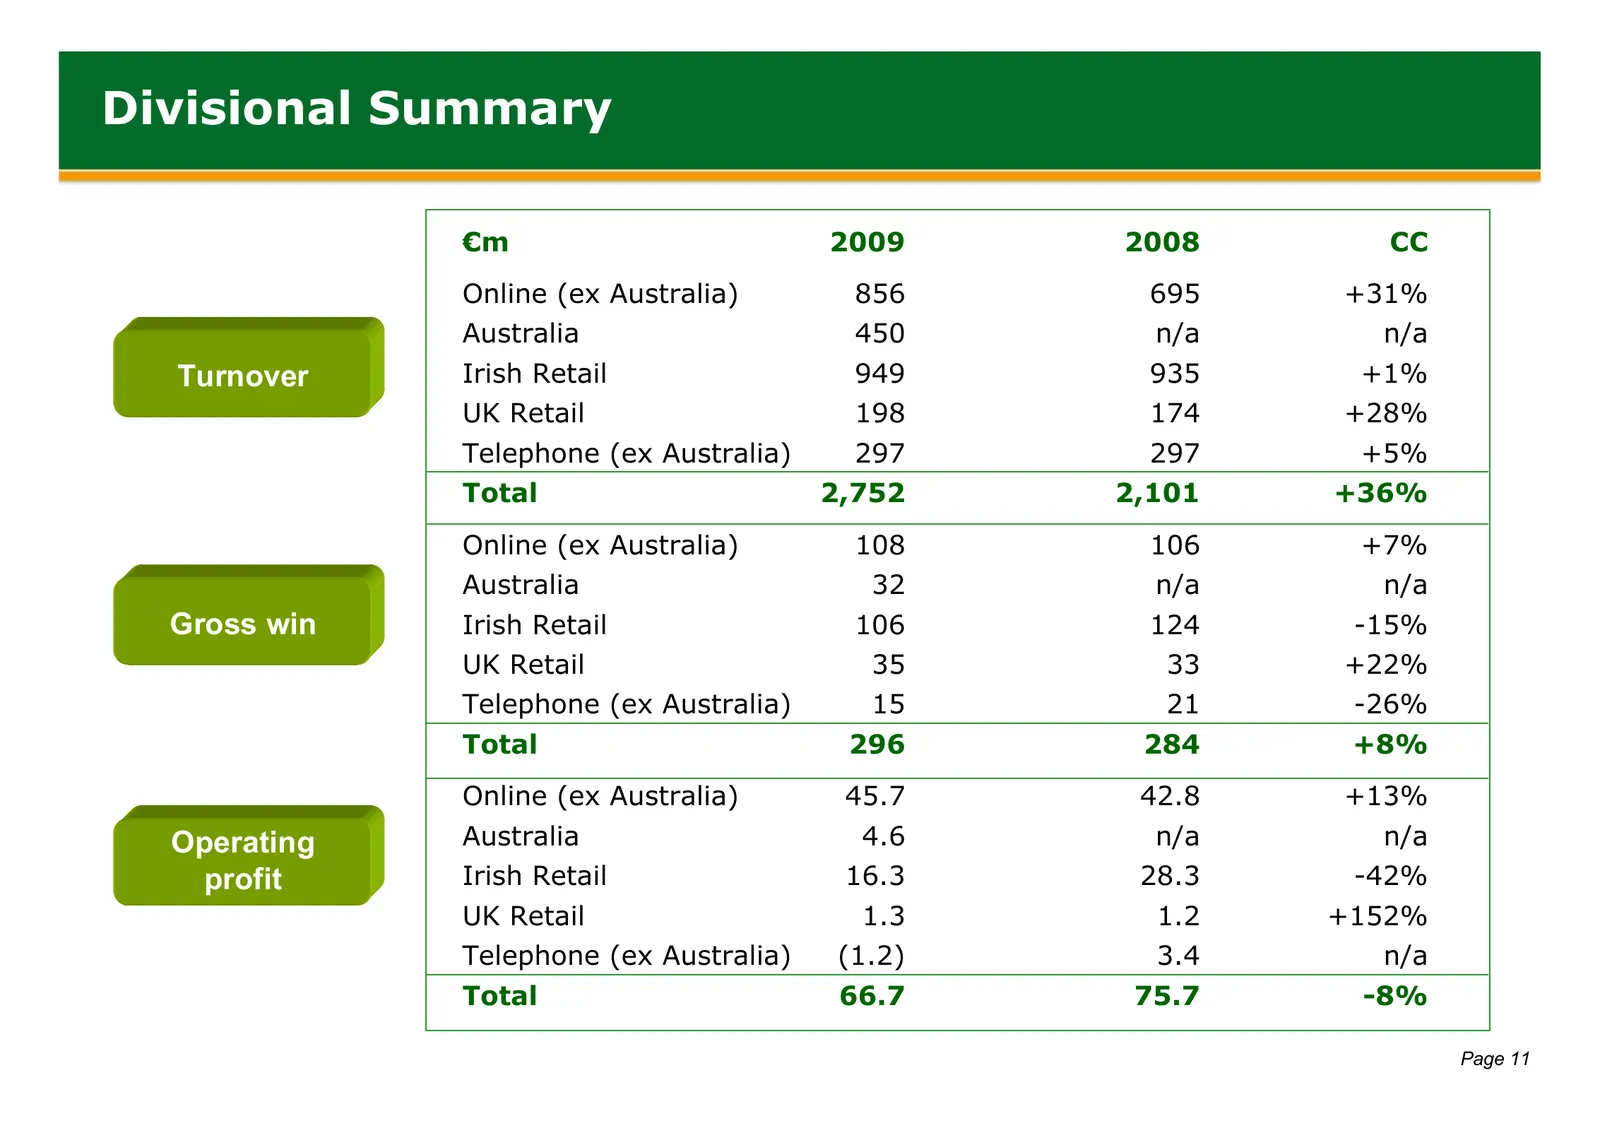
Divisional Summary €m 2009 2008 CC Online (ex Australia) 856 695 +31% Australia 450 n/a n/a Turnover Irish Retail 949 935 +1% UK Retail 198 174 +28% Telephone (ex Australia) 297 297 +5% Total 2,752 2,101 +36% Online (ex Australia) 108 106 +7% Australia 32 n/a n/a Gross win Irish Retail 106 124 -15%
Slide 13: Online (ex Australia)
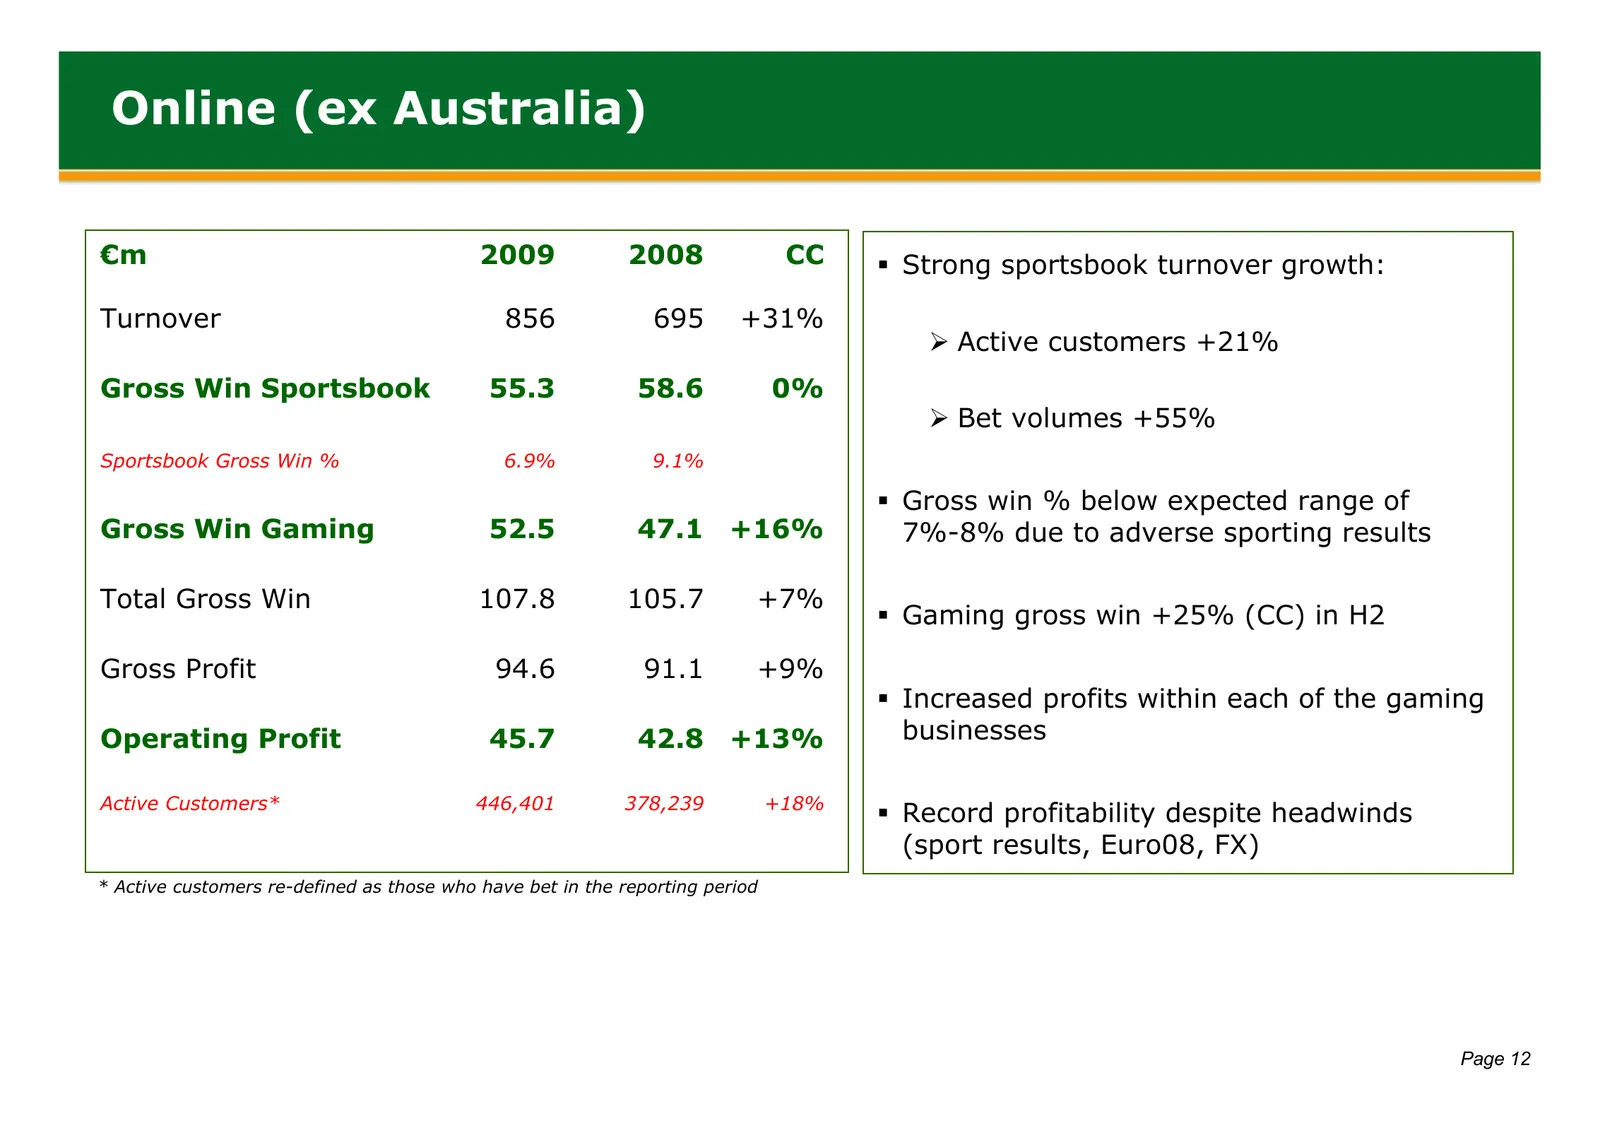
Online (ex Australia) €m 2009 2008 CC Strong sportsbook turnover growth: Turnover 856 695 +31% ¾ Active customers +21% Gross Win Sportsbook 55.3 58.6 0% ¾ Bet volumes +55% Sportsbook Gross Win % 6.9% 9.1% Gross win % below expected range of Gross Win Gaming 52.5 47.1 +16% 7%-8% due to adverse sp
Slide 14: Online Momentum (ex Australia)
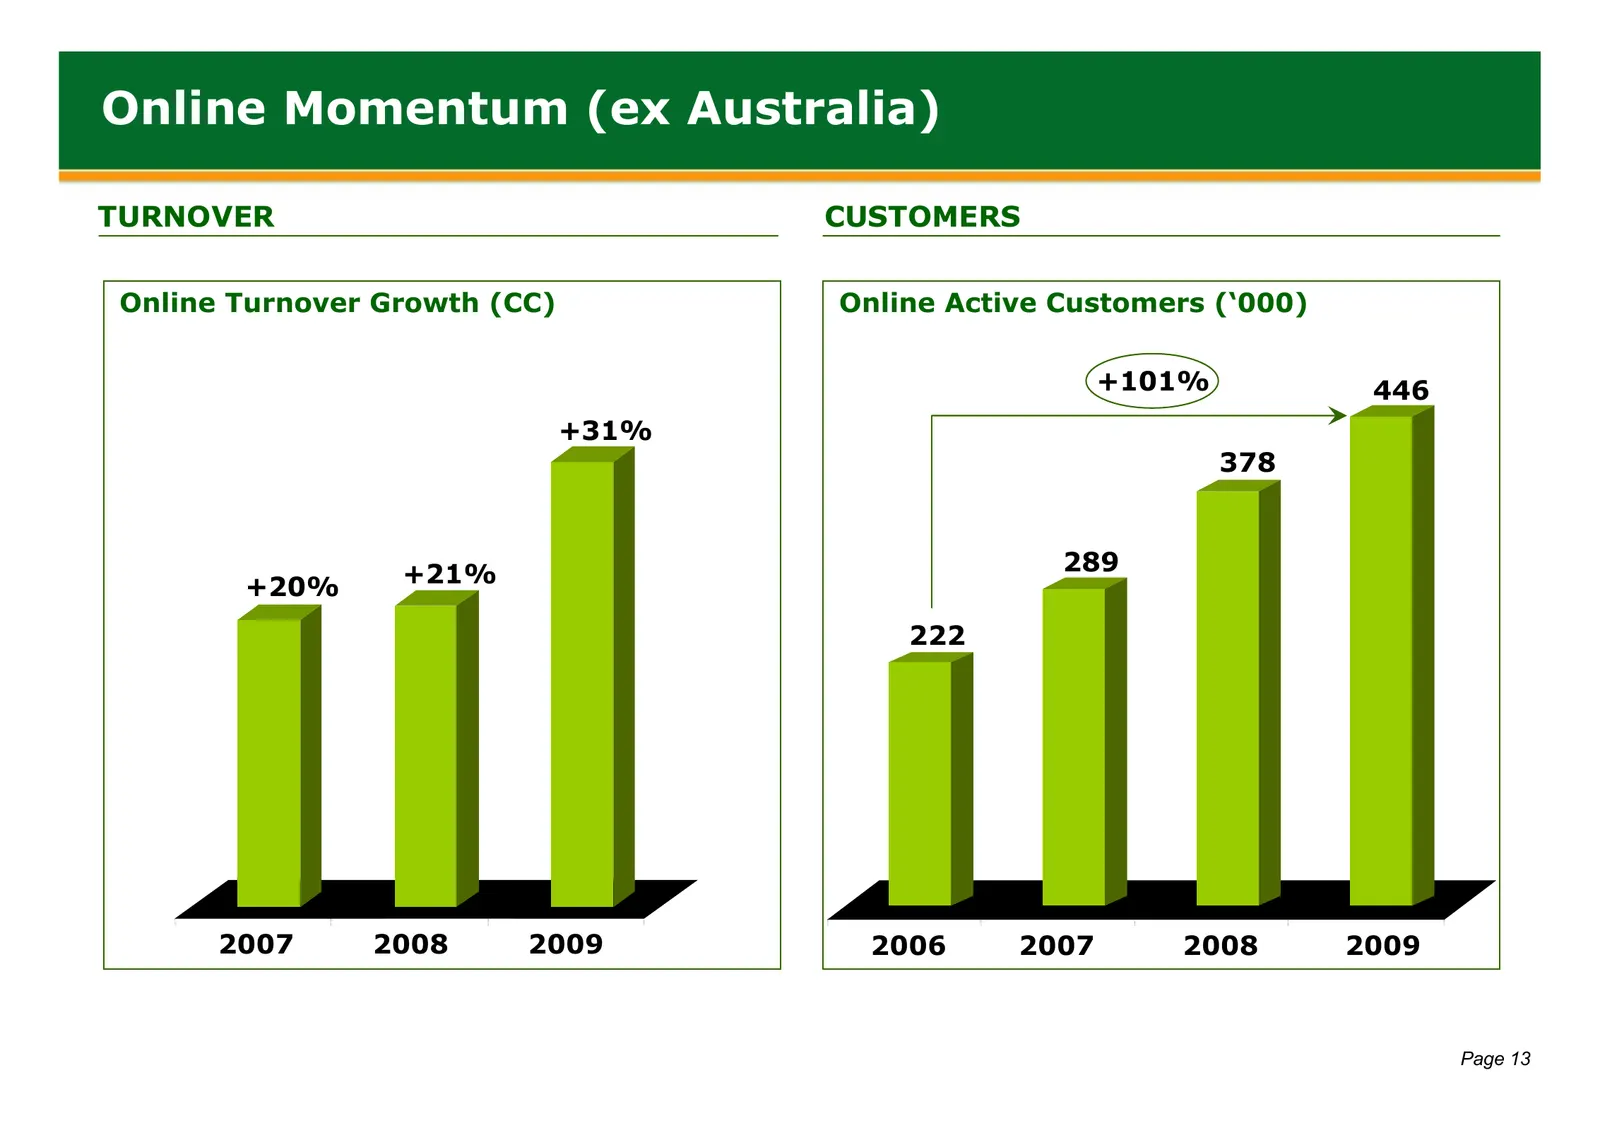
Online Momentum (ex Australia) TURNOVER CUSTOMERS Online Turnover Growth (CC) Online Active Customers (‘000) +101% 446 +31% 378 +21% 289 +20% 222 2007 2008 2009 2006 2007 2008 2009 Page 13
Slide 15: Australia
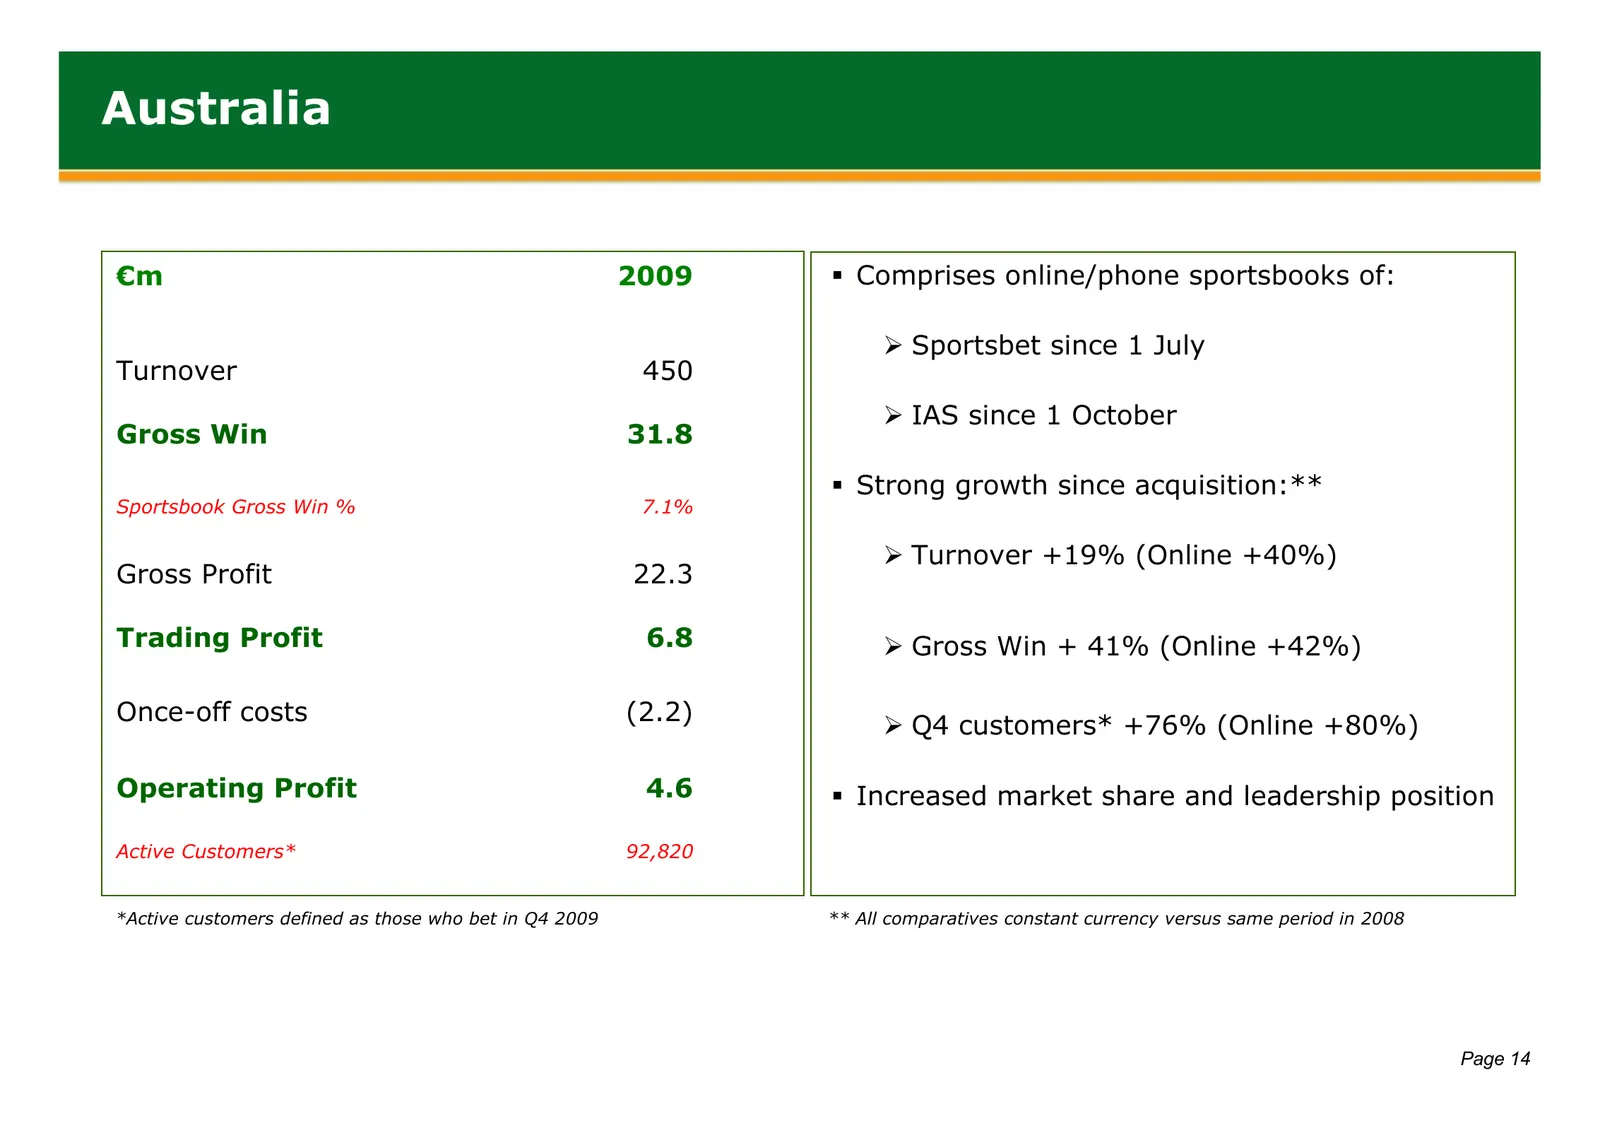
Australia €m 2009 Comprises online/phone sportsbooks of: ¾ Sportsbet since 1 July Turnover 450 ¾ IAS since 1 October Gross Win 31.8 Strong growth since acquisition:** Sportsbook Gross Win % 7.1% ¾ Turnover +19% (Online +40%) Gross Profit 22.3 Trading Profit 6.8 ¾ Gross Win + 41% (Online +42%) On
Slide 16: Australia Developments Since Acquisition
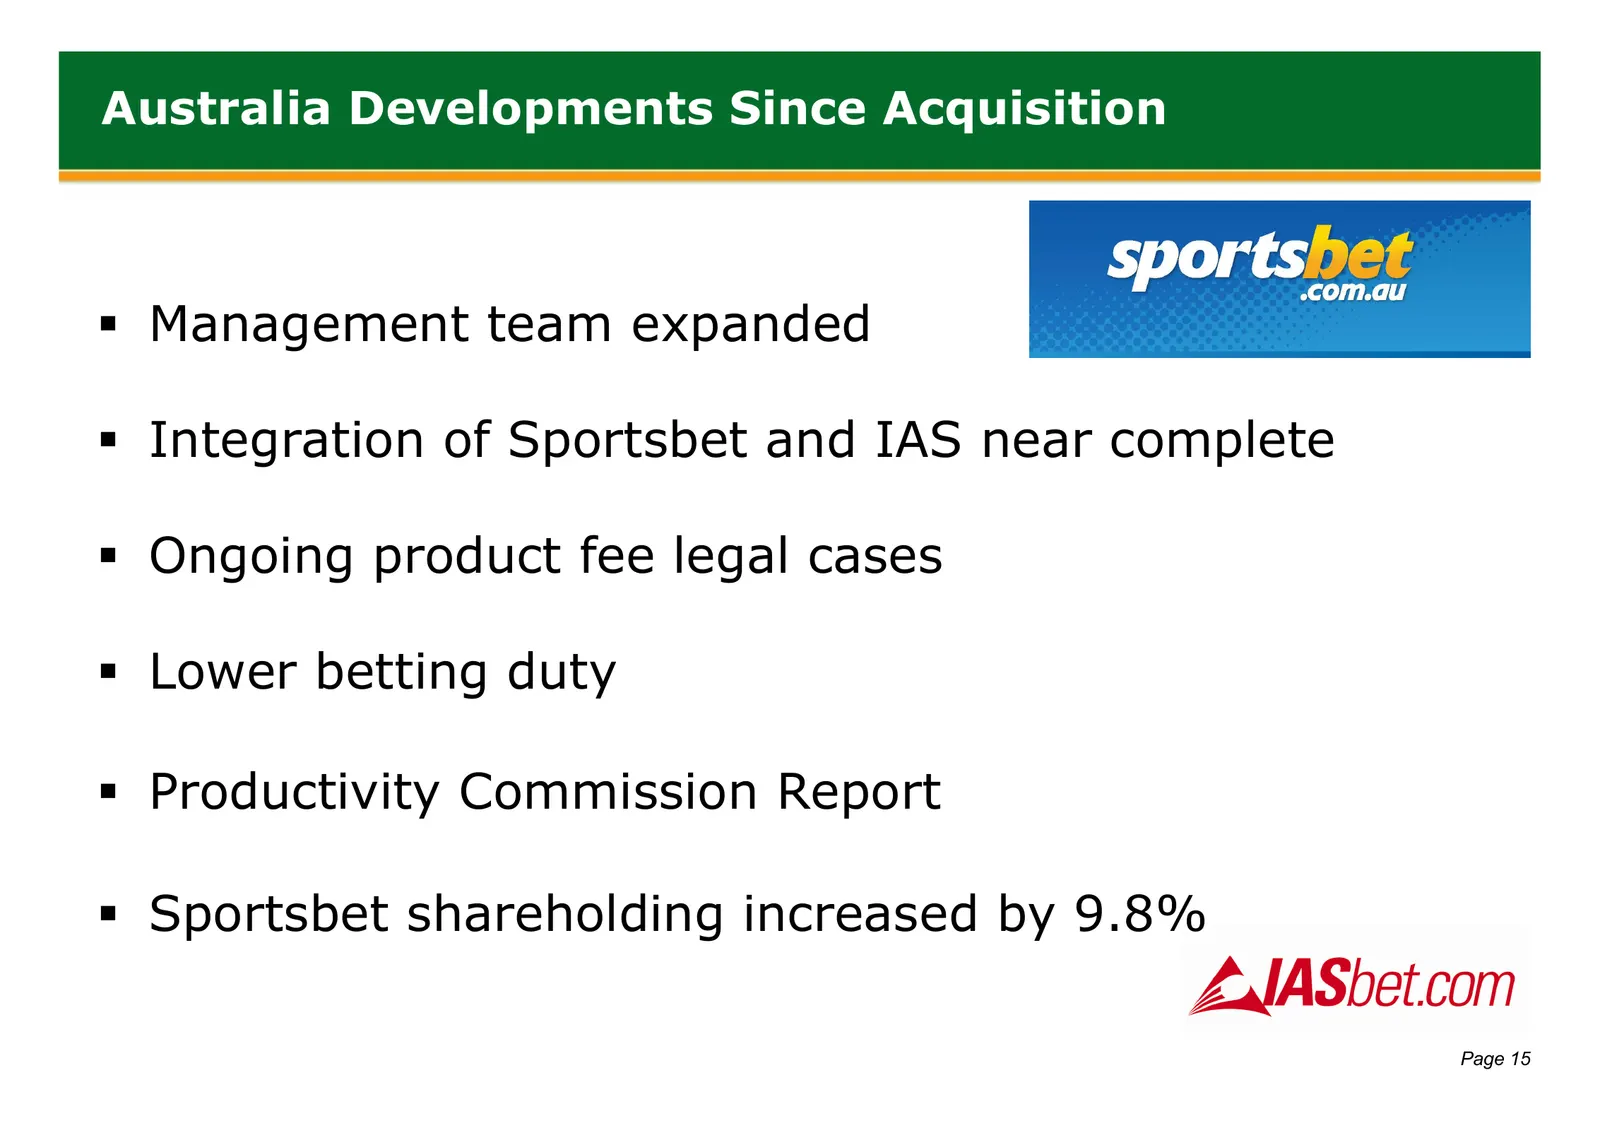
Australia Developments Since Acquisition Management team expanded Integration of Sportsbet and IAS near complete Ongoing product fee legal cases Lower betting duty Productivity Commission Report Sportsbet shareholding increased by 9.8% Page 15
Slide 17: New Business Unit: B2B
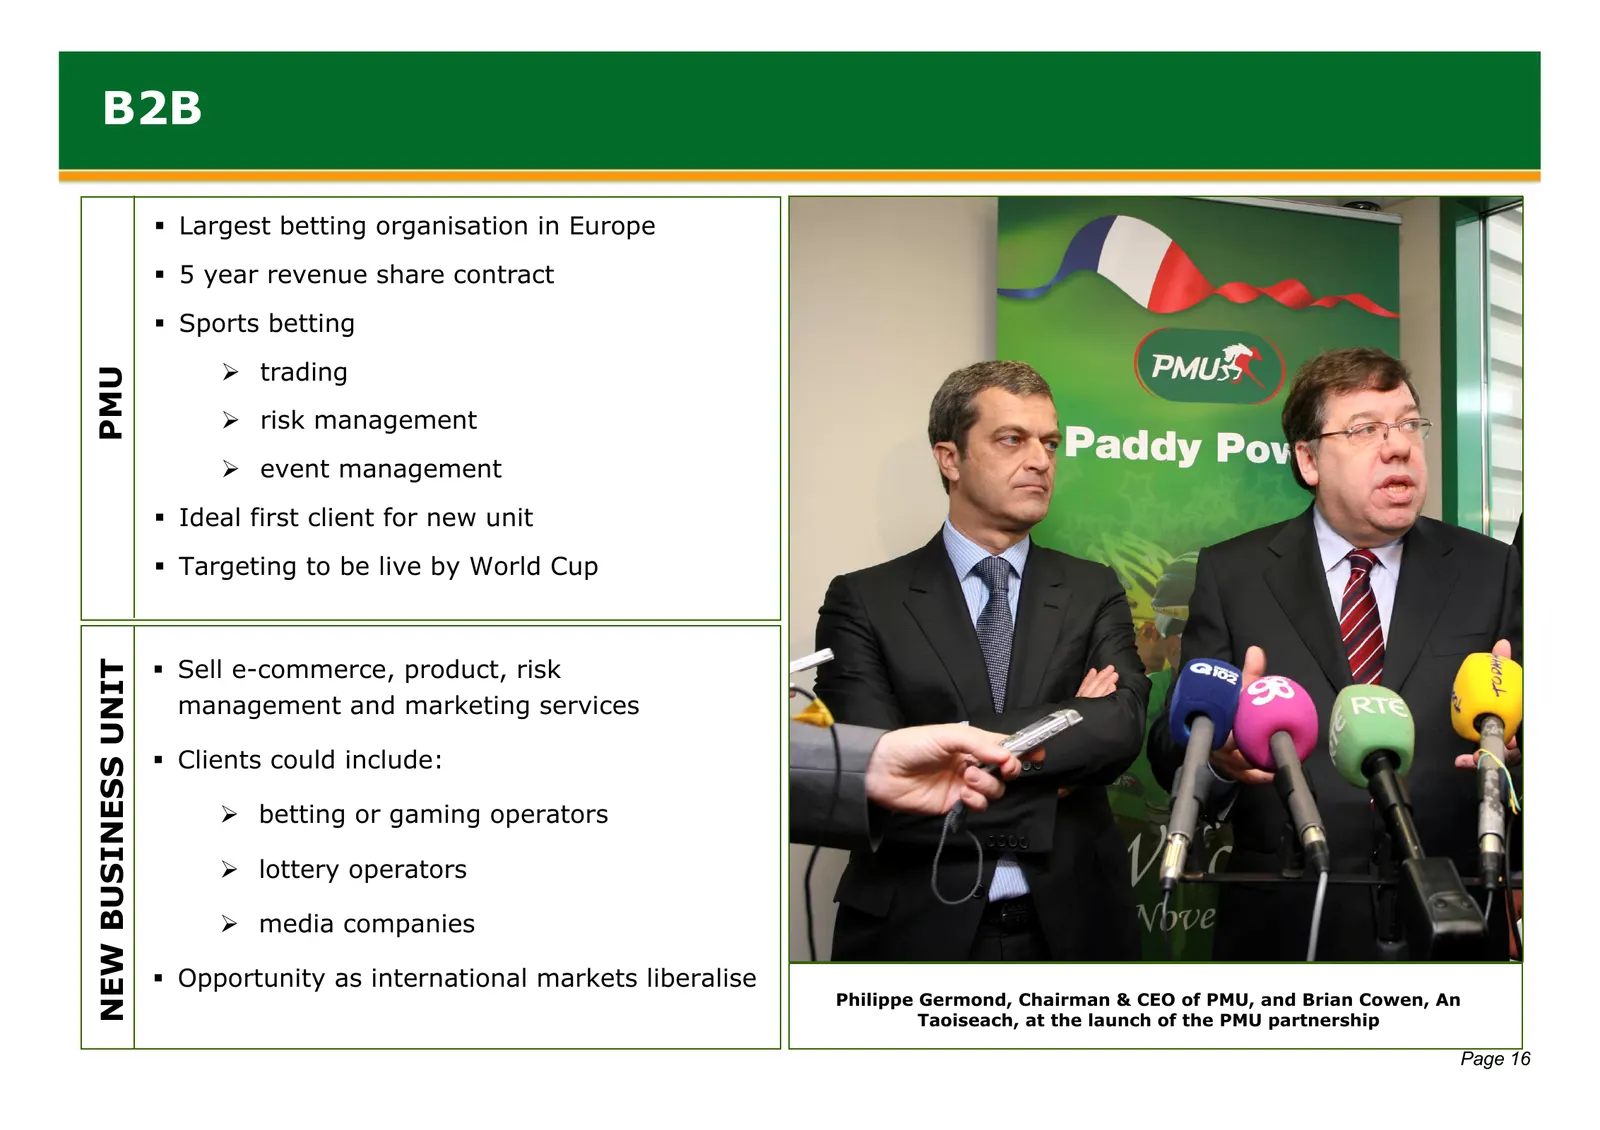
B2B Largest betting organisation in Europe 5 year revenue share contract Sports betting ¾ trading PMU ¾ risk management ¾ event management Ideal first client for new unit Targeting to be live by World Cup Sell e-commerce, product, risk NEW BUSINESS UNIT management and marketing services
Slide 18: Irish Retail
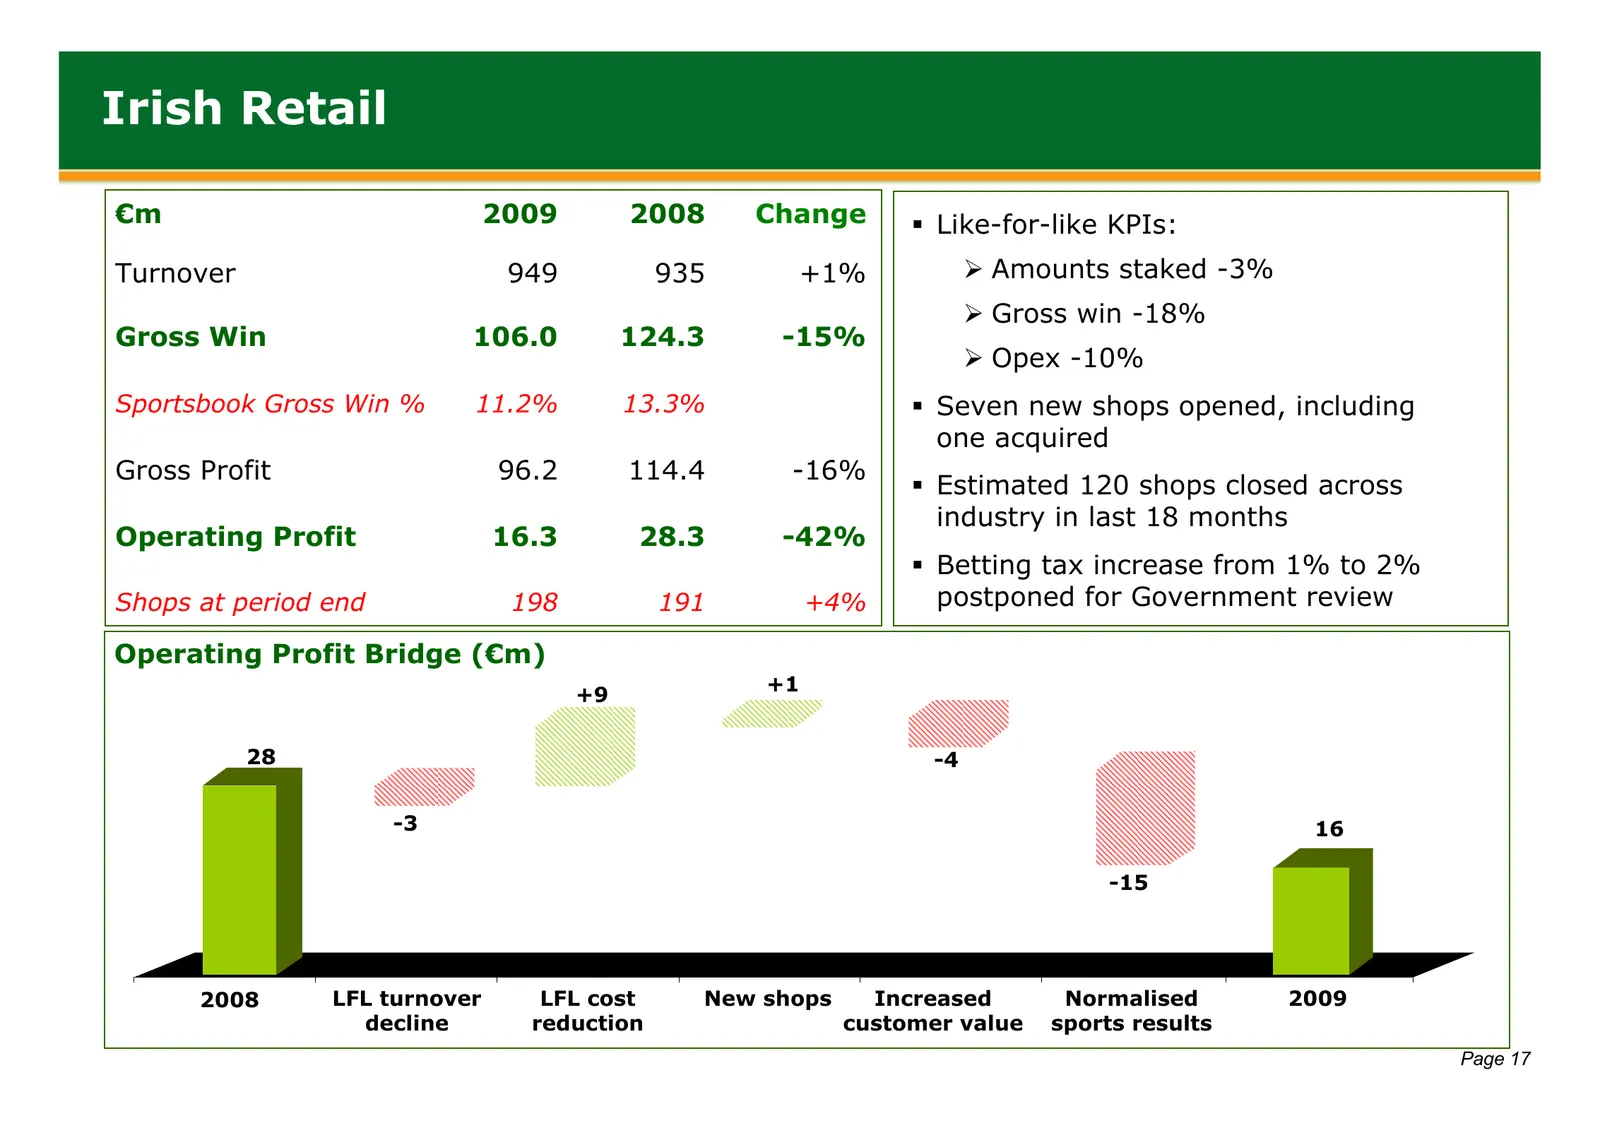
Irish Retail €m 2009 2008 Change Like-for-like KPIs: Turnover 949 935 +1% ¾ Amounts staked -3% ¾ Gross win -18% Gross Win 106.0 124.3 -15% ¾ Opex -10% Sportsbook Gross Win % 11.2% 13.3% Seven new shops opened, including one acquired Gross Profit 96.2 114.4 -16% Estimated 120 shops closed acros
Slide 19: Irish Retail
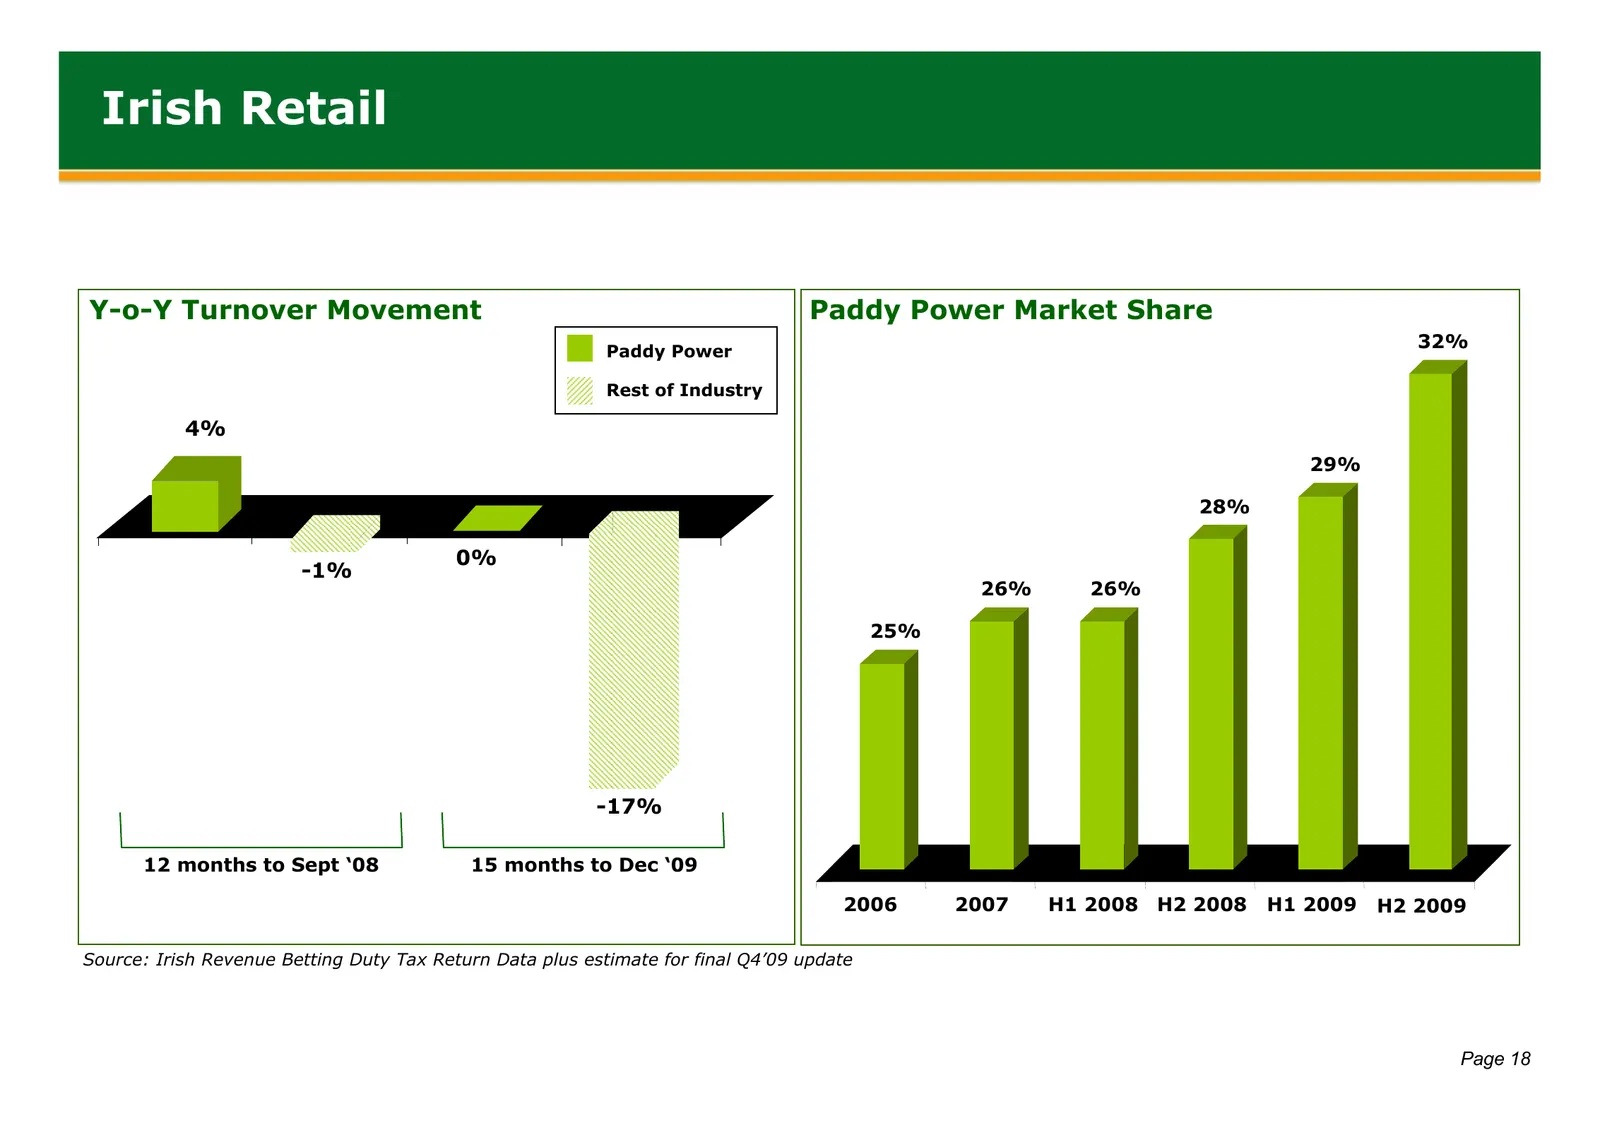
Irish Retail Y-o-Y Turnover Movement Paddy Power Market Share Paddy Power 32% Rest of Industry 4% 29% 28% 0% -1% 26% 26% 25% -17% 12 months to Sept ‘08 15 months to Dec ‘09 2006 2007 H1 2008 H2 2008 H1 2009 H2 2009 Source: Irish Revenue Betting Duty Tax Return Data plus estimate for final Q4’09 upda
Slide 20: UK Retail
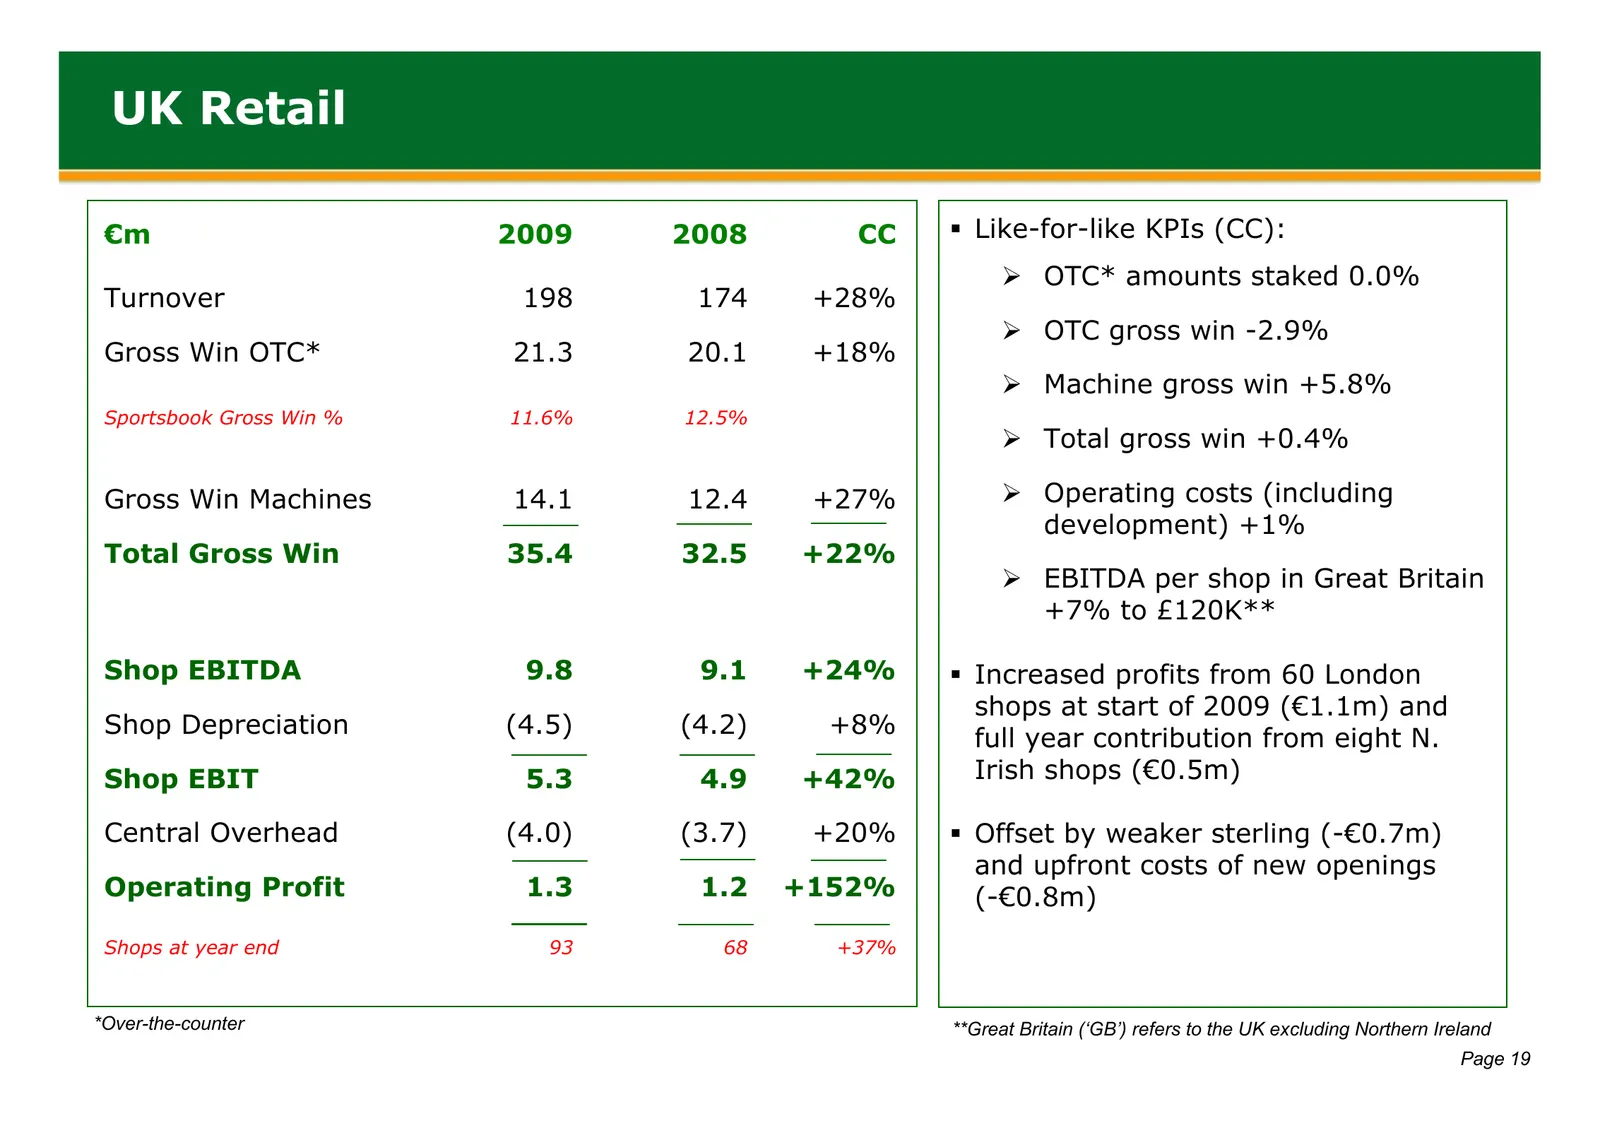
UK Retail €m 2009 2008 CC Like-for-like KPIs (CC): ¾ OTC* amounts staked 0.0% Turnover 198 174 +28% ¾ OTC gross win -2.9% Gross Win OTC* 21.3 20.1 +18% ¾ Machine gross win +5.8% Sportsbook Gross Win % 11.6% 12.5% ¾ Total gross win +0.4% Gross Win Machines 14.1 12.4 +27% ¾ Operating costs (includin
Slide 21: UK Retail Estate
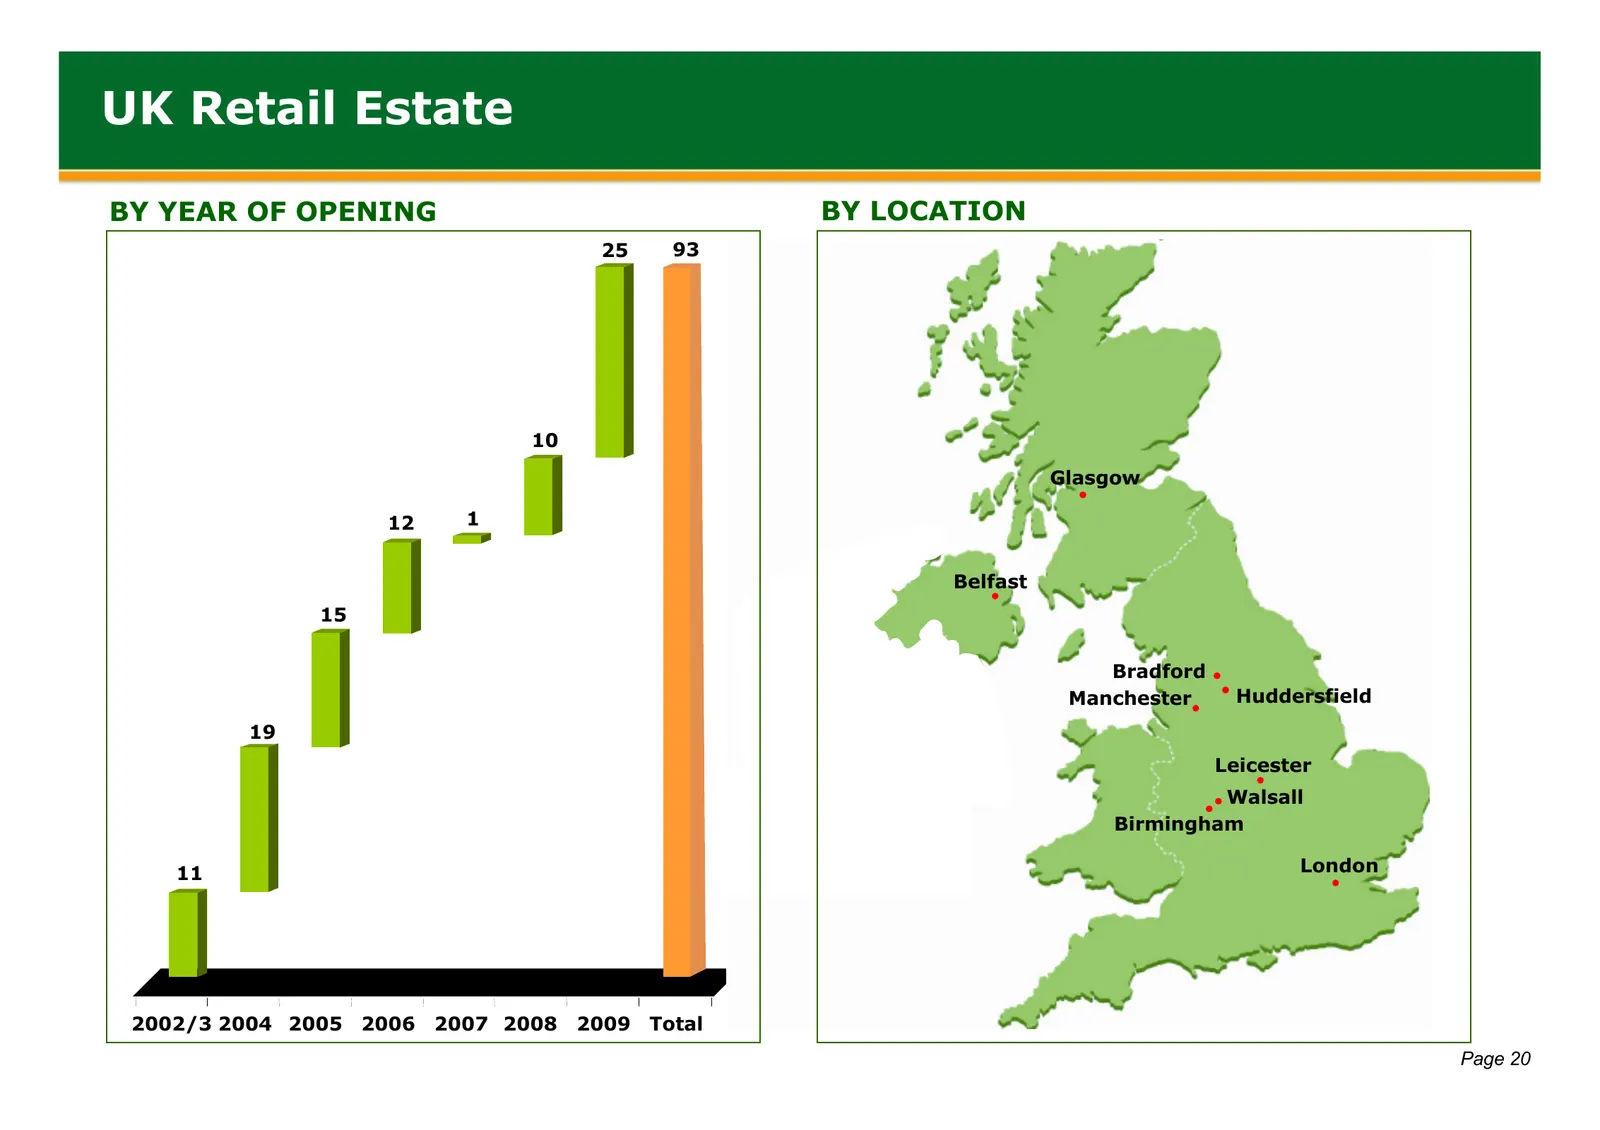
UK Retail Estate BY YEAR OF OPENING BY LOCATION 25 93 10 Glasgow 12 1 Belfast 15 Bradford Manchester Huddersfield 19 Leicester Walsall Birmingham 11 London 2002/3 2004 2005 2006 2007 2008 2009 Total Page 20
Slide 22: GB Retail: Return on Capital
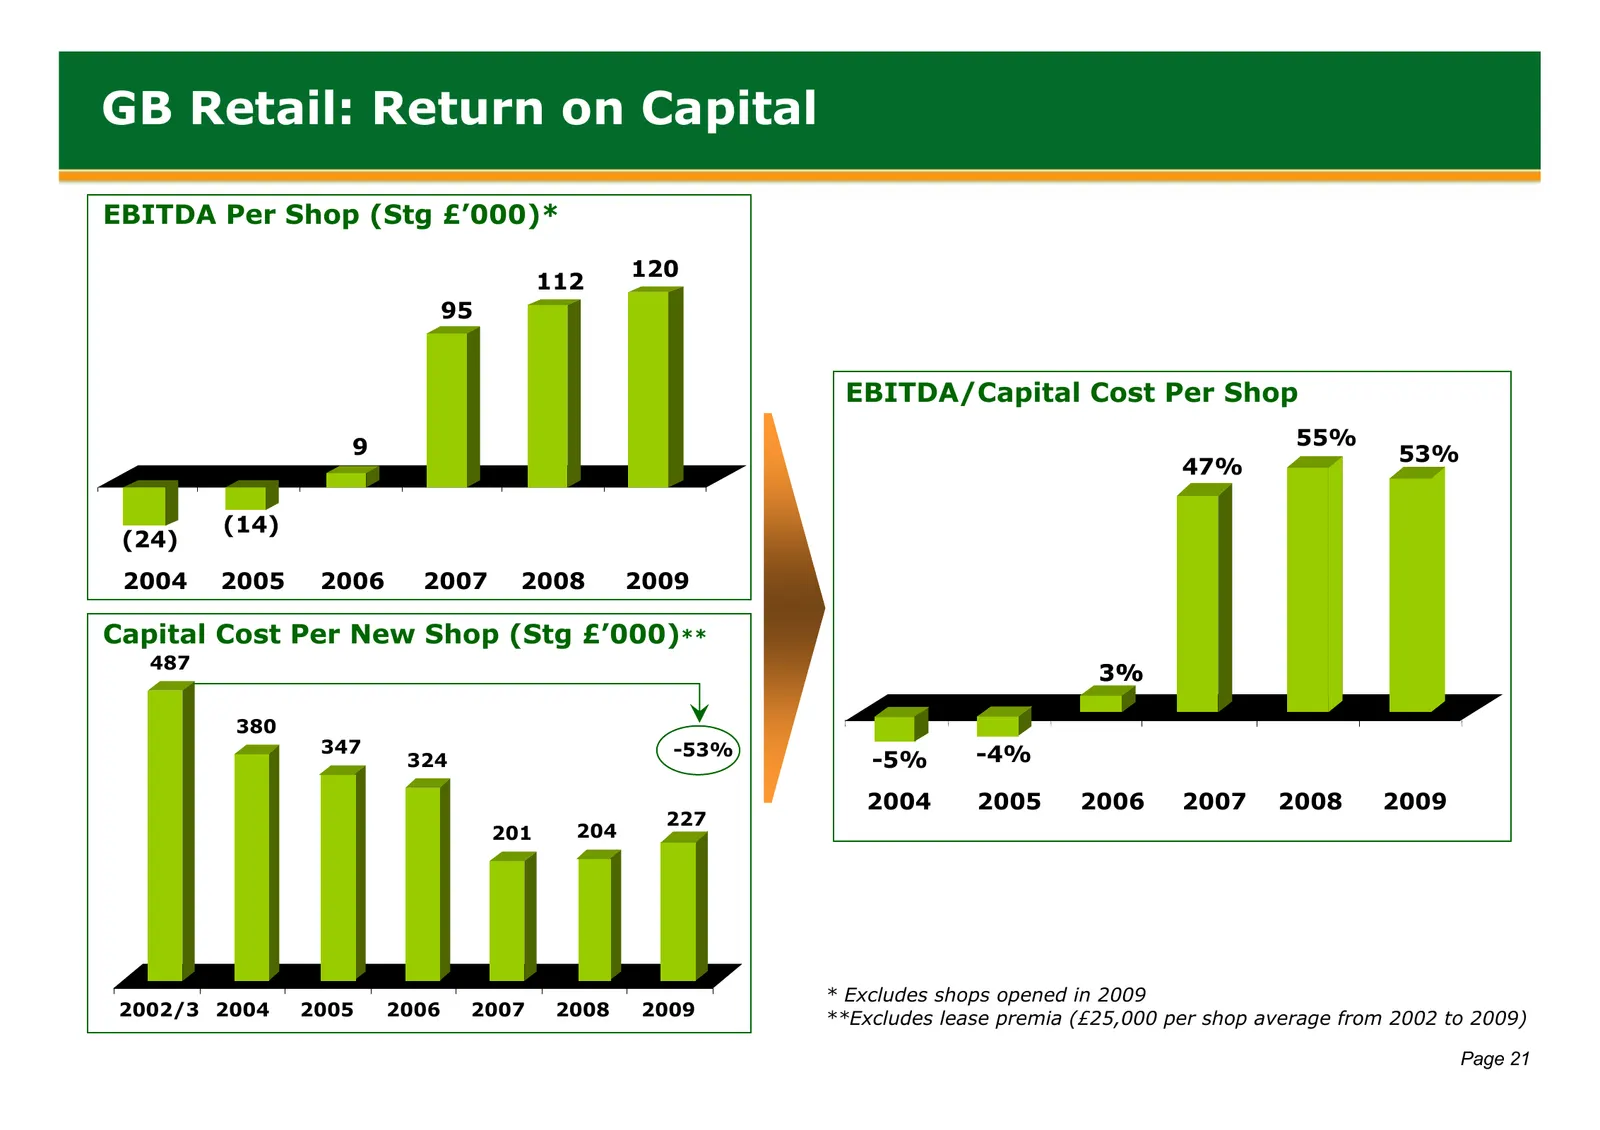
GB Retail: Return on Capital EBITDA Per Shop (Stg £’000)* 120 112 95 EBITDA/Capital Cost Per Shop 9 55% 53% 47% (14) (24) 2004 2005 2006 2007 2008 2009 Capital Cost Per New Shop (Stg £’000)** 487 3% 380 347 -53% -4% 324 -5% 2004 2005 2006 2007 2008 2009 227 201 204 * Excludes shops opened in 2009 20
Slide 23: Telephone (ex Australia)
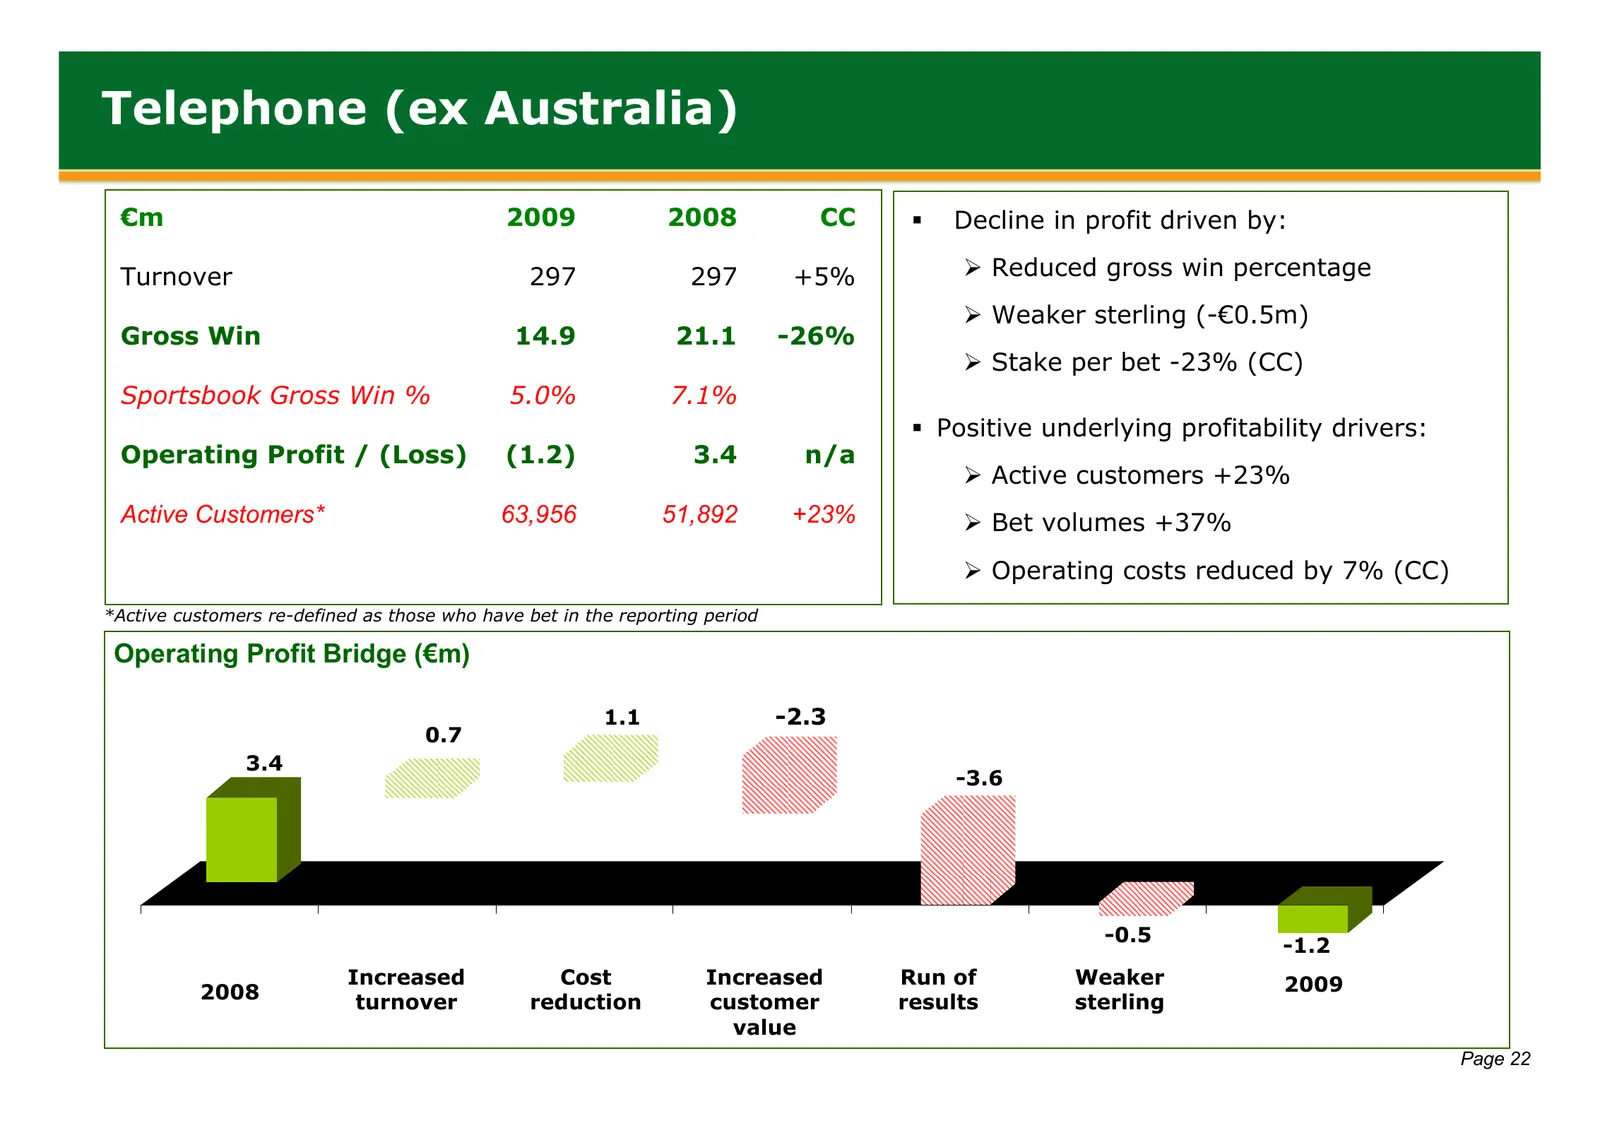
Telephone (ex Australia) €m 2009 2008 CC Decline in profit driven by: Turnover 297 297 +5% ¾ Reduced gross win percentage ¾ Weaker sterling (-€0.5m) Gross Win 14.9 21.1 -26% ¾ Stake per bet -23% (CC) Sportsbook Gross Win % 5.0% 7.1% Positive underlying profitability drivers: Operating Profit / (
Slide 24: Strategy & Outlook
Strategy & Outlook Introduction Financial Performance Divisional Review Strategy & Outlook Page 23
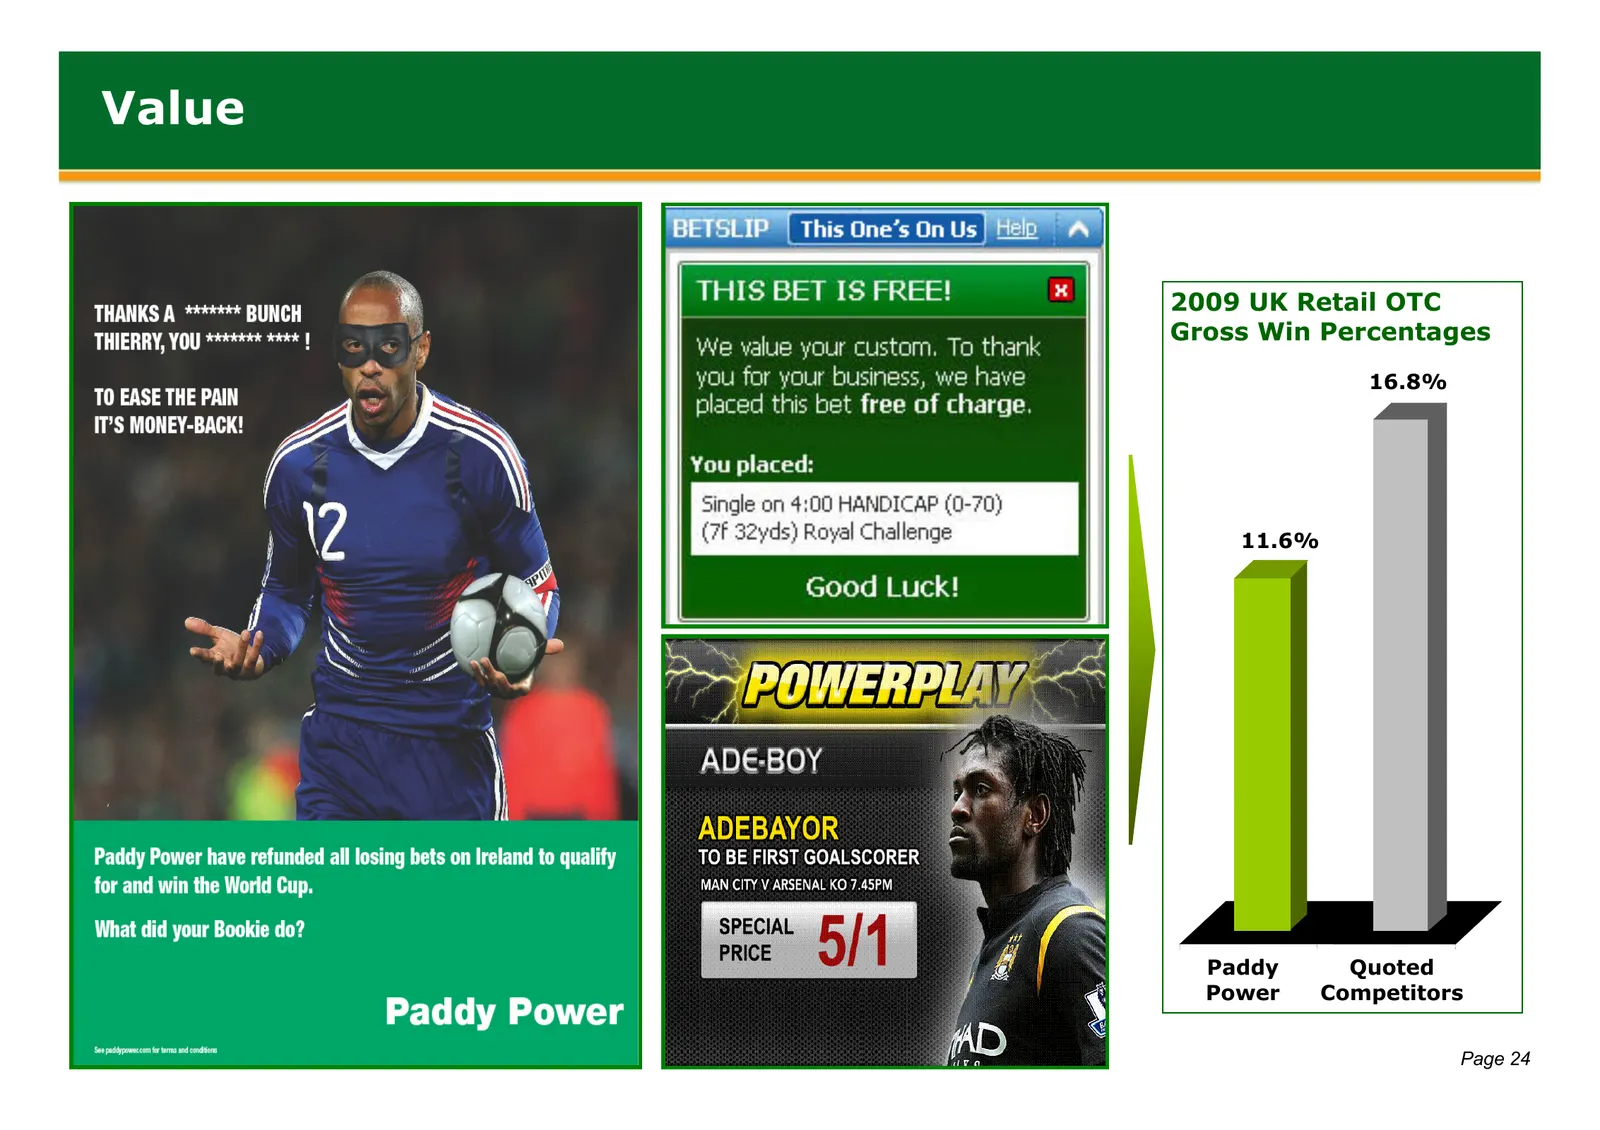
Slide 25: Value
Value 2009 UK Retail OTC Gross Win Percentages 16.8% 11.6% Paddy Quoted Power Competitors Page 24
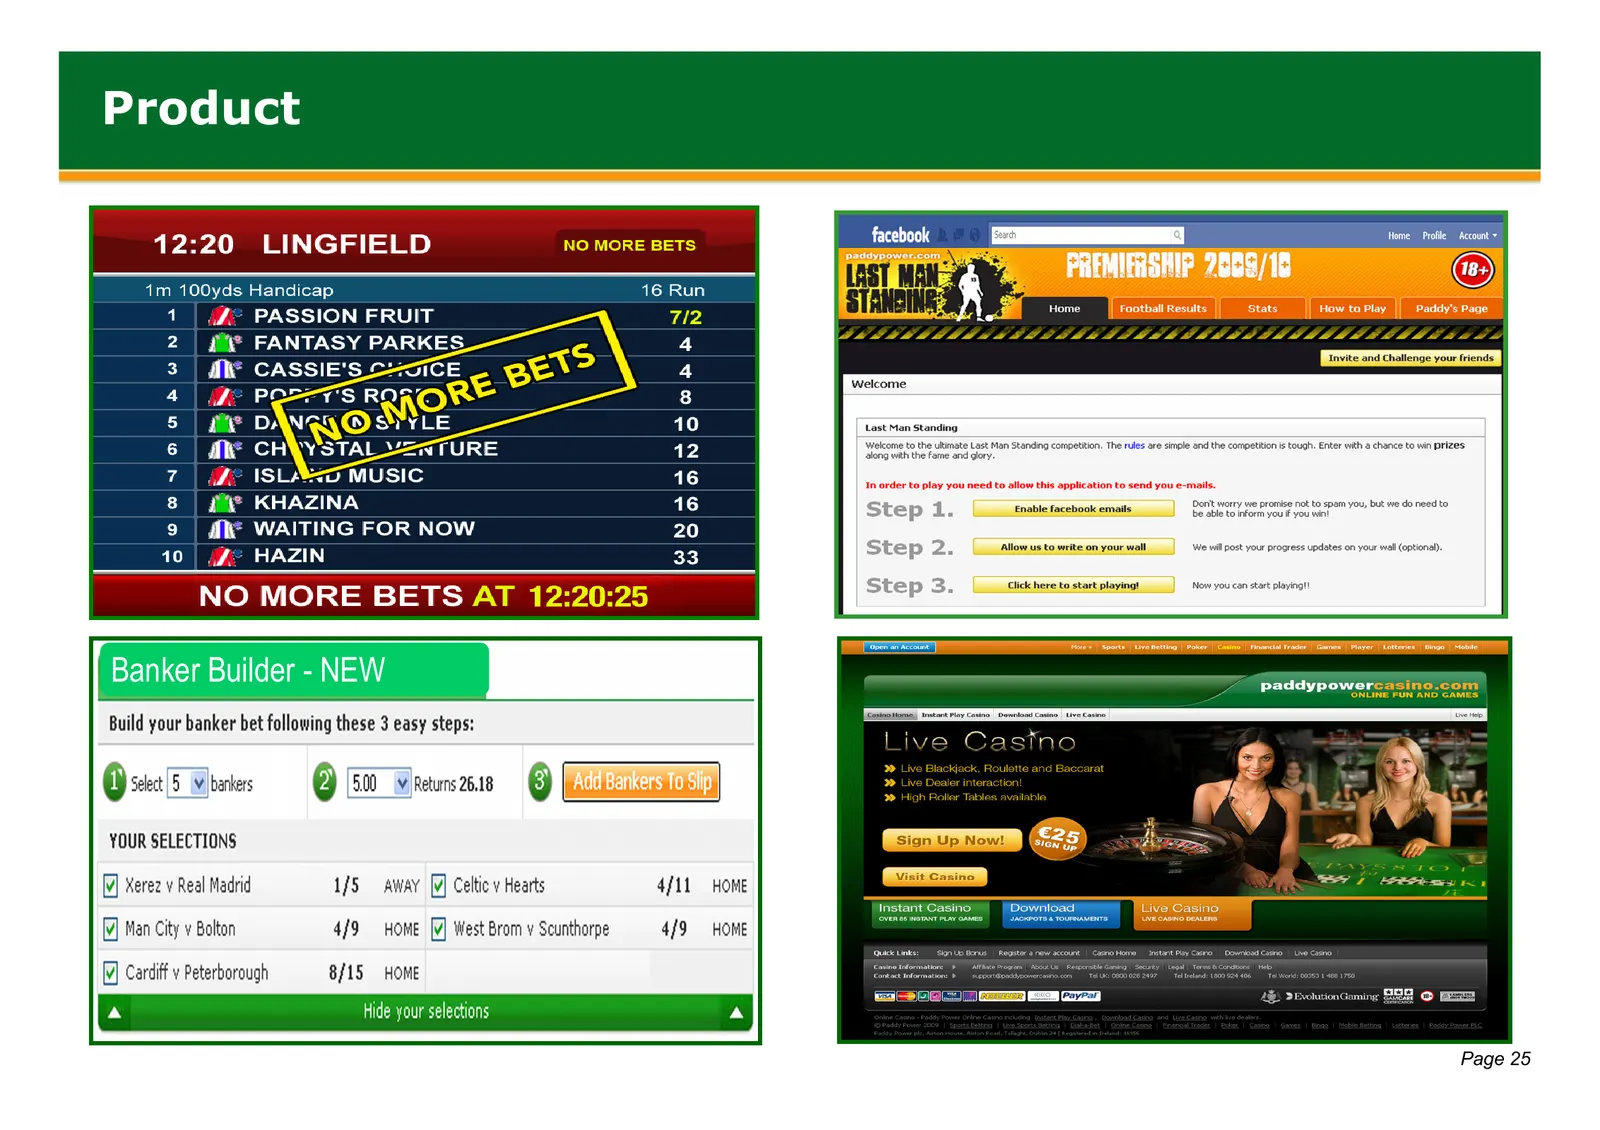
Slide 26: Product
Product Banker Builder - NEW Page 25

Slide 27: Brand
\ y Who'll tickle 7) tigers fancy — for festive <*; i frofics? ee —— r Michelle? ; = LS —_ ! 1S == 2000/ *) INDEPENDENT Pil FINANCIAL TIMES The Washington Post Los Angeles Times P gemmaks ae paddypower.com a THE SCOTSMAN Daily ec Mail
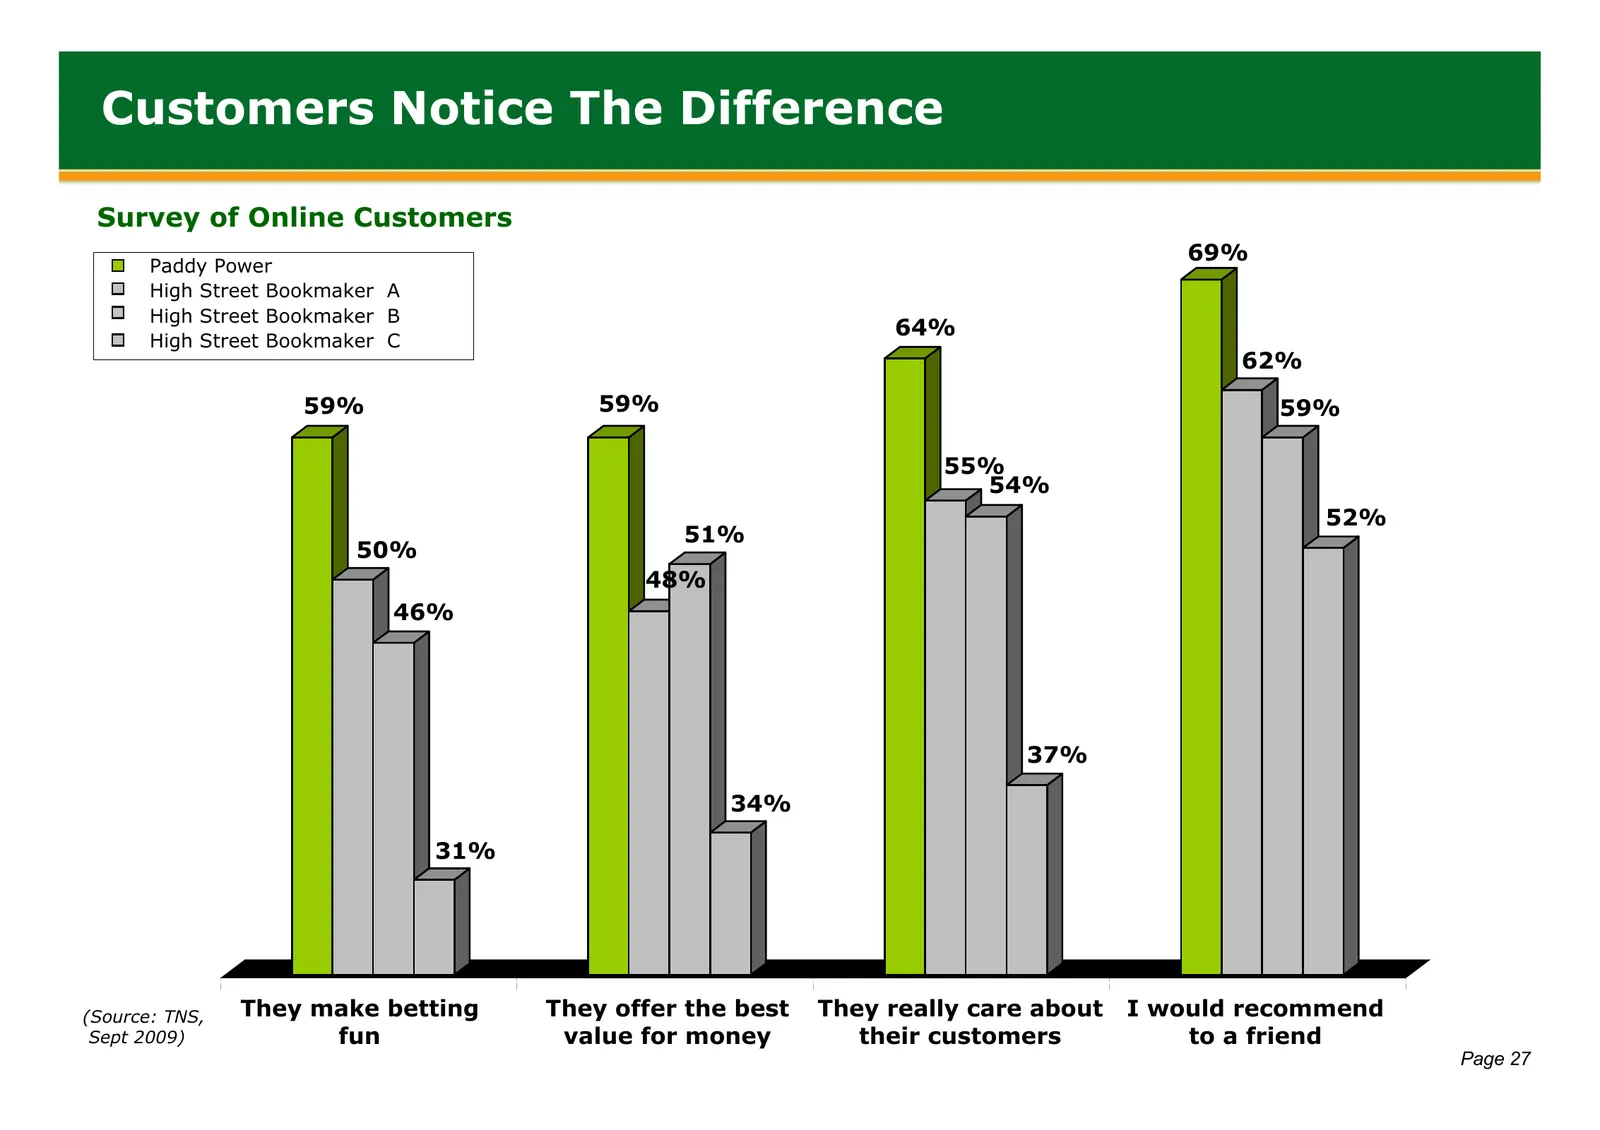
Slide 28: Customers Notice The Difference
Customers Notice The Difference Survey of Online Customers 69% Paddy Power High Street Bookmaker A High Street Bookmaker B 64% High Street Bookmaker C 62% 59% 59% 59% 55% 54% 52% 51% 50% 48% 46% 37% 34% 31% (Source: TNS, They make betting They offer the best They really care about I would recommend
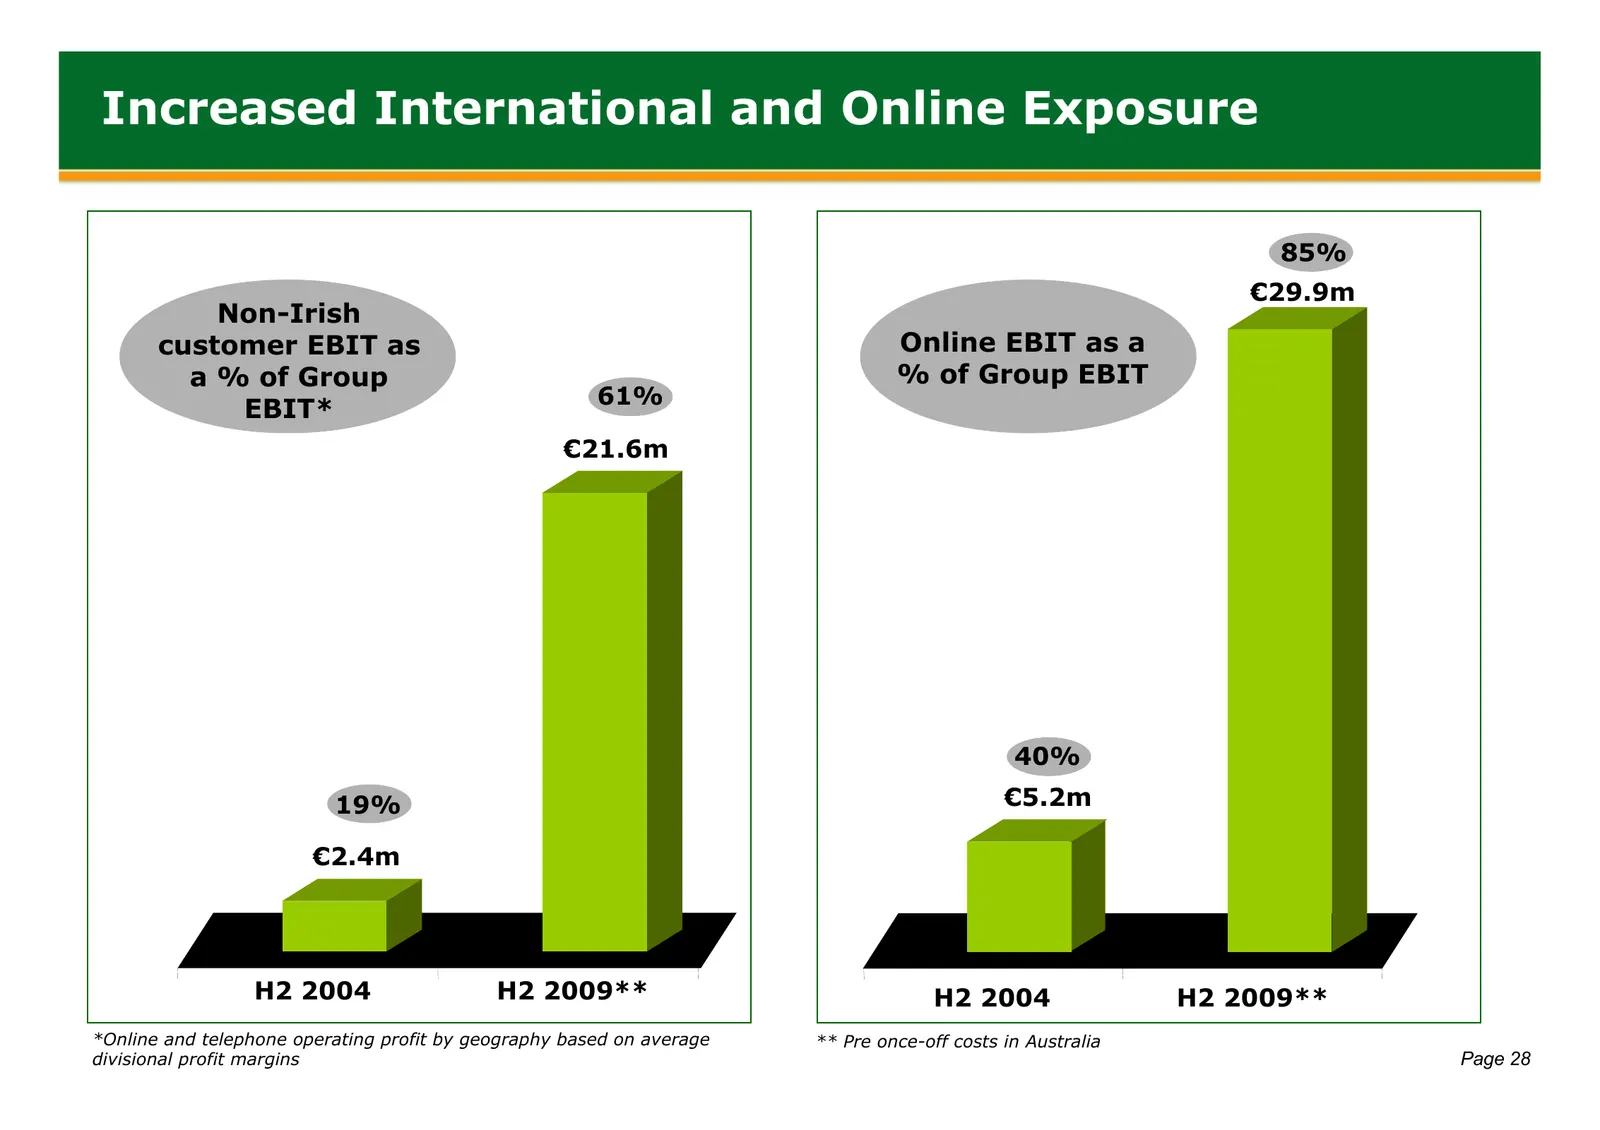
Slide 29: Increased International and Online Exposure
Increased International and Online Exposure 85% €29.9m p Non-Irish customer EBIT as Online EBIT as a a % of Group % of Group EBIT 61% EBIT* €21.6m 40% 19% €5.2m €2.4m H2 2004 H2 2009** H2 2004 H2 2009** *Online and telephone operating profit by geography based on average ** Pre once-off costs in Aus
Slide 30: Outlook & Opportunities
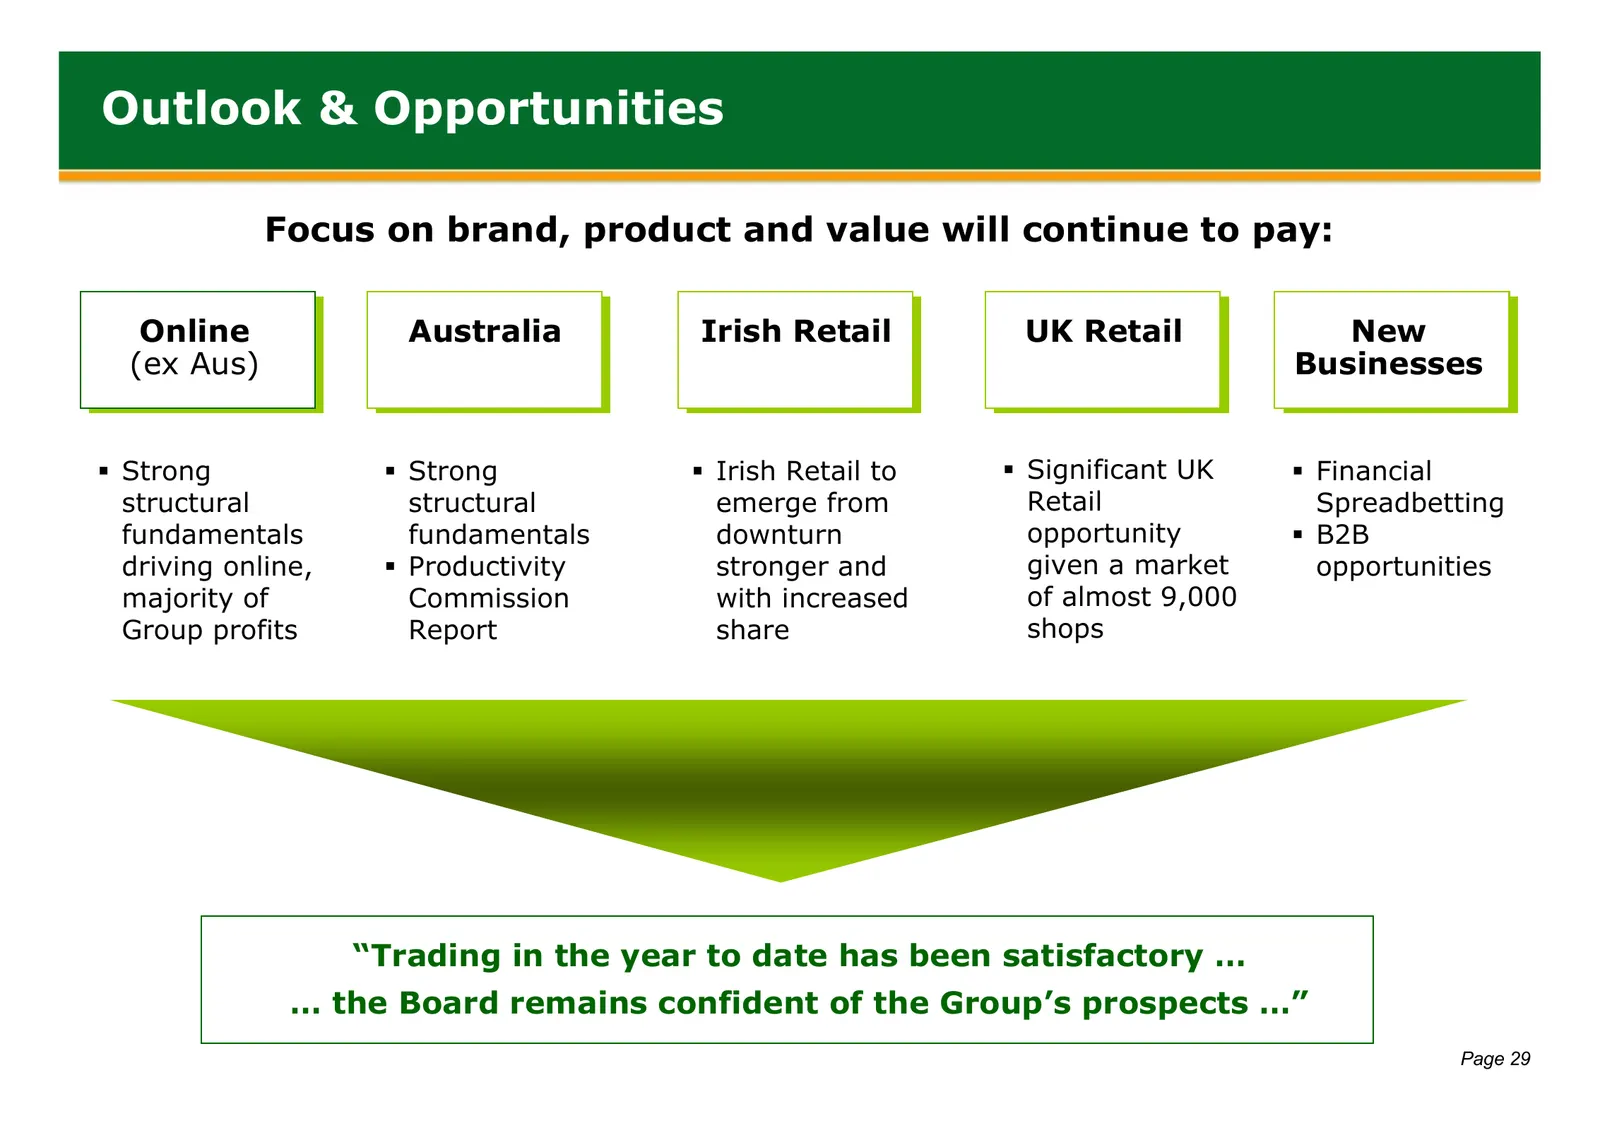
Outlook & Opportunities Focus on brand, product and value will continue to pay: Online Australia Irish Retail UK Retail New Online (ex Aus) Online Online Online Online Businesses Strong Strong Irish Retail to Significant UK Financial structural structural emerge from Retail Spreadbetting f
Source: Internet Archive copy of flutter.com
More decks from Flutter Entertainment plc
 Q3 2026 Earnings Presentation15 slides · Nov 4, 2026
 Q2 2026 Earnings Presentation14 slides · Aug 5, 2026
 Investor Day (September 2024)152 slides · Sep 25, 2024
 Q2 2024 Earnings Presentation20 slides · Aug 13, 2024
 Q1 2024 Earnings Presentation20 slides · May 14, 2024
 FY2023 Earnings Presentation36 slides · Mar 26, 2024