Strategic Hotels and Resorts Inc
Strategic Hotels and Resorts — NAREIT Presentation June 2010
22 slides from Strategic Hotels and Resorts's conference presentation, Jun 9, 2010
Slide 1: NAREIT Presentation June 2010
Exhibit 99.1 Hotels & Resorts STRATEGIC NAREIT Presentation June 2010
Slide 2: Agenda
I. Company Agenda II. III. 2IV.Industry Balance BEE Growth Update Sheet Overview Profile Review
Slide 3: Investment Highlights
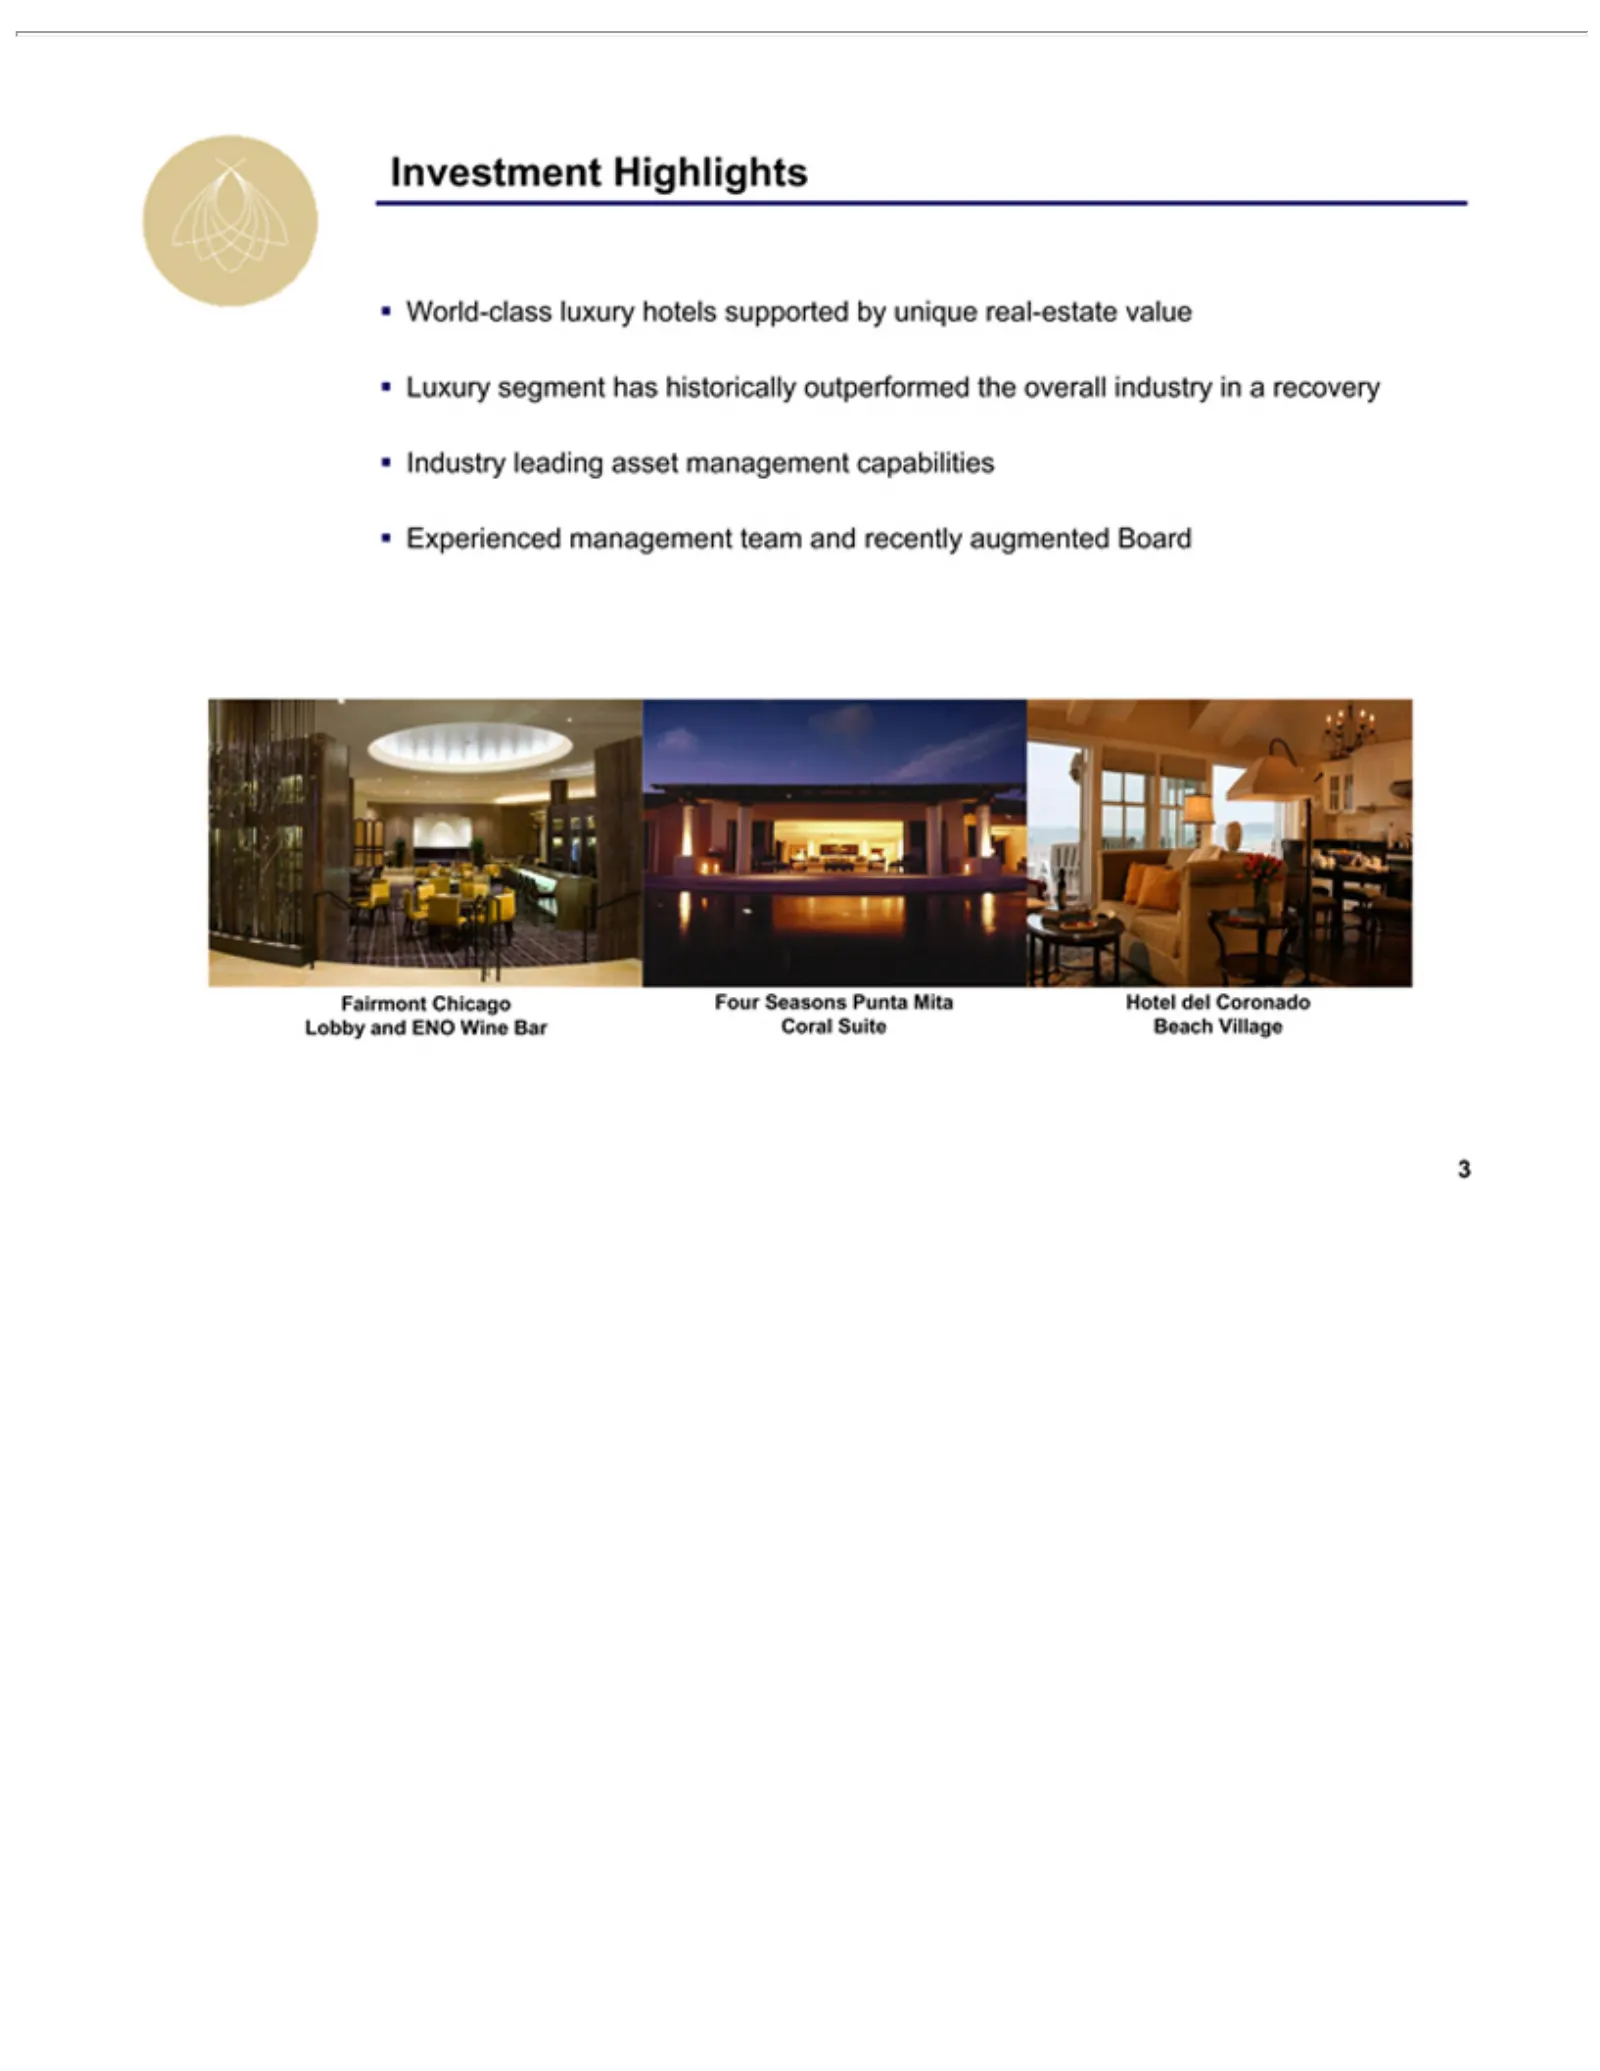
•Investment Fairmont Four 3Hotel World-class Luxury Industry Experienced Seasons del segment Chicago Coronado leading Highlights luxury Punta management has asset Lobby Beach Mita hotels historically management Coral and Village supported team ENO Suite and outperformed Wine capabilities recently by
Slide 4: Strategic Plan 2.0 and Board Augmentation
4–•Strategic Augmented Plan Pursuing Disciplined Initiatives Appointed to exit Hotels balance toRichard REIT Raymond Eugene Europe approach management reduce 2.0industry sheet Reilly and Kincaid corporate “Rip” toinitiatives focus capital organization to veteran Gellein, to Board on overhead Board a
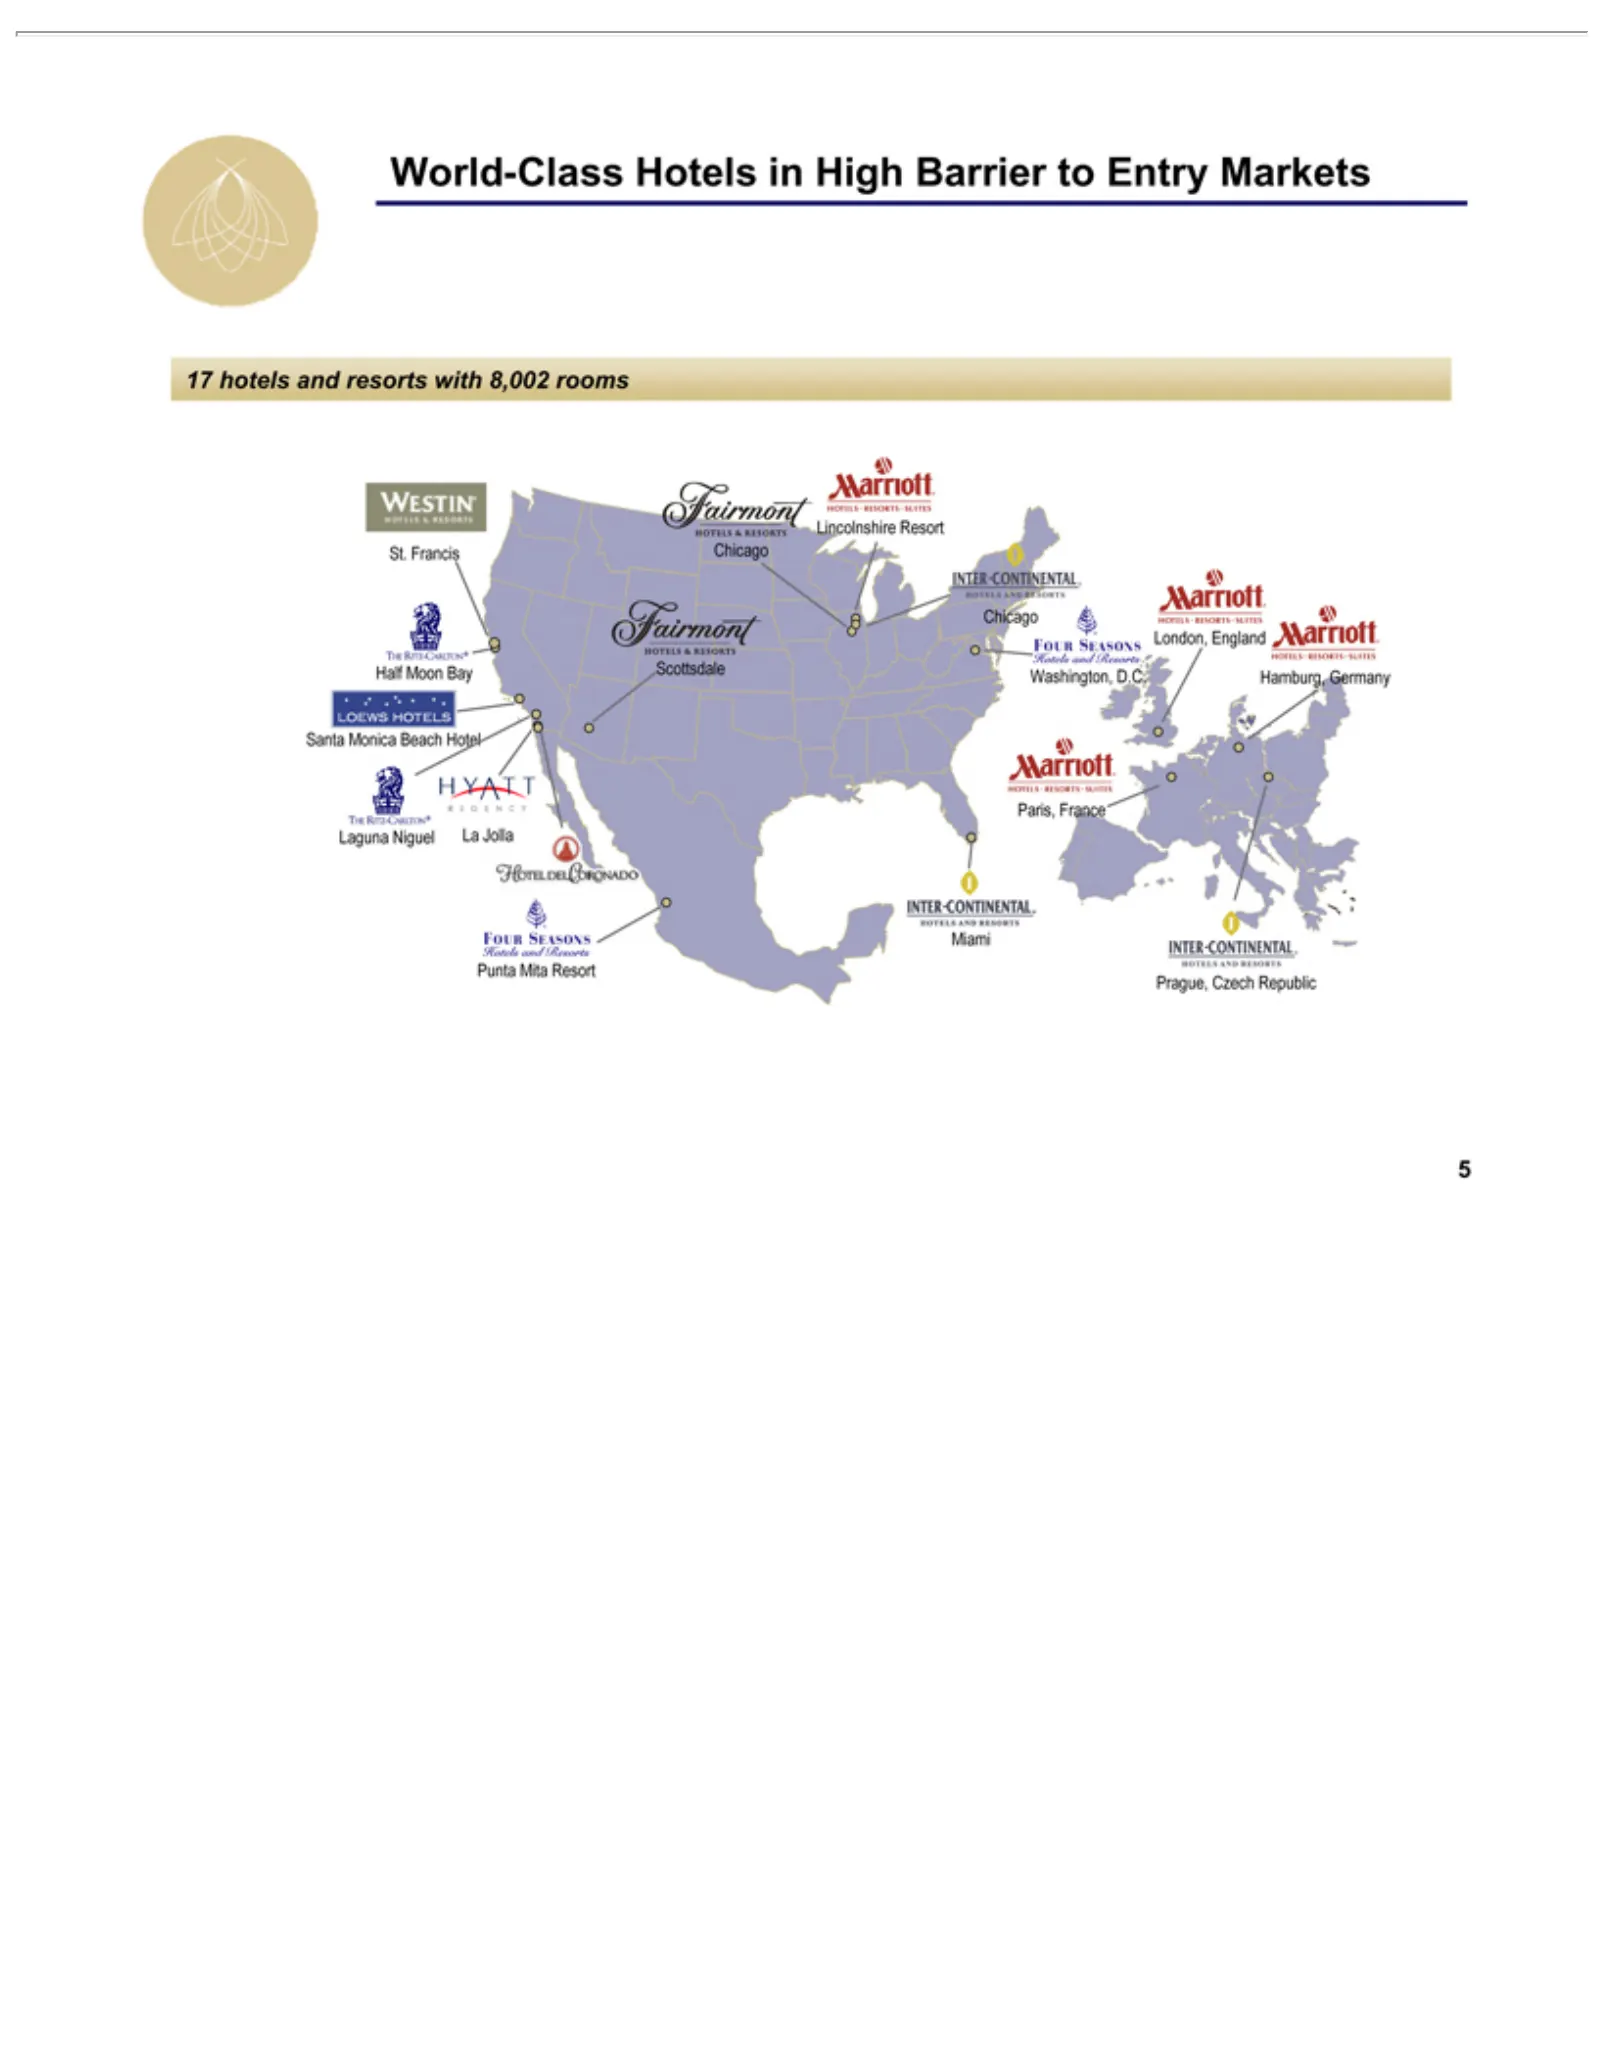
Slide 5: World-Class Portfolio
World-Class 17 WESTIN Half LOEWS Santa THE Laguna HYATT La HOTEL Punta Fairmont Lincolnshire FOUR Chicago Paris, London, Marriott Hamburg, HOTELS INTER-CONTINENTAL 5Prague, hotels Jolla Moon RITZ-CARLTON® Monica France Mita SEASONS Niguel Czech REGENCY DEL HOTELS England HOTELS and HOTELS HOTELS AND
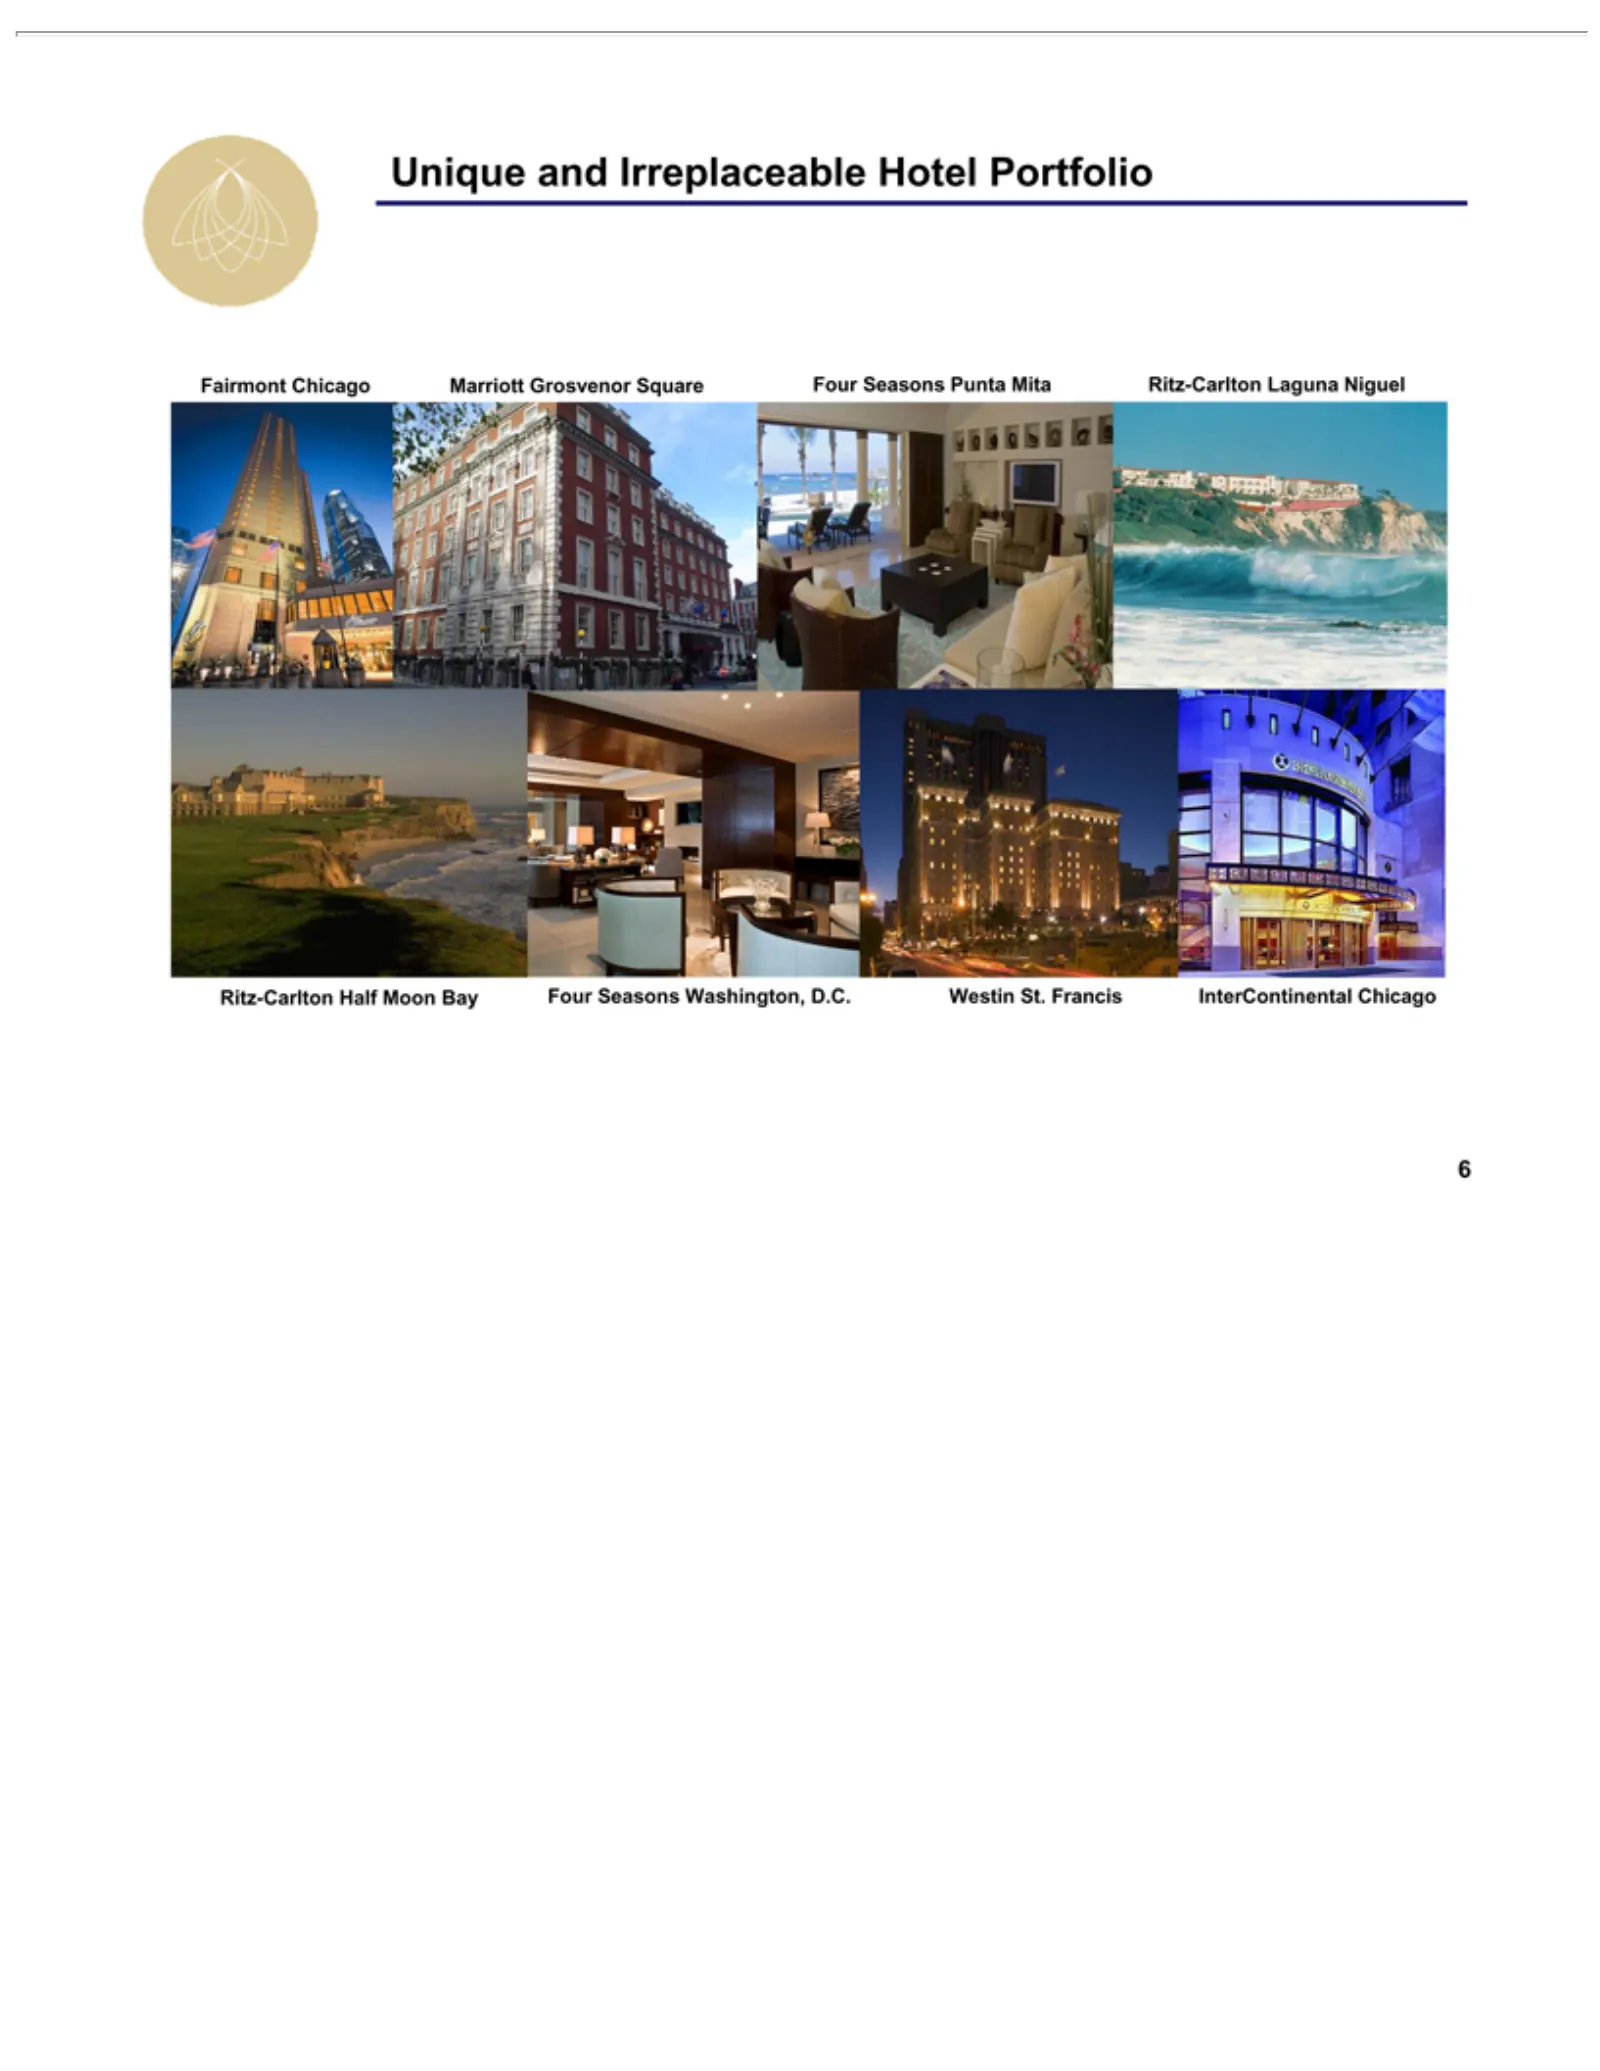
Slide 6: Unique and Irreplaceable Portfolio
Unique Fairmont Marriott Mita Ritz-Carlton Four Westin 6InterContinental Ritz-Carlton Seasons St. and Grosvenor Chicago Francis Irreplaceable Half Washington, Punta Chicago Moon Laguna Square Bay Hotel Niguel D.C. Portfolio
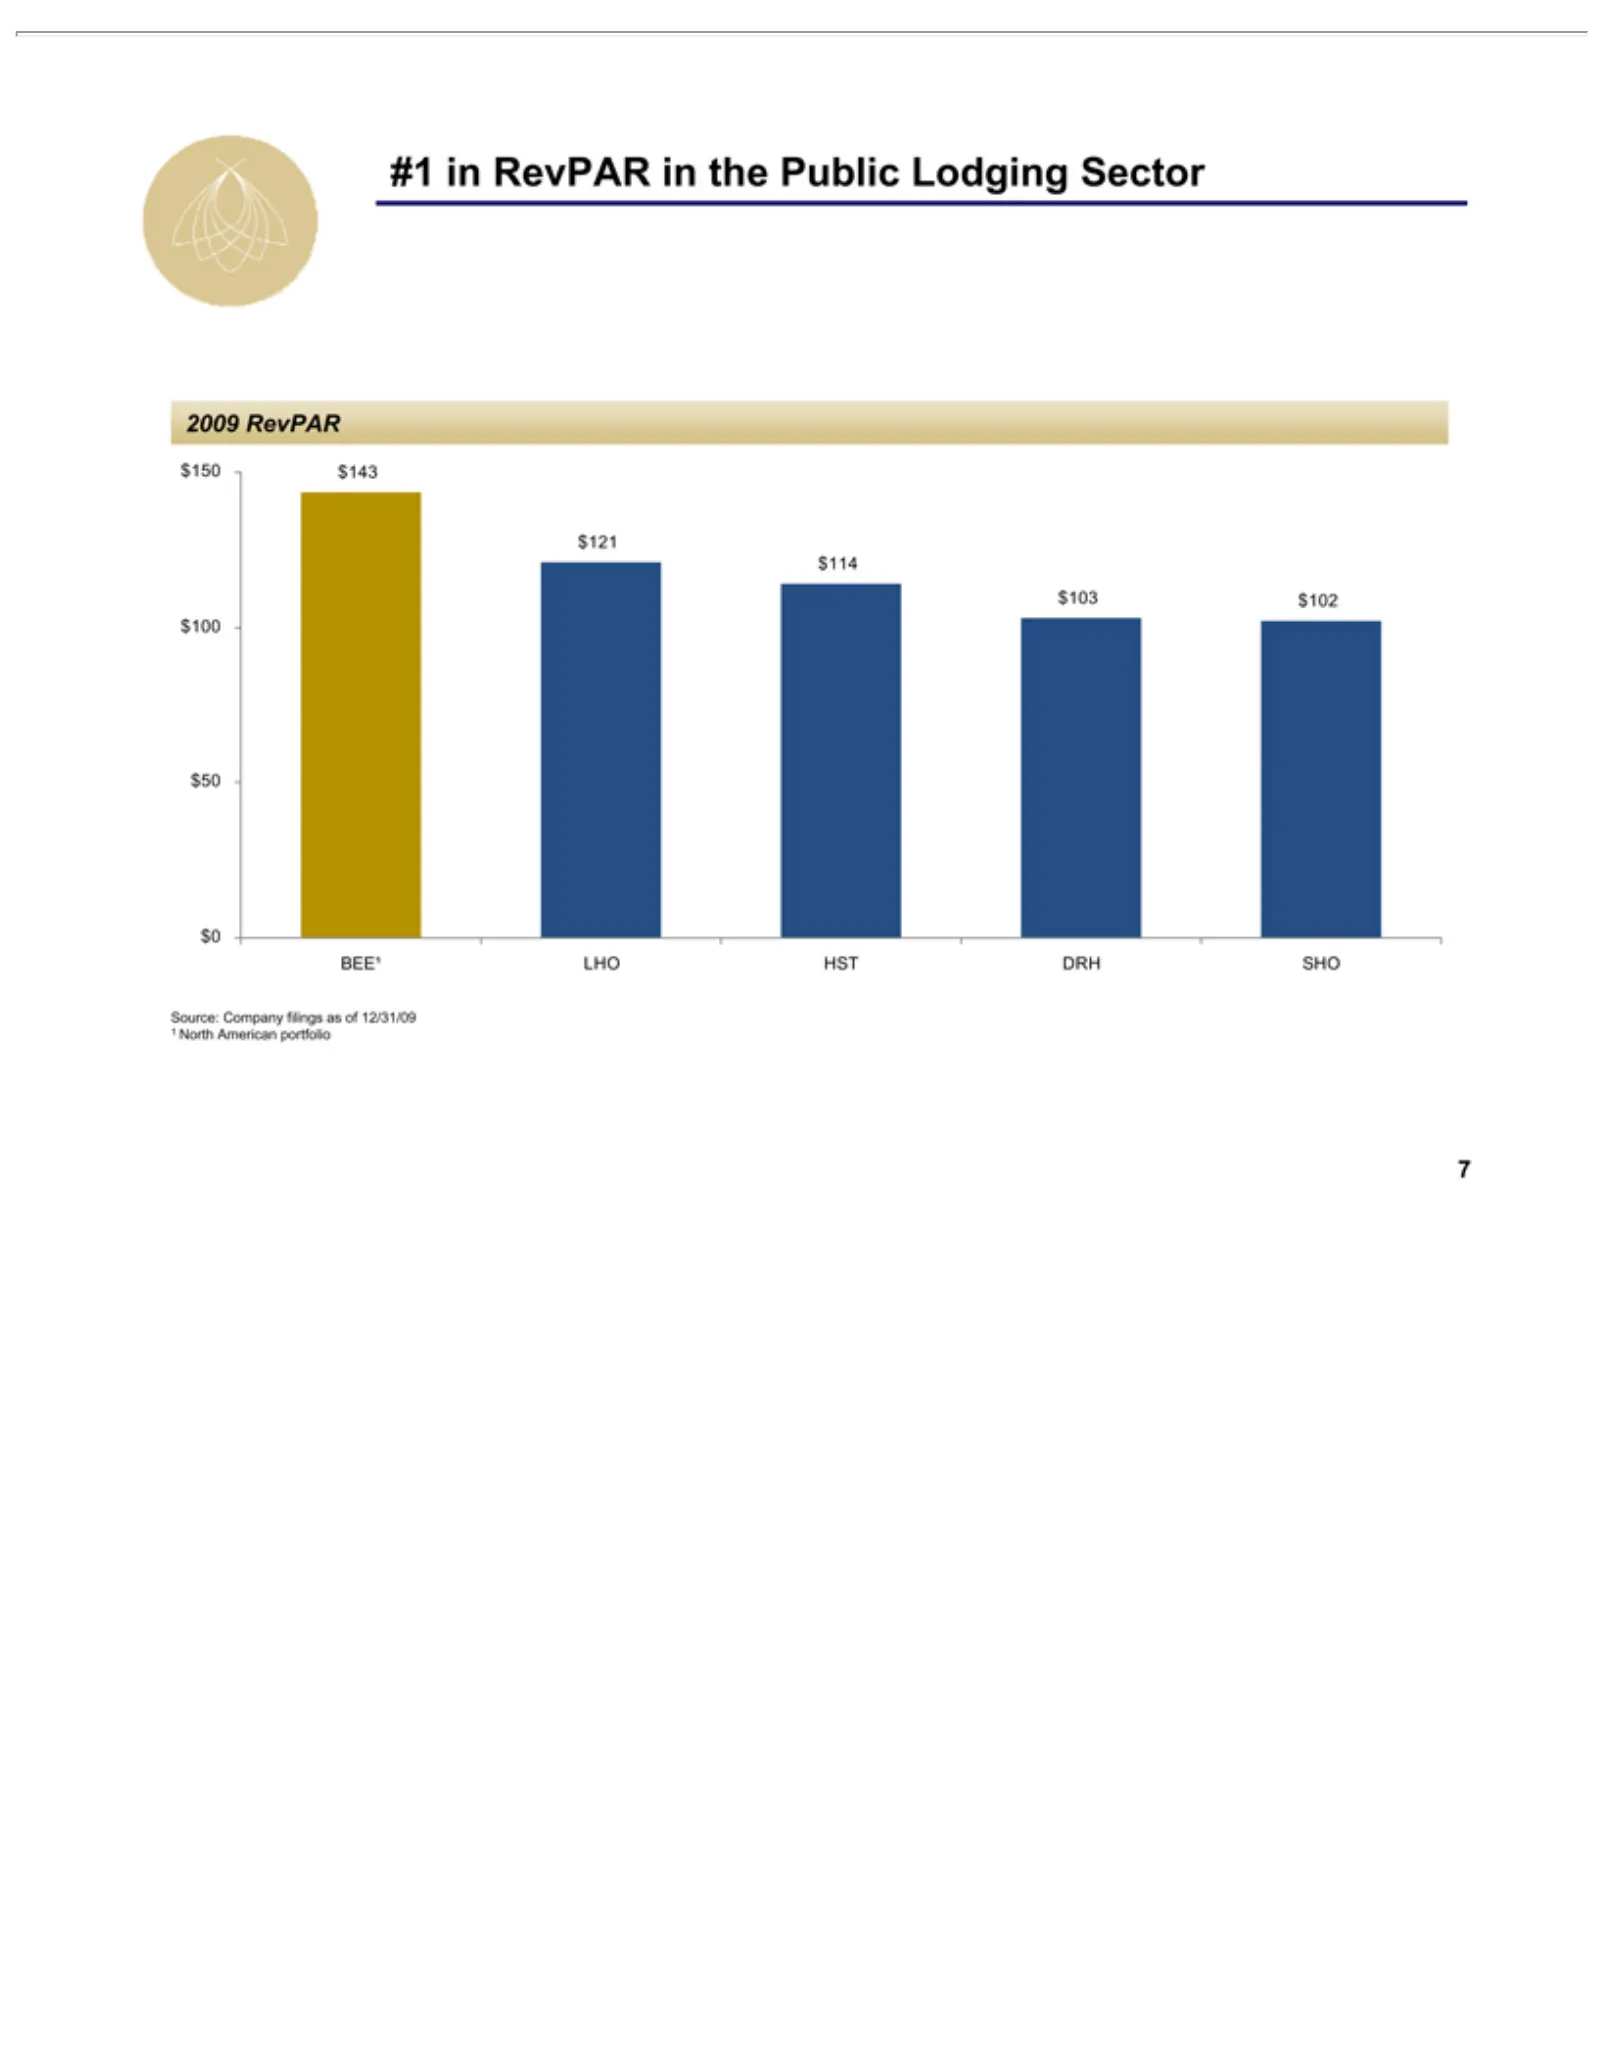
Slide 7: #1 North American Public Lodging Company in RevPAR
#1North 2009 $150 $143 BEE1 71Source: in $121 RevPAR $100 LHO American Company $50 $114 HST in $0 $103 the DRH filings portfolio Public $102 SHO as Lodging of 12/31/09 Sector
Slide 8: II. Industry Update
I. Company Agenda 8II. Industry Update Overview
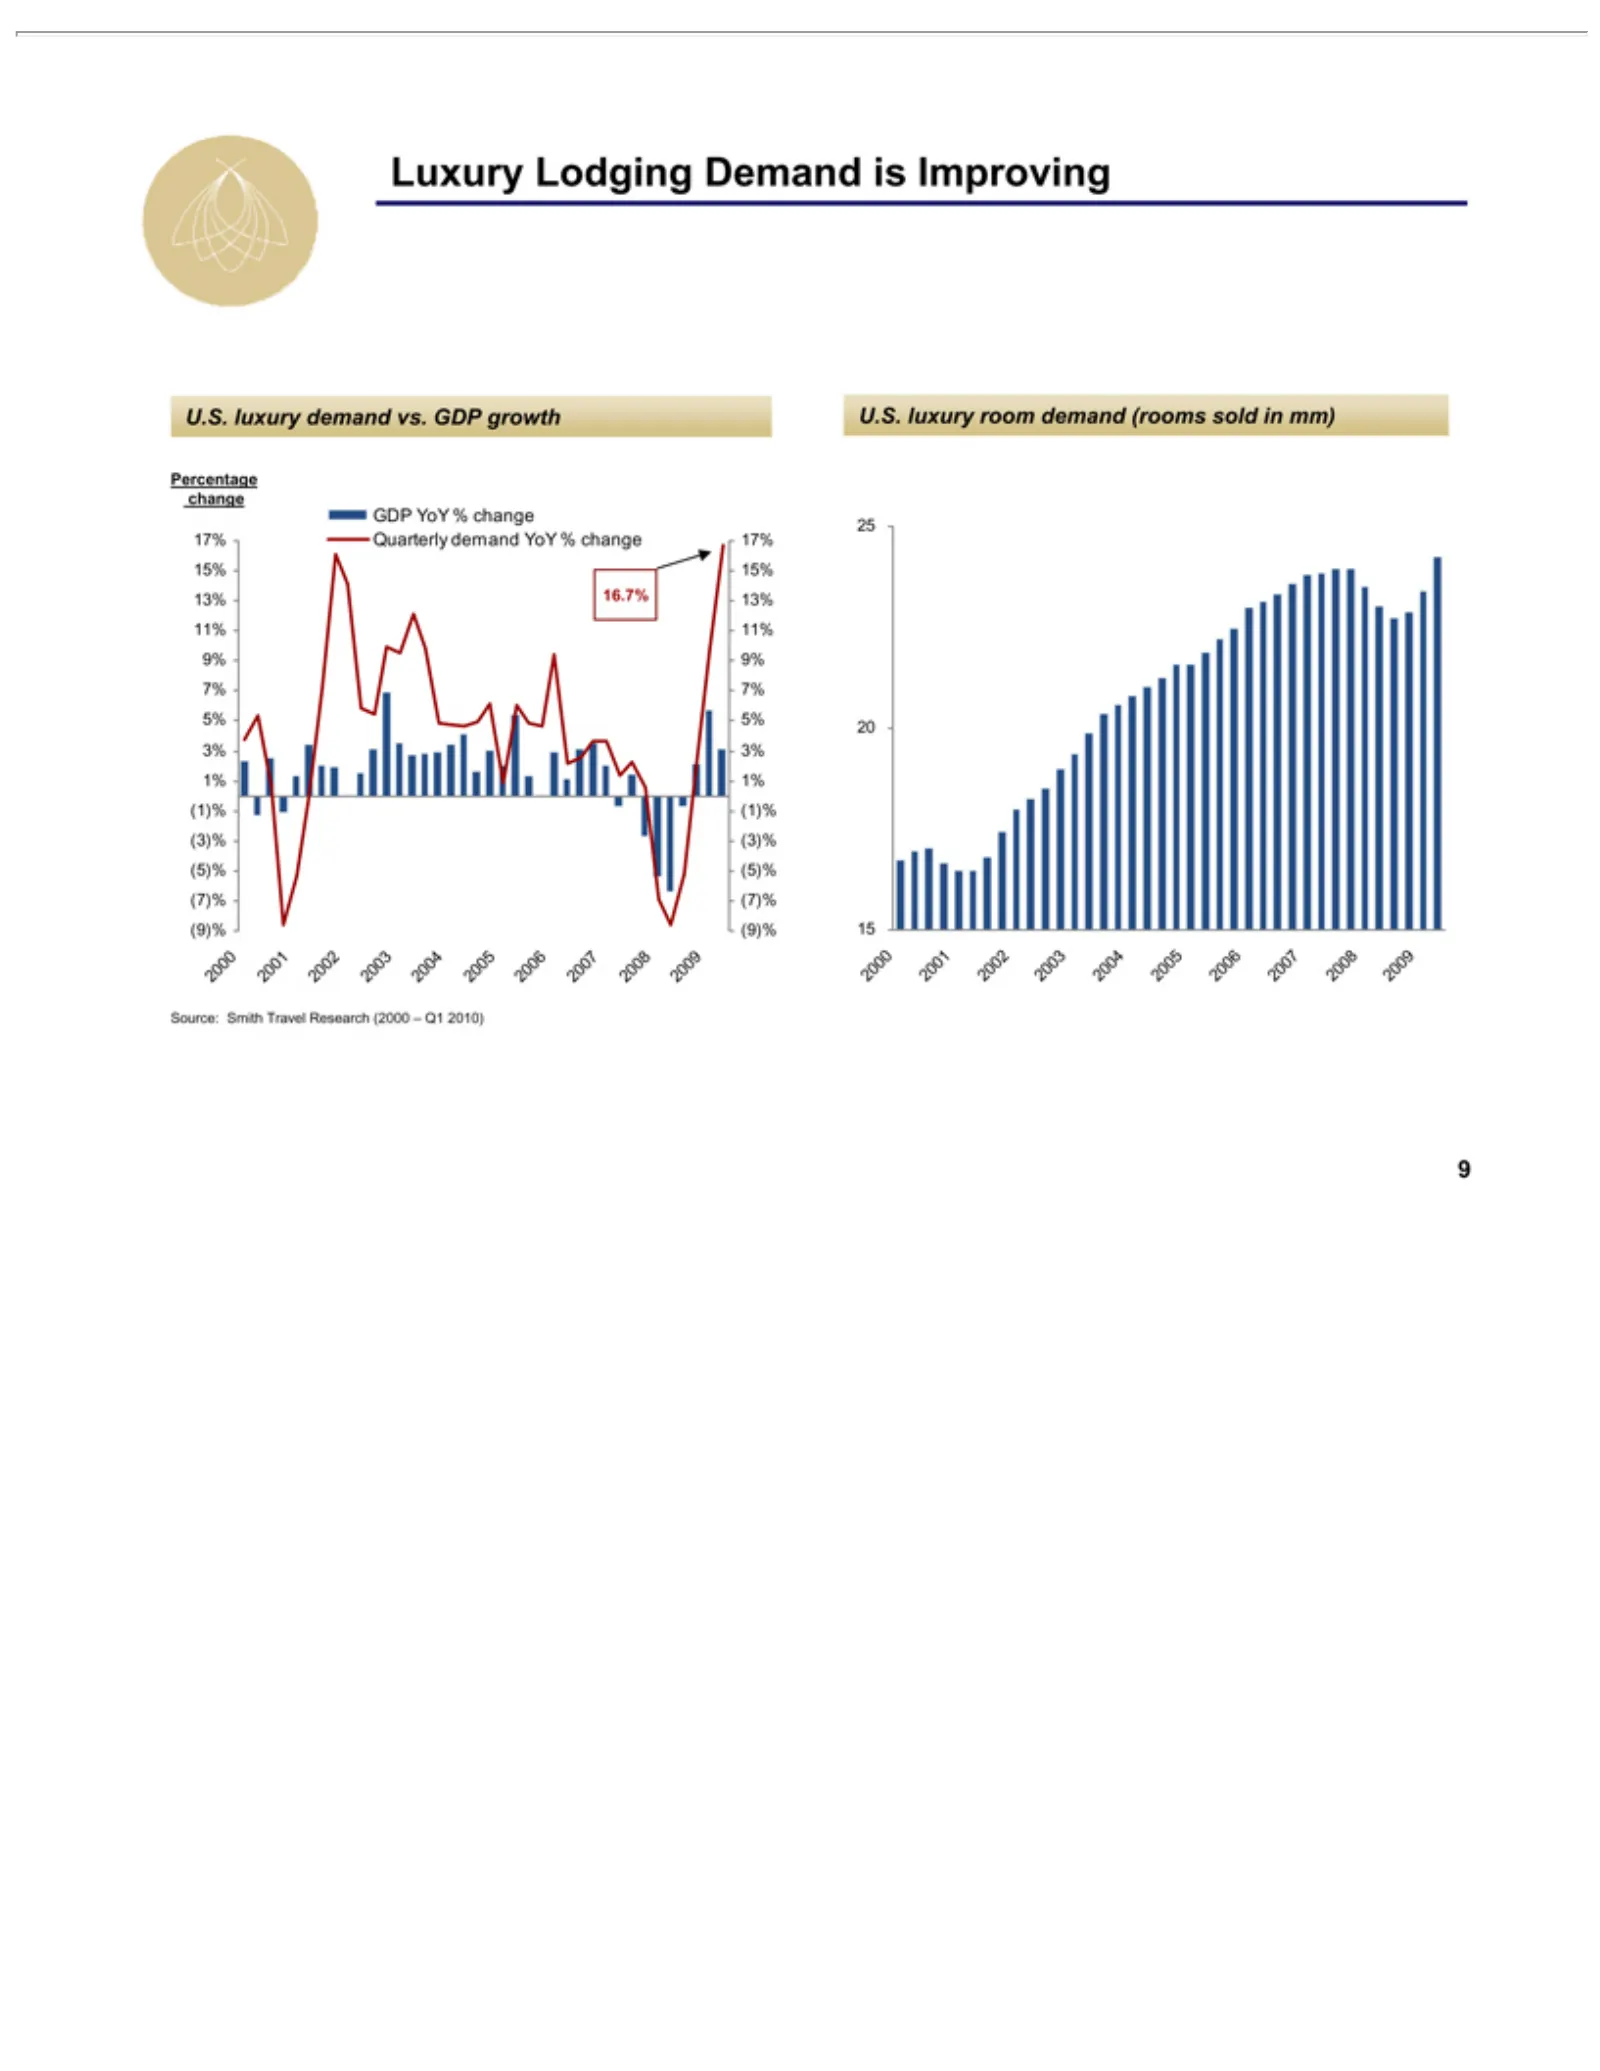
Slide 9: Luxury Demand Improving
Luxury Percentage GDP Quarterly 16.7% 17% U.S. 25 2000 9Source: 20luxury 15% YoY 2001 15Lodging Smith demand 13% %2002 change demand room change Travel 11% 2003 Demand demand YoY 9% vs. Research 2004 % GDP 7%is change (rooms 2005 Improving 5% growth (2000 3% 2006 sold 1%–in 2007 Q1 (1)% mm) 2010) 20
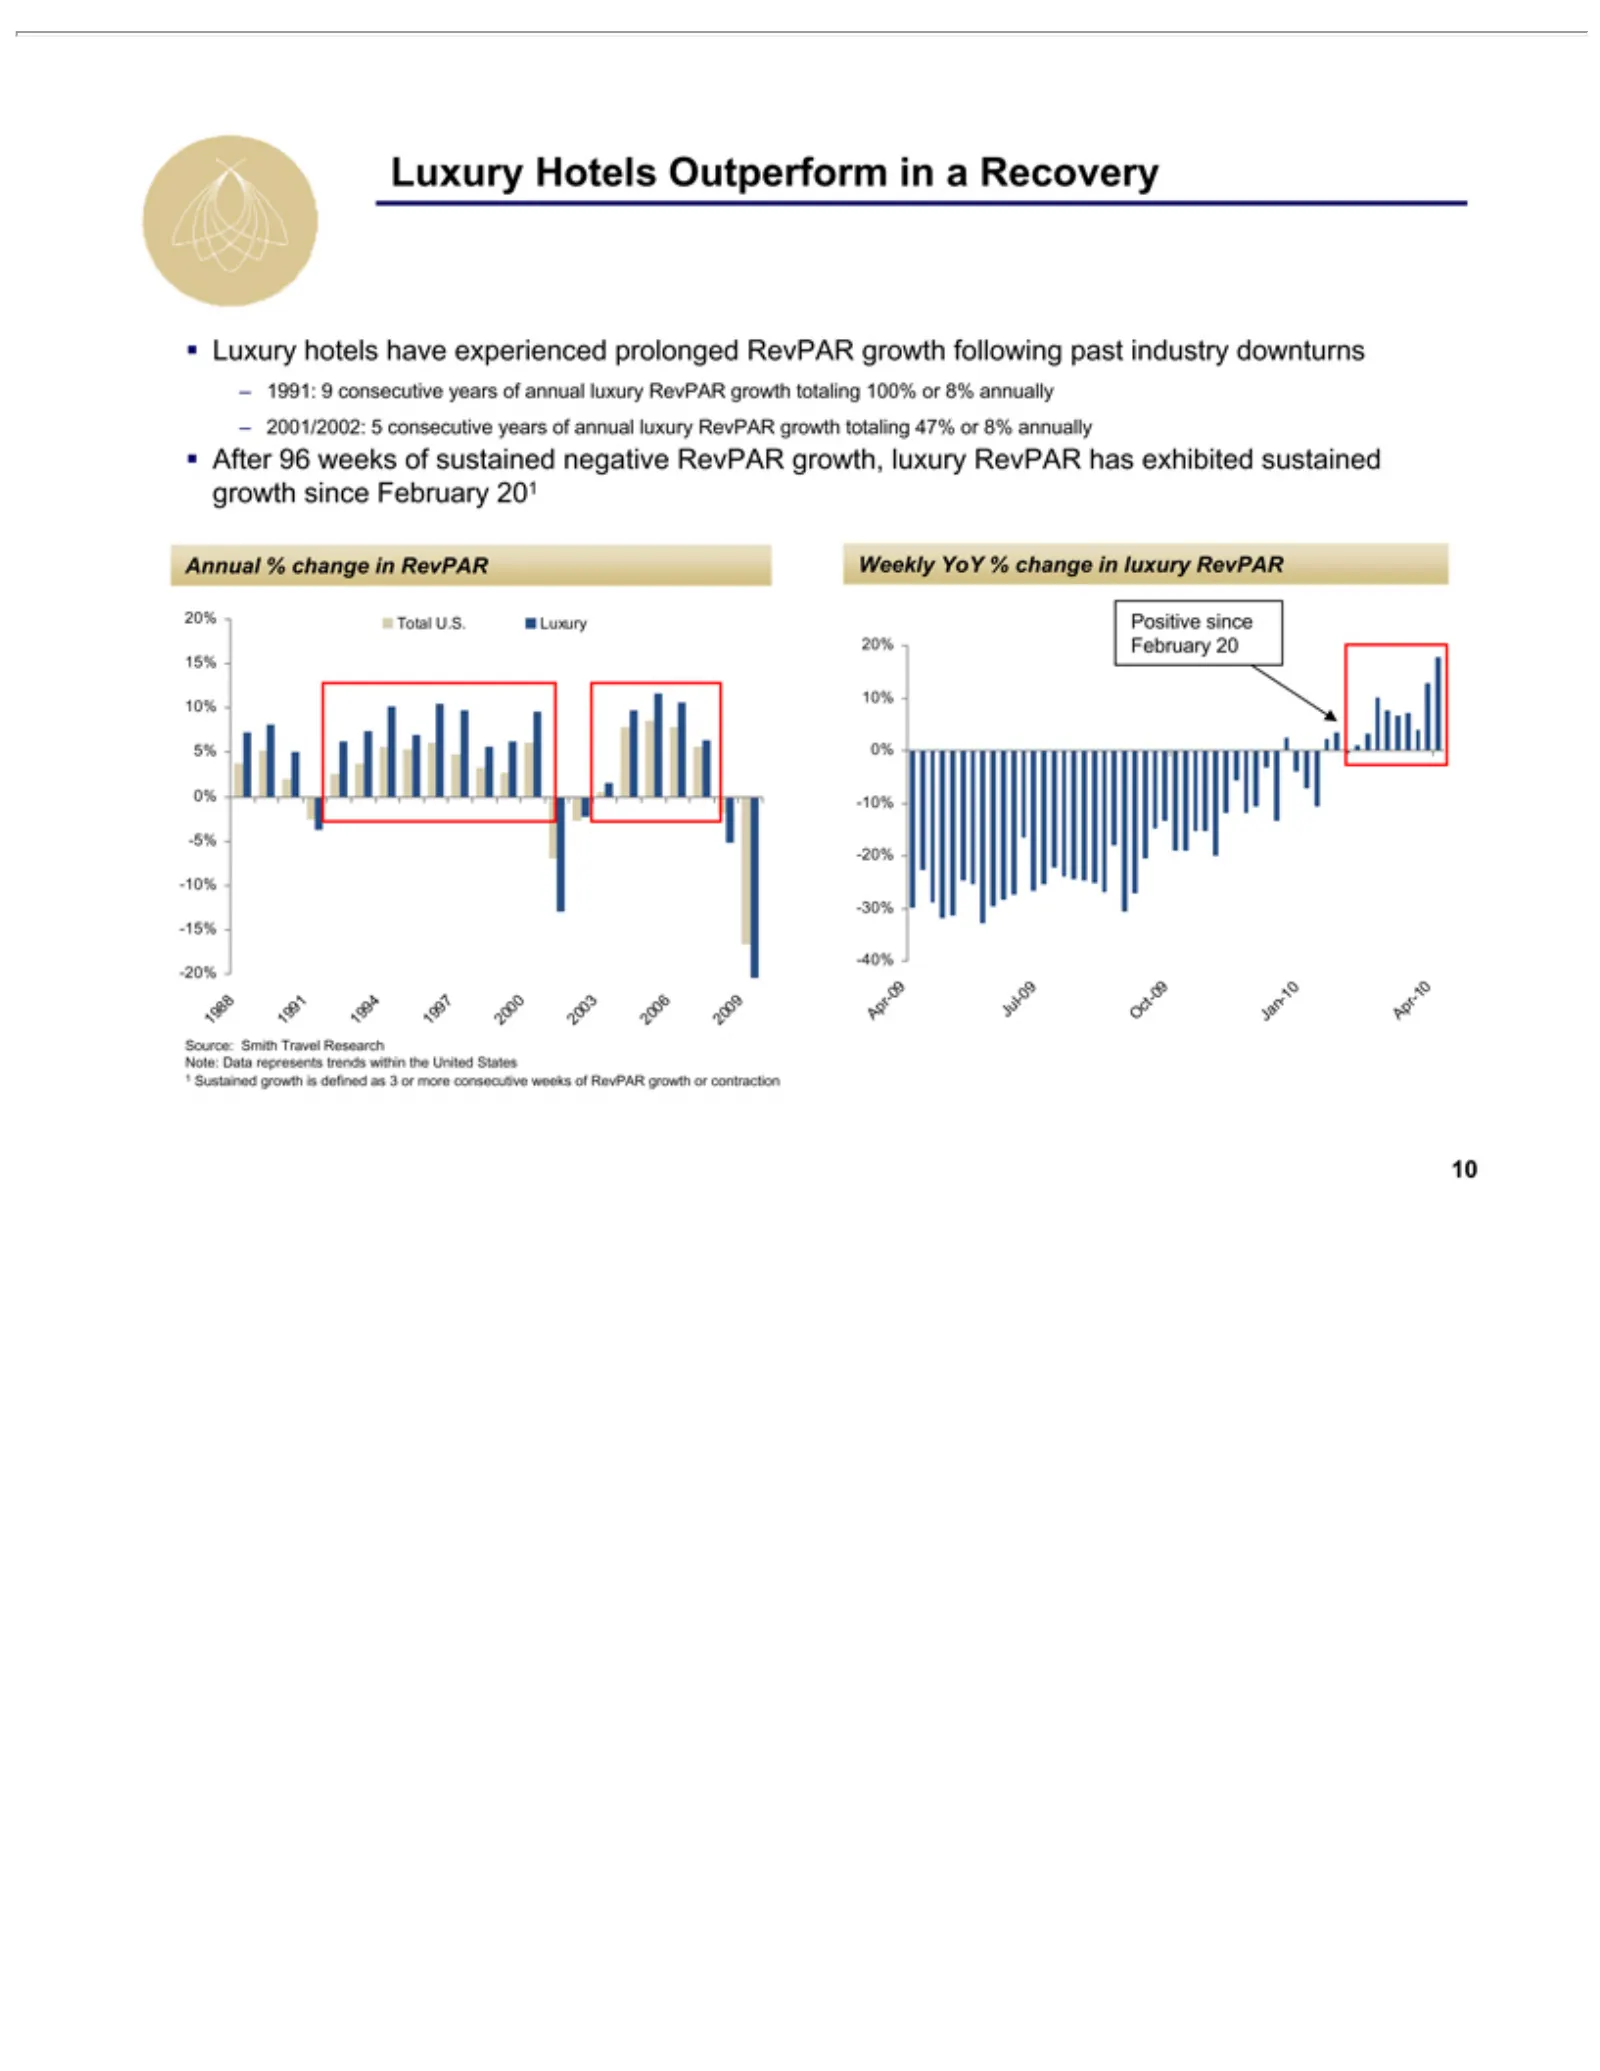
Slide 10: Luxury RevPAR Recovery and Outperformance
•–Luxury Annual Total 1988 Weekly Positive 20% Apr-09 Source: 1Note: 10 After Luxury 1991: 2001/2002: Sustained 15% 10% 1991 U.S. Data 96 Jul-09 Hotels % YoY 9Smith since hotels consecutive weeks 10% 0% change Luxury 1994 represents growth %5-10% February Oct-09 Travel Outperform 5% consecutive chan
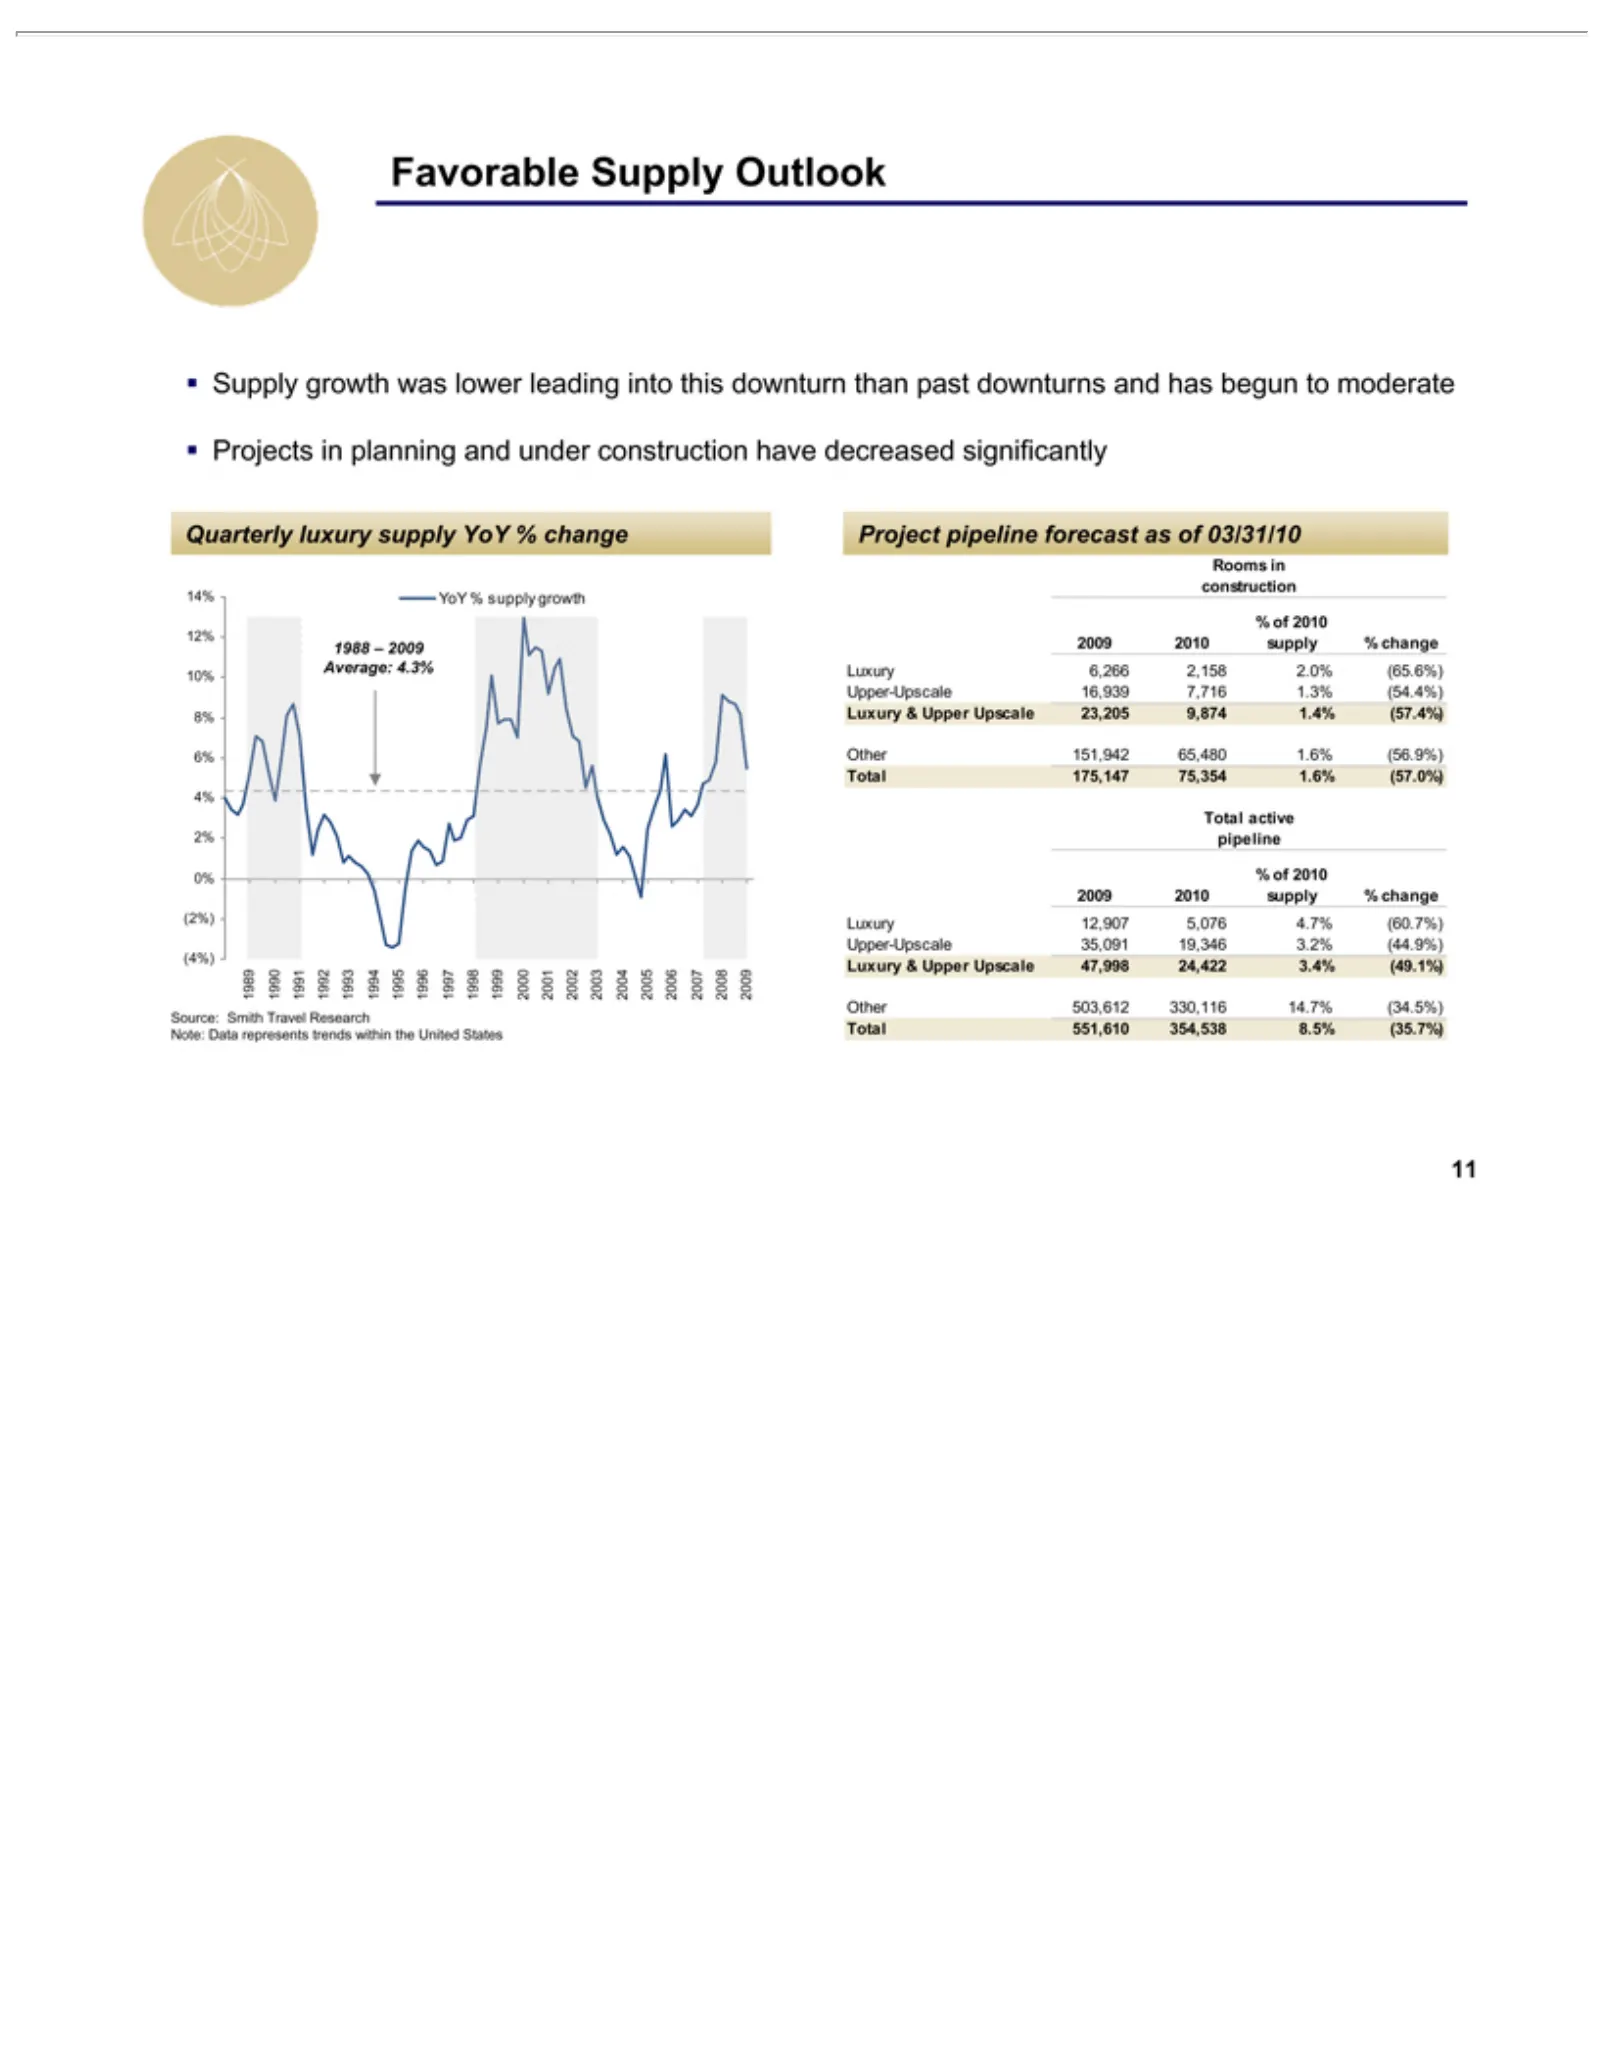
Slide 11: Favorable Supply Outlook
•Favorable Quarterly YoY 1988 Average: 14% 1989 Project Rooms Upper-Upscale % 2009 Luxury Other Total Source: Note: 11 Supply Projects of % 12% 2010 –551,610 1990 175,147 active Data 151,942 503,612 2009 pipeline in supply 6,266 12,907 &Smith growth 4.3% in luxury construction 10% Upper Supply 1991
Slide 12: Agenda
I. Company Agenda II. III. 12 Industry BEE Growth Update Overview Profile
Slide 13: Industry-Leading Asset Management Capabilities
•Industry 13 Aggressive Revenue Exceptional Rigorous Evaluation Leading enhancement oversight and and asset implementation early Asset management ofcost Management brand through cutting managers supported market ofinitiatives value Capabilities to research add ensure byimplemented ROI internally bas
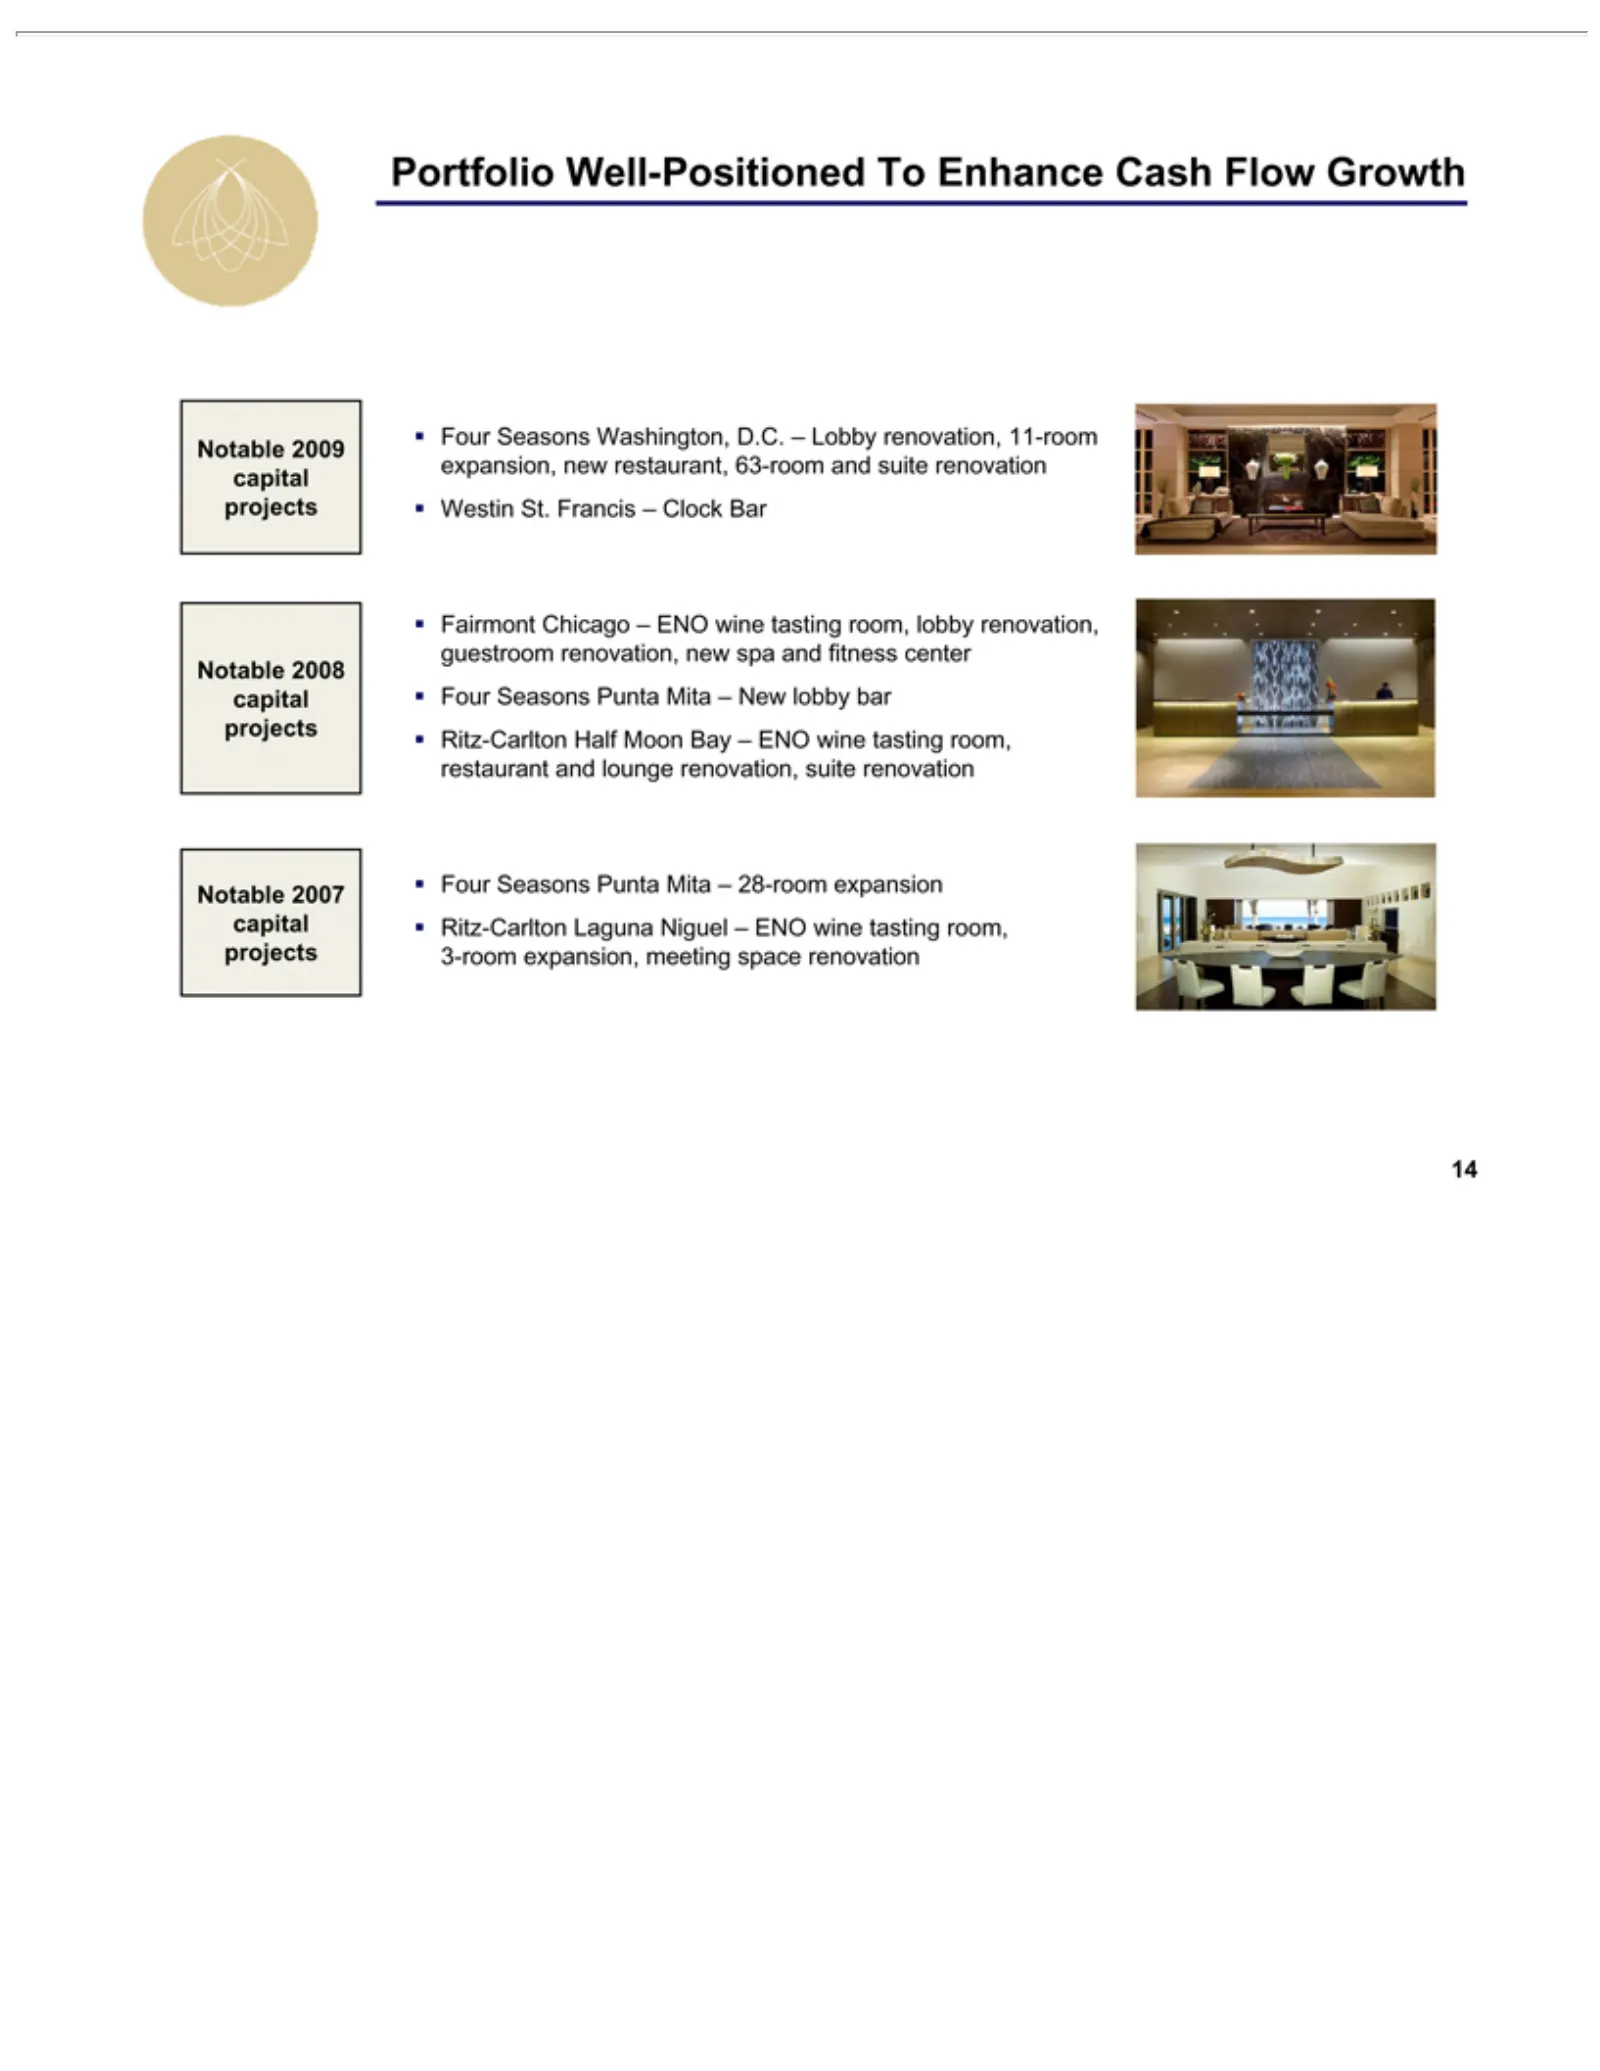
Slide 14: Well-Positioned Portfolio and Notable Capital Projects
PortfolioHalf Carlton Notable 14 2009 2008 2007 Well-Positioned Moon capitalBay projects – To ENOEnhance • Four Fairmont wineSeasons tasting Cash Chicago Flow room, Washington, Punta Growth –restaurant Mita ENO–wine D.C. 28-room and tasting – Lobby lounge expansion room, renovation, renovation, lobb
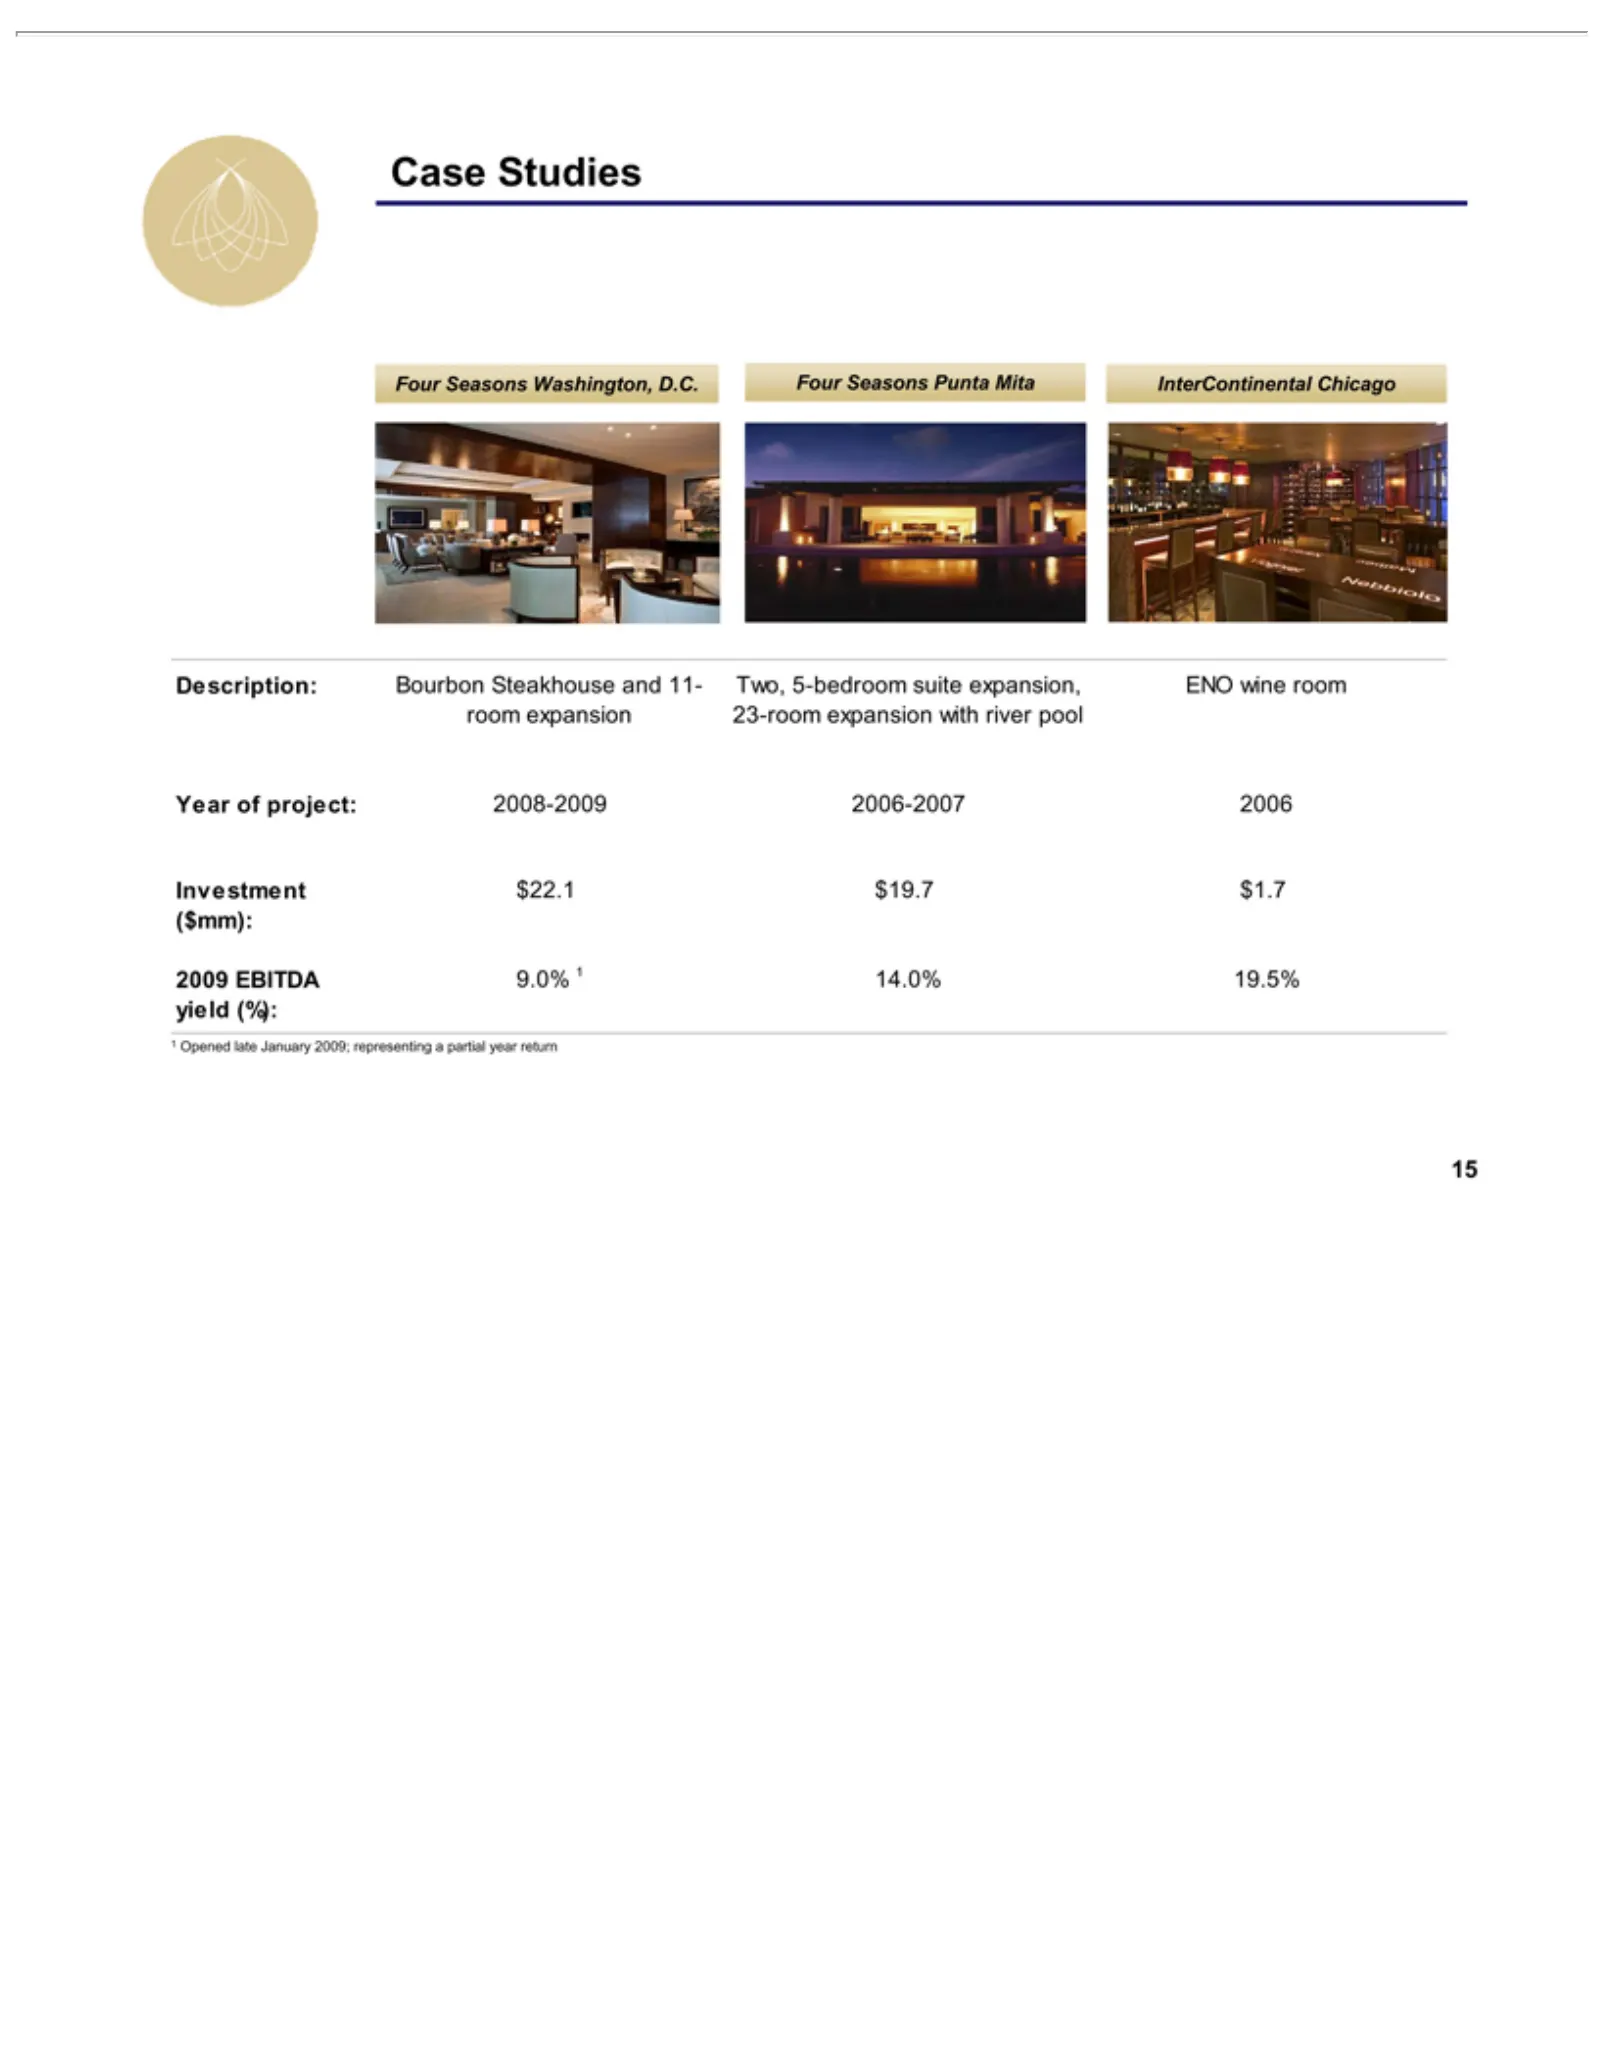
Slide 15: Case Studies
Case Four InterContinental Description: Two, ENO Year Investment 2009 ($mm): 1yield 15Opened of Seasons Studies (%): EBITDA 5-bedroom wine project: late room $22.1 Bourbon Washington, Punta January 9.0% 2008-2009 Chicago suite $19.7 Mita 1Steakhouse expansion, 2009; 14.0% $1.7 D.C. 2006-2007 represe
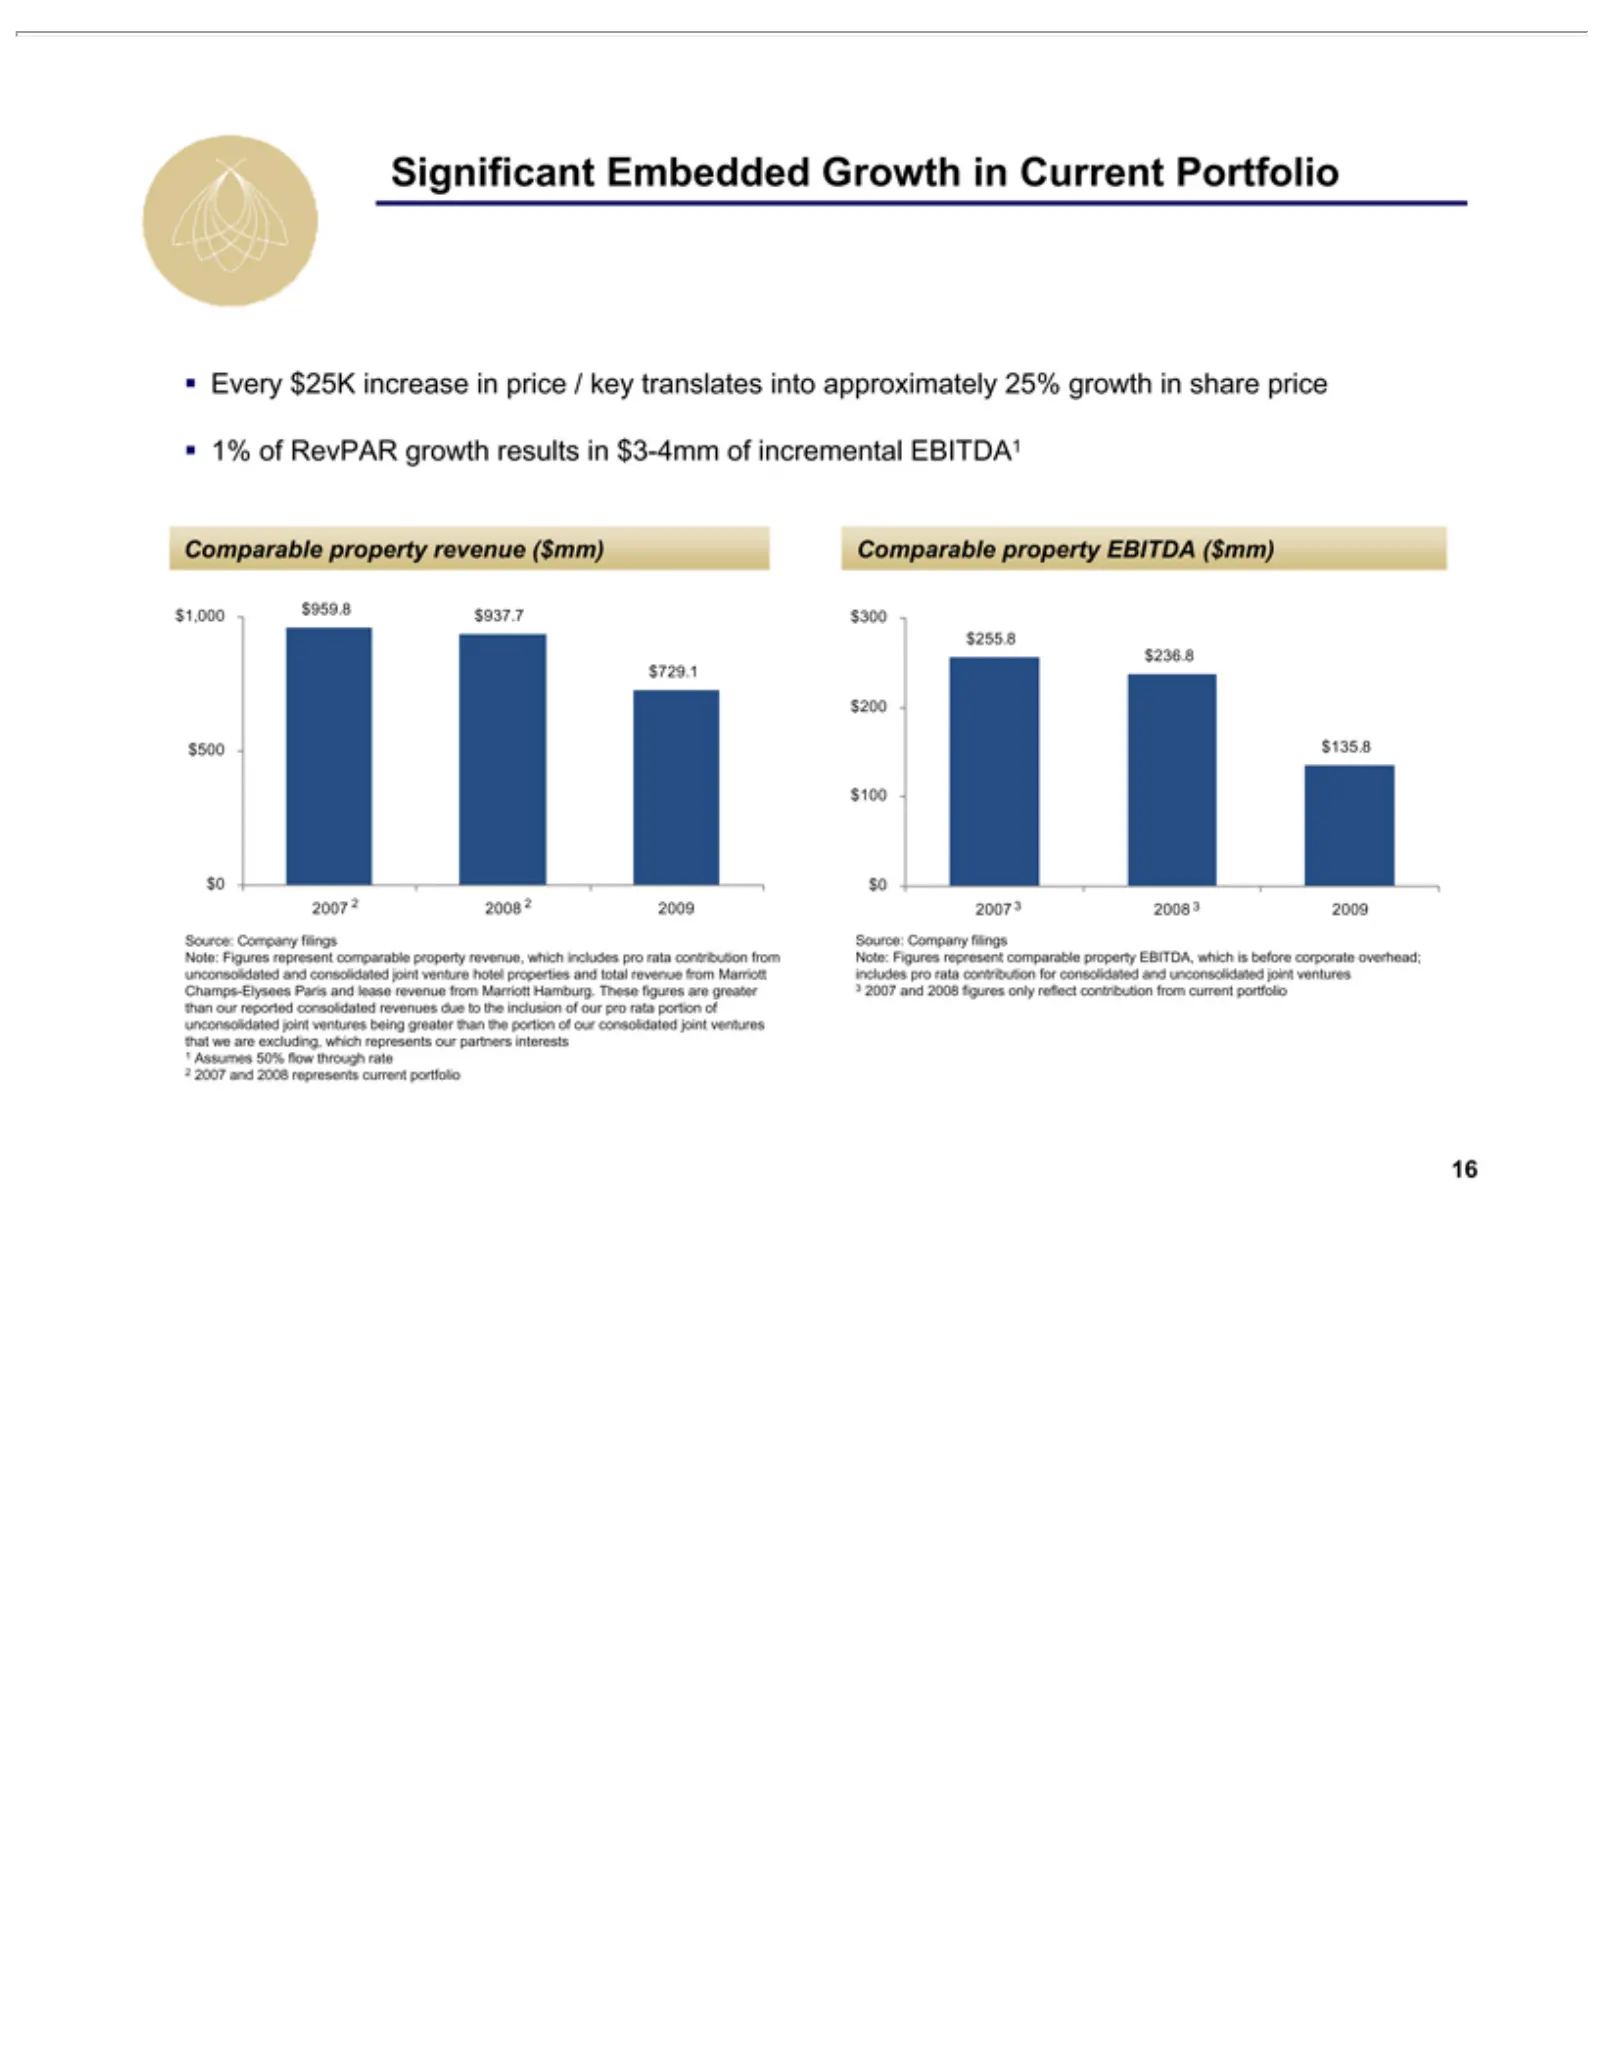
Slide 16: Significant Embedded EBITDA Growth
•Significant $1,000 $500 Champs-Elysees 21ventures Comparable $300 2007 $0 $100 $200 Source: 3Note: 16 Every 1% Assumes 2007 of 2Figures 3$255.8 $959.8 2008 and $25K RevPAR Company being 50% Embedded 2008 property 2increase 3$236.8 represent $937.7 2009 greater flow Paris represents figures growth f
Slide 17: Agenda
I. Company Agenda II. III. IV. 17 Industry Balance BEE Growth Update Sheet Overview Profile Review
Slide 18: Recent Transaction Summary: Sources and Uses
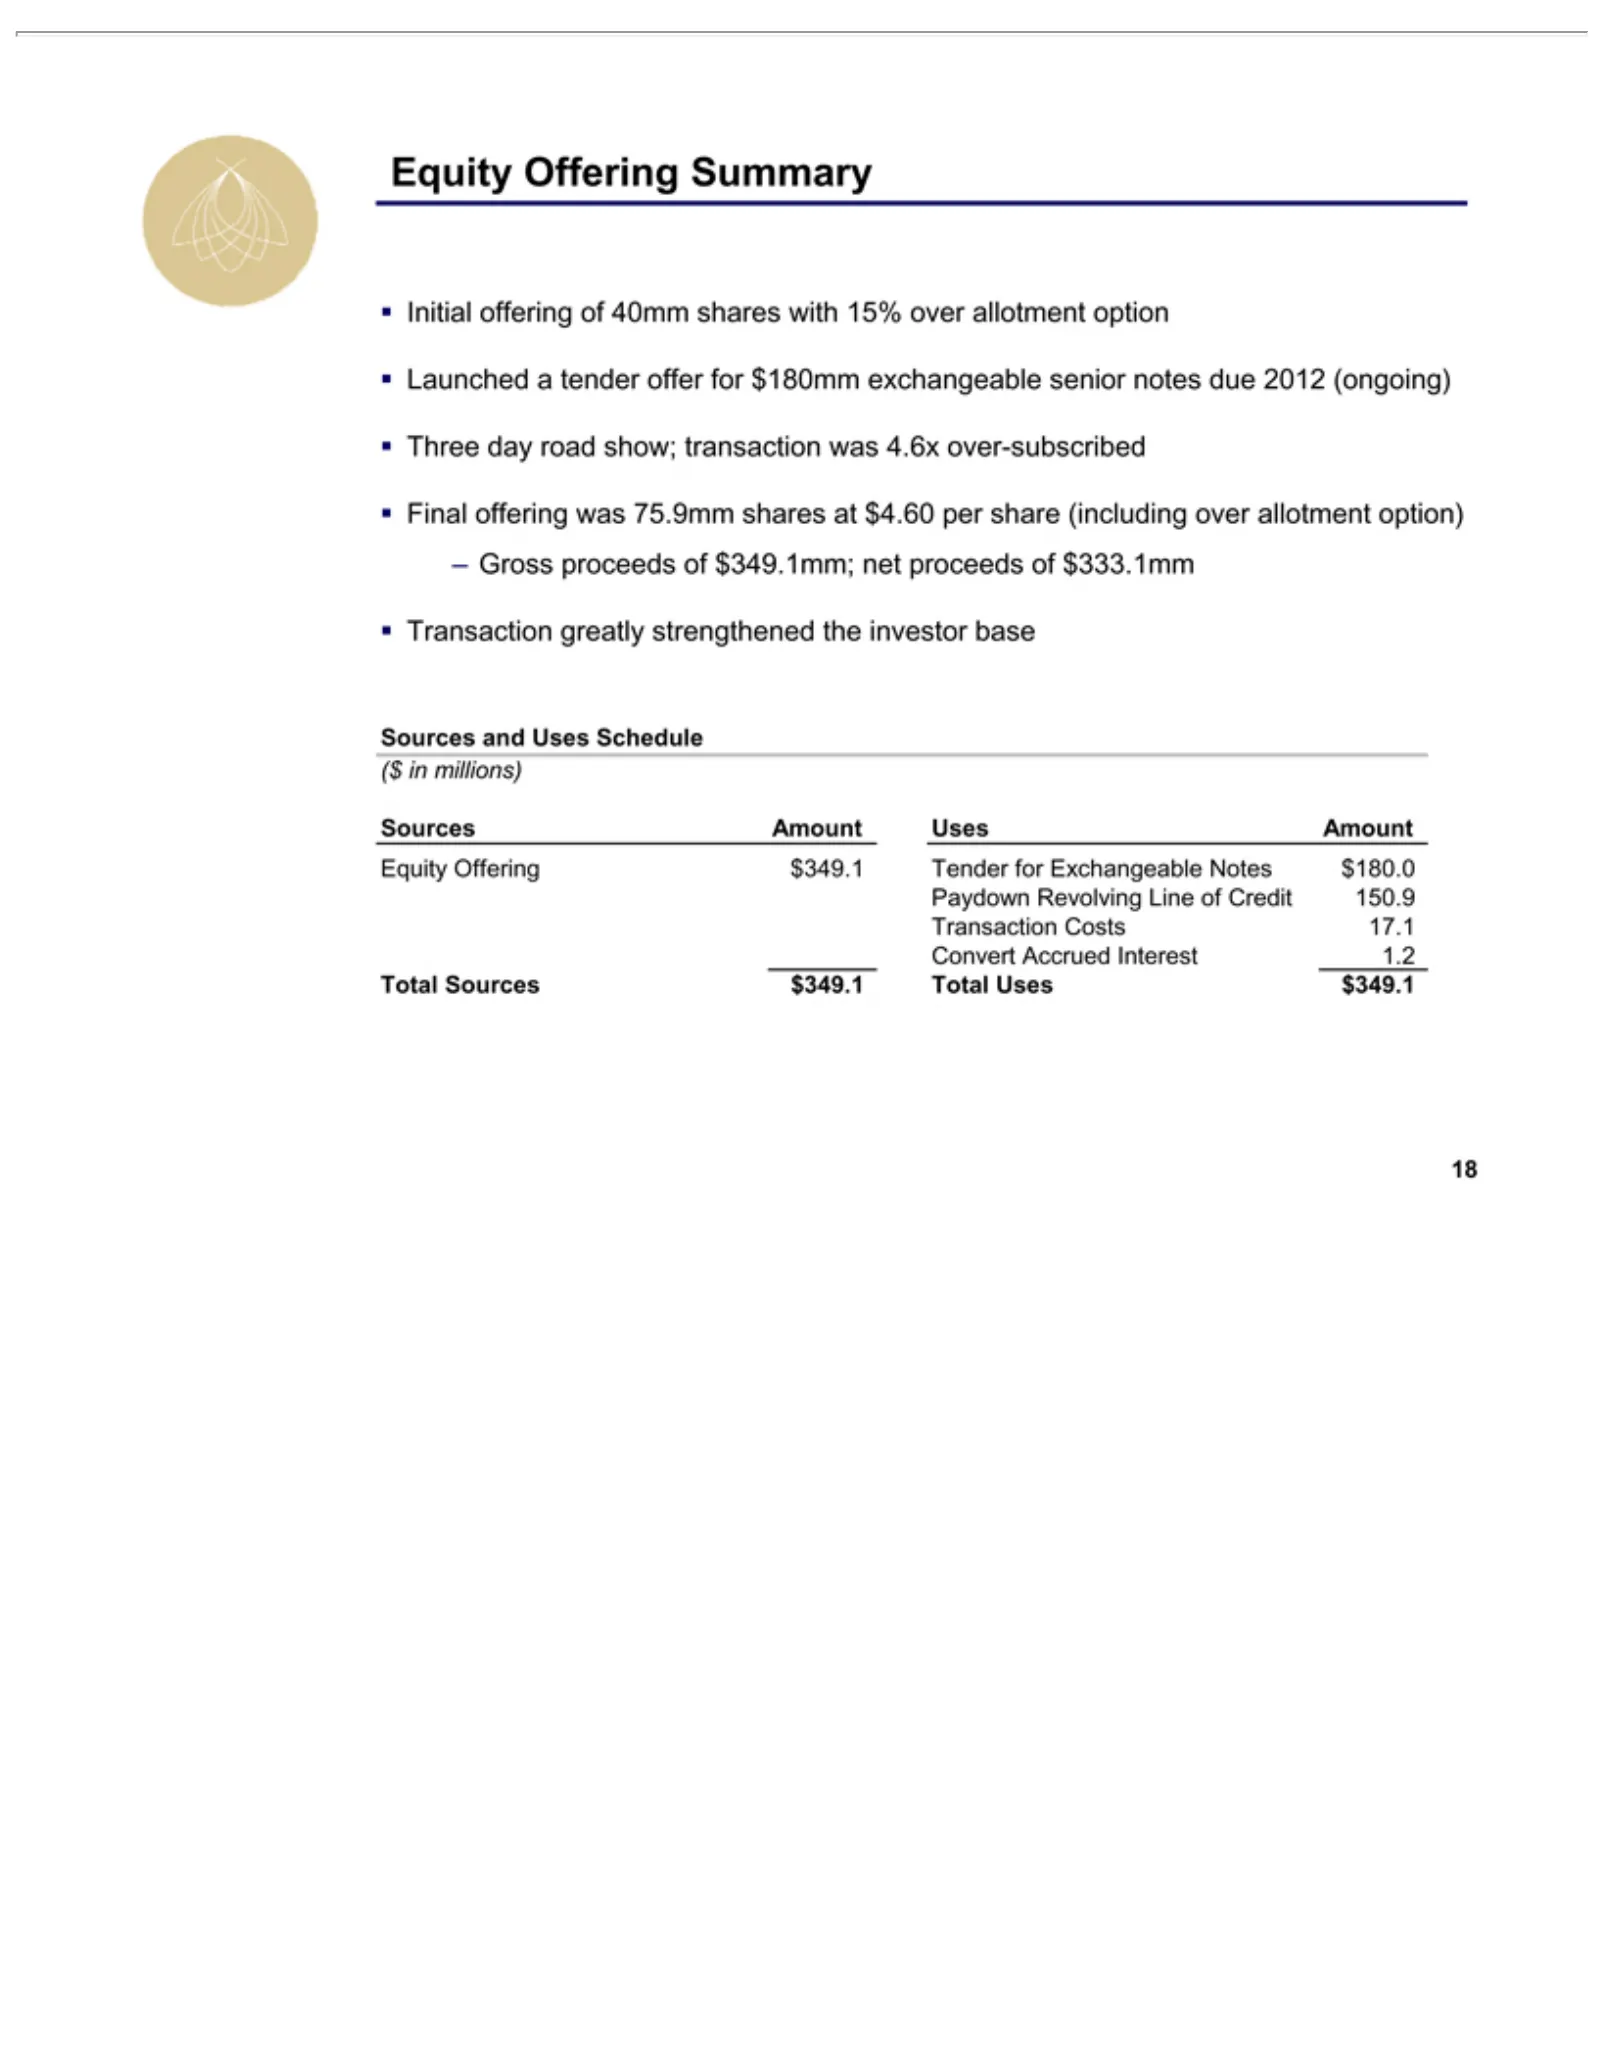
•– Transaction ($ Sources Equity Uses Tender Paydown Transaction Convert Total 18Three Initial Launched Final Gross in millions) Amount Sources Uses offering Offering for day offering proceeds Amount and Accrued Revolving Exchangeable $349.1 aroad Costs Uses tender greatly $349.1 was Summary $349.1
Slide 19: Recent Balance Sheet Strengthening Initiatives
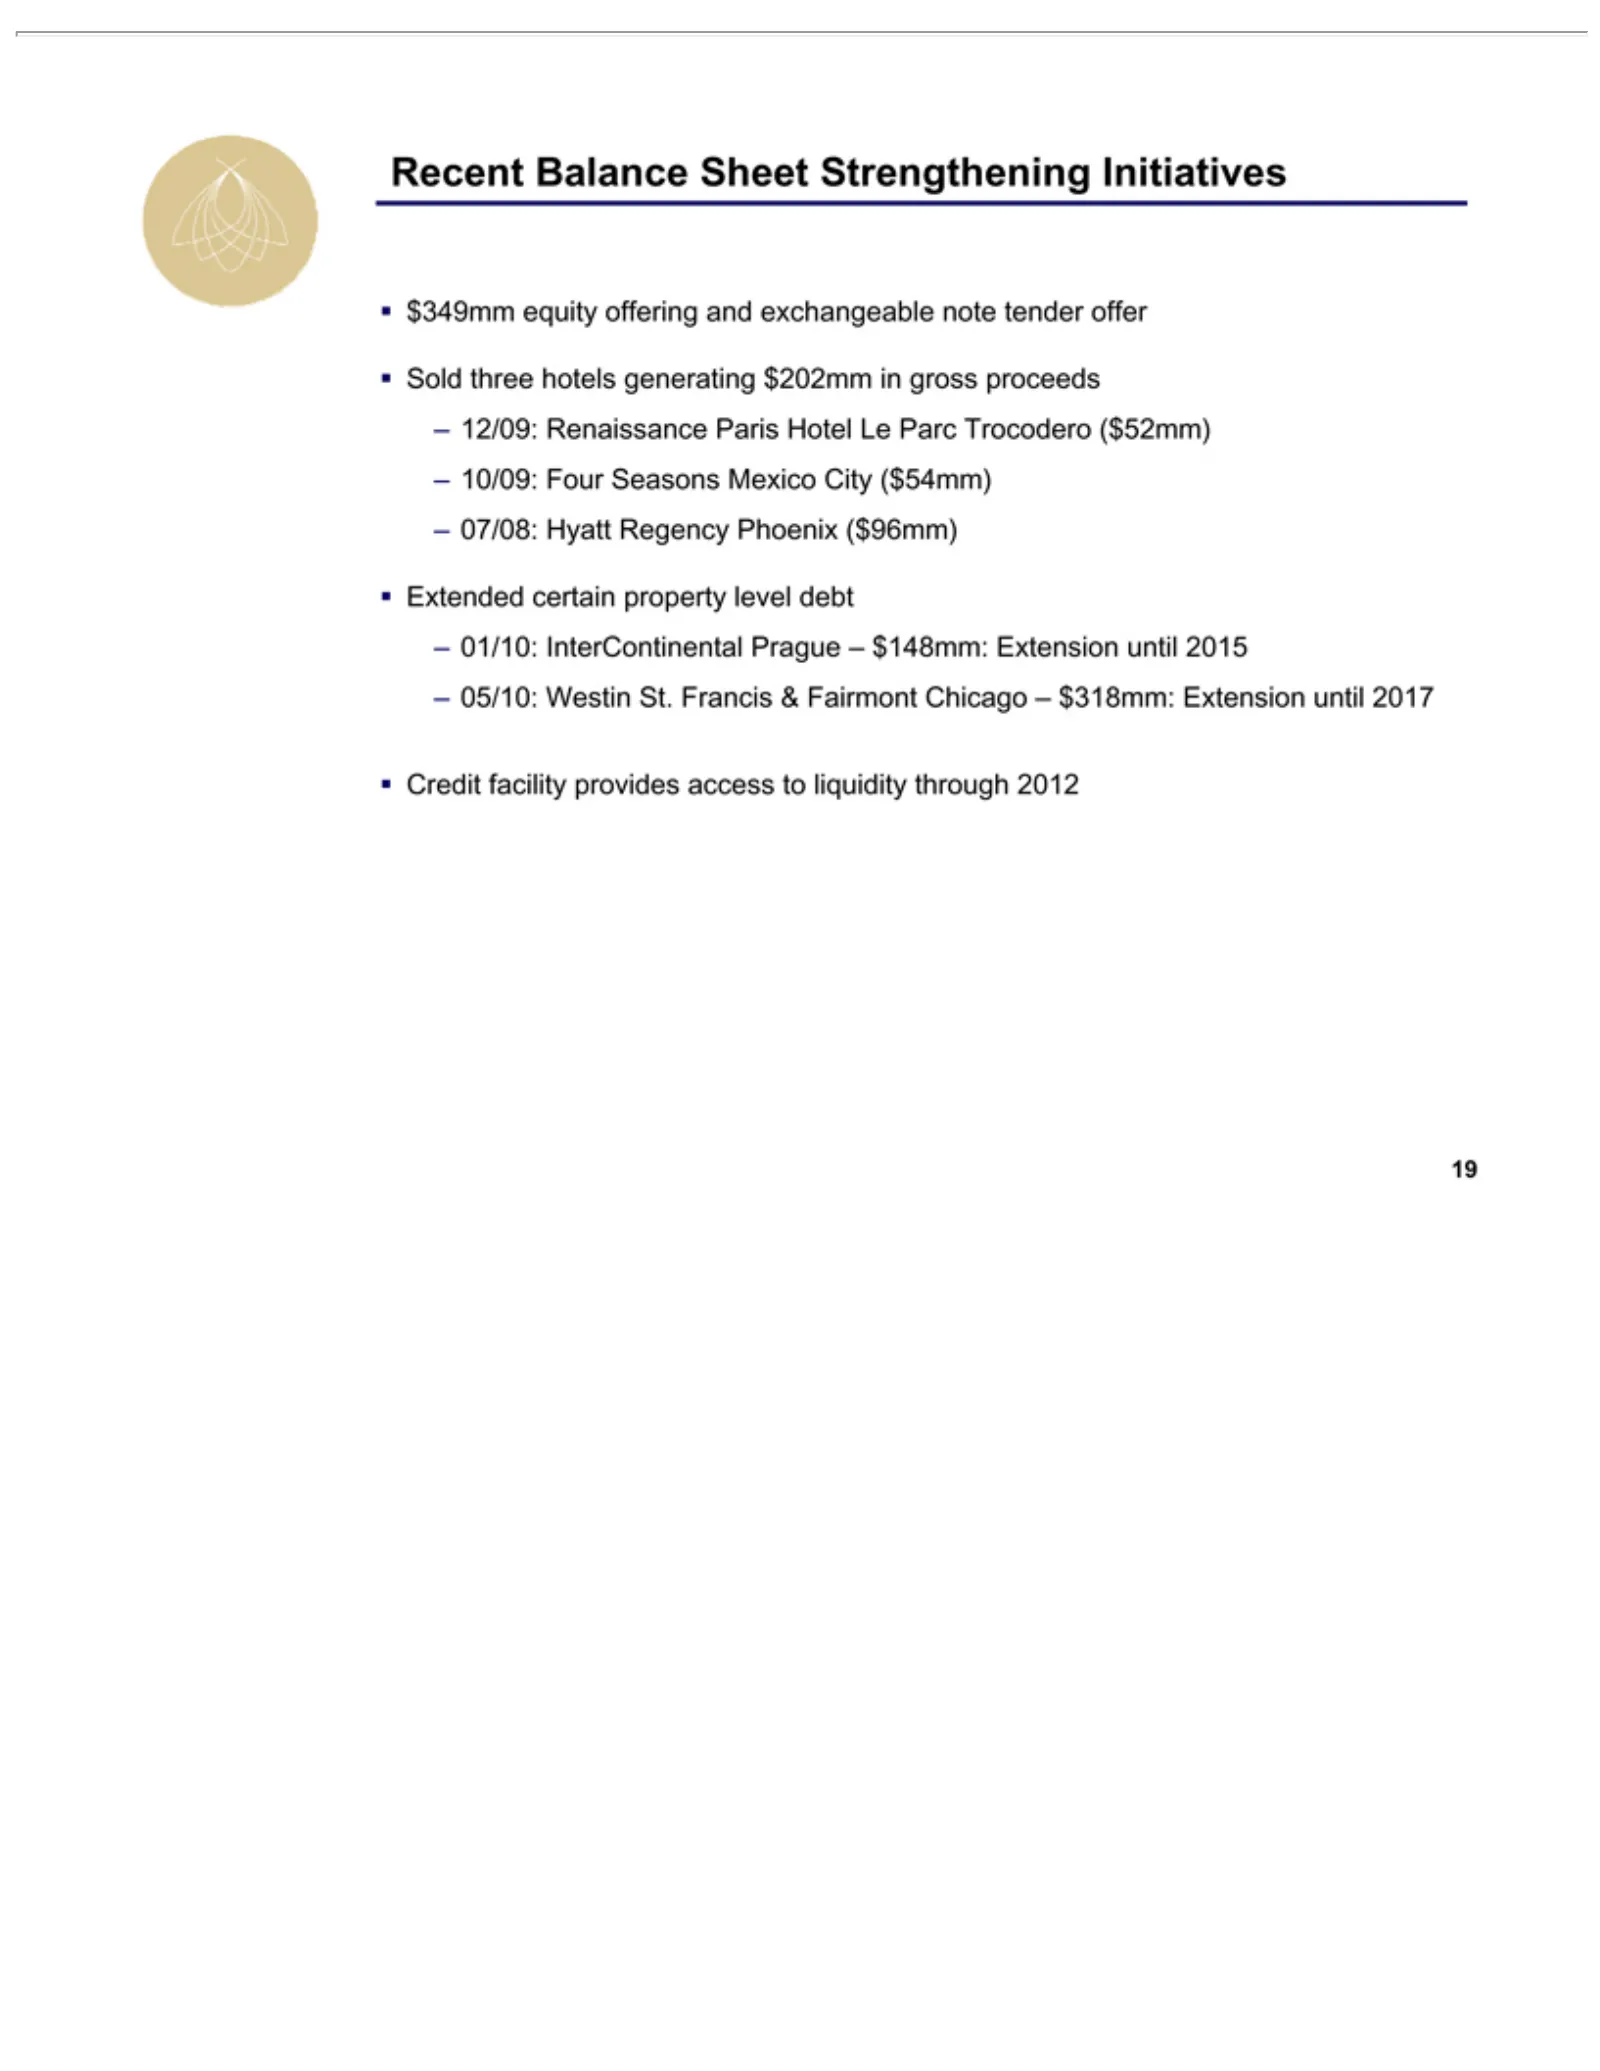
•–Recent 19 $349mm Sold Extended Credit 12/09: 10/09: 07/08: 01/10: 05/10: three Balance facility Westin Renaissance Four Hyatt InterContinental equity certain hotels Seasons Regency provides Sheet St.offering generating property Francis Paris Strengthening Mexico Phoenix access Prague and Hotel &le
Slide 20: Debt Maturity Profile
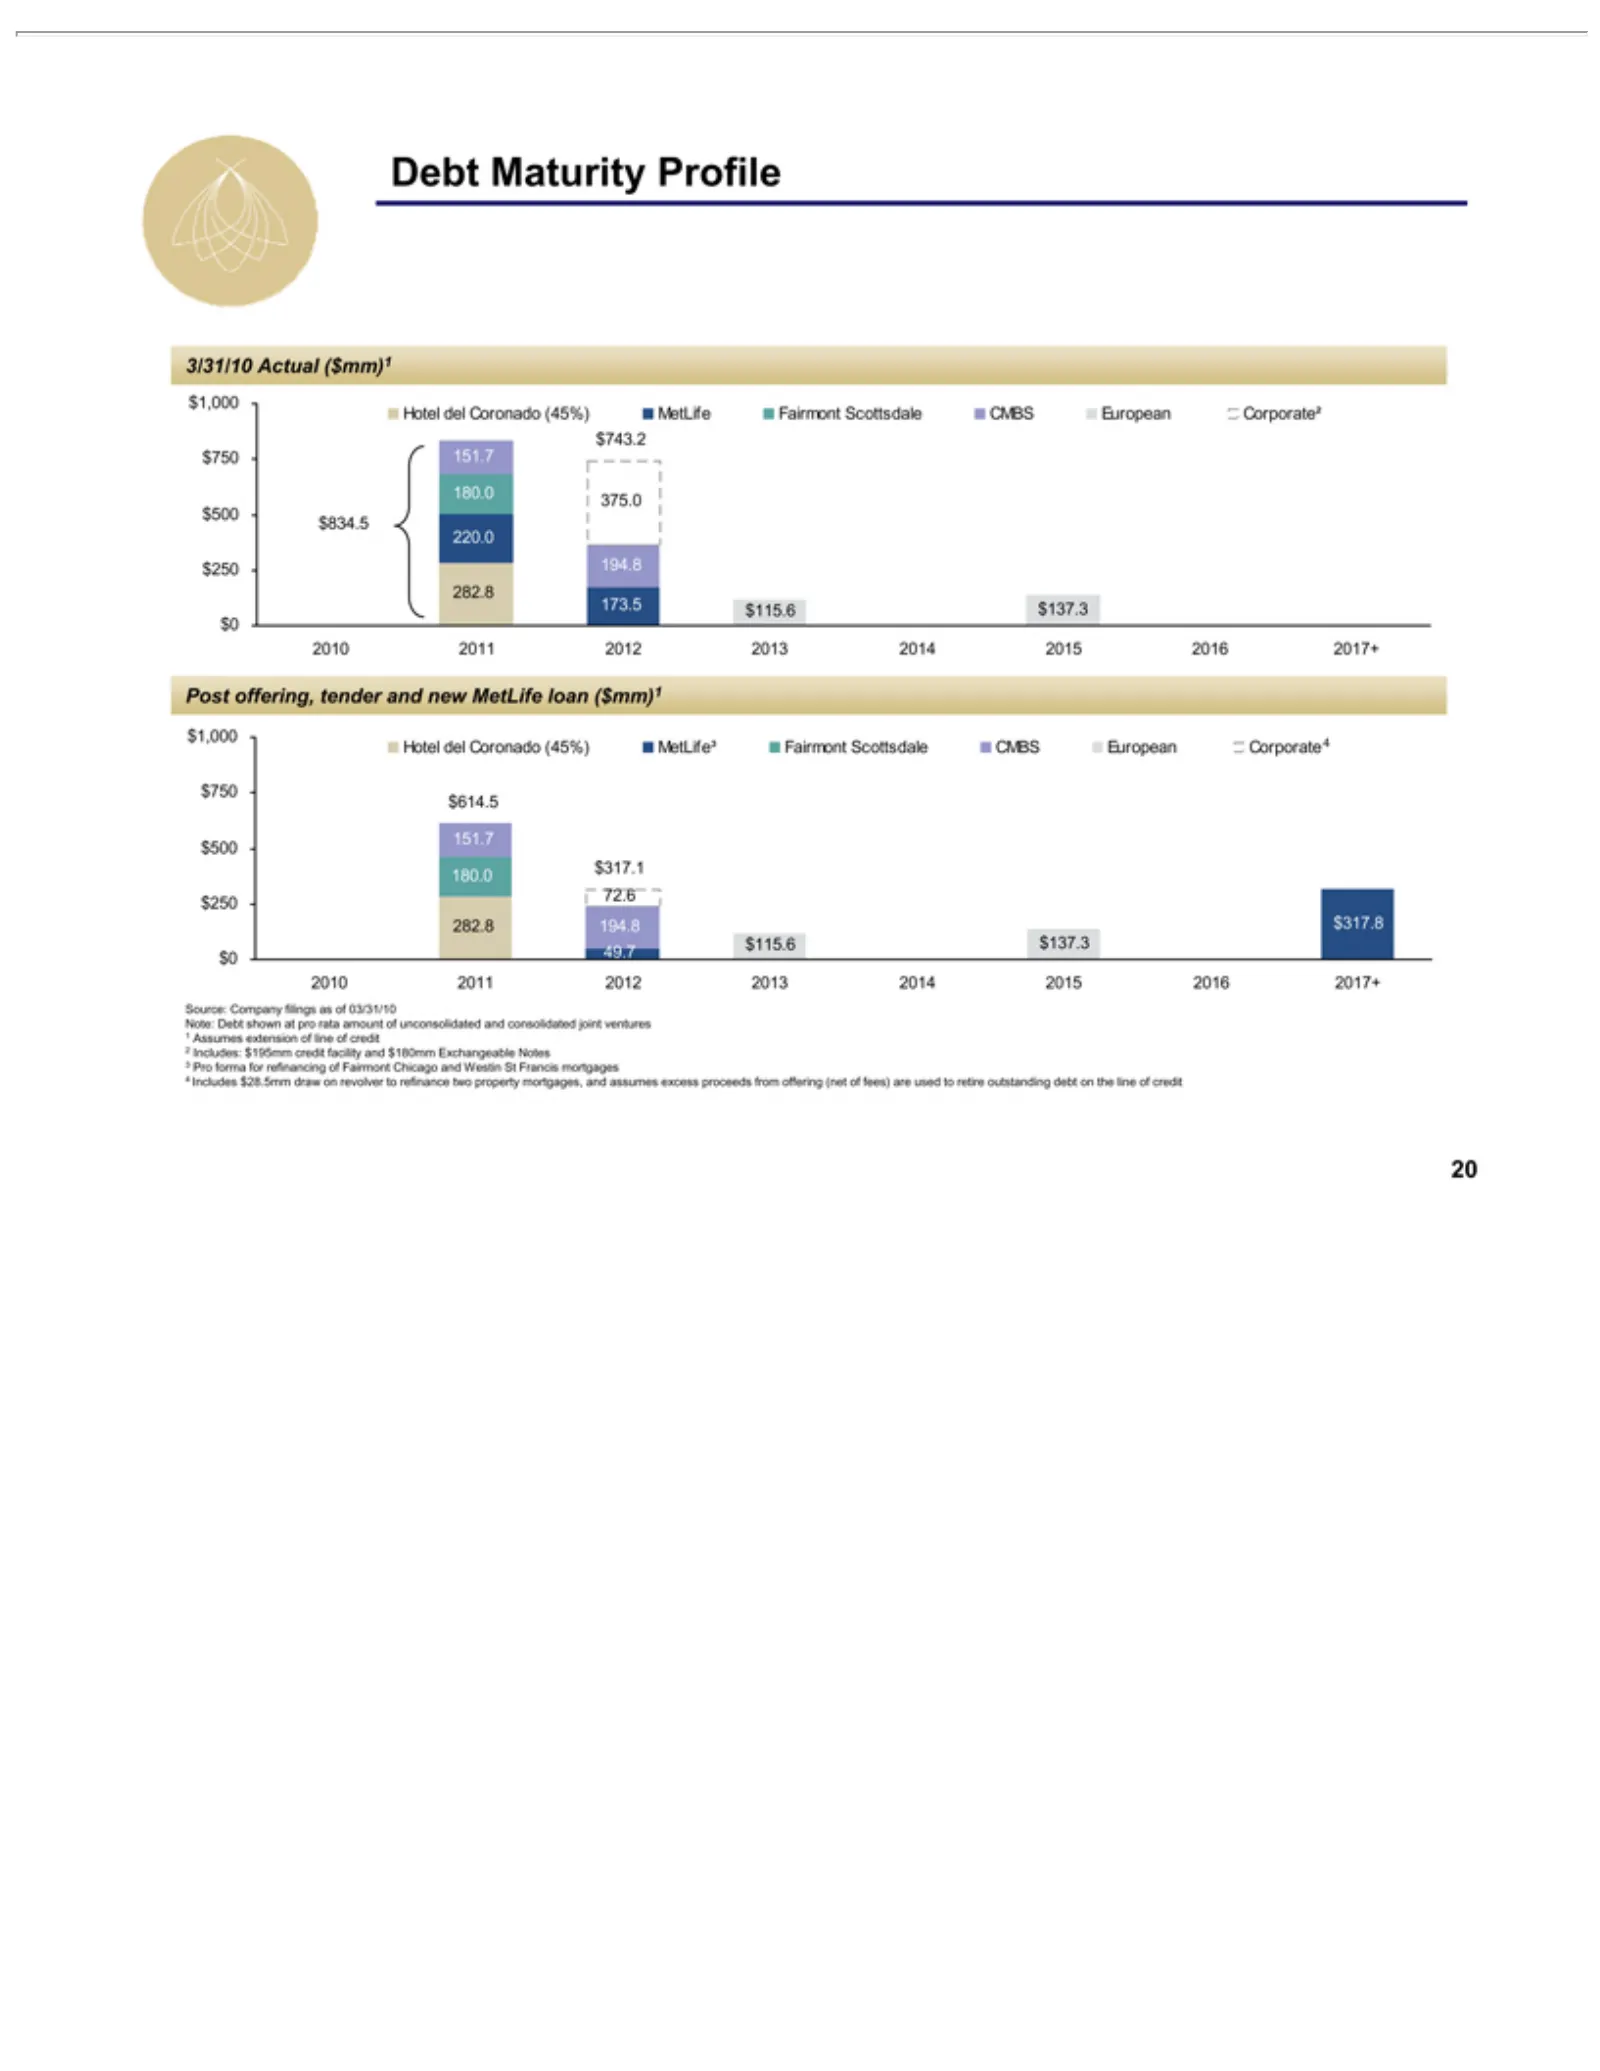
Debt 3/31/10 $834.5 $743.2 Post Hotel $1,000 $614.5 $317.1 $115.6 2010 Source: 4321Note: 20 Assumes Includes: Pro Includes offering, Maturity 2011 forma del Debt $137.3 {Actual 375.0 $750 151.7 72.6 Company 151.7 Coronado $28.5mm 2012 extension shown $195mm 194.8 for $500 194.8 180.0 tender Profile
Slide 21: Key Objectives
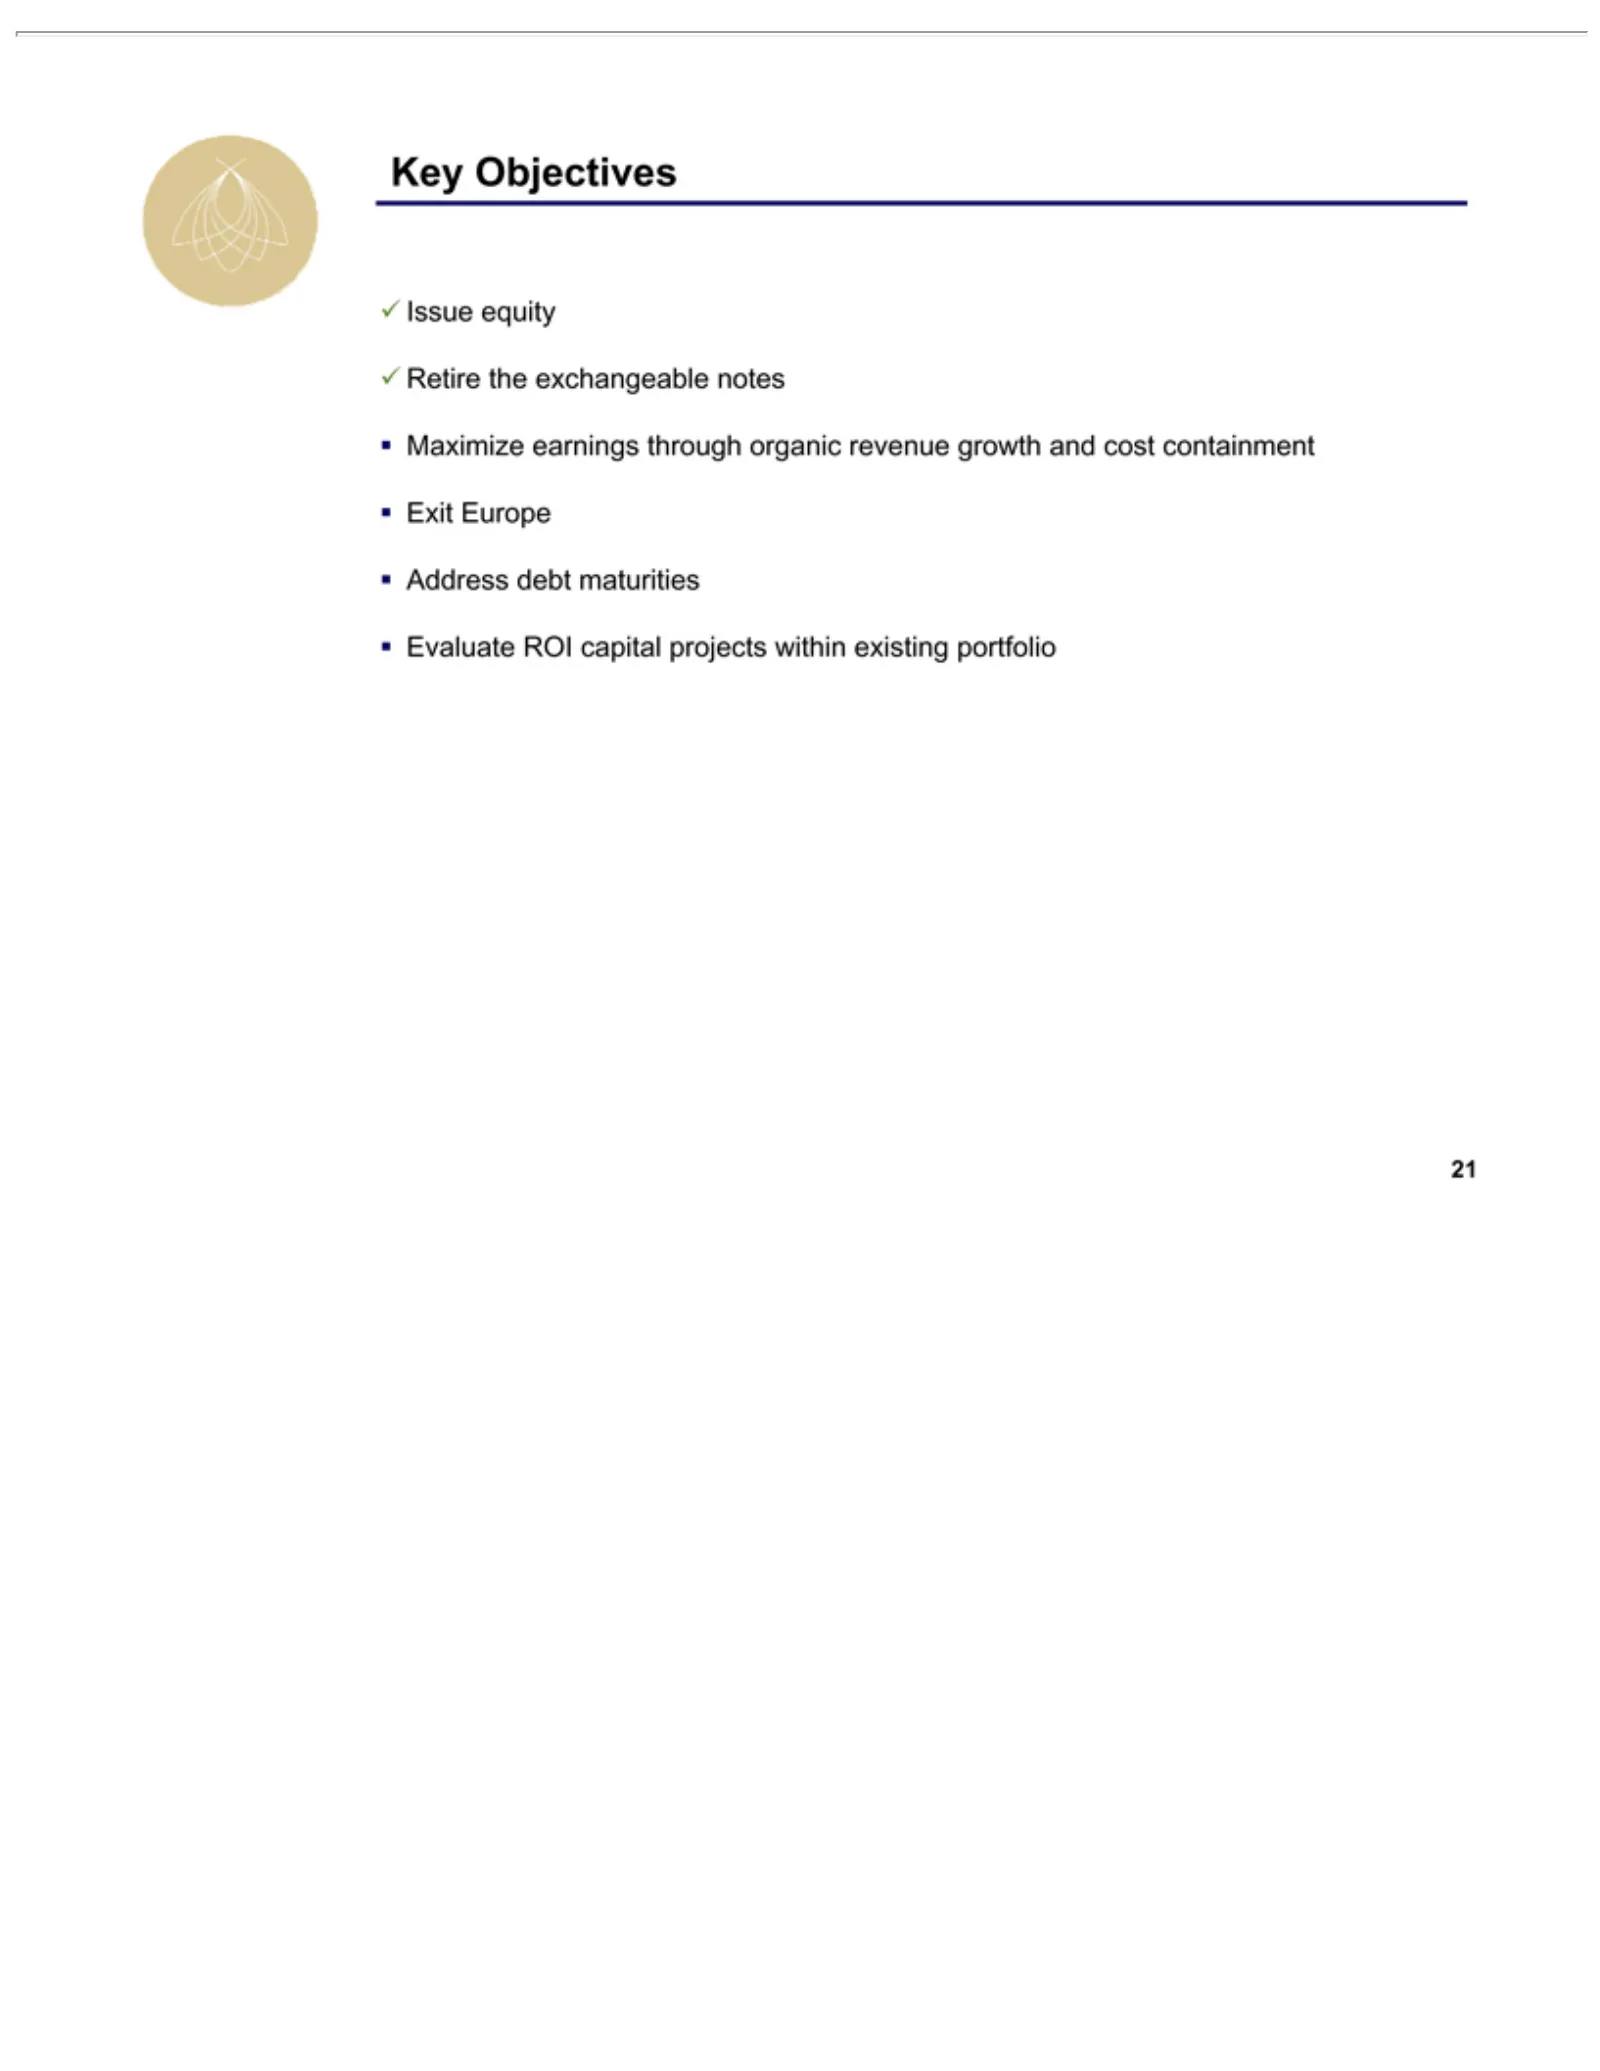
•üKey 21 Address Maximize Exit Evaluate Issue Retire Objectives Europe equity the debt ROI earnings exchangeable maturities capitalthrough projects notes organic withinrevenue existinggrowth portfolio and cost containment
Slide 22: Strategic Hotels & Resorts
Hotels & Resorts STRATEGIC
Source: SEC EDGAR · 8-K filed Jun 9, 2010
More decks from Strategic Hotels and Resorts Inc
 Investor Presentation (June 2015)43 slides · Jun 1, 2015
 Investor Presentation (February 2015)43 slides · Feb 24, 2015
 Investor Presentation (January 2015)44 slides · Jan 26, 2015
 Investor Presentation (November 2014)50 slides · Nov 5, 2014
 Investor Presentation (October 2014)50 slides · Oct 3, 2014
 Investor Day (September 2014)67 slides · Sep 22, 2014