PT Sarana Menara Nusantara Tbk · IDX:TOWR
PT Sarana Menara Nusantara Tbk — Q2 2012 Earnings Presentation
15 slides from PT Sarana Menara Nusantara Tbk's earnings presentation, August 2012
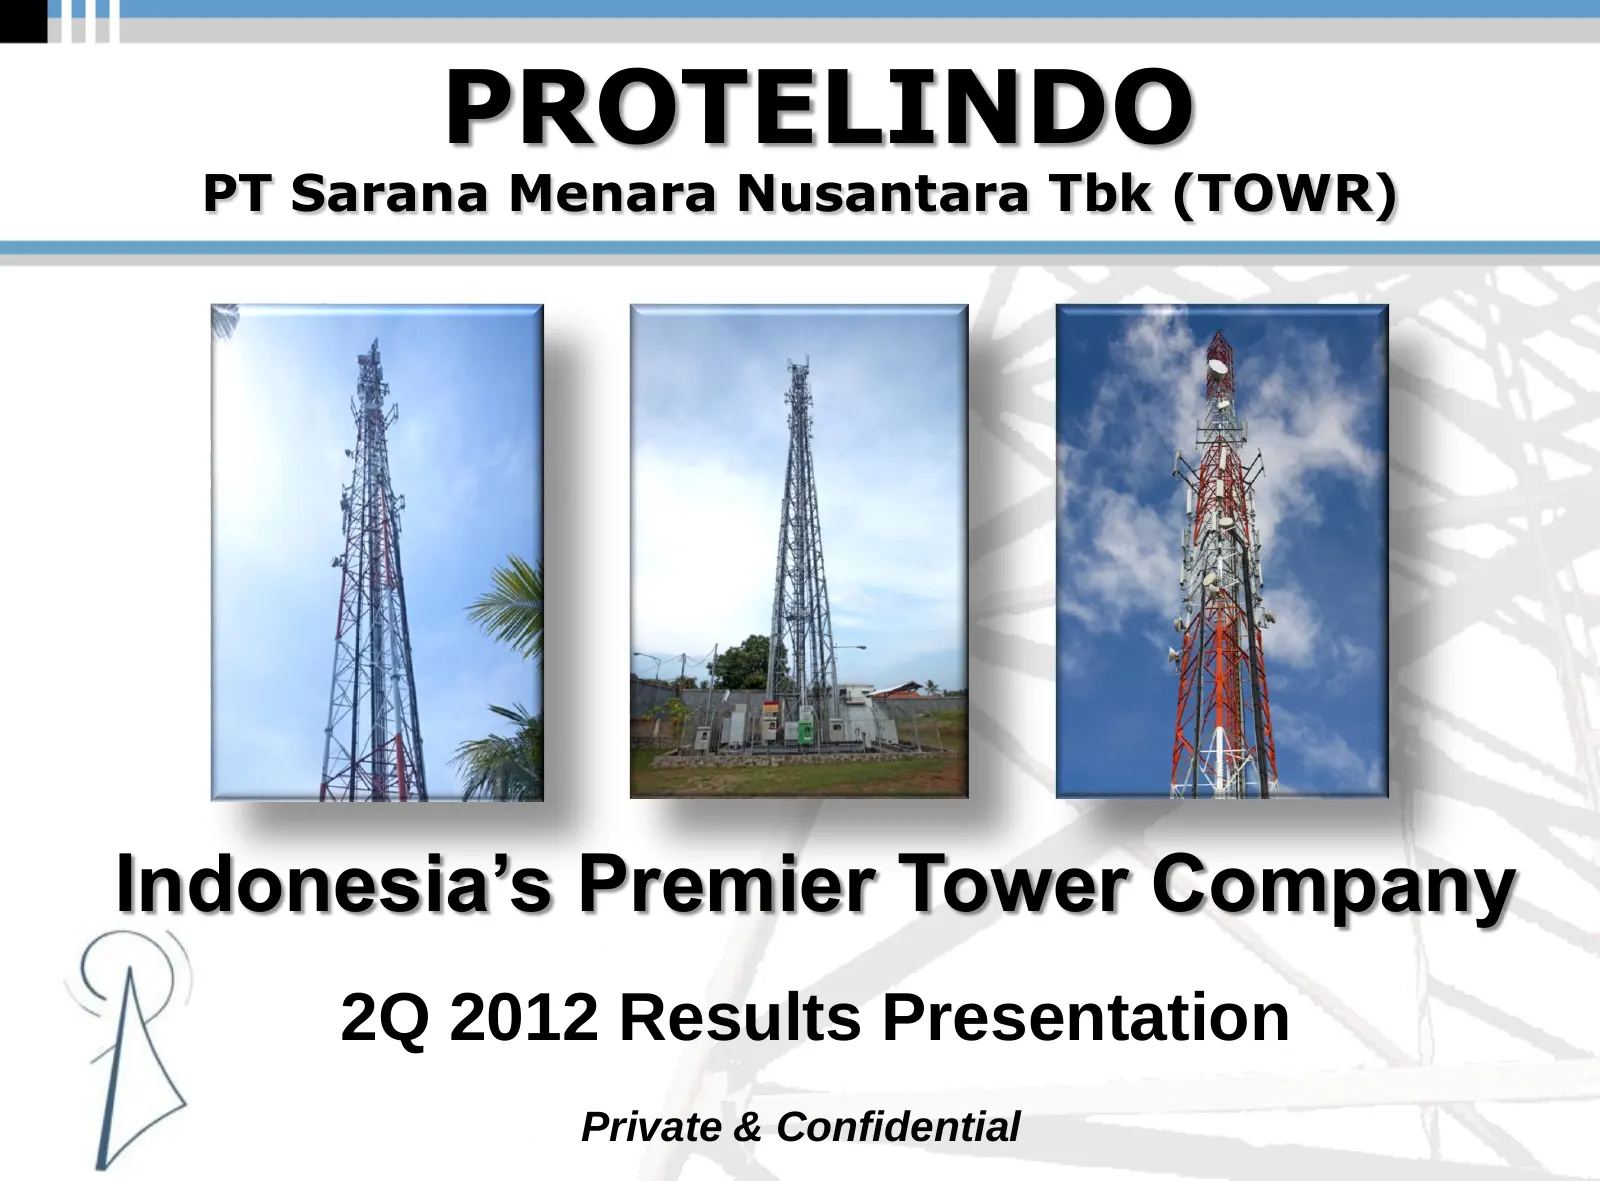
Slide 1: Indonesia's Premier Tower Company: 2Q 2012 Results Presentation
PROTELINDO PT Sarana Menara Nusantara Tbk (TOWR) Indonesia’s Premier Tower Company 2Q 2012 Results Presentation Private & Confidential
Slide 2: Disclaimer
Disclaimer These materials have been prepared by PT Sarana Menara Nusantara, Tbk. (the “Company”) and have not been independently verified. No representation or warranty, expressed or implied, is made and no reliance should be placed on the accuracy, fairness or completeness of the information prese
Slide 3: Agenda
Agenda Financial Performance Operational Performance and Market Data Balance Sheet 2012 Full Year Outlook Revision Q&A 2
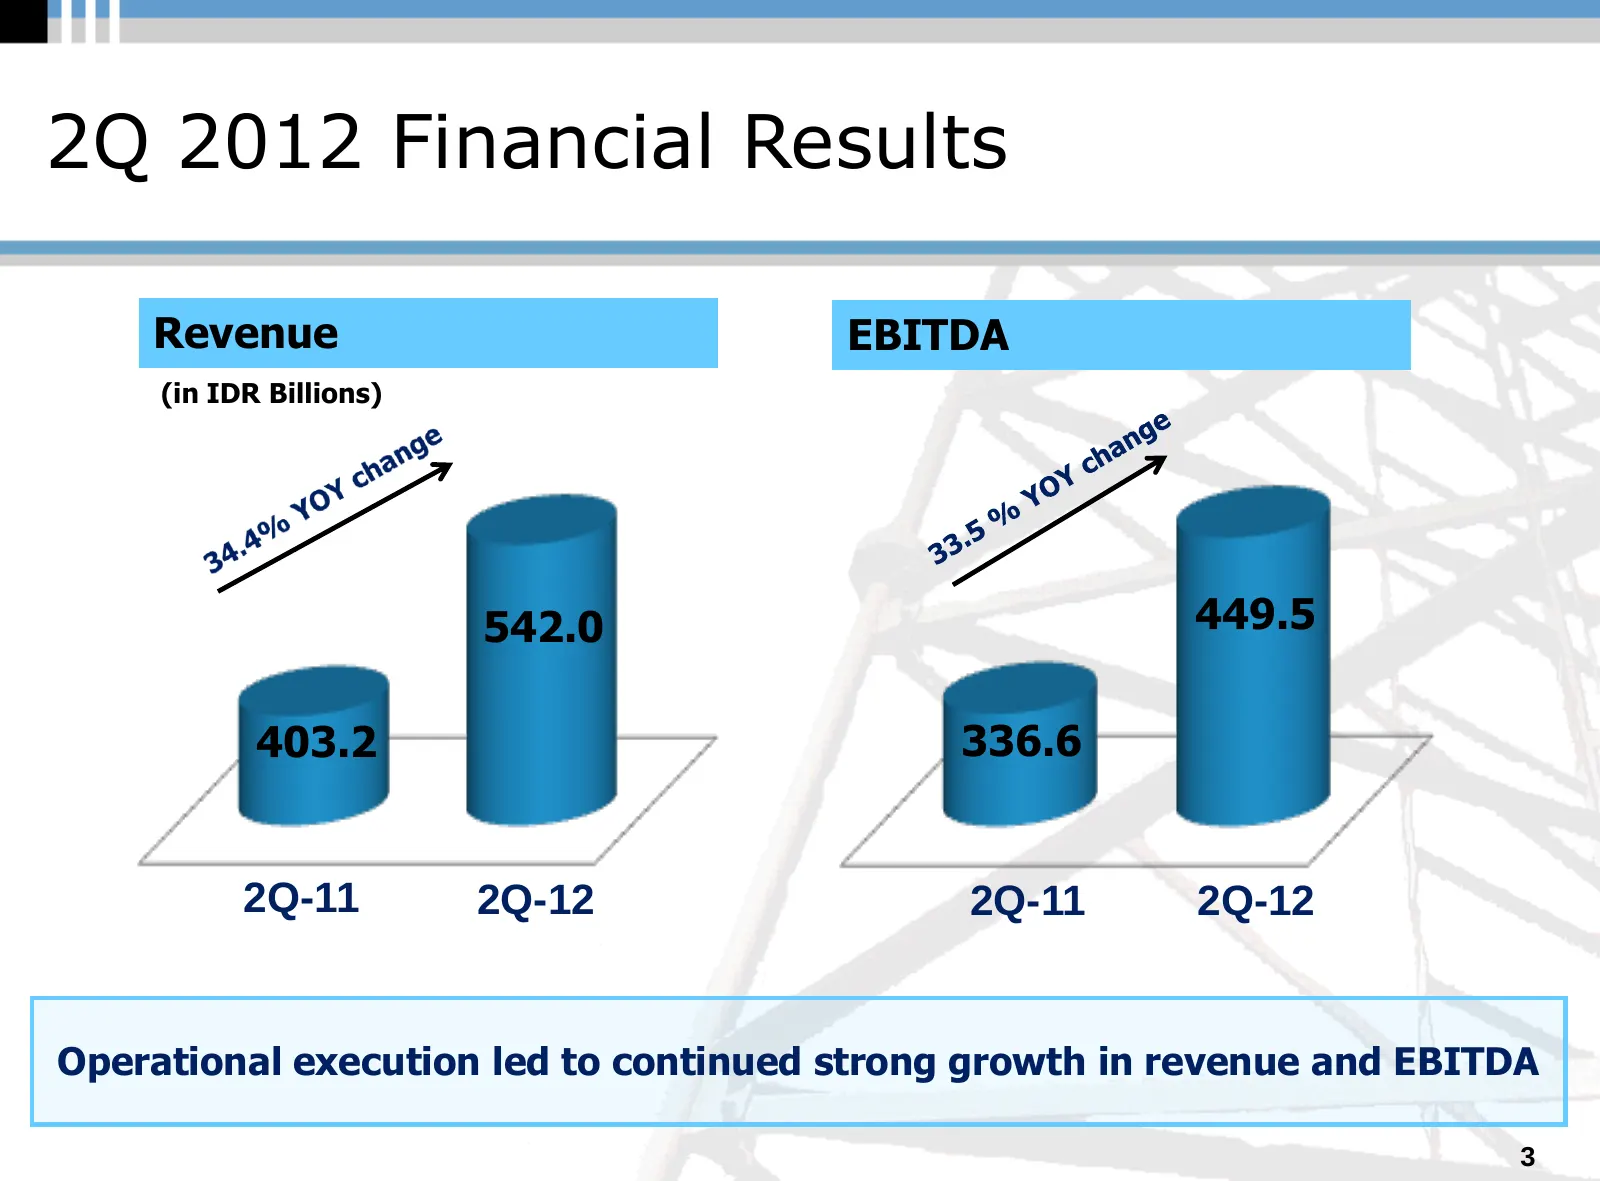
Slide 4: 2Q 2012 Financial Results
2Q 2012 Financial Results Revenue EBITDA (in IDR Billions) 542.0 449.5 403.2 336.6 2Q-11 2Q-12 2Q-11 2Q-12 Operational execution led to continued strong growth in revenue and EBITDA 3
Slide 5: Strong tower and tenant growth
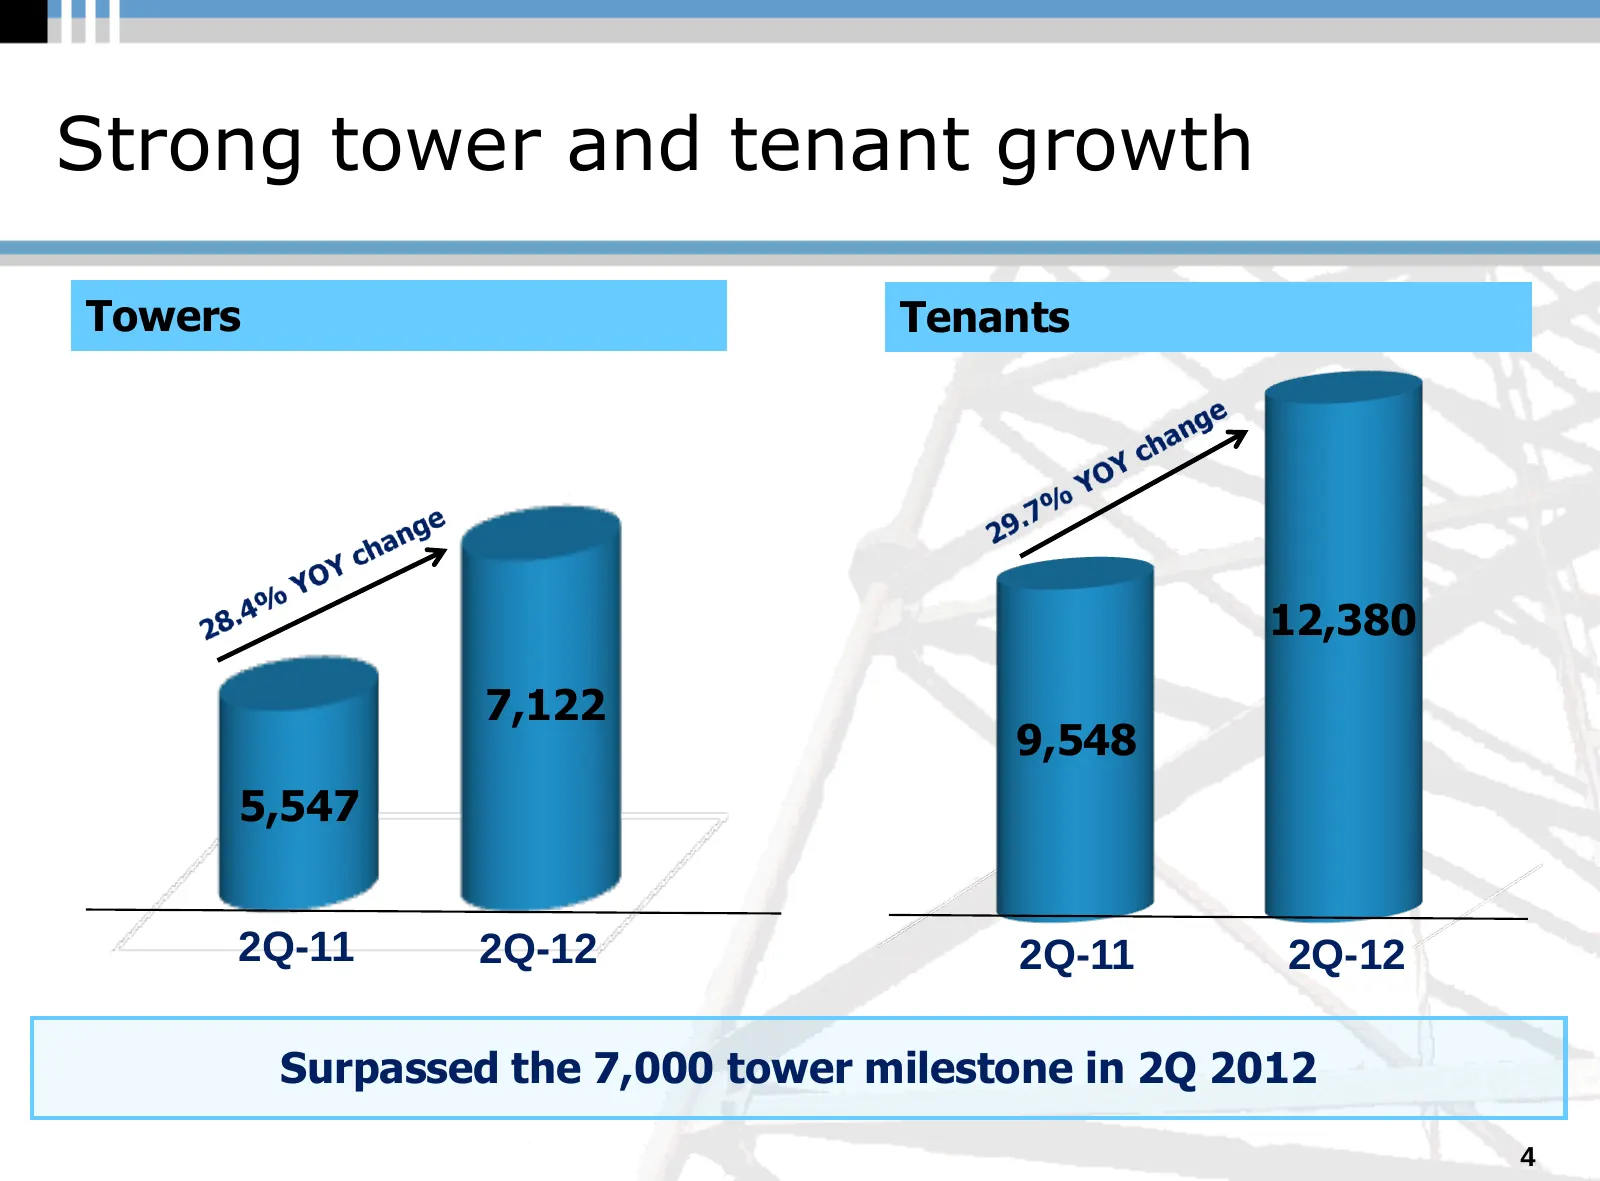
Strong tower and tenant growth Towers Tenants Tenants 12,380 7,122 9,548 5,547 2Q-11 2Q-12 2Q-11 2Q-12 Surpassed the 7,000 tower milestone in 2Q 2012 4
Slide 6: Disciplined portfolio growth
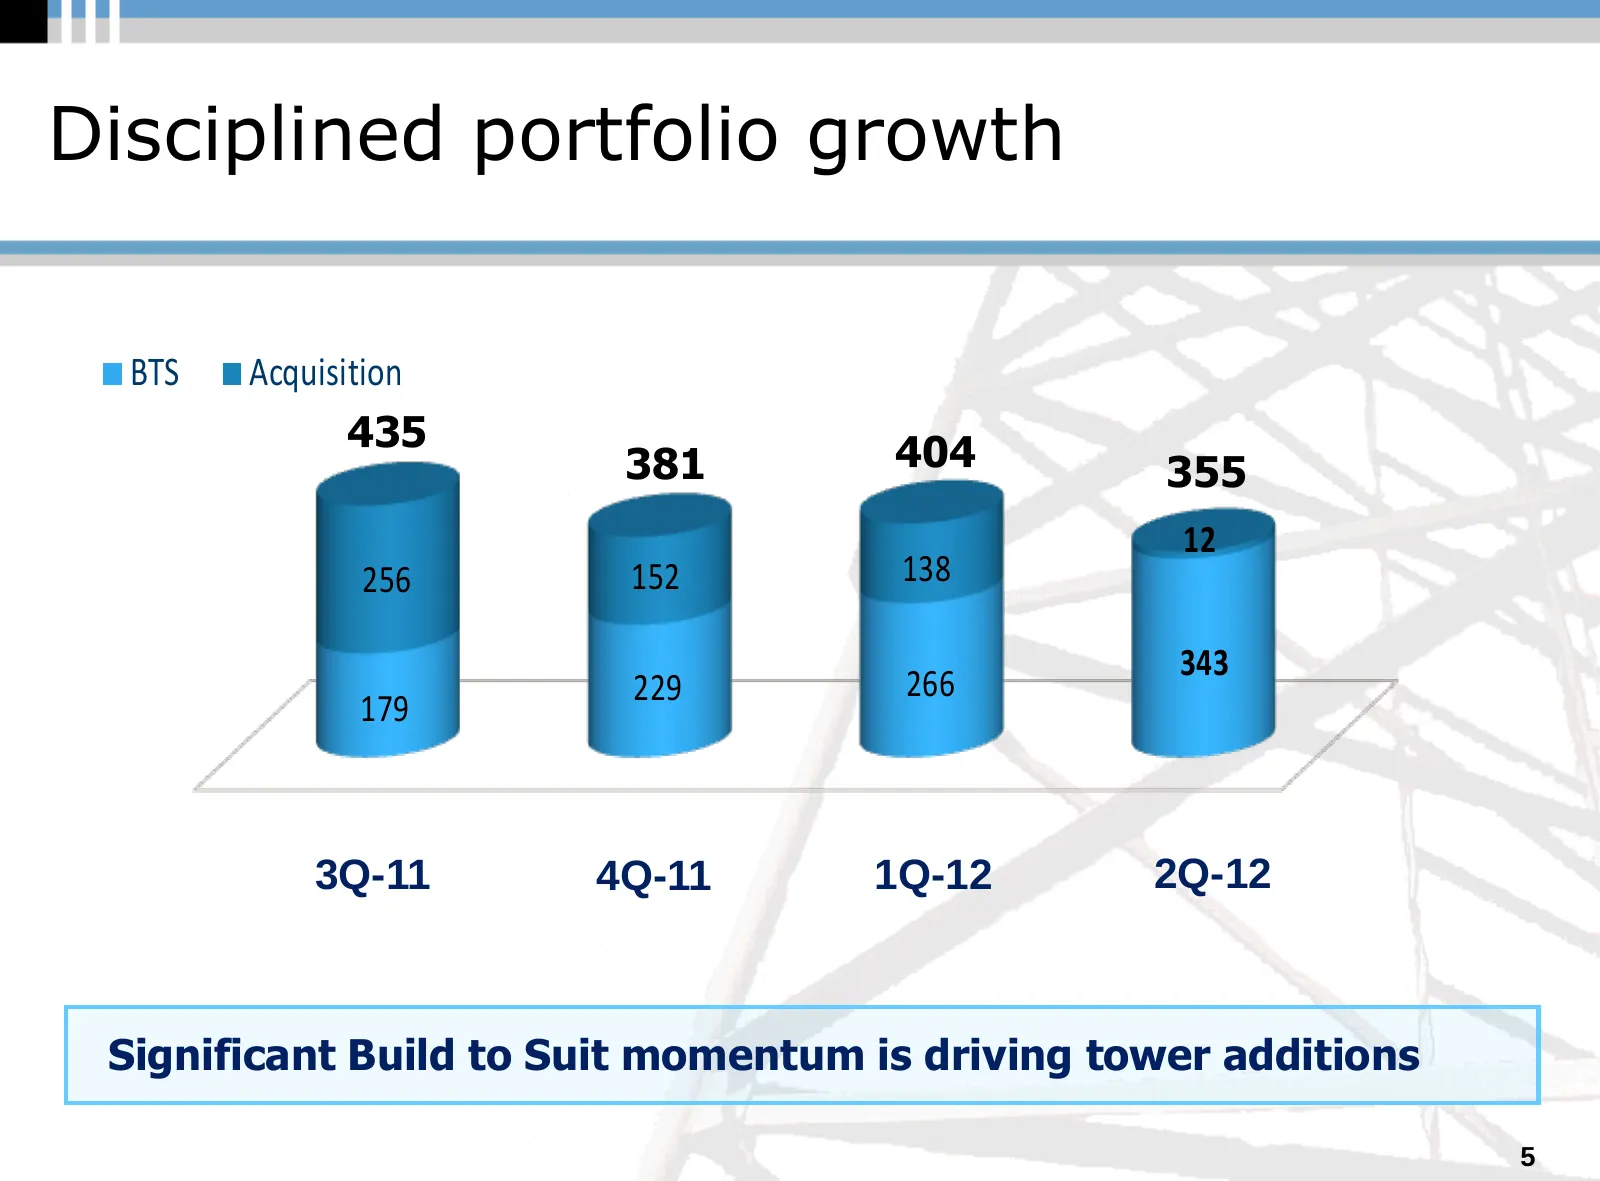
Disciplined portfolio growth BTS Acquisition 435 404 381 355 12 256 152 138 343 229 266 179 3Q-11 4Q-11 1Q-12 2Q-12 Significant Build to Suit momentum is driving tower additions 5
Slide 7: Colocation new revenue mix for 1H 2012
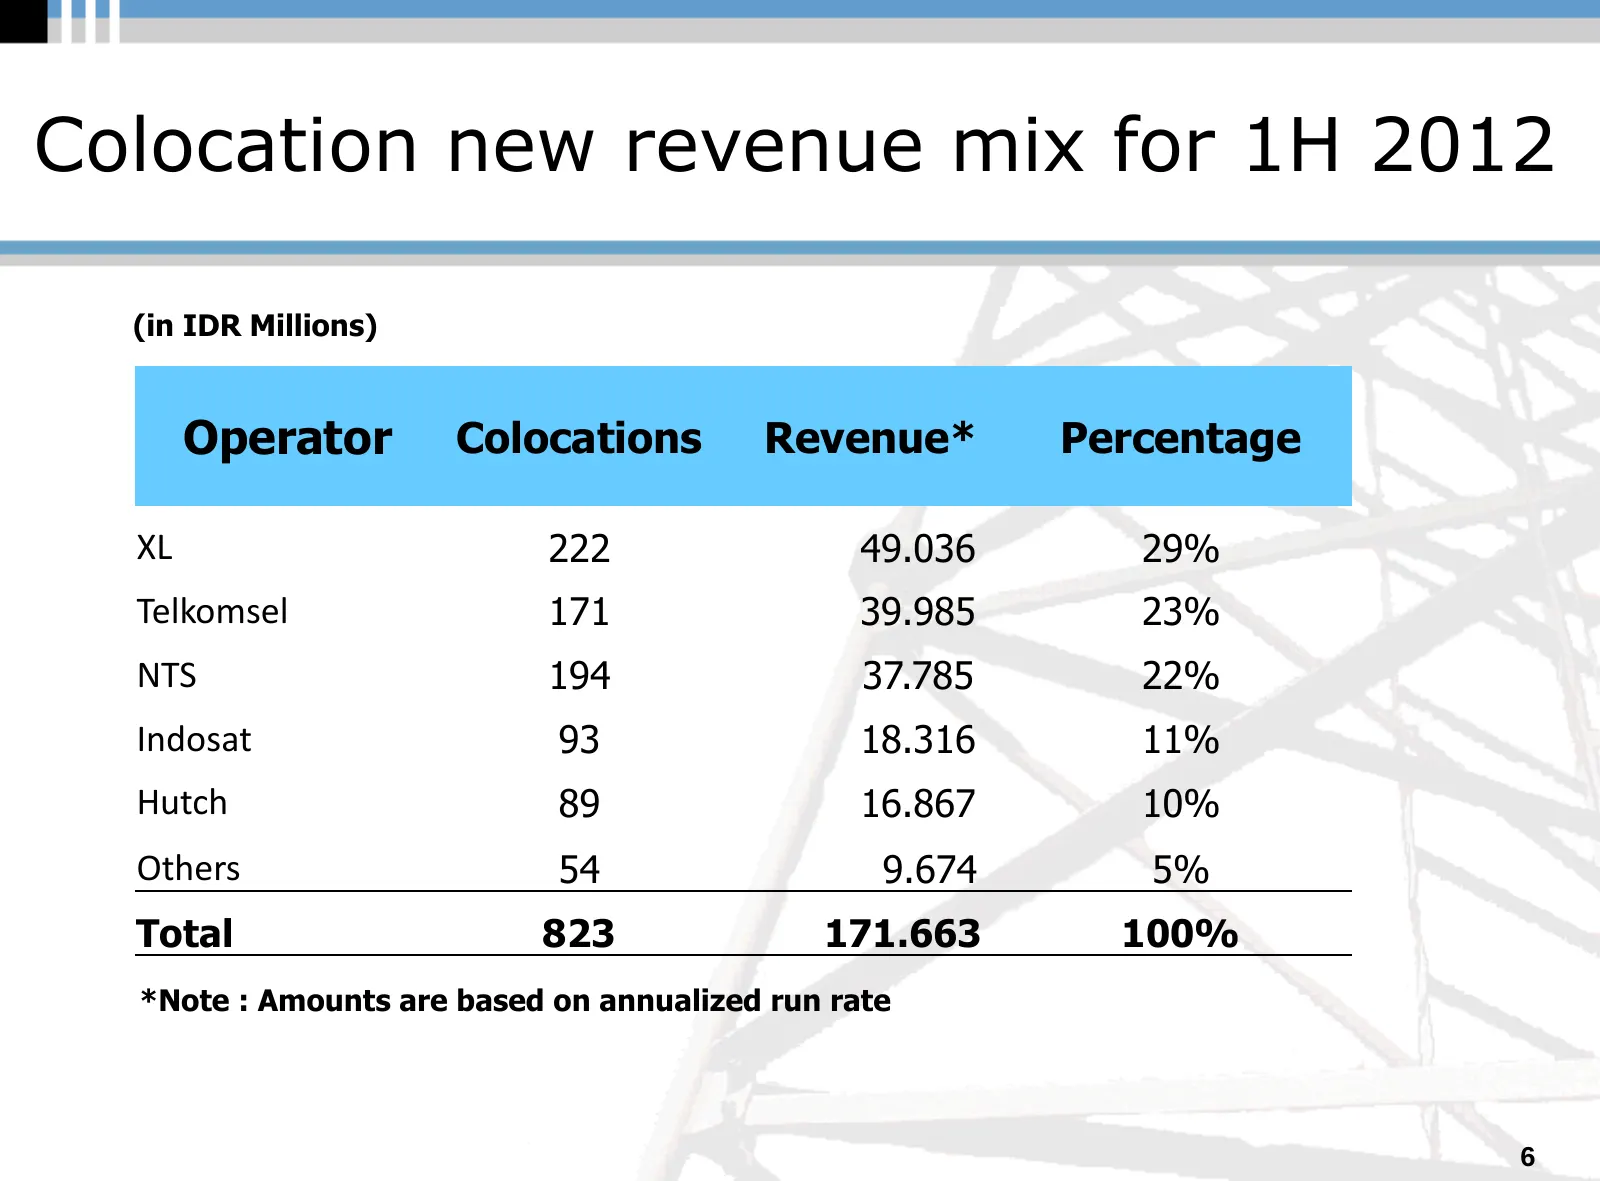
Colocation new revenue mix for 1H 2012 (in IDR Millions) Operator Colocations Revenue* Percentage XL 222 49.036 29% Telkomsel 171 39.985 23% NTS 194 37.785 22% Indosat 93 18.316 11% Hutch 89 16.867 10% Others 54 9.674 5% Total 823 171.663 100% *Note : Amounts are based on annualized run rate 6
Slide 8: Demand drivers
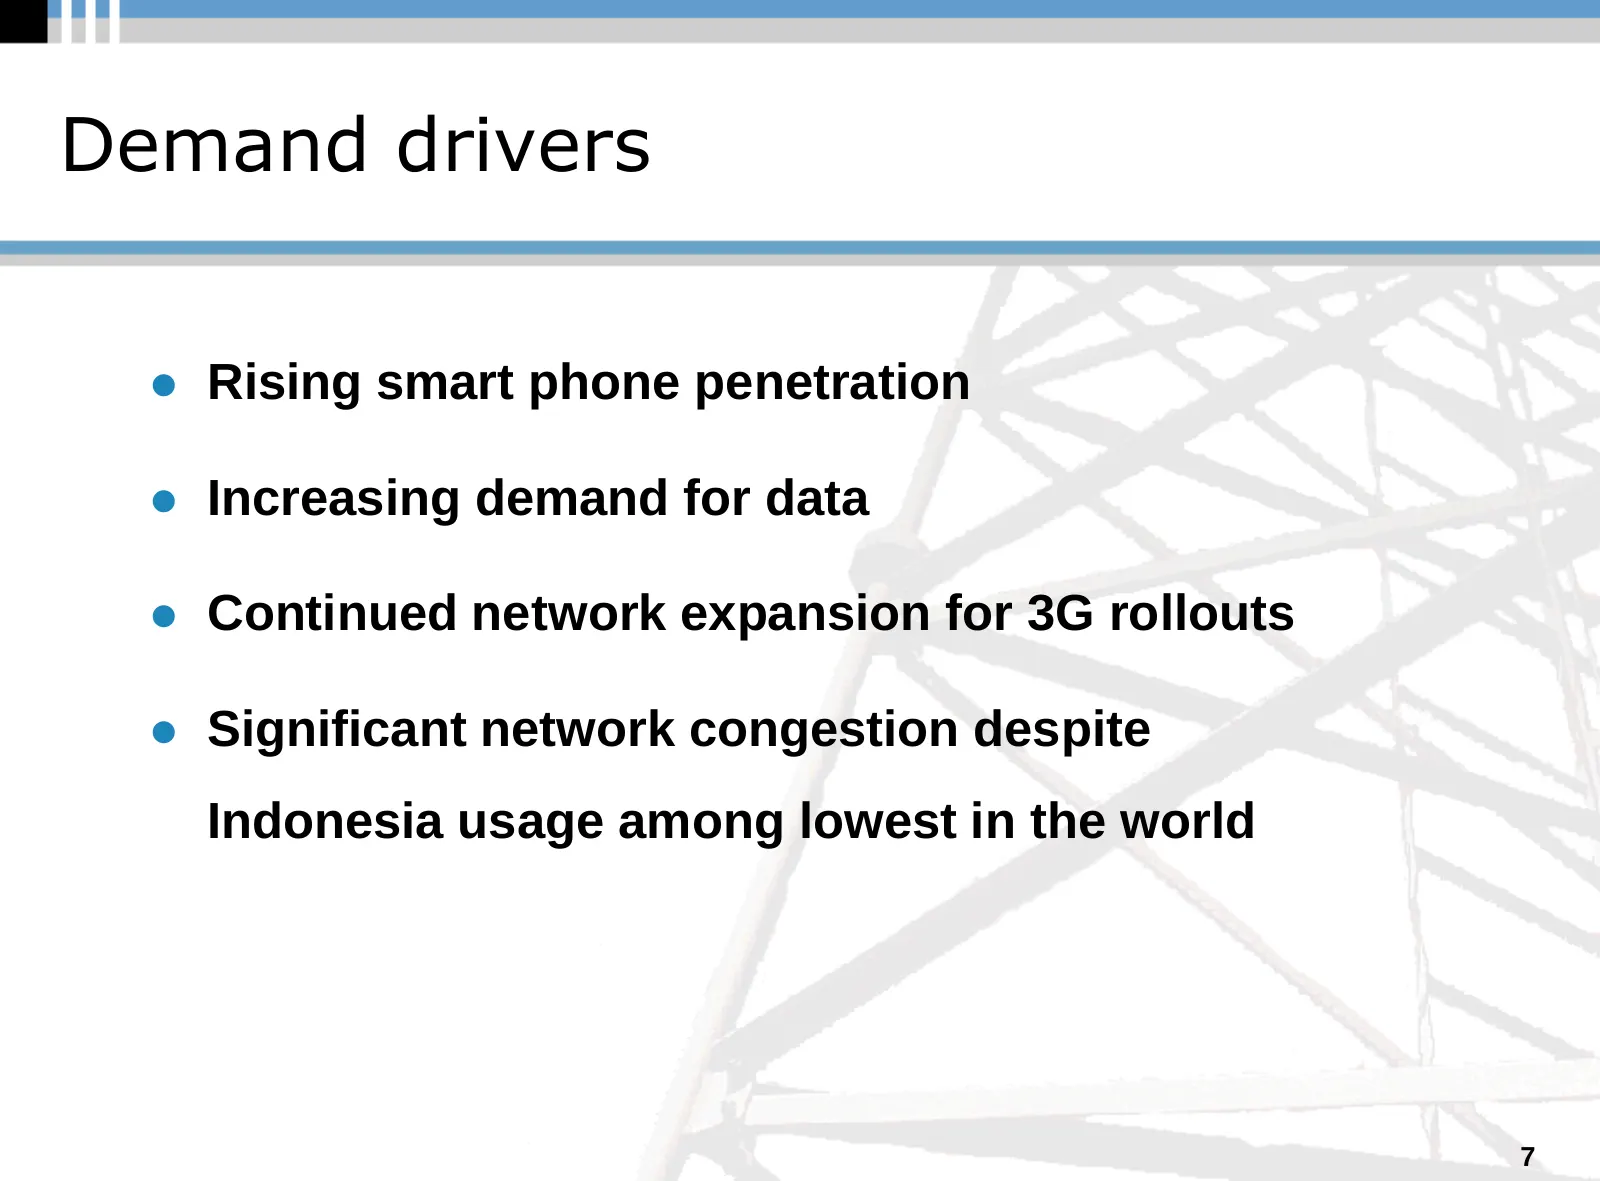
Demand drivers Rising smart phone penetration Increasing demand for data Continued network expansion for 3G rollouts Significant network congestion despite Indonesia usage among lowest in the world 7
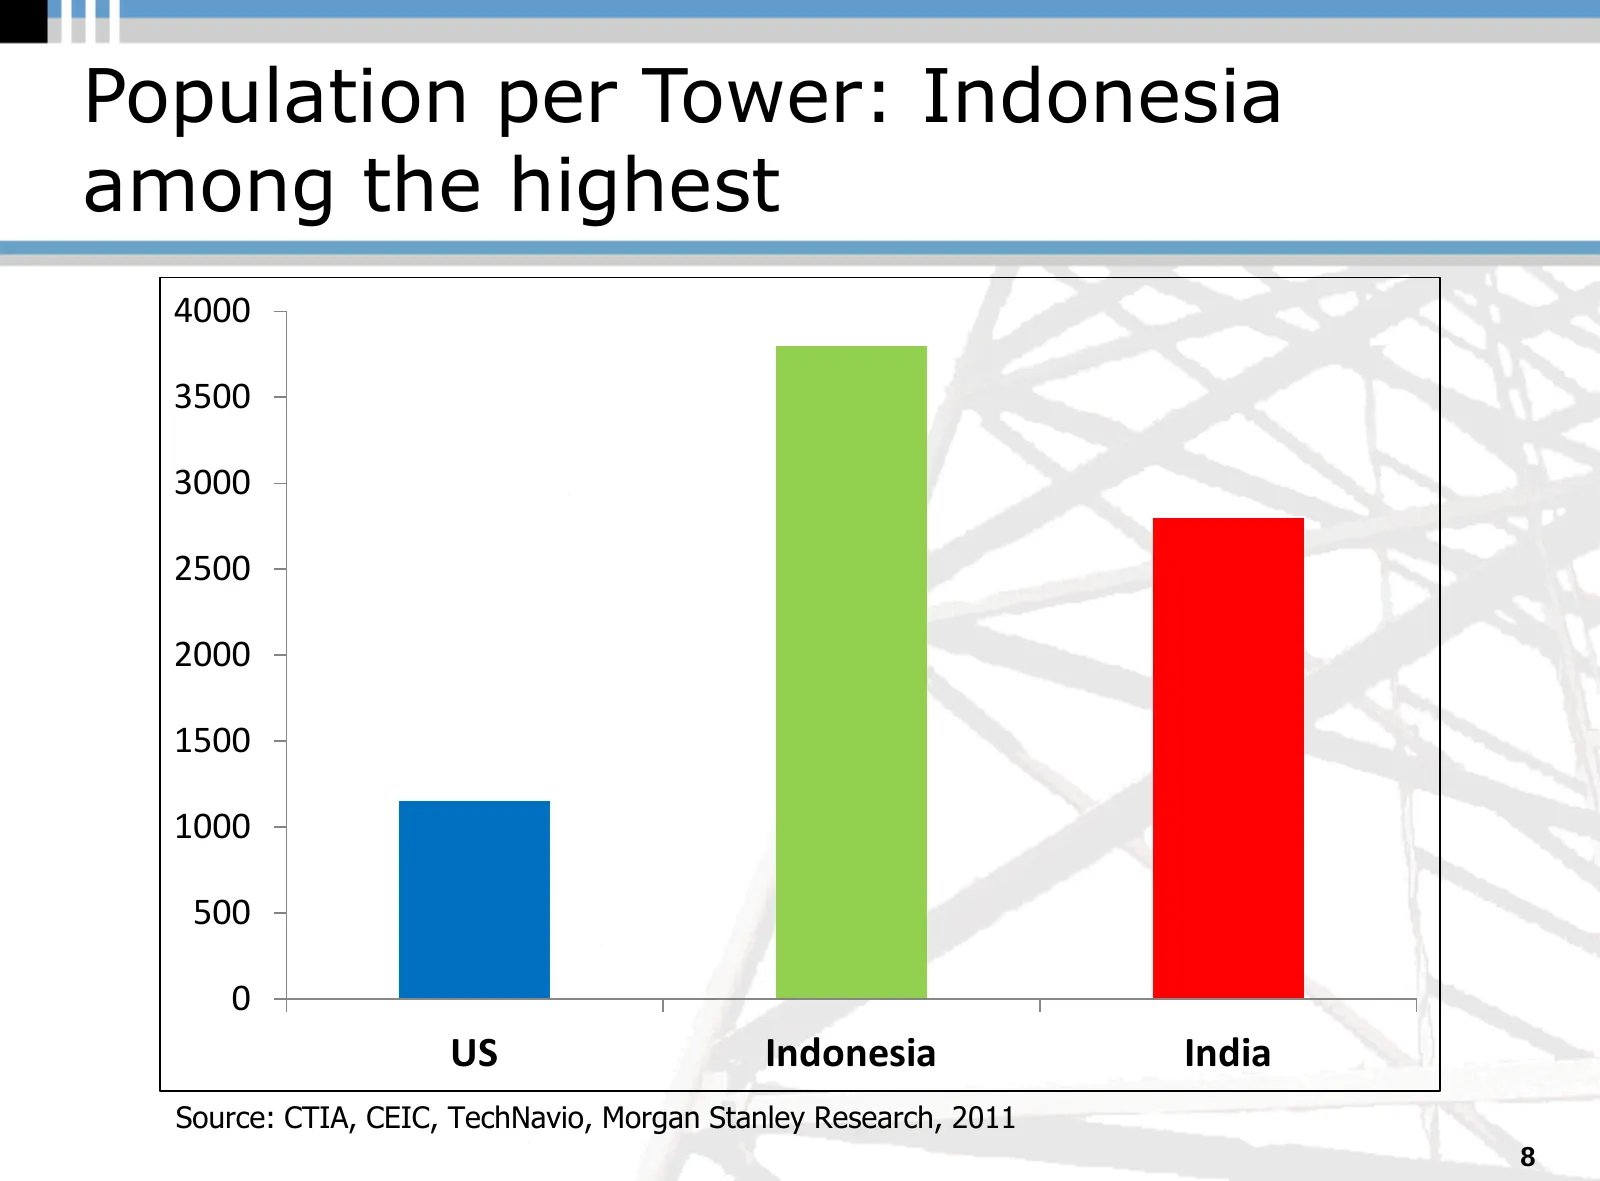
Slide 9: Population per Tower: Indonesia among the highest
Population per Tower: Indonesia among the highest 4000 3500 3000 2500 2000 1500 1000 500 0 US Indonesia India Source: CTIA, CEIC, TechNavio, Morgan Stanley Research, 2011 8
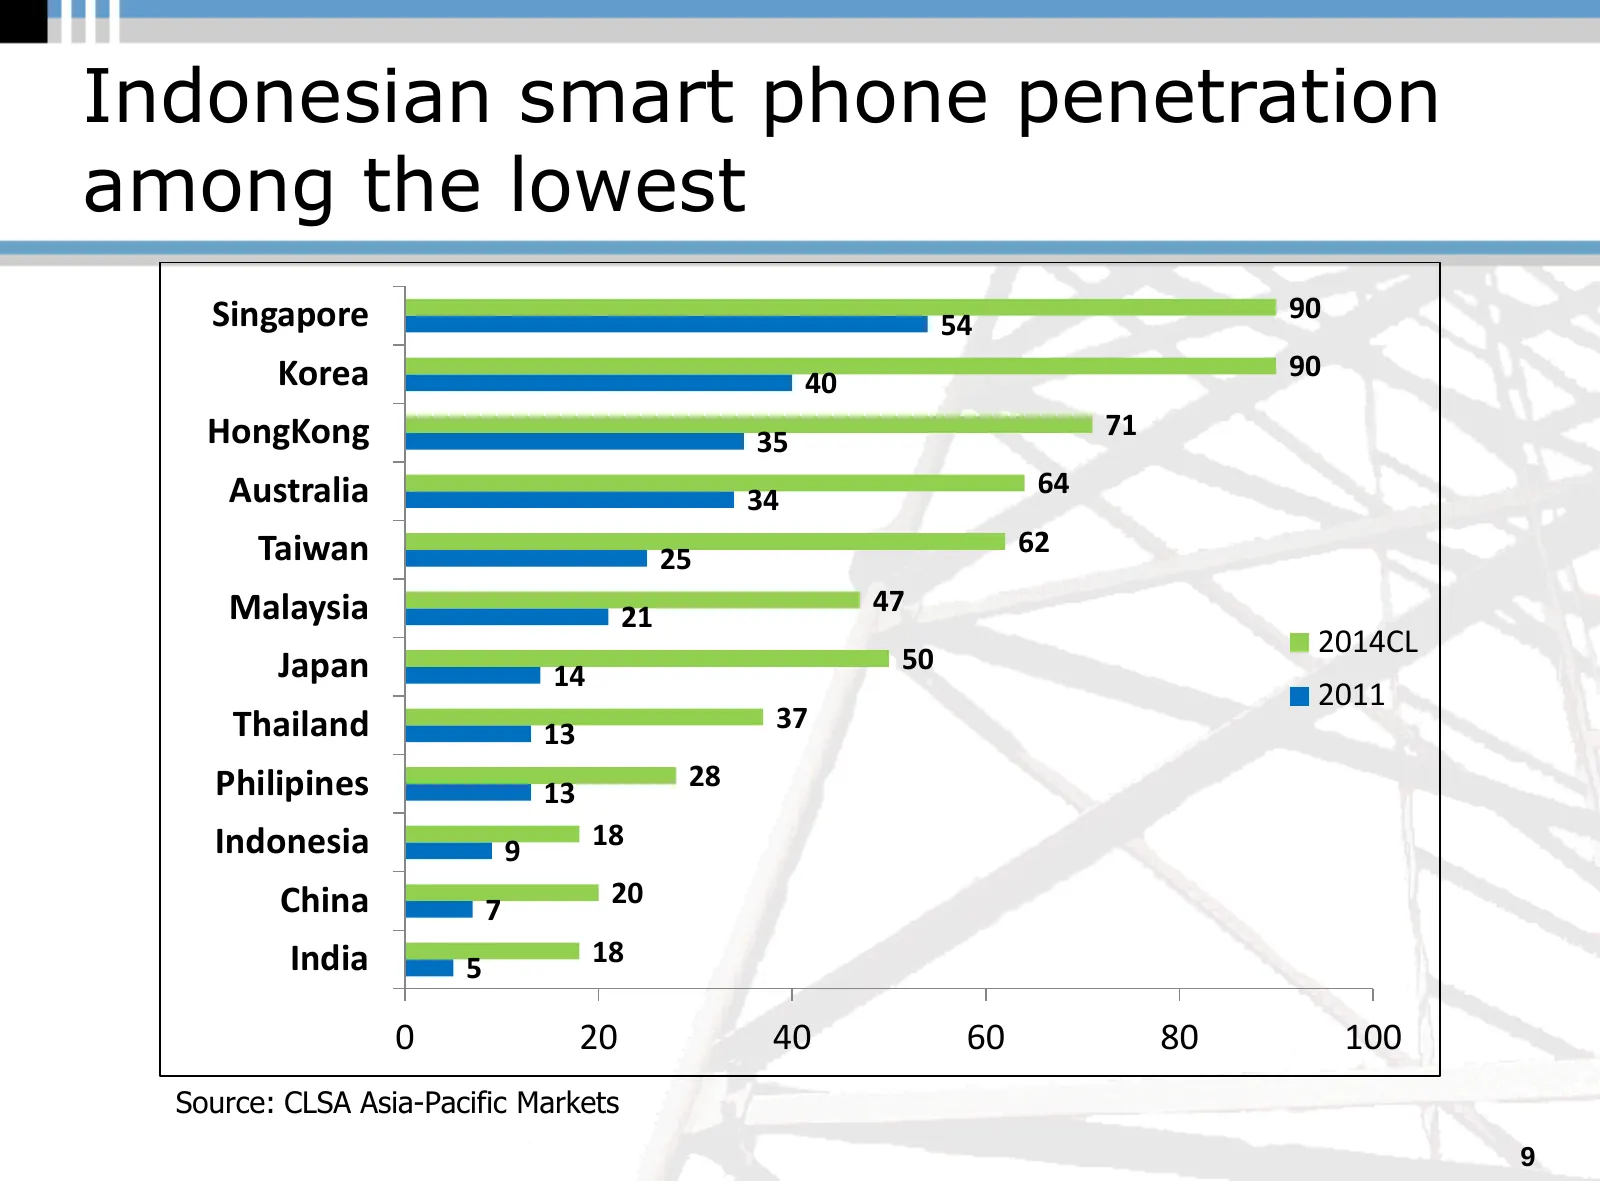
Slide 10: Indonesian smart phone penetration among the lowest
Indonesian smart phone penetration among the lowest Singapore 90 54 Korea 90 40 HongKong 71 35 Australia 64 34 Taiwan 62 25 Malaysia 47 21 2014CL Japan 50 14 2011 Thailand 37 13 Philipines 28 13 Indonesia 18 9 China 20 7 India 18 5 0 20 40 60 80 100 Source: CLSA Asia-Pacific Markets 9
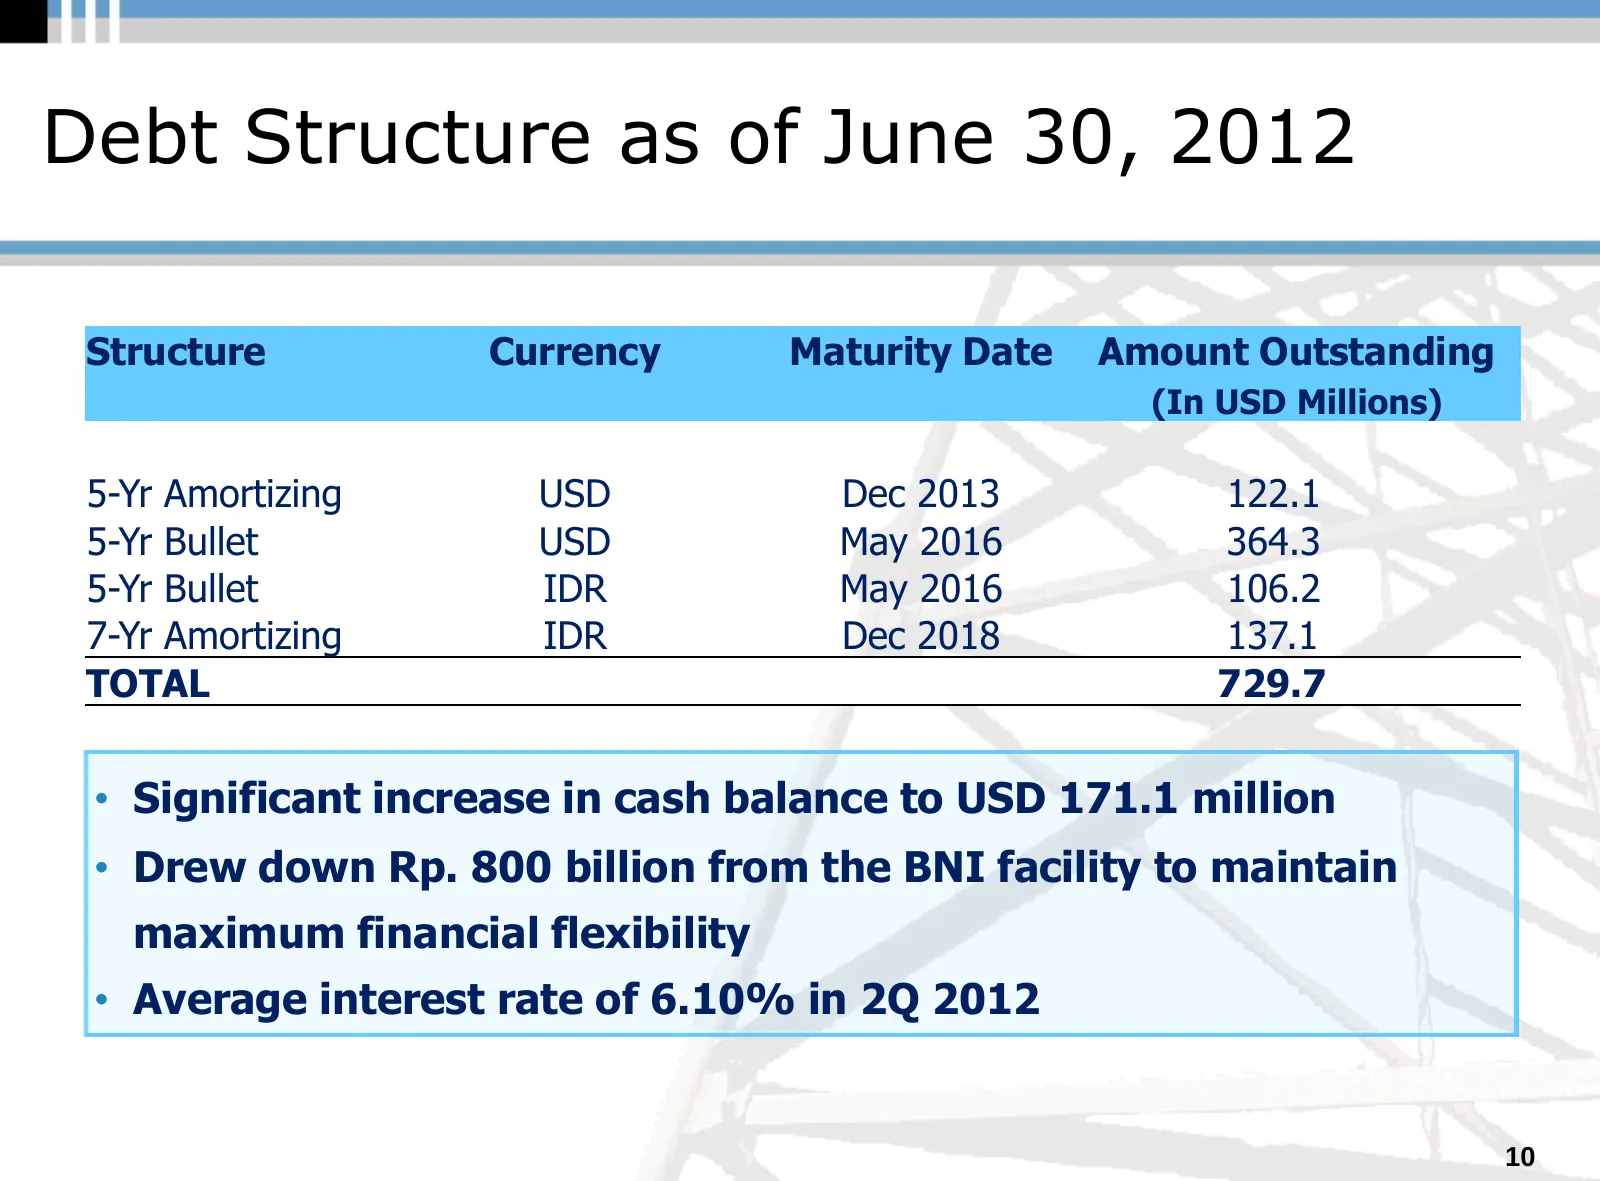
Slide 11: Debt Structure as of June 30, 2012
Debt Structure as of June 30, 2012 Structure Currency Maturity Date Amount Outstanding (In USD Millions) 5-Yr Amortizing USD Dec 2013 122.1 5-Yr Bullet USD May 2016 364.3 5-Yr Bullet IDR May 2016 106.2 7-Yr Amortizing IDR Dec 2018 137.1 TOTAL 729.7 • Significant increase in cash balance to USD 171.1
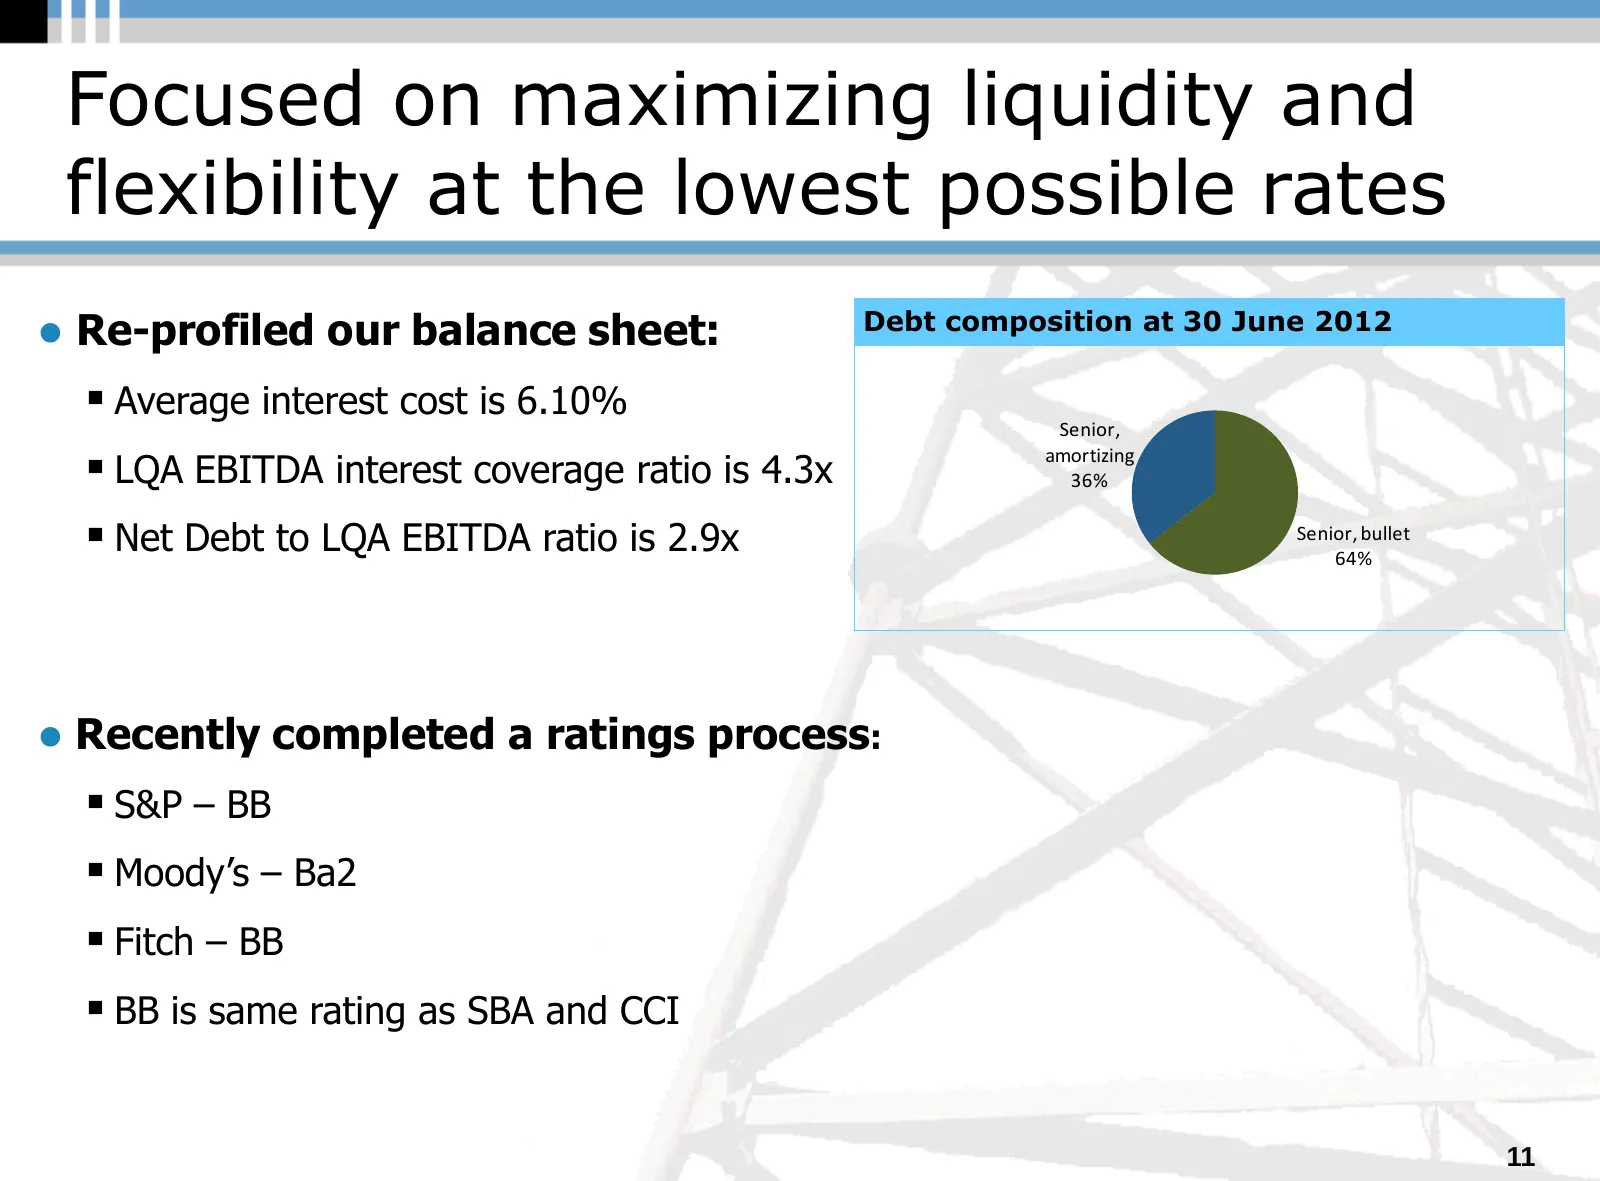
Slide 12: Focused on maximizing liquidity and flexibility at the lowest possible rates
Focused on maximizing liquidity and flexibility at the lowest possible rates Re-profiled our balance sheet: Debt composition at 30 June 2012 Average interest cost is 6.10% Senior, LQA EBITDA interest coverage ratio is 4.3x amortizing 36% Net Debt to LQA EBITDA ratio is 2.9x Senior, bullet 64
Slide 13: Strong financial liquidity
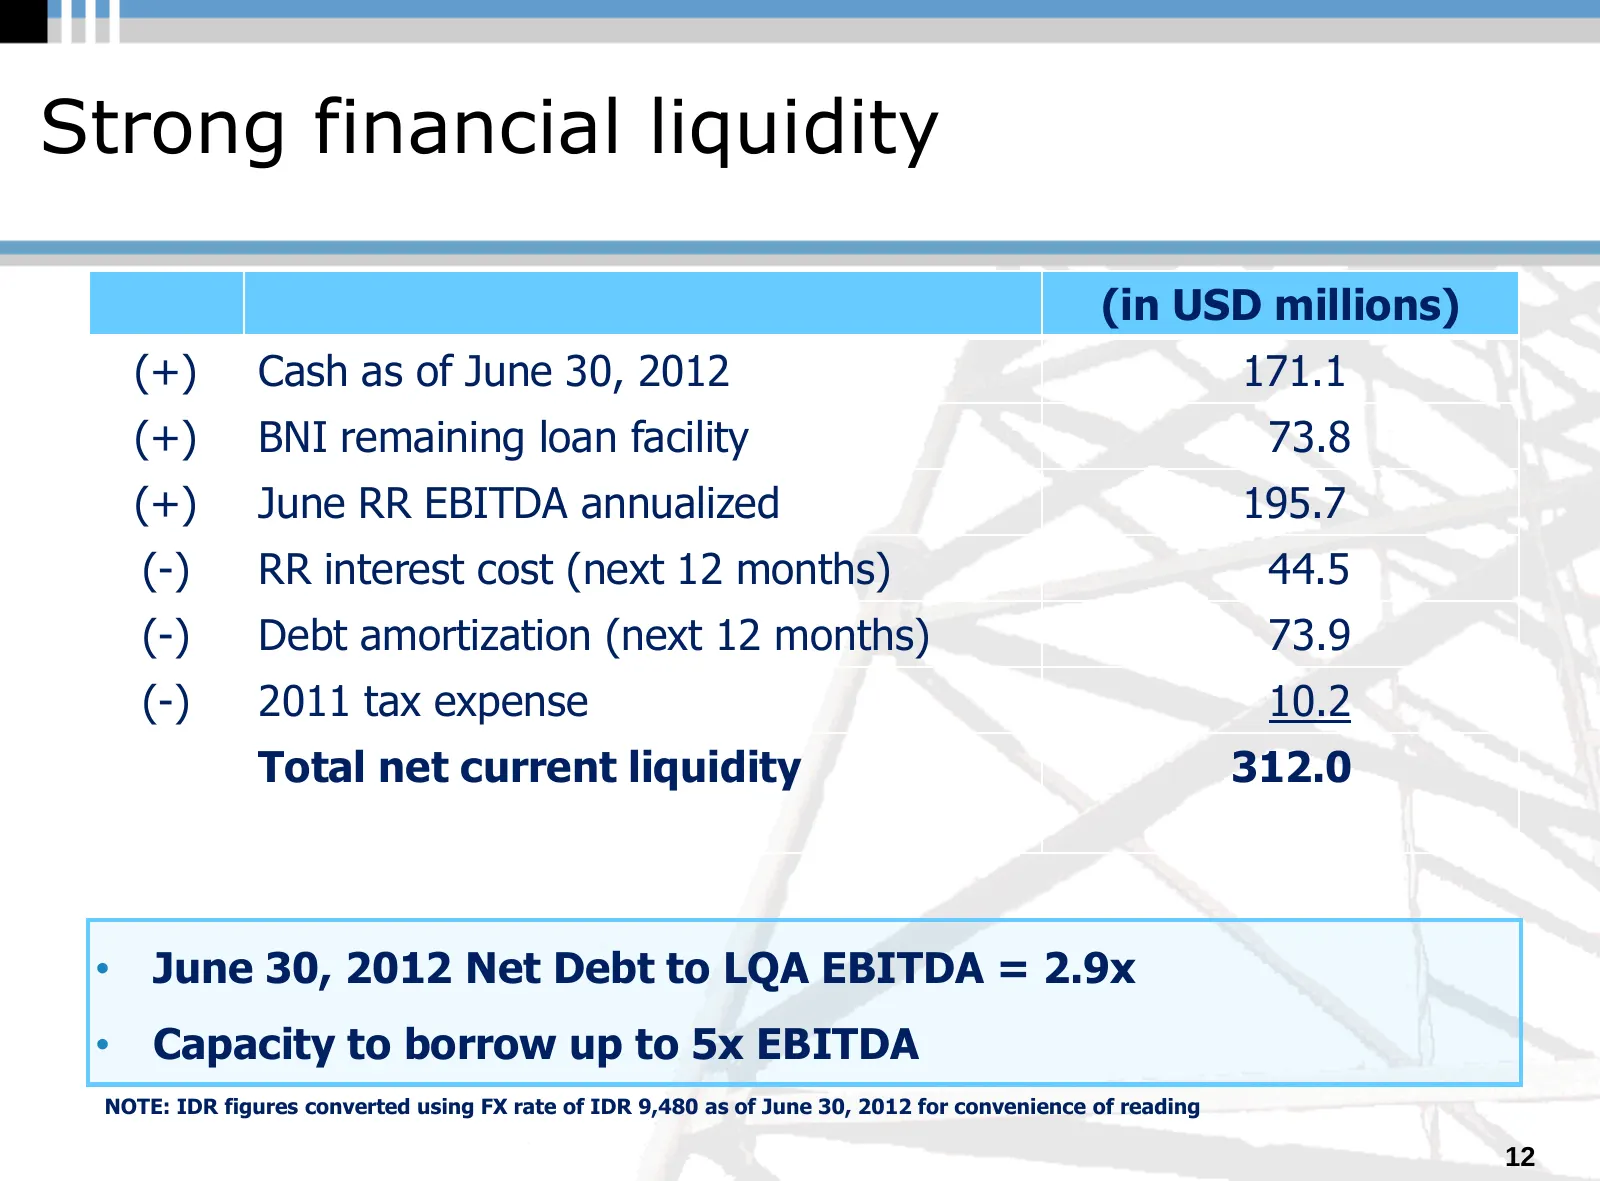
Strong financial liquidity (in USD millions) (+) Cash as of June 30, 2012 171.1 (+) BNI remaining loan facility 73.8 (+) June RR EBITDA annualized 195.7 (-) RR interest cost (next 12 months) 44.5 (-) Debt amortization (next 12 months) 73.9 (-) 2011 tax expense 10.2 Total net current liquidity 312.0
Slide 14: Summary
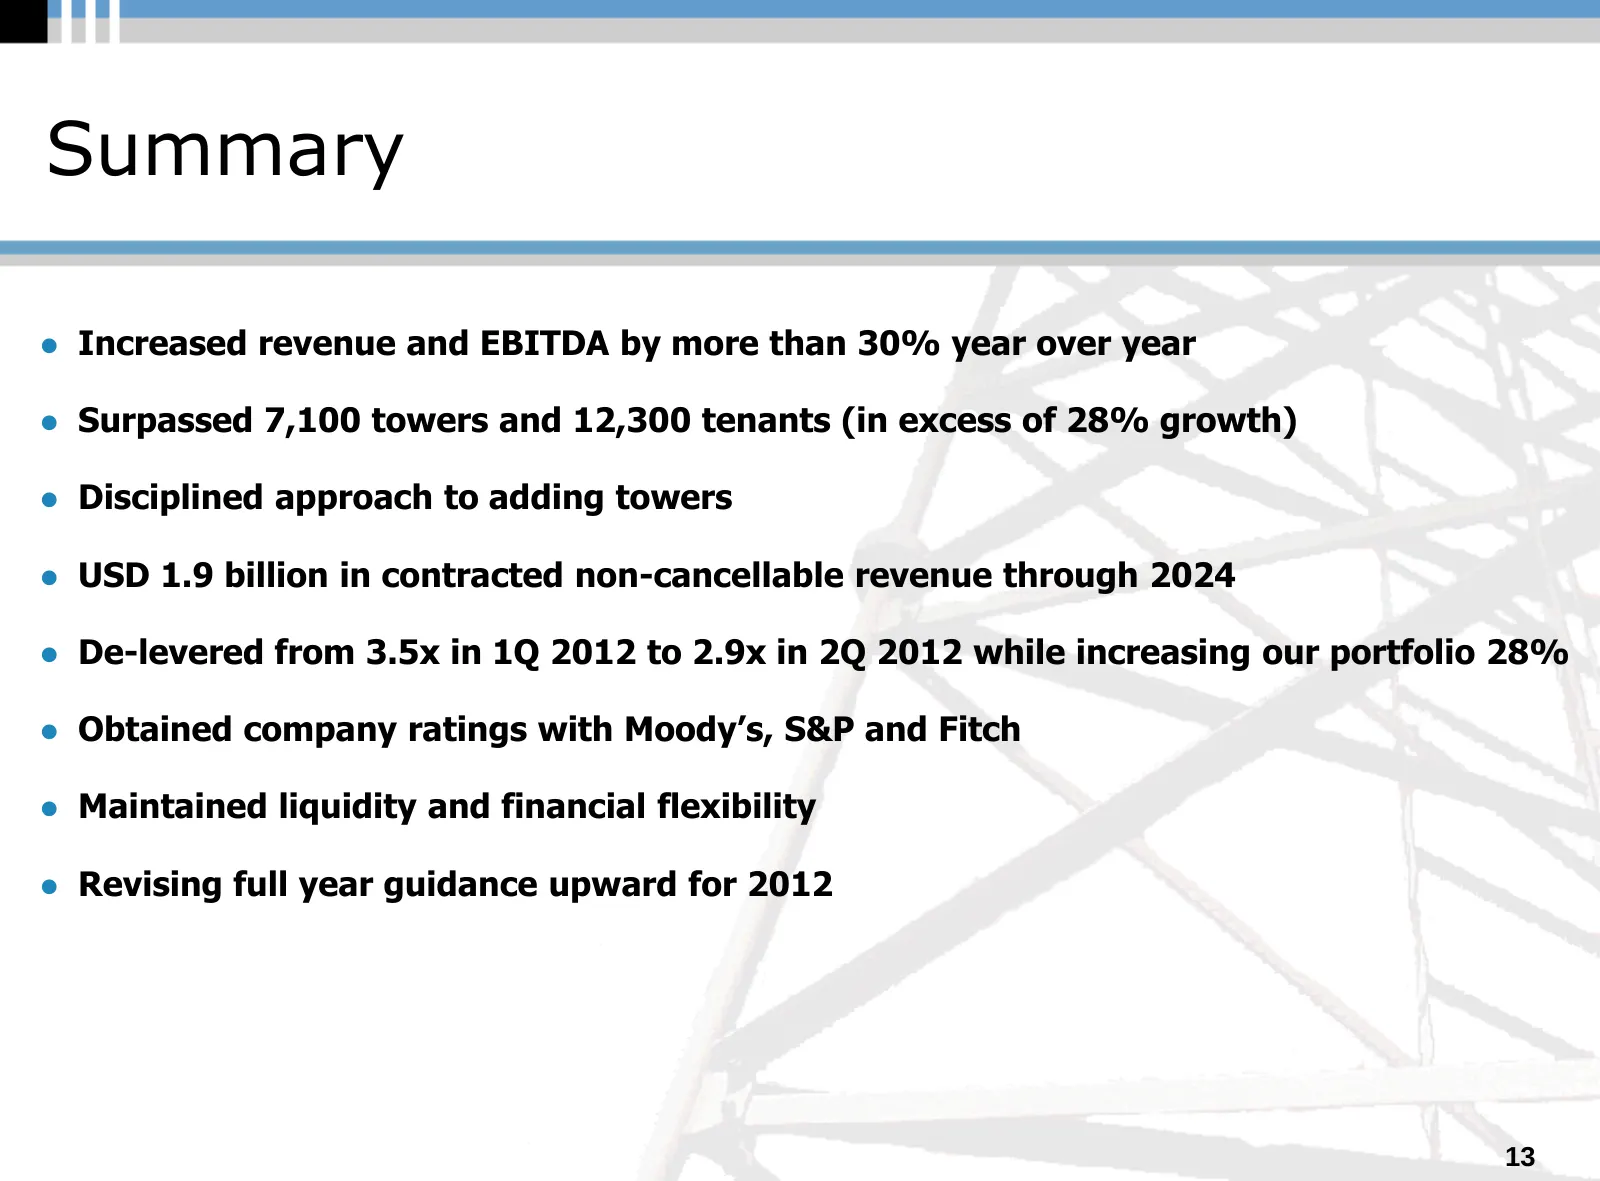
Summary Increased revenue and EBITDA by more than 30% year over year Surpassed 7,100 towers and 12,300 tenants (in excess of 28% growth) Disciplined approach to adding towers USD 1.9 billion in contracted non-cancellable revenue through 2024 De-levered from 3.5x in 1Q 2012 to 2.9x in 2Q 20
Slide 15: 2012 Outlook Revised
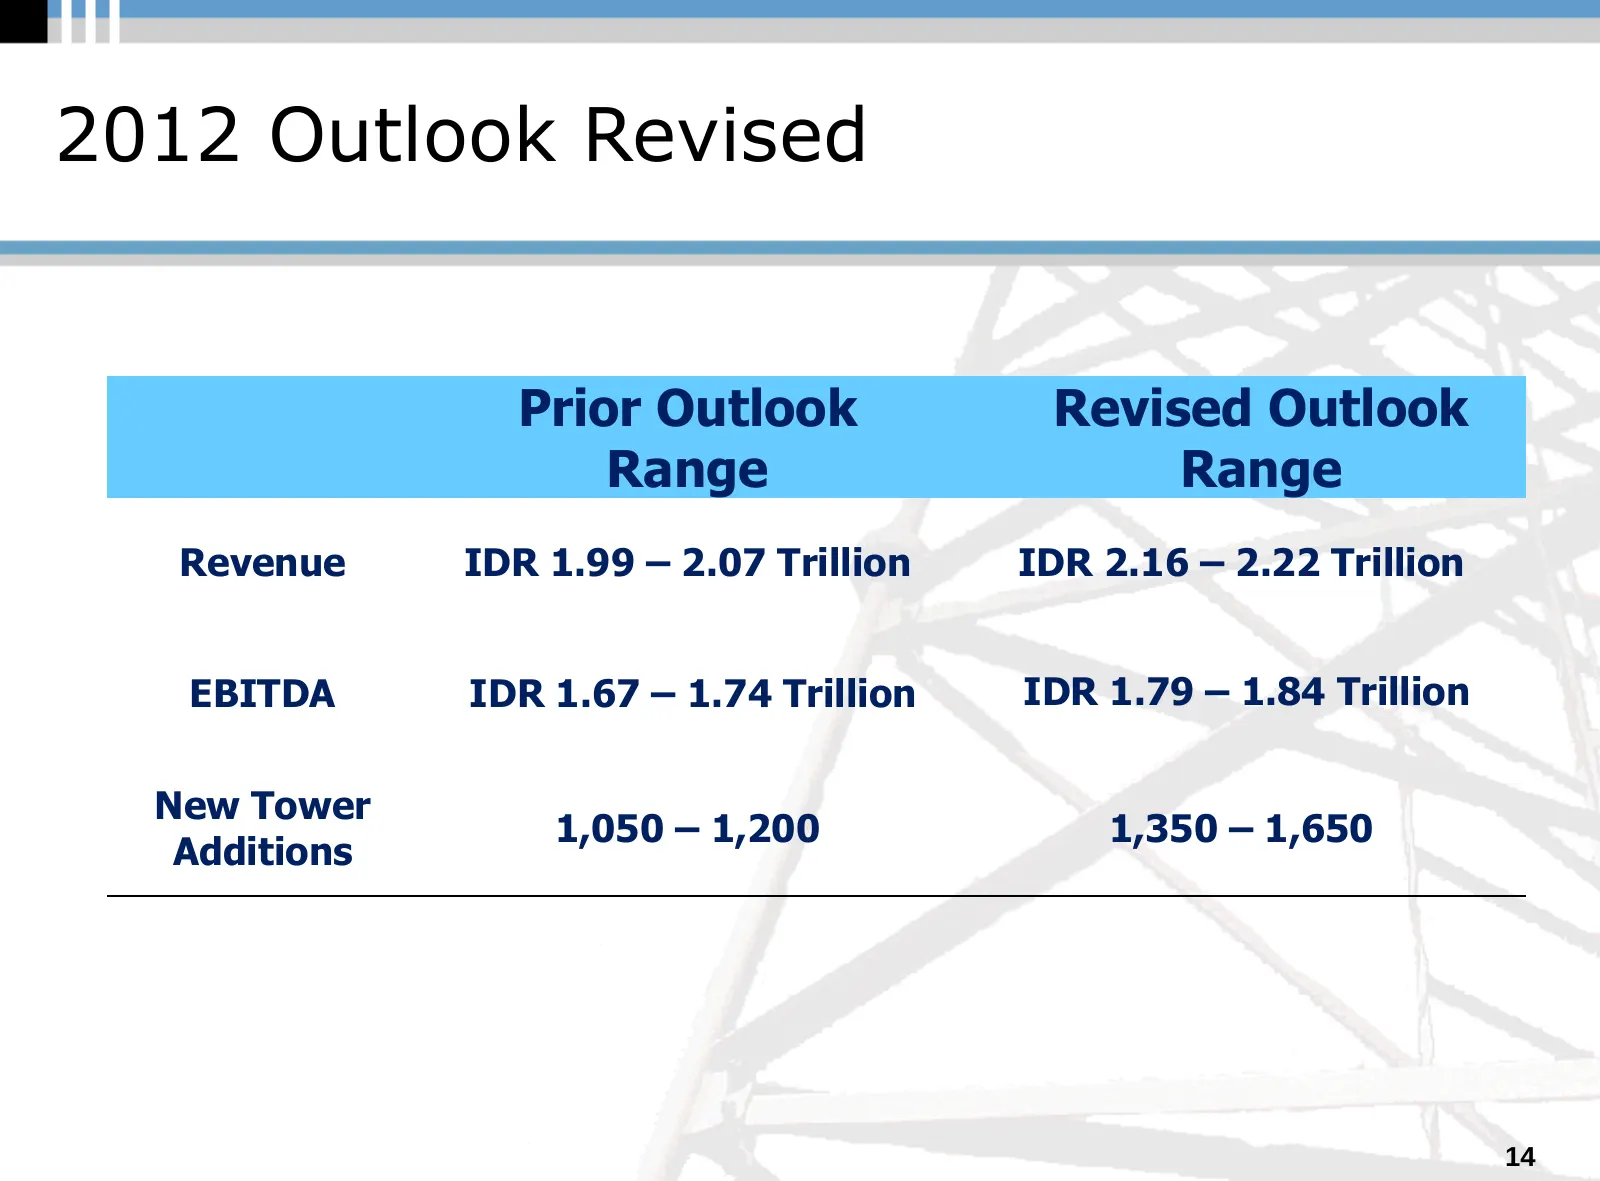
2012 Outlook Revised Prior Outlook Revised Outlook Range Range Revenue IDR 1.99 – 2.07 Trillion IDR 2.16 – 2.22 Trillion EBITDA IDR 1.67 – 1.74 Trillion IDR 1.79 – 1.84 Trillion New Tower 1,050 – 1,200 1,350 – 1,650 Additions 14
Source: Internet Archive copy of ptsmn.co.id
More decks from PT Sarana Menara Nusantara Tbk
 Q2 2026 Earnings Presentation25 slides · Aug 14, 2026
 Q1 2026 Earnings Presentation25 slides · Jun 3, 2026
 Q4 2025 Earnings Presentation24 slides · Apr 6, 2026
 Q2 2023 Earnings Presentation26 slides · Sep 28, 2023
 Q1 2023 Earnings Presentation26 slides · May 2023
 FY2022 Earnings Presentation26 slides · Apr 6, 2023