NN, Inc. · NASDAQ:NNBR
NN — Craig-Hallum Investor Conference 2026
27 slides from NN's conference presentation, Nov 16, 2026
Slide 1: NN, Inc. Craig-Hallum Investor Conference
NN, Inc. Craig-Hallum Investor Conference November 16, 2026
Slide 2: Forward Looking Statements
2 Forward Looking Statements This presentation may contain forward-looking statements regarding our business, operations, and financial performance. Such statements are based on current expectations and assumptions that are subject to a number of risks and uncertainties. Actual results could differ
Slide 3: What's New Since Q3 2026 Results Announcement?
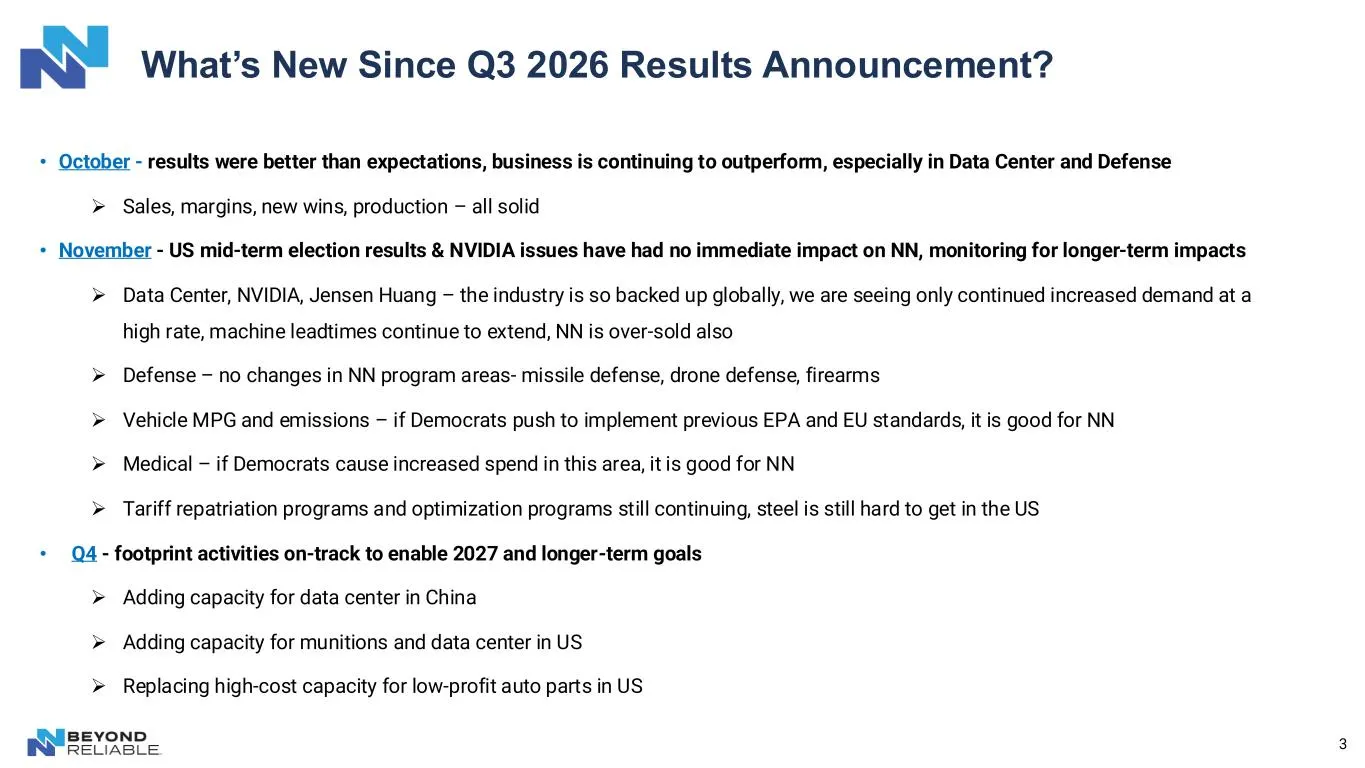
3 What’s New Since Q3 2026 Results Announcement? • October - results were better than expectations, business is continuing to outperform, especially in Data Center and Defense ➢ Sales, margins, new wins, production – all solid • November - US mid-term election results & NVIDIA issues have had no imm
Slide 4: Q3 2026 Earnings Highlights
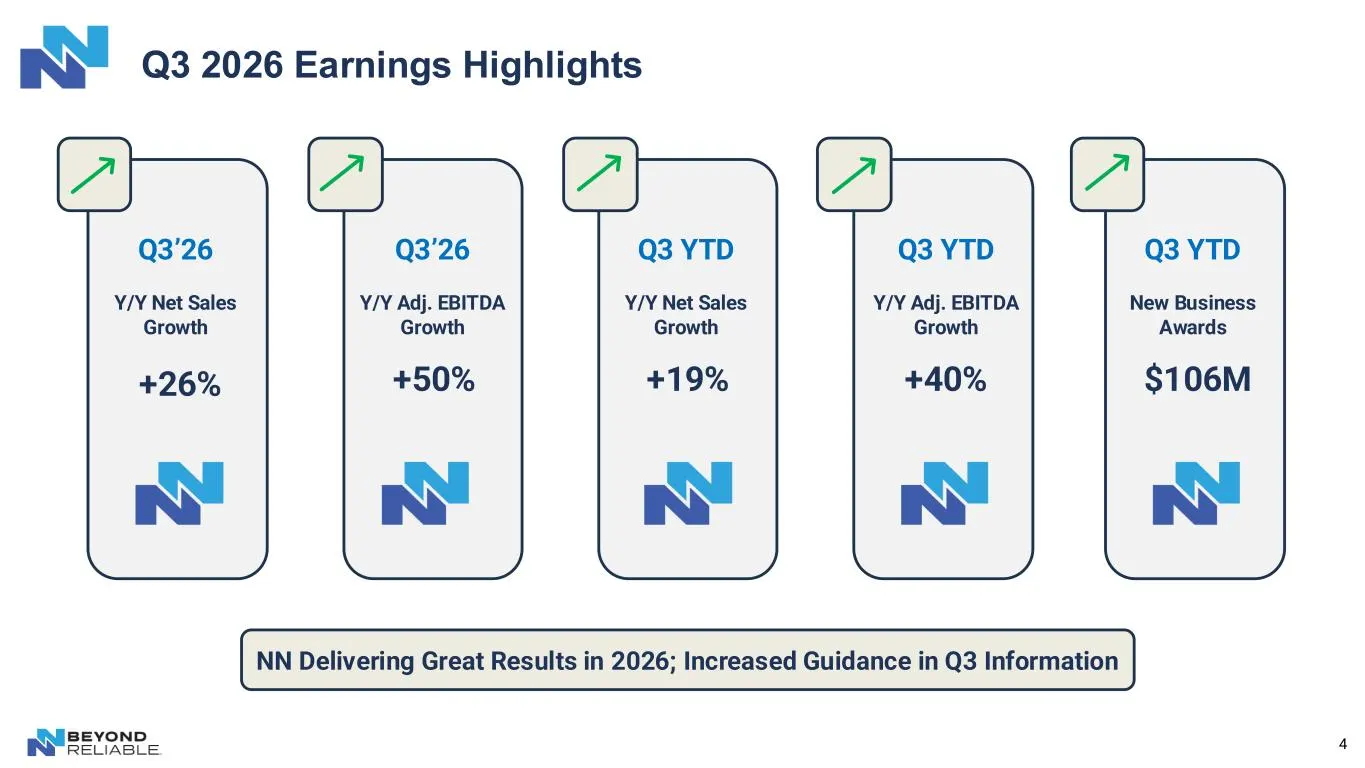
4 Q3 2026 Earnings Highlights +26% +19%+50% +40% $106M Q3’26 Y/Y Net Sales Growth Q3 YTD Y/Y Net Sales Growth Q3’26 Y/Y Adj. EBITDA Growth Q3 YTD Y/Y Adj. EBITDA Growth Q3 YTD New Business Awards NN Delivering Great Results in 2026; Increased Guidance in Q3 Information
Slide 5: Key Messages
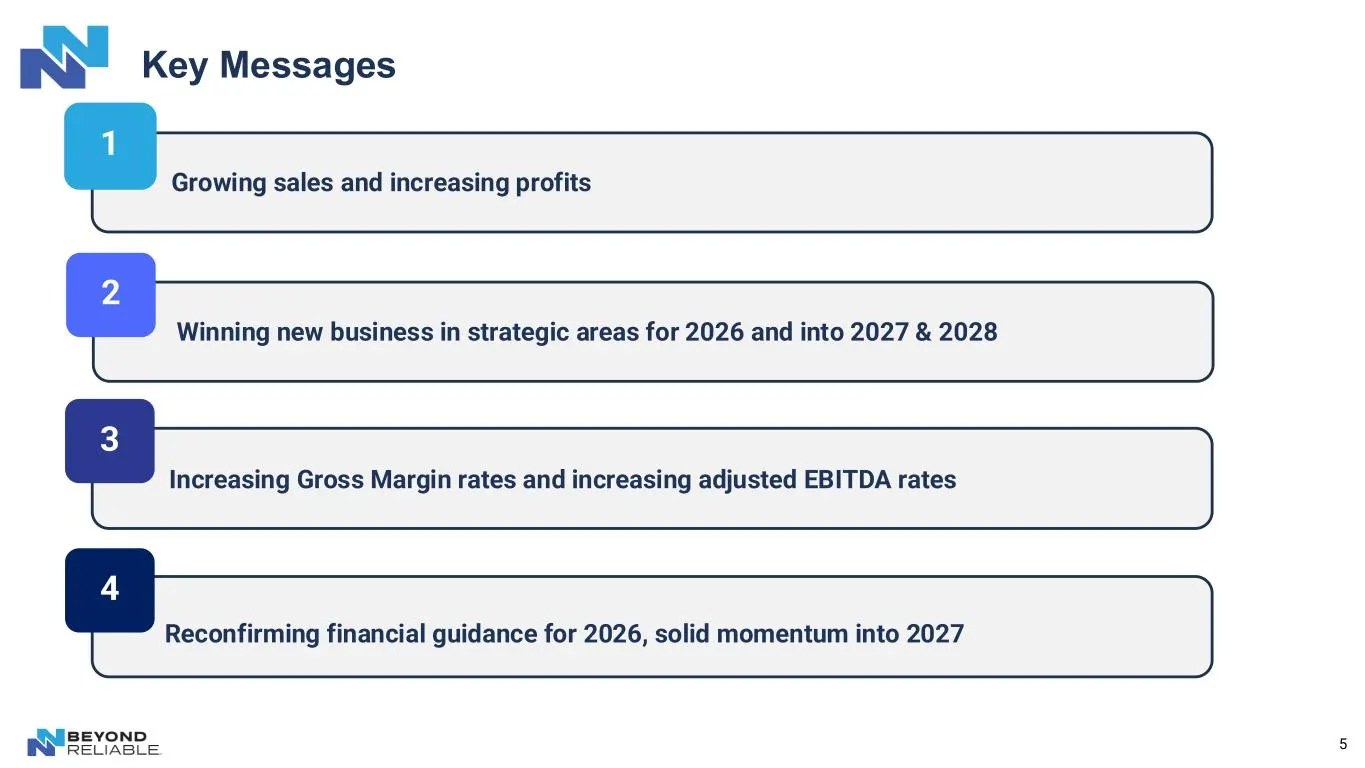
5 Key Messages 1 2 3 Growing sales and increasing profits Winning new business in strategic areas for 2026 and into 2027 & 2028 4 Increasing Gross Margin rates and increasing adjusted EBITDA rates Reconfirming financial guidance for 2026, solid momentum into 2027
Slide 6: Resolved 5-Year-Old Balance Sheet Problem, Achieved Shareholder Alignment
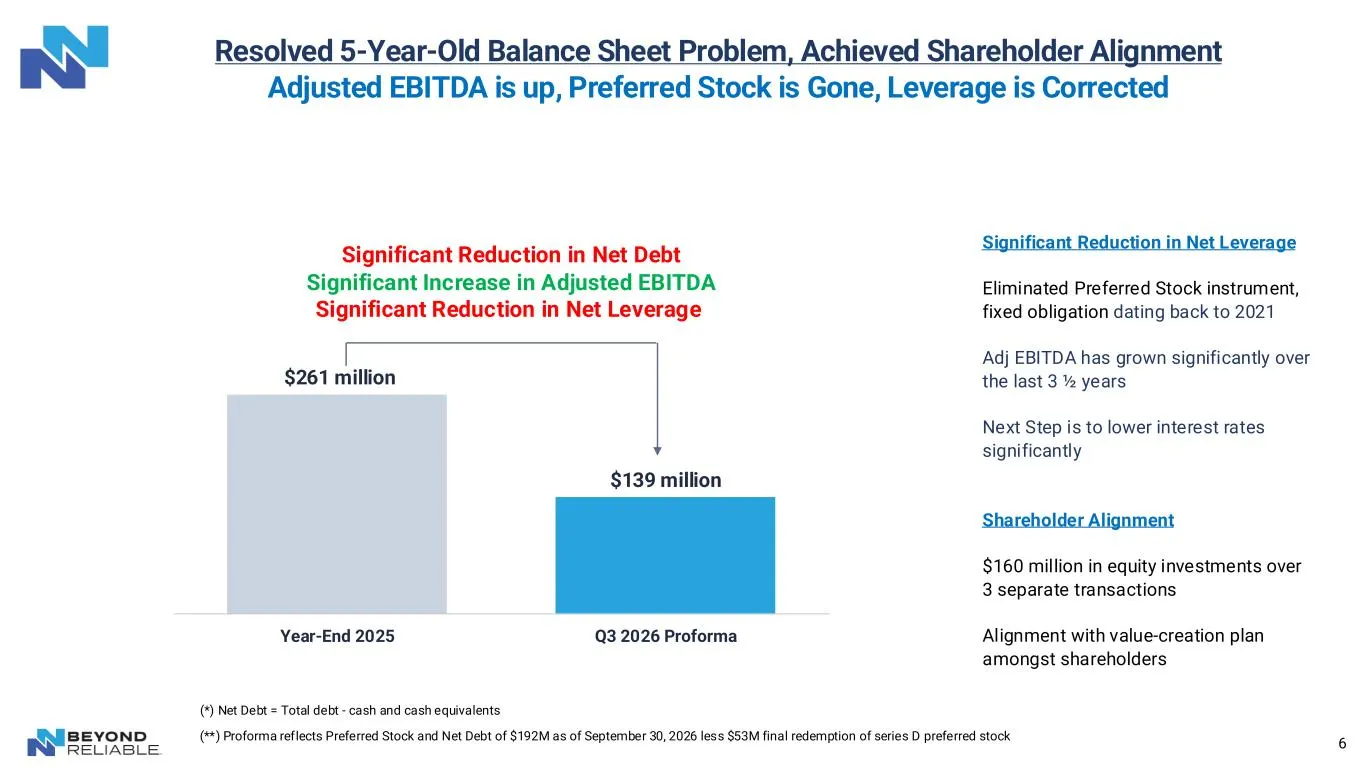
6 Resolved 5-Year-Old Balance Sheet Problem, Achieved Shareholder Alignment Adjusted EBITDA is up, Preferred Stock is Gone, Leverage is Corrected Significant Reduction in Net Leverage Eliminated Preferred Stock instrument, fixed obligation dating back to 2021 Adj EBITDA has grown significantly over
Slide 7: Long Term Sales Mix Gameplan
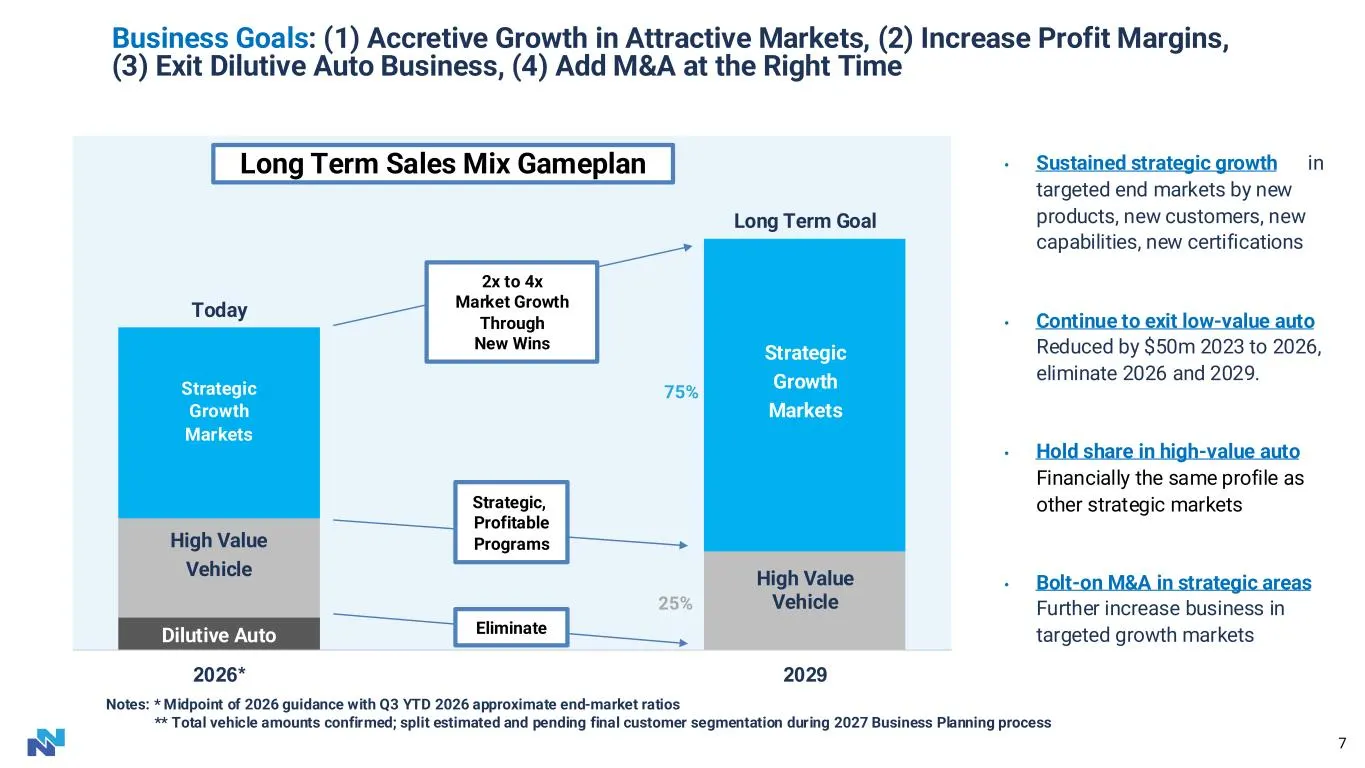
7 • Sustained strategic growth in targeted end markets by new products, new customers, new capabilities, new certifications • Continue to exit low-value auto Reduced by $50m 2023 to 2026, eliminate 2026 and 2029. • Hold share in high-value auto Financially the same profile as other strategic markets
Slide 8: Q3 2026 Financial Results
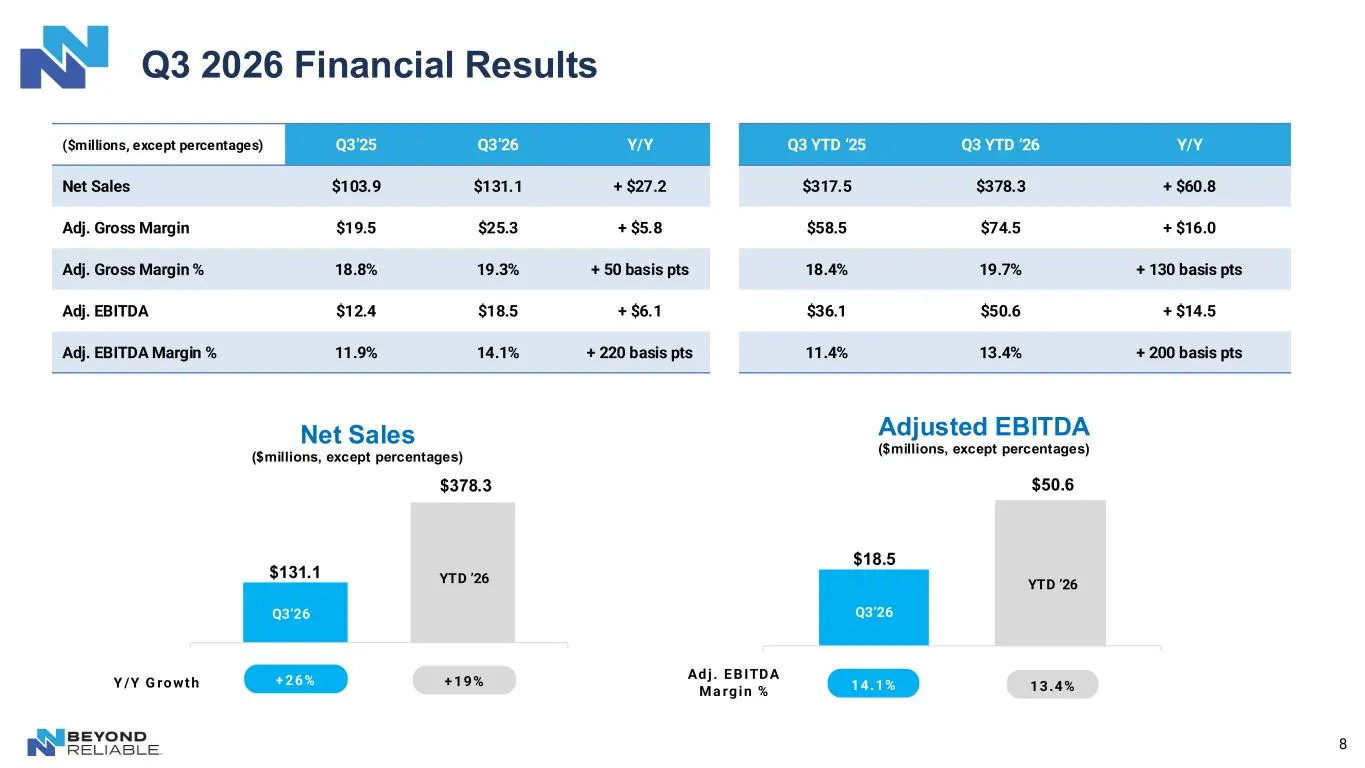
8 Q3 2026 Financial Results $18.5 $50.6 Adjusted EBITDA ($millions, except percentages) $131.1 $378.3 Net Sales ($millions, except percentages) ($millions, except percentages) Q3’25 Q3’26 Y/Y Q3 YTD ‘25 Q3 YTD ‘26 Y/Y Net Sales $103.9 $131.1 + $27.2 $317.5 $378.3 + $60.8 Adj. Gross Margin $19.5 $25.
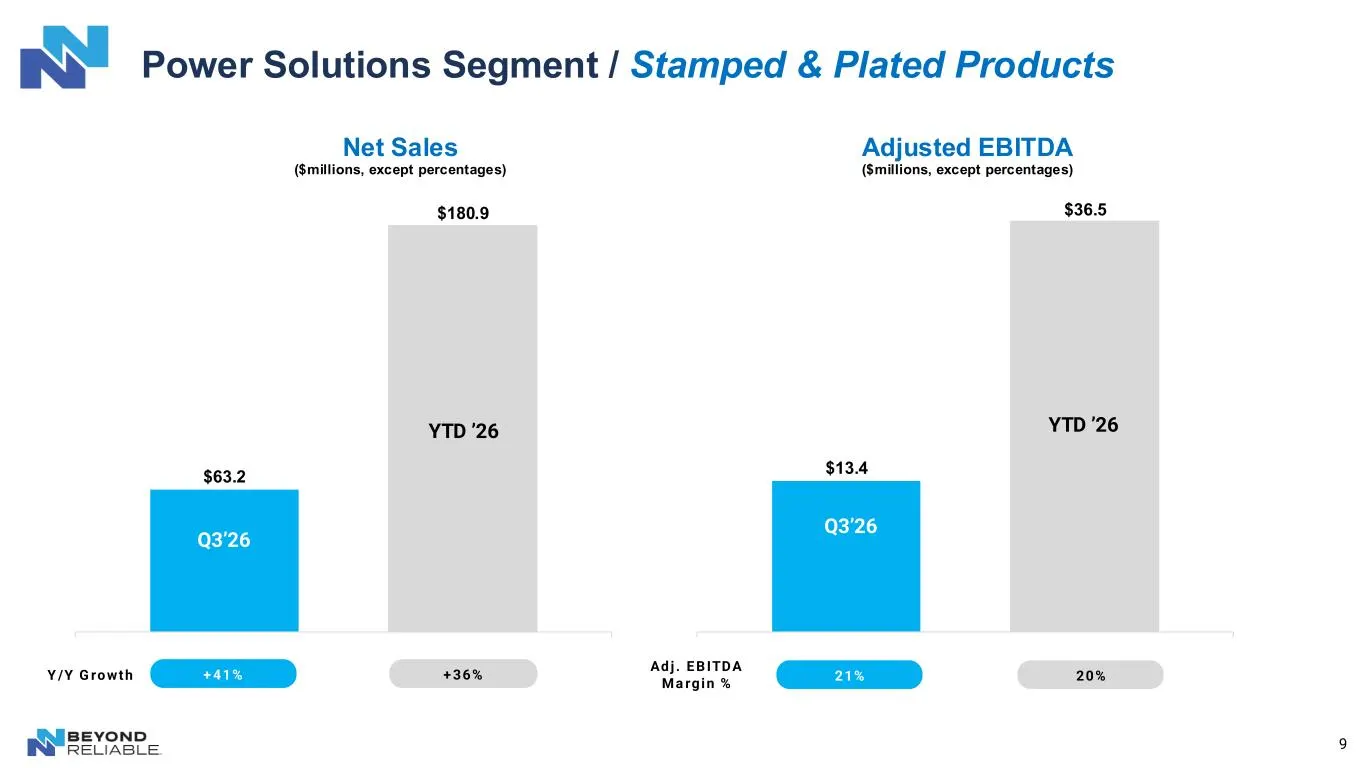
Slide 9: Power Solutions Segment / Stamped & Plated Products
9 Power Solutions Segment / Stamped & Plated Products $63.2 $180.9 Net Sales ($millions, except percentages) + 41% + 36%Y /Y G ro wth $13.4 $36.5 Adjusted EBITDA ($millions, except percentages) Ad j . E B ITDA Ma rgin % 21% 20% Q3’26 Q3’26 YTD ’26 YTD ’26
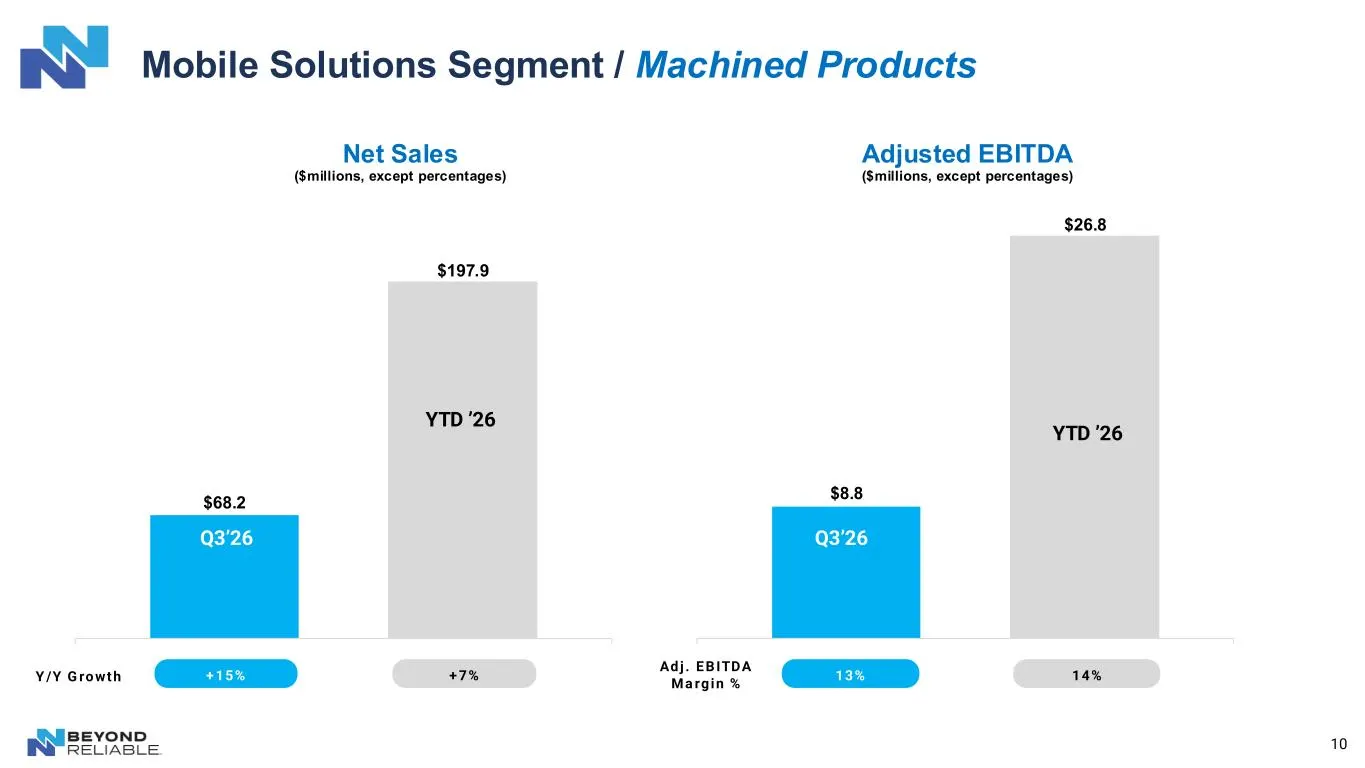
Slide 10: Mobile Solutions Segment / Machined Products
10 Mobile Solutions Segment / Machined Products $68.2 $197.9 Net Sales ($millions, except percentages) + 15% + 7%Y /Y G ro wth $8.8 $26.8 Adjusted EBITDA ($millions, except percentages) Ad j . E B ITDA Ma rg in % 13% 14% Q3’26 Q3’26 YTD ’26 YTD ’26
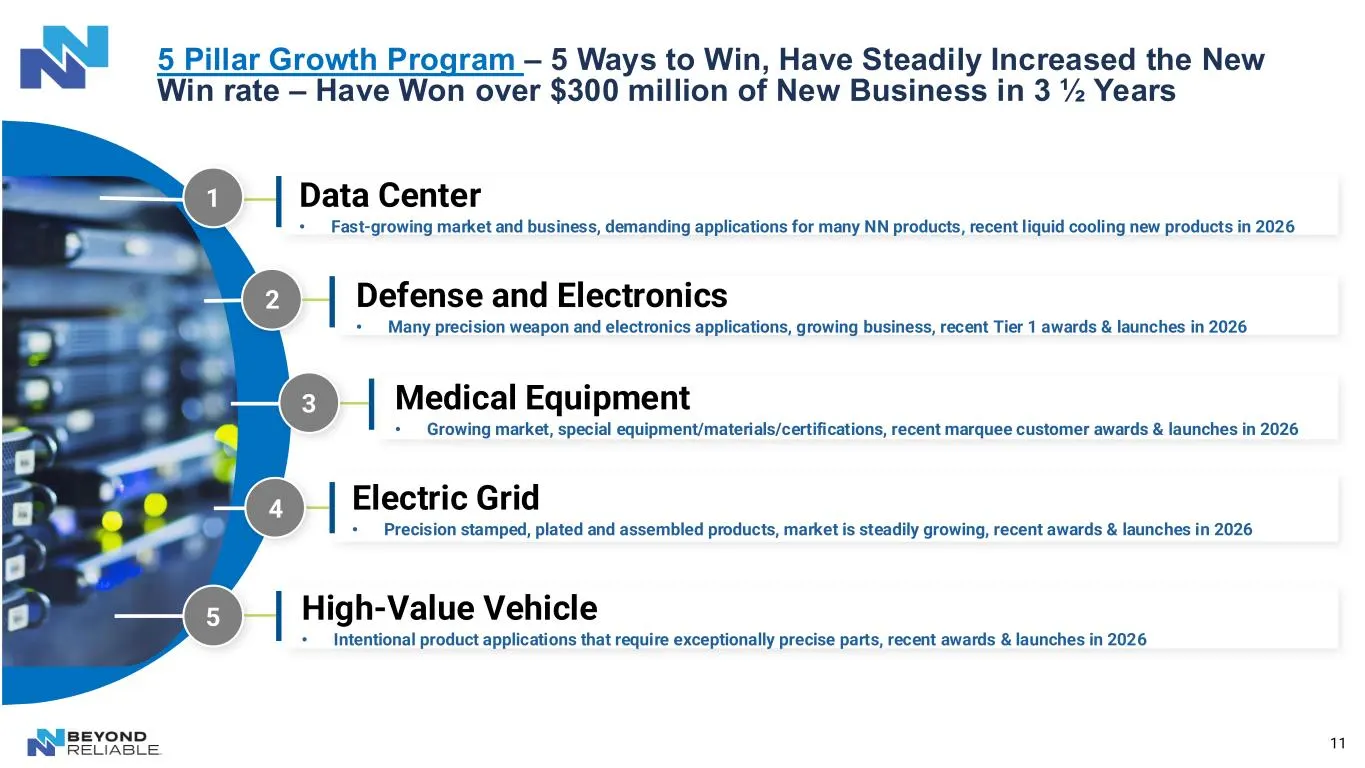
Slide 11: Pillar Growth Program – Ways to Win
11 5 Pillar Growth Program – 5 Ways to Win, Have Steadily Increased the New Win rate – Have Won over $300 million of New Business in 3 ½ Years High-Value Vehicle • Intentional product applications that require exceptionally precise parts, recent awards & launches in 2026 Electric Grid • Precision st
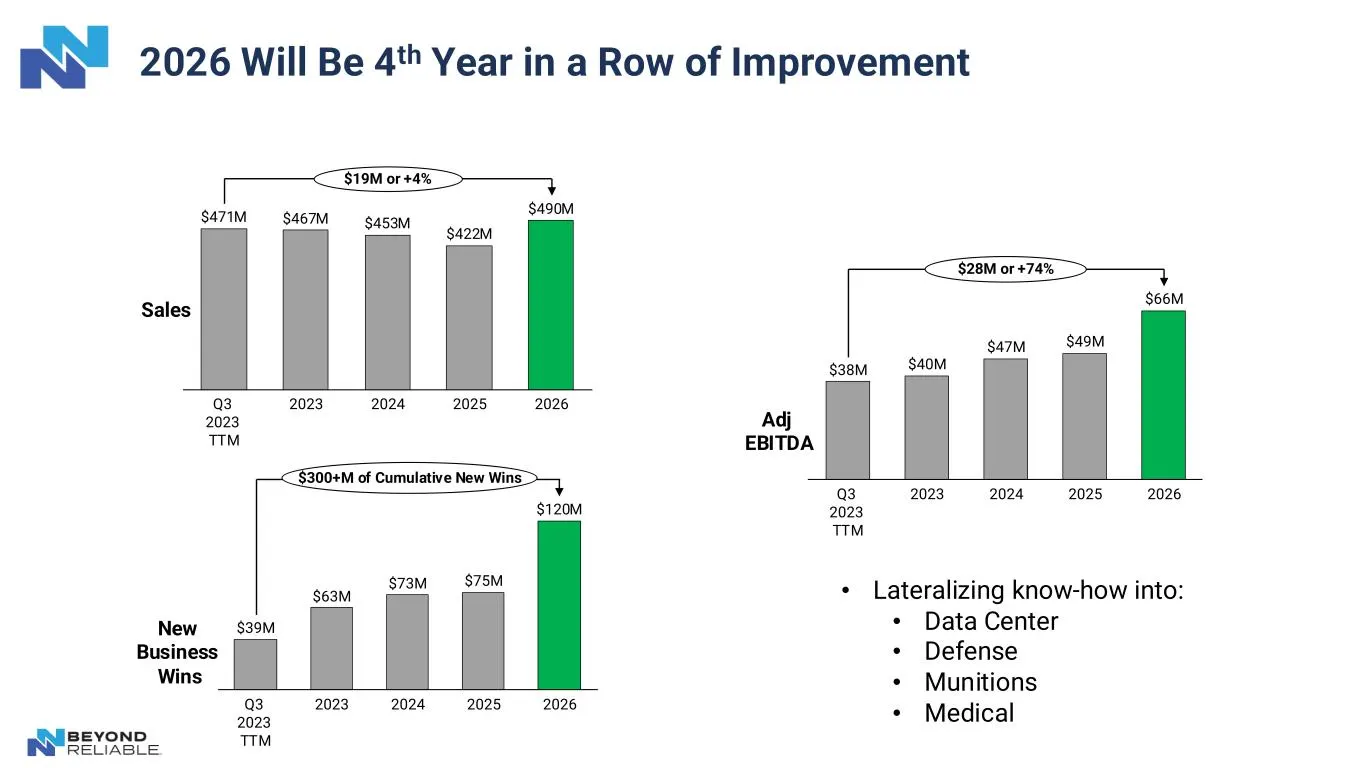
Slide 12: 2026 Will Be 4th Year in a Row of Improvement
2026 Will Be 4th Year in a Row of Improvement $38M $40M $47M $49M $66M Q3 2023 TTM 2023 2024 2025 2026 Adj EBITDA $28M or +74% $471M $467M $453M $422M $490M Q3 2023 TTM 2023 2024 2025 2026 Sales $19M or +4% $39M $63M $73M $75M $120M Q3 2023 TTM 2023 2024 2025 2026 New Business Wins $300+M of Cumulat
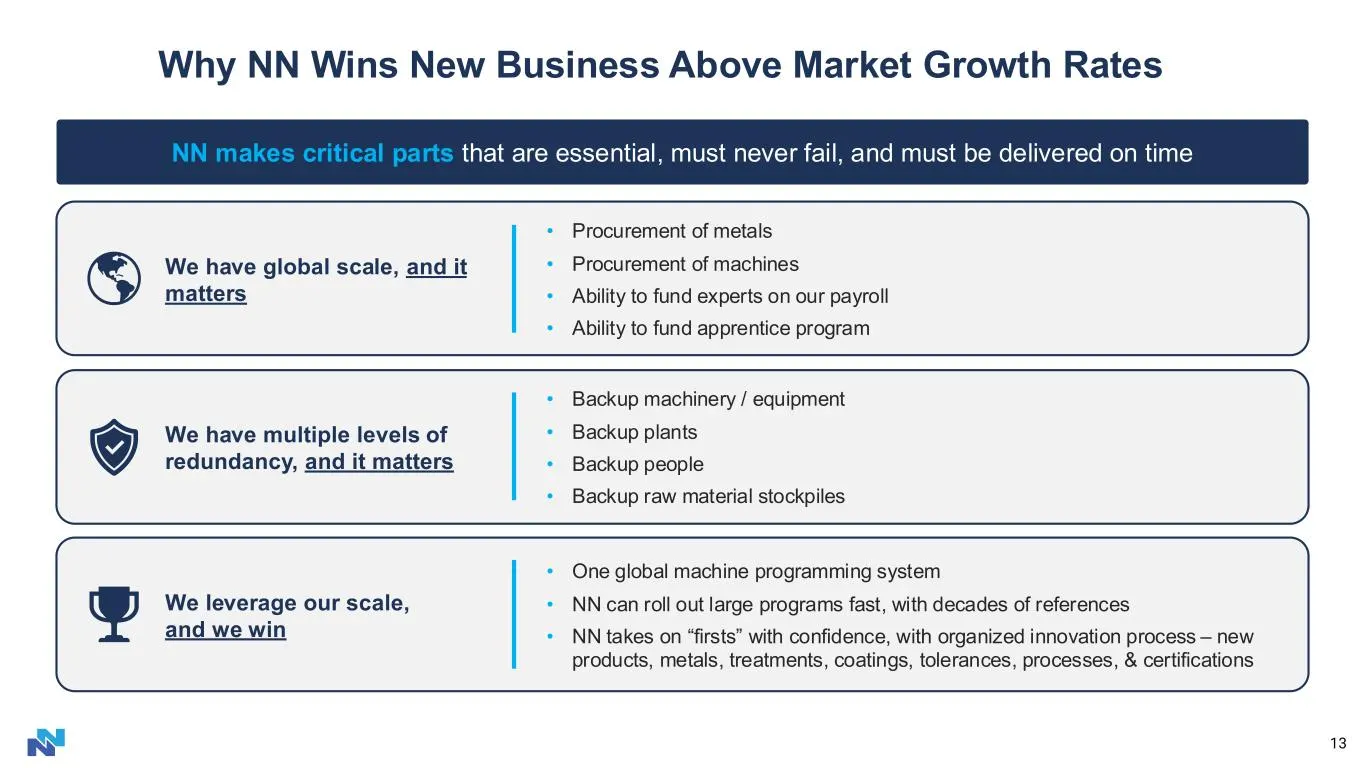
Slide 13: Why NN Wins New Business Above Market Growth Rates
13 NN makes critical parts that are essential, must never fail, and must be delivered on time We have global scale, and it matters • Procurement of metals • Procurement of machines • Ability to fund experts on our payroll • Ability to fund apprentice program We have multiple levels of redundancy, an
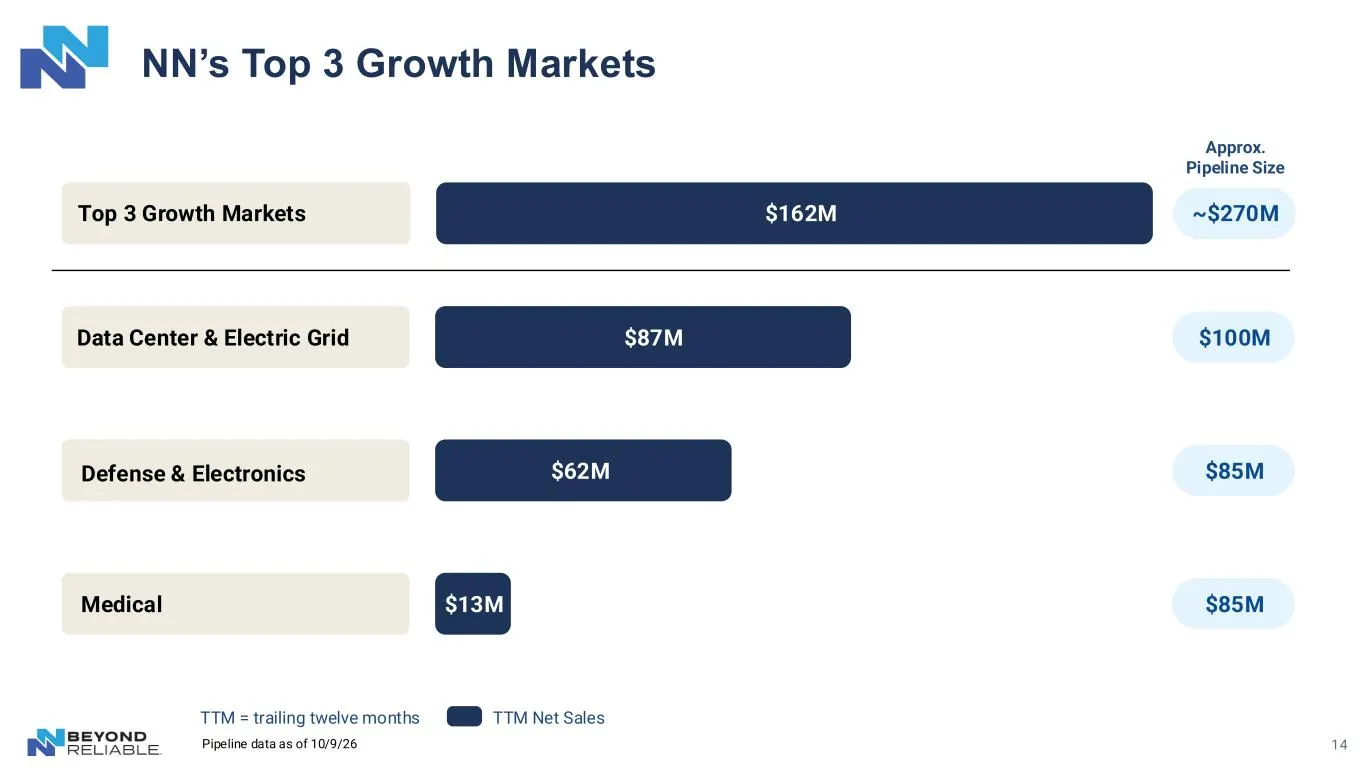
Slide 14: NN's Top Growth Markets
NN’s Top 3 Growth Markets TTM Net Sales Data Center & Electric Grid $87M Defense & Electronics $62M Medical $13M $100M $85M $85M Combined: $162M TTM Net Sales TTM = trailing twelve months 14 Top 3 Growth Markets $162M Approx. Pipeline Size ~$270M Pipeline data as of 10/9/26
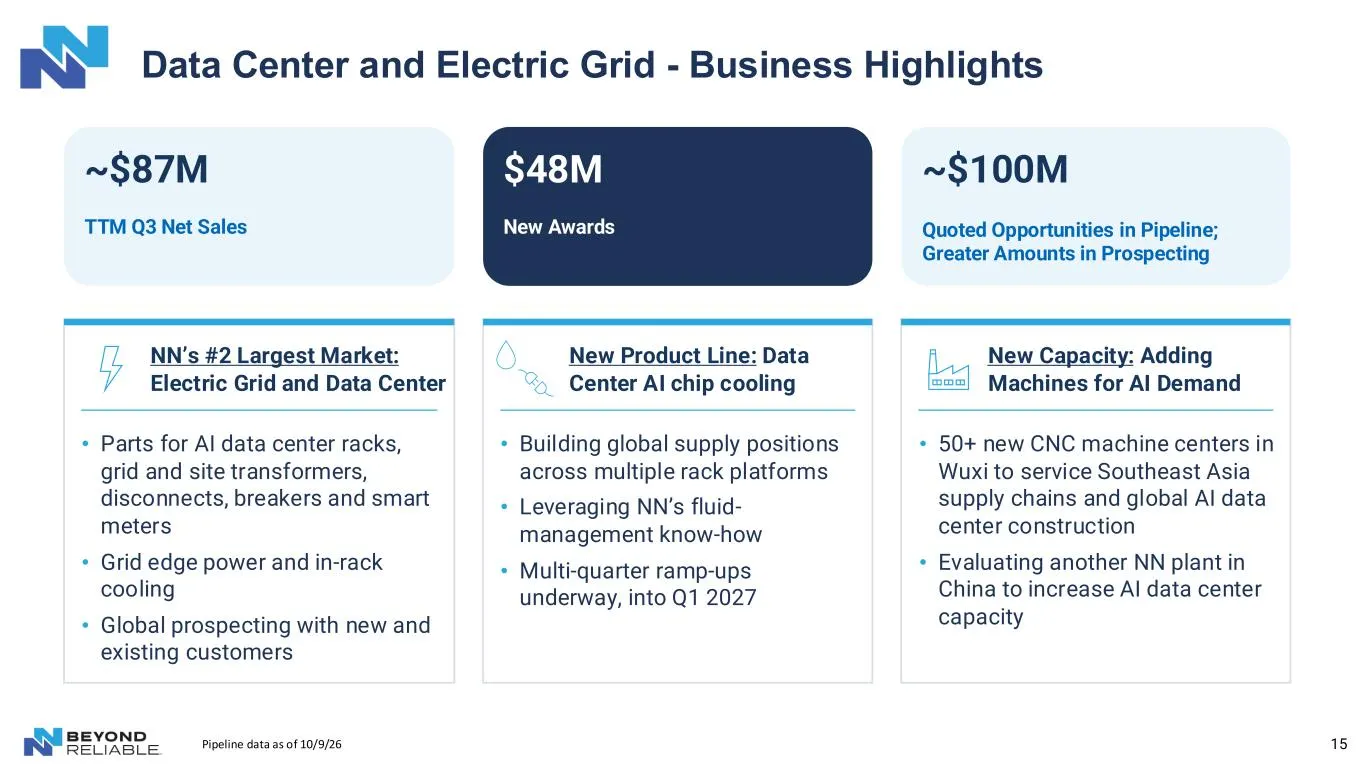
Slide 15: Data Center and Electric Grid - Business Highlights
15 Data Center and Electric Grid - Business Highlights ~$87M TTM Q3 Net Sales NN’s #2 Largest Market: Electric Grid and Data Center $48M New Awards New Product Line: Data Center AI chip cooling ~$100M Quoted Opportunities in Pipeline; Greater Amounts in Prospecting New Capacity: Adding Machines for
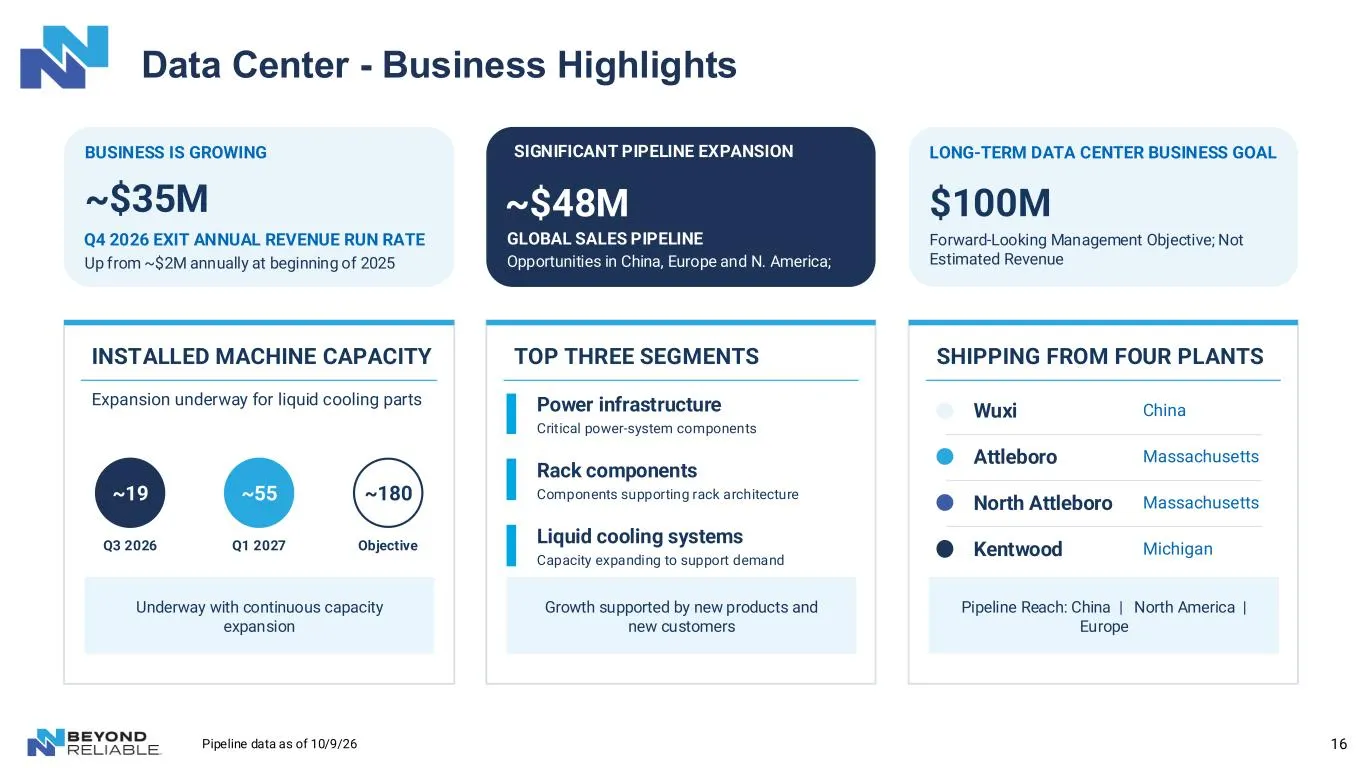
Slide 16: Data Center - Business Highlights
16 Data Center - Business Highlights ~$35M Q4 2026 EXIT ANNUAL REVENUE RUN RATE Up from ~$2M annually at beginning of 2025 INSTALLED MACHINE CAPACITY Expansion underway for liquid cooling parts Underway with continuous capacity expansion ~180 Objective ~19 Q3 2026 ~55 Q1 2027 ~$48M GLOBAL SALES PIPE
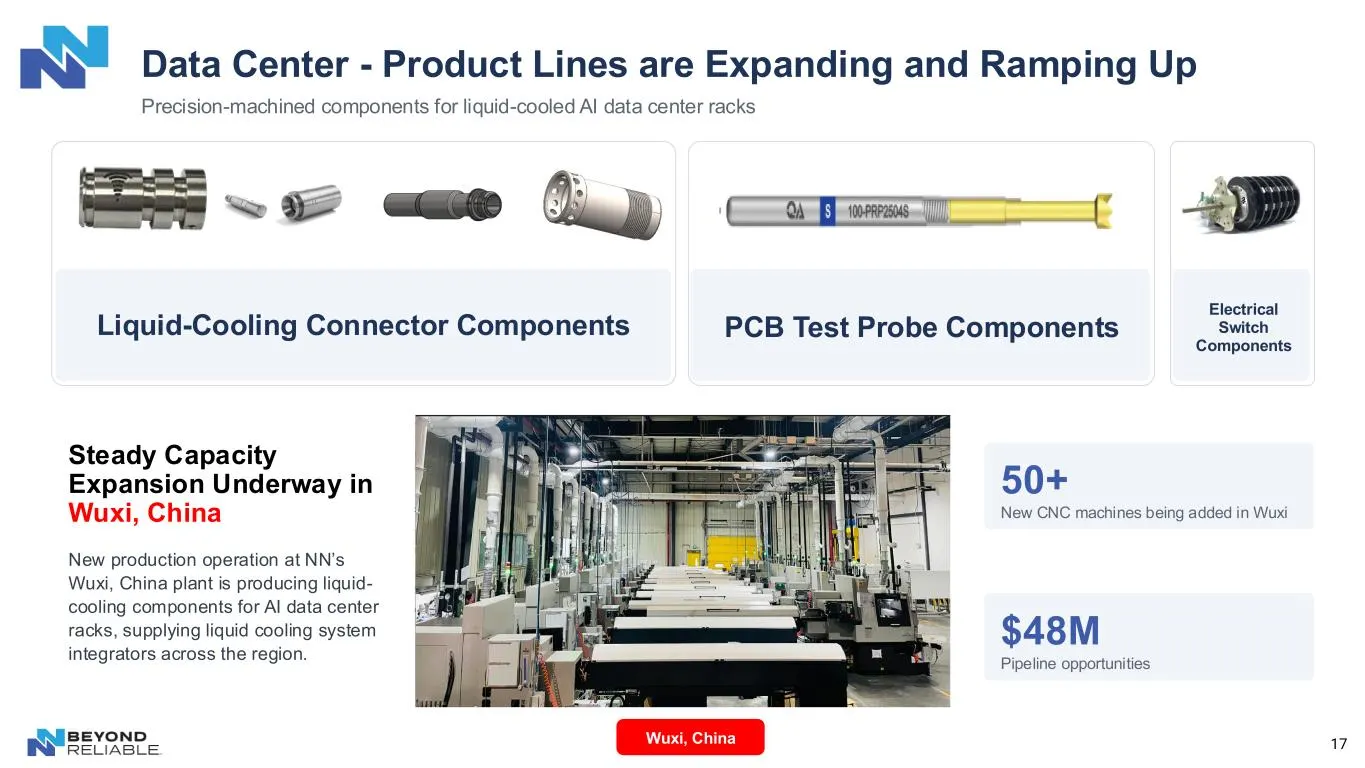
Slide 17: Data Center - Product Lines are Expanding and Ramping Up
17 Data Center - Product Lines are Expanding and Ramping Up Precision-machined components for liquid-cooled AI data center racks Liquid-Cooling Connector Components Electrical Switch Components Wuxi, China Steady Capacity Expansion Underway in Wuxi, China New production operation at NN’s Wuxi, China
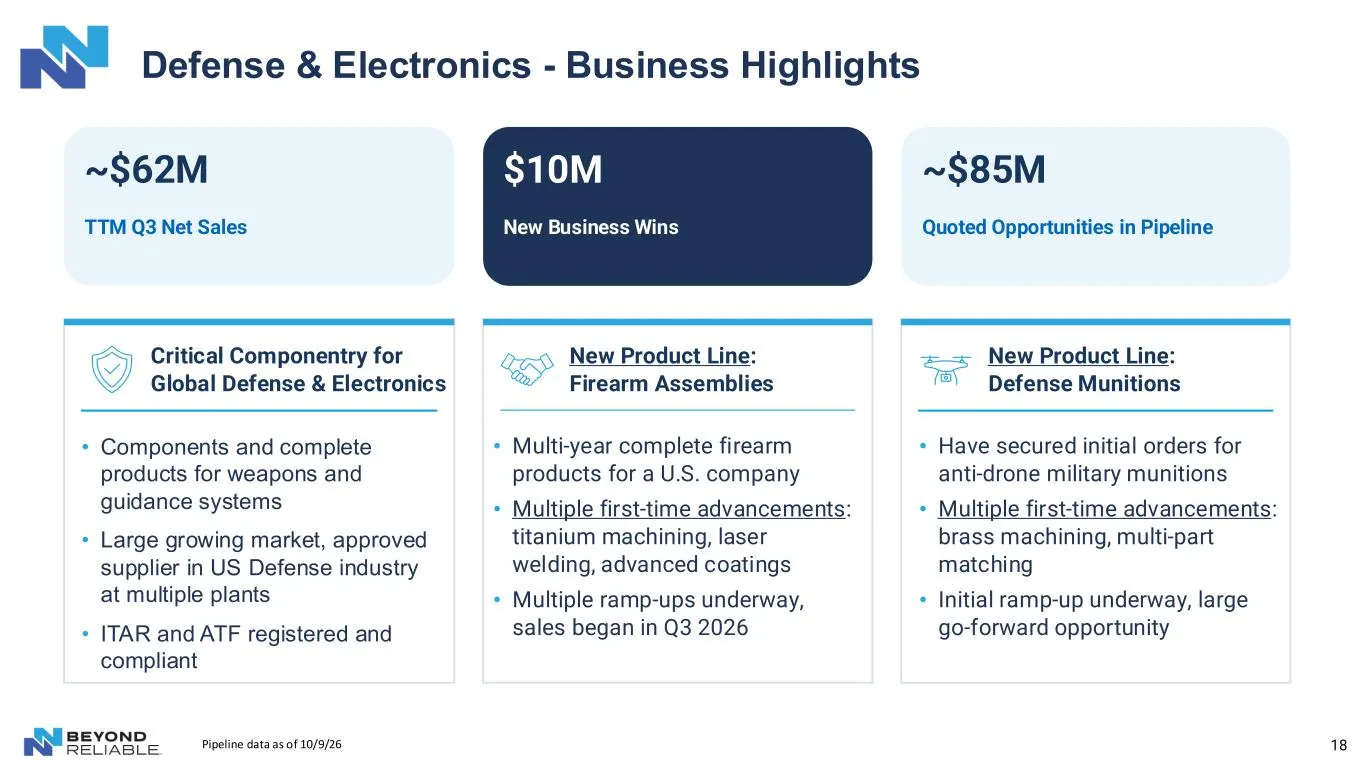
Slide 18: Defense & Electronics - Business Highlights
18 $10M New Business Wins New Product Line: Firearm Assemblies Defense & Electronics - Business Highlights ~$62M TTM Q3 Net Sales Critical Componentry for Global Defense & Electronics ~$85M Quoted Opportunities in Pipeline New Product Line: Defense Munitions • Components and complete products for we
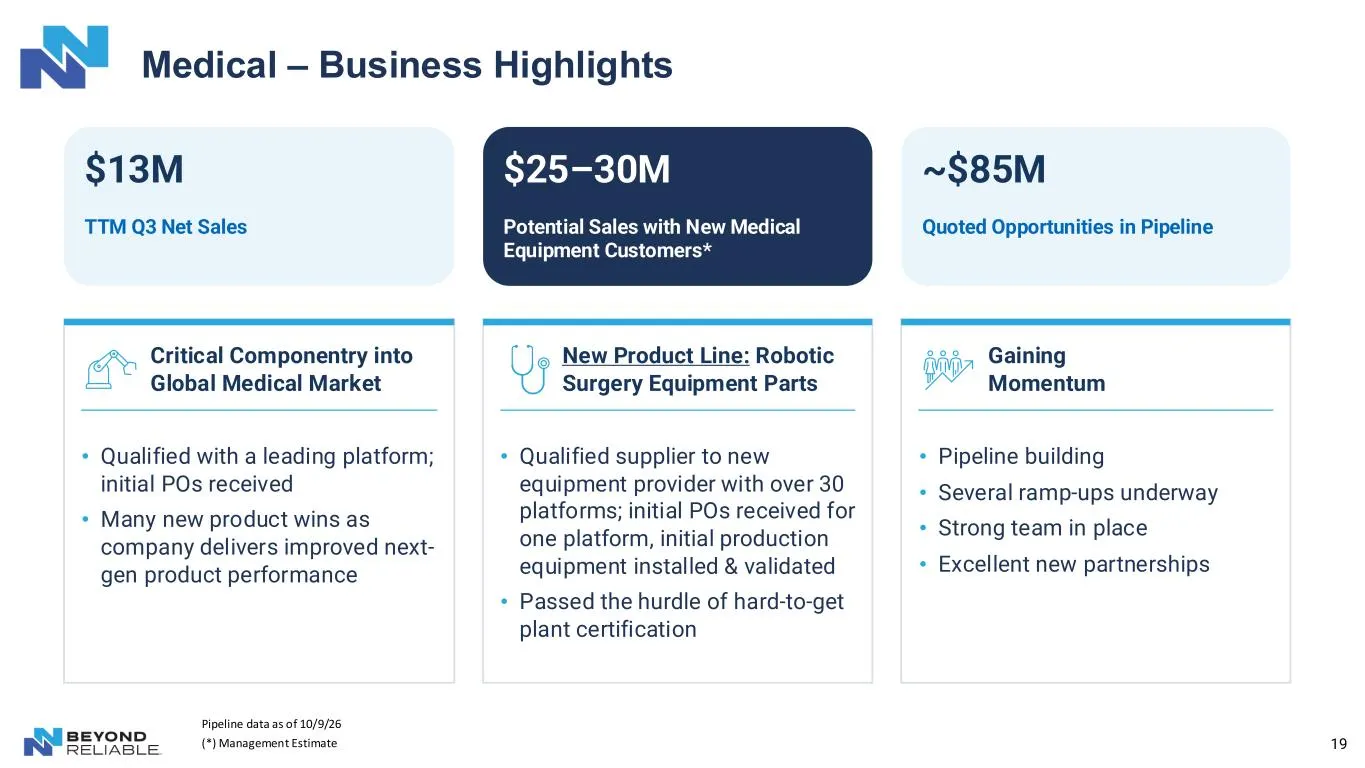
Slide 19: Medical – Business Highlights
19 Medical – Business Highlights $13M TTM Q3 Net Sales Critical Componentry into Global Medical Market $25–30M Potential Sales with New Medical Equipment Customers* New Product Line: Robotic Surgery Equipment Parts ~$85M Quoted Opportunities in Pipeline Gaining Momentum • Qualified with a leading pl
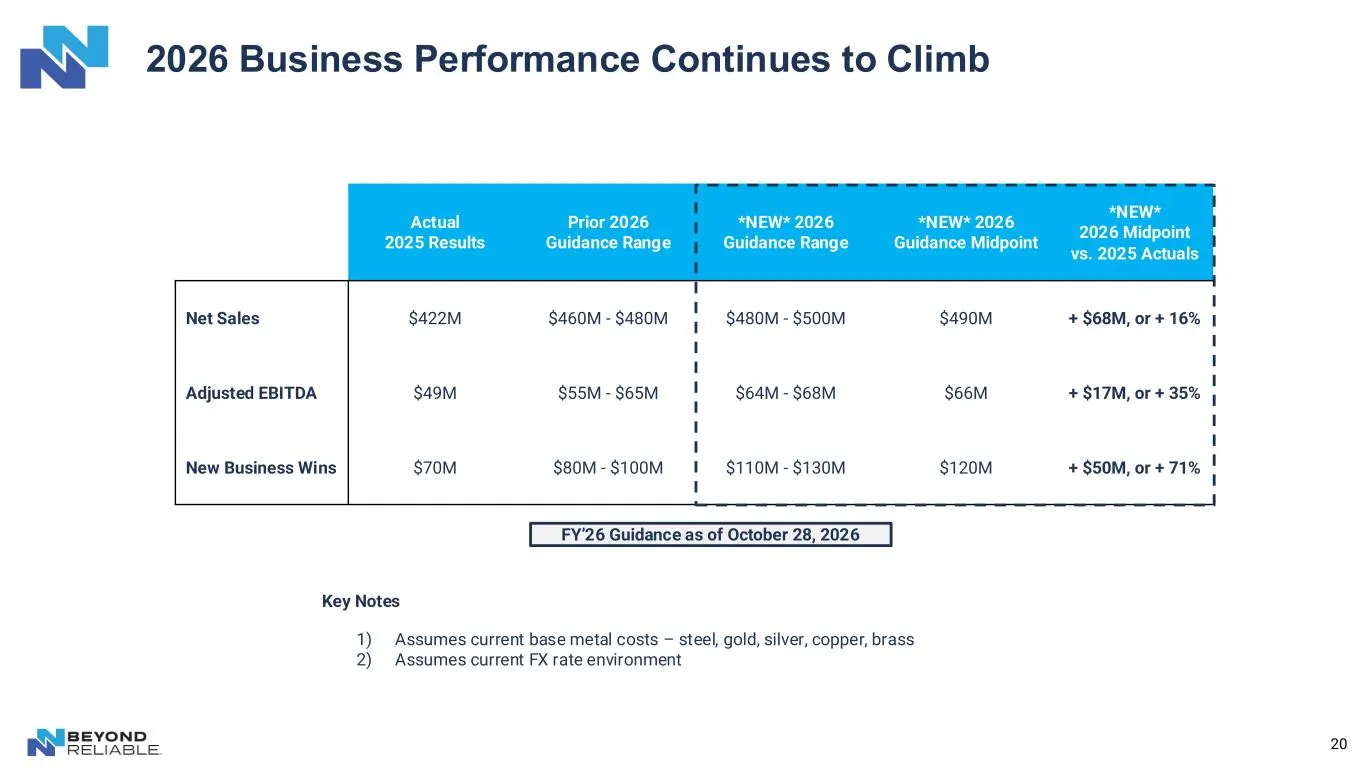
Slide 20: 2026 Business Performance Continues to Climb
20 2026 Business Performance Continues to Climb Actual 2025 Results Prior 2026 Guidance Range *NEW* 2026 Guidance Range *NEW* 2026 Guidance Midpoint *NEW* 2026 Midpoint vs. 2025 Actuals Net Sales $422M $460M - $480M $480M - $500M $490M + $68M, or + 16% Adjusted EBITDA $49M $55M - $65M $64M - $68M $6
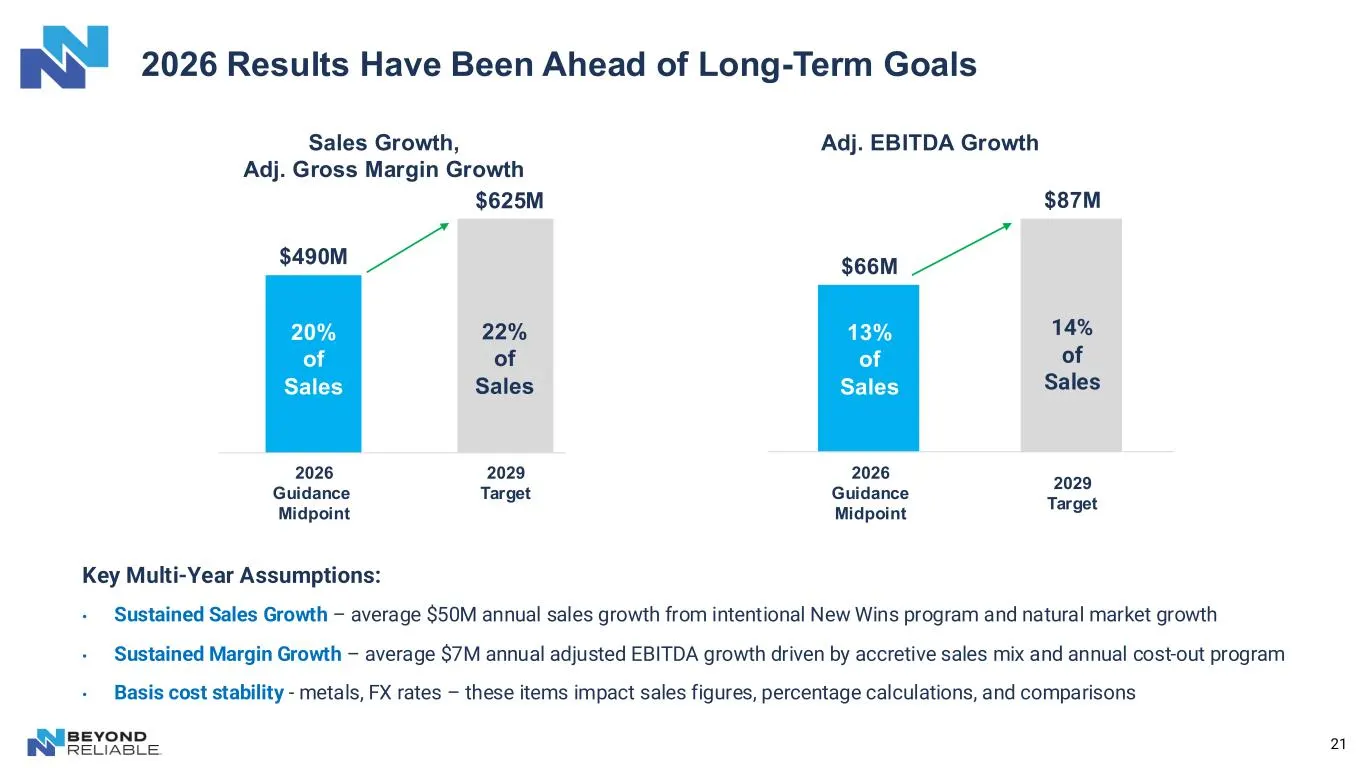
Slide 21: 2026 Results Have Been Ahead of Long-Term Goals
2026 Results Have Been Ahead of Long-Term Goals 21 Key Multi-Year Assumptions: • Sustained Sales Growth – average $50M annual sales growth from intentional New Wins program and natural market growth • Sustained Margin Growth – average $7M annual adjusted EBITDA growth driven by accretive sales mix a
Slide 22: Appendix
Appendix WNBEvOND RELIABLE.
Slide 23: Non-GAAP financial measures
23 This presentation contains certain financial measures not presented in accordance with U.S. generally accepted accounting principles ("GAAP"), including adjusted gross margin, adjusted gross margin %, adjusted income from operations, adjusted EBITDA, adjusted EBITDA margin % and net debt (collect
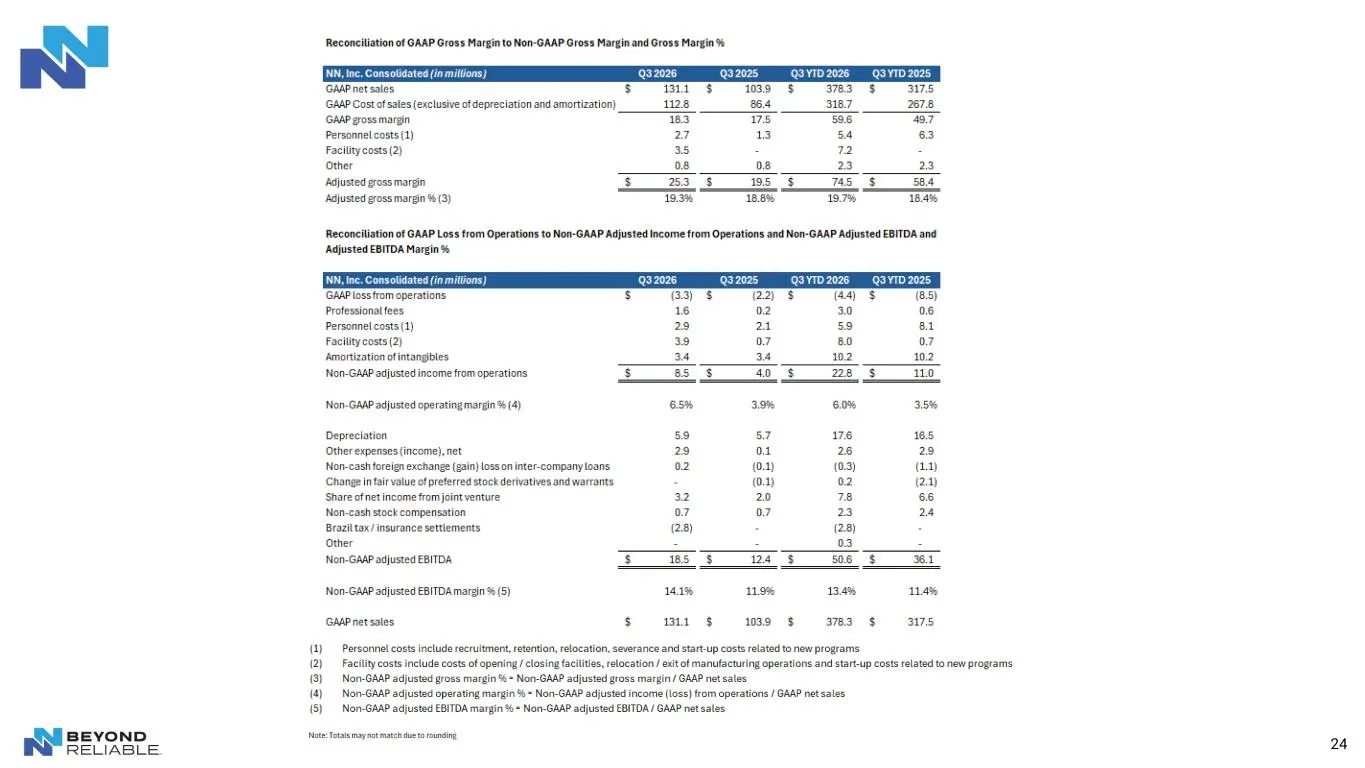
Slide 24: Reconciliation of GAAP to Non-GAAP Gross Margin and EBITDA
BEYOND RELIABLE Reconciliation of GAAP Gross Margin to Non-GAAP Gross Margin and Gross Margin ® INN, Ine, Consolidated in milions (932026 ‘GAAP net sales $s it $ 1039 $ 373 § SITS GAAP Cost of sales (exclusive of depreciation and amortization) 128 864 3187 2678 GAAP grossmargin 183 75 Ea 97 Personne
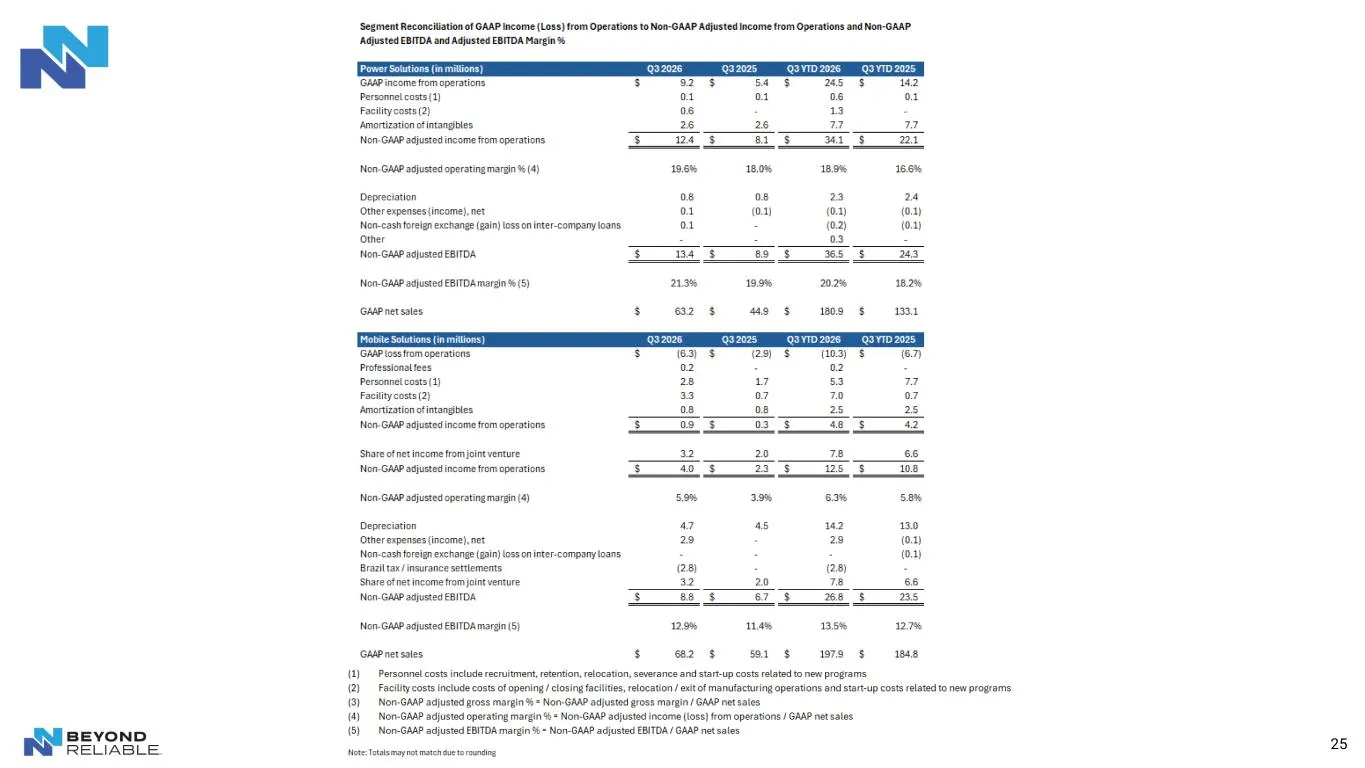
Slide 25: Segment Reconciliation of GAAP to Non-GAAP
BEYOND RELIABLE ‘Segment Reconcilation of GAAP Income (Loss) from Operations to Non-GAAP Adjusted Income from Operations and Non-GAAP ‘Adjusted EBITDA and Adjusted EBITDA Margin % ‘GAAP income remoperations| Personne costs(1) Focitycosts(2) “Amortization otintangbles Non-GAAP austedincome trom opera
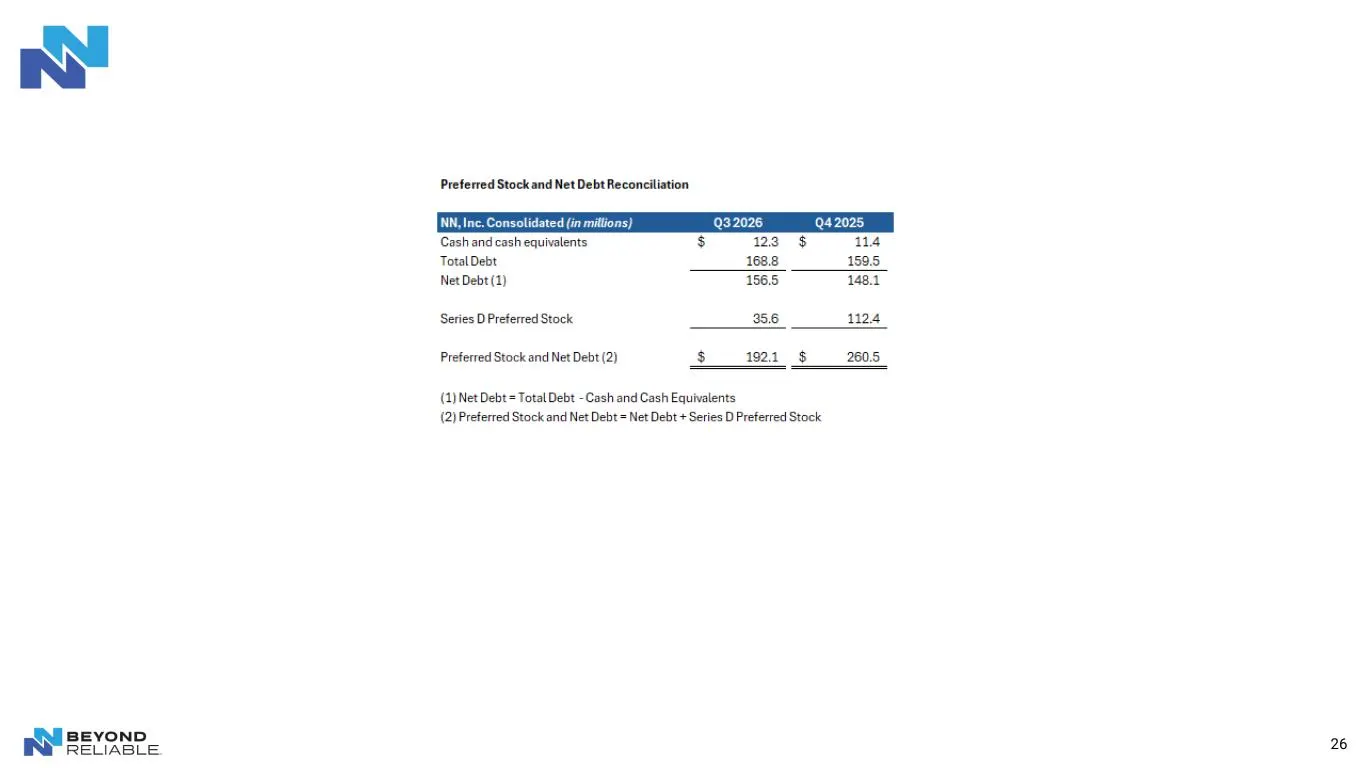
Slide 26: Preferred Stock and Net Debt Reconciliation
ij BEYOND RELUABLE Preferred Stock and Net DebtReconciliation idated (in millions) Q32026 9420: Cash and cash equivalents, $ 123 $ Total Debt 168.8 Net Debt (1) 156.5 Series D Preferred Stock 356 112.4 Preferred Stock and Net Debt (2) (1) Net Debt =Total Debt -Cash and Cash Equivalents (2) Preferred
Slide 27: Thank You
Thank You BEYOND INP RELIABLE
Source: SEC EDGAR · 8-K filed Nov 16, 2026
More decks from NN, Inc.
 Q3 2026 Earnings Presentation23 slides · Oct 28, 2026
 D.A. Davidson Diversified Industrials & Services Investor Conference 202627 slides · Sep 22, 2026
 Lake Street Investor Conference 202624 slides · Sep 9, 2026
 Investor Presentation (August 2026)24 slides · Aug 20, 2026
 Q2 2026 Earnings Presentation18 slides · Aug 6, 2026
 Investor Presentation (June 2026)21 slides · Jun 22, 2026