QTS Realty Trust — Investor Day (November 2017)
110 slides from QTS Realty Trust's investor day presentation, Nov 13, 2017
Slide 1: Forward Looking Statements
QTS INVESTOR DAY 2017 1 Forward Looking Statements Some of the statements contained in this presentation constitute forward-looking statements within the meaning of the federal securities laws. Forward-looking statements relate to expectations, beliefs, projections, future plans and strategies, anti
Slide 2: Welcome to QTS Fort Worth: The QTS Story
2 Welcome to QTS Fort Worth The QTS Story Chad Williams, Chairman & CEO © 2017 QTS. All Rights Reserved.
Slide 3: Financial Achievements
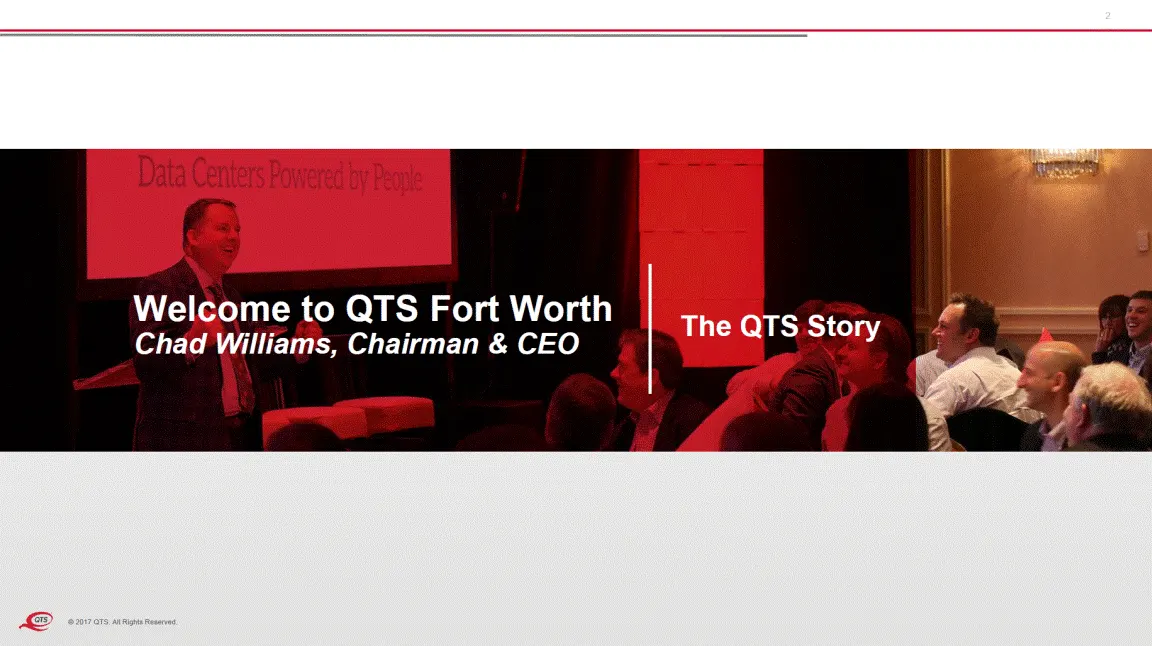
QTS INVESTOR DAY 2017 3 Financial Achievements QTS Has More Business Since the than Doubled Its IPO in October 2013 25% Revenue 28% 31% 17% Operating Adjusted EBITDA Operating FFO FFO Per Share CAGR © 2017 QTS. All Rights Reserved.
Slide 4: Operating Achievements
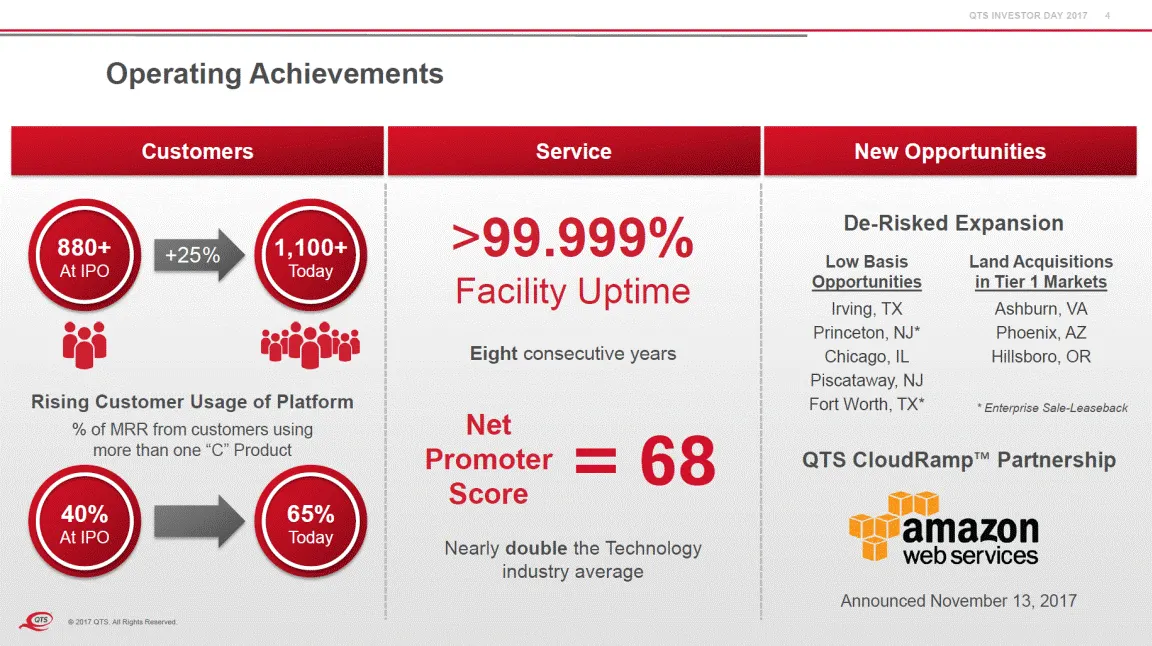
QTS INVESTOR DAY 2017 4 Operating Achievements Customers Service New Opportunities >99.999% Facility Uptime Eight consecutive years De-Risked Low Basis Opportunities Irving, TX Princeton, NJ* Chicago, IL Piscataway, NJ Fort Worth, TX* Expansion Land Acquisitions in Tier 1 Markets 880+ At IPO 1,100+
Slide 5: QTS is Well-Positioned for Continued Future Growth
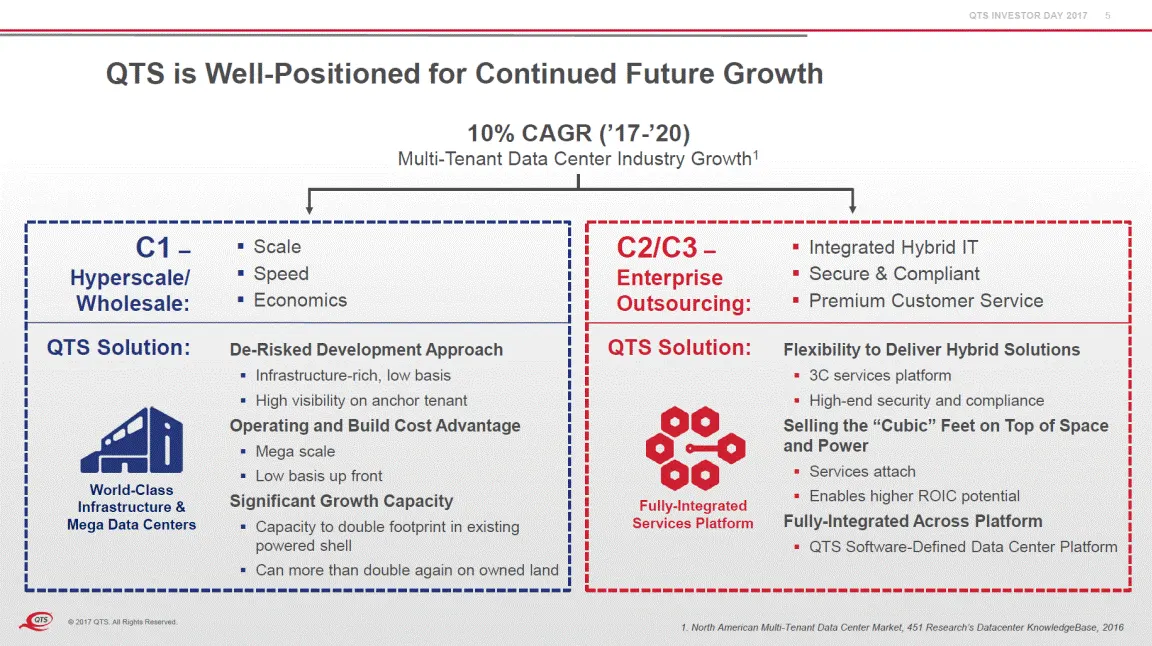
QTS INVESTOR DAY 2017 5 QTS is Well-Positioned for Continued Future Growth 10% CAGR (’17-’20) Multi-Tenant Data Center Industry Growth1 World-Class Significant Growth Capacity Capacity to double footprint in existing Mega Data Centers © 2017 QTS. All Rights Reserved. 1. North American Multi-Tenant D
Slide 6: QTS Growth Acceleration Plan
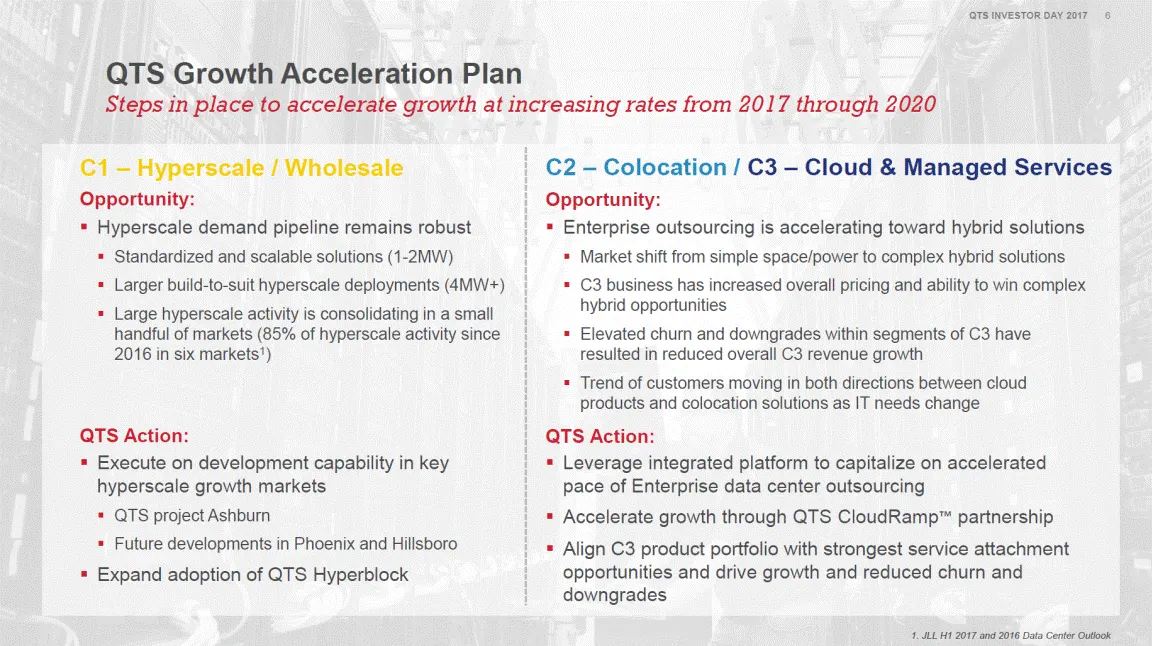
QTS INVESTOR DAY 2017 6 QTS Growth Acceleration Plan Steps in place to accelerate growth at increasing rates from 2017 through 2020 C1 – Hyperscale / Wholesale Opportunity: Hyperscale demand pipeline remains robust C2 – Colocation / C3 – Cloud & Managed Services Opportunity: Enterprise outsourcing i
Slide 7: QTS Investor Day 2017 – Agenda
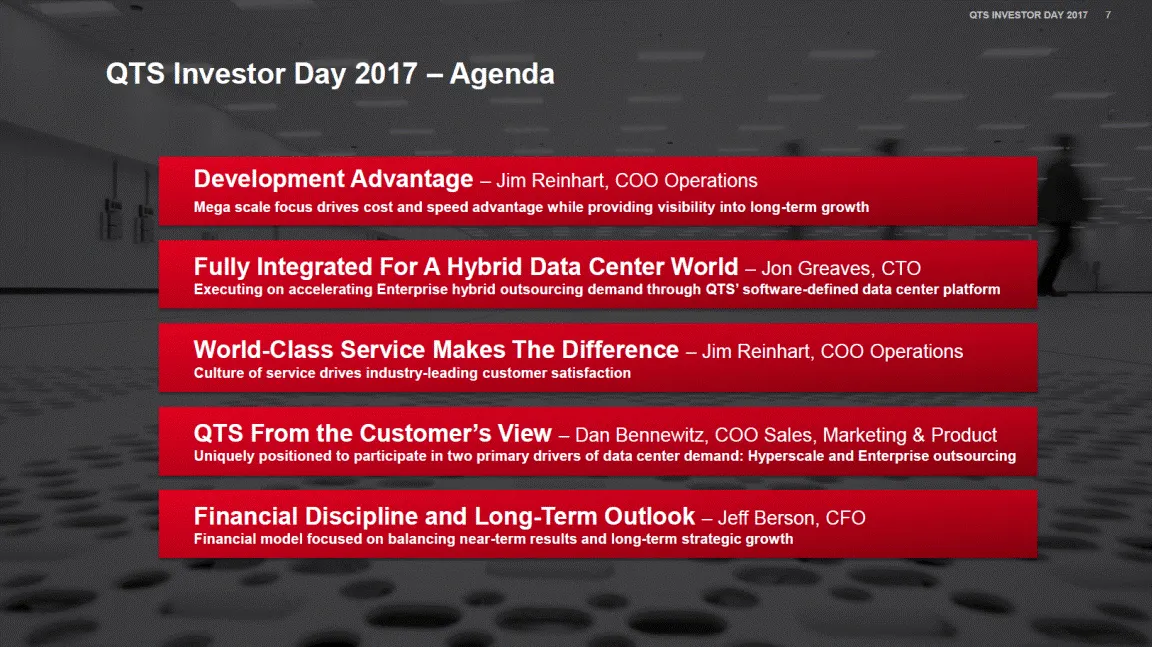
QTS INVESTOR DAY 2017 7 QTS Investor Day 2017 – Agenda Development Advantage – Jim Reinhart, COO Operations Mega scale focus drives cost and speed advantage while providing visibility into long-term growth Fully Integrated For A Hybrid Data Center World – Jon Greaves, CTO Executing on accelerating E
Slide 8: QTS Development Strategy
8 QTS Development Strategy © 2017 QTS. All Rights Reserved.
Slide 9: QTS Development Strategy
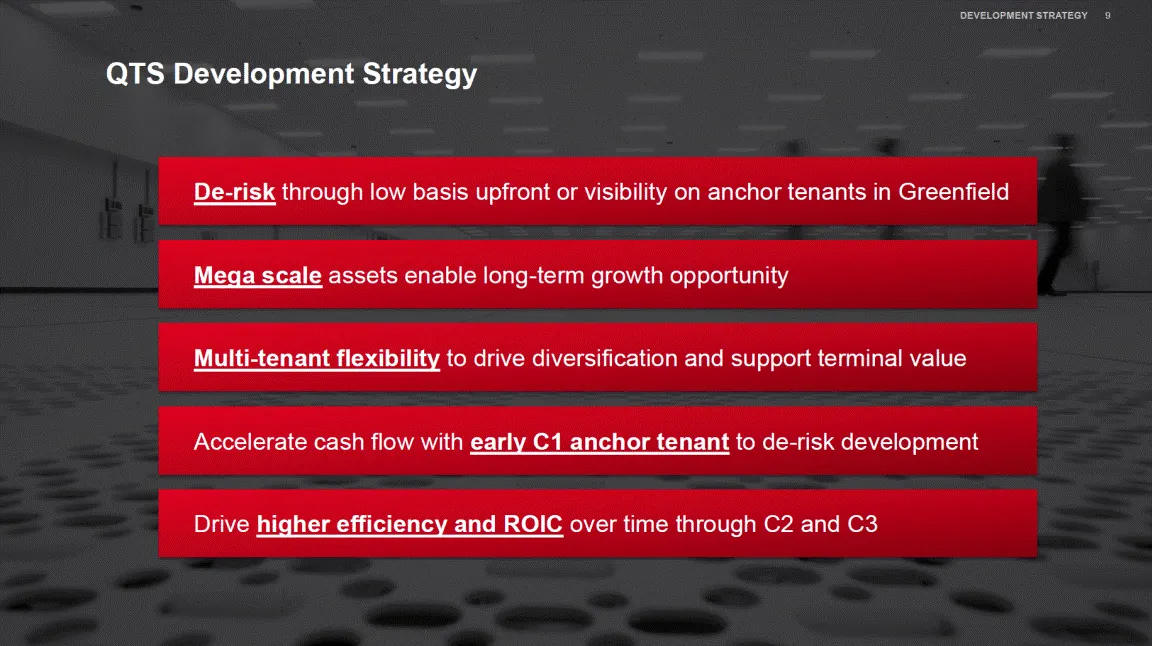
DEVELOPMENT STRATEGY 9 QTS Development Strategy De-risk through low basis upfront or visibility on anchor tenants in Greenfield Mega scale assets enable long-term growth opportunity Multi-tenant flexibility to drive diversification and support terminal value Accelerate cash flow with early C1 anchor
Slide 10: Broad And Diversified Platform
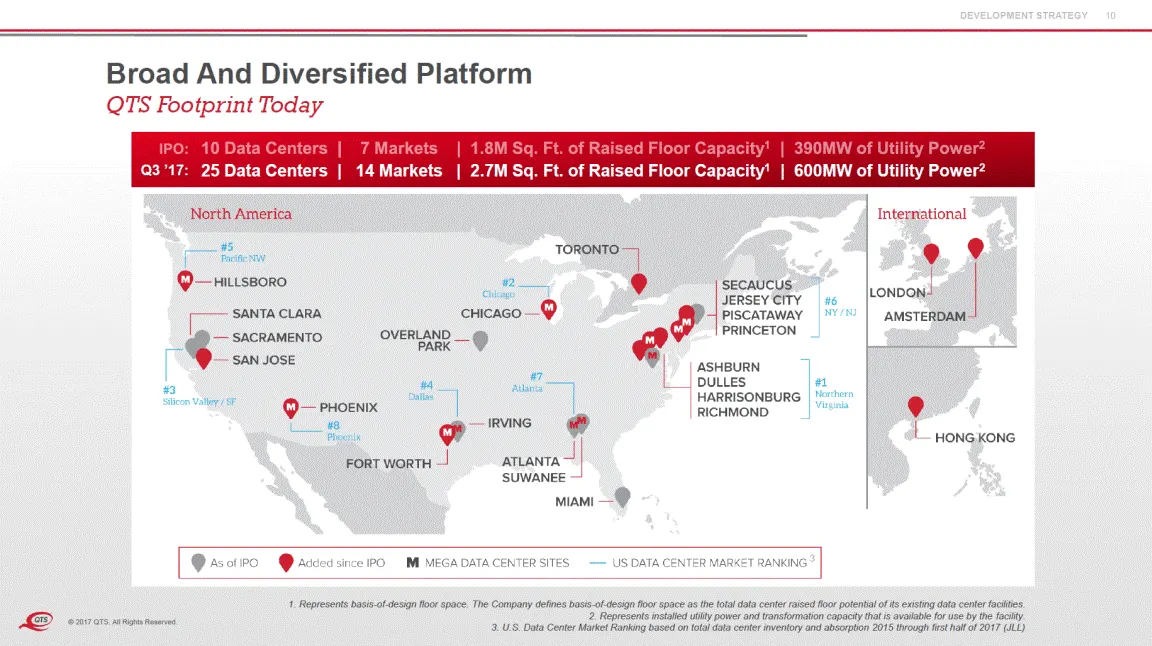
DEVELOPMENT STRATEGY 10 Broad And Diversified Platform QTS Footprint Today 2.7M Sq. Ft. of Raised Floor Capacity1 600MW of Utility Power2 Q3 ’17: 25 Data Centers | 14 Markets | | 3 1. Represents basis-of-design floor space. The Company defines basis-of-design floor space as the total data center rai
Slide 11: Disciplined Approach to Acquiring Land
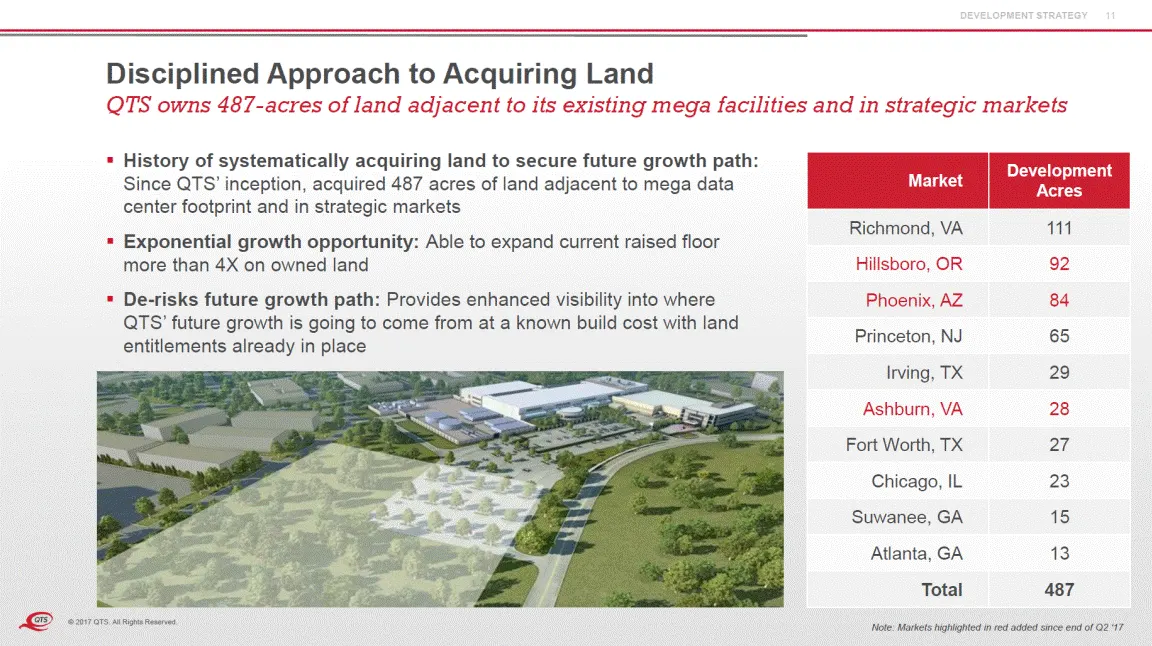
DEVELOPMENT STRATEGY 11 Disciplined Approach to Acquiring Land QTS owns 487-acres of land adjacent to its existing mega facilities and in strategic markets History of systematically acquiring land to secure future growth path: Since QTS’ inception, acquired 487 acres of land adjacent to mega data ce
Slide 12: Disciplined Development Approach
DEVELOPMENT STRATEGY 12 Disciplined Development Approach Capital discipline and de-risked entry point Continued focus on capital discipline to balance long-term growth with near-term results De-risked approach to new market entry Infrastructure designed to support multi-tenant environments to enable
Slide 13: Significant Scale In The Top U.S. Markets
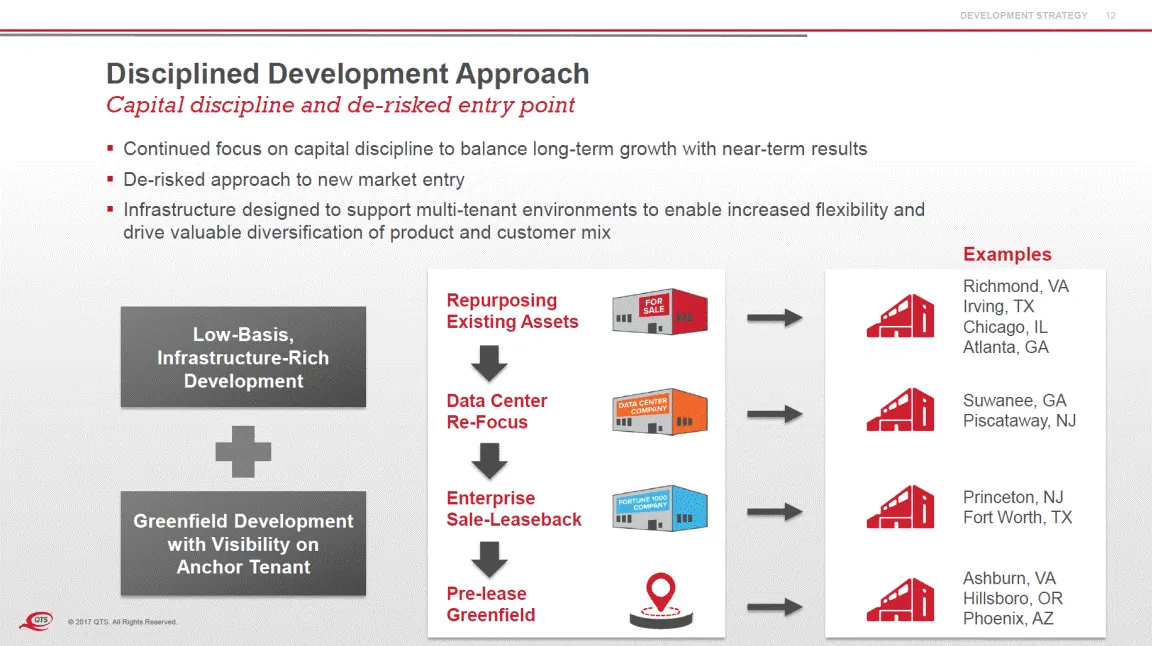
DEVELOPMENT STRATEGY 13 Significant Scale In The Top U.S. Markets Current capacity of approximately 2.7 million of raised floor NRSF1 within existing powered shell and 600MW of available utility power2 QTS Capacity within Top U.S. Markets 1,800 1,657 1,600 1,400 1,200 1,057 1,000 800 600 435 400 200
Slide 14: Enhancing Growth Capacity in Northern Virginia
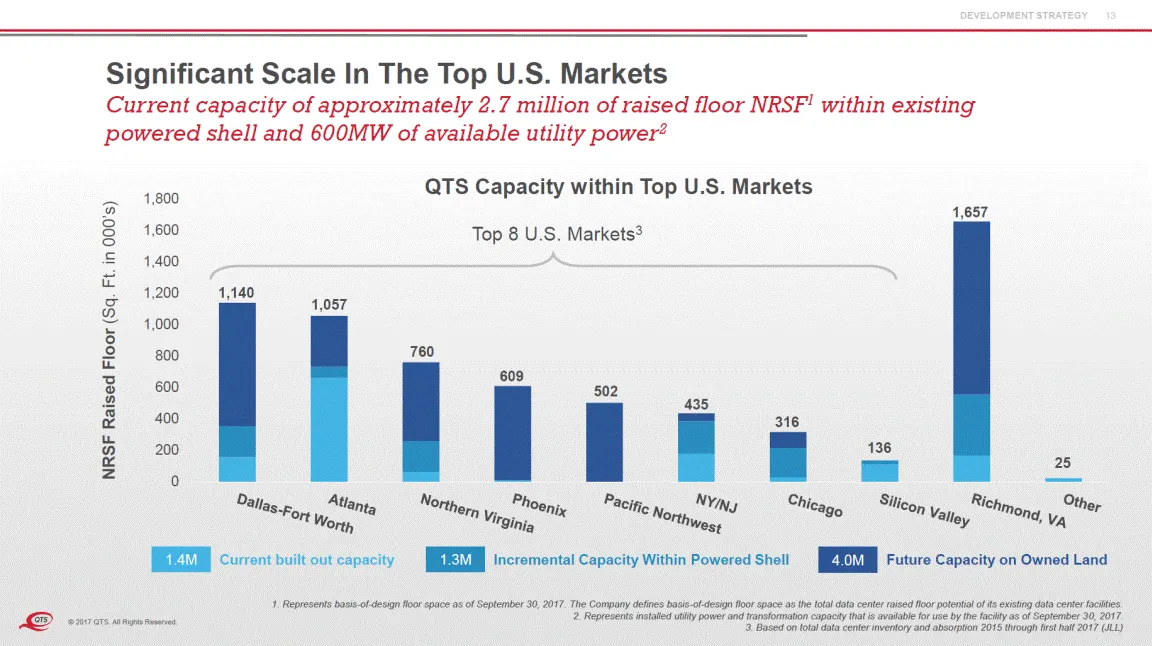
DEVELOPMENT STRATEGY 14 Enhancing Growth Capacity in Northern 52-acres in Ashburn,Virginia acquired for $53M Virginia 24-acres QTS 28-acres Vault Facility More than 700,000 sq. ft. of potential raised floor capacity and 140MW of gross power Near-adjacent to existing QTS Vault Facility1 Enhances futu
Slide 15: Differentiated Development Approach
15 Differentiated Development Approach Jim Reinhart, COO - Operations © 2017 QTS. All Rights Reserved.
Slide 16: Differentiated Development Approach
16 Differentiated Development Approach De-Risked Development Approach Mega Scale Flexible Infrastructure Data Centers © 2017 QTS. All Rights Reserved.
Slide 17: Mega Scale Data Centers Enable Rapid Expansion
17 Differentiated Development Approach Mega Scale Data Centers Enables Rapid Expansion & Long-Term Future Growth Drives Build and Operating Cost Advantage Facilitates Growth Opportunity With Hyperscale Customers © 2017 QTS. All Rights Reserved. Flexible Infrastructure De-Risked Development Approach
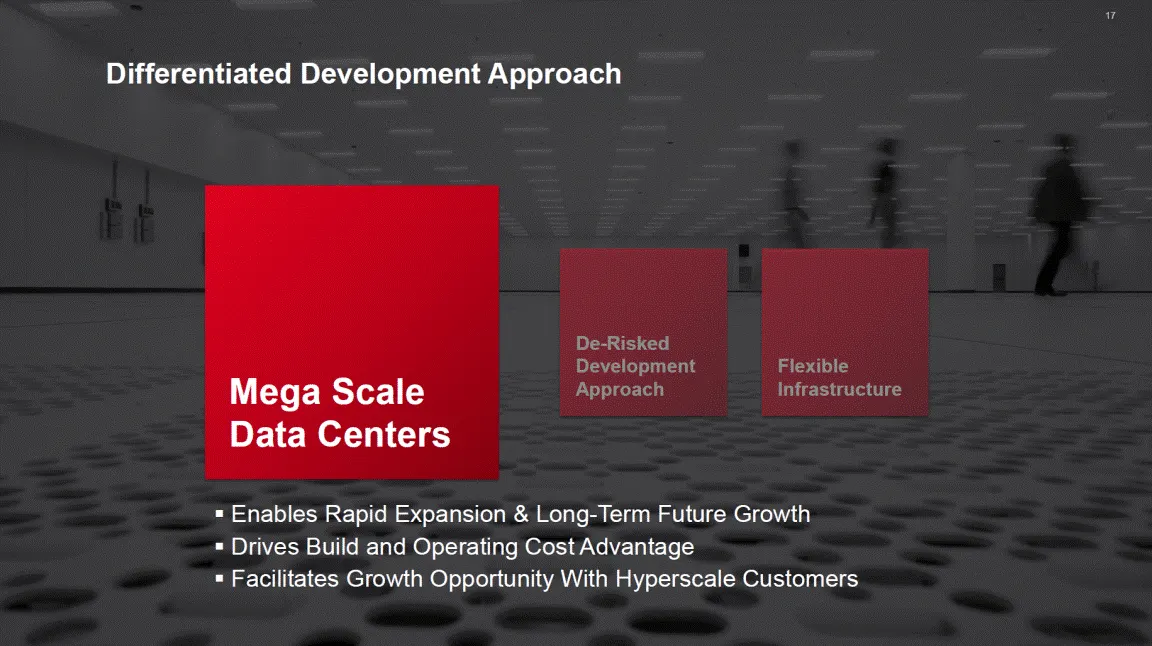
Slide 18: Capacity Within Powered Shell Represents 5+ Years of Growth
MEGA SCALE DATA CENTERS DE-RISKED DEVELOPMENT FLEXIBLE INFRASTRUCTURE 18 Capacity Within Powered Shell Represents 5+ Years of Growth Enhanced visibility into future growth and development pipeline at a known build cost and incrementally higher returns +90% Increase Growth Opportunity Within Existing
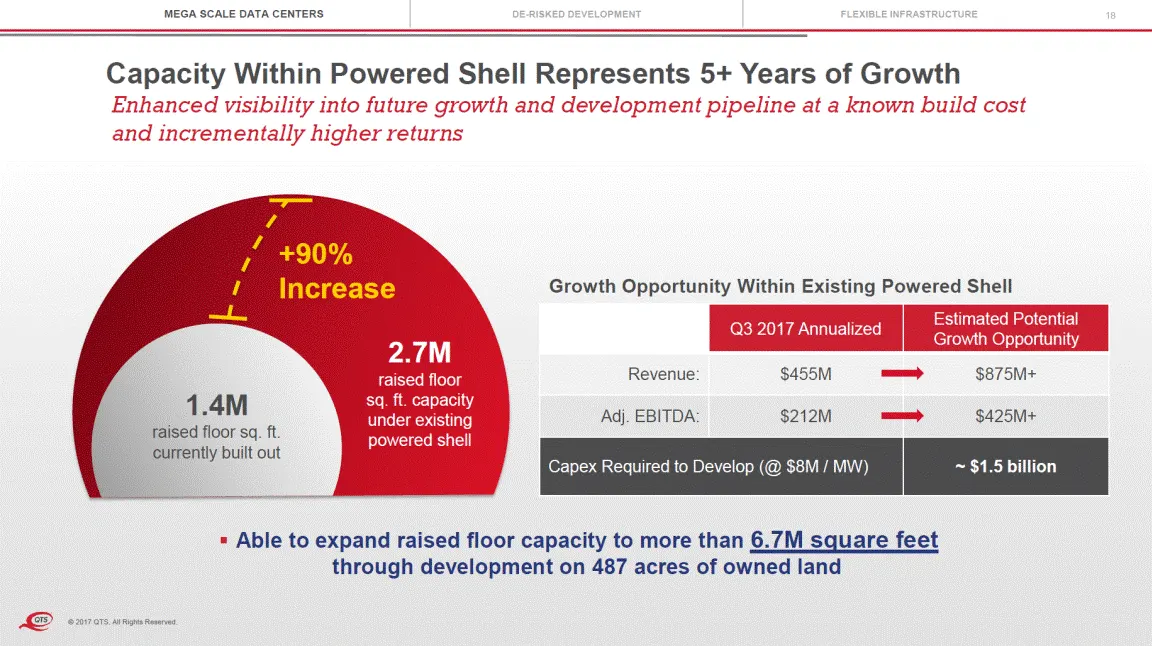
Slide 19: Mega Scale Supports Build and Operating Cost Advantage
MEGA SCALE DATA CENTERS DE-RISKED DEVELOPMENT FLEXIBLE INFRASTRUCTURE 19 Mega Scale Supports Sustainable Build and Operating Cost Advantage Greater the scale, greater the cost leverage, and better the return potential 18 80% 16 75% 14 ta, GA 70% 12 65% 10 60% 8 ega Data Centers ncludes Atlanta, GA;
Slide 20: Powered Shell Capacity Provides Speed Advantage
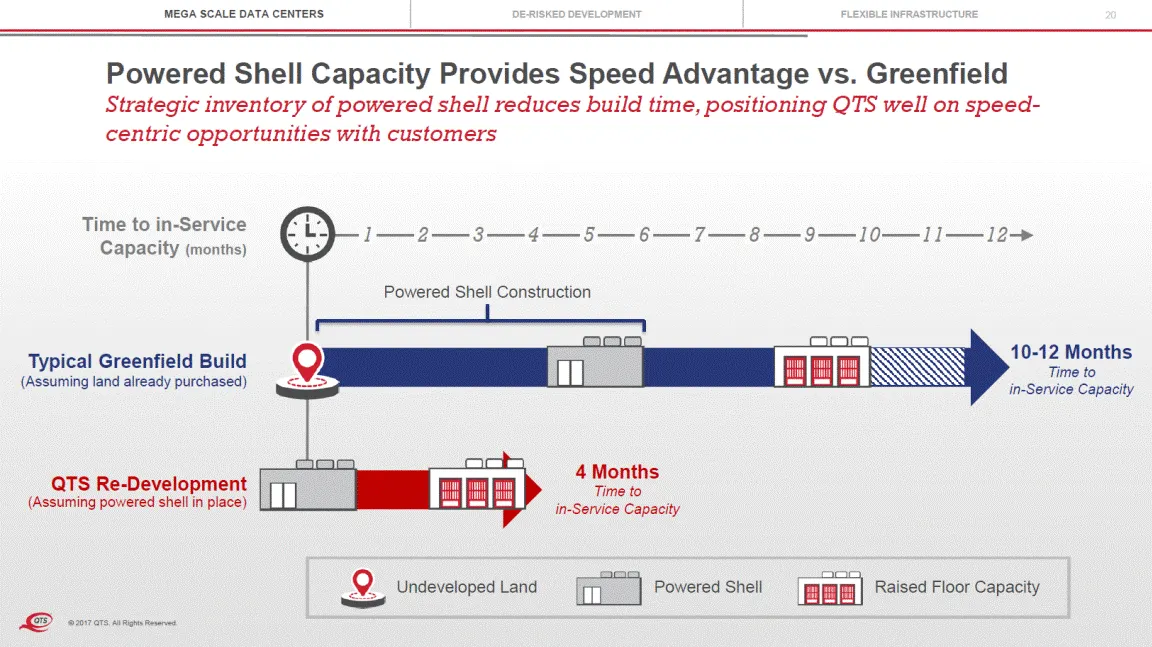
MEGA SCALE DATA CENTERS DE-RISKED DEVELOPMENT FLEXIBLE INFRASTRUCTURE 20 Powered Shell Capacity Provides Speed Advantage vs. Greenfield Strategic inventory of powered shell reduces build time, positioning QTS well on speed-centric opportunities with customers Time to in-Service Capacity (months) 10
Slide 21: Enabling the Spectrum of Hyperscale Requirements
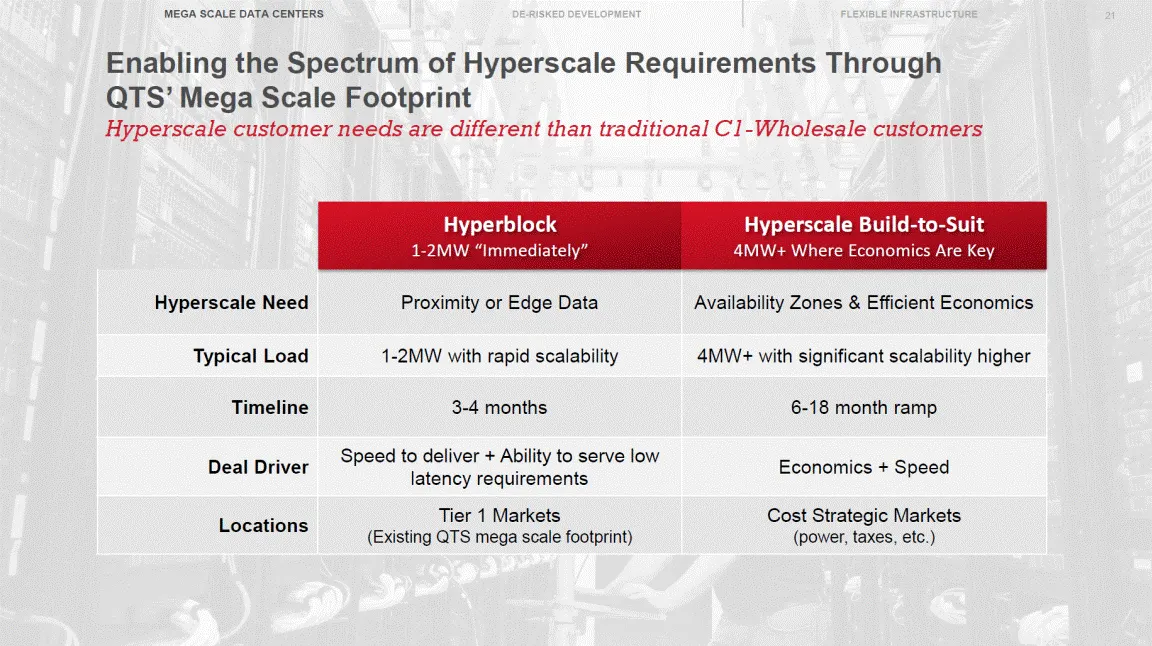
MEGA SCALE DATA CENTERS DE-RISKED DEVELOPMENT FLEXIBLE INFRASTRUCTURE 21 Enabling the Spectrum of Hyperscale Requirements Through QTS’ Mega Scale Footprint Hyperscale customer needs are different than traditional C1-Wholesale customers Hyperblock 1-2MW “Immediately” Hyperscale Build-to-Suit 4MW+ Whe
Slide 22: De-Risked Development Approach
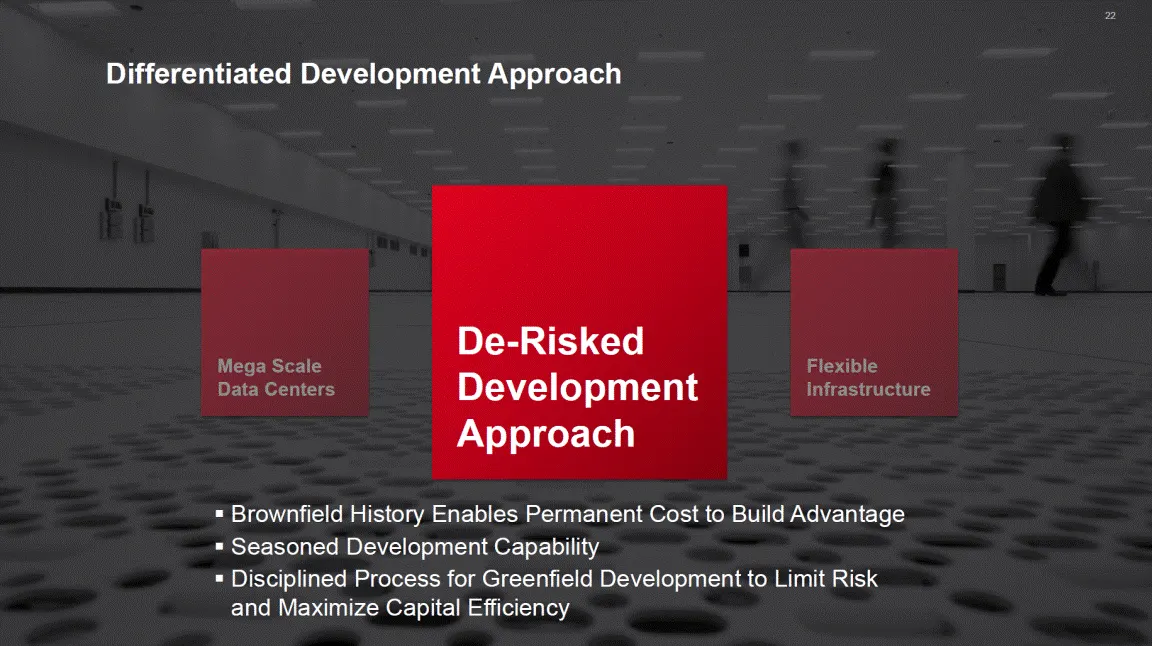
22 Differentiated Development Approach De-Risked Development Approach Brownfield History Enables Permanent Cost Seasoned Development Capability to Build Advantage Disciplined Process for Greenfield Development to Limit Risk and Maximize Capital Efficiency © 2017 QTS. All Rights Reserved. Flexible In
Slide 23: Successful Track Record at a Low Basis
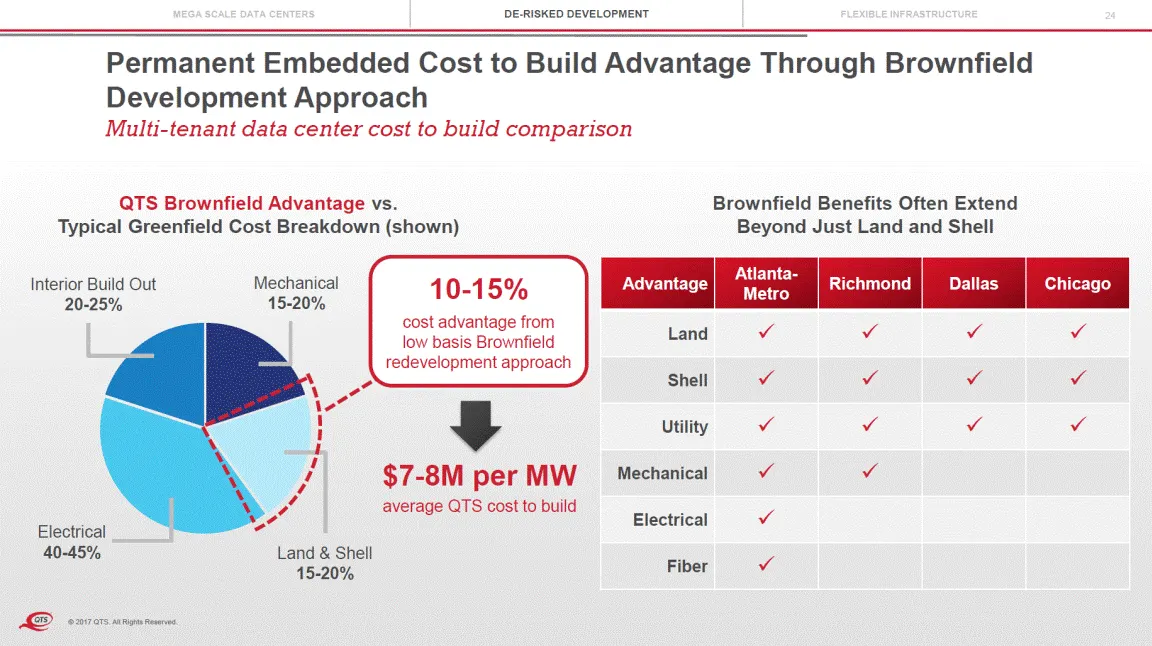
MEGA SCALE DATA CENTERS DE-RISKED DEVELOPMENT FLEXIBLE INFRASTRUCTURE 23 Successful Track at a Low Basis Record of Finding Infrastructure-Rich Assets Atlanta-Suwanee, GA 2005 15-Acres 205,608 Sq. Ft. Raised Floor Capacity 36MW Utility Power Richmond, VA 2010 111-Acres 557,309 Sq. Ft. Raised Floor Ca
Slide 24: Brownfield Experience Develops Greenfield Expertise
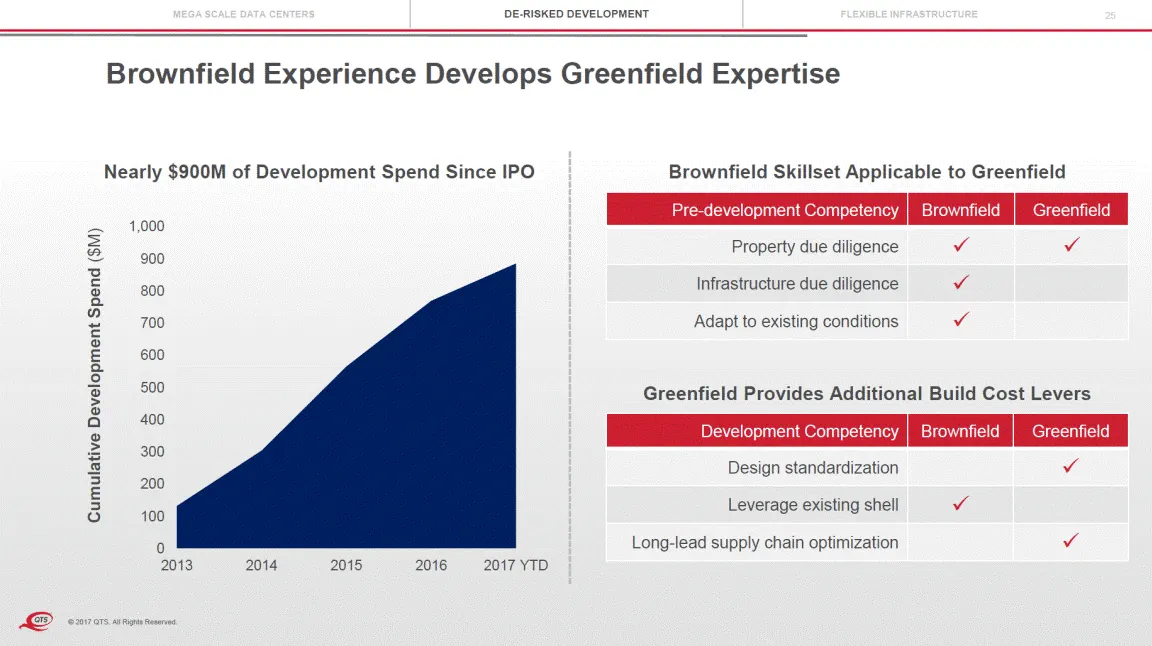
MEGA SCALE DATA CENTERS DE-RISKED DEVELOPMENT FLEXIBLE INFRASTRUCTURE 25 Brownfield Experience Develops Greenfield Expertise Nearly $900M of Development Spend Since IPO Brownfield Skillset Applicable to Greenfield 1,000 900 800 700 600 500 Greenfield Provides Additional Build Cost Levers 400 300 200
Slide 25: A De-Risked Approach to Greenfield Development
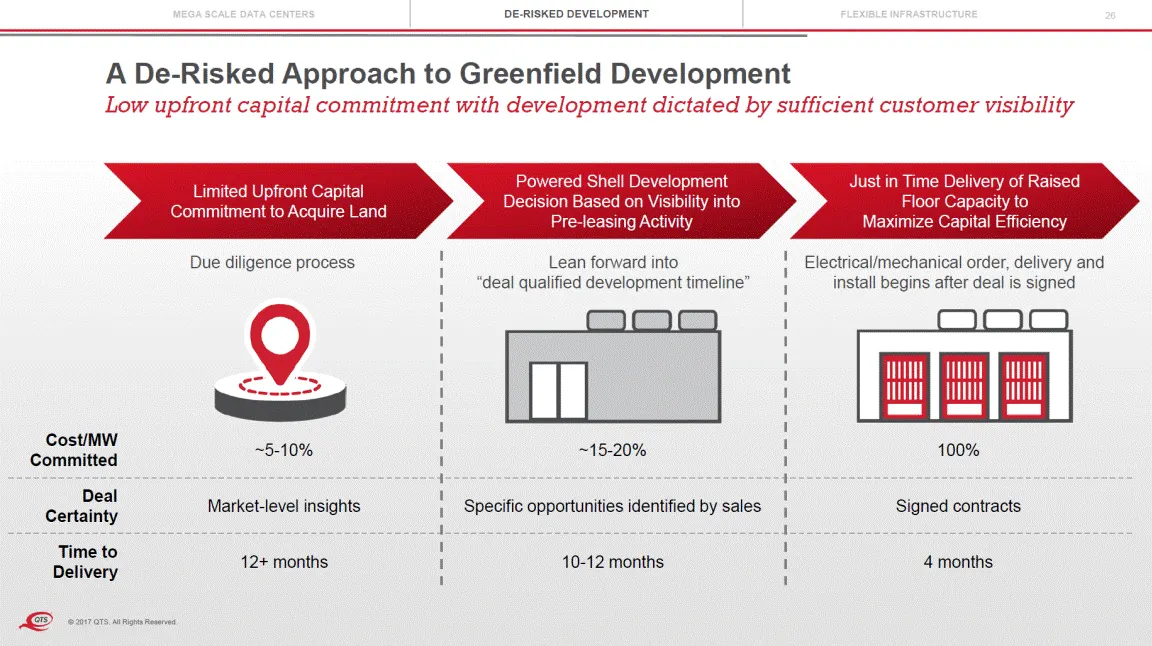
MEGA SCALE DATA CENTERS DE-RISKED DEVELOPMENT FLEXIBLE INFRASTRUCTURE 26 A De-Risked Approach to Greenfield Development Low upfront capital commitment with development dictated by sufficient customer visibility Powered Shell Development Decision Based on Visibility into Pre-leasing Activity Just in
Slide 26: Flexible Infrastructure Enables Diverse Customer Ecosystems
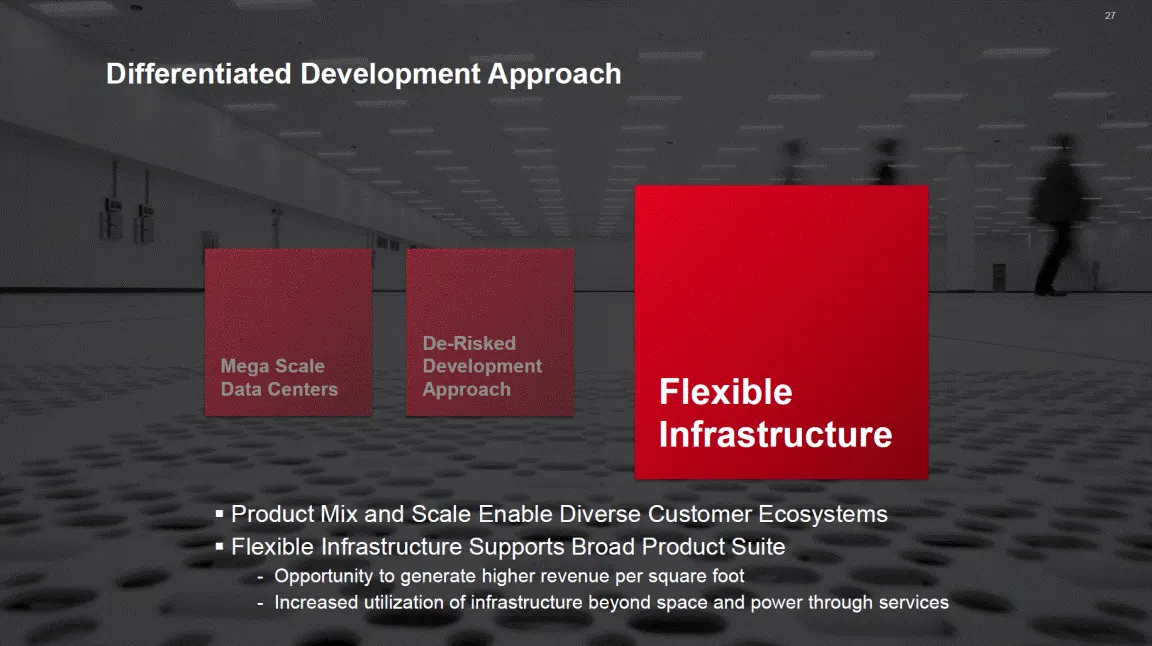
27 Differentiated Development Approach Flexible Infrastructure Product Mix and Scale Enable Diverse Customer Ecosystems Flexible Infrastructure Supports Broad Product Suite - Opportunity to generate higher revenue per square foot - Increased utilization of infrastructure beyond space and power throu
Slide 27: Scale Enables Customer Ecosystems
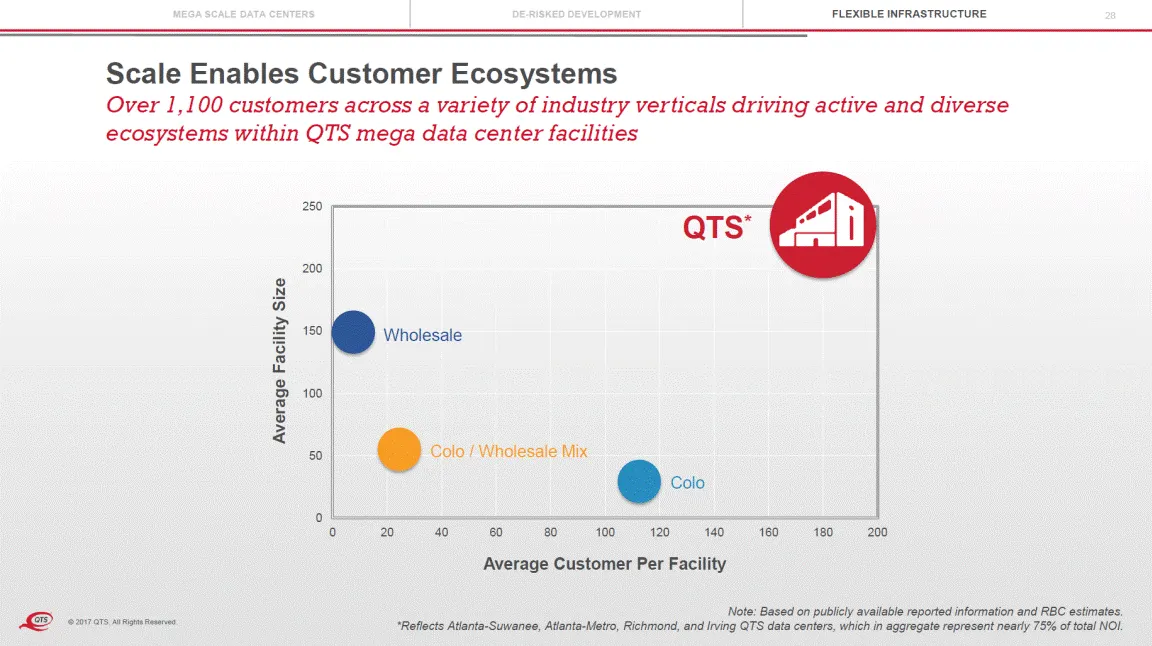
MEGA SCALE DATA CENTERS DE-RISKED DEVELOPMENT FLEXIBLE INFRASTRUCTURE 28 Scale Enables Customer Ecosystems Over 1,100 customers across a variety of industry verticals driving active and diverse ecosystems within QTS mega data center facilities 250 200 150 100 50 0 0 20 40 60 80 100 120 140 160 180 2
Slide 28: Flexible Infrastructure by Design
MEGA SCALE DATA CENTERS DE-RISKED DEVELOPMENT FLEXIBLE INFRASTRUCTURE 29 Flexible Infrastructure by Design QTS facilities are designed to support the delivery of hybrid solutions across a range of integrated services broad © 2017 QTS. All Rights Reserved.
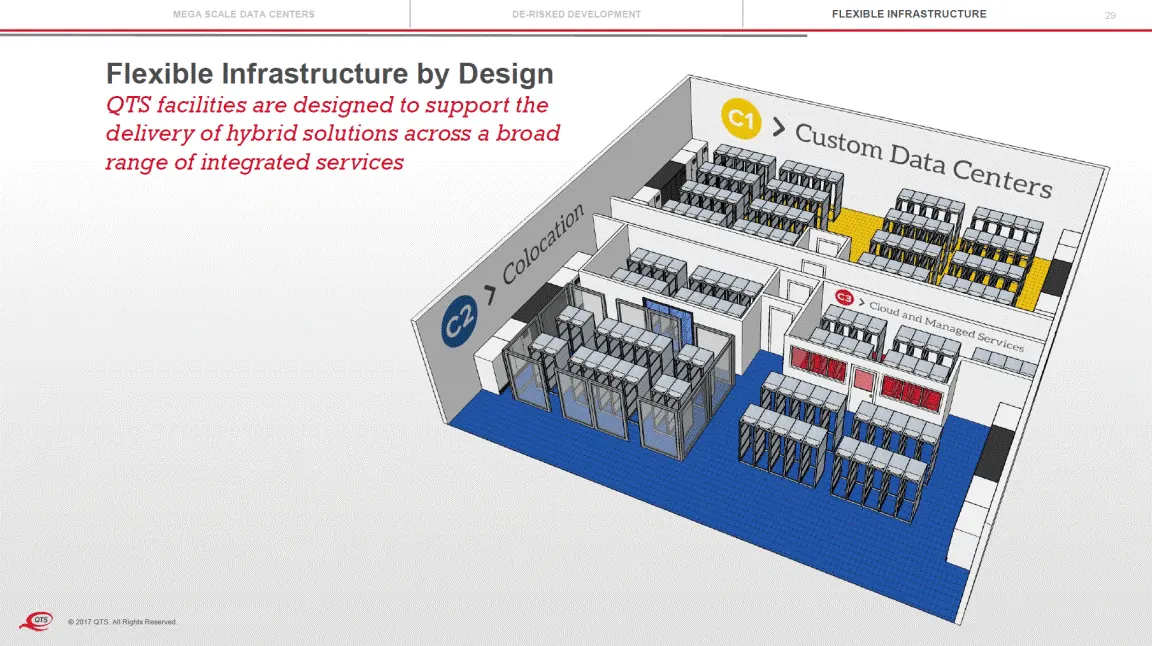
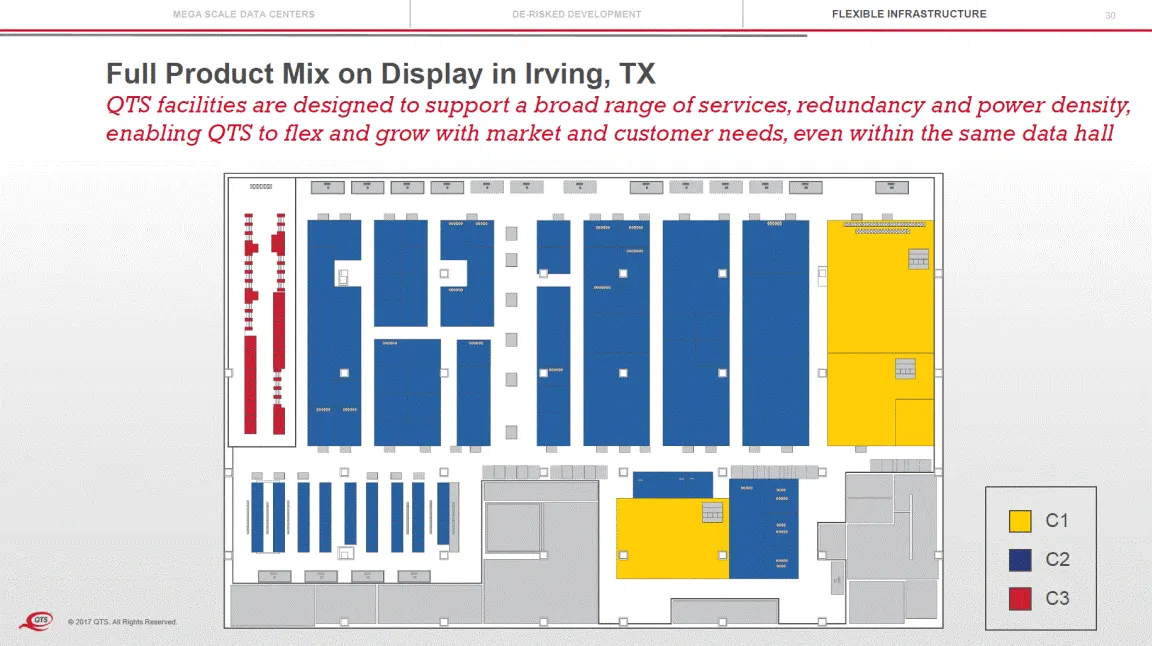
Slide 29: Full Product Mix on Display in Irving, TX
MEGA SCALE DATA CENTERS DE-RISKED DEVELOPMENT FLEXIBLE INFRASTRUCTURE 30 Full Product Mix on Display in Irving, TX QTS facilities are designed to support a broad range of services, redundancy and power density, enabling QTS to flex and grow with market and customer needs, even within the same data h
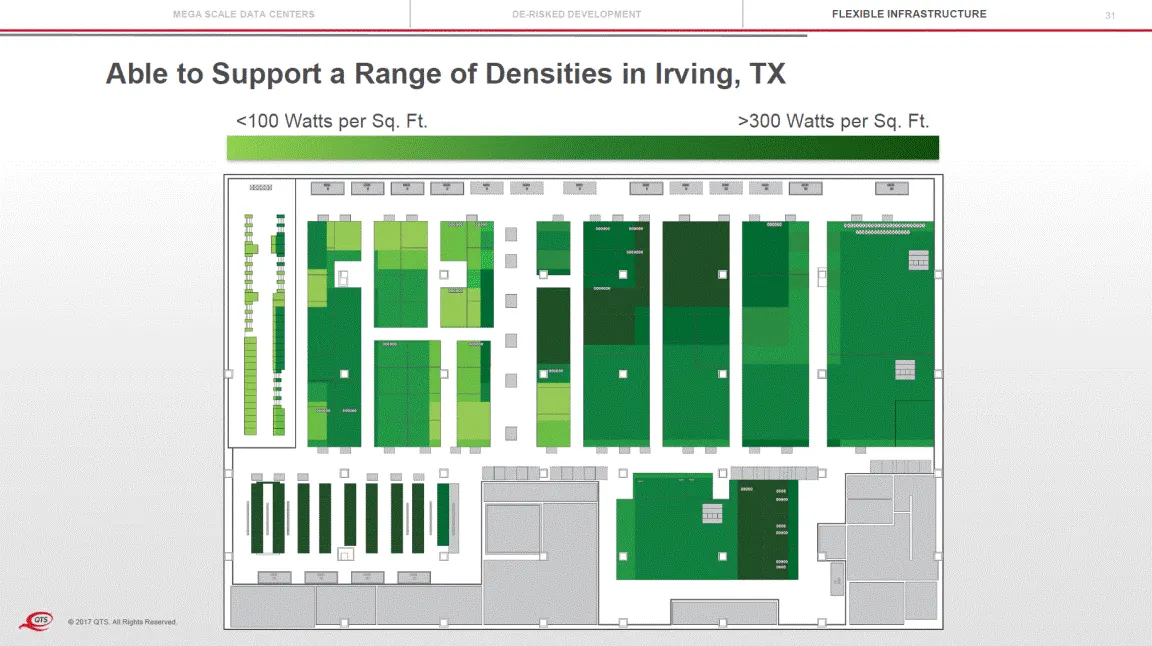
Slide 30: Able to Support a Range of Densities in Irving, TX
MEGA SCALE DATA CENTERS DE-RISKED DEVELOPMENT FLEXIBLE INFRASTRUCTURE 31 Able to Support a Range <100 Watts per Sq. Ft. of Densities in Irving, TX >300 Watts per Sq. Ft. © 2017 QTS. All Rights Reserved.
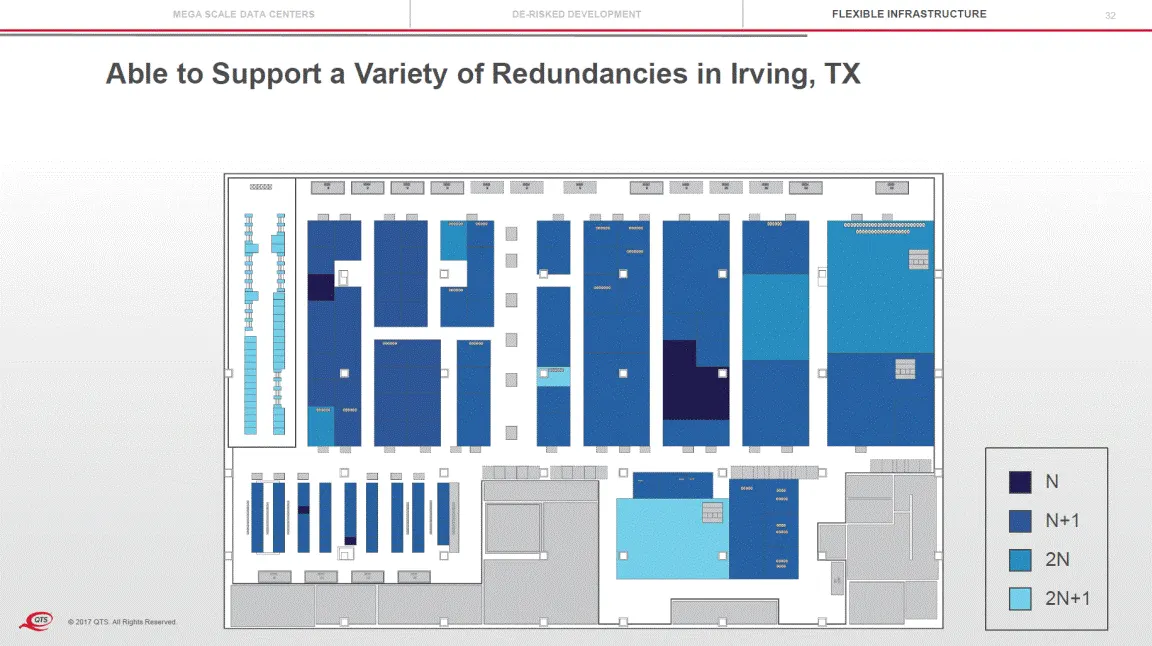
Slide 31: Able to Support a Variety of Redundancies in Irving, TX
FLEXIBLE INFRASTRUCTURE MEGA SCALE DATA CENTERS DE-RISKED DEVELOPMENT 32 Able to Support a Variety of Redundancies in Irving, TX D D ,.,ljjf;? © 2017 QTS. AJIRights Reserved N N+1 2N D 2N+1 D D D
Slide 32: Atlanta-Metro Case Study
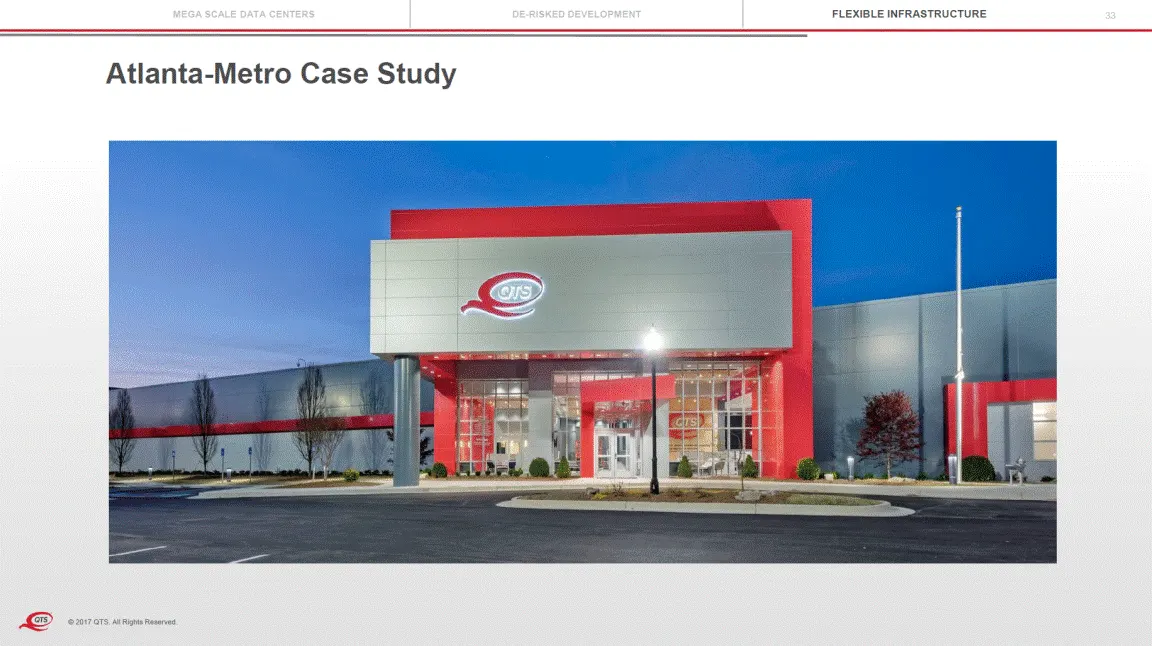
FLEXIBLE INFRASTRUCTURE MEGA SCALE DATA CENTERS DE-RISKED DEVELOPMENT 33 Atlanta-Metro Case Study ,.,ljjf;? © 2017 QTS. AJIRights Reserved
Slide 33: Atlanta-Metro Case Study: Customer Ecosystem
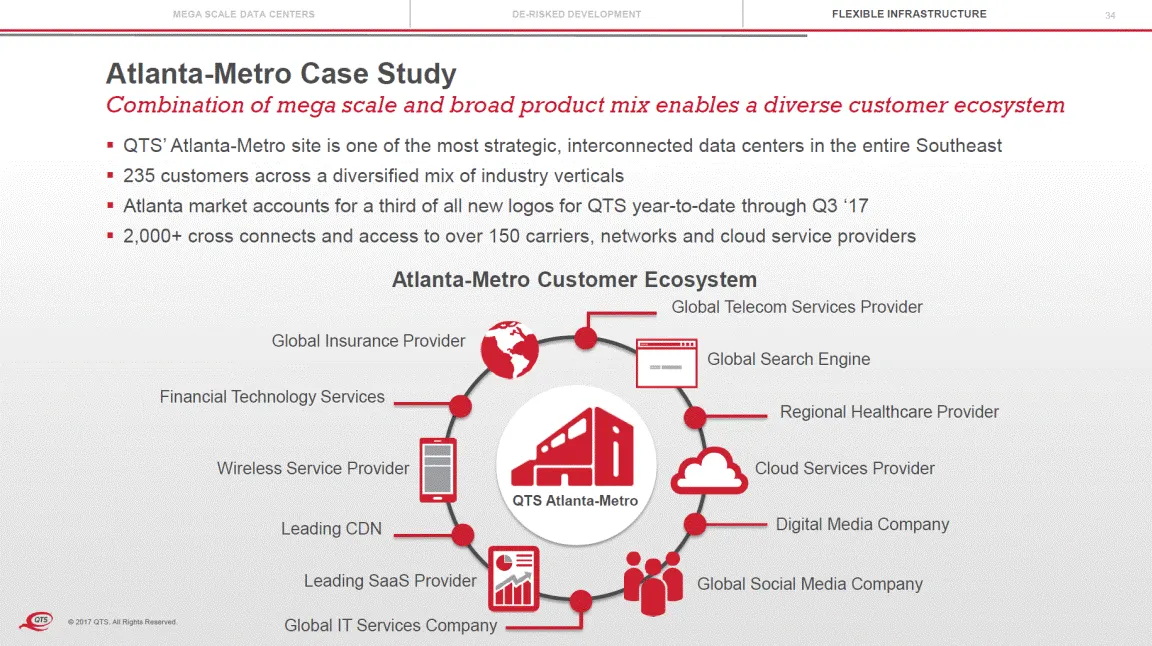
MEGA SCALE DATA CENTERS DE-RISKED DEVELOPMENT FLEXIBLE INFRASTRUCTURE 34 Atlanta-Metro Case Study Combination of mega scale and broad product mix enables a diverse customer ecosystem QTS’ Atlanta-Metro site is one of the most strategic, interconnected data centers in the entire Southeast 235 custome
Slide 34: Atlanta-Metro Case Study: The Power of QTS' Model at Scale
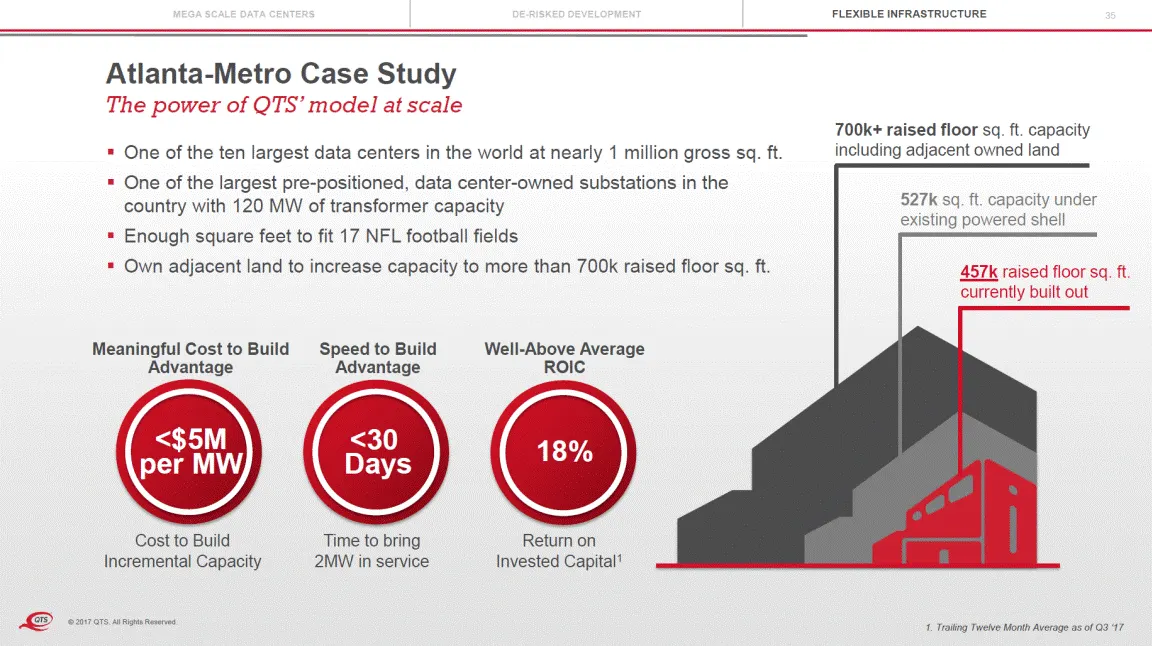
MEGA SCALE DATA CENTERS DE-RISKED DEVELOPMENT FLEXIBLE INFRASTRUCTURE 35 Atlanta-Metro Case Study The power of QTS’ model at scale 700k+ raised floor sq. ft. capacity including adjacent owned land One of the ten largest data centers in the world at nearly 1 million gross sq. ft. One of the largest p
Slide 35: Differentiated Development Approach Summary
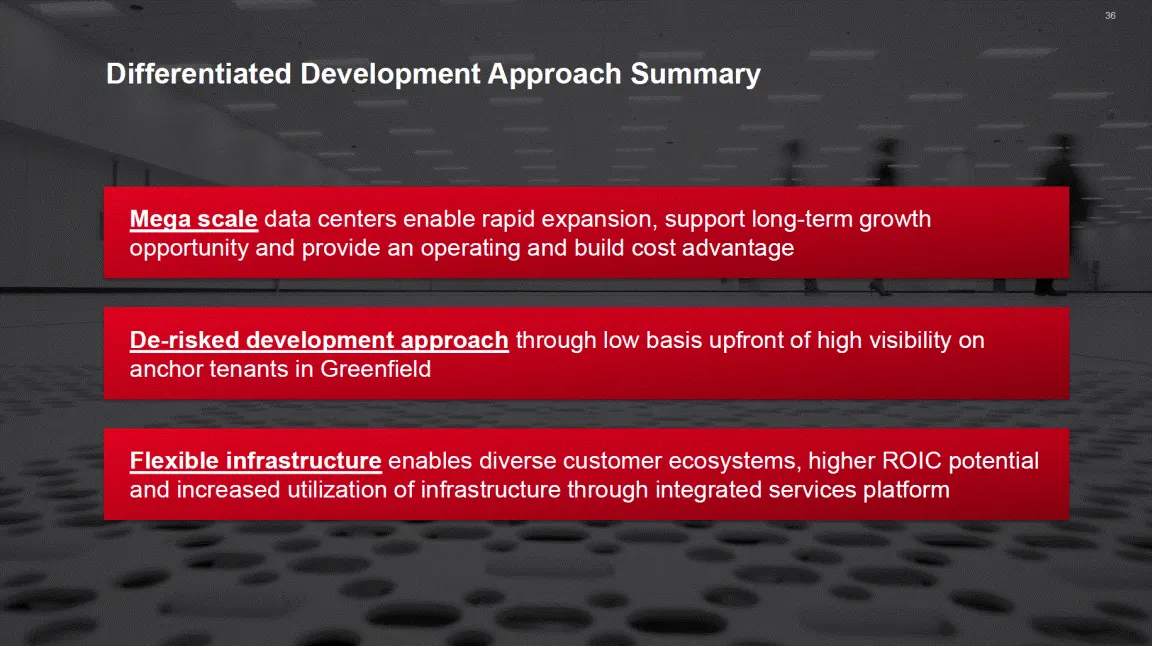
36 Differentiated Development Approach Summary Mega scale data centers enable rapid expansion, support long-term growth opportunity and provide an operating and build cost advantage De-risked development approach through low basis upfront of high visibility on anchor tenants in Greenfield Flexible i
Slide 36: © 2017 QTS. AJIRights Reserved
37 © 2017 QTS. AJIRights Reserved
Slide 37: Fireside Chat
38 FIRESIDE CHAT Brian George - Corgan © 2017 QTS. All Rights Reserved.
Slide 38: Fully Integrated for a Hybrid Data Center World
39 Fully Integrated for a Hybrid Data Center World Jon Greaves, CTO © 2017 QTS. All Rights Reserved.
Slide 39: Fully Integrated for a Hybrid Data Center World
40 Fully Integrated for a Hybrid Data Center World Accelerated pace of enterprise outsourcing moving toward hybrid solutions, integrated through QTS’ software-defined data center platform Expanding C2 – Colocation opportunity through innovation and QTS CloudRamp™ partnership with public cloud provid
Slide 40: What's Driving Hybrid IT
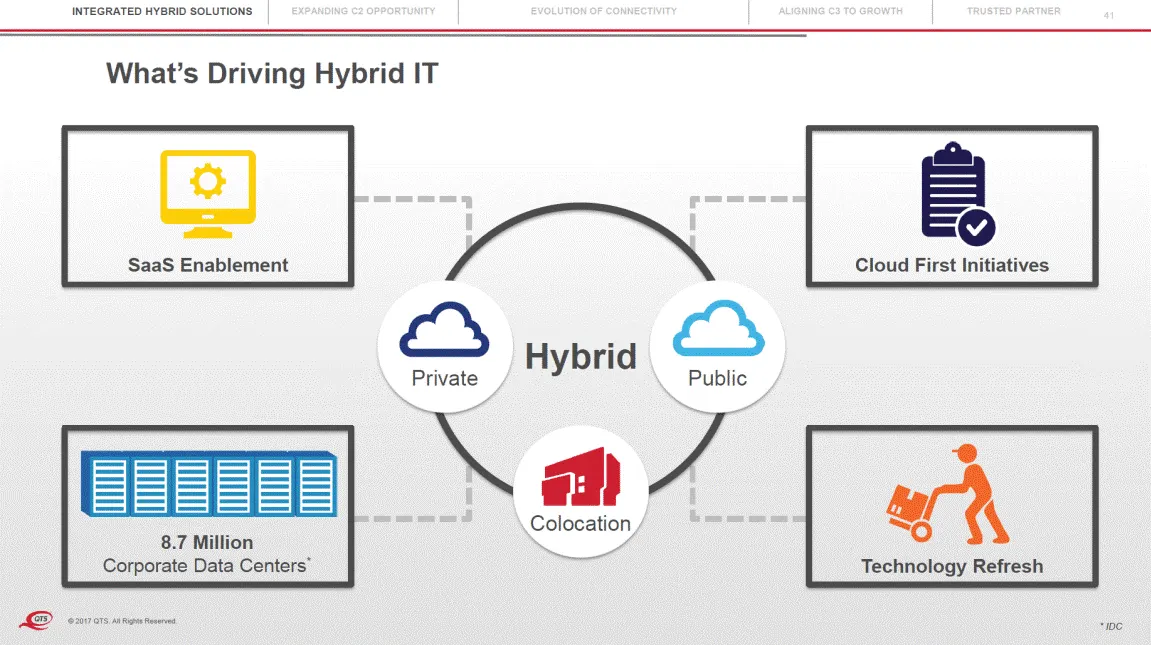
INTEGRATED HYBRID SOLUTIONS EXPANDING C2 OPPORTUNITY EVOLUTION OF CONNECTIVITY ALIGNING C3 TO GROWTH TRUSTED PARTNER 41 What’s Driving Hybrid IT Hybrid Private Public Colocation © 2017 QTS. All Rights Reserved. * IDC 8.7 Million Corporate Data Centers* Technology Refresh SaaS Enablement Cloud First
Slide 41: The Hybrid Movement Is Accelerating
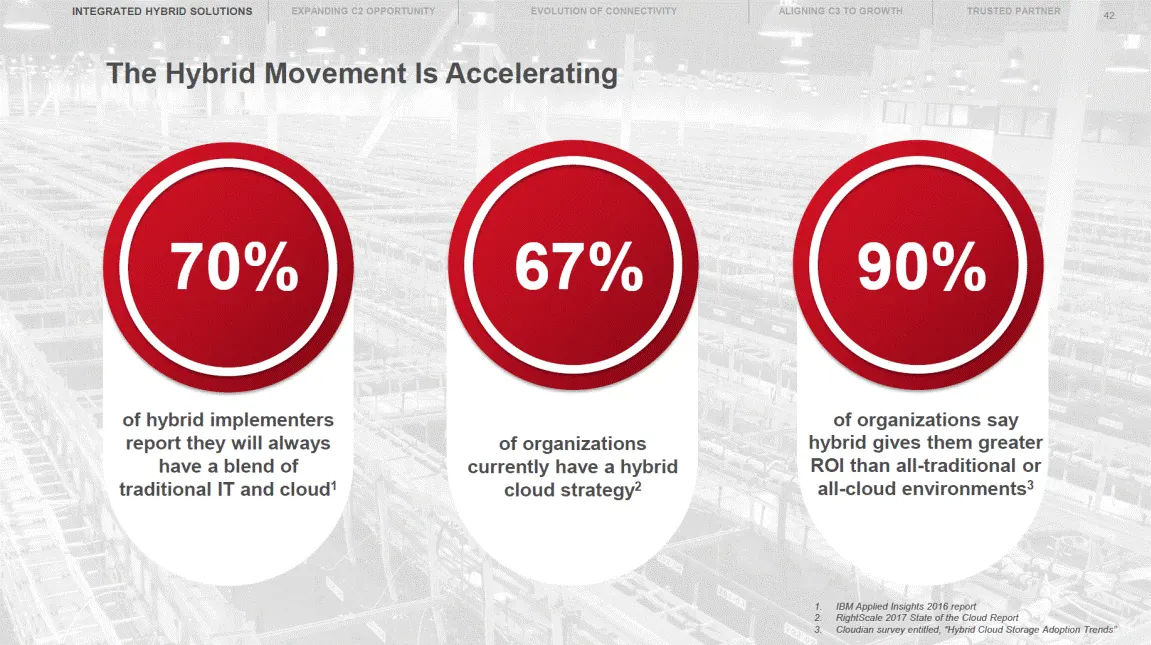
INTEGRATED HYBRID SOLUTIONS EXPANDING C2 OPPORTUNITY EVOLUTION OF CONNECTIVITY ALIGNING C3 TO GROWTH TRUSTED PARTNER 42 The Hybrid Movement Is Accelerating 67% 90% of hybrid implementers report they will always have a blend of of organizations say hybrid gives them greater ROI than all-traditional o
Slide 42: Hyperscale Cloud Providers Stress the Move to Hybrid
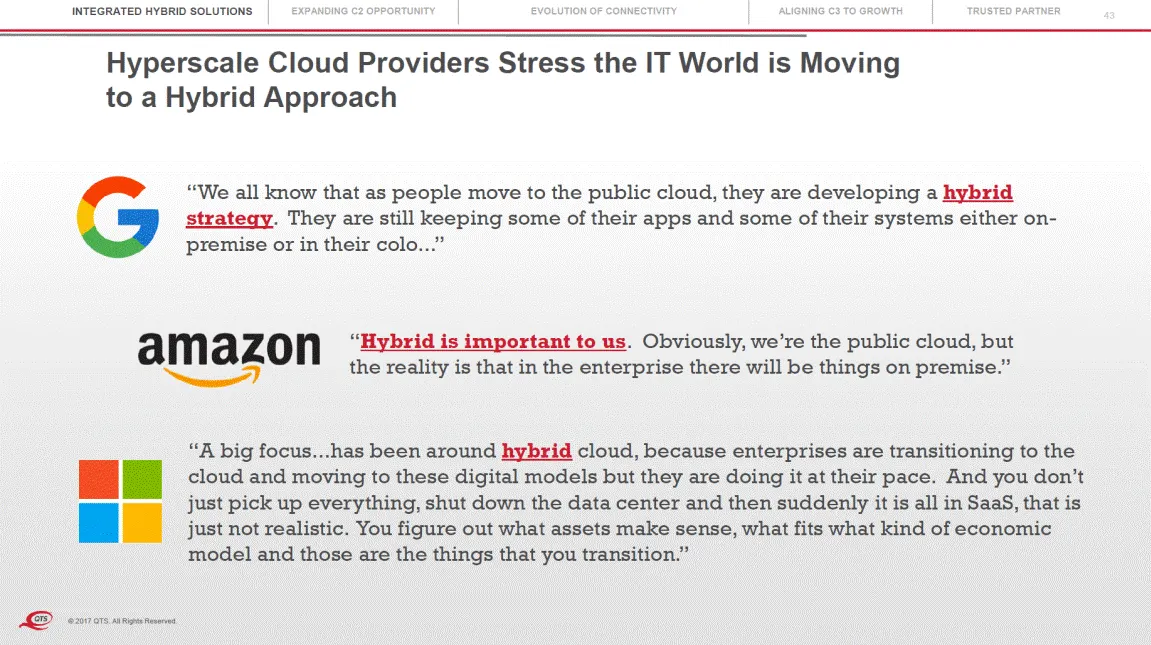
INTEGRATED HYBRID SOLUTIONS EXPANDING C2 OPPORTUNITY EVOLUTION OF CONNECTIVITY ALIGNING C3 TO GROWTH TRUSTED PARTNER 43 Hyperscale Cloud Providers Stress the IT World is Moving to a Hybrid Approach “We all know that as people move to the public cloud, they are developing a hybrid strategy. They are
Slide 43: But Hybrid Creates Tremendous Complexity
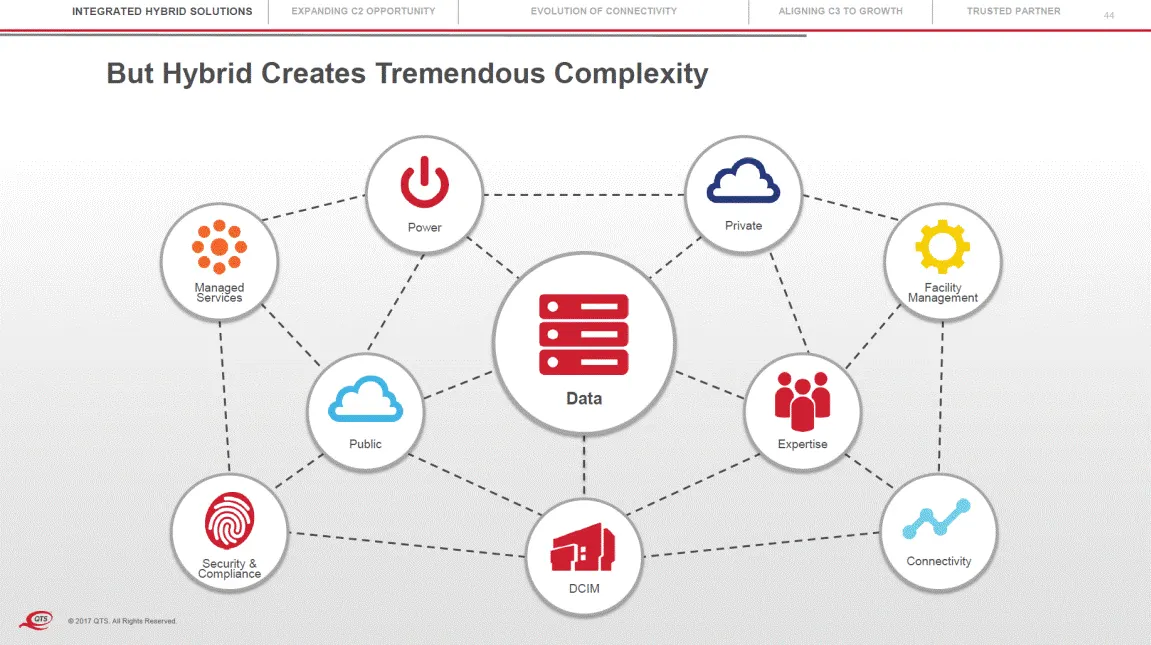
INTEGRATED HYBRID SOLUTIONS EXPANDING C2 OPPORTUNITY EVOLUTION OF CONNECTIVITY ALIGNING C3 TO GROWTH TRUSTED PARTNER 44 But Hybrid Creates Tremendous Complexity Private Power Managed Services Facility Management Data Public Expertise Connectivity Security & Compliance DCIM © 2017 QTS. All Rights Res
Slide 44: QTS Opportunity: Leverage Software-Defined Data Center Platform
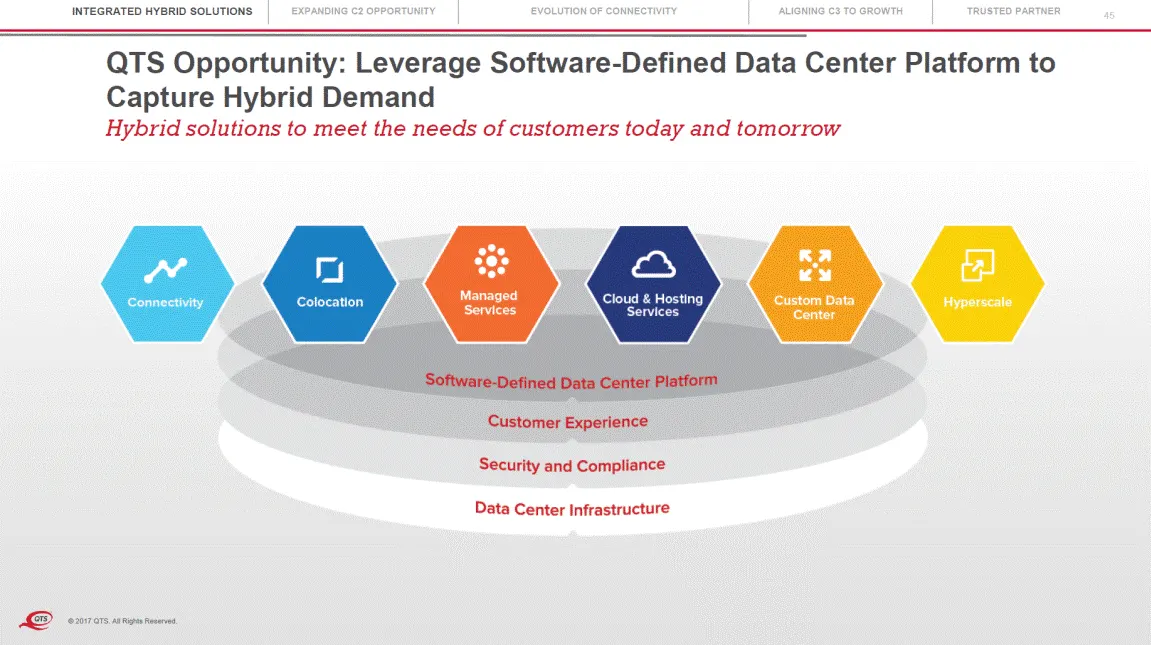
INTEGRATED HYBRID SOLUTIONS EXPANDING C2 OPPORTUNITY EVOLUTION OF CONNECTIVITY ALIGNING C3 TO GROWTH TRUSTED PARTNER 45 QTS Opportunity: Leverage Software-Defined Data Center Capture Hybrid Demand Platform to Hybrid solutions to meet the needs of customers today and tomorrow © 2017 QTS. All Rights R
Slide 45: Integrated Platform Capitalizes on Hybrid Outsourcing Demand
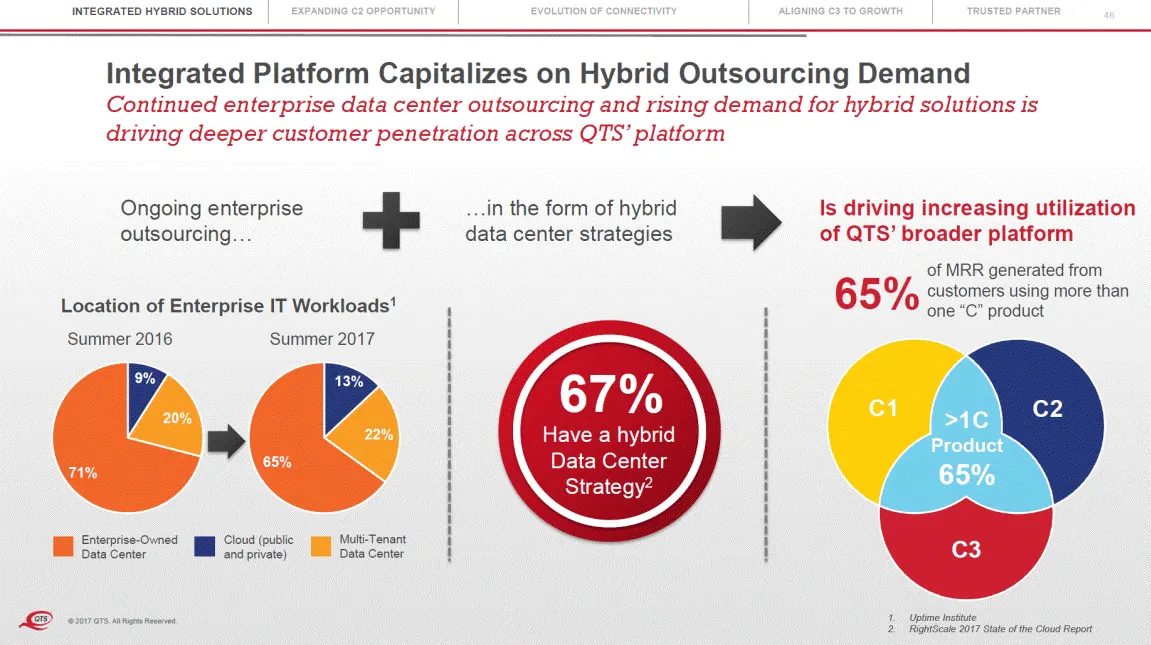
INTEGRATED HYBRID SOLUTIONS EXPANDING C2 OPPORTUNITY EVOLUTION OF CONNECTIVITY ALIGNING C3 TO GROWTH TRUSTED PARTNER 46 Integrated Platform Capitalizes on Hybrid Outsourcing Demand Continued enterprise data center outsourcing and rising demand for hybrid solutions is driving deeper customer penetrat
Slide 46: Delivering C2 Next Gen Colocation Through Innovation
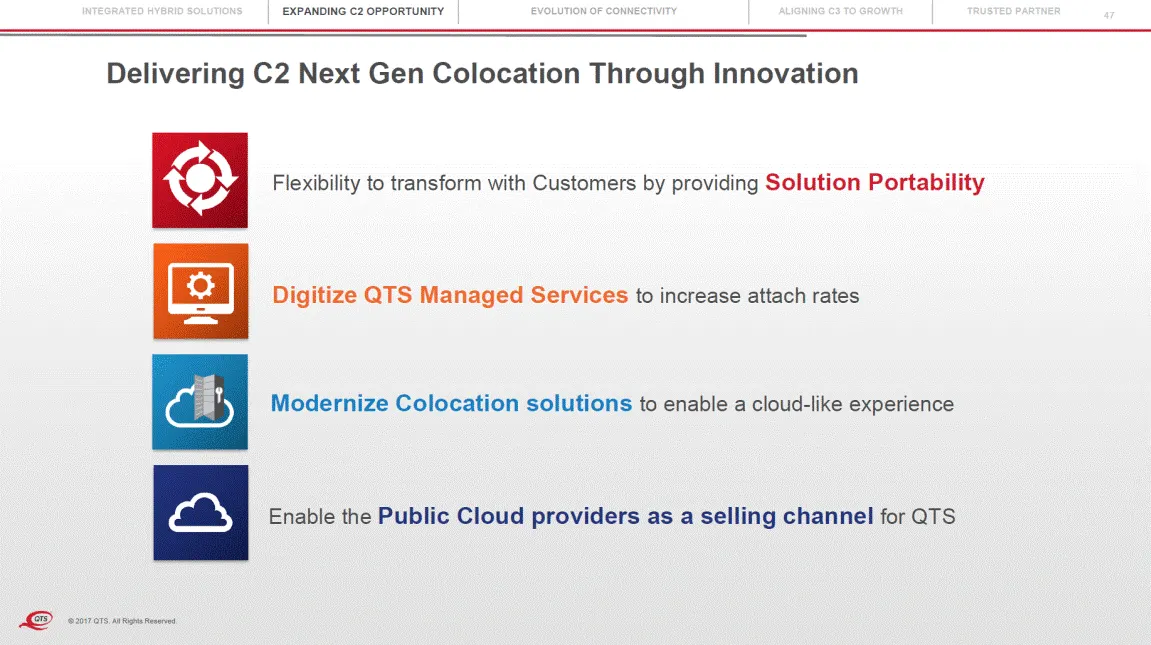
EXPANDING C2 OPPORTUNITY INTEGRATED HYBRID SOLUTIONS EVOLUTION OF CONNECTIVITY ALIGNING C3 TO GROWTH TRUSTED PARTNER 47 Delivering C2 Next Gen Colocation Through Innovation to transform with Customers by providing Solution Portability Flexibility Digitize QTS Managed Services to increase attach rate
Slide 47: QTS C2 – Colocation Roadmap
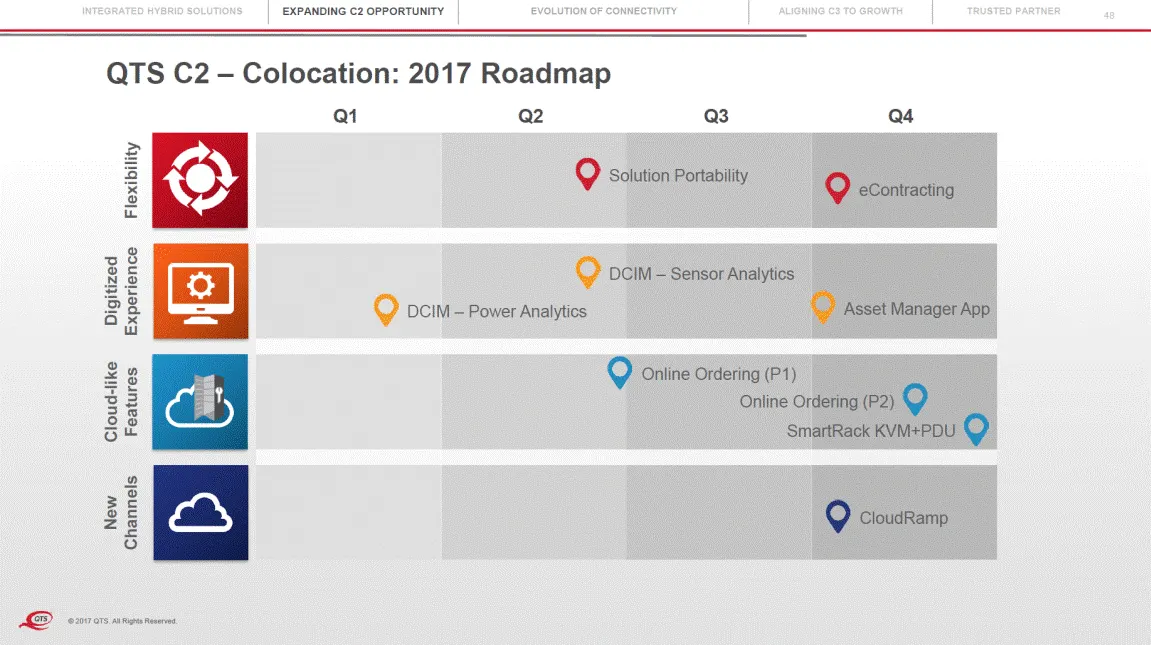
EXPANDING C2 OPPORTUNITY INTEGRATED HYBRID SOLUTIONS EVOLUTION OF CONNECTIVITY ALIGNING C3 TO GROWTH TRUSTED PARTNER 48 QTS C2 – Colocation: Q1 2017 Roadmap Q2 Q3 Q4 Solution Portability eContracting DCIM – Sensor Analytics Asset Manager App DCIM – Power Analytics Online Ordering (P1) Online Orderin
Slide 48: QTS CloudRamp – Colocation, Simplified
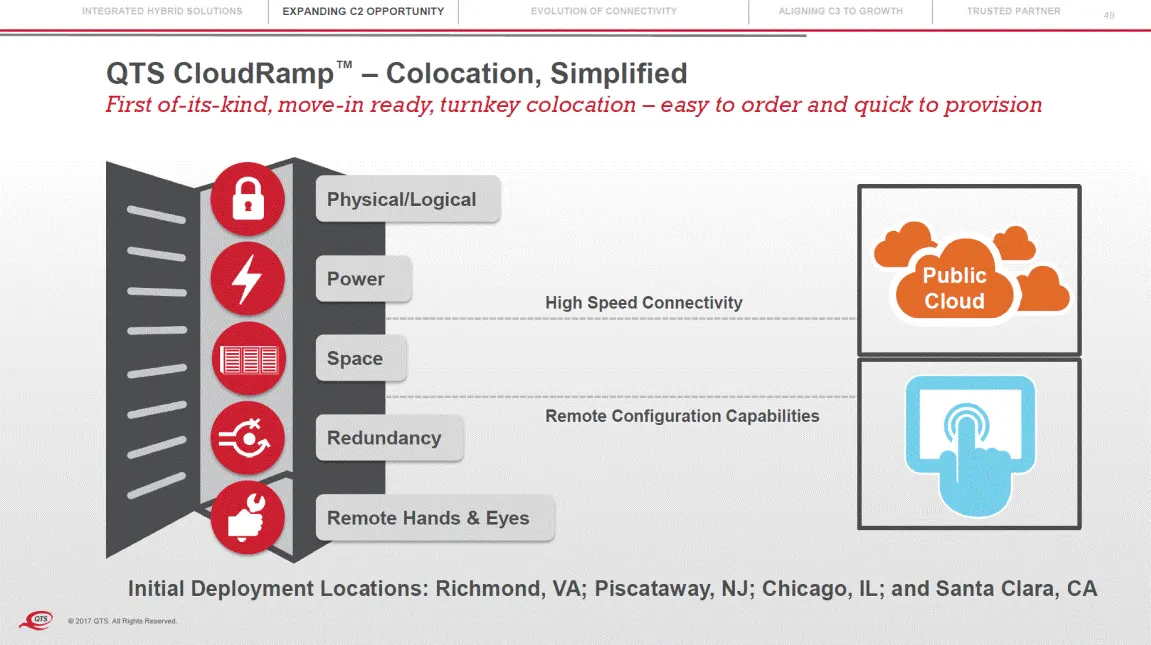
EXPANDING C2 OPPORTUNITY INTEGRATED HYBRID SOLUTIONS EVOLUTION OF CONNECTIVITY ALIGNING C3 TO GROWTH TRUSTED PARTNER 49 QTS CloudRamp™ – Colocation, Simplified First of-its-kind, move-in ready, turnkey colocation – easy to order and quick to provision Physical/Logical Power Space Redundancy Remote H
Slide 49: Expanding QTS' Opportunity Through Cloud Partners
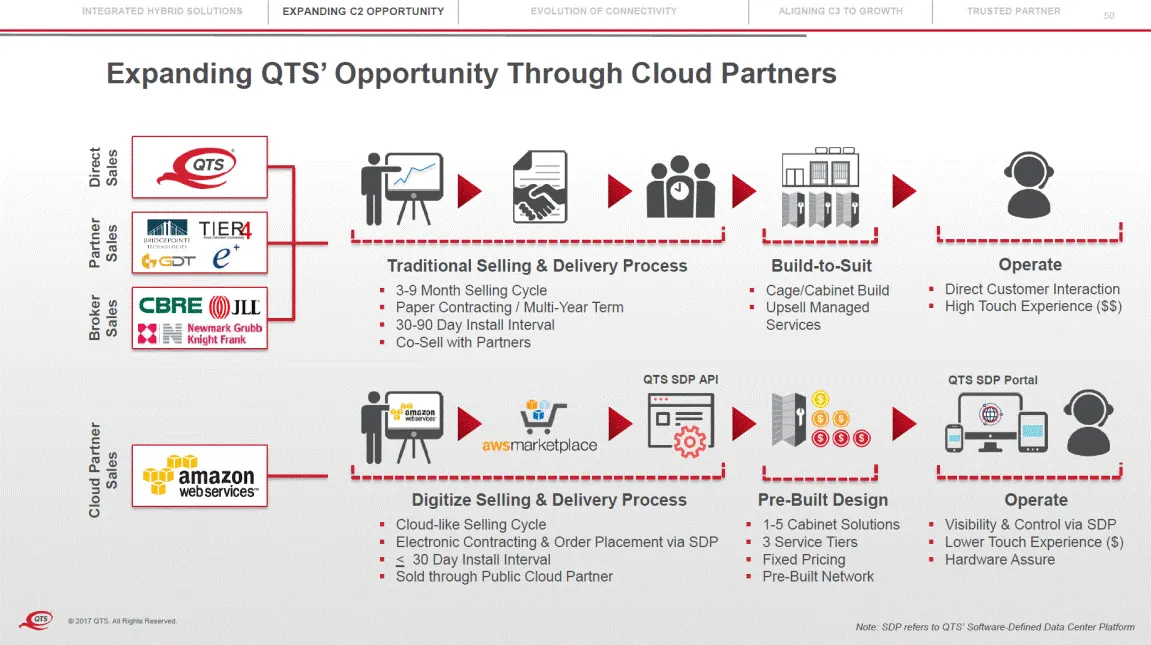
EXPANDING C2 OPPORTUNITY INTEGRATED HYBRID SOLUTIONS EVOLUTION OF CONNECTIVITY ALIGNING C3 TO GROWTH TRUSTED PARTNER 50 Expanding QTS’ Opportunity Through Cloud Partners Operate Direct Customer Interaction High Touch Experience ($$) Traditional Selling & Delivery Process 3-9 Month Selling Cycle Pape
Slide 50: Overview of QTS Strategic Partnership with AWS
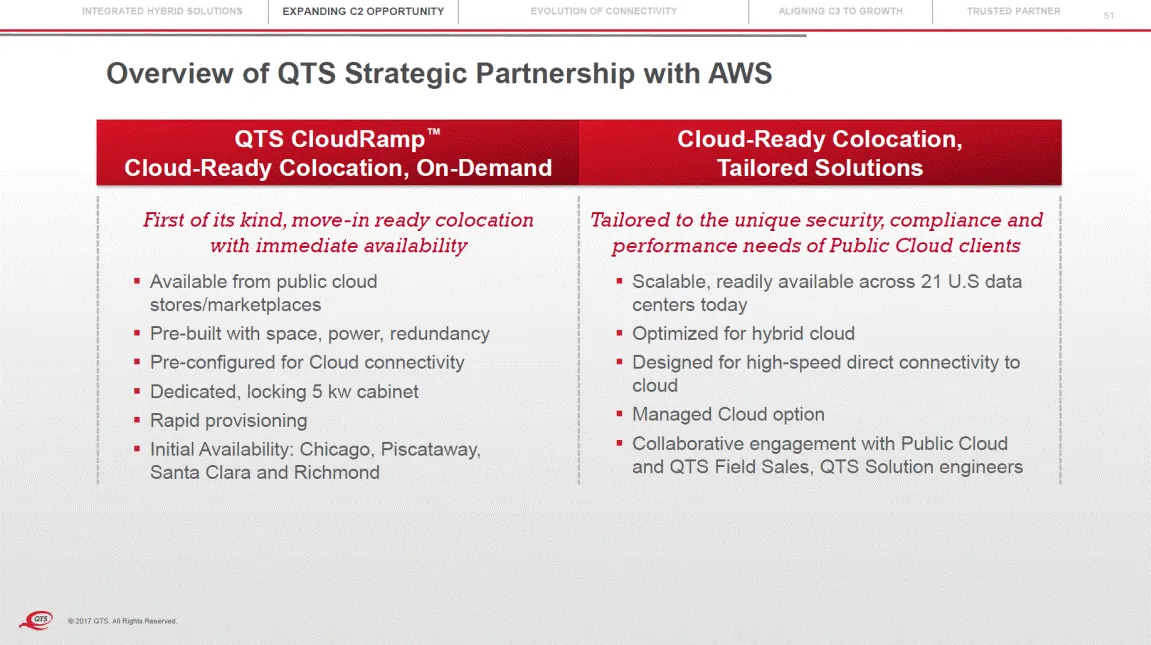
EXPANDING C2 OPPORTUNITY INTEGRATED HYBRID SOLUTIONS EVOLUTION OF CONNECTIVITY ALIGNING C3 TO GROWTH TRUSTED PARTNER 51 Overview of QTS Strategic Partnership with AWS QTS CloudRamp™ Cloud-Ready Colocation, On-Demand Cloud-Ready Colocation, Tailored Solutions First of its kind, move-in ready colocati
Slide 51: AWS Discusses Strategic Partnership with QTS
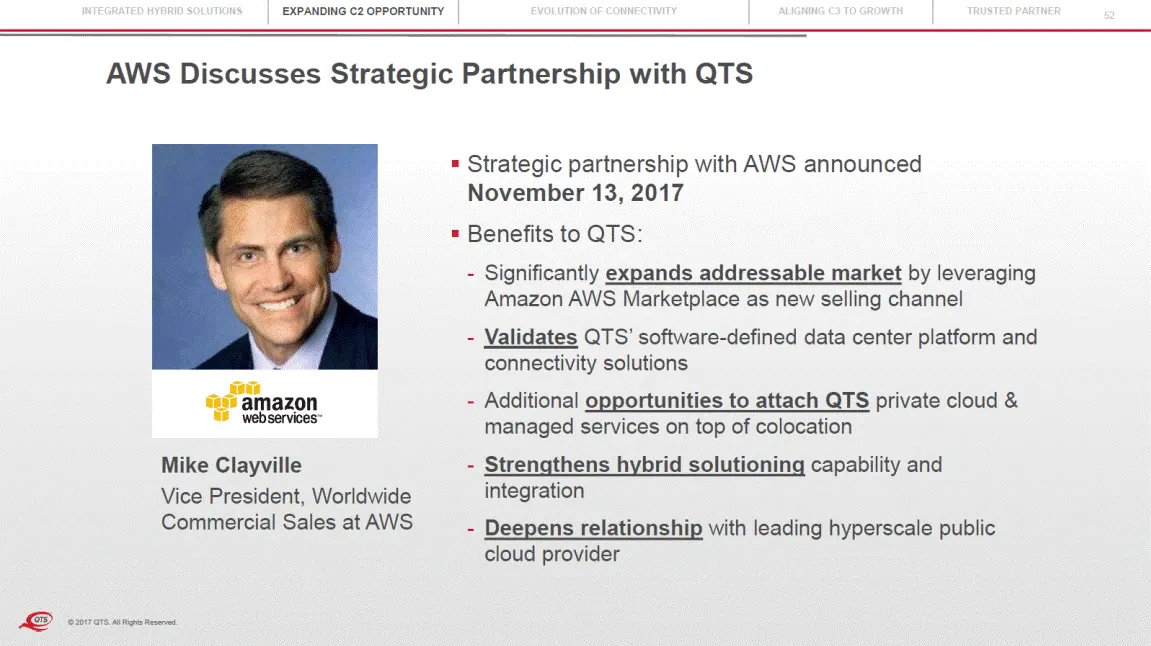
EXPANDING C2 OPPORTUNITY INTEGRATED HYBRID SOLUTIONS EVOLUTION OF CONNECTIVITY ALIGNING C3 TO GROWTH TRUSTED PARTNER 52 AWS Discusses Strategic Partnership with QTS Strategic partnership November 13, 2017 Benefits to QTS: with AWS announced - Significantly expands addressable market by leveraging Am
Slide 52: Evolution of Connectivity
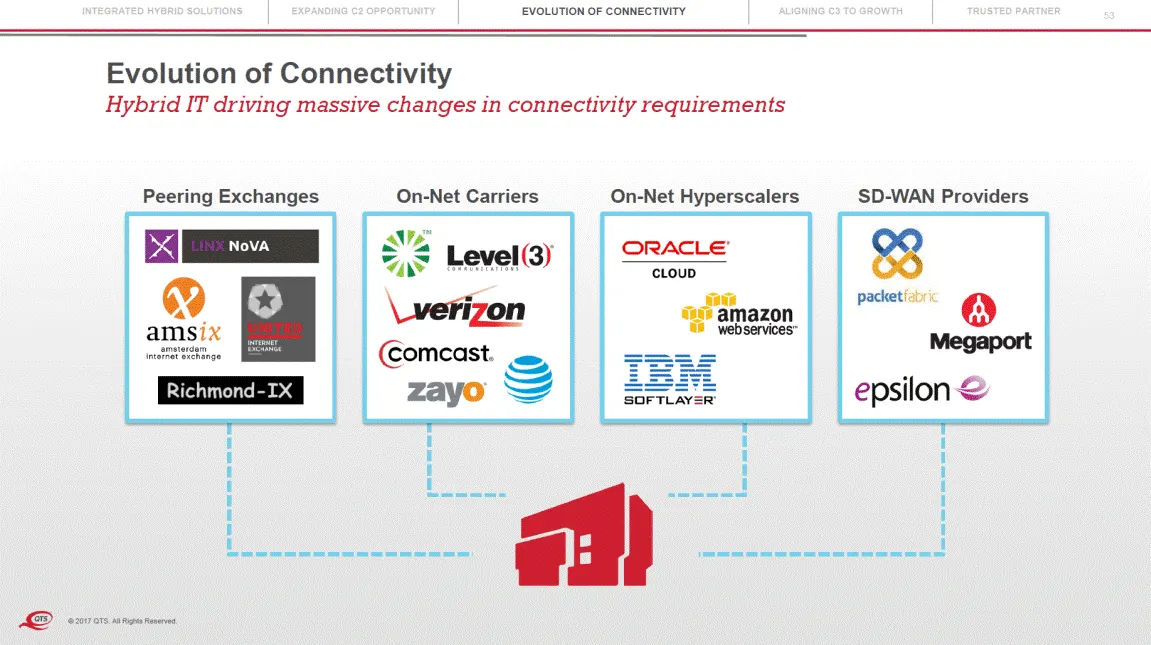
EVOLUTION OF CONNECTIVITY INTEGRATED HYBRID SOLUTIONS EXPANDING C2 OPPORTUNITY ALIGNING C3 TO GROWTH TRUSTED PARTNER 53 Evolution of Connectivity Hybrid IT driving massive changes in connectivity requirements SD-WAN Providers Peering Exchanges On-Net Carriers On-Net Hyperscalers © 2017 QTS. All Righ
Slide 53: QTS Connectivity Snapshot
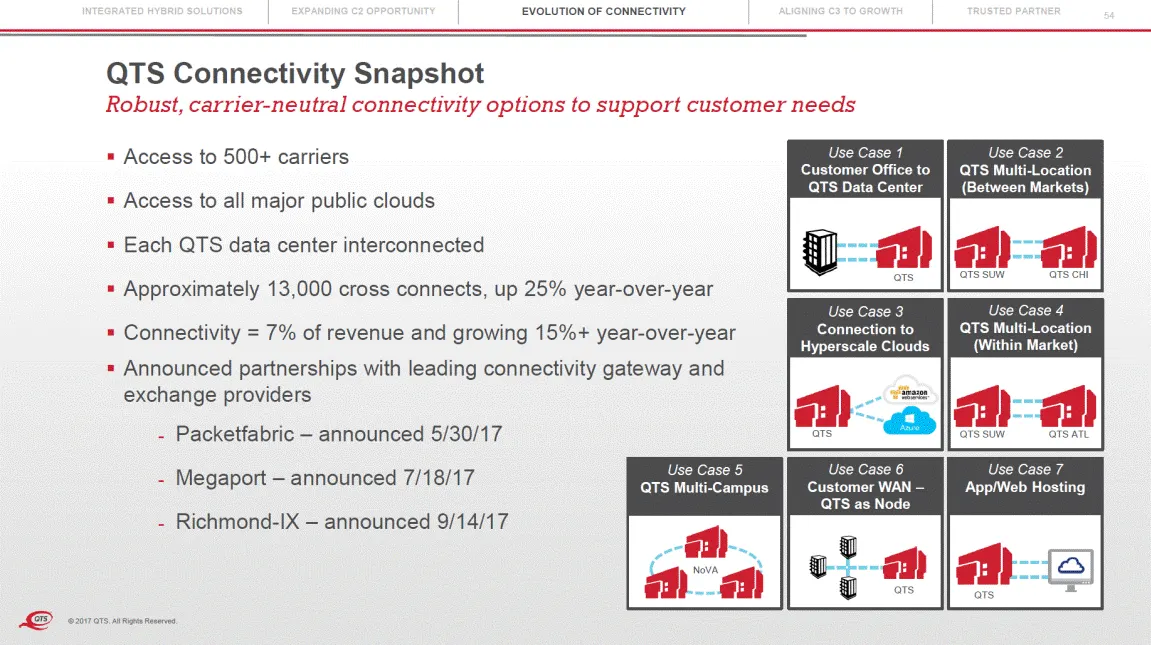
EVOLUTION OF CONNECTIVITY INTEGRATED HYBRID SOLUTIONS EXPANDING C2 OPPORTUNITY ALIGNING C3 TO GROWTH TRUSTED PARTNER 54 QTS Connectivity Snapshot Robust, carrier-neutral connectivity options to support customer needs Access to 500+ carriers Access to all major public clouds Each QTS data center inte
Slide 54: C3 – Cloud & Managed Services Simplified
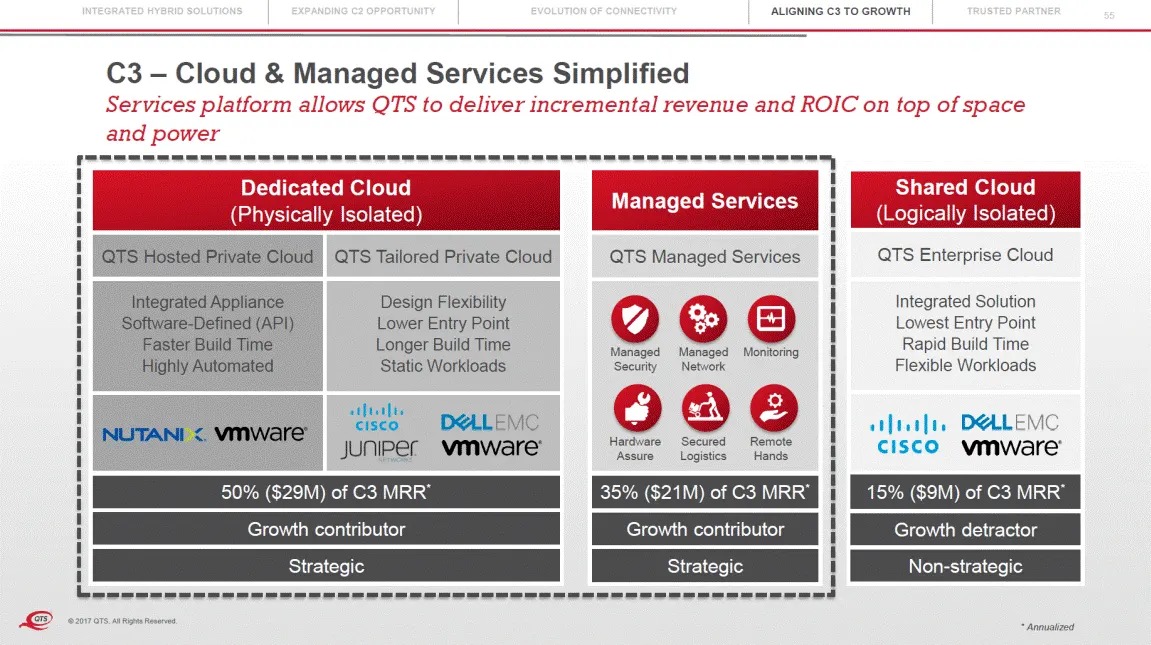
ALIGNING C3 TO GROWTH INTEGRATED HYBRID SOLUTIONS EXPANDING C2 OPPORTUNITY EVOLUTION OF CONNECTIVITY TRUSTED PARTNER 55 C3 – Cloud & Managed Services Simplified Services platform allows QTS to deliver incremental revenue and ROIC on top of space and power (Logically Isolated) Flexible Workloads © 20
Slide 55: Aligning C3 Product Portfolio to Strongest Service Attachment
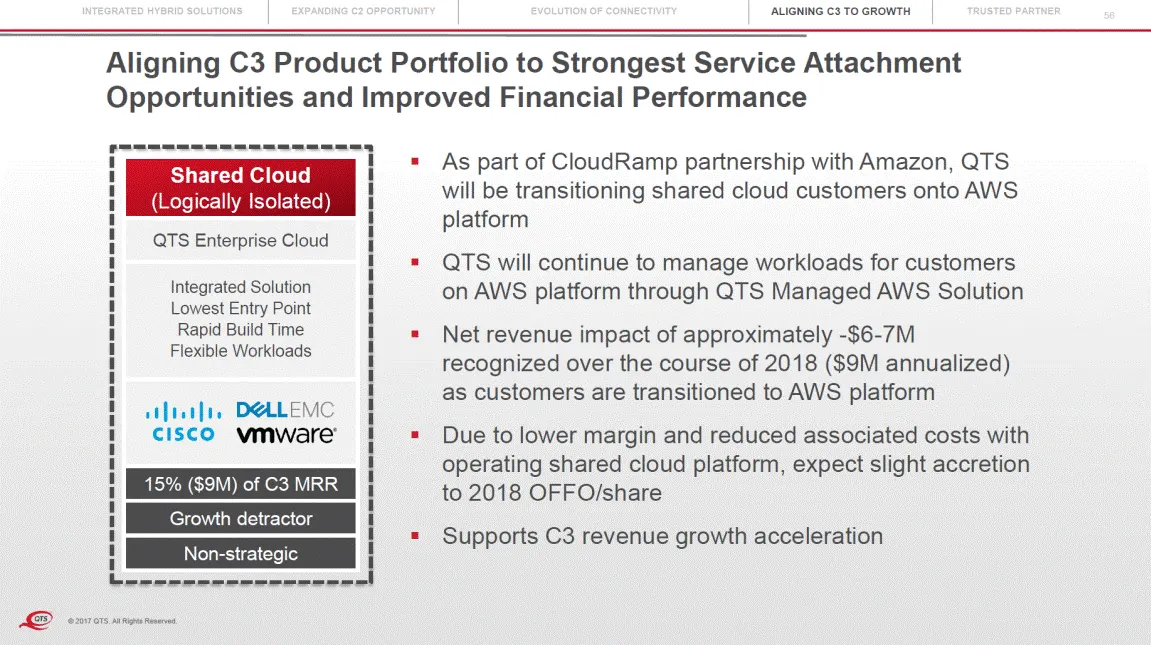
ALIGNING C3 TO GROWTH INTEGRATED HYBRID SOLUTIONS EXPANDING C2 OPPORTUNITY EVOLUTION OF CONNECTIVITY TRUSTED PARTNER 56 Aligning C3 Product Portfolio to Strongest Service Attachment Opportunities and Improved Financial Performance As part of CloudRamp partnership with Amazon, QTS will be transitioni
Slide 56: Cybersecurity Threat Landscape Continues to Grow
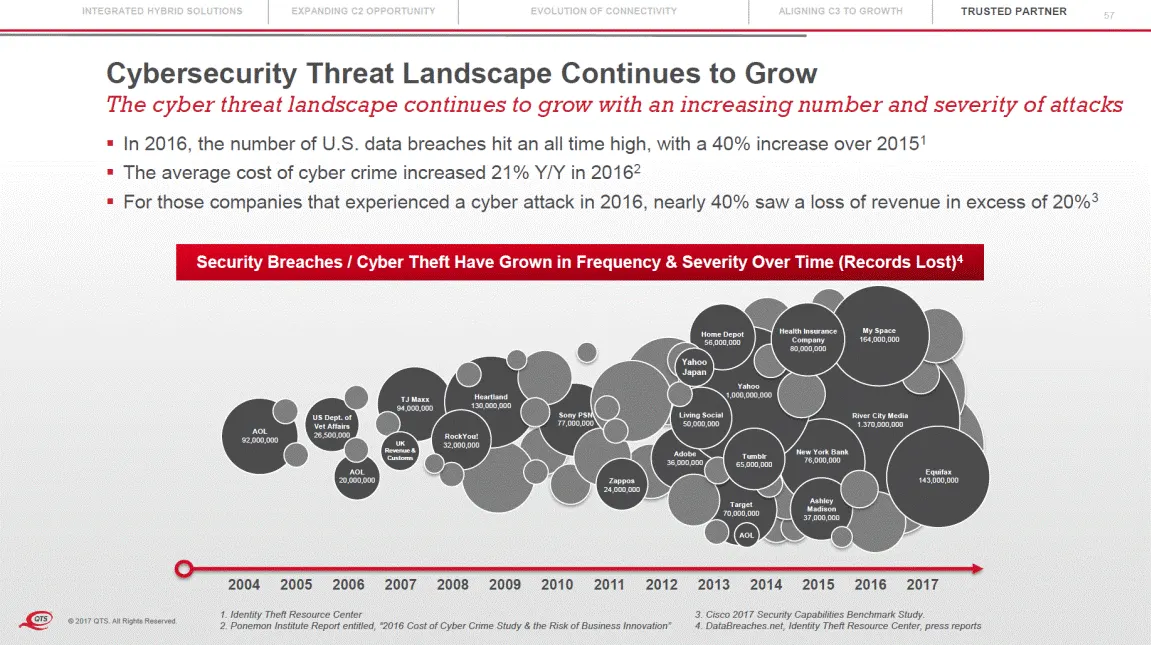
TRUSTED PARTNER INTEGRATED HYBRID SOLUTIONS EXPANDING C2 OPPORTUNITY EVOLUTION OF CONNECTIVITY ALIGNING C3 TO GROWTH 57 Cybersecurity Threat Landscape Continues to Grow The cyber threat landscape continues to grow with an increasing number and severity of attacks In 2016, the number of U.S. data bre
Slide 57: Increased Compliance Enforcement Activity
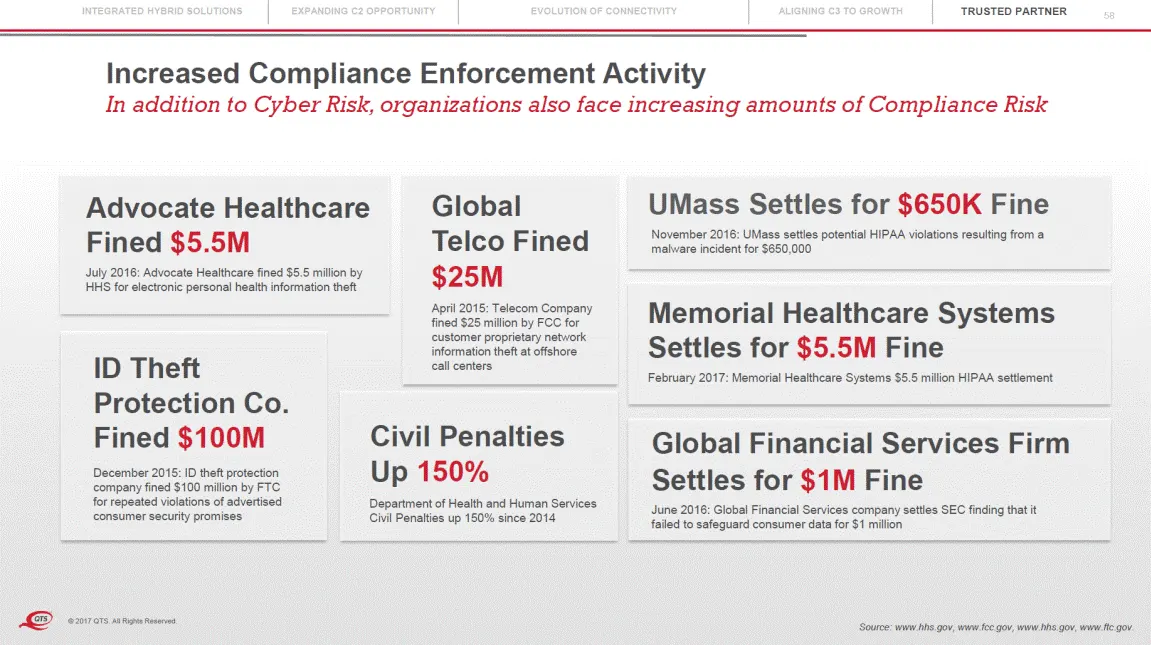
TRUSTED PARTNER INTEGRATED HYBRID SOLUTIONS EXPANDING C2 OPPORTUNITY EVOLUTION OF CONNECTIVITY ALIGNING C3 TO GROWTH 58 Increased Compliance Enforcement Activity In addition to Cyber Risk, organizations also face increasing amounts of Compliance Risk UMass Settles for $650K Fine November 2016: UMass
Slide 58: Trusted Partner
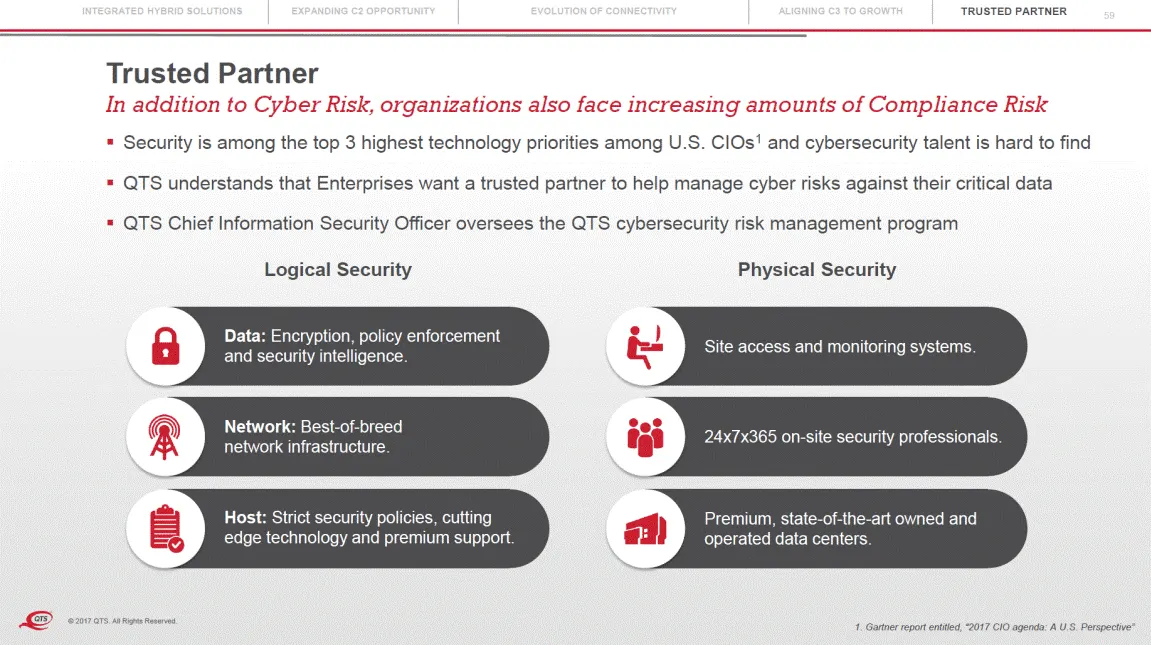
TRUSTED PARTNER INTEGRATED HYBRID SOLUTIONS EXPANDING C2 OPPORTUNITY EVOLUTION OF CONNECTIVITY ALIGNING C3 TO GROWTH 59 Trusted Partner In addition to Cyber Risk, organizations also face increasing amounts of Compliance Risk Security is among the top 3 highest technology priorities among U.S. CIOs1
Slide 59: Navigating Customers' Complex Compliance Processes
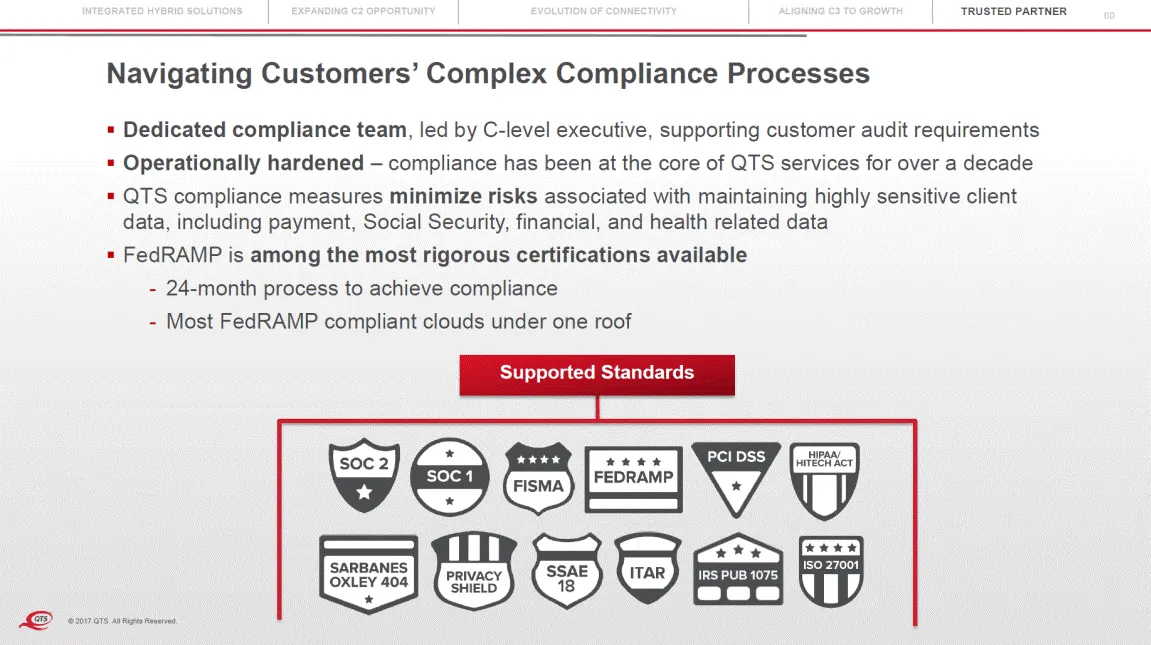
TRUSTED PARTNER INTEGRATED HYBRID SOLUTIONS EXPANDING C2 OPPORTUNITY EVOLUTION OF CONNECTIVITY ALIGNING C3 TO GROWTH 60 Navigating Customers’ Complex Compliance Processes Dedicated compliance team, led by C-level executive, supporting customer audit requirements Operationally hardened – compliance h
Slide 60: Value of Integrated Platform
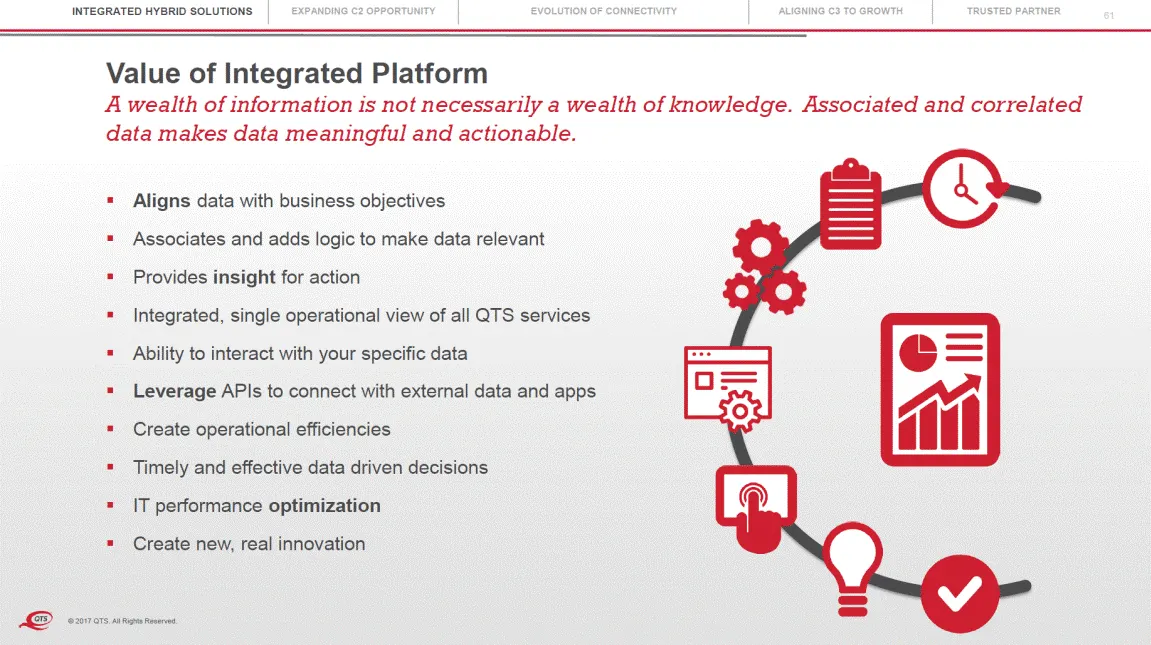
INTEGRATED HYBRID SOLUTIONS EXPANDING C2 OPPORTUNITY EVOLUTION OF CONNECTIVITY ALIGNING C3 TO GROWTH TRUSTED PARTNER 61 Value of Integrated Platform A wealth of information is not necessarily a wealth of knowledge. data makes data meaningful and actionable. Associated and correlated Aligns data with
Slide 61: Software-Defined Data Center Platform
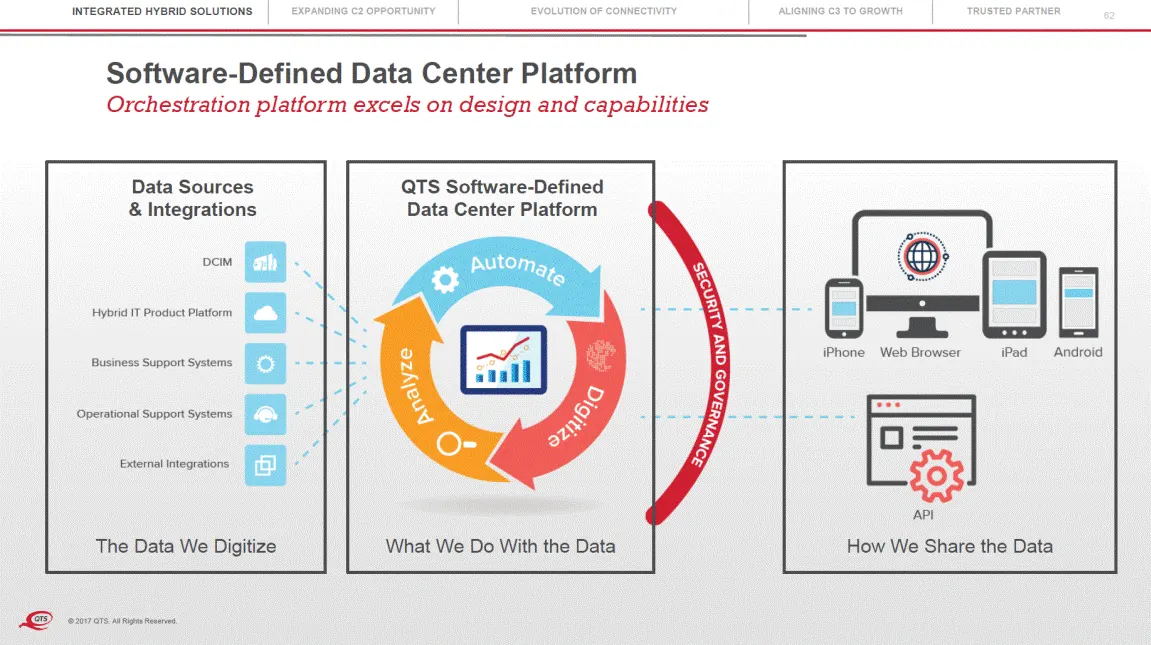
INTEGRATED HYBRID SOLUTIONS EXPANDING C2 OPPORTUNITY EVOLUTION OF CONNECTIVITY ALIGNING C3 TO GROWTH TRUSTED PARTNER 62 Software-Defined Data Center Platform Orchestration platform excels on design and capabilities © 2017 QTS. All Rights Reserved. How We Share the Data QTS Software-Defined Data Cent
Slide 62: Analyst Feedback on QTS Software-Defined Data Center Platform
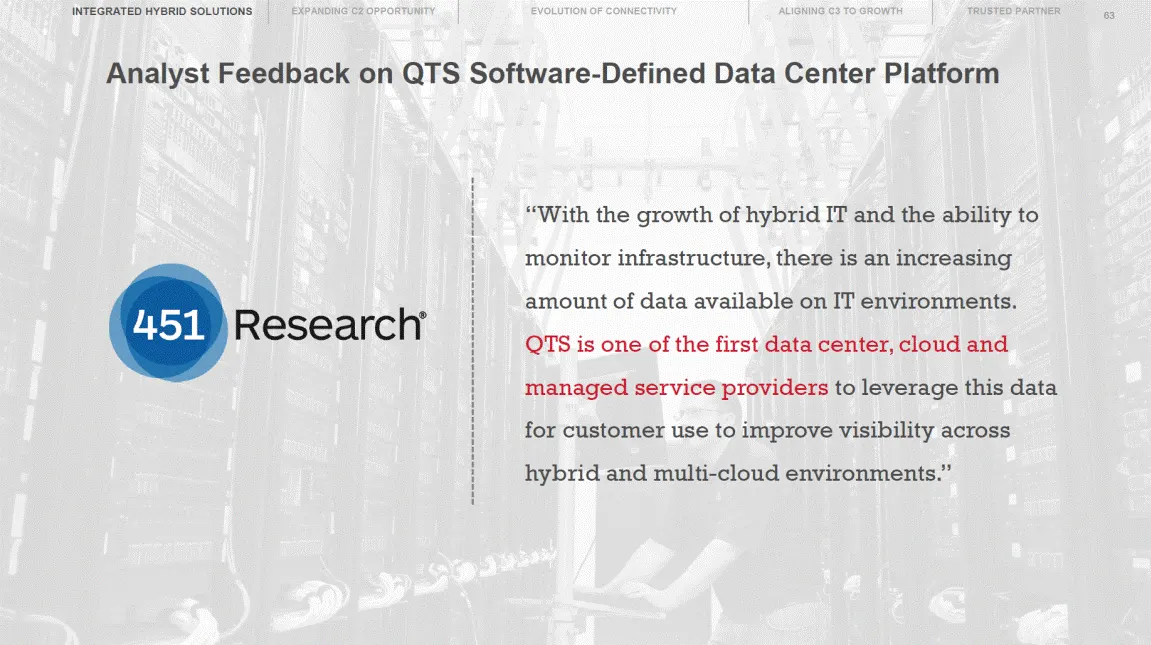
INTEGRATED HYBRID SOLUTIONS EXPANDING C2 OPPORTUNITY EVOLUTION OF CONNECTIVITY ALIGNING C3 TO GROWTH TRUSTED PARTNER 63 Analyst Feedback on QTS Software-Defined Data Center Platform “With the growth of hybrid IT and the ability to monitor infrastructure, there is an increasing amount of data availab
Slide 63: SDP User Statistics as of November 2017
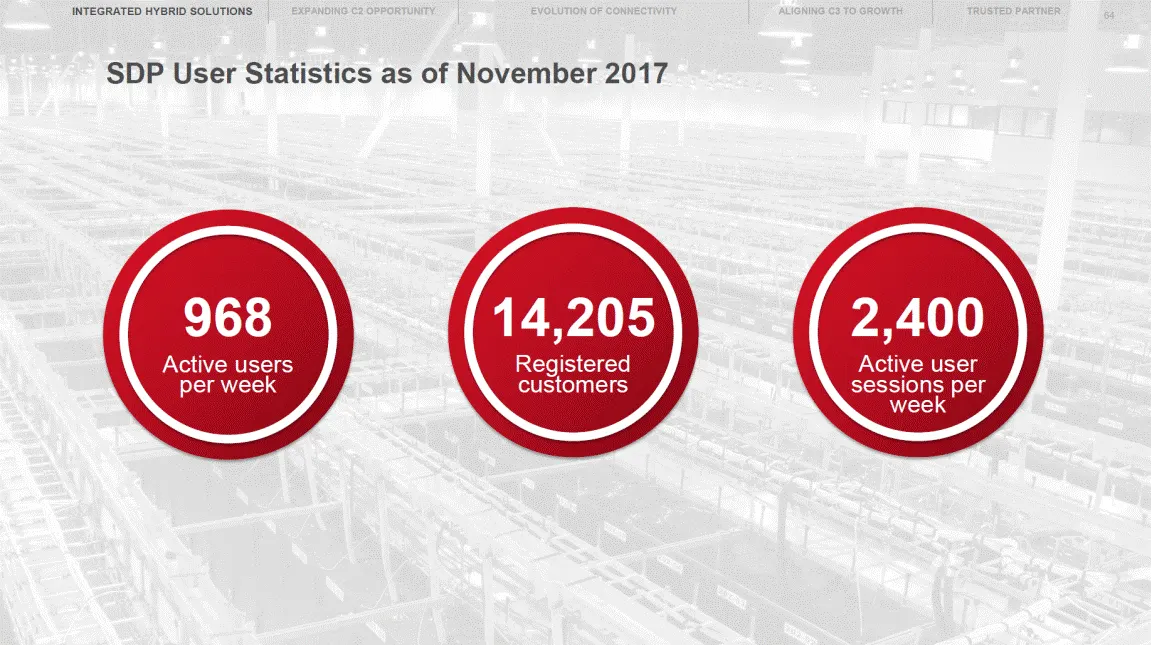
INTEGRATED HYBRID SOLUTIONS EXPANDING C2 OPPORTUNITY EVOLUTION OF CONNECTIVITY ALIGNING C3 TO GROWTH TRUSTED PARTNER 64 SDP User Statistics as of November 2017 14,205 Registered customers 2,400 Active user sessions per week © 2017 QTS. All Rights Reserved.
Slide 64: QTS Integrated Services Platform Summary Highlights
65 QTS Integrated Services Platform Summary Highlights Accelerated pace of enterprise outsourcing moving toward hybrid solutions, integrated through QTS’ software-defined data center platform Expanding C2 – Colocation opportunity through innovation and QTS CloudRamp™ partnership with public cloud pr
Slide 65: World-Class Service Makes the Difference
66 World-Class Service Makes the Difference Jim Reinhart, COO - Operations © 2017 QTS. All Rights Reserved.
Slide 66: World-Class Service Makes the Difference
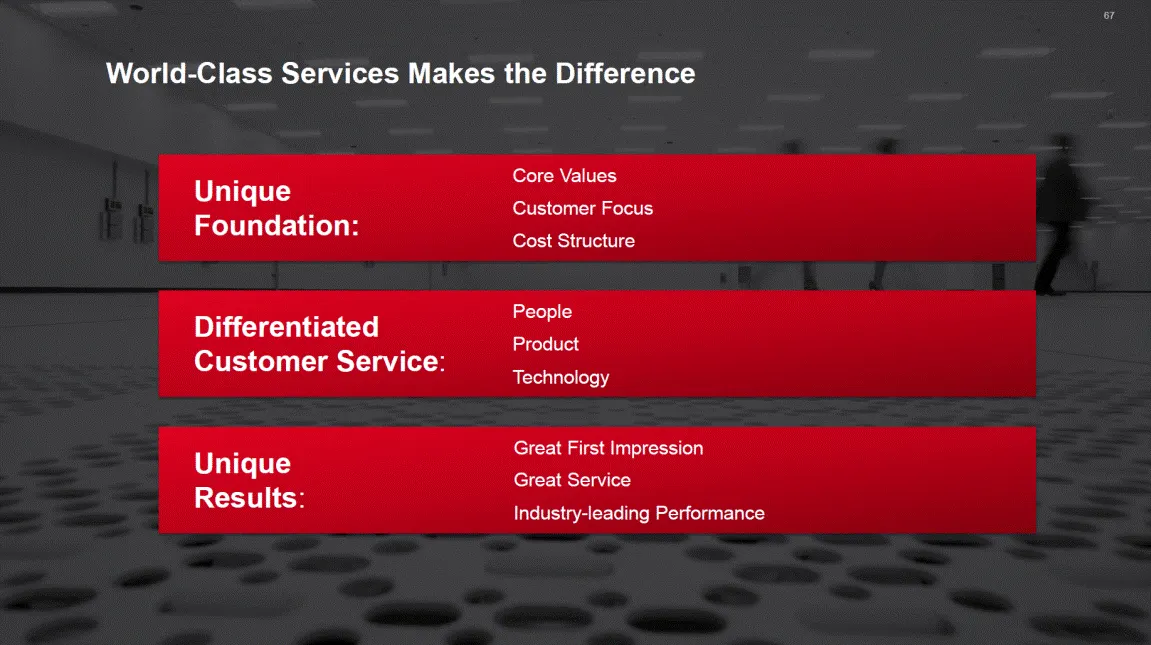
67 World-Class Services Makes the Difference Core Values Customer Focus Cost Structure Unique Foundation: People Product Technology Differentiated Customer Service: Great First Impression Great Service Industry-leading Performance Unique Results: © 2017 QTS. All Rights Reserved.
Slide 67: Unique Foundations
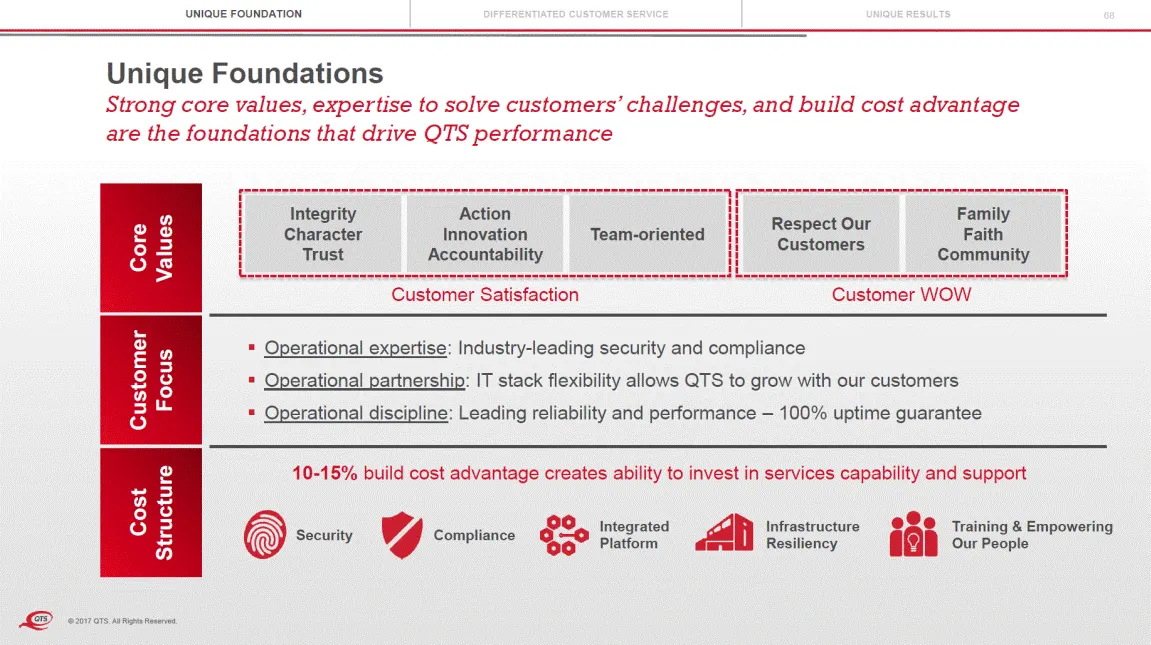
UNIQUE FOUNDATION DIFFERENTIATED CUSTOMER SERVICE UNIQUE RESULTS 68 Unique Foundations Strong core values, expertise to solve customers’ challenges, and are the foundations that drive QTS performance build cost advantage Faith Customers Customer Satisfaction Customer WOW Operational expertise: Indus
Slide 68: Tangible Aspects of QTS Model to Drive Customer Service
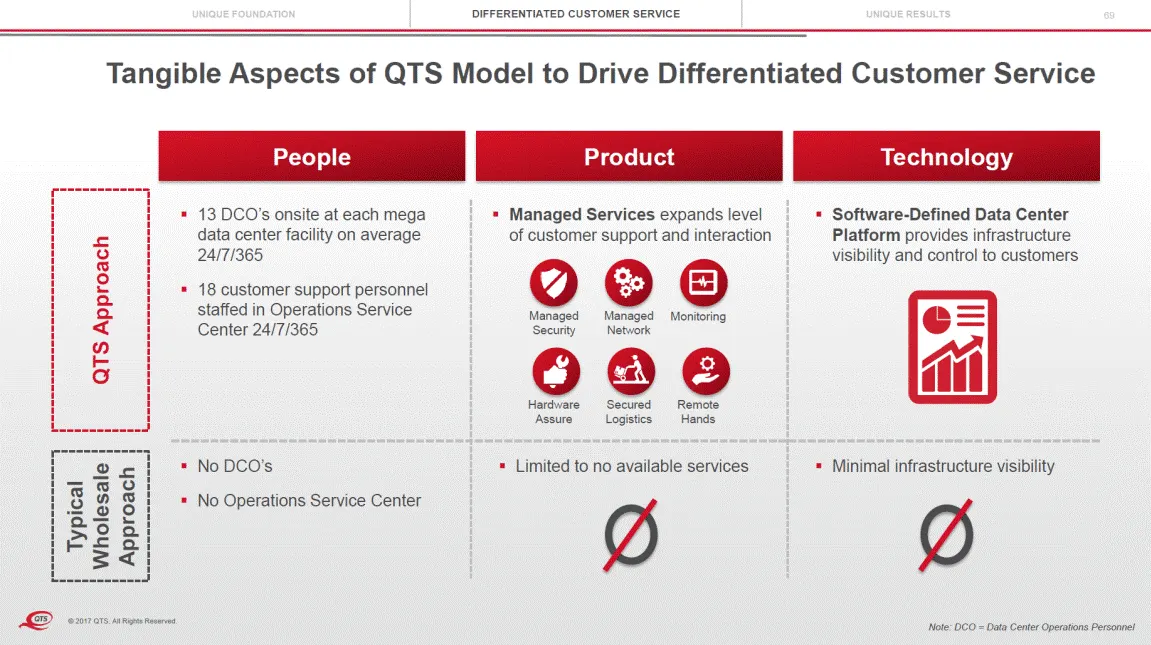
UNIQUE FOUNDATION DIFFERENTIATED CUSTOMER SERVICE UNIQUE RESULTS 69 Tangible Aspects of QTS Model to Drive Differentiated Customer Service People Product Technology Security Network © 2017 QTS. All Rights Reserved. Note: DCO = Data Center Operations Personnel Typical Wholesale Approach 13 DCO’s onsi
Slide 69: NPS: Net Promoter Score
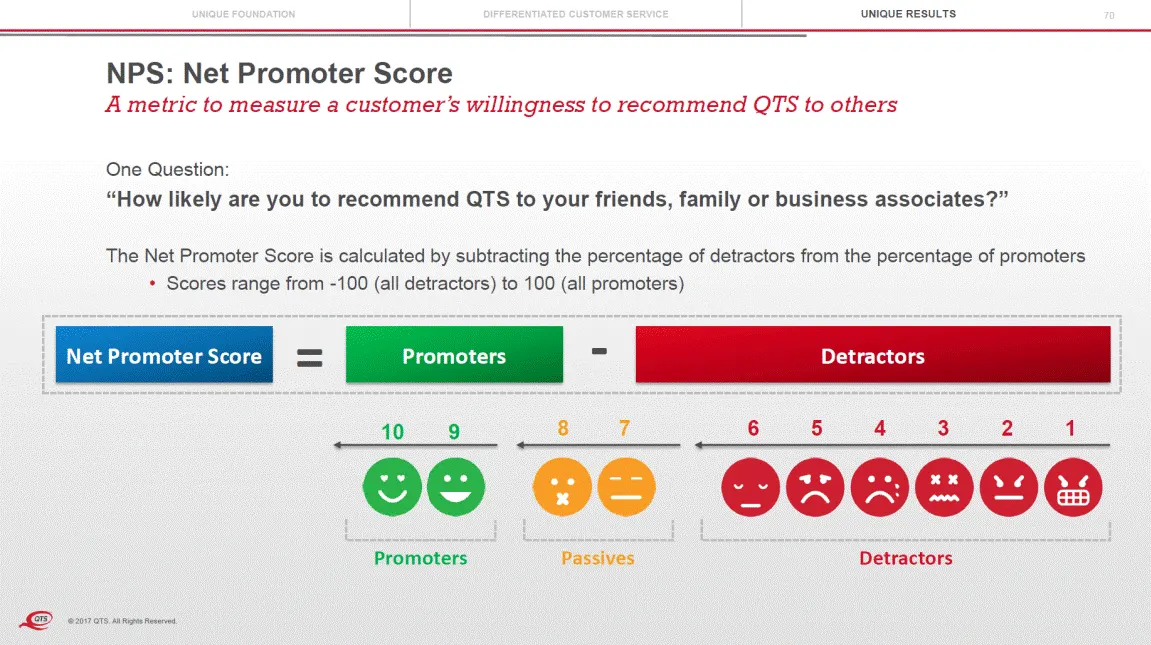
UNIQUE FOUNDATION DIFFERENTIATED CUSTOMER SERVICE UNIQUE RESULTS 70 NPS: Net Promoter Score A metric to measure a customer’s willingness to recommend QTS to others One Question: “How likely are you to recommend QTS to your friends, family or business associates?” The Net Promoter Score is calculated
Slide 70: Unique Results
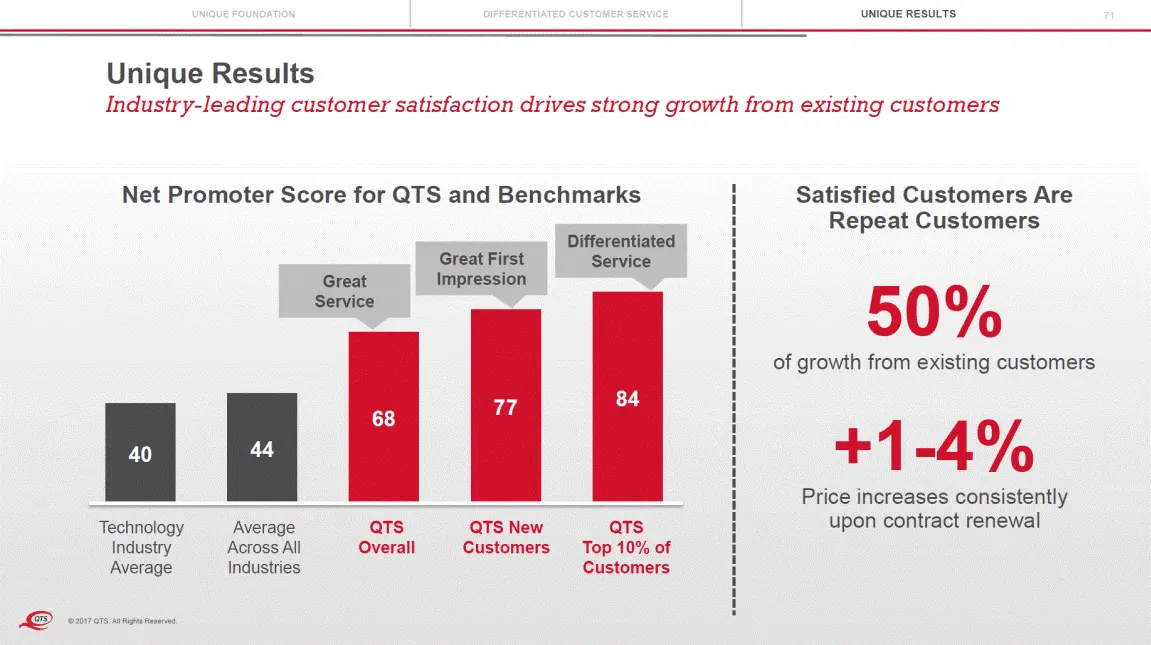
UNIQUE FOUNDATION DIFFERENTIATED CUSTOMER SERVICE UNIQUE RESULTS 71 Unique Results Industry-leading customer satisfaction drives strong growth from existing customers Net Promoter Score for QTS and Benchmarks Satisfied Customers Are Repeat Customers Differentiated Service Great First Impression Grea
Slide 71: Proven Go-To-Market Formula
72 Proven Go-To-Market Formula Dan Bennewitz, COO – Sales, Product & Marketing © 2017 QTS. All Rights Reserved.
Slide 72: Focused on Market Segments with Strong Growth Profiles
INTEGRATED APPROACH TO MEET HYBRID NEEDS SCALABLE SALES MODEL EXPANDING REACH THROUGH STRATEGIC PARTNERSHIPS 74 Focused on Market Segments with Strong Growth Profiles QTS’ integrated 3C portfolio provides attractive solutions for changing buyer needs Hyperscale: Profile: High-growth Cloud & SaaS com
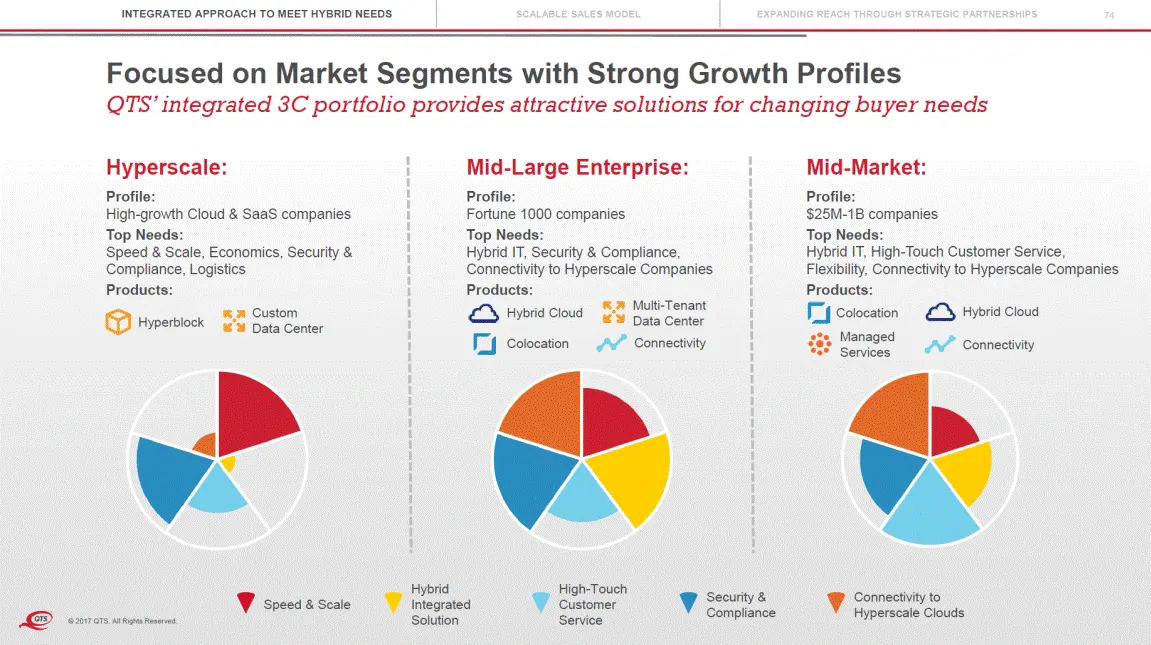
Slide 73: Meeting Hybrid IT Needs of Today and Tomorrow
INTEGRATED APPROACH TO MEET HYBRID NEEDS SCALABLE SALES MODEL EXPANDING REACH THROUGH STRATEGIC PARTNERSHIPS 75 Meeting Hybrid IT Needs of Today and Tomorrow QTS differentiation and value proposition is relevant to four major use cases Hyperscale Data Center Outsourcing IT Modernization Compliance-D
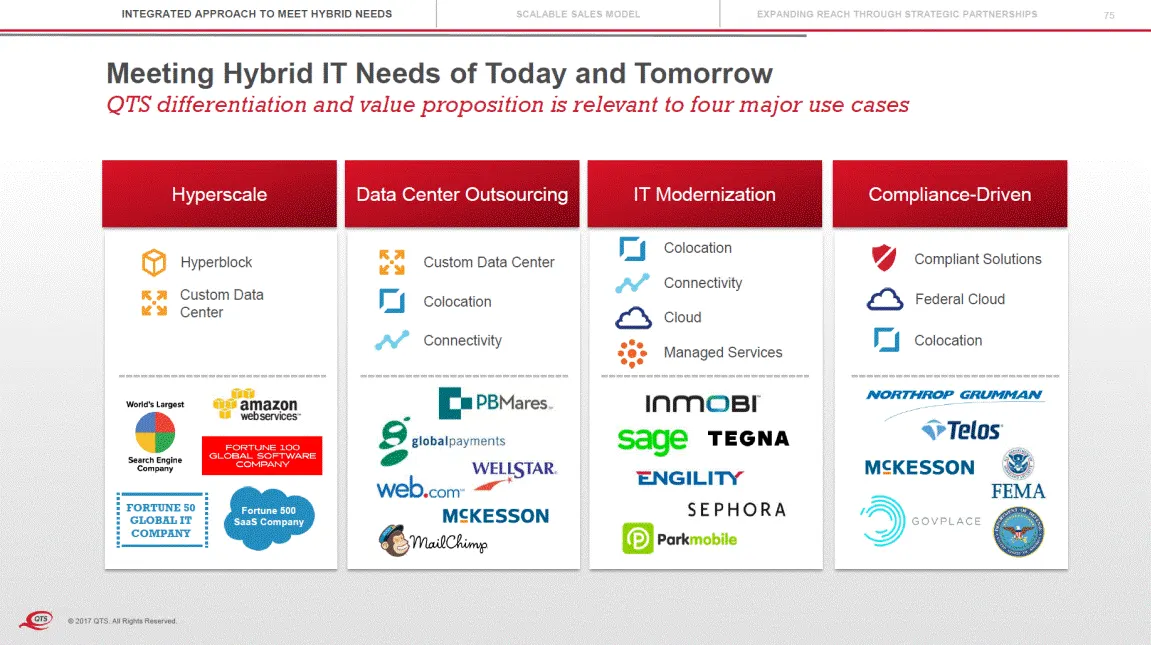
Slide 74: Integrated Go-To-Market Sales Model
INTEGRATED APPROACH TO MEET HYBRID NEEDS SCALABLE SALES MODEL EXPANDING REACH THROUGH STRATEGIC PARTNERSHIPS 76 Integrated Go-To-Market Sales Model Model execution enables scalable, efficient growth Industry Verticals State Government 60% of customer base 3:1 ratio Sales Competency Model Over 25 cor
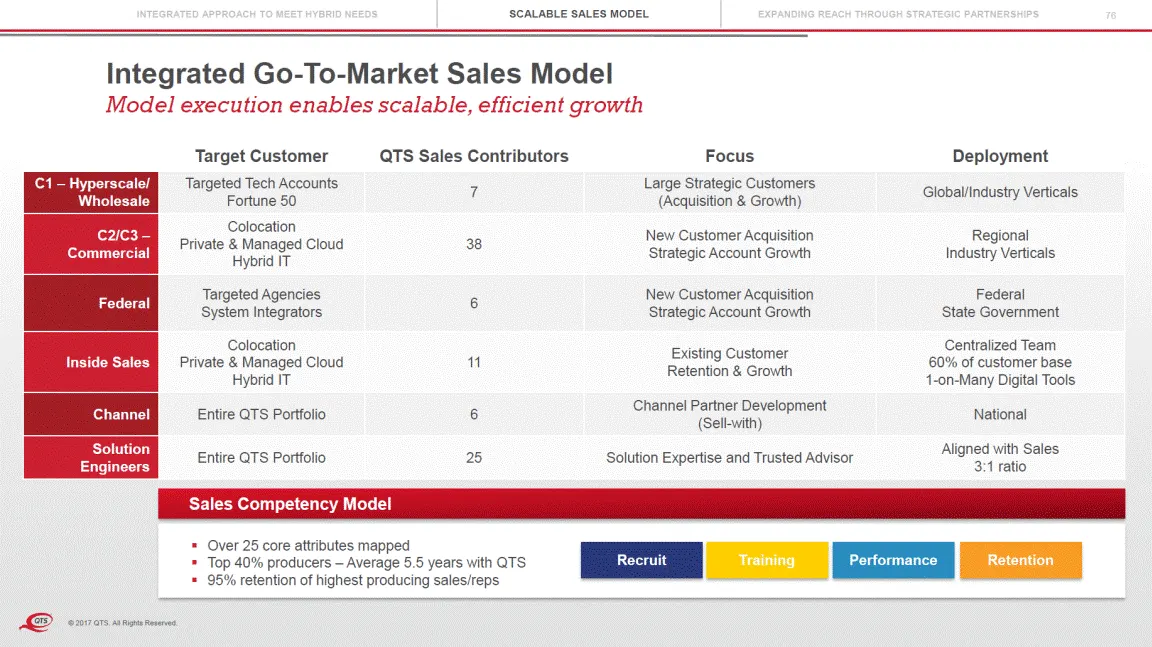
Slide 75: Sales Channel Strategy
INTEGRATED APPROACH TO MEET HYBRID NEEDS SCALABLE SALES MODEL EXPANDING REACH THROUGH STRATEGIC PARTNERSHIPS 77 Sales Channel Strategy Expanding market reach through strategic channel partnerships Channel Partners: Hybrid Delivery + Solutions: Custom Data Center Colocation Custom Data Center Cloud C
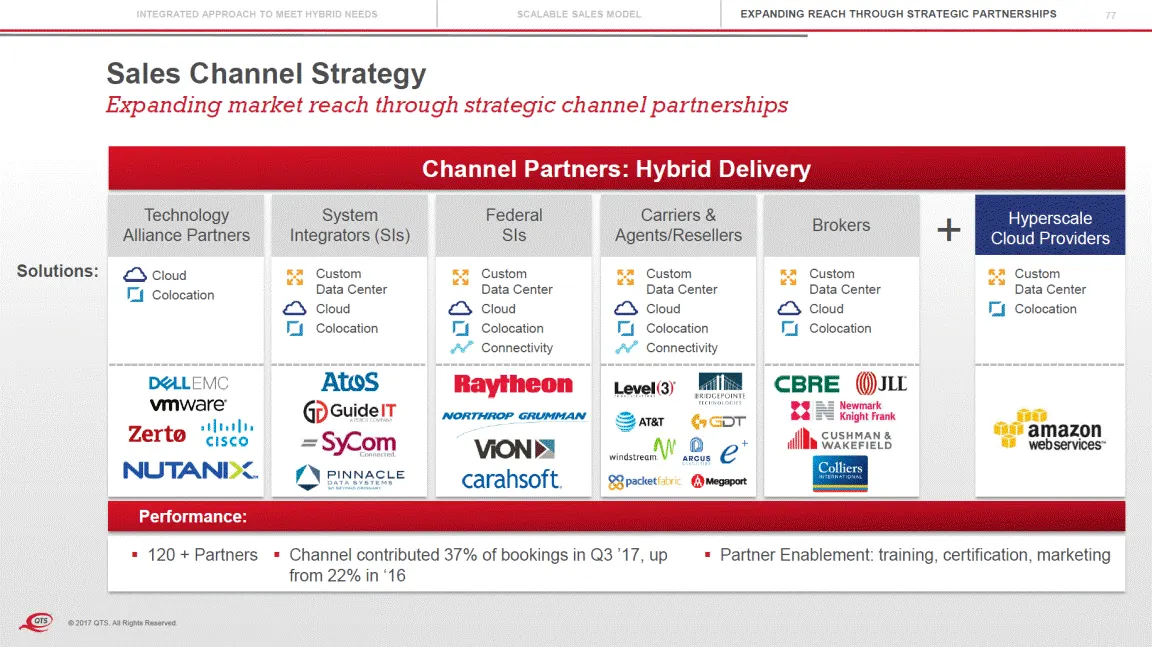
Slide 76: Proven Go-To-Market Formula
INTEGRATED APPROACH TO MEET HYBRID NEEDS SCALABLE SALES MODEL EXPANDING REACH THROUGH STRATEGIC PARTNERSHIPS 78 Proven Go-To-Market Formula 50% of growth from existing customers 65% In new logos signed YTD ~35% In opportunity pipeline MRR for top 50 customers © 2017 QTS. All Rights Reserved.
Slide 77: Proven Go-To-Market Formula Summary
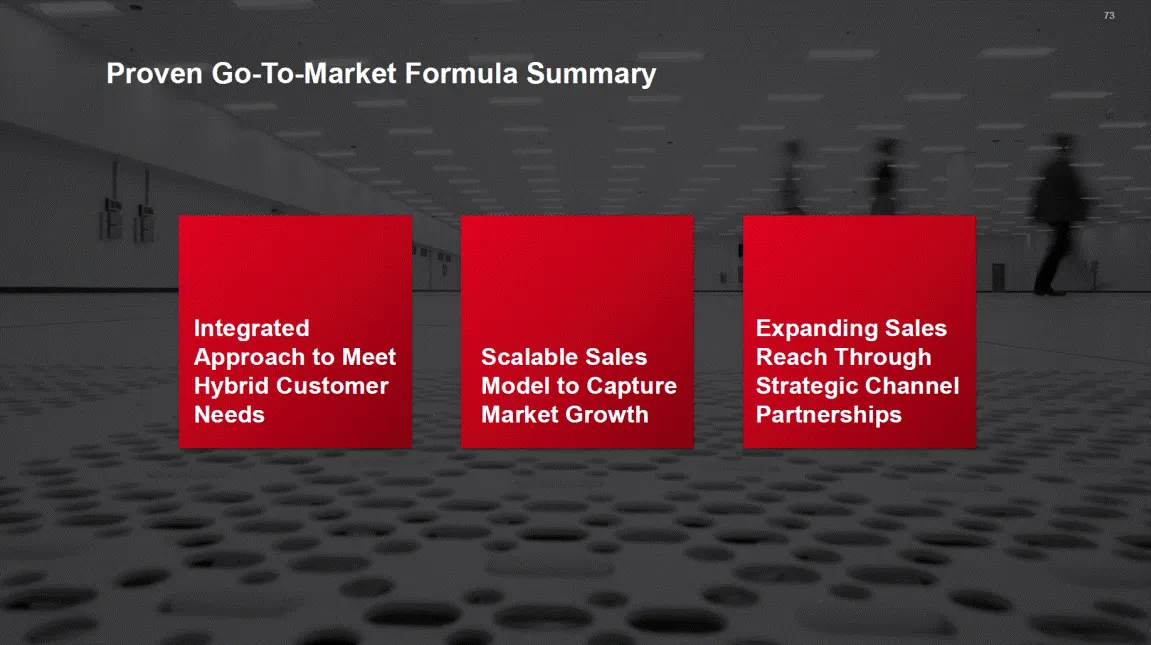
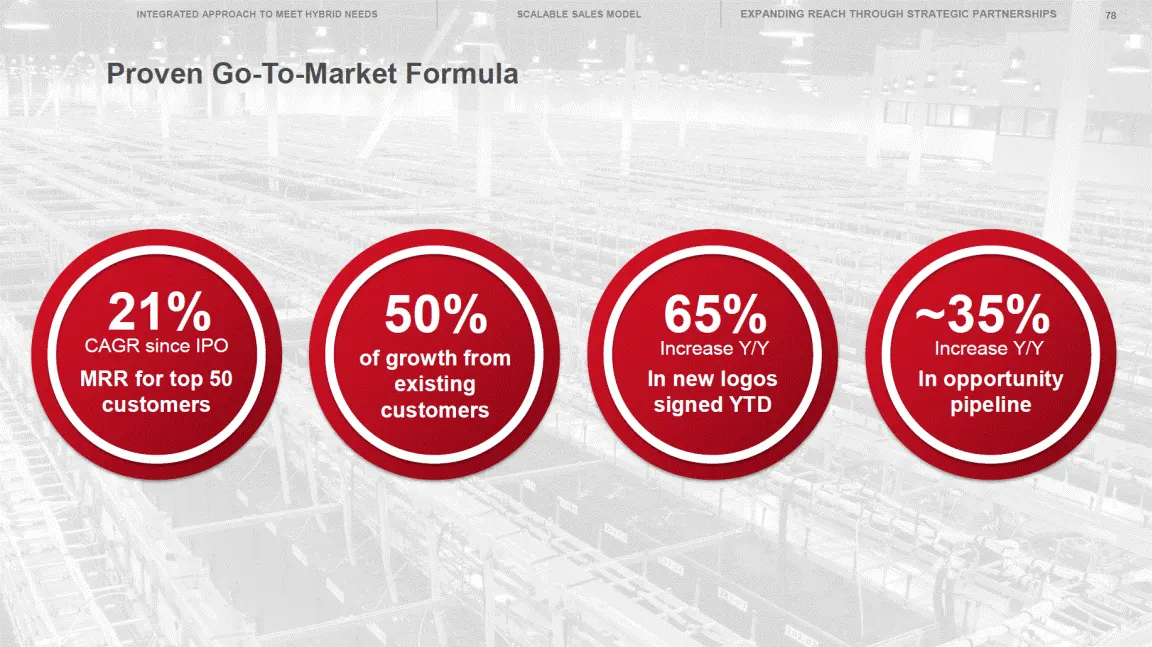
79 Proven Go-To-Market Formula Summary Integrated approach to hybrid customer needs enables QTS to target broader market opportunity and continue to grow as buyer needs change Scalable sales model organized to efficiently sell into diverse customer groups Enabling strategic channel partnerships to e
Slide 78: 8C © 2017 QTS. AJIRights Reserved
8C © 2017 QTS. AJIRights Reserved
Slide 79: QTS From the Customer's View: Fireside Discussion
81 QTS From the Customer’s View Fireside Discussion © 2017 QTS. All Rights Reserved.
Slide 80: Financial Discipline and Long-Term Outlook
82 Financial Discipline and Long-Term Outlook Jeff Berson, CFO © 2017 QTS. All Rights Reserved.
Slide 81: Financial Discipline and Long-Term Outlook
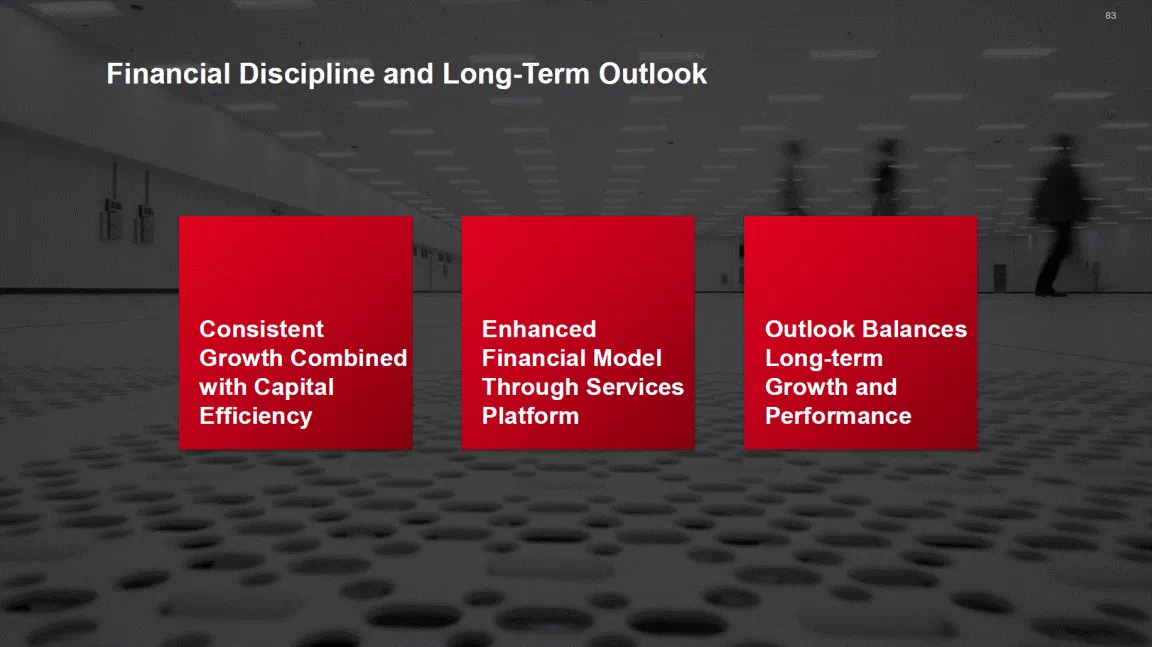
83 Financial Discipline and Long-Term Outlook Consistent Growth Combined with Capital Efficiency Enhanced Financial Model Outlook Balances Long-term Growth and Performance Through Platform Services © 2017 QTS. All Rights Reserved.
Slide 82: Demonstrated Ability to Grow While Achieving Operating Efficiencies
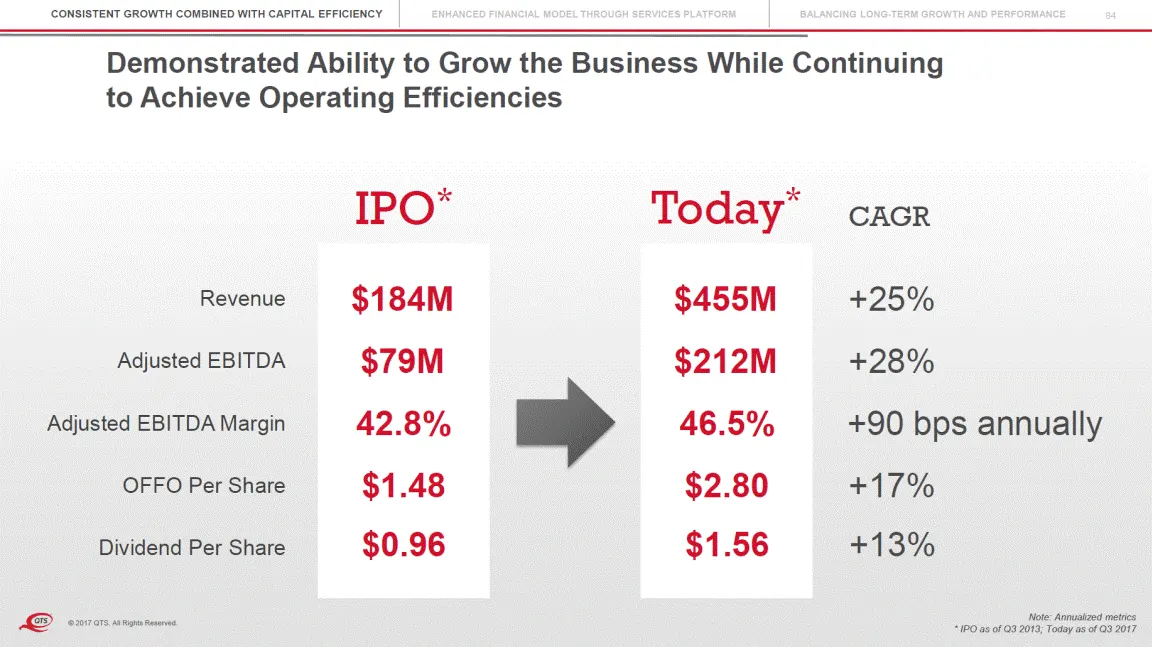
CONSISTENT GROWTH COMBINED WITH CAPITAL EFFICIENCY ENHANCED FINANCIAL MODEL THROUGH SERVICES PLATFORM BALANCING LONG-TERM GROWTH AND PERFORMANCE 84 Demonstrated Ability to Grow the Business While Continuing to Achieve Operating Efficiencies IPO* Today* CAGR $184M $79M 42.8% $1.48 $0.96 $455M $212M 4
Slide 83: Significant Footprint Growth with Stable Occupancy
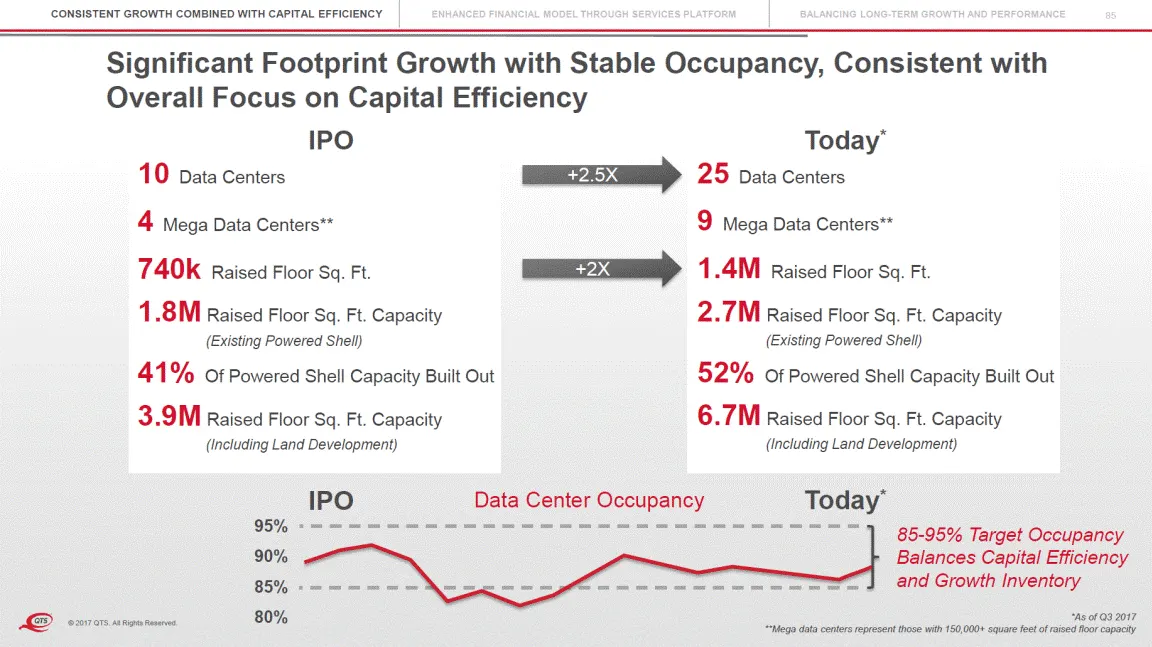
CONSISTENT GROWTH COMBINED WITH CAPITAL EFFICIENCY ENHANCED FINANCIAL MODEL THROUGH SERVICES PLATFORM BALANCING LONG-TERM GROWTH AND PERFORMANCE 85 Significant Footprint Growth with Stable Occupancy, Consistent with Overall Focus on Capital IPO Efficiency Today* 25 Data Centers 10 +2.5X Data Centers
Slide 84: Enhanced Customer and Geographic Diversity
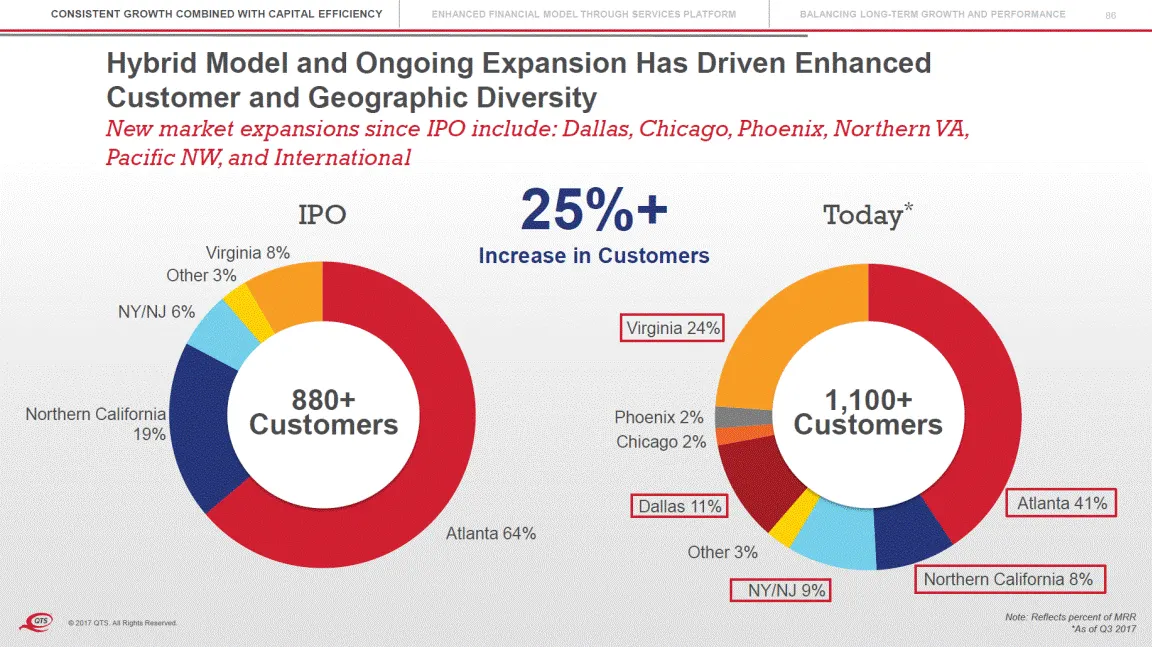
CONSISTENT GROWTH COMBINED WITH CAPITAL EFFICIENCY ENHANCED FINANCIAL MODEL THROUGH SERVICES PLATFORM BALANCING LONG-TERM GROWTH AND PERFORMANCE 86 Hybrid Model and Ongoing Expansion Has Driven Enhanced Customer and Geographic Diversity New market expansions since IPO include: Dallas, Chicago, Phoen
Slide 85: Development Model Balances Near- and Long-term ROIC Profile
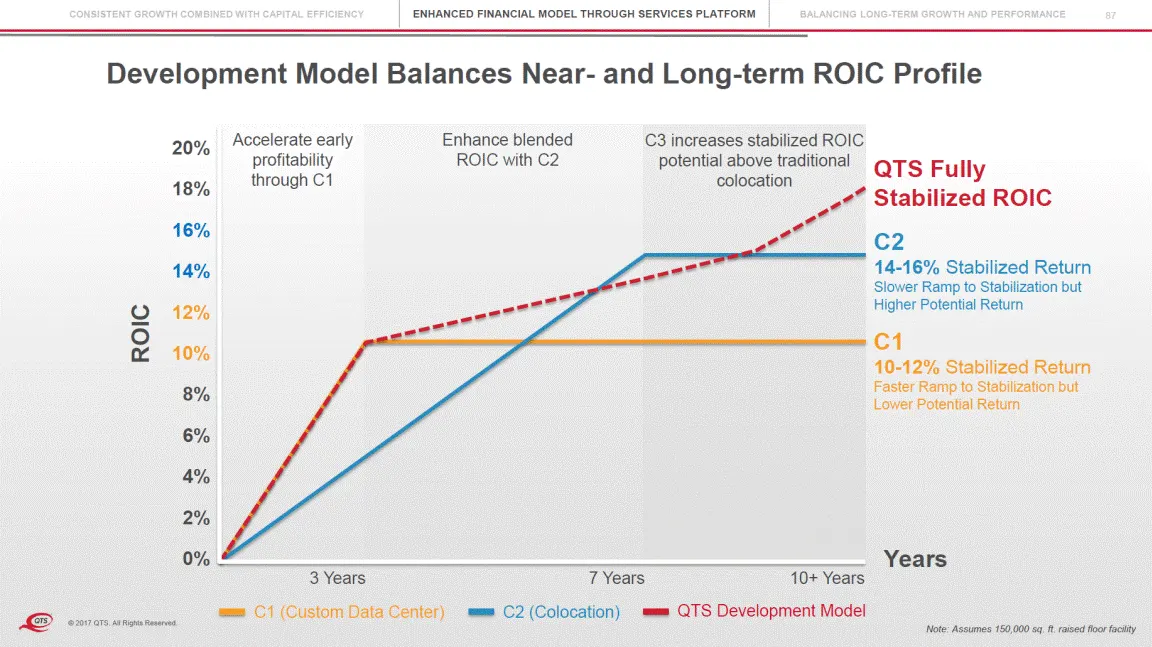
CONSISTENT GROWTH COMBINED WITH CAPITAL EFFICIENCY ENHANCED FINANCIAL MODEL THROUGH SERVICES PLATFORM BALANCING LONG-TERM GROWTH AND PERFORMANCE 87 Development Model Balances Near-and Long-term ROIC Profile 20% QTS Fully Stabilized ROIC C2 14-16% Stabilized Return Slower Ramp to Stabilization but Hi
Slide 86: Mega Data Center Lifecycle
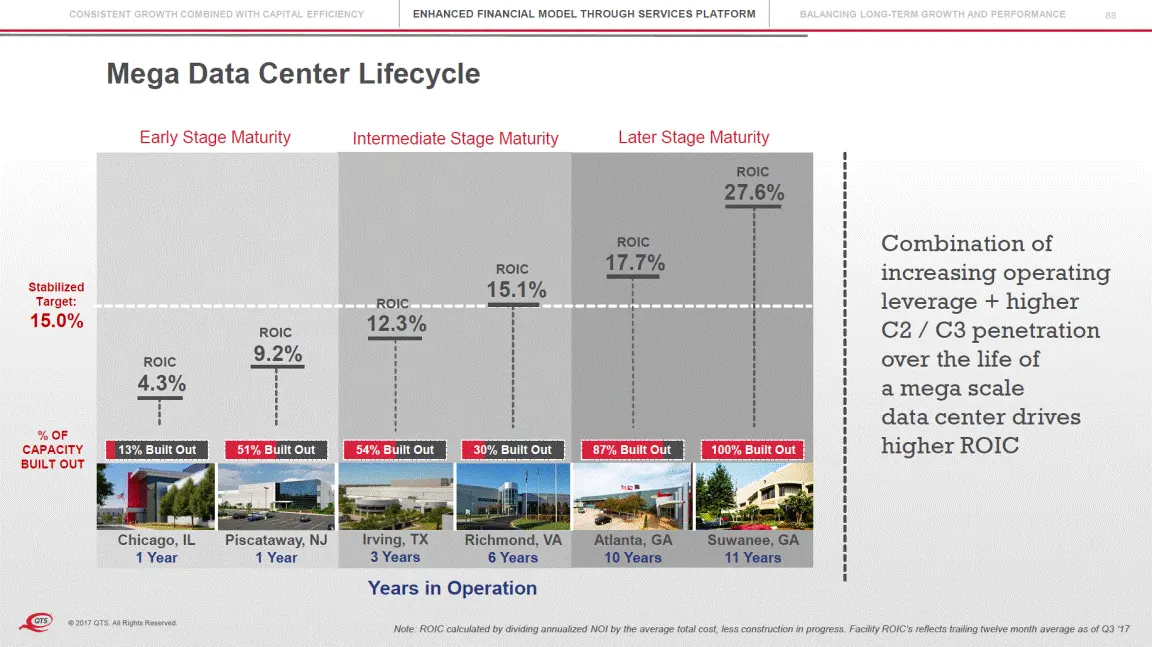
CONSISTENT GROWTH COMBINED WITH CAPITAL EFFICIENCY ENHANCED FINANCIAL MODEL THROUGH SERVICES PLATFORM BALANCING LONG-TERM GROWTH AND PERFORMANCE 88 Mega Data Center Lifecycle Early Stage Maturity Later Stage Maturity Intermediate Stage Maturity % Combination of increasing operating leverage + higher
Slide 87: Atlanta-Suwanee Development Case Study
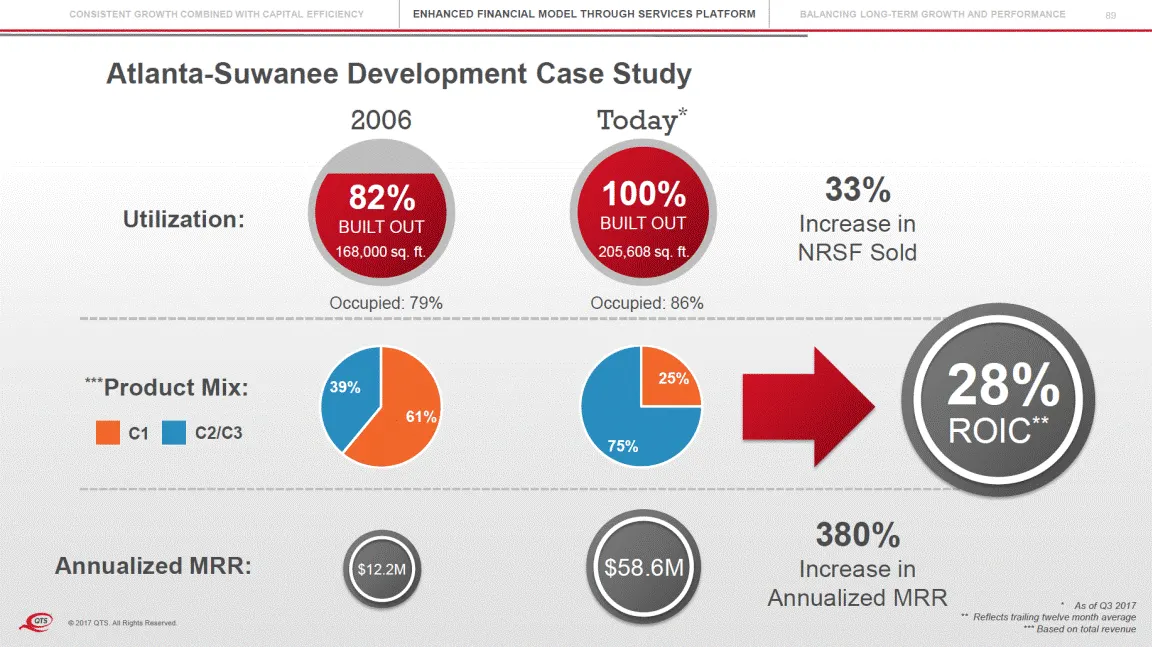
CONSISTENT GROWTH COMBINED WITH CAPITAL EFFICIENCY ENHANCED FINANCIAL MODEL THROUGH SERVICES PLATFORM BALANCING LONG-TERM GROWTH AND PERFORMANCE 89 Atlanta-Suwanee Development 2006 Case Study Today* 33% Increase in 100% BUILT OUT 205,608 sq. ft. 82% BUILT OUT 168,000 sq. ft. Utilization: NRSF Sold O
Slide 88: Differentiated Model Supports ROIC Performance
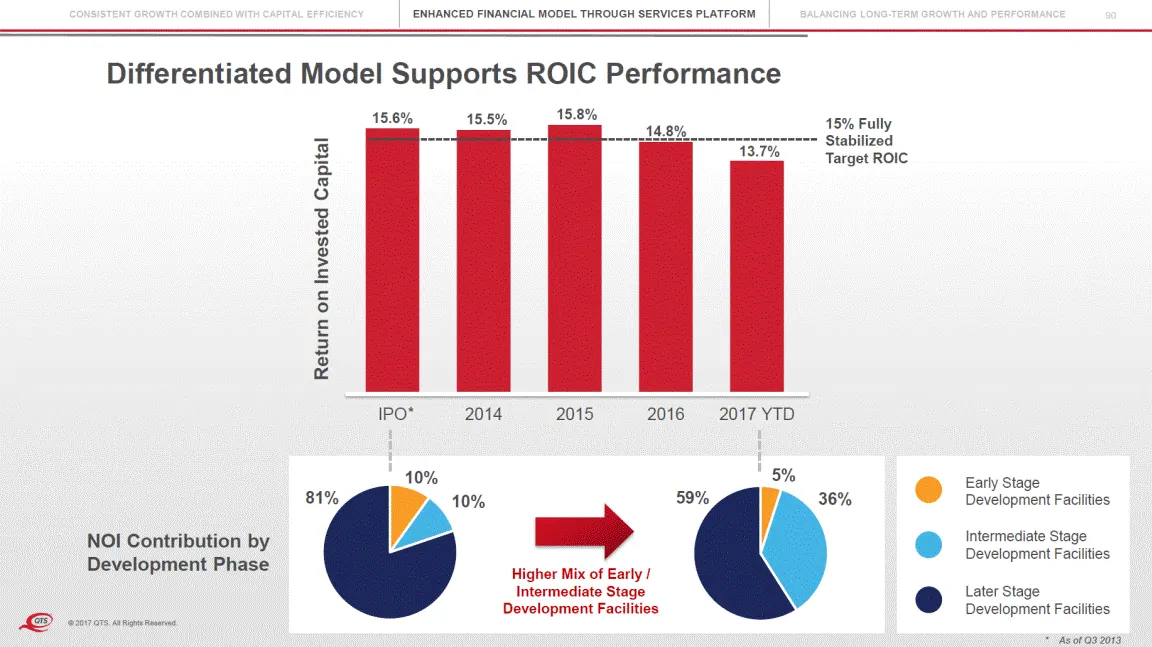
CONSISTENT GROWTH COMBINED WITH CAPITAL EFFICIENCY ENHANCED FINANCIAL MODEL THROUGH SERVICES PLATFORM BALANCING LONG-TERM GROWTH AND PERFORMANCE 90 Differentiated Model Supports ROIC 15.8% Performance 15.6% 15.5% 15% Fully Stabilized Target ROIC IPO* 2014 2015 2016 2017 YTD 5% 10% Early Stage Develo
Slide 89: Value of Selling the Cubic Feet
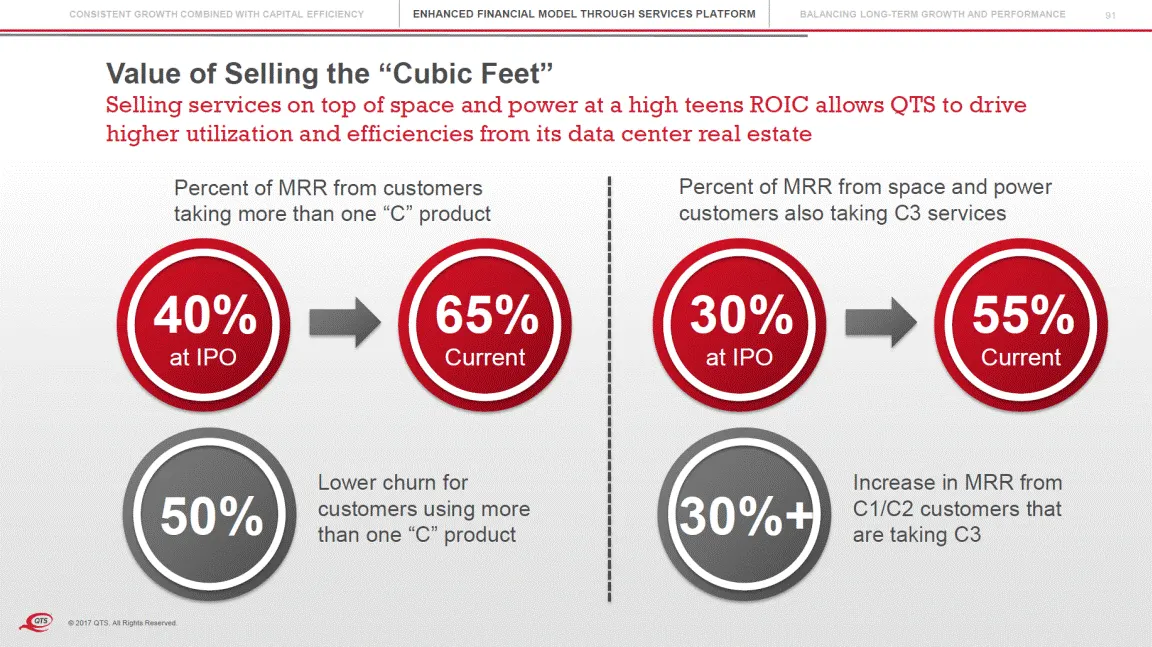
CONSISTENT GROWTH COMBINED WITH CAPITAL EFFICIENCY ENHANCED FINANCIAL MODEL THROUGH SERVICES PLATFORM BALANCING LONG-TERM GROWTH AND PERFORMANCE 91 Value of Selling the “Cubic Feet” Selling services on top of space and power at a high teens ROIC allows QTS to drive higher utilization and efficiencie
Slide 90: Pricing Trends Across C2/C3 Product Mix Remain Healthy
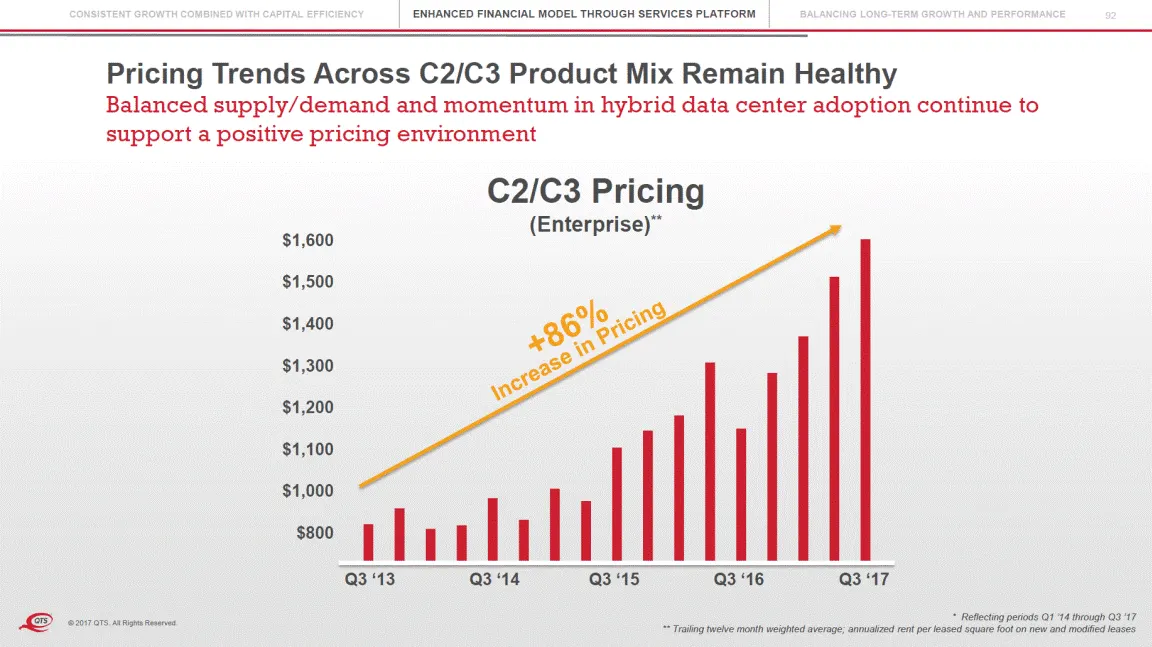
CONSISTENT GROWTH COMBINED WITH CAPITAL EFFICIENCY ENHANCED FINANCIAL MODEL THROUGH SERVICES PLATFORM BALANCING LONG-TERM GROWTH AND PERFORMANCE 92 Pricing Trends Across C2/C3 Product Mix Remain Healthy Balanced supply/demand and momentum in hybrid data center adoption support a positive pricing env
Slide 91: The Value of C3 to Financial Performance
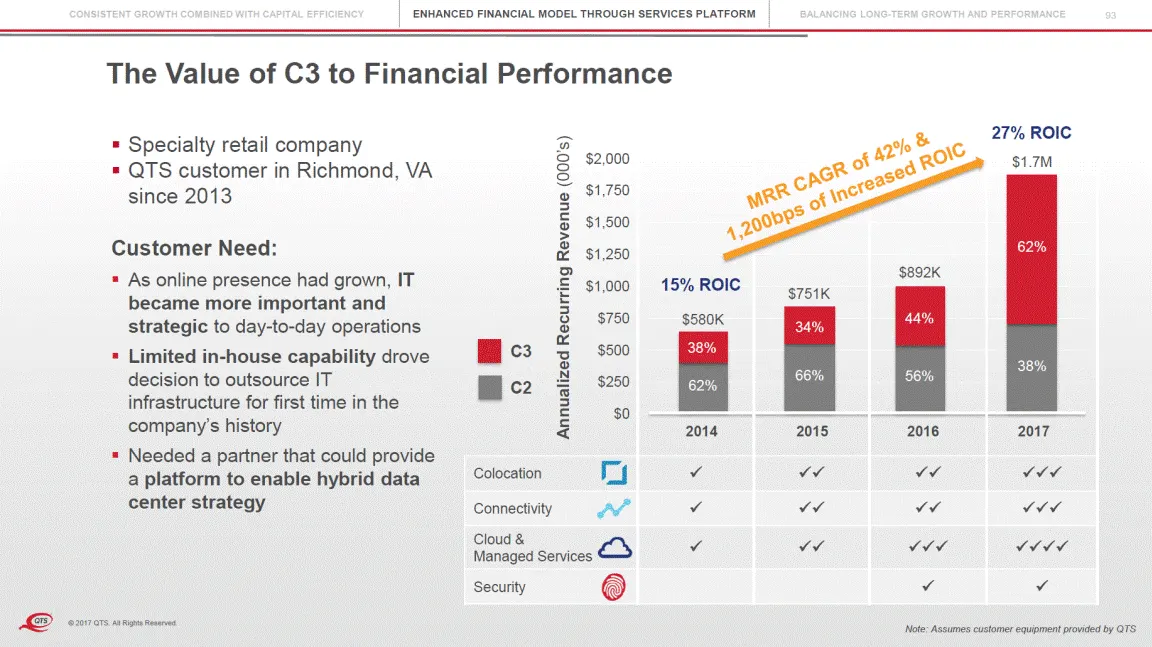
CONSISTENT GROWTH COMBINED WITH CAPITAL EFFICIENCY ENHANCED FINANCIAL MODEL THROUGH SERVICES PLATFORM BALANCING LONG-TERM GROWTH AND PERFORMANCE 93 The Value of C3 to Financial Performance Specialty retail company QTS customer in Richmond, VA since 2013 Customer Need: As online presence had grown, I
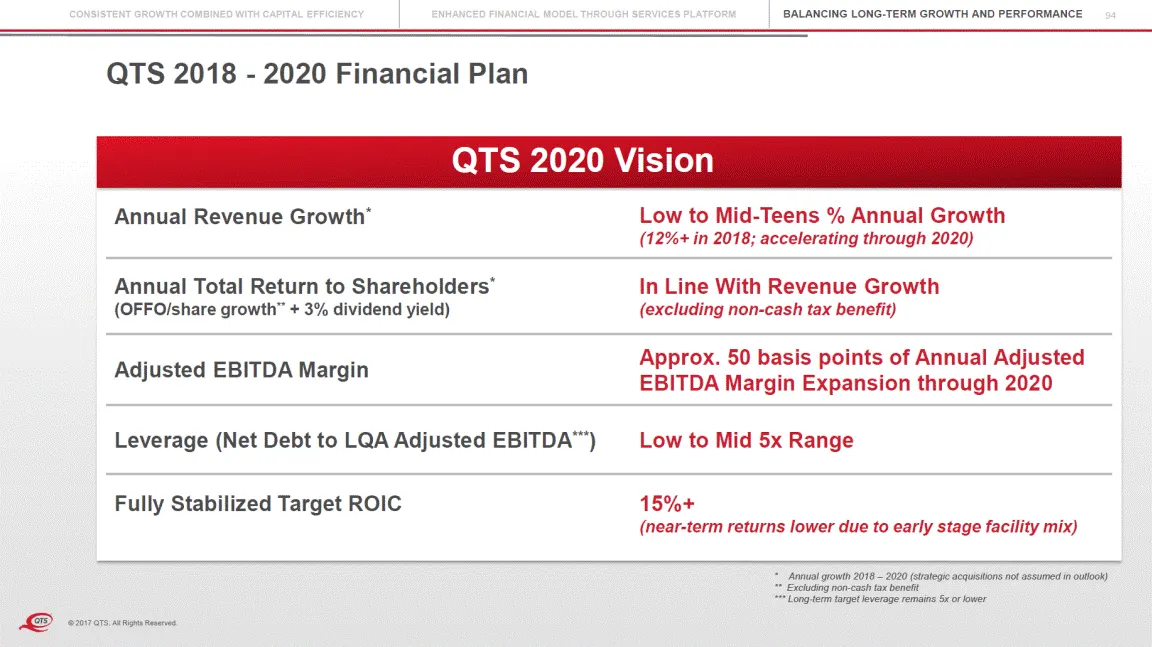
Slide 92: QTS 2018 - 2020 Financial Plan
CONSISTENT GROWTH COMBINED WITH CAPITAL EFFICIENCY ENHANCED FINANCIAL MODEL THROUGH SERVICES PLATFORM BALANCING LONG-TERM GROWTH AND PERFORMANCE 94 QTS 2018 - 2020 Financial Plan QTS 2020 Vision EBITDA Margin Expansion through 2020 * Annual growth 2018 – 2020 (strategic acquisitions not assumed in o
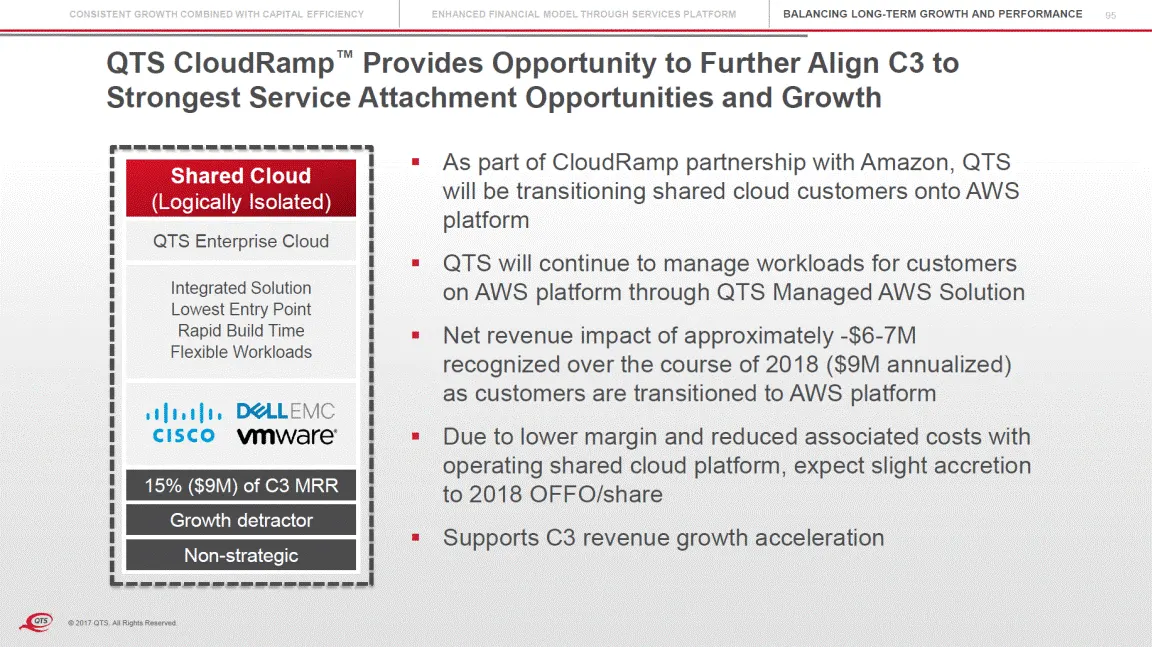
Slide 93: QTS CloudRamp Aligns C3 to Strongest Opportunities
CONSISTENT GROWTH COMBINED WITH CAPITAL EFFICIENCY ENHANCED FINANCIAL MODEL THROUGH SERVICES PLATFORM BALANCING LONG-TERM GROWTH AND PERFORMANCE 95 QTS CloudRamp™ Provides Opportunity to Further Align C3 to Strongest Service Attachment Opportunities and Growth As part of CloudRamp partnership with A
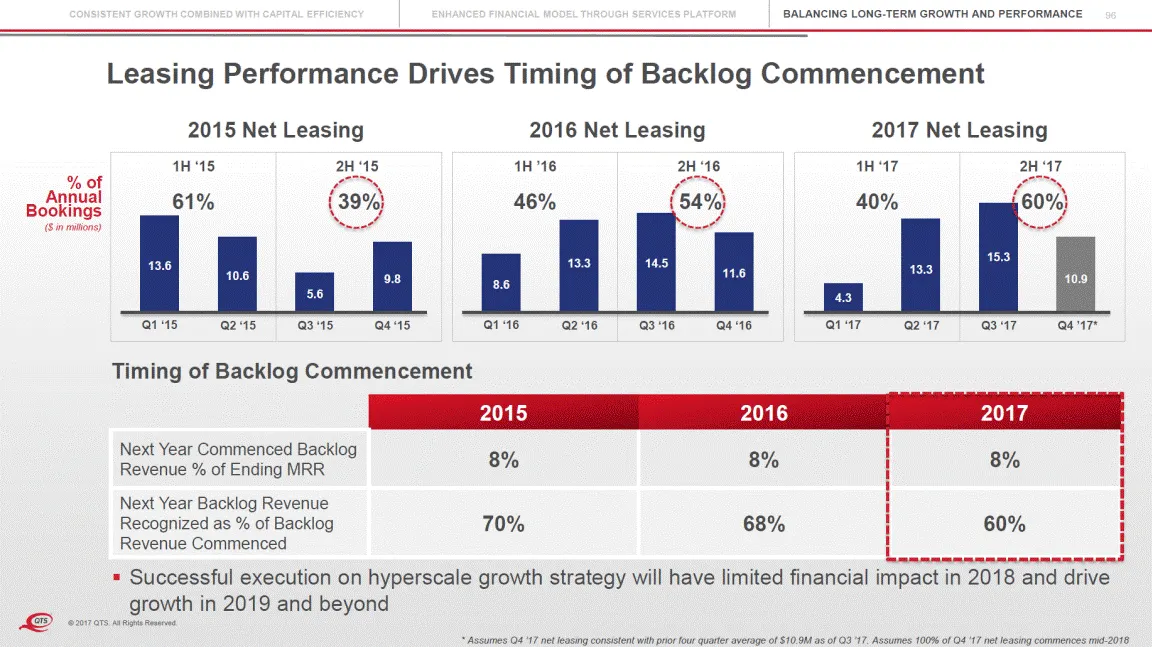
Slide 94: Leasing Performance Drives Timing of Backlog Commencement
CONSISTENT GROWTH COMBINED WITH CAPITAL EFFICIENCY ENHANCED FINANCIAL MODEL THROUGH SERVICES PLATFORM BALANCING LONG-TERM GROWTH AND PERFORMANCE 96 Leasing Performance Drives Timing of Backlog Commencement 2015 Net Leasing 2016 Net Leasing 2017 Net Leasing % of Annual 60% Bookings ($ in millions) Ti
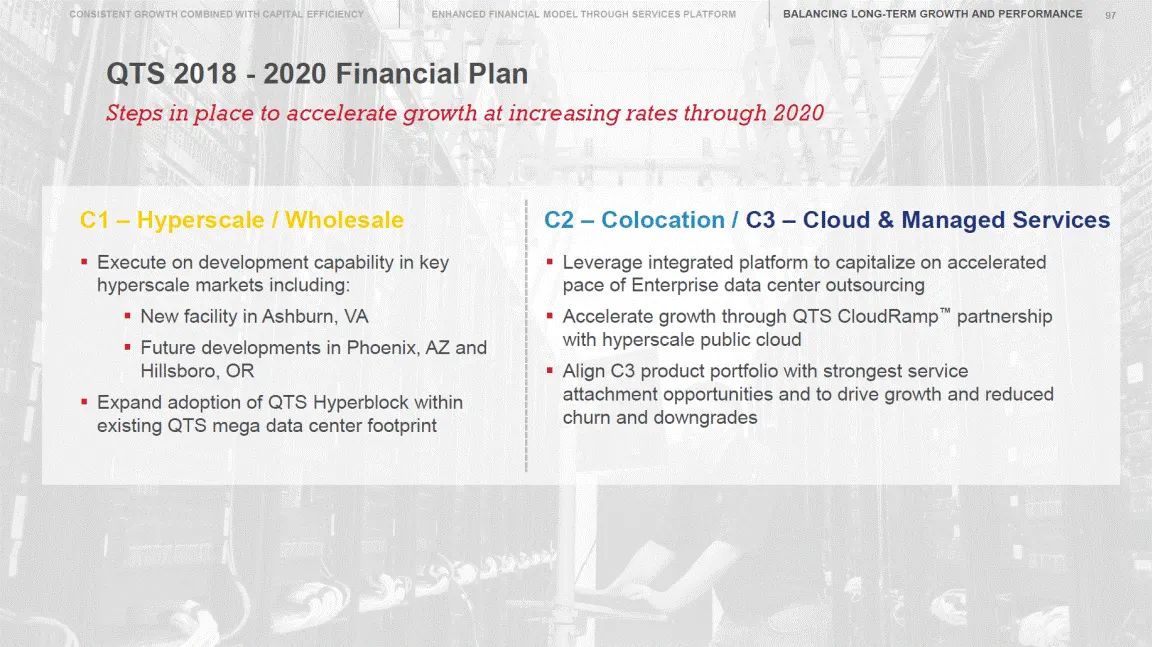
Slide 95: QTS 2018 - 2020 Financial Plan: Steps to Accelerate Growth
CONSISTENT GROWTH COMBINED WITH CAPITAL EFFICIENCY ENHANCED FINANCIAL MODEL THROUGH SERVICES PLATFORM BALANCING LONG-TERM GROWTH AND PERFORMANCE 97 QTS 2018 - 2020 Financial Plan Steps in place to accelerate growth at increasing rates through 2020 C2 – Colocation / C3 – Cloud & Managed Services C1 –
Slide 96: Positive Momentum in the Business Sets Up Future Growth
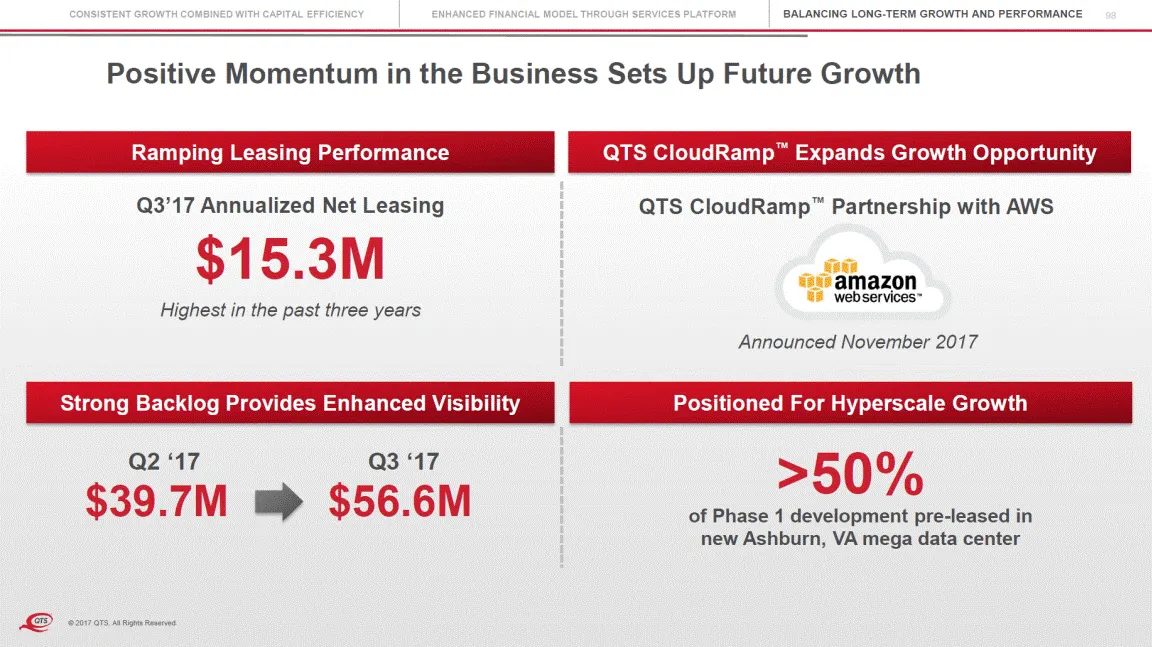
CONSISTENT GROWTH COMBINED WITH CAPITAL EFFICIENCY ENHANCED FINANCIAL MODEL THROUGH SERVICES PLATFORM BALANCING LONG-TERM GROWTH AND PERFORMANCE 98 Positive Momentum in the Business Sets Up Future Growth QTS CloudRamp™ Expands Growth Opportunity Ramping Leasing Performance Q3’17 Annualized Net Leasi
Slide 97: Disciplined Approach to Capital Allocation
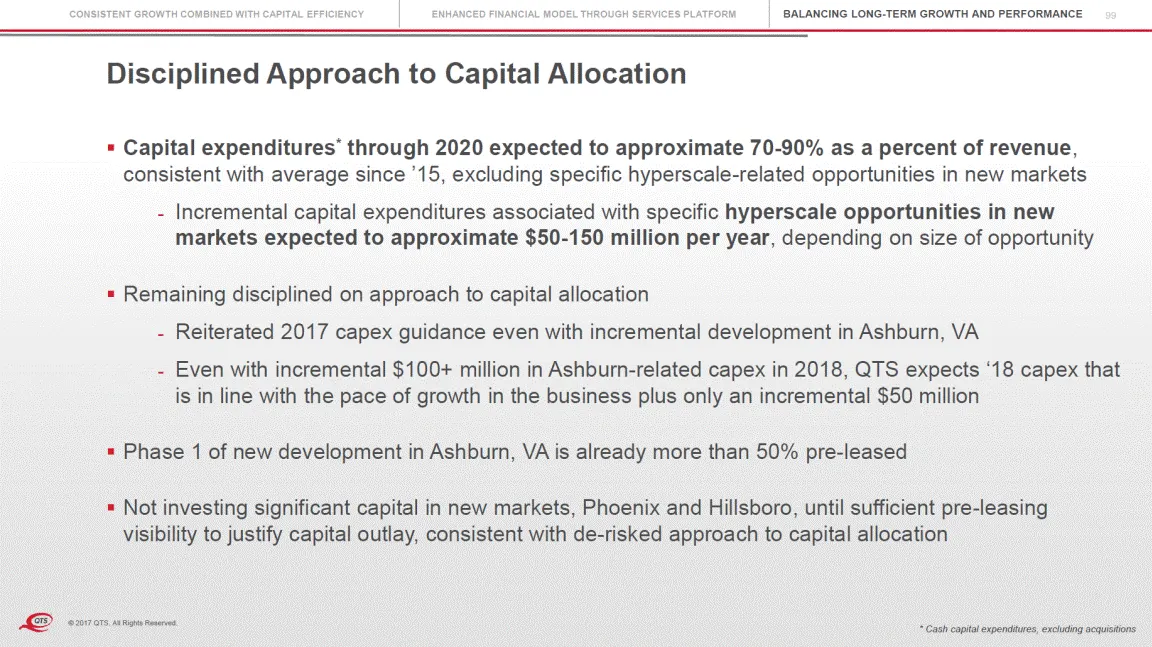
CONSISTENT GROWTH COMBINED WITH CAPITAL EFFICIENCY ENHANCED FINANCIAL MODEL THROUGH SERVICES PLATFORM BALANCING LONG-TERM GROWTH AND PERFORMANCE 99 Disciplined Approach to Capital Allocation Capital expenditures* through 2020 expected to approximate 70-90% as a percent of revenue, consistent with av
Slide 98: Disciplined Balance Sheet Management
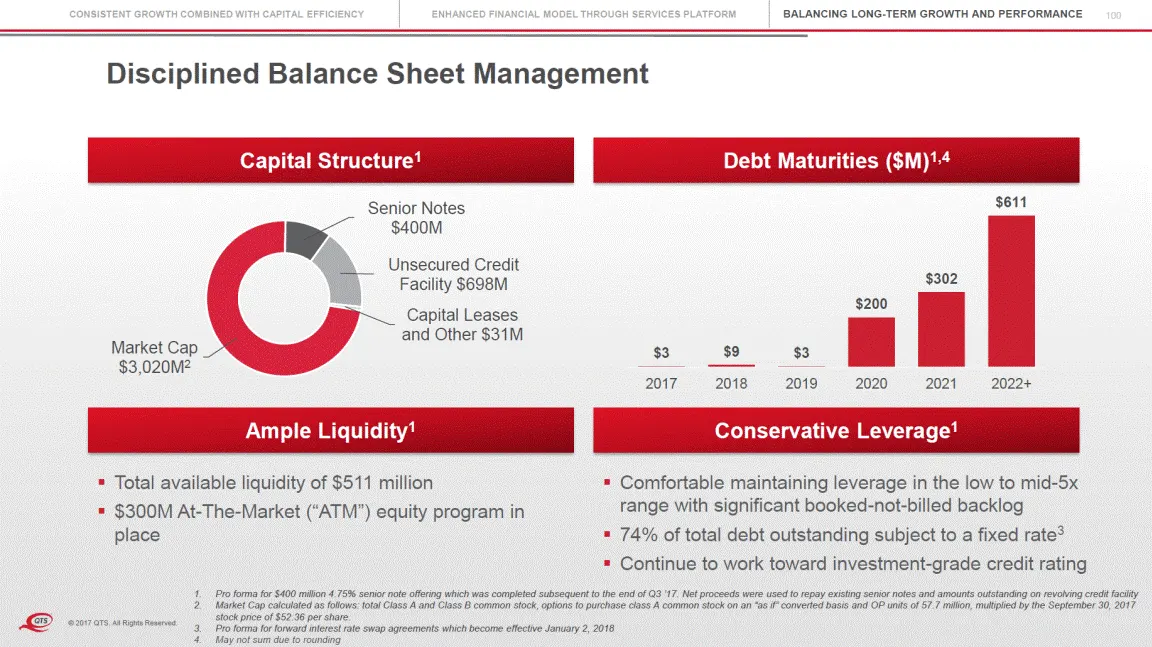
CONSISTENT GROWTH COMBINED WITH CAPITAL EFFICIENCY ENHANCED FINANCIAL MODEL THROUGH SERVICES PLATFORM BALANCING LONG-TERM GROWTH AND PERFORMANCE 100 Disciplined Balance Sheet Management Capital Structure1 Debt Maturities ($M)1,4 $611 Senior Notes $400M Unsecured Credit Facility $698M Capital Leases
Slide 99: 2017 Full Year Guidance Unchanged
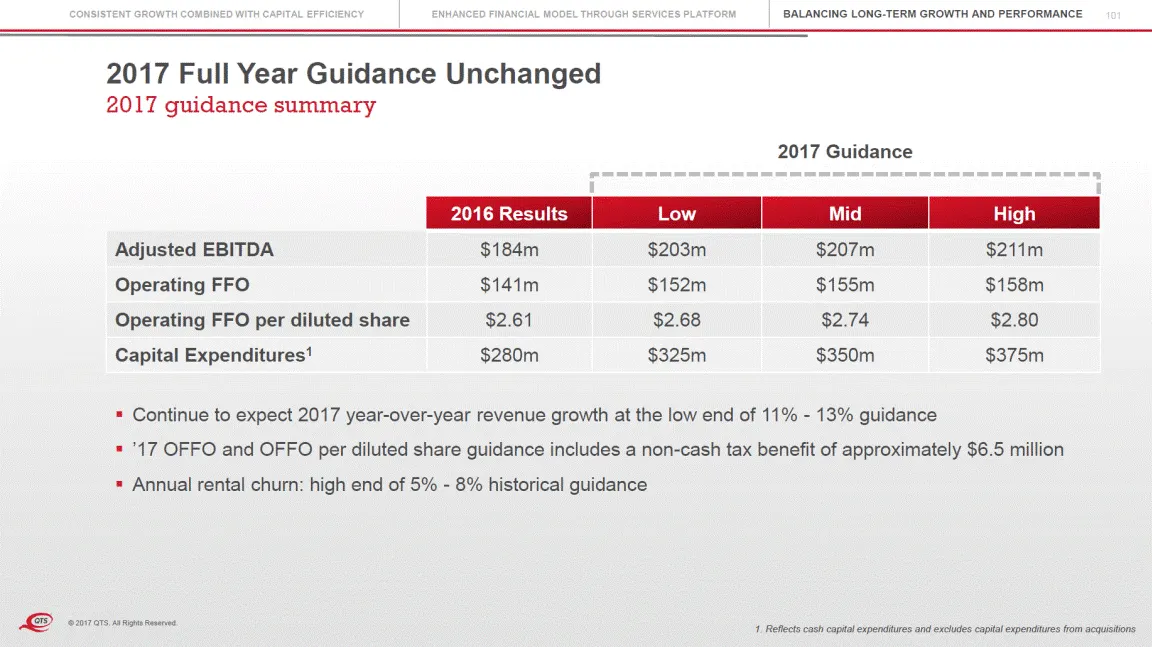
CONSISTENT GROWTH COMBINED WITH CAPITAL EFFICIENCY ENHANCED FINANCIAL MODEL THROUGH SERVICES PLATFORM BALANCING LONG-TERM GROWTH AND PERFORMANCE 101 2017 Full Year Guidance Unchanged 2017 guidance summary 2017 Guidance Continue to expect 2017 year-over-year revenue growth at the low end of 11% - 13%
Slide 100: Financial Discipline and Long-Term Outlook Summary
102 Financial Discipline and Long-Term Outlook Demonstrated a track record of consistent growth combined with capital efficiency Integrated services platform enhances financial model by enabling QTS to drive revenue on top of space and power which drives higher utilization and ROIC Financial outlook
Slide 101: Q&A
103 Q&A © 2017 QTS. All Rights Reserved.
Slide 102: QTS Investor Day Summary
104 QTS Investor Day Summary Chad Williams, Chairman & CEO © 2017 QTS. All Rights Reserved.
Slide 103: QTS Investor Day Summary
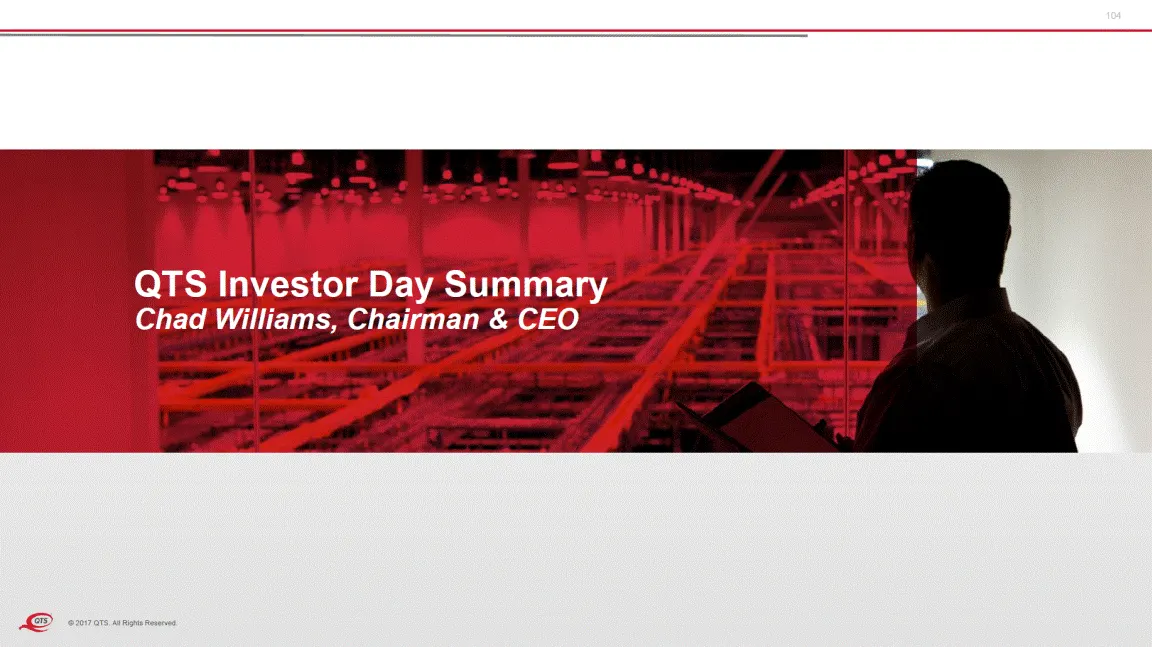
105 QTS Investor Day Summary Significant growth opportunity for third party data centers driven by: • • Hyperscale (C1) Enterprise outsourcing (C2/C3) Capture Hyperscale demand through: • • • Mega scale data centers Hyperblock (standardized and scalable) and Hyperscale Build-to-Suit (4MW+) New growt
Slide 104: QTS Investor Day 2017
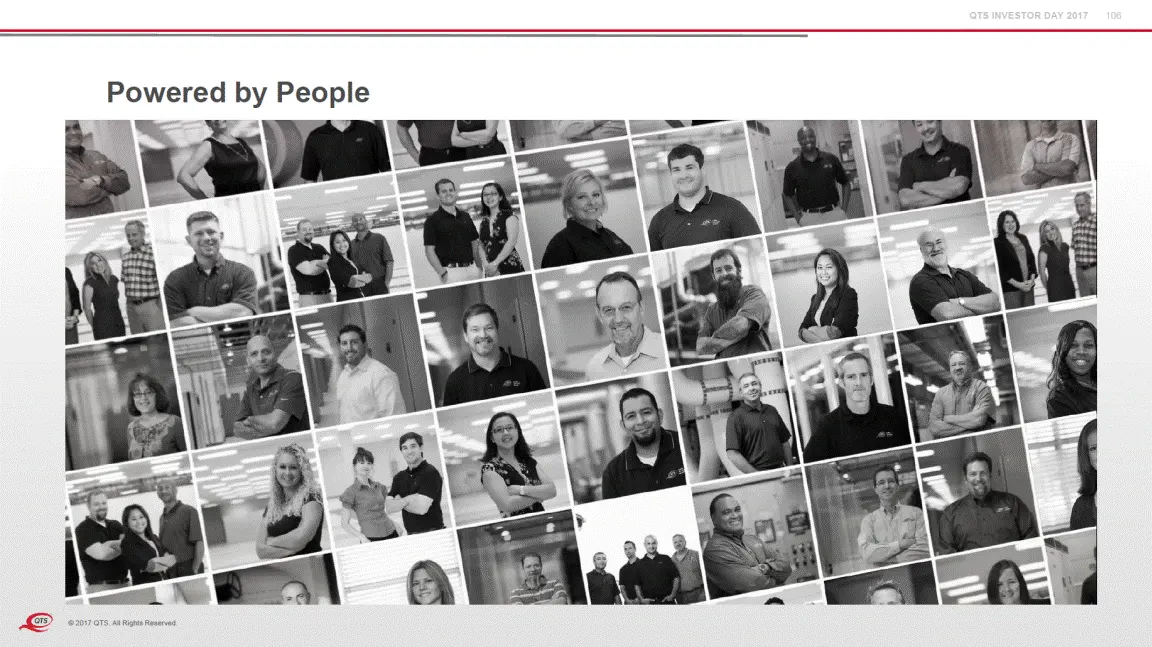
QTS INVESTOR DAY 2017 106 by Powered People ,.,ljjf;? © 2017 QTS. AJIRights Reserved
Slide 105: Appendix
107 APPENDIX © 2017 QTS. All Rights Reserved.
Slide 106: NOI Reconciliation
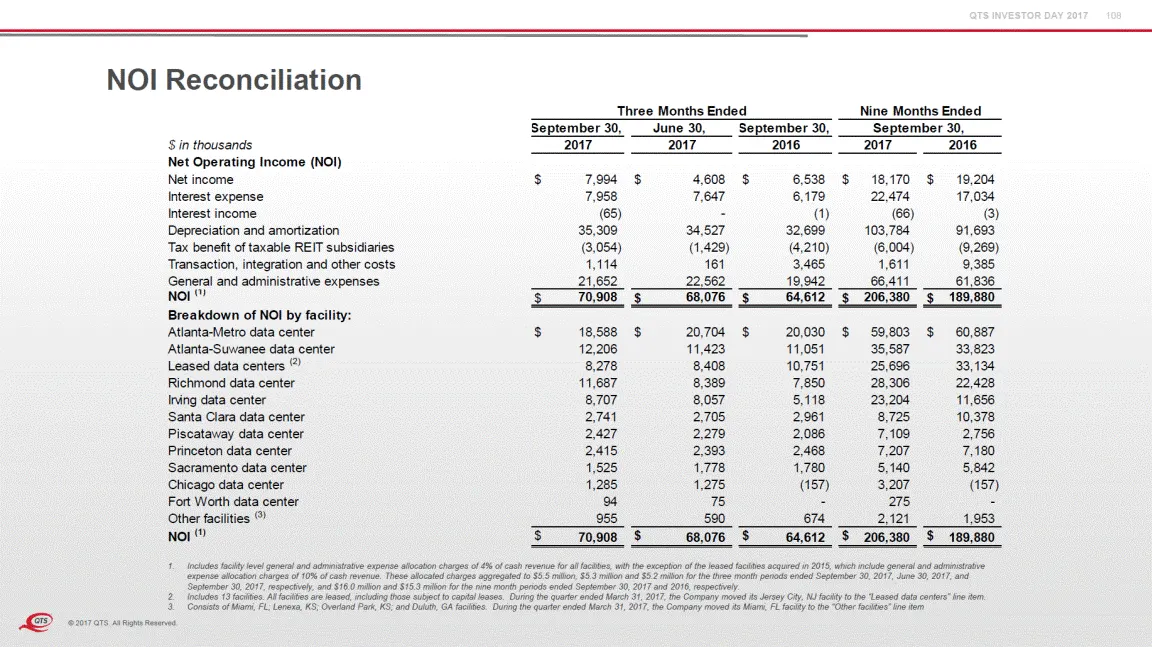
QTS INVESTOR DAY 2017 108 NOI Reconciliation Thre e Months Ende d Nine Months Ende d Se pte mbe r 30, June 30, Se pte mbe r 30, Se pte mbe r 30, $ in thousands Net Operating Income (NOI) Net income Interest expense Interest income Depreciation and amortization Tax benefit of taxable REIT subsidiarie
Slide 107: EBITDA and Adjusted EBITDA Reconciliation
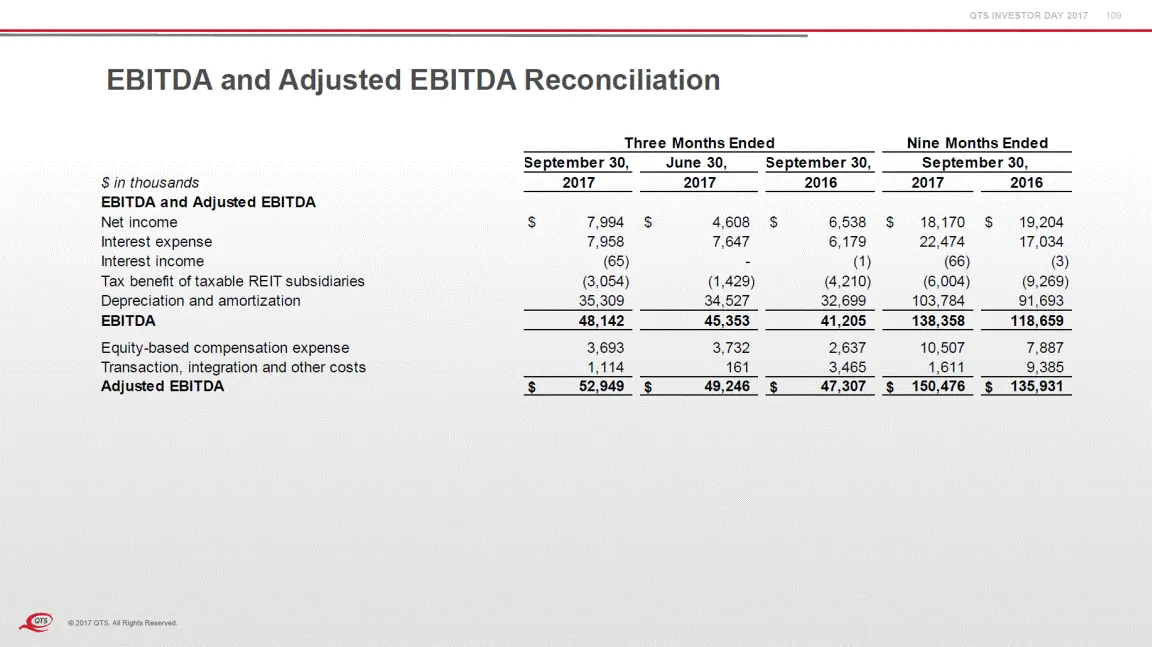
QTS INVESTOR DAY 2017 109 EBITDA and Adjusted EBITDA Reconciliation Three Months Ende d Nine Months Ende d Septembe r 30, June 30, Septembe r 30, Septembe r 30, $ in thousands EBITDA and Adjusted EBITDA Net income Interest expense Interest income Tax benefit of taxable REIT subsidiaries Depreciation
Slide 108: FFO, Operating FFO and Adjusted Operating FFO Reconciliation
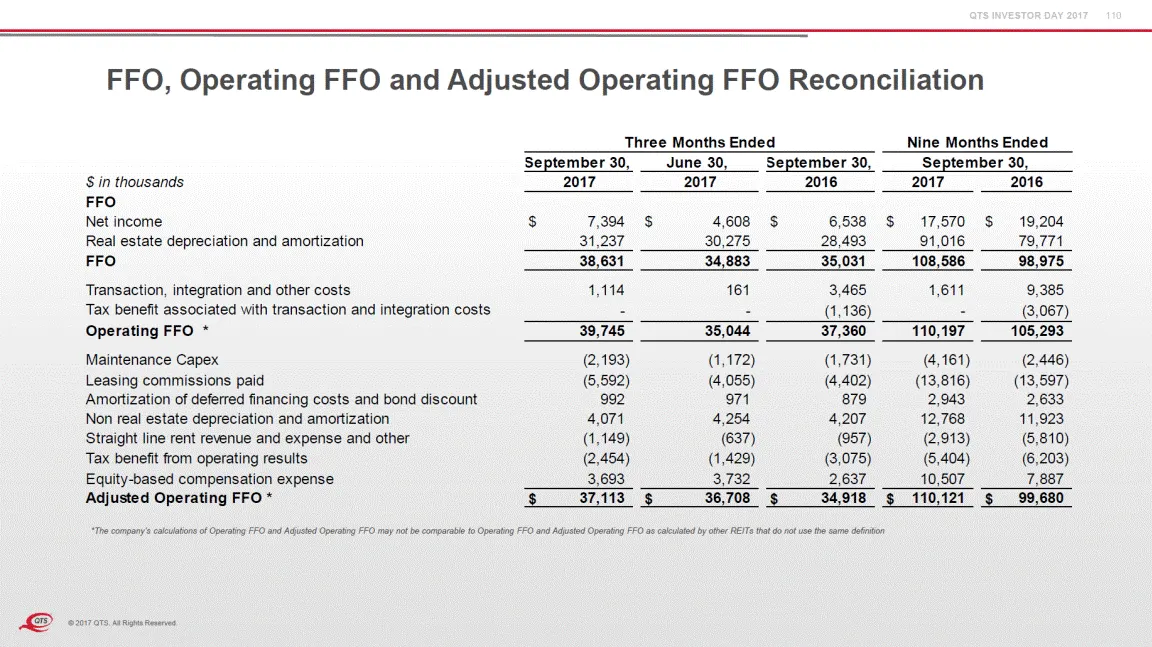
QTS INVESTOR DAY 2017 110 FFO, Operating FFO and Adjusted Operating FFO Reconciliation Thre e Months Ende d Nine Months Ende d Se pte mbe r 30, June 30, Se pte mbe r 30, Se pte mbe r 30, $ in thousands FFO Net income Real estate depreciation and amortization FFO Transaction, integration and other co
Slide 109: MRR Reconciliation
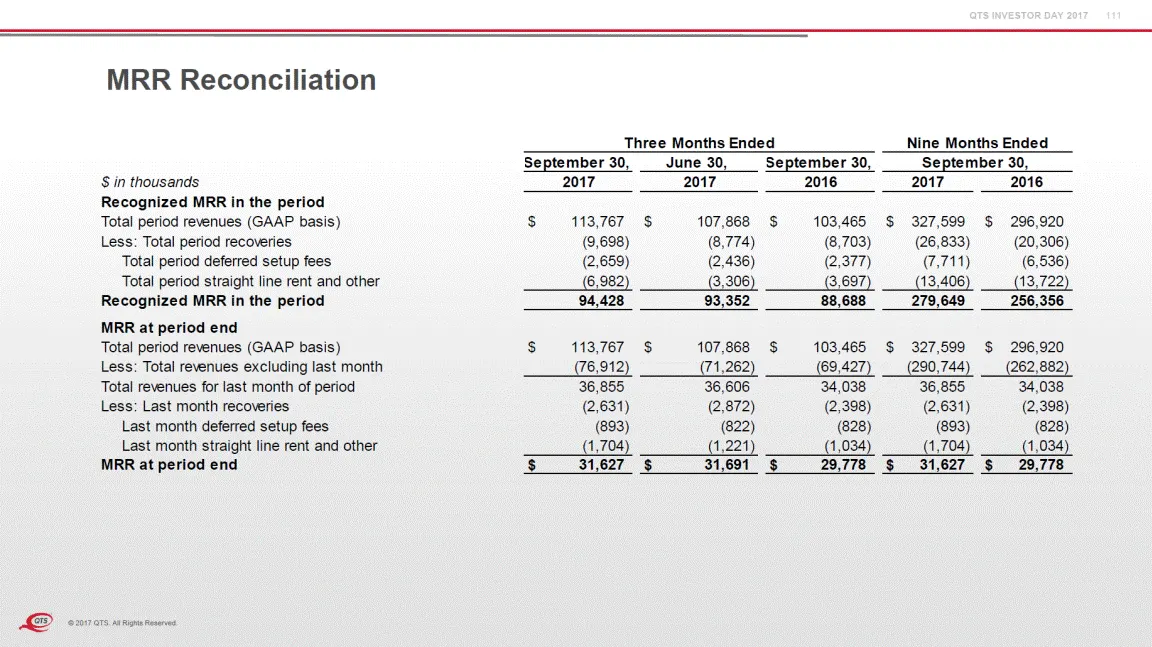
QTS INVESTOR DAY 2017 111 MRR Reconciliation Thre e Months Ende d Nine Months Ende d Se pte mbe r 30, June 30, Se pte mbe r 30, Se pte mbe r 30, $ in thousands Recognized MRR in the period Total period revenues (GAAP basis) Less: Total period recoveries Total period deferred setup fees Total period
Slide 110: MRR Reconciliation
MRR Reconciliation $ in thousands Recognized MRR in the period Total period revenues (GAAP basis) Less: Total period recoveries Total period deferred setup fees Total period straight line rent and other Recognized MRR in the period MRR at period end Total period revenues (GAAP basis) Less: Total rev
Source: SEC EDGAR · 8-K filed Nov 13, 2017