Lorillard — Morgan Stanley Global Consumer & Retail Conference November 2009
22 slides from Lorillard's conference presentation, Nov 19, 2009
Slide 1: Morgan Stanley Global Consumer & Retail Conference November 2009
Morgan Stanley Global Consumer & Retail Conference November 2009
Slide 2: Presenters
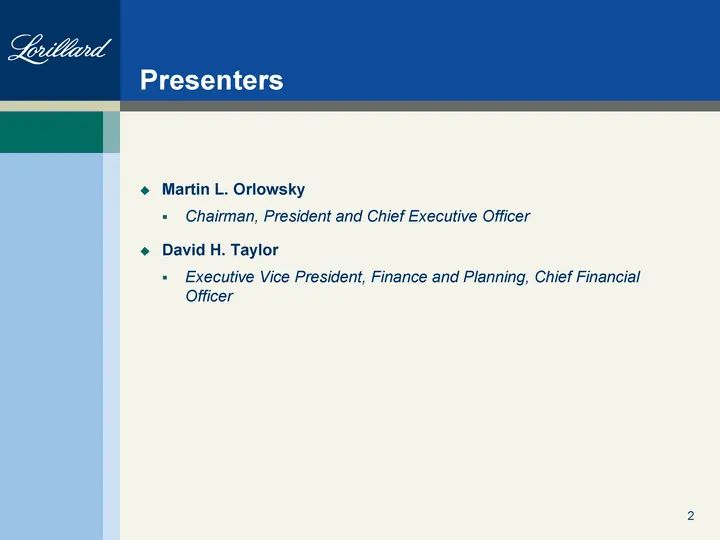
Presenters Martin L. Orlowsky Chairman, President and Chief Executive Officer David H. Taylor Executive Vice President, Finance and Planning, Chief Financial Officer
Slide 3: Safe Harbor Disclaimer
Safe Harbor Disclaimer You are cautioned that certain statements made in this presentation are "forward-looking" statements within the meaning of the Private Securities Litigation Reform Act of 1995. Forward-looking statements include, without limitation, any statement that may project, indicate or
Slide 4: Regulation G Compliance
Regulation G Compliance You are also reminded that during this presentation, certain non-GAAP financial measures, such as EBITDA and Adjusted Operating Income per 1,000 Cigarettes may be discussed. These measures should not be considered an alternative to net income, or any other measure of financia
Slide 5: Lorillard Overview
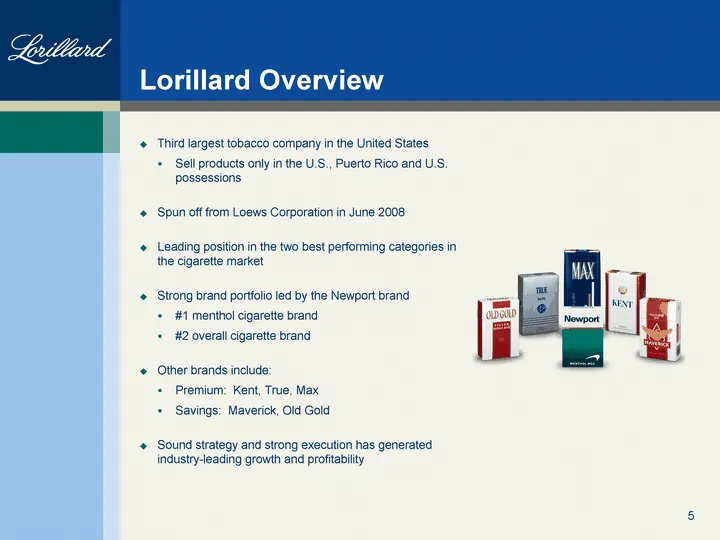
Lorillard Overview Third largest tobacco company in the United States Sell products only in the U.S., Puerto Rico and U.S. possessions Spun off from Loews Corporation in June 2008 Leading position in the two best performing categories in the cigarette market Strong brand portfolio led by the Newport
Slide 6: Trends in the U.S. Cigarette Market
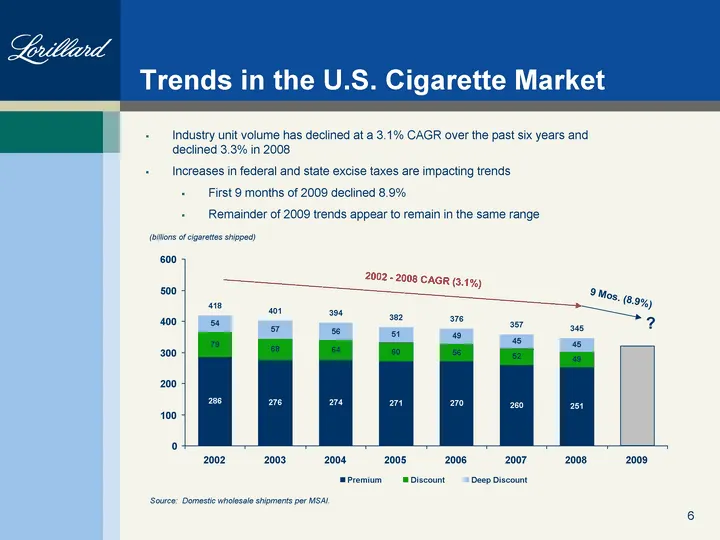
Trends in the U.S. Cigarette Market Industry unit volume has declined at a 3.1% CAGR over the past six years and declined 3.3% in 2008 Increases in federal and state excise taxes are impacting trends First 9 months of 2009 declined 8.9% Remainder of 2009 trends appear to remain in the same range (bi
Slide 7: Strong Brand Portfolio is Led by Newport
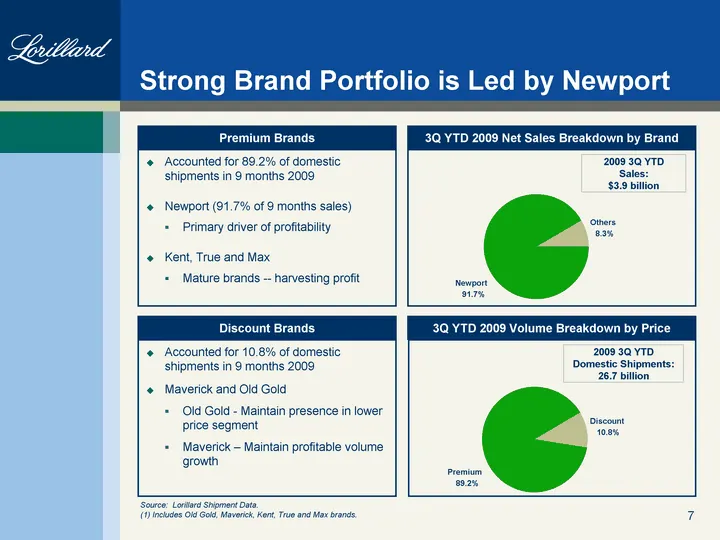
Strong Brand Portfolio is Led by Newport 2009 3Q YTD Sales: $3.9 billion Source: Lorillard Shipment Data. (1) Includes Old Gold, Maverick, Kent, True and Max brands. Accounted for 89.2% of domestic shipments in 9 months 2009 Newport (91.7% of 9 months sales) Primary driver of profitability Kent, Tru
Slide 8: Menthol Continues to Gain Share
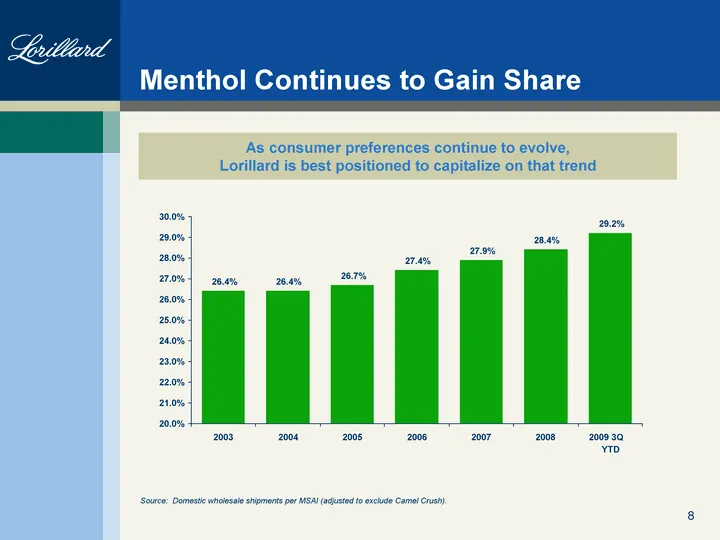
Menthol Continues to Gain Share As consumer preferences continue to evolve, Lorillard is best positioned to capitalize on that trend Source: Domestic wholesale shipments per MSAI (adjusted to exclude Camel Crush). 26.4% 26.4% 26.7% 27.4% 27.9% 28.4% 29.2% 20.0% 21.0% 22.0% 23.0% 24.0% 25.0% 26.0% 27
Slide 9: Recent Menthol Share Growth
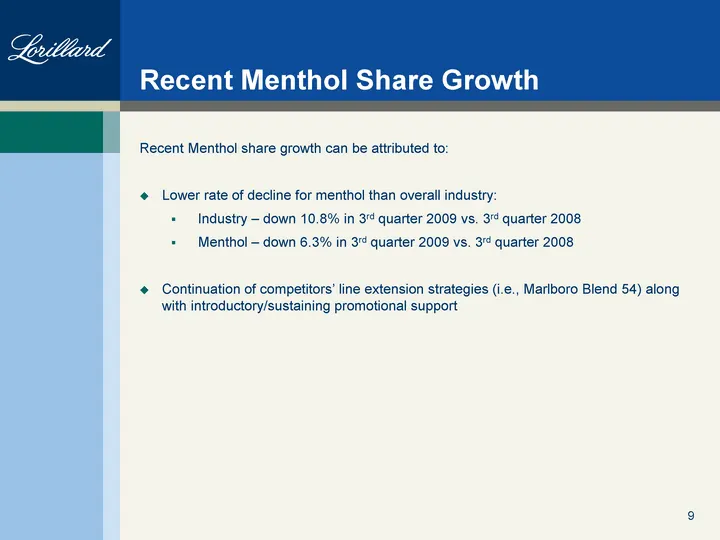
Recent Menthol Share Growth Recent Menthol share growth can be attributed to: Lower rate of decline for menthol than overall industry: Industry - down 10.8% in 3rd quarter 2009 vs. 3rd quarter 2008 Menthol - down 6.3% in 3rd quarter 2009 vs. 3rd quarter 2008 Continuation of competitors' line extensi
Slide 10: Newport Leads the Menthol Segment
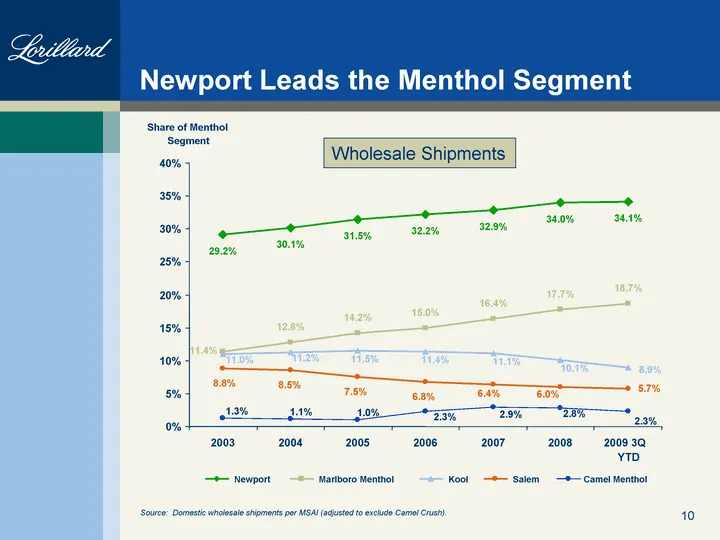
Newport Leads the Menthol Segment Source: Domestic wholesale shipments per MSAI (adjusted to exclude Camel Crush). Wholesale Shipments 29.2% 30.1% 31.5% 32.2% 32.9% 34.0% 34.1% 12.8% 14.2% 15.0% 16.4% 17.7% 18.7% 11.4% 11.5% 11.4% 11.1% 10.1% 8.9% 11.0% 11.2% 5.7% 6.0% 6.4% 6.8% 7.5% 8.5% 8.8% 2.3%
Slide 11: Premium Segment Share of Market by Manufacturer
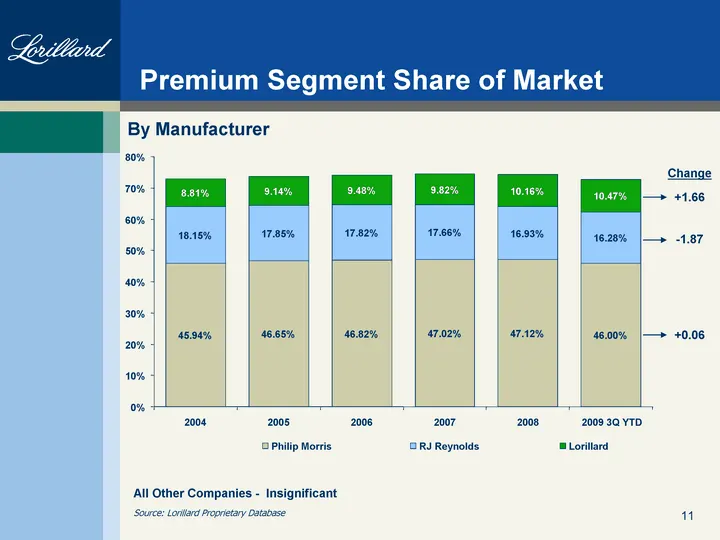
Source: Lorillard Proprietary Database +1.66 - -1.87 +0.06 Premium Segment Share of Market All Other Companies - Insignificant By Manufacturer Change 45.94% 46.65% 46.82% 47.02% 47.12% 46.00% 18.15% 17.85% 17.82% 17.66% 16.93% 16.28% 8.81% 9.14% 9.48% 9.82% 10.16% 10.47% 0% 10% 20% 30% 40% 50% 60% 7
Slide 12: Top Premium Brands Share of Market
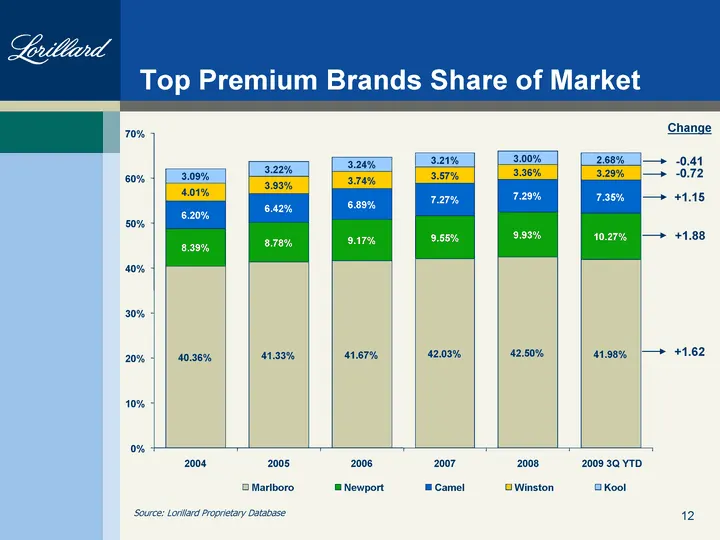
Source: Lorillard Proprietary Database - -0.41 - -0.72 +1.15 Top Premium Brands Share of Market Change +1.88 +1.62 40.36% 41.33% 41.67% 42.03% 42.50% 41.98% 8.39% 8.78% 9.17% 9.55% 9.93% 10.27% 6.20% 6.42% 6.89% 7.27% 7.29% 7.35% 4.01% 3.93% 3.74% 3.57% 3.36% 3.29% 3.09% 3.22% 3.24% 3.21% 3.00% 2.68
Slide 13: Maverick Growth
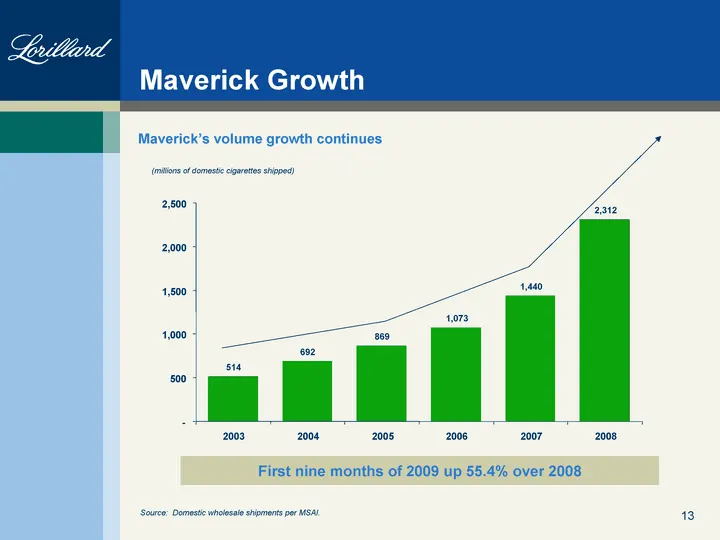
Maverick Growth Source: Domestic wholesale shipments per MSAI. Maverick's volume growth continues (millions of domestic cigarettes shipped) First nine months of 2009 up 55.4% over 2008 514 692 869 1,073 1,440 2,312 - - 500 1,000 1,500 2,000 2,500 2003 2004 2005 2006 2007 2008
Slide 14: Current Environment
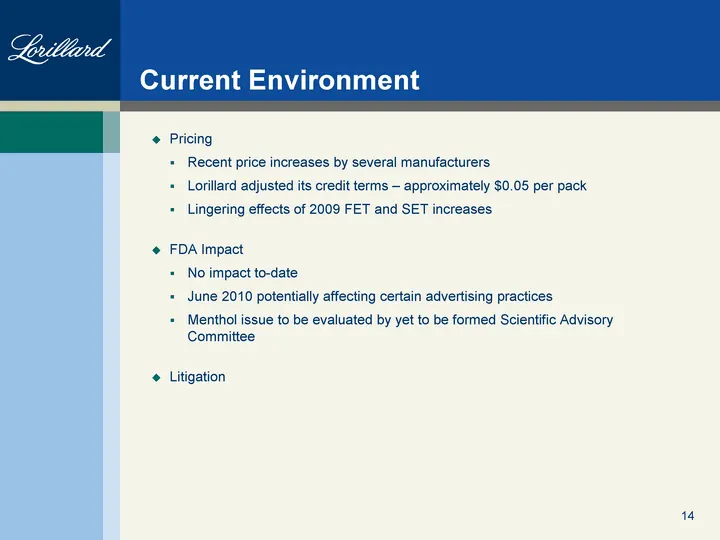
Current Environment Pricing Recent price increases by several manufacturers Lorillard adjusted its credit terms - approximately $0.05 per pack Lingering effects of 2009 FET and SET increases FDA Impact No impact to-date June 2010 potentially affecting certain advertising practices Menthol issue to b
Slide 15: Operating Strategy
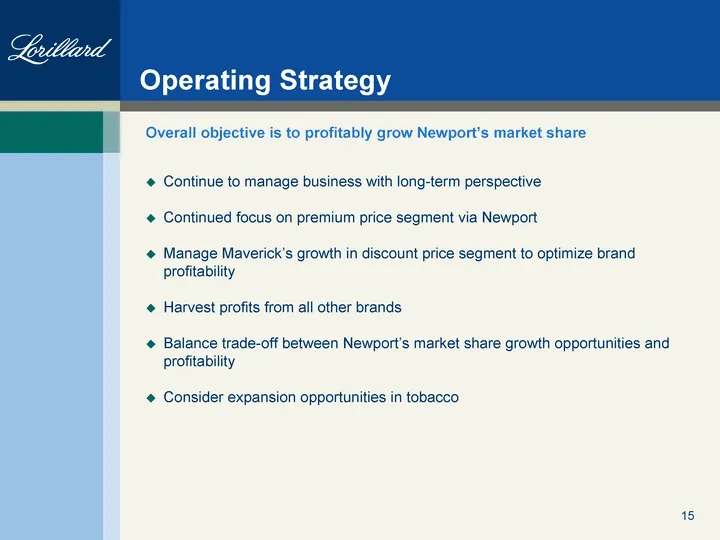
Operating Strategy Continue to manage business with long-term perspective Continued focus on premium price segment via Newport Manage Maverick's growth in discount price segment to optimize brand profitability Harvest profits from all other brands Balance trade-off between Newport's market share gro
Slide 16: Financial Results
Leolllind Financial Results
Slide 17: Recent Results
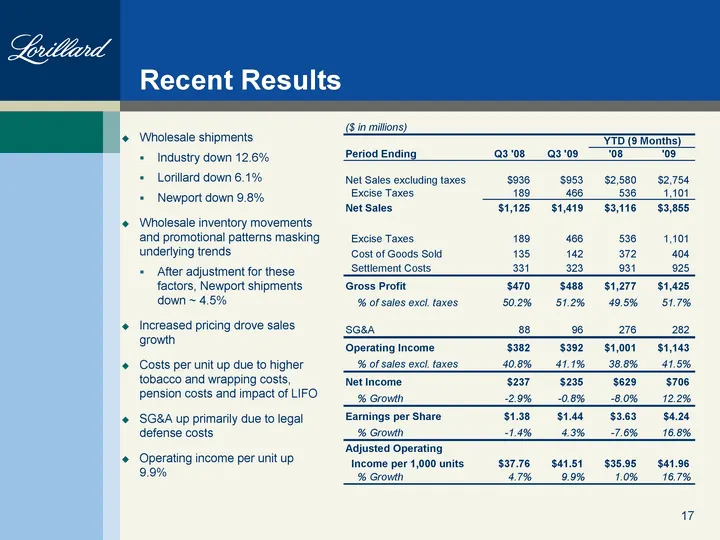
Recent Results Wholesale shipments Industry down 12.6% Lorillard down 6.1% Newport down 9.8% Wholesale inventory movements and promotional patterns masking underlying trends After adjustment for these factors, Newport shipments down ~ 4.5% Increased pricing drove sales growth Costs per unit up due t
Slide 18: Most Profitable Operating Model
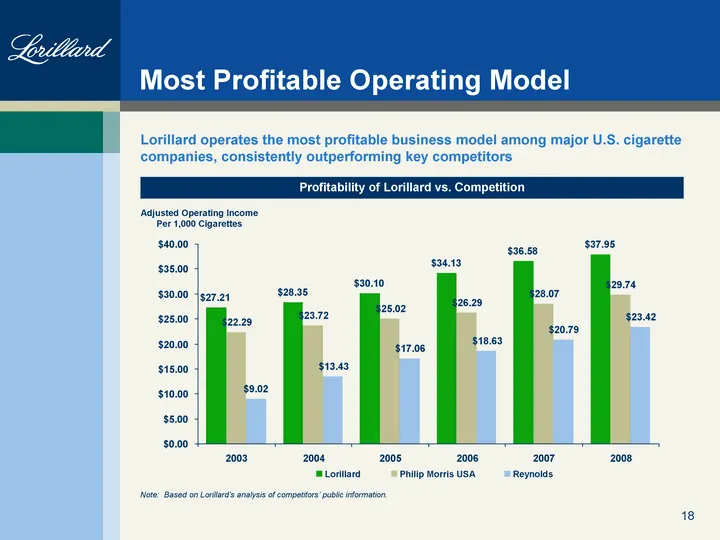
Most Profitable Operating Model Profitability of Lorillard vs. Competition Lorillard operates the most profitable business model among major U.S. cigarette companies, consistently outperforming key competitors Note: Based on Lorillard's analysis of competitors' public information. Adjusted Operating
Slide 19: Financial Policy Highlights
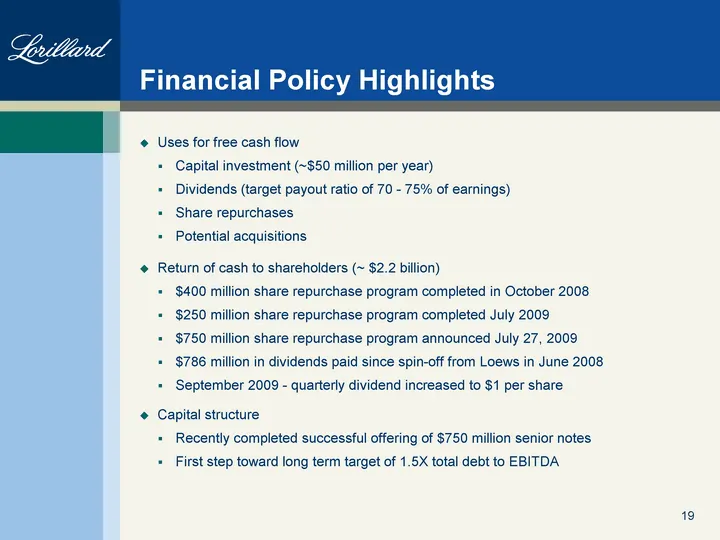
Financial Policy Highlights Uses for free cash flow Capital investment (~$50 million per year) Dividends (target payout ratio of 70 - 75% of earnings) Share repurchases Potential acquisitions Return of cash to shareholders (~ $2.2 billion) $400 million share repurchase program completed in October 2
Slide 20: Investment Highlights
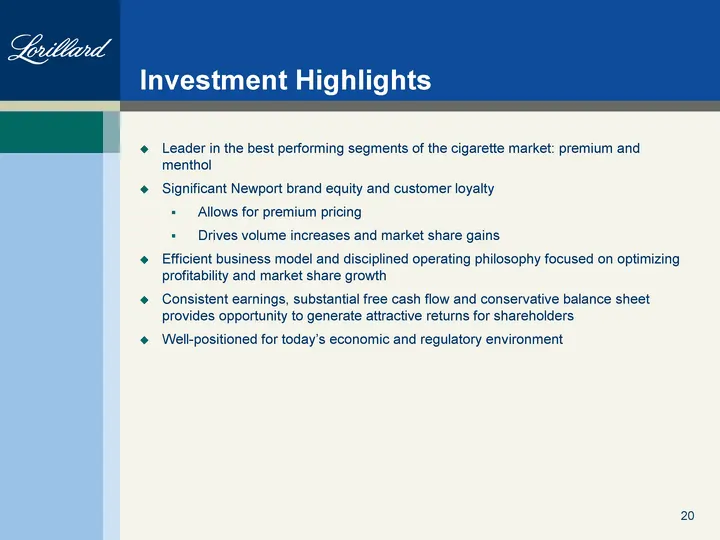
Investment Highlights Leader in the best performing segments of the cigarette market: premium and menthol Significant Newport brand equity and customer loyalty Allows for premium pricing Drives volume increases and market share gains Efficient business model and disciplined operating philosophy focu
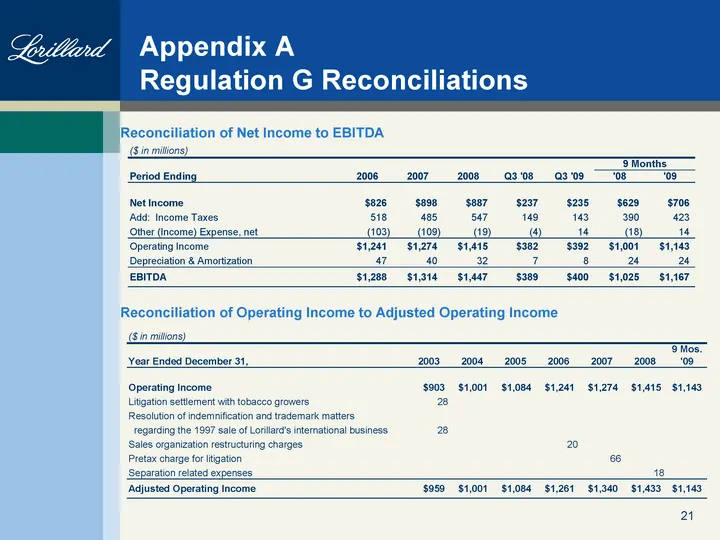
Slide 21: Appendix A Regulation G Reconciliations
Appendix A Regulation G Reconciliations Reconciliation of Net Income to EBITDA Reconciliation of Operating Income to Adjusted Operating Income
Slide 22: Questions
Leotlliand Questions
Source: SEC EDGAR · 8-K filed Nov 19, 2009
More decks from Lorillard Inc
 Merger or Acquisition (February 2015)62 slides · Feb 18, 2015
 Merger or Acquisition (November 2014)40 slides · Nov 17, 2014
 Merger or Acquisition (September 2014)25 slides · Sep 4, 2014
 Merger or Acquisition (July 2014)13 slides · Jul 15, 2014
 Merger or Acquisition (July 2014)42 slides · Jul 15, 2014
 Merger or Acquisition (July 2014)30 slides · Jul 15, 2014