SKF AB Class A · OMXSTO:SKF_A
SKF AB Class A — Q3 2000 Earnings Presentation
12 slides from SKF AB Class A's earnings presentation, October 2000
Slide 1: The SKF Group Nine-months report 2000
The SKF Group Nine-months report 2000
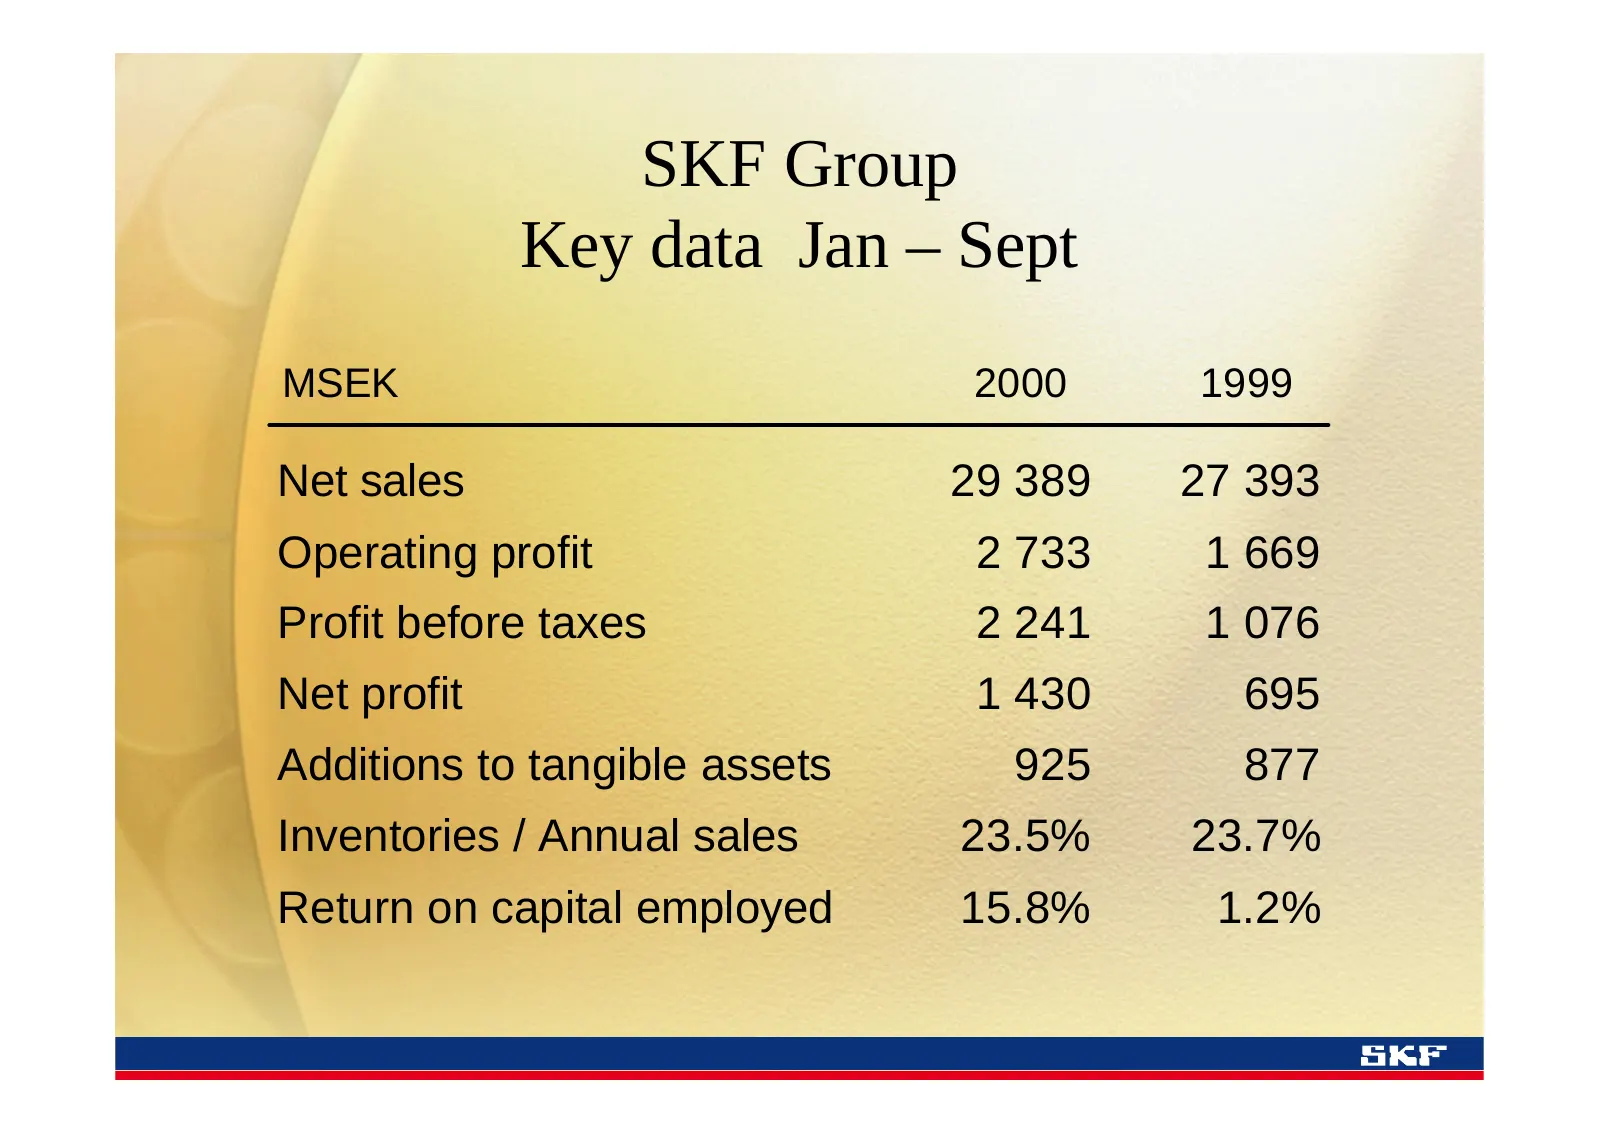
Slide 2: Key data Jan – Sept
SKF Group Key data Jan – Sept MSEK 2000 1999 Net sales 29 389 27 393 Operating profit 2 733 1 669 Profit before taxes 2 241 1 076 Net profit 1 430 695 Additions to tangible assets 925 877 Inventories / Annual sales 23.5% 23.7% Return on capital employed 15.8% 1.2%
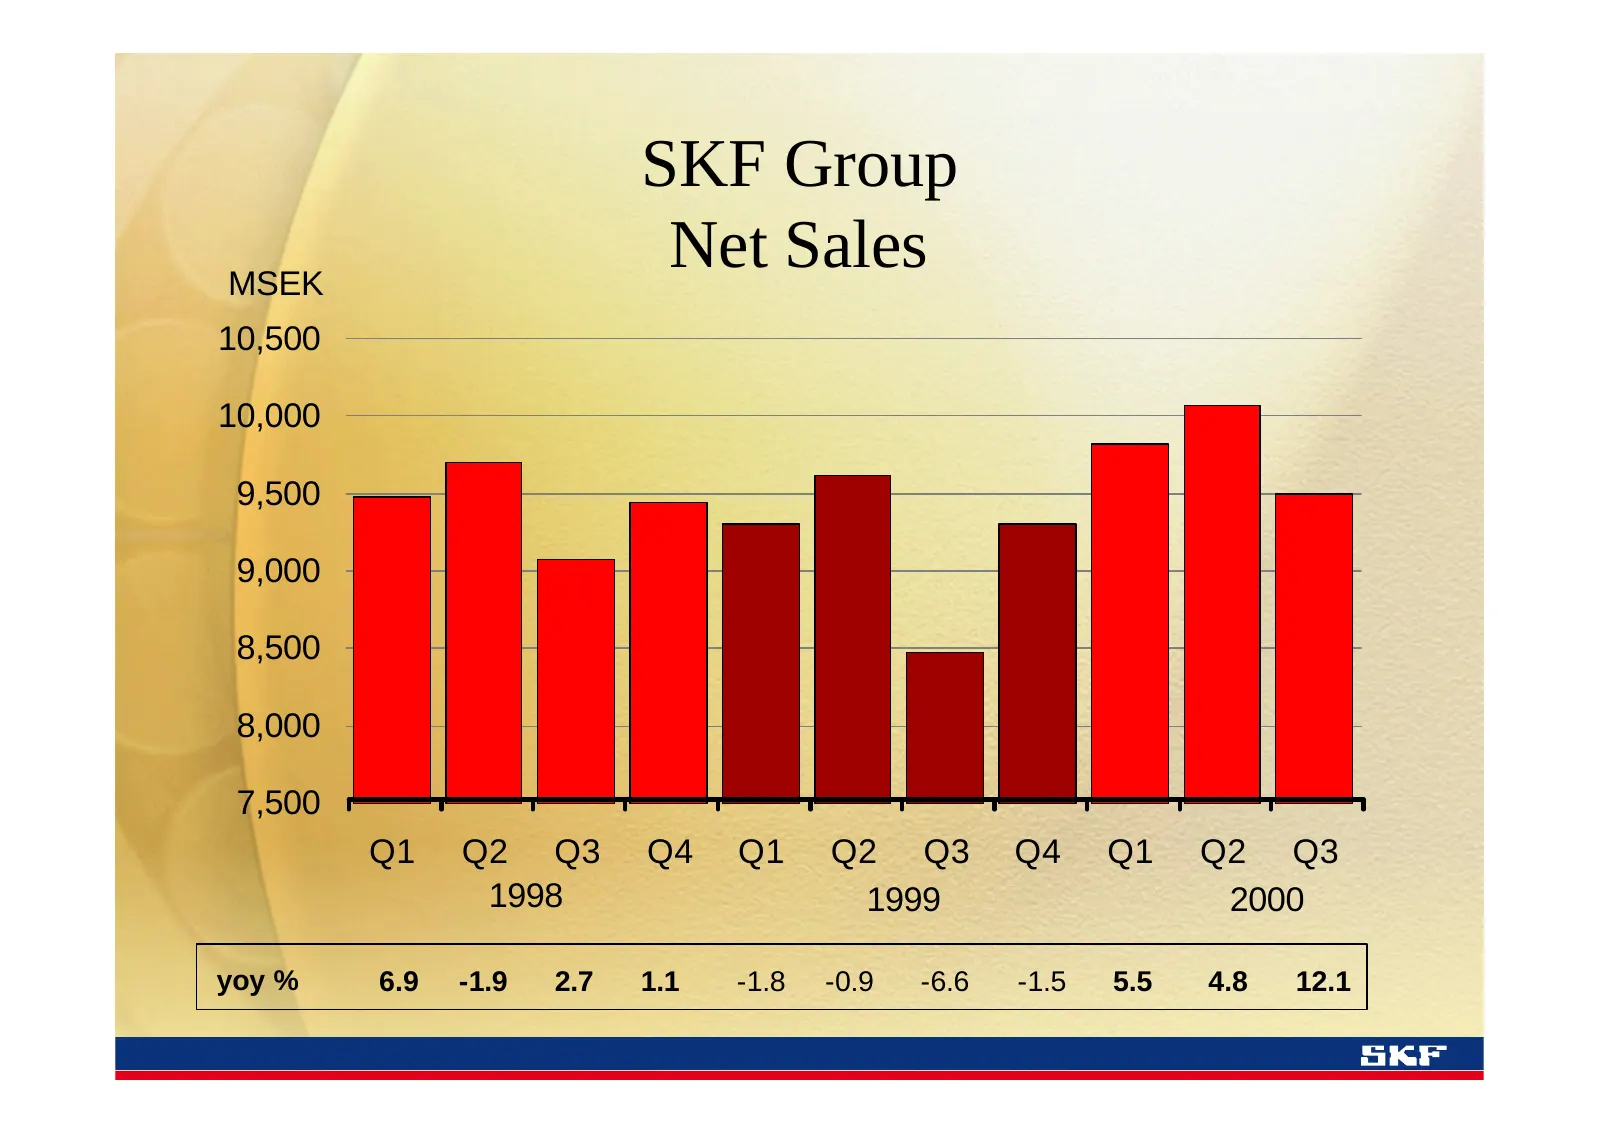
Slide 3: Net Sales
SKF Group MSEK Net Sales 10,500 10,000 9,500 9,000 8,500 8,000 7,500 Q1 Q2 Q3 Q4 Q1 Q2 Q3 Q4 Q1 Q2 Q3 1998 1999 2000 yoy % 6.9 -1.9 2.7 1.1 -1.8 -0.9 -6.6 -1.5 5.5 4.8 12.1
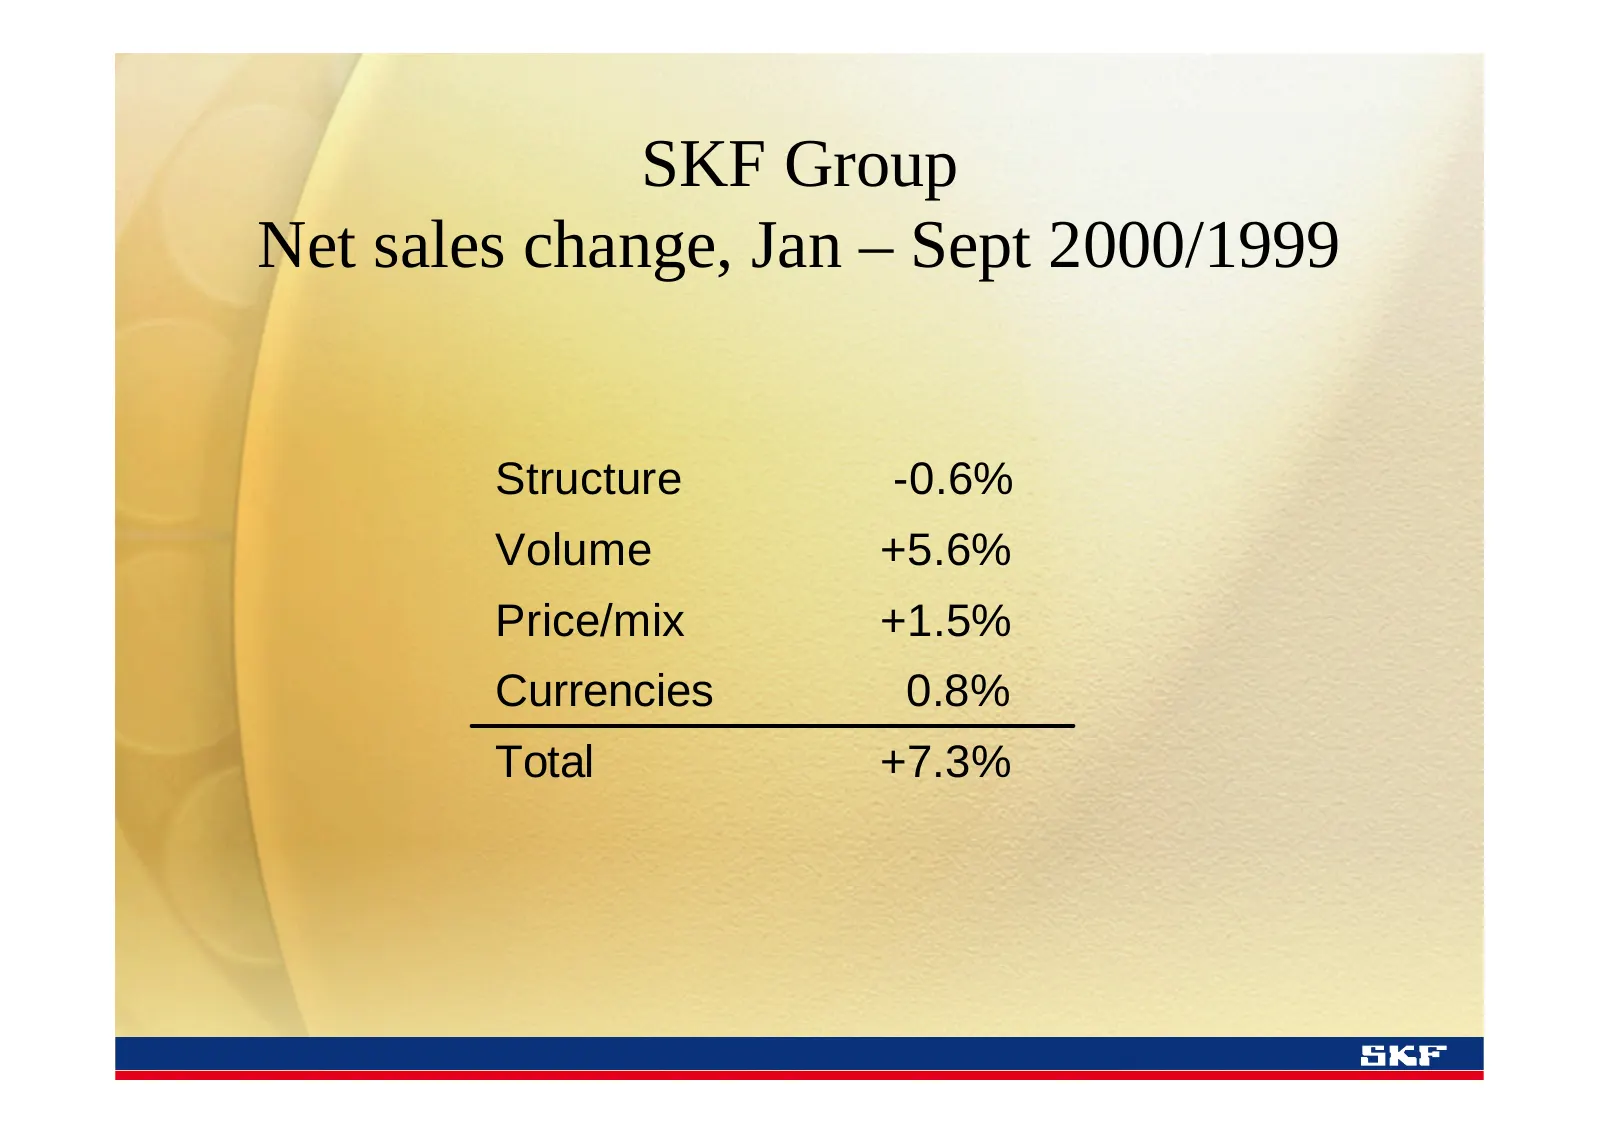
Slide 4: Net sales change, Jan – Sept 2000/1999
SKF Group Net sales change, Jan – Sept 2000/1999 Structure -0.6% Volume +5.6% Price/mix +1.5% Currencies 0.8% Total +7.3%
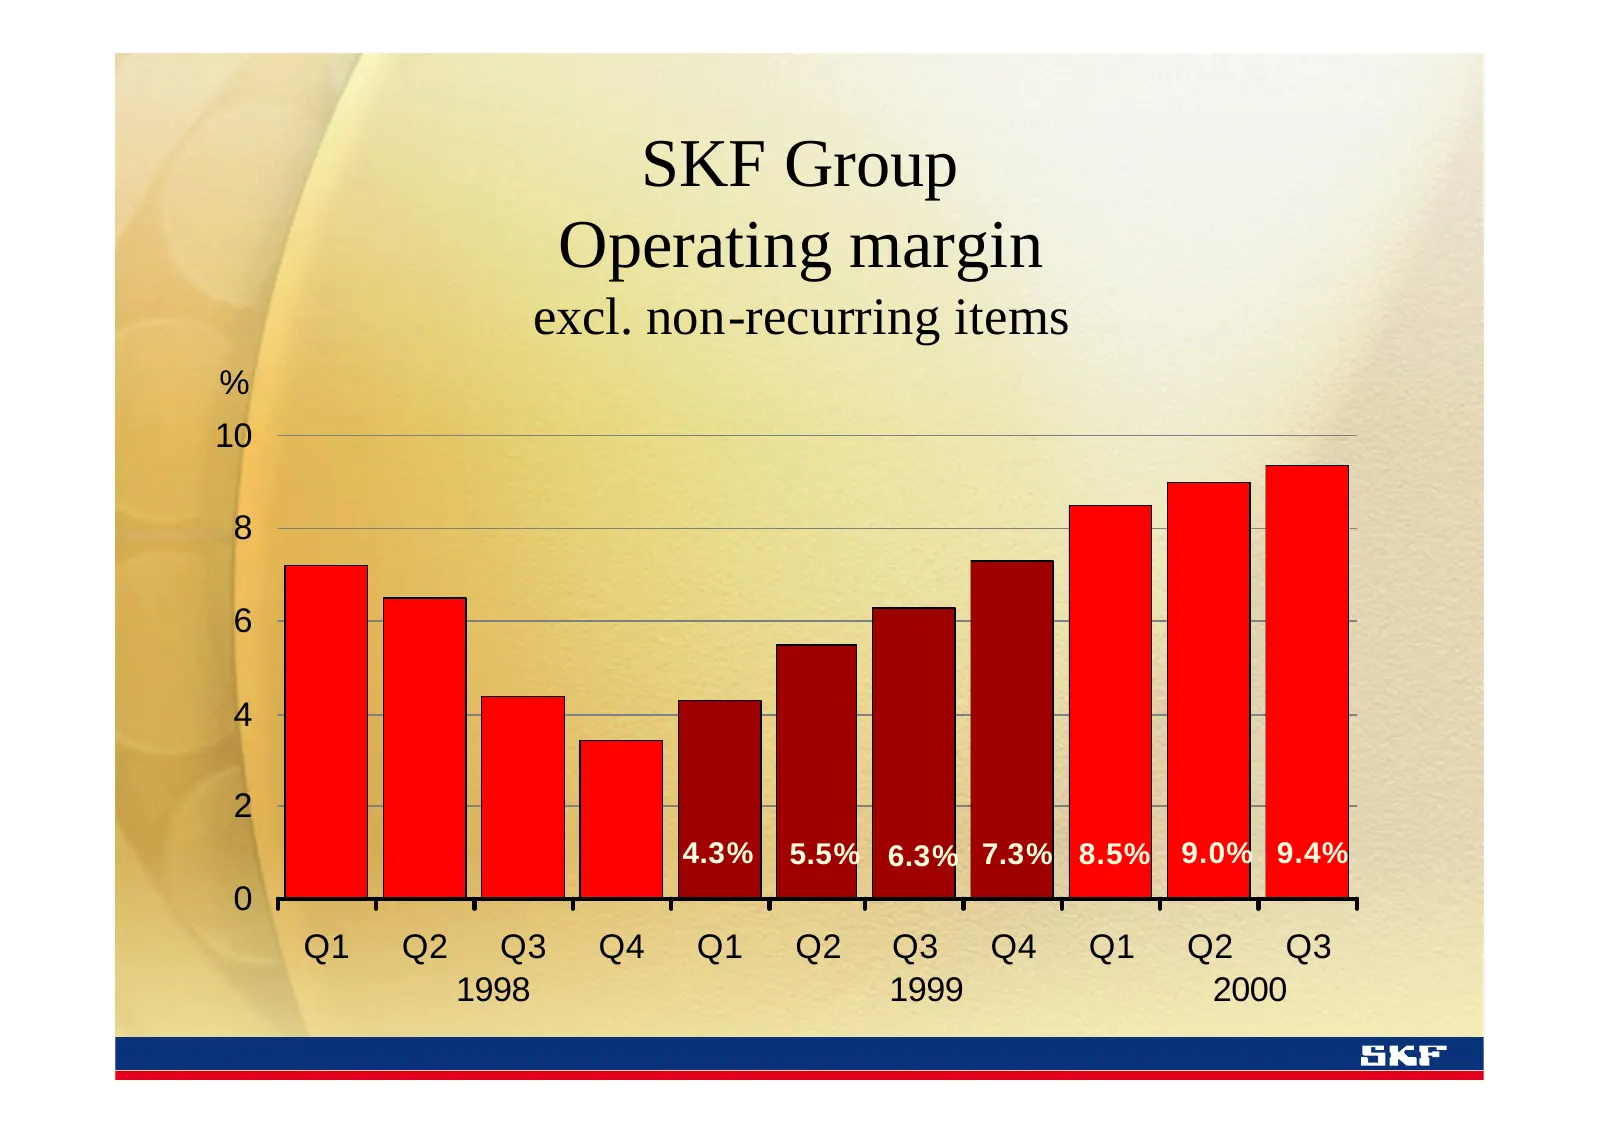
Slide 5: Operating margin
SKF Group Operating margin excl. non-recurring items % 10 8 6 4 2 4.3% 5.5% 6.3% 7.3% 8.5% 9.0% 9.4% 0 Q1 Q2 Q3 Q4 Q1 Q2 Q3 Q4 Q1 Q2 Q3 1998 1999 2000
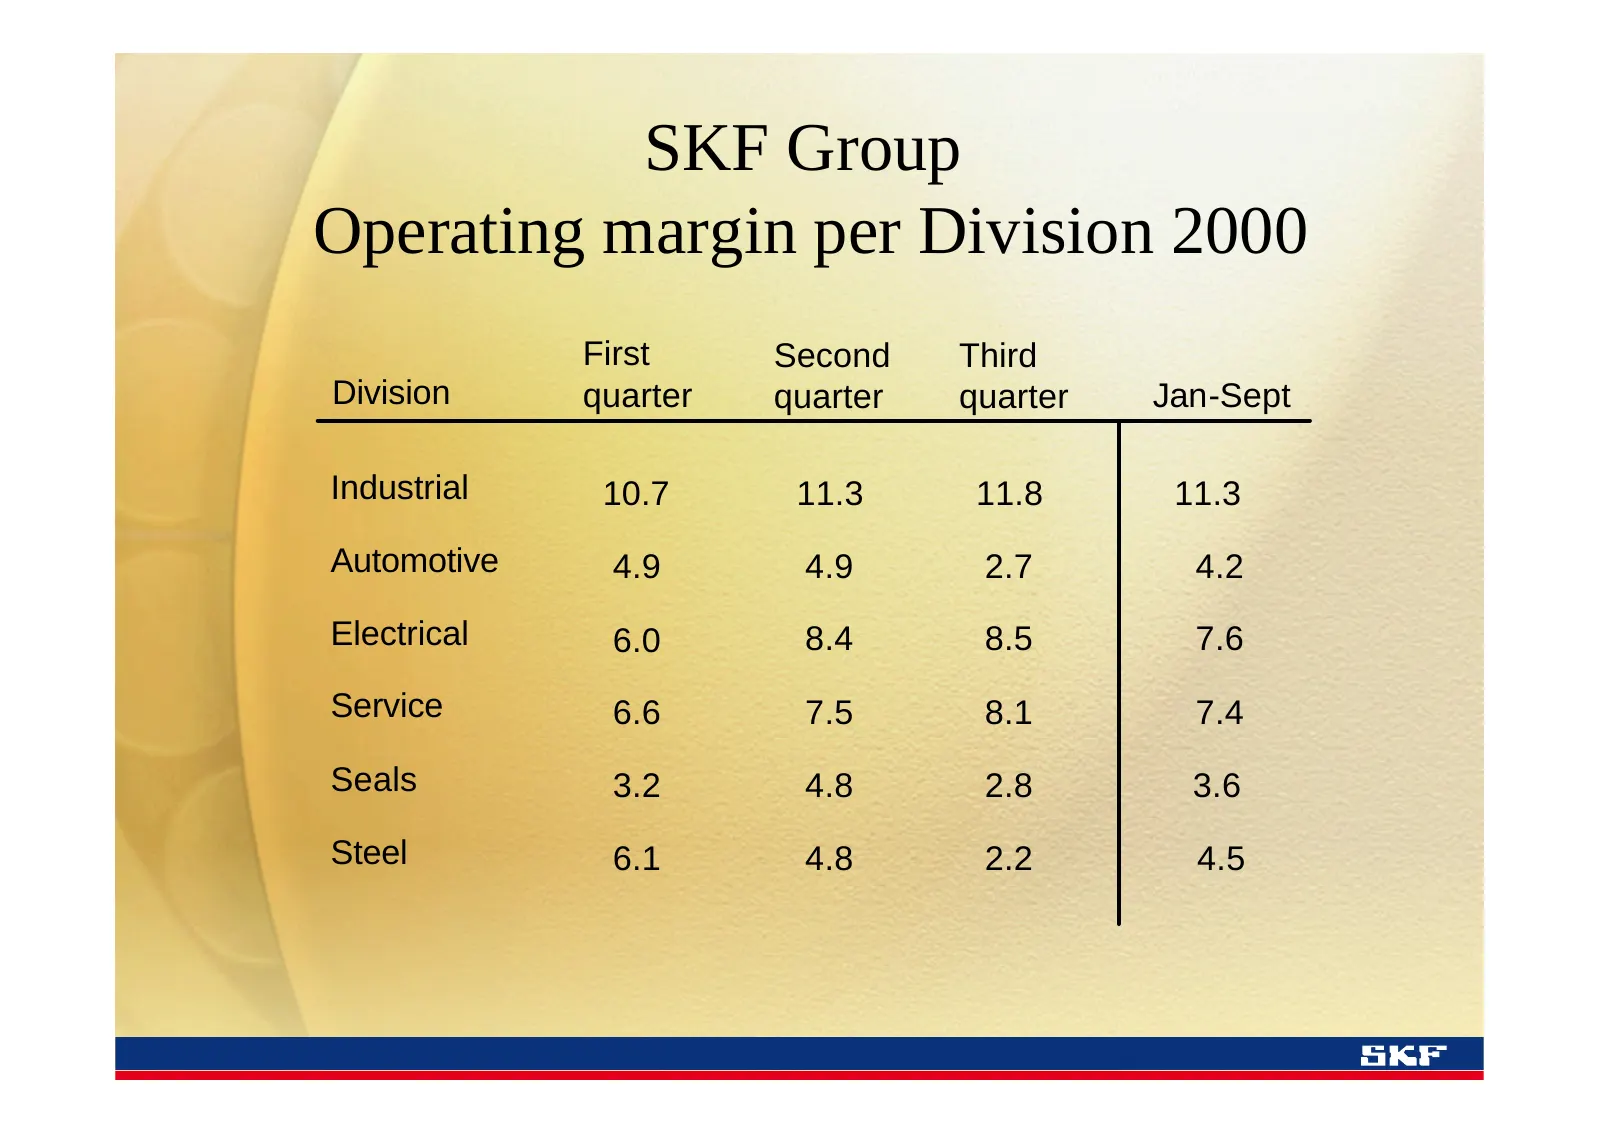
Slide 6: Operating margin per Division 2000
SKF Group Operating margin per Division 2000 First Second Third Division quarter quarter quarter Jan-Sept Industrial 10.7 11.3 11.8 11.3 Automotive 4.9 4.9 2.7 4.2 Electrical 6.0 8.4 8.5 7.6 Service 6.6 7.5 8.1 7.4 Seals 3.2 4.8 2.8 3.6 Steel 6.1 4.8 2.2 4.5
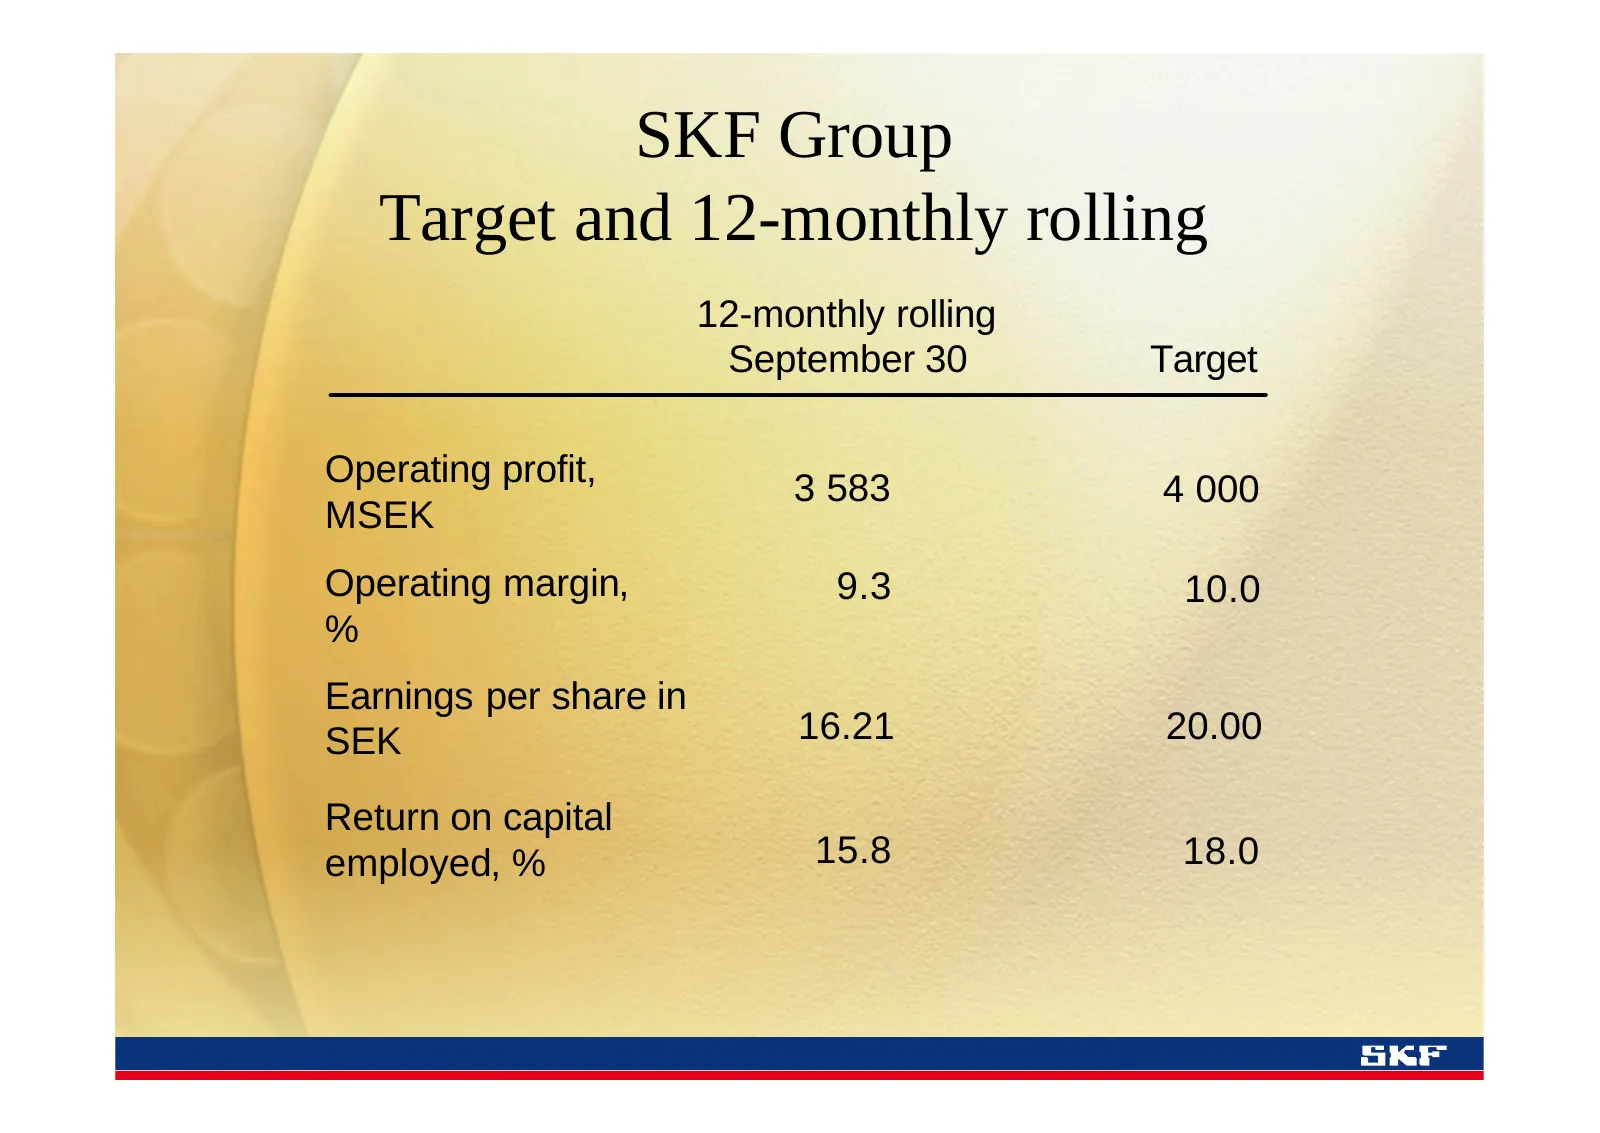
Slide 7: Target and 12-monthly rolling
SKF Group Target and 12-monthly rolling 12-monthly rolling September 30 Target Operating profit, 3 583 4 000 MSEK Operating margin, 9.3 10.0 % Earnings per share in SEK 16.21 20.00 Return on capital employed, % 15.8 18.0
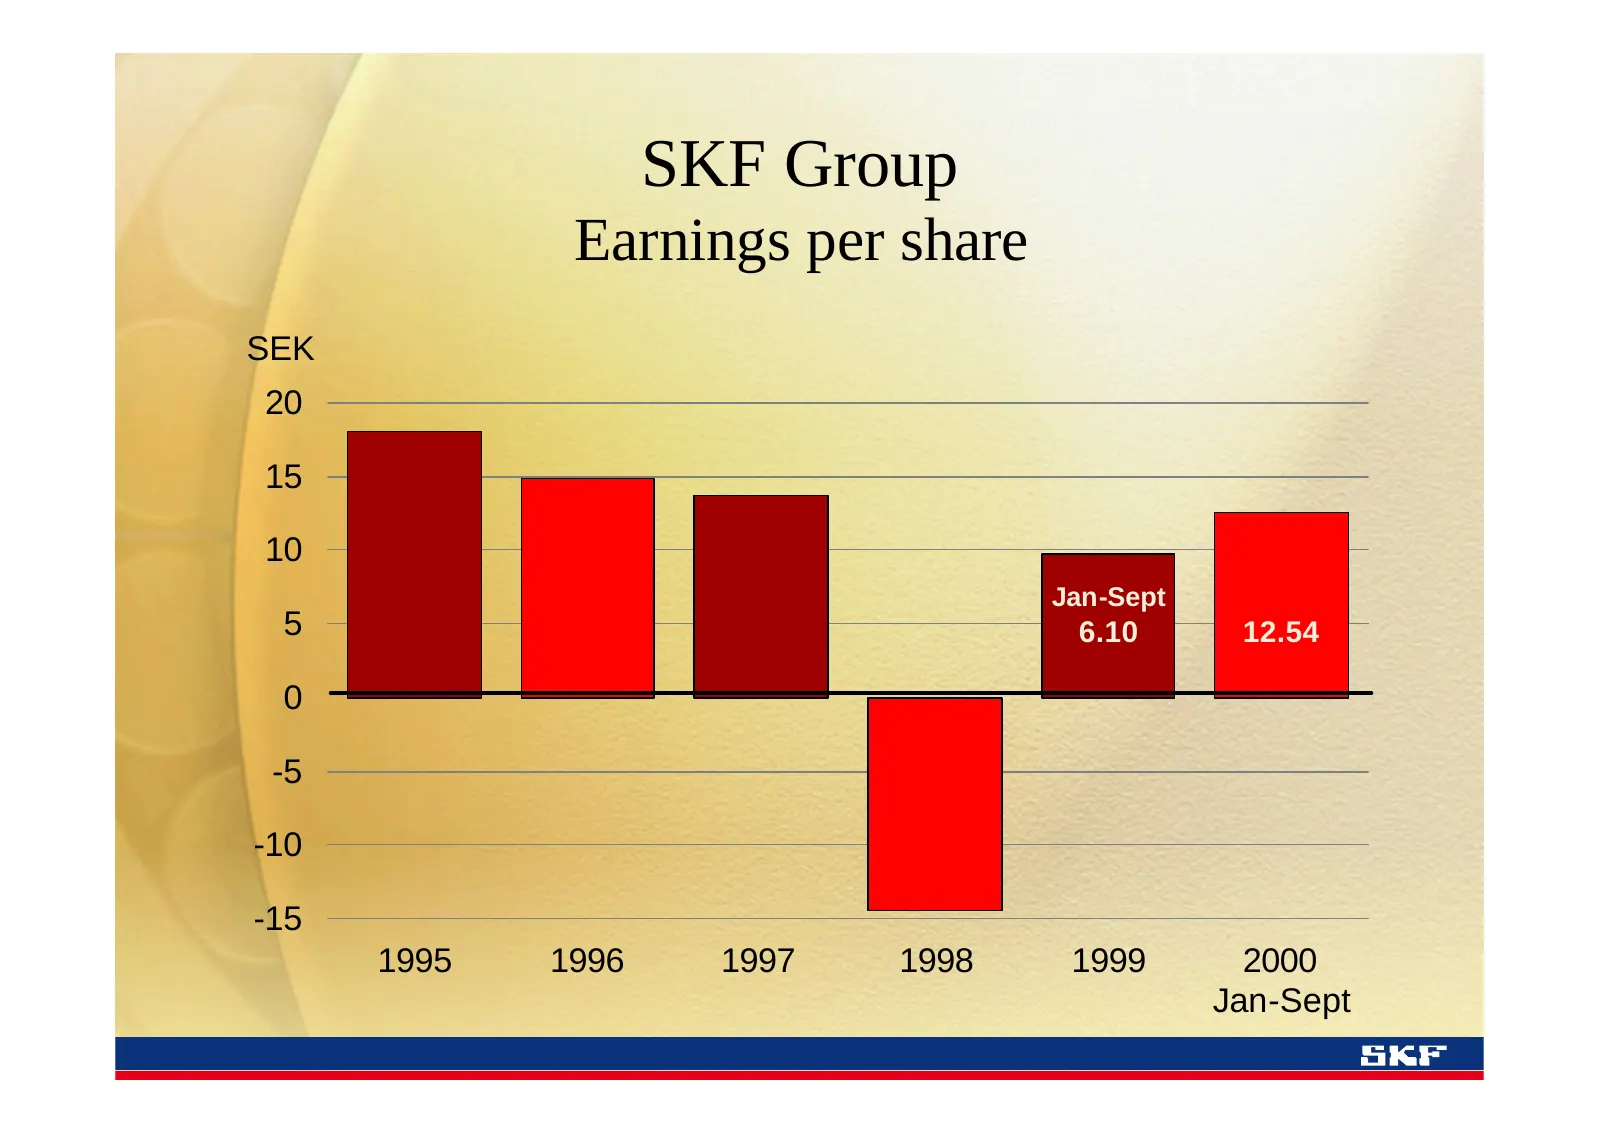
Slide 8: Earnings per share
SKF Group Earnings per share SEK 20 15 10 Jan-Sept 5 6.10 12.54 0 -5 -10 -15 1995 1996 1997 1998 1999 2000 Jan-Sept
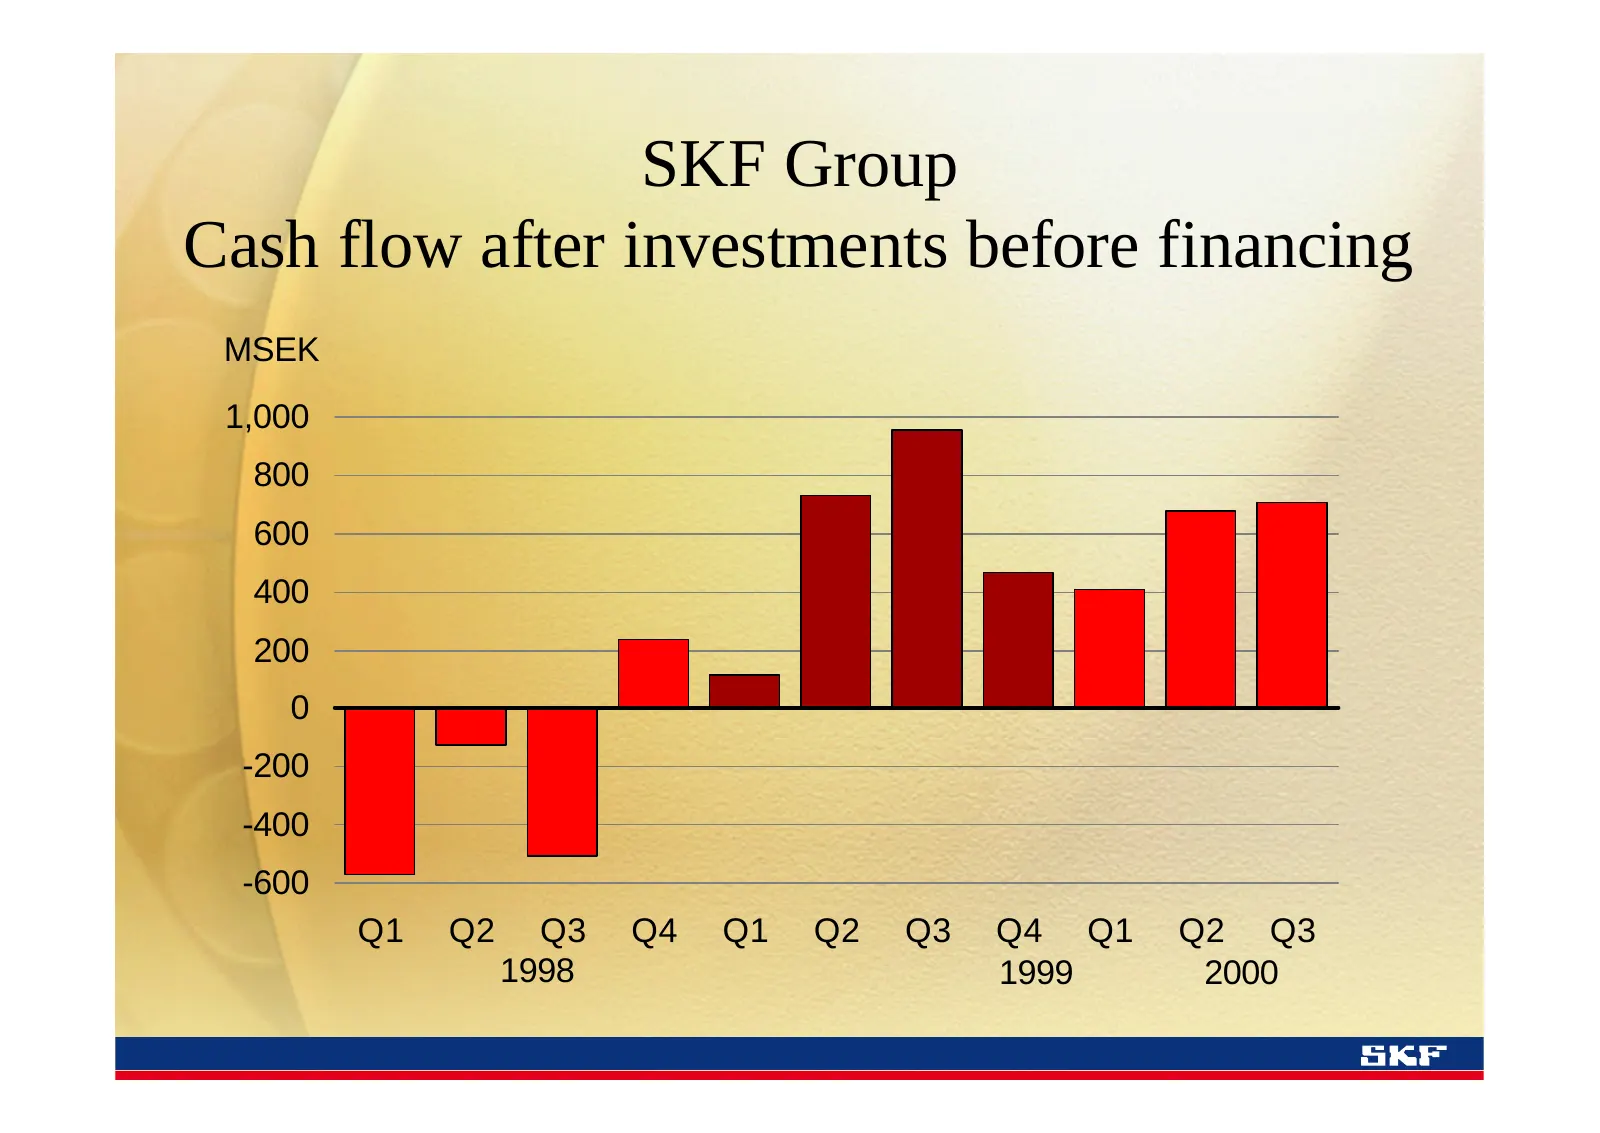
Slide 9: Cash flow after investments before financing
SKF Group Cash flow after investments before financing MSEK 1,000 800 600 400 200 0 -200 -400 -600 Q1 Q2 Q3 Q4 Q1 Q2 Q3 Q4 Q1 Q2 Q3 1998 1999 2000
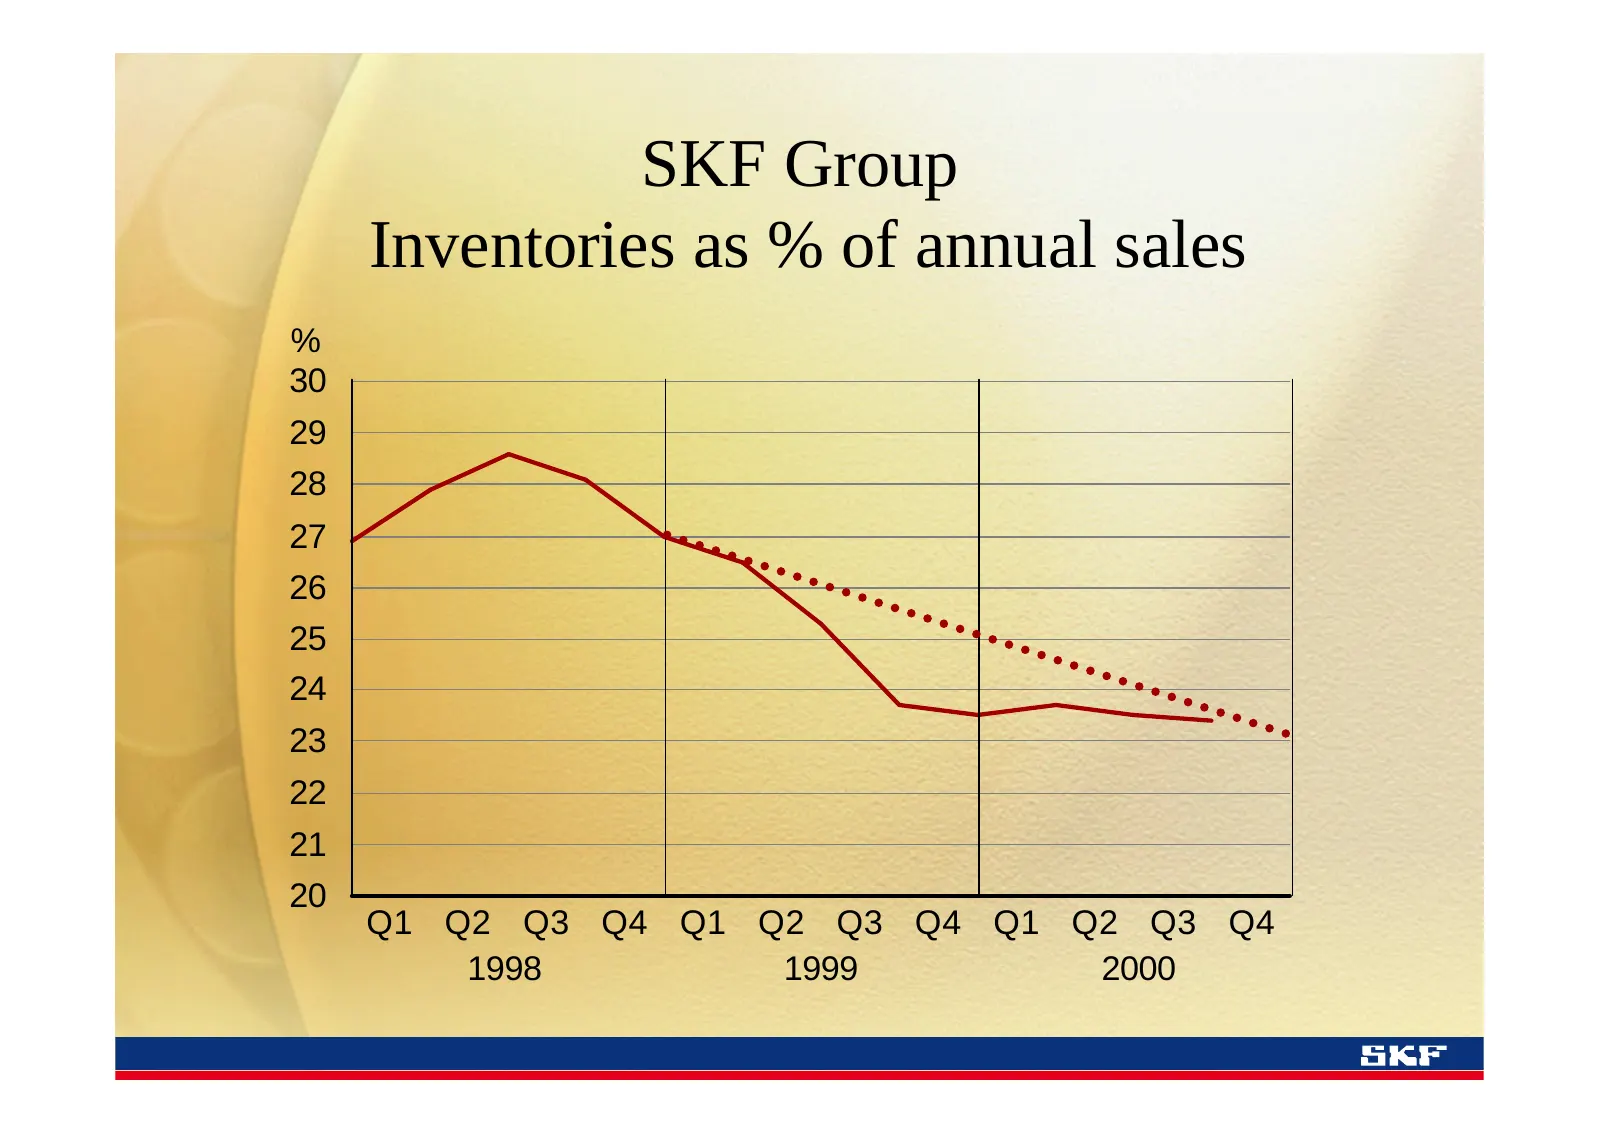
Slide 10: Inventories as % of annual sales
SKF Group Inventories as % of annual sales % 30 29 28 27 26 25 24 23 22 21 20 Q1 Q2 Q3 Q4 Q1 Q2 Q3 Q4 Q1 Q2 Q3 Q4 1998 1999 2000
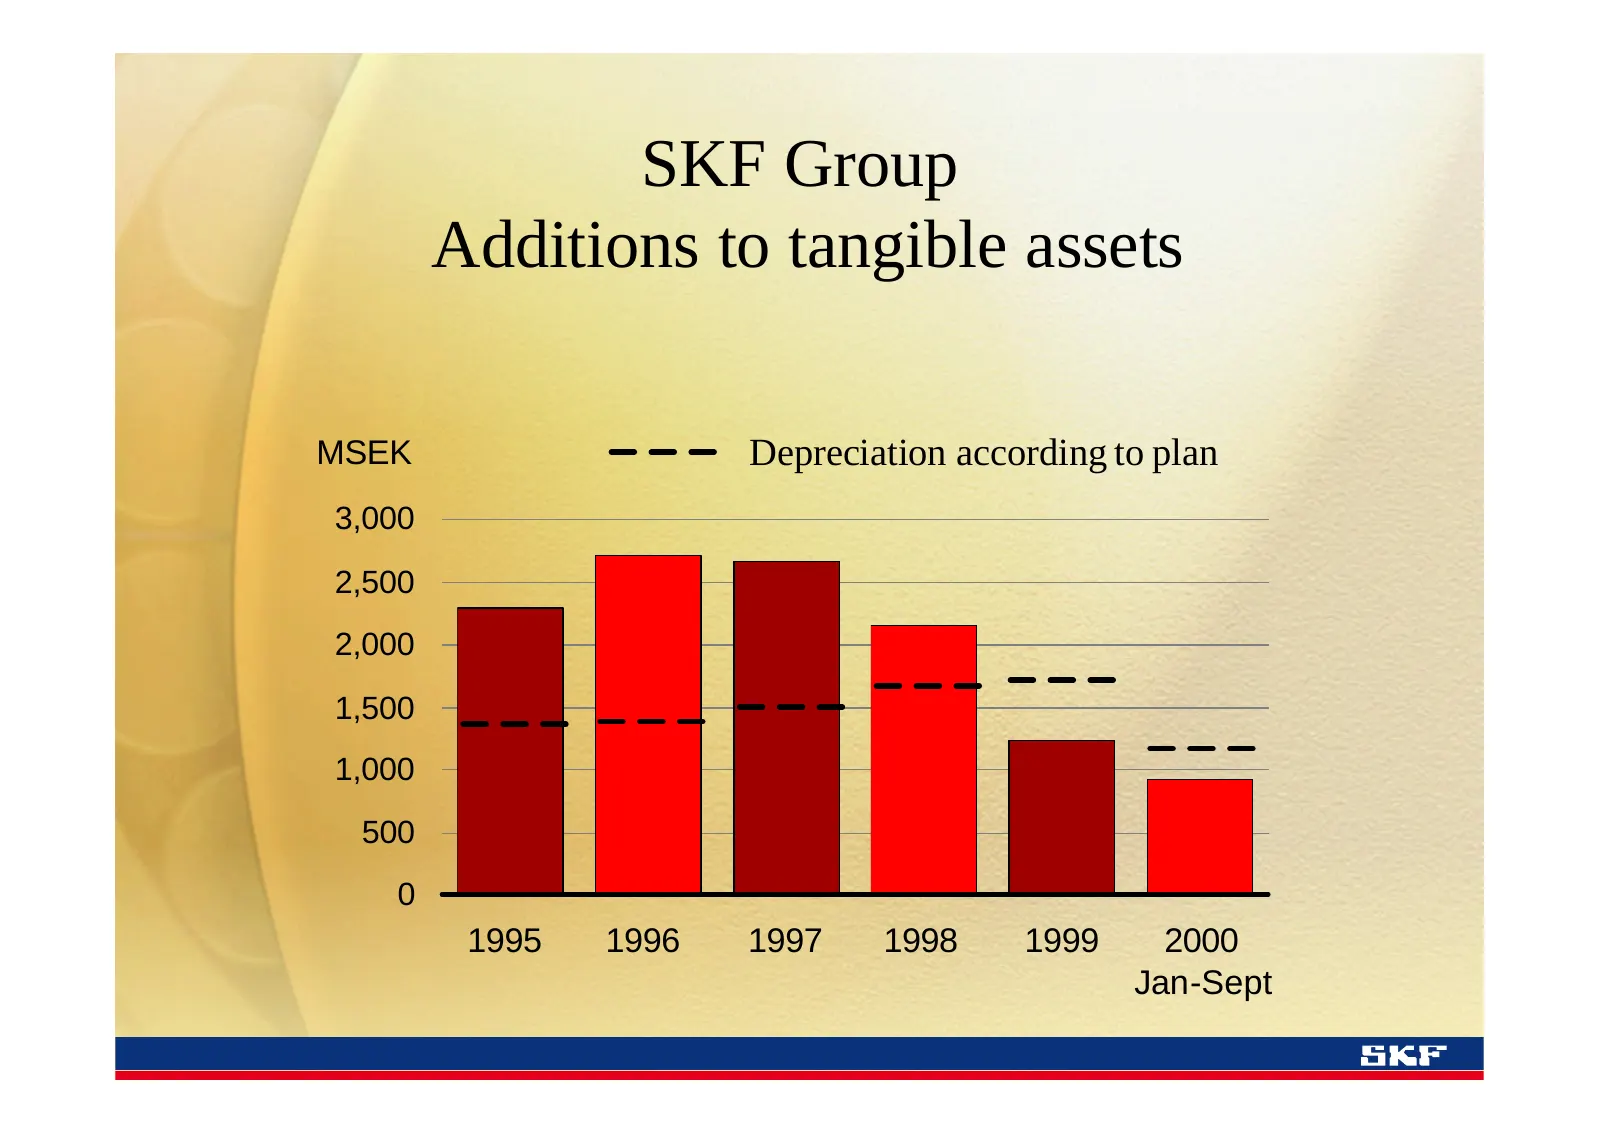
Slide 11: Additions to tangible assets
SKF Group Additions to tangible assets MSEK Depreciation according to plan 3,000 2,500 2,000 1,500 1,000 500 0 1995 1996 1997 1998 1999 2000 Jan-Sept
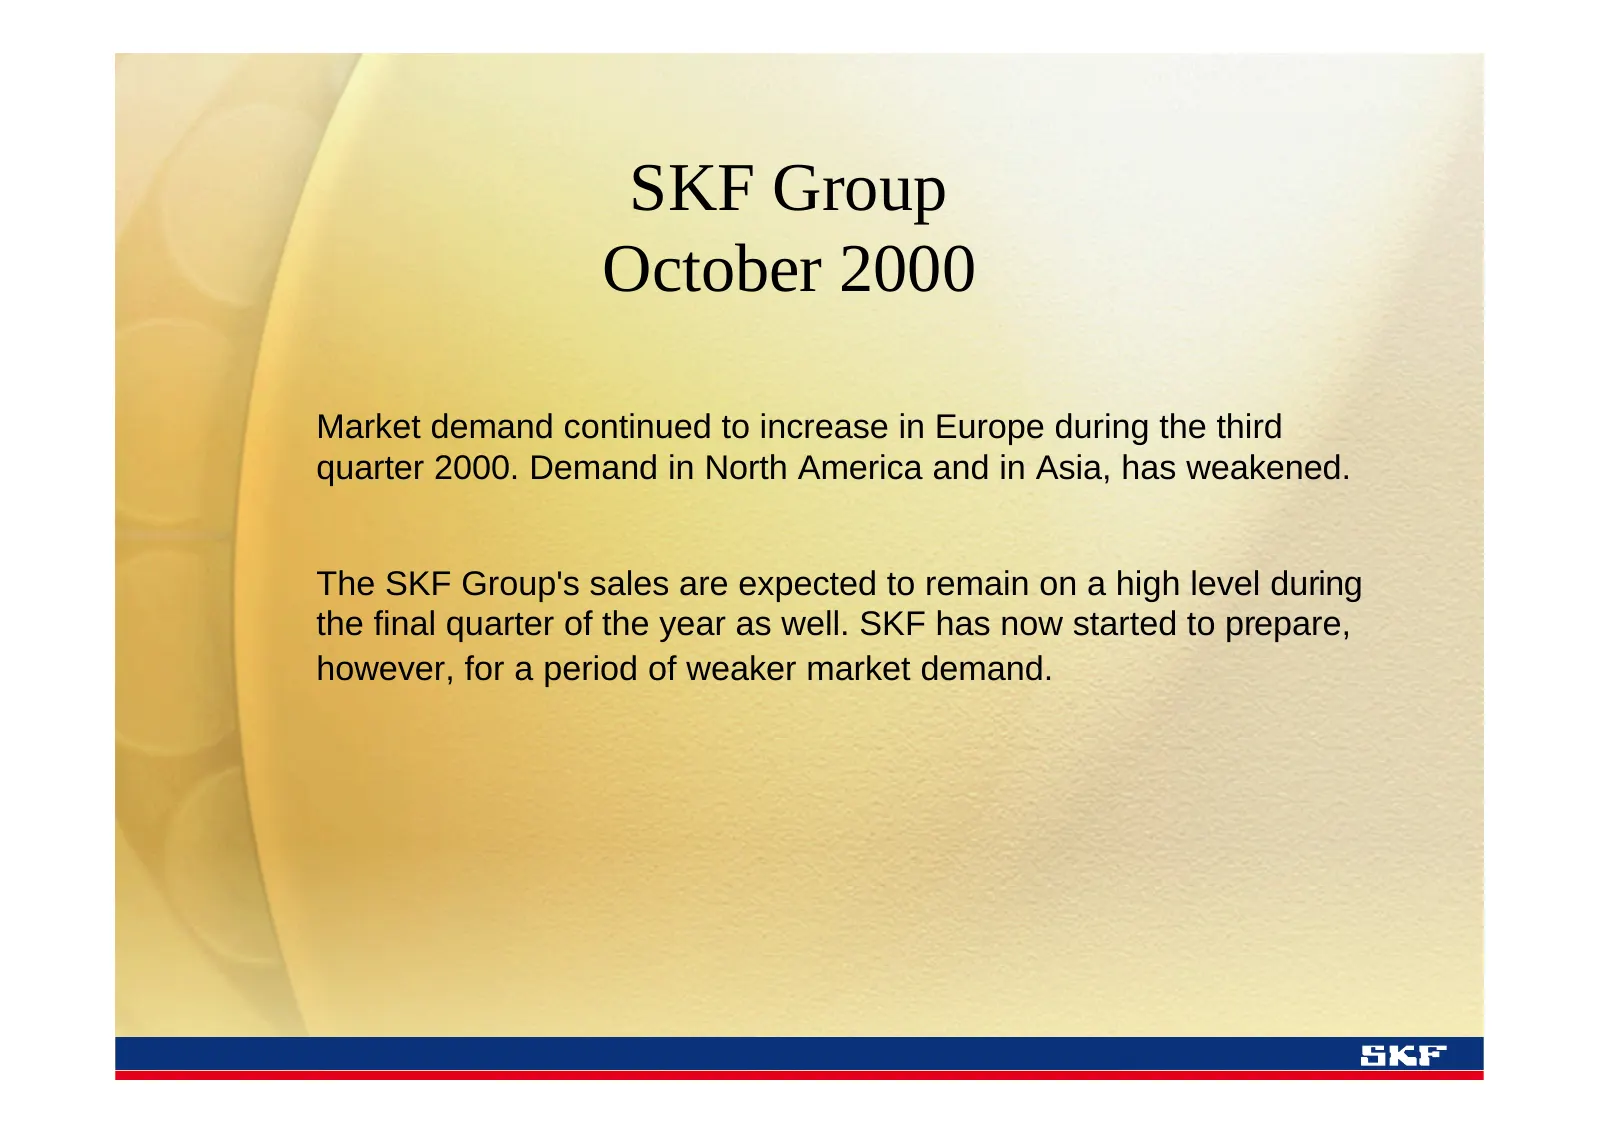
Slide 12: October 2000
SKF Group October 2000 Market demand continued to increase in Europe during the third quarter 2000. Demand in North America and in Asia, has weakened. The SKF Group's sales are expected to remain on a high level during the final quarter of the year as well. SKF has now started to prepare, however, f
Source: Internet Archive copy of investors.skf.com
More decks from SKF AB Class A
 Q3 2026 Earnings Presentation20 slides · Oct 21, 2026
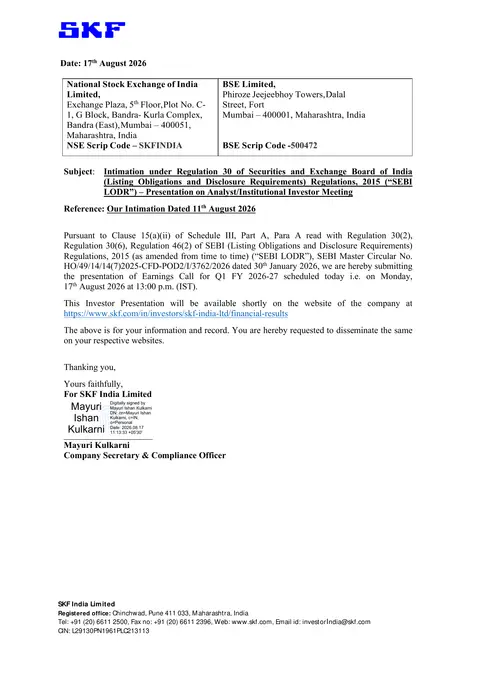 SKF India — Q1 FY2026-27 Earnings Presentation20 slides · Aug 17, 2026
 Q2 2026 Earnings Presentation21 slides · Jul 17, 2026
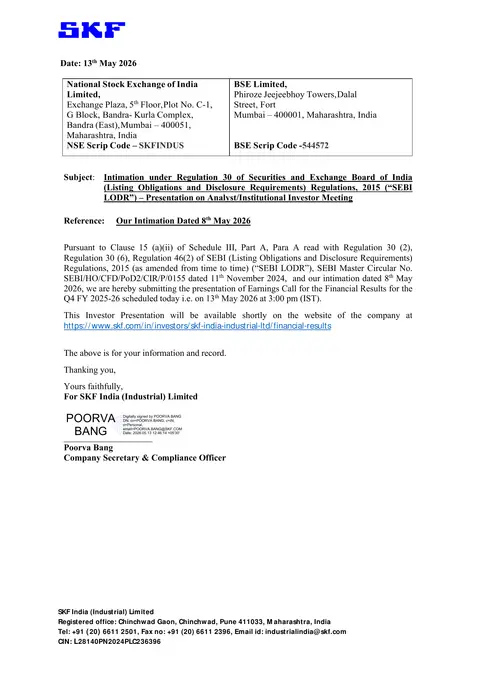 SKF India (Industrial) — Q4 FY2026 Earnings Presentation20 slides · May 13, 2026
 Q1 2026 Earnings Presentation22 slides · Apr 21, 2026
 Q4 2025 Earnings Presentation19 slides · Jan 30, 2026