AltaGas Ltd. · TSX:ALA
AltaGas — Q3 2020 Earnings Presentation
18 slides from AltaGas's earnings presentation, Oct 29, 2020
Slide 1: Third Quarter 2020 Earnings Summary
Third Quarter 2020 Earnings Summary October 29, 2020
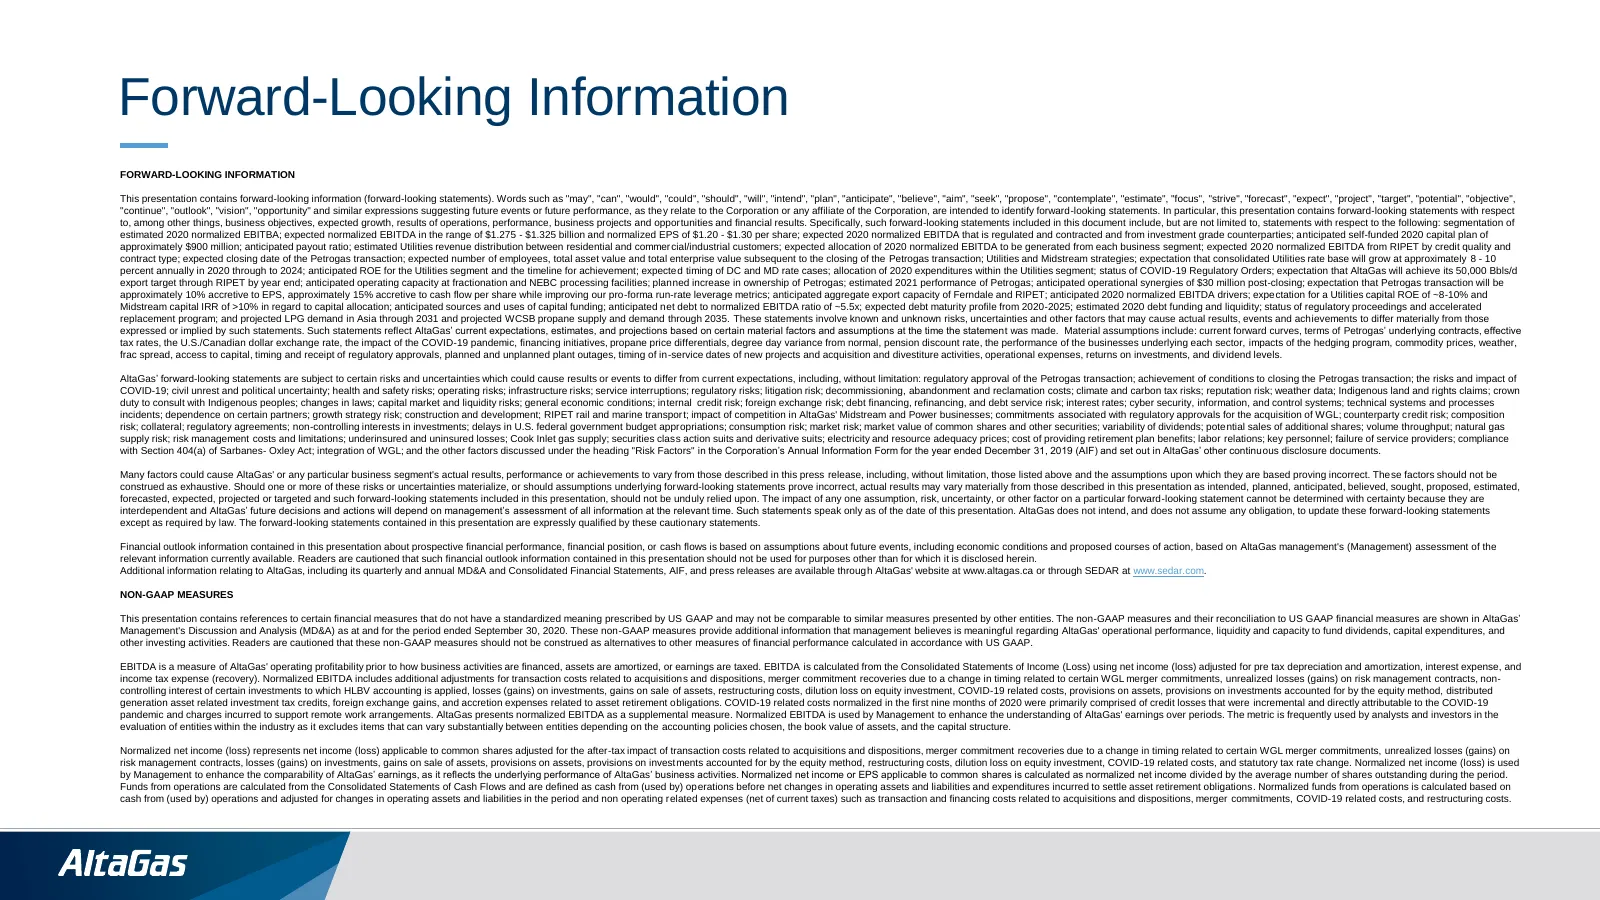
Slide 2: Forward-Looking Information
Forward-Looking Information FORWARD-LOOKING INFORMATION This presentation contains forward-looking information (forward-looking statements). Words such as "may", "can", "would", "could", "should", "will", "intend", "plan", "anticipate", "believe", "aim", "seek", "propose", "contemplate", "estimate",
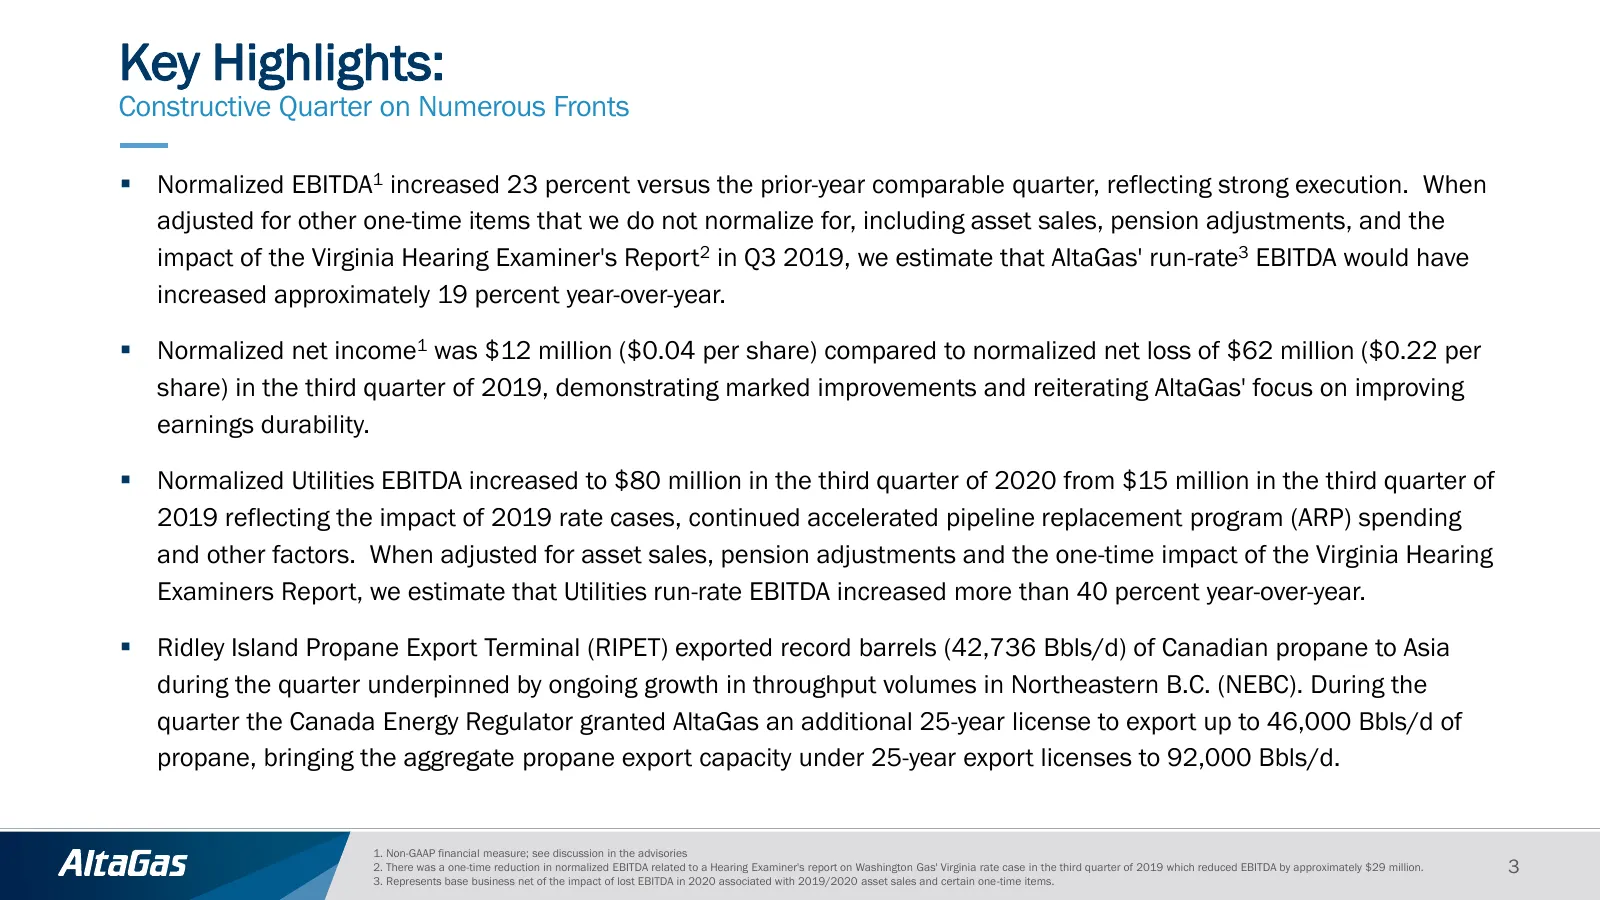
Slide 3: Key Highlights: Constructive Quarter on Numerous Fronts
Key Highlights: Constructive Quarter on Numerous Fronts ▪ Normalized EBITDA1 increased 23 percent versus the prior-year comparable quarter, reflecting strong execution. When adjusted for other one-time items that we do not normalize for, including asset sales, pension adjustments, and the impact of
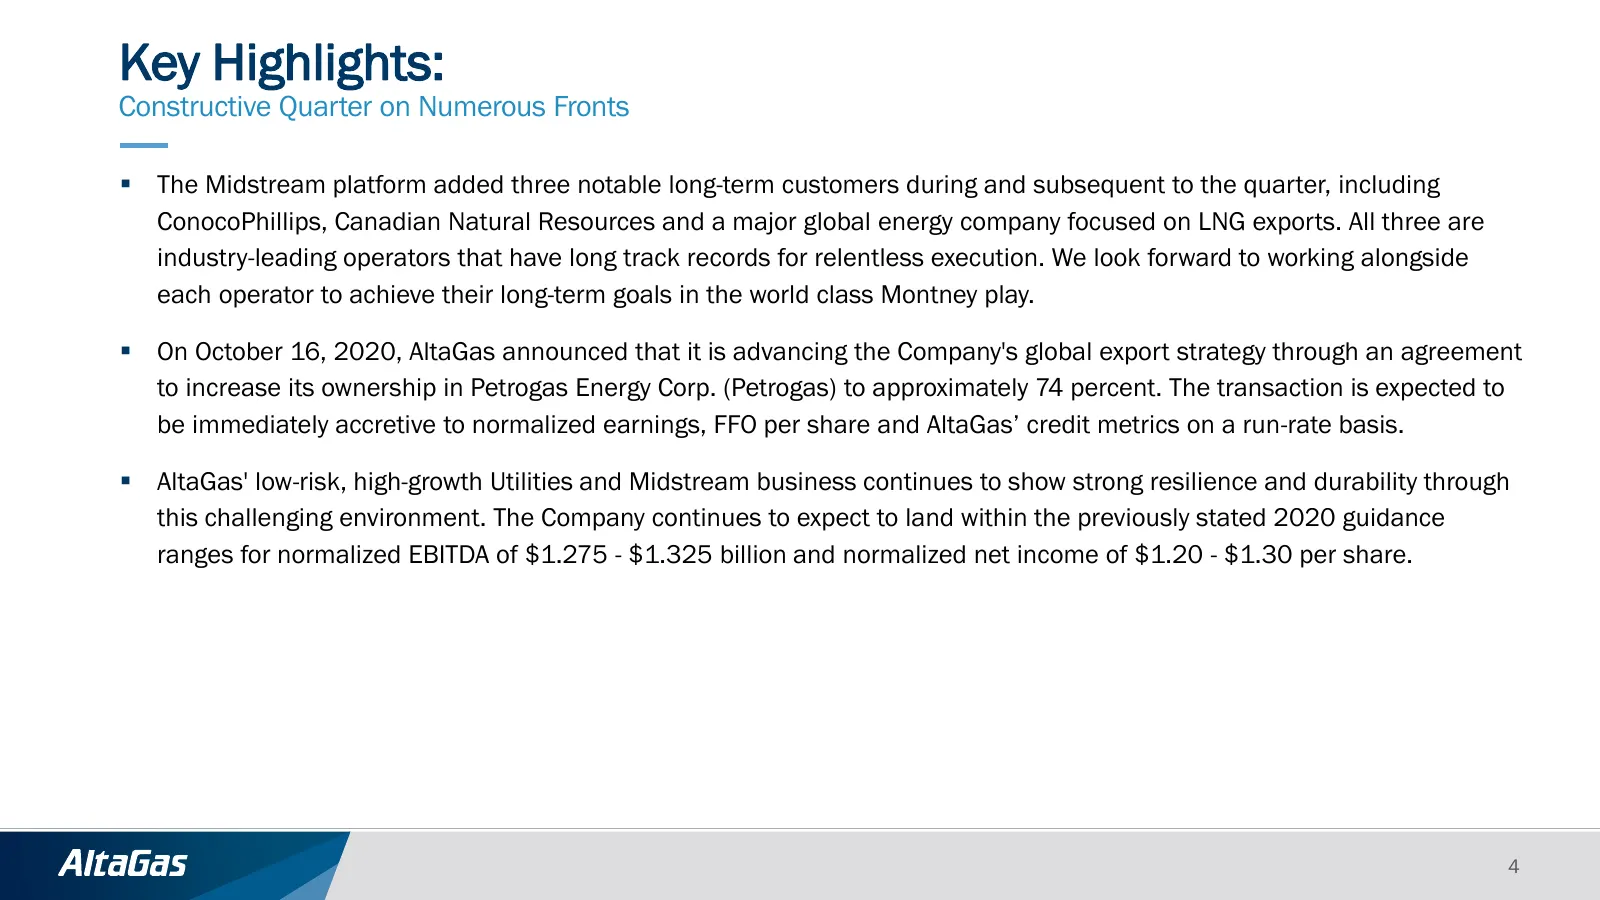
Slide 4: Key Highlights: Constructive Quarter on Numerous Fronts
Key Highlights: Constructive Quarter on Numerous Fronts ▪ The Midstream platform added three notable long-term customers during and subsequent to the quarter, including ConocoPhillips, Canadian Natural Resources and a major global energy company focused on LNG exports. All three are industry-leading
Slide 5: Q3 2020 Financial Results Summary
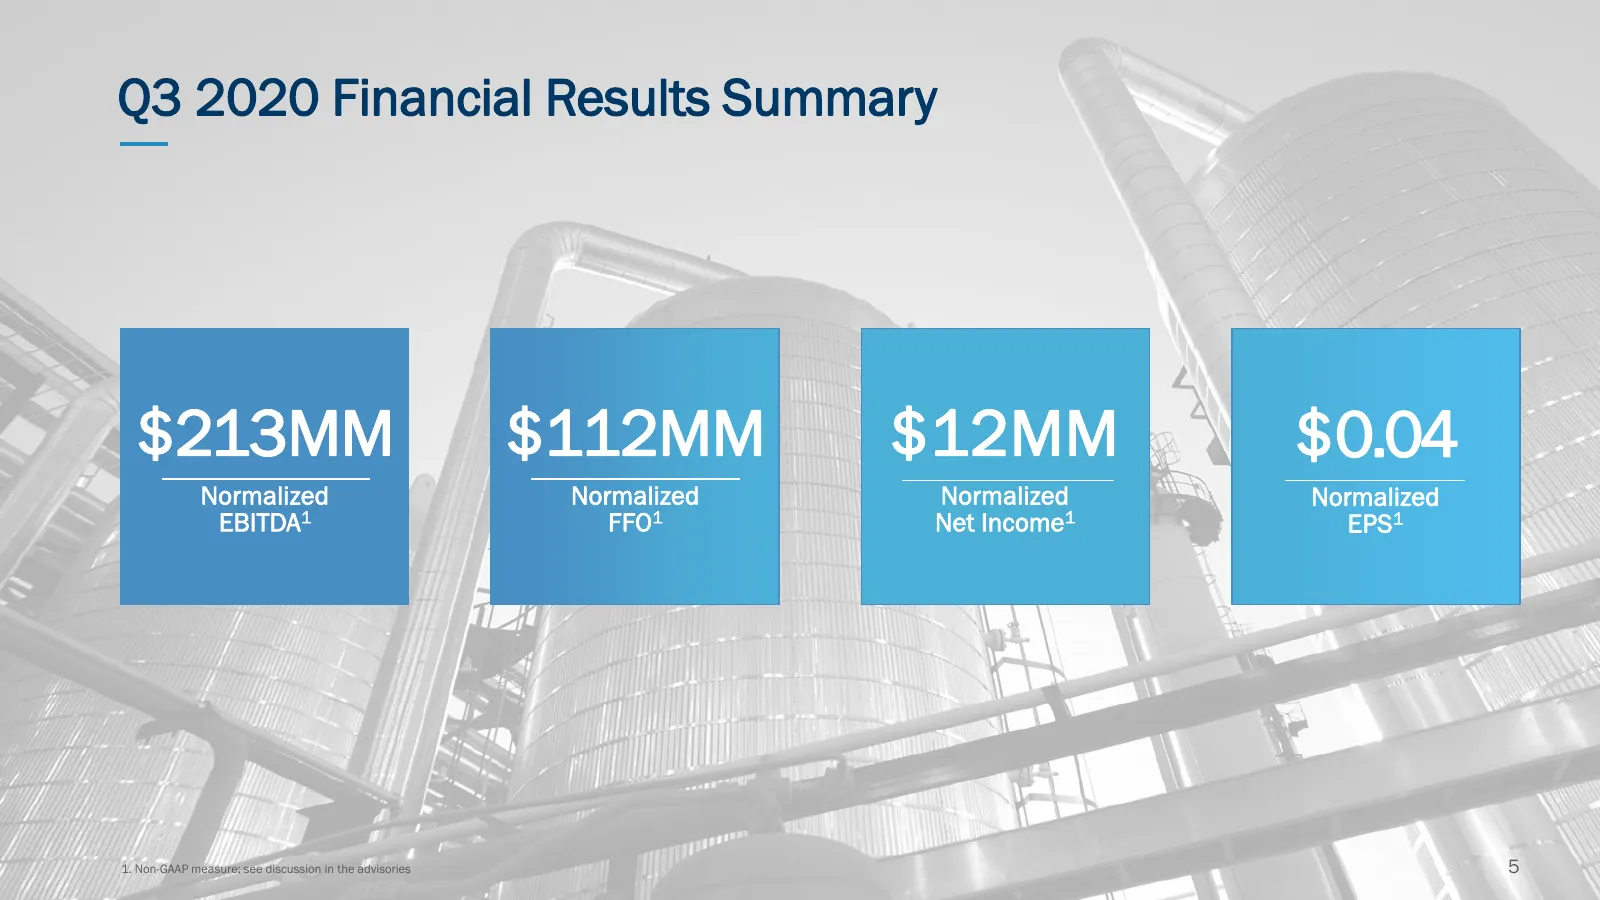
Q3 2020 Financial Results Summary $213MM $112MM $12MM $0.04 Normalized Normalized Normalized Normalized EBITDA1 FFO1 Net Income1 EPS1 1. Non-GAAP measure; see discussion in the advisories 5

Slide 6: Key Variances
Key Variances 6
Slide 7: Consolidated: Q3/20 vs. Q3/19
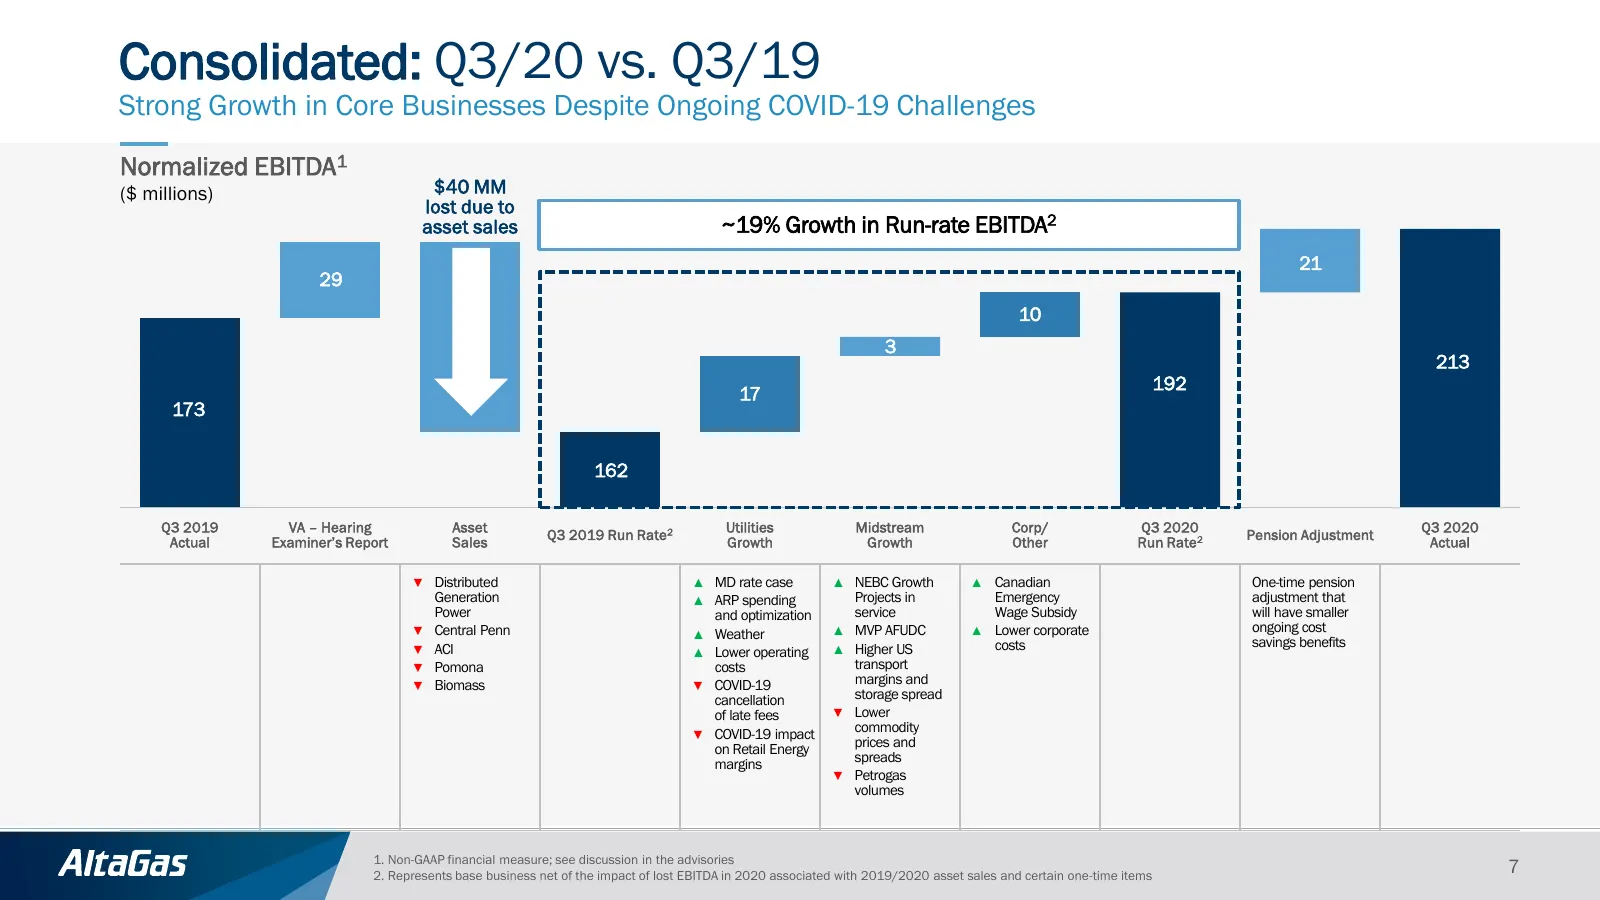
Consolidated: Q3/20 vs. Q3/19 Strong Growth in Core Businesses Despite Ongoing COVID-19 Challenges Normalized EBITDA1 ($ millions) $40 MM lost due to asset sales ~19% Growth in Run-rate EBITDA2 21 29 10 3 213 192 17 173 162 Q3 2019 VA – Hearing Asset Utilities Midstream Corp/ Q3 2020 Q3 2020 Actual
Slide 8: Utilities: Q3/20 vs. Q3/19
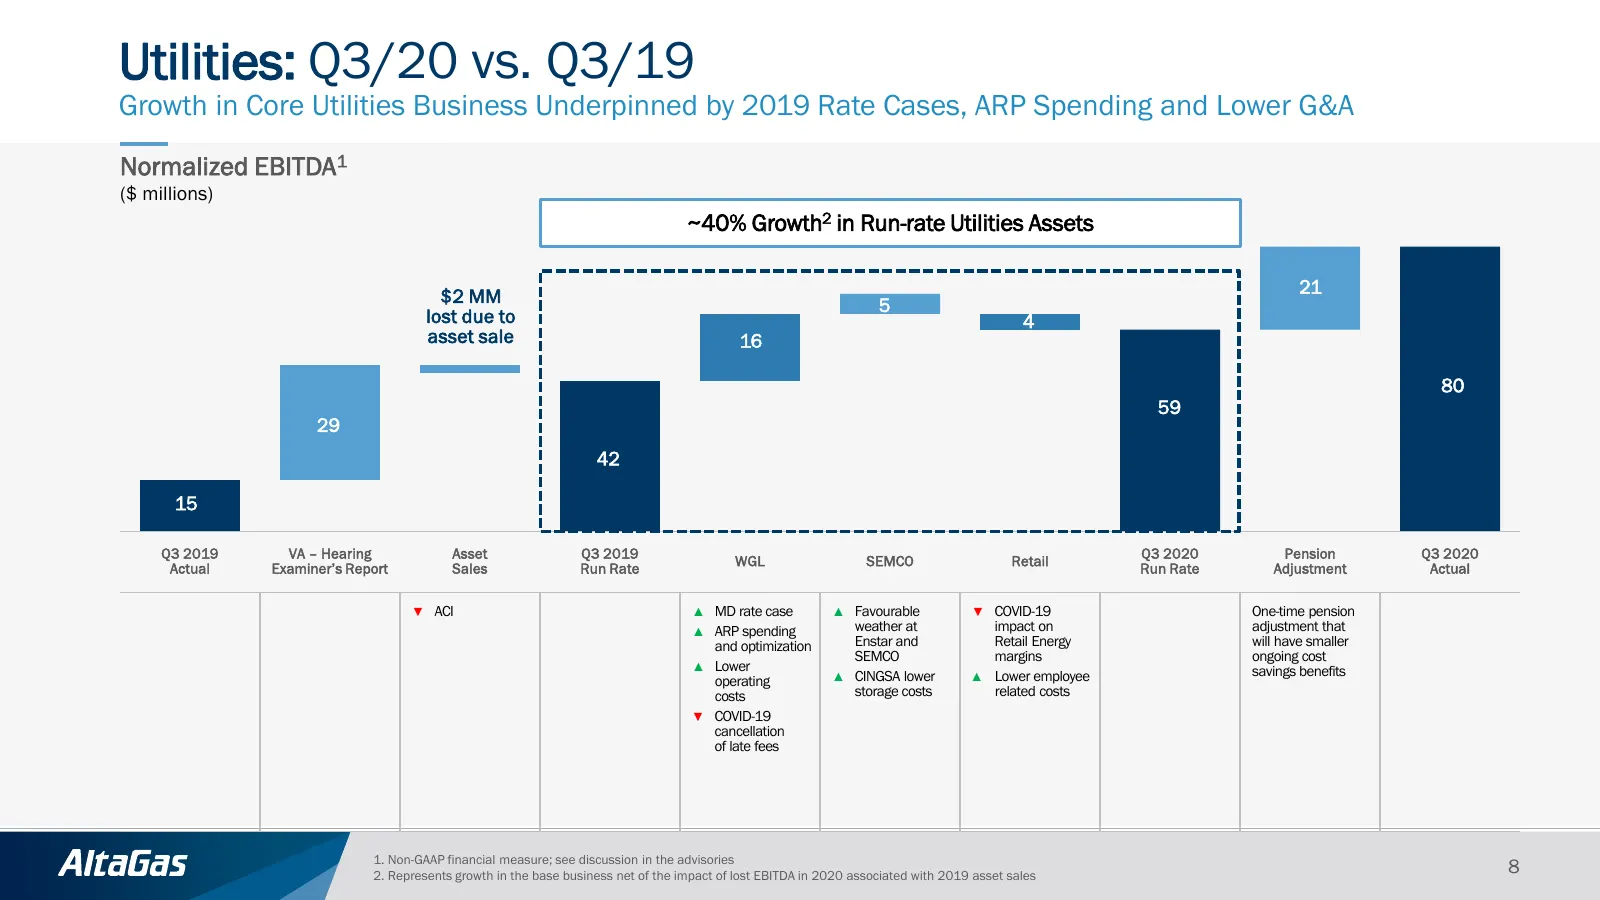
Utilities: Q3/20 vs. Q3/19 Growth in Core Utilities Business Underpinned by 2019 Rate Cases, ARP Spending and Lower G&A Normalized EBITDA1 ($ millions) ~40% Growth2 in Run-rate Utilities Assets $2 MM 21 5 lost due to 4 asset sale 16 80 59 29 42 15 Q3 2019 VA – Hearing Asset Q3 2019 Q3 2020 Pension Q
Slide 9: Midstream: Q3/20 vs. Q3/19
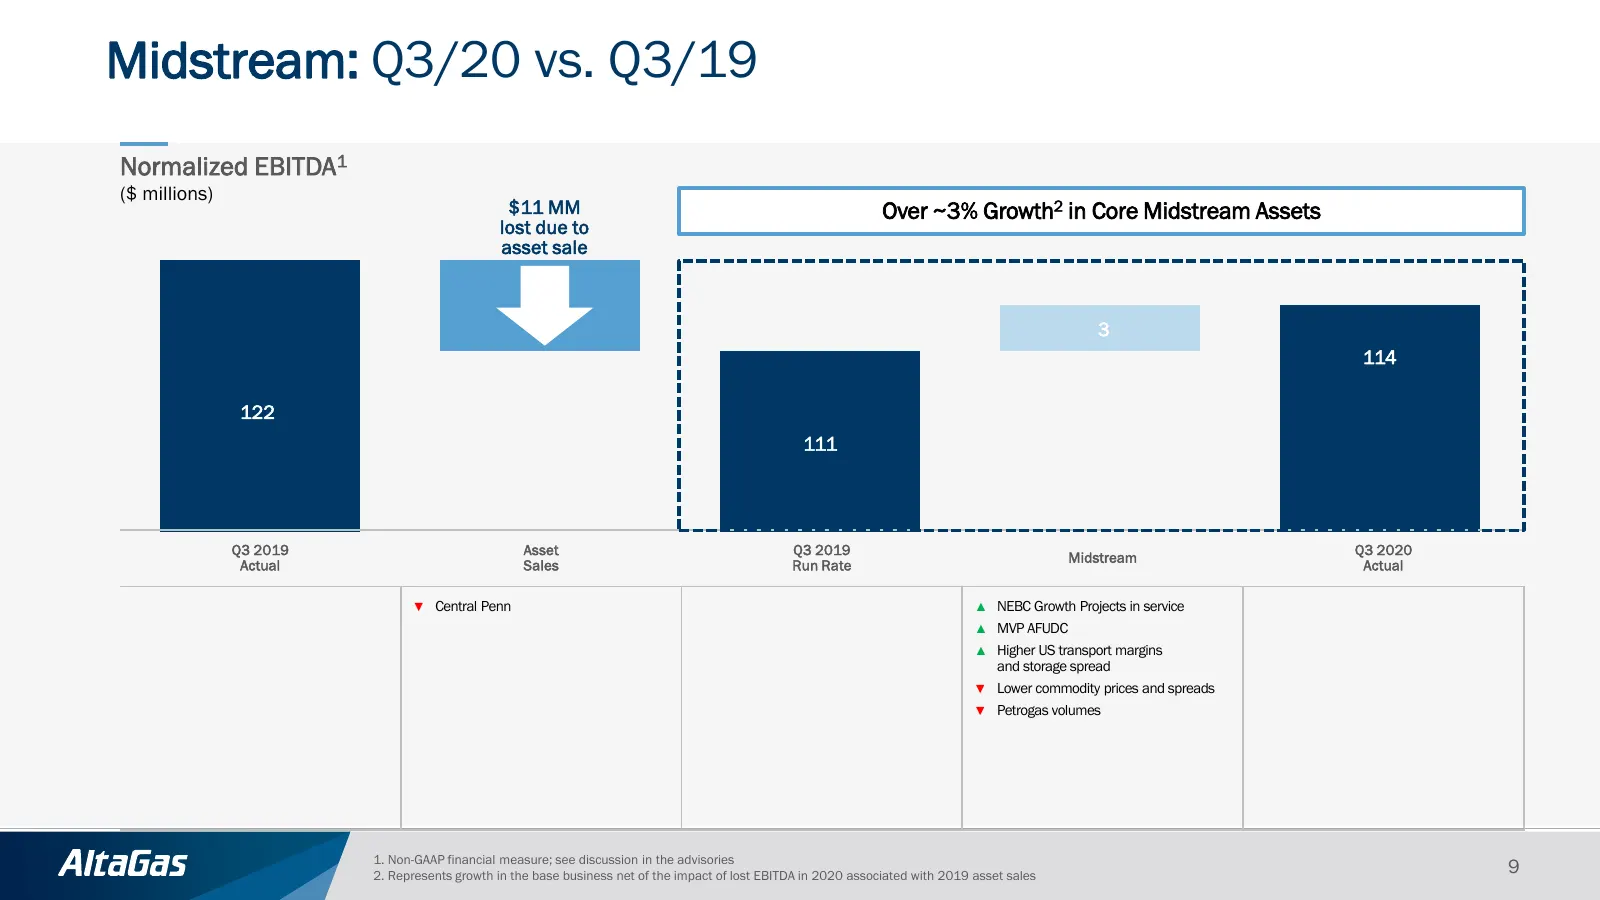
Midstream: Q3/20 vs. Q3/19 Normalized EBITDA1 ($ millions) $11 MM Over ~3% Growth2 in Core Midstream Assets lost due to asset sale 3 114 122 111 Q3 2019 Asset Q3 2019 Q3 2020 Midstream Actual Sales Run Rate Actual ▼ Central Penn ▲ NEBC Growth Projects in service ▲ MVP AFUDC ▲ Higher US transport mar
Slide 10: Corporate/Other: Q3/20 vs. Q3/19
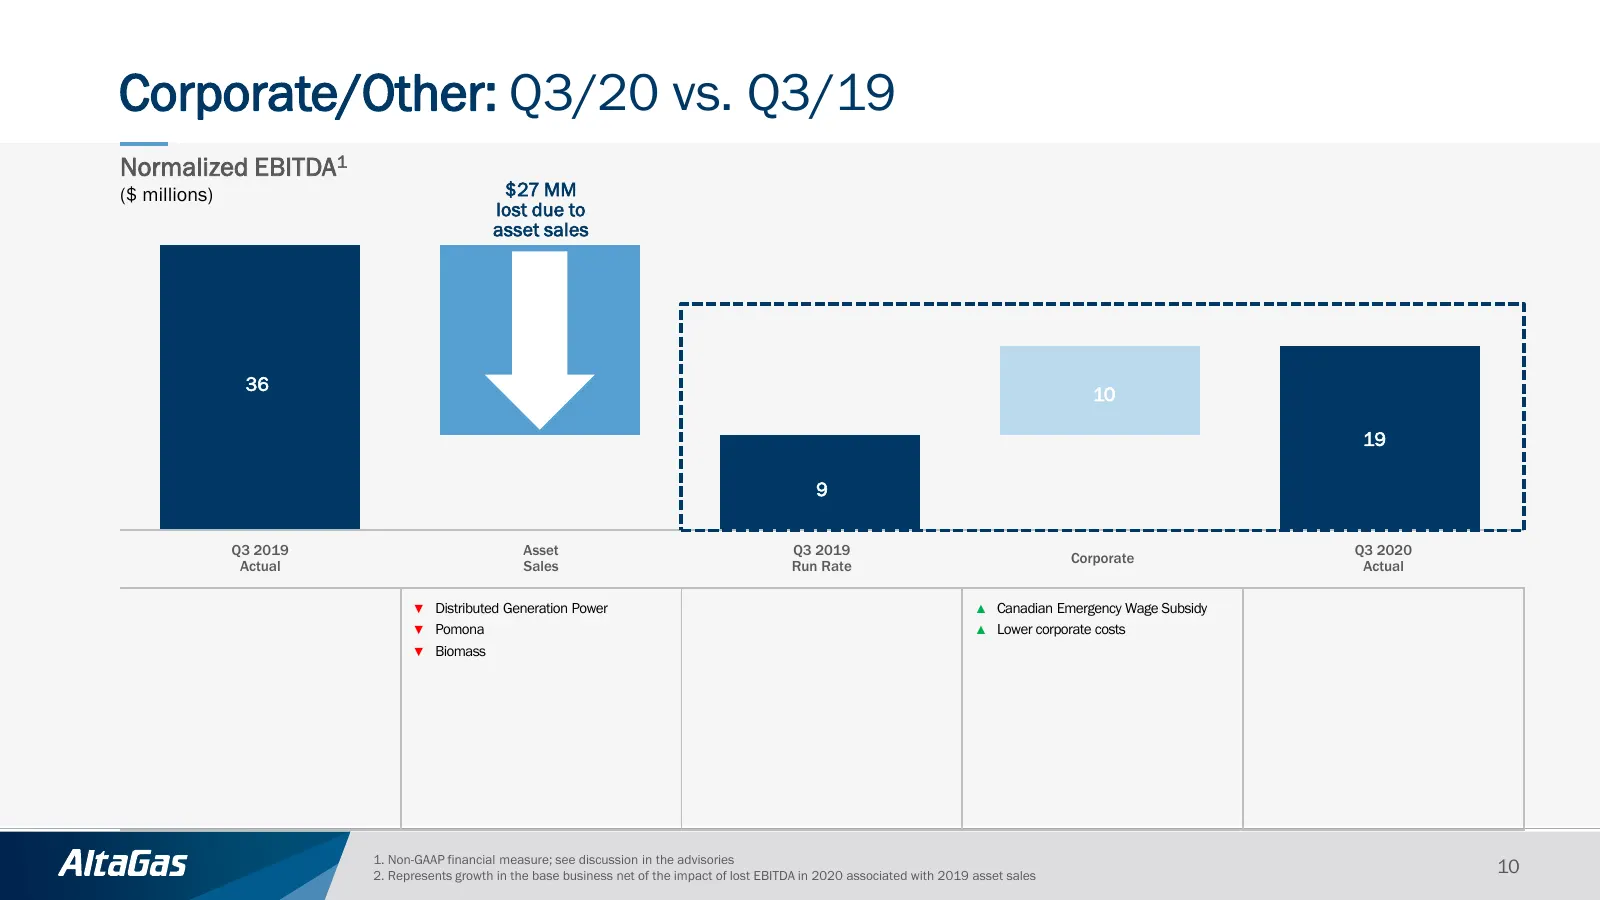
Corporate/Other: Q3/20 vs. Q3/19 Normalized EBITDA1 ($ millions) $27 MM lost due to asset sales 36 10 19 9 Q3 2019 Asset Q3 2019 Q3 2020 Corporate Actual Sales Run Rate Actual ▼ Distributed Generation Power ▲ Canadian Emergency Wage Subsidy ▼ Pomona ▲ Lower corporate costs ▼ Biomass 1. Non-GAAP fina
Slide 11: Q3/20 Normalized EBITDA Variance
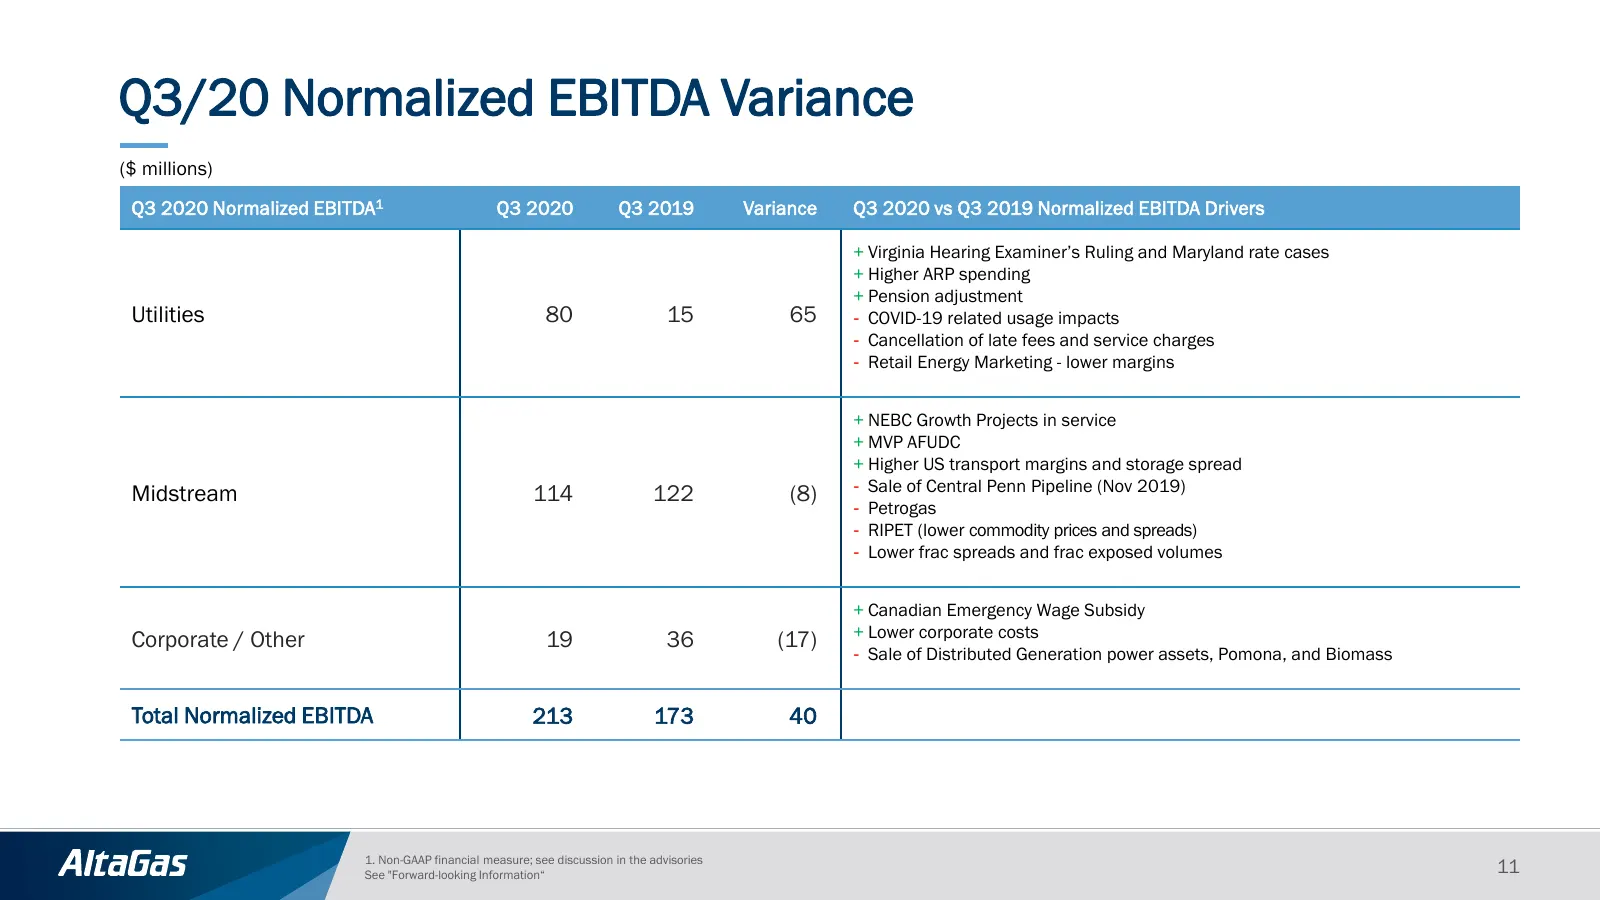
Q3/20 Normalized EBITDA Variance ($ millions) Q3 2020 Normalized EBITDA1 Q3 2020 Q3 2019 Variance Q3 2020 vs Q3 2019 Normalized EBITDA Drivers + Virginia Hearing Examiner’s Ruling and Maryland rate cases + Higher ARP spending + Pension adjustment Utilities 80 15 65 - COVID-19 related usage impacts -
Slide 12: 2020 Outlook
2020 Outlook 12
Slide 13: 2020 Outlook Unchanged
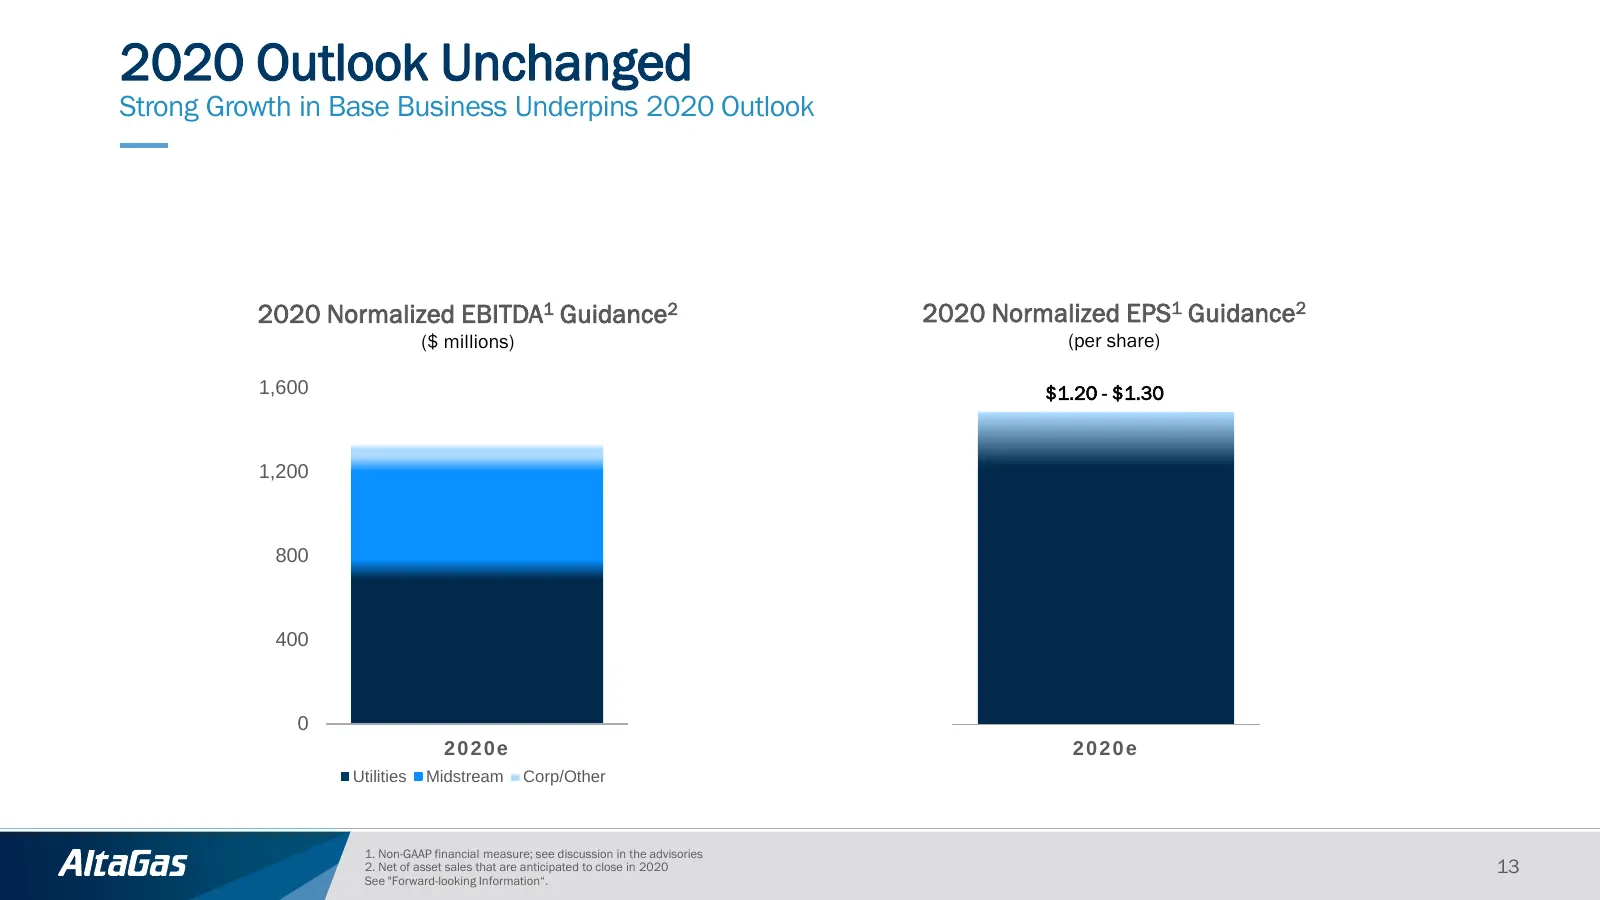
2020 Outlook Unchanged Strong Growth in Base Business Underpins 2020 Outlook 2020 Normalized EBITDA1 Guidance2 2020 Normalized EPS1 Guidance2 ($ millions) (per share) 1,600 $1.20 - $1.30 1,200 800 400 0 2020e 2020e Utilities Midstream Corp/Other 1. Non-GAAP financial measure; see discussion in the a
Slide 14: 2020 Normalized EBITDA Drivers
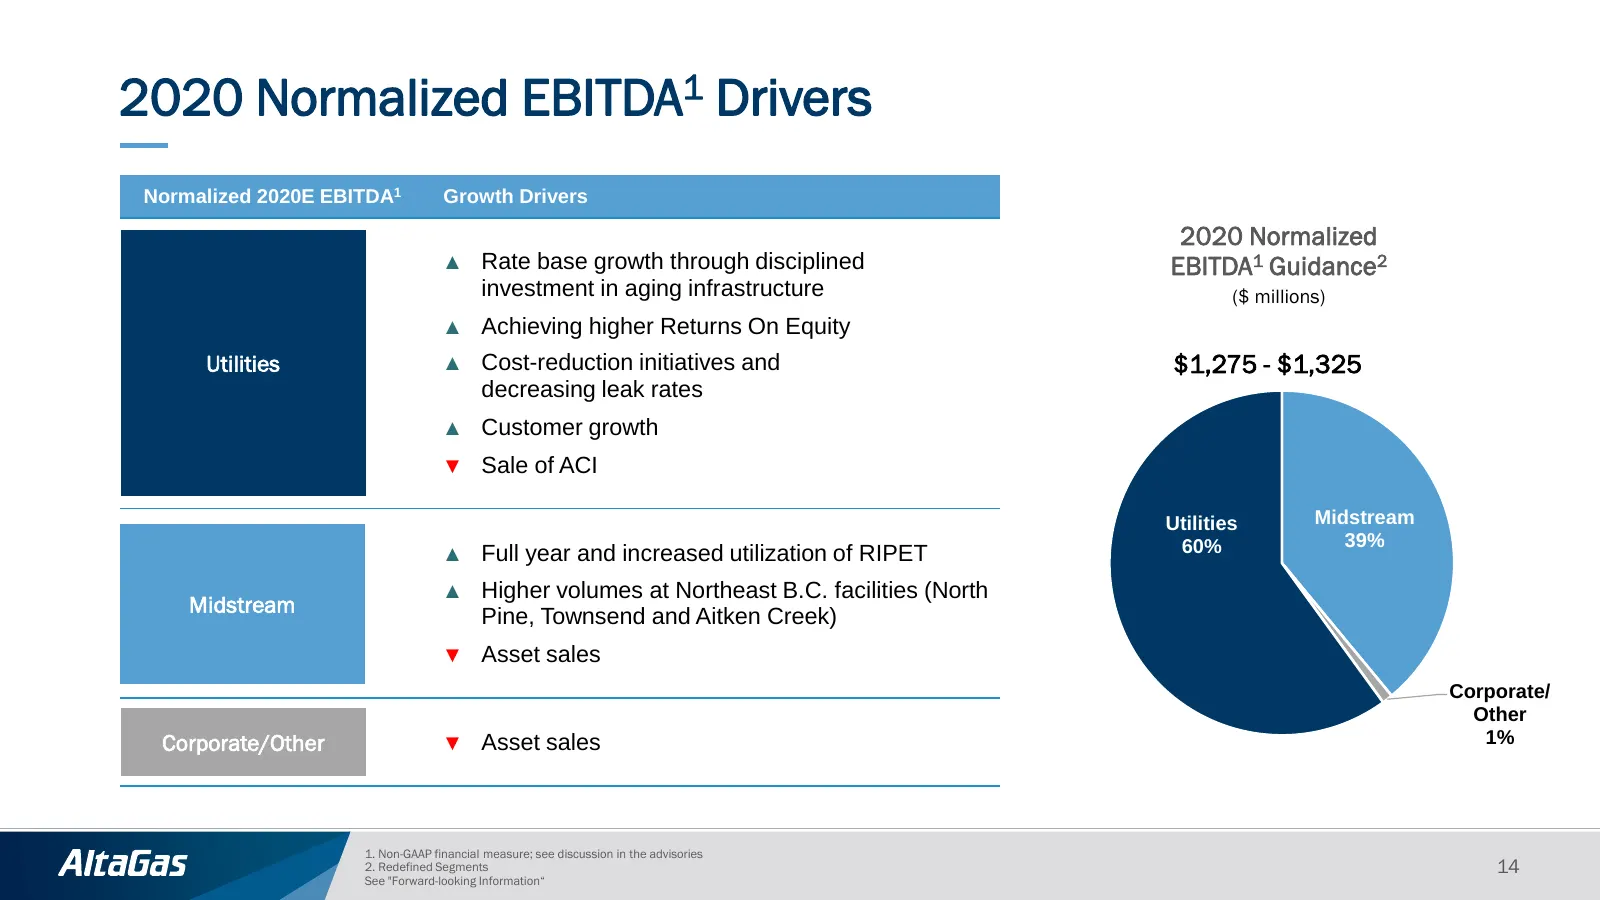
2020 Normalized EBITDA1 Drivers Normalized 2020E EBITDA1 Growth Drivers 2020 Normalized ▲ Rate base growth through disciplined EBITDA1 Guidance2 investment in aging infrastructure ($ millions) ▲ Achieving higher Returns On Equity Utilities ▲ Cost-reduction initiatives and $1,275 - $1,325 decreasing
Slide 15: 2020 Disciplined Capital Allocation
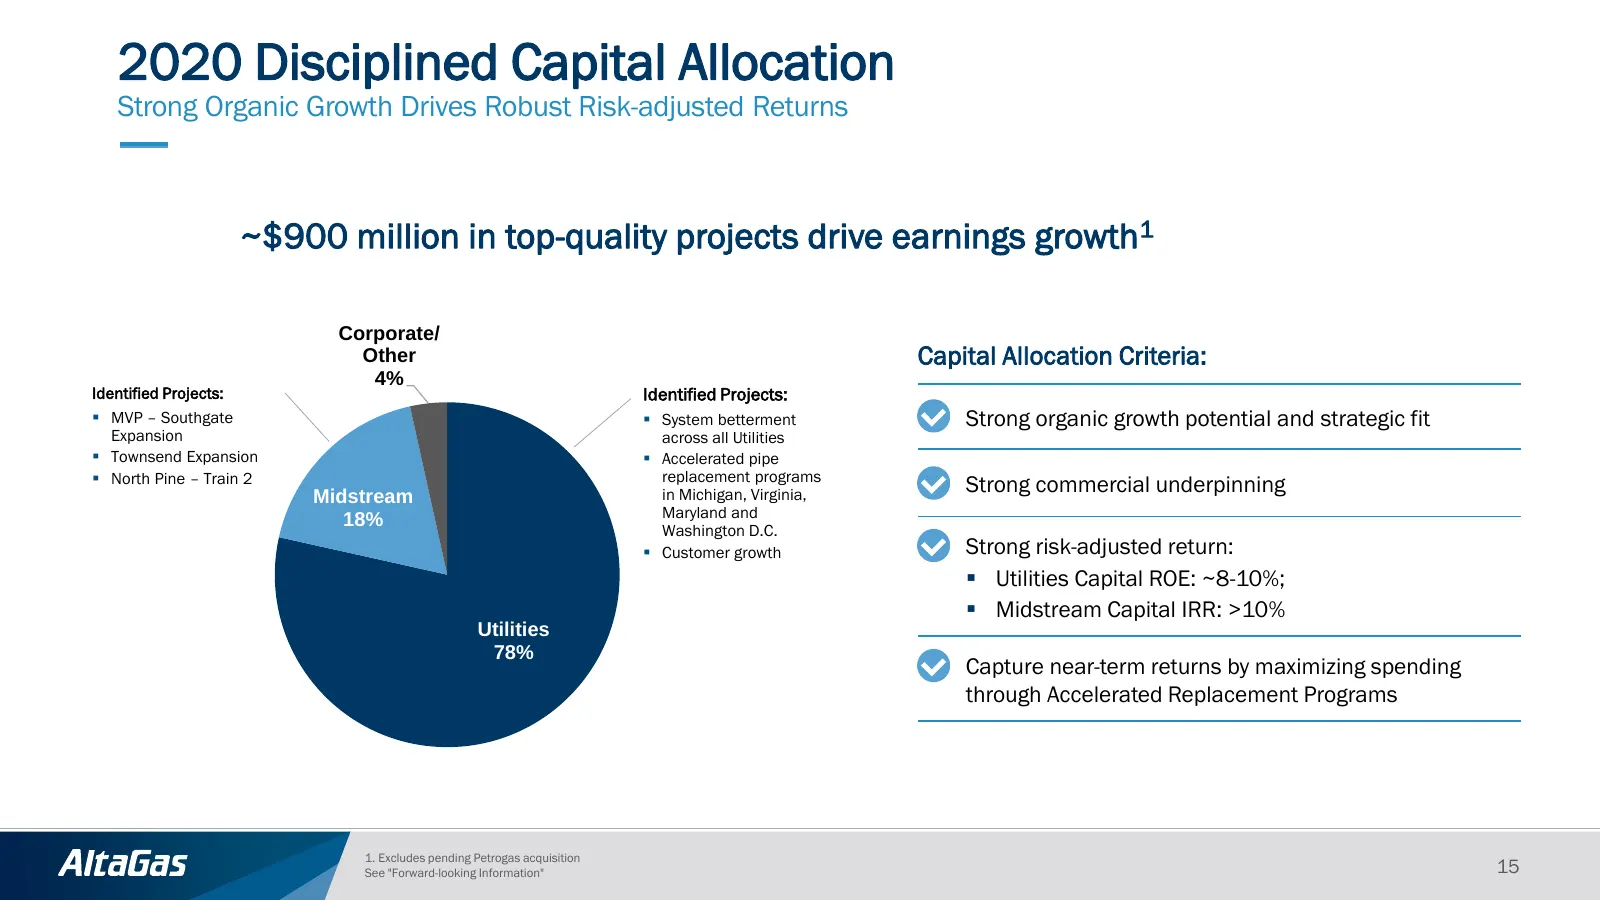
2020 Disciplined Capital Allocation Strong Organic Growth Drives Robust Risk-adjusted Returns ~$900 million in top-quality projects drive earnings growth1 Corporate/ Other Capital Allocation Criteria: 4% Identified Projects: Identified Projects: ▪ MVP – Southgate ▪ System betterment Strong organic g
Slide 16: Investment Grade Credit Rating
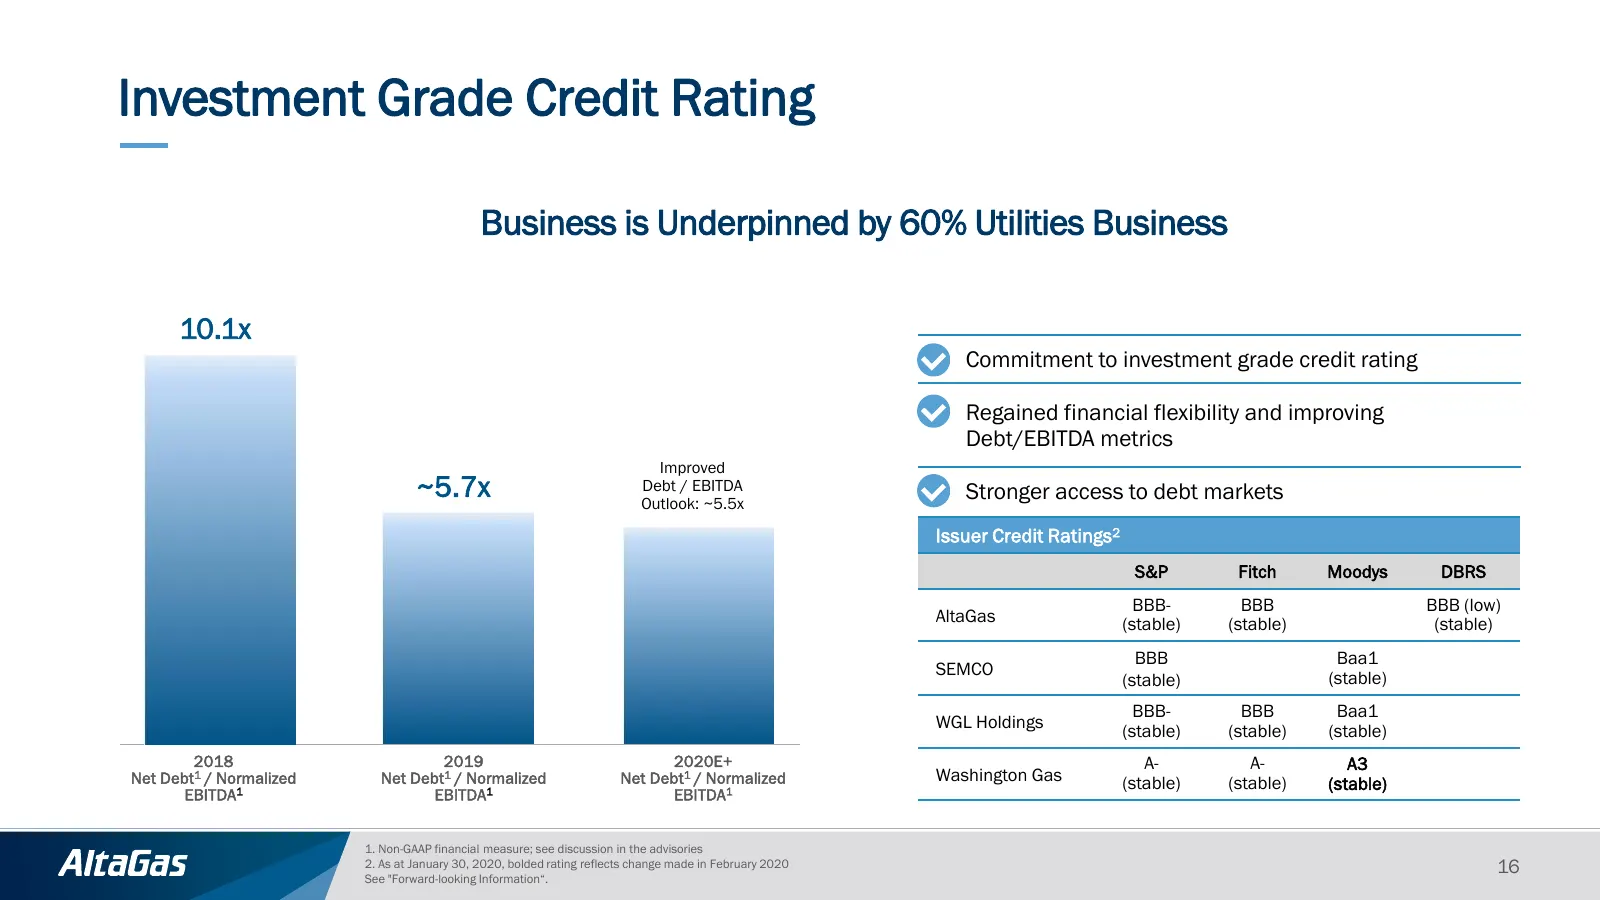
Investment Grade Credit Rating Business is Underpinned by 60% Utilities Business 10.1x Commitment to investment grade credit rating Regained financial flexibility and improving Debt/EBITDA metrics Improved ~5.7x Debt / EBITDA Outlook: ~5.5x Stronger access to debt markets Issuer Credit Ratings2 S&P
Slide 17: Financial Flexibility
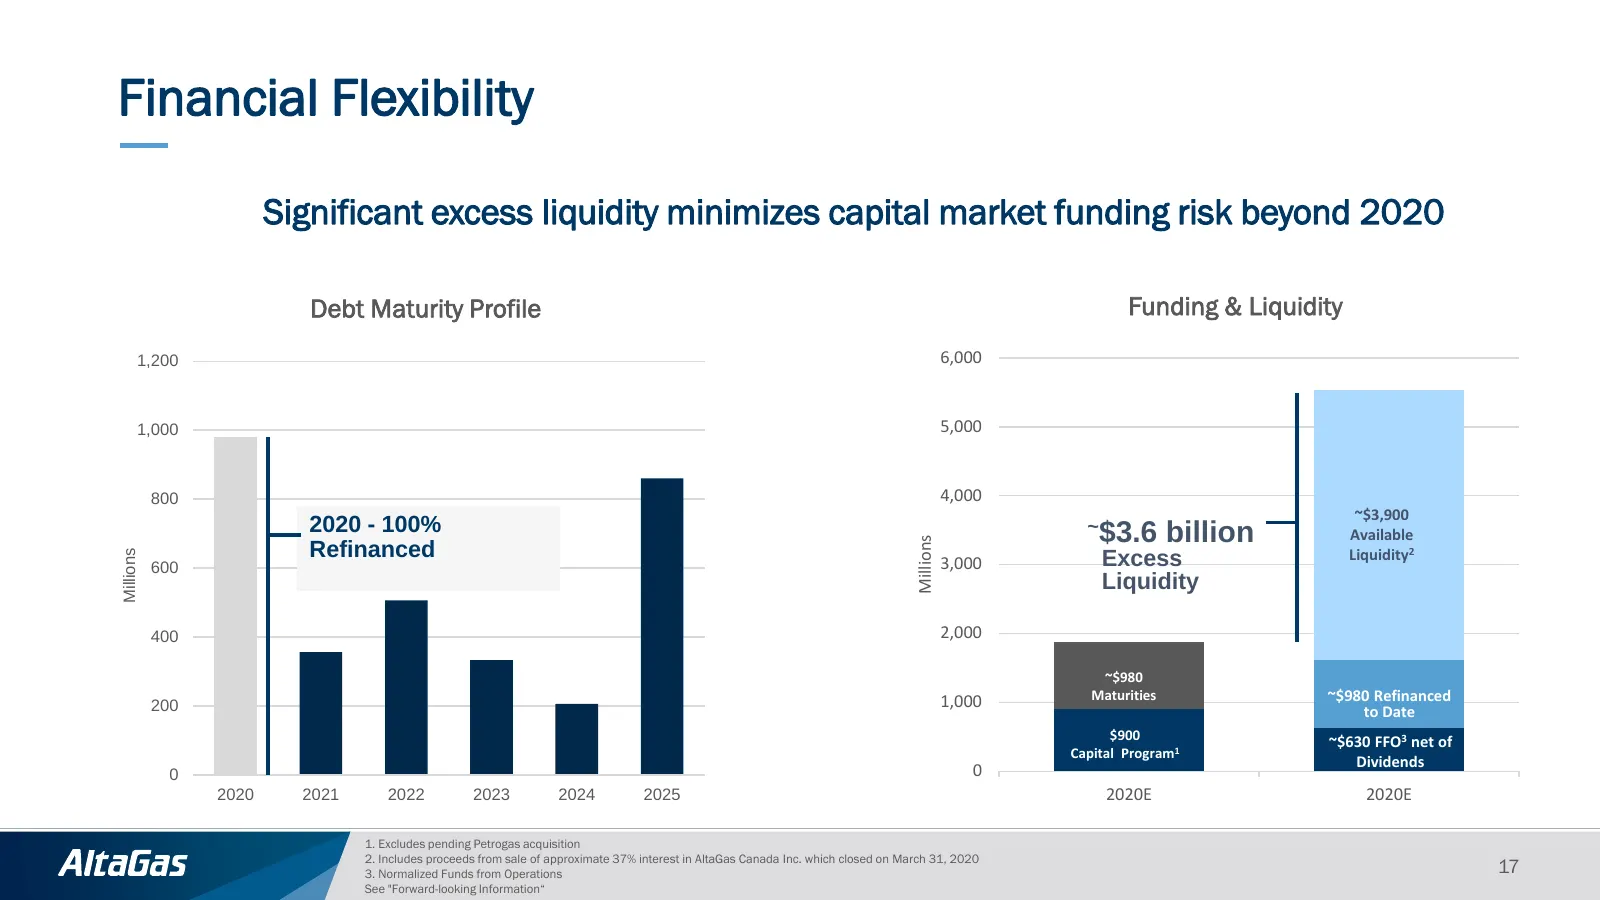
Financial Flexibility Significant excess liquidity minimizes capital market funding risk beyond 2020 Debt Maturity Profile Funding & Liquidity 1,200 6,000 1,000 5,000 800 4,000 ~$3,900 2020 - 100% ~$3.6 billion Available Millions Refinanced Liquidity2 Millions 600 3,000 Excess Liquidity 400 2,000 ~$
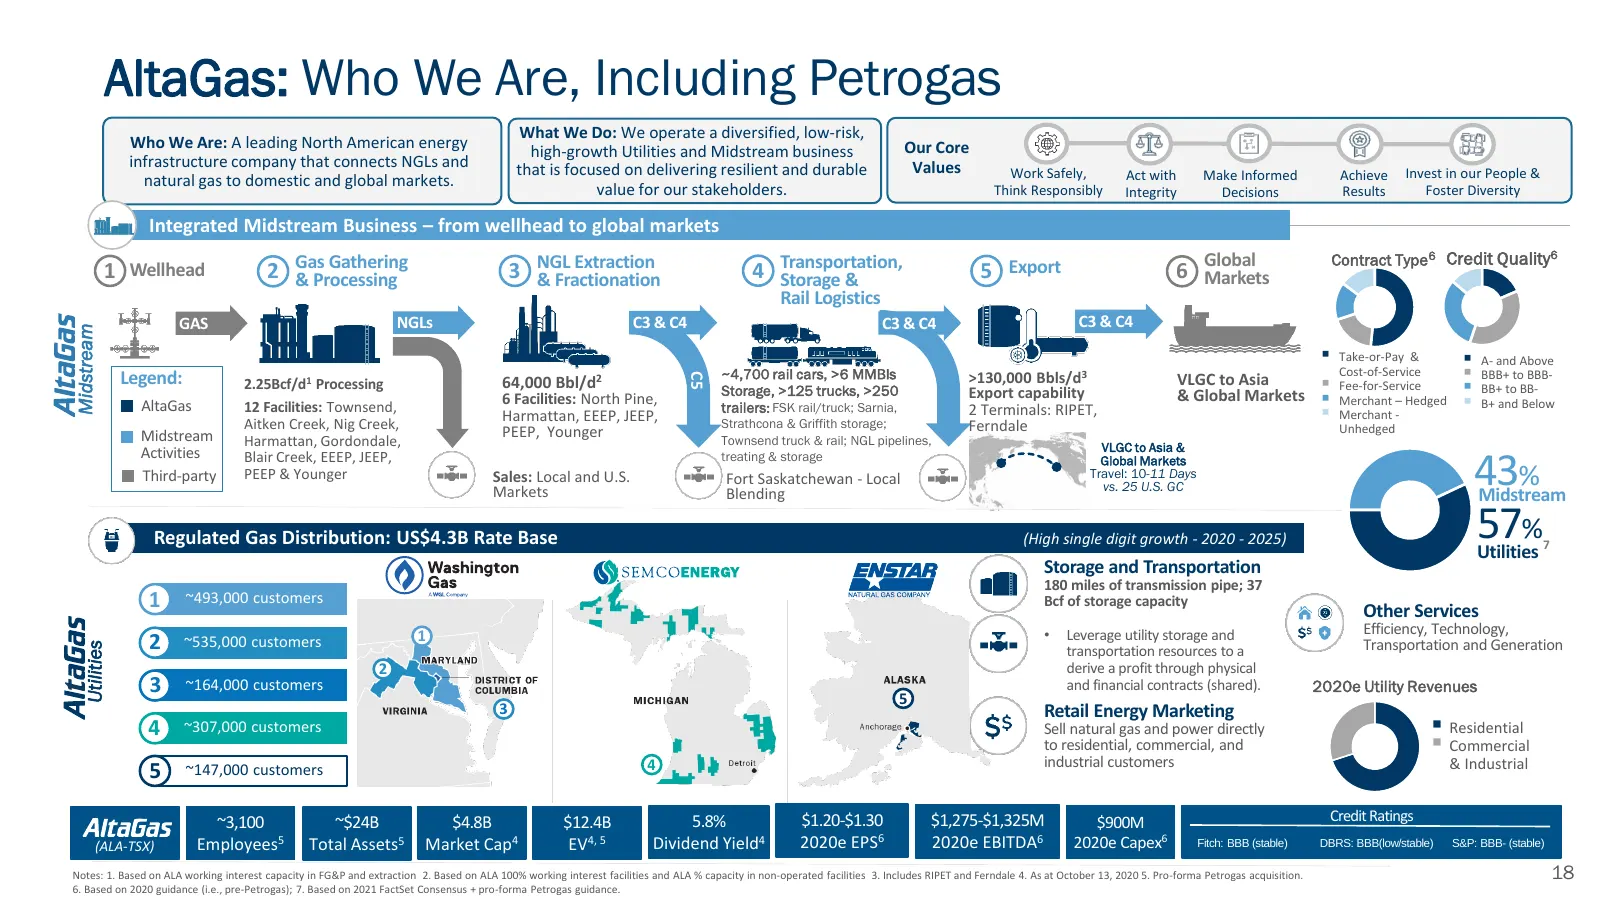
Slide 18: AltaGas: Who We Are, Including Petrogas
AltaGas: Who We Are, Including Petrogas What We Do: We operate a diversified, low-risk, Who We Are: A leading North American energy high-growth Utilities and Midstream business Our Core infrastructure company that connects NGLs and that is focused on delivering resilient and durable Values Work Safe
Source: Internet Archive copy of altagas.ca
More decks from AltaGas Ltd.
 Q3 2026 Earnings Presentation23 slides · Oct 29, 2026
 Q2 2026 Earnings Presentation24 slides · Jul 30, 2026
 Investor Presentation (June 2026)58 slides · June 2026
 Investor Presentation (May 2026)61 slides · May 2026
 Q1 2026 Earnings Presentation24 slides · Apr 30, 2026
 Q4 2025 Earnings Presentation30 slides · Mar 6, 2026