OPC Energy Ltd. · TASE:OPCE
OPC Energy — Q3 2026 Earnings Presentation
32 slides from OPC Energy's earnings presentation, Nov 10, 2026
Slide 1: Earnings Presentation Q3 2026
Earnings Presentation Q3 2026
Slide 2: Legal Disclaimer
Legal Disclaimer Receipt of information from OPC Energy Ltd. (the “Company”) is subject to the terms of this legal disclaimer. English presentation is provided as unofficial translation for convenience purposes only. This presentation is provided solely for the purpose of delivering condensed inform
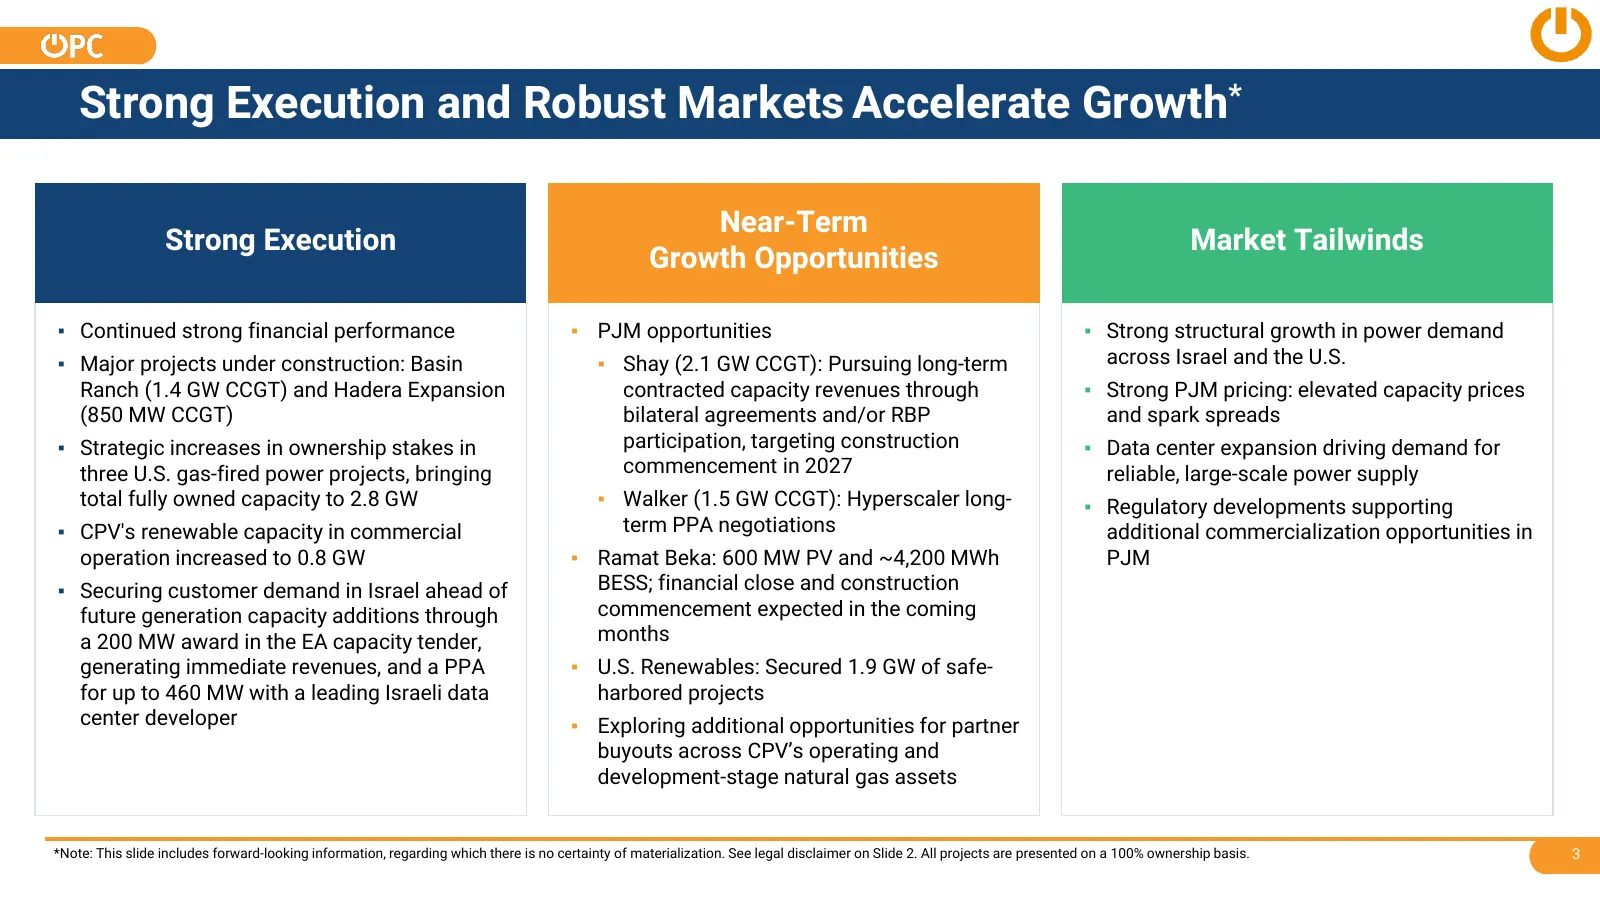
Slide 3: Strong Execution and Robust Markets Accelerate Growth
Strong Execution and Robust Markets Accelerate Growth* Near-Term Strong Execution Market Tailwinds Growth Opportunities ▪ Continued strong financial performance ▪ PJM opportunities ▪ Strong structural growth in power demand ▪ Major projects under construction: Basin ▪ Shay (2.1 GW CCGT): Pursuing lo
Slide 4: Strong Results in Q3 2026
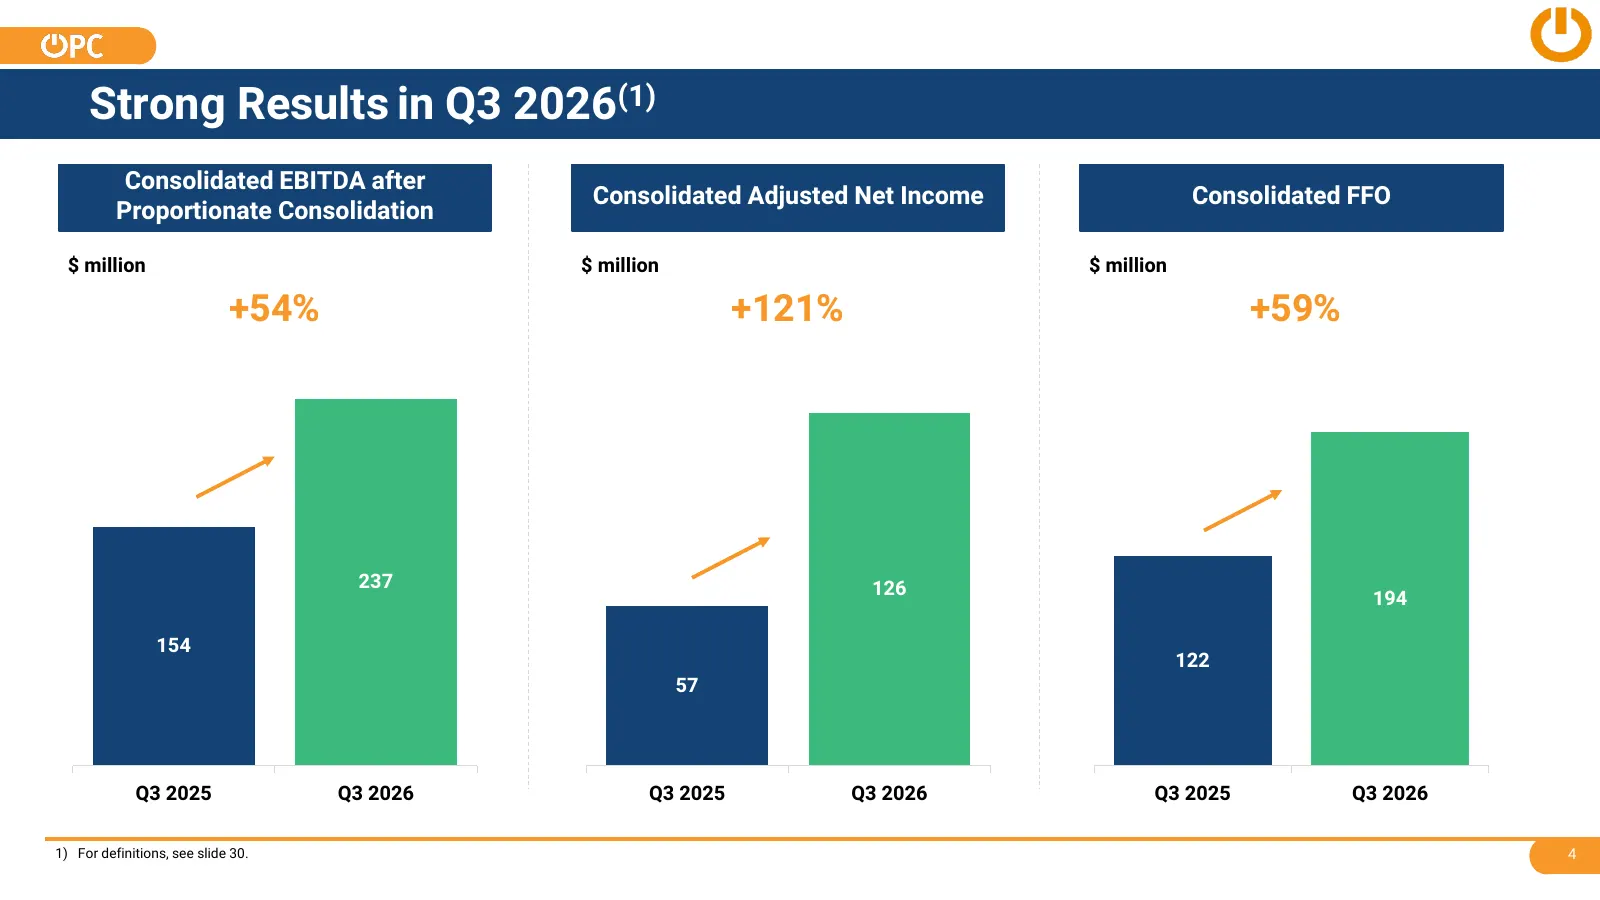
Strong Results in Q3 2026(1) Consolidated EBITDA after Consolidated Adjusted Net Income Consolidated FFO Proportionate Consolidation $ million $ million $ million +54% +121% +59% 237 126 194 154 122 57 Q3 2025 Q3 2026 Q3 2025 Q3 2026 Q3 2025 Q3 2026 1) For definitions, see slide 30. 4
Slide 5: Near-Term Strategic Projects of 9 GW and 4 GWh BESS
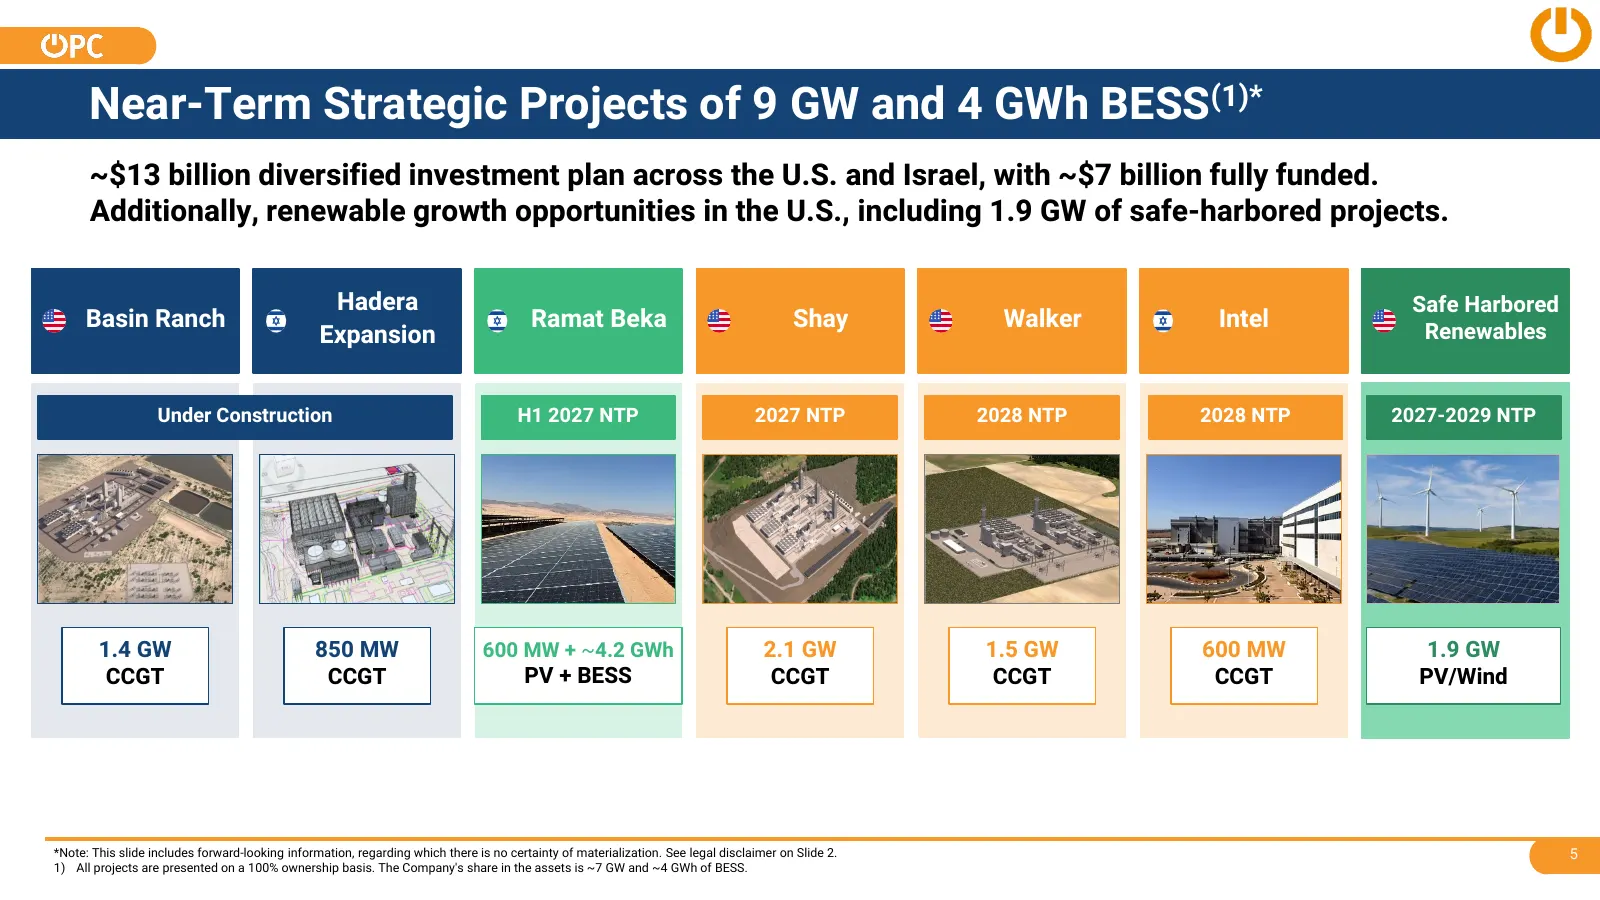
Near-Term Strategic Projects of 9 GW and 4 GWh BESS(1)* ~$13 billion diversified investment plan across the U.S. and Israel, with ~$7 billion fully funded. Additionally, renewable growth opportunities in the U.S., including 1.9 GW of safe-harbored projects. Hadera Safe Harbored Basin Ranch Ramat Bek
Slide 6: Israel
Israel
Slide 7: Data Center Demand Creates Significant Growth Opportunities
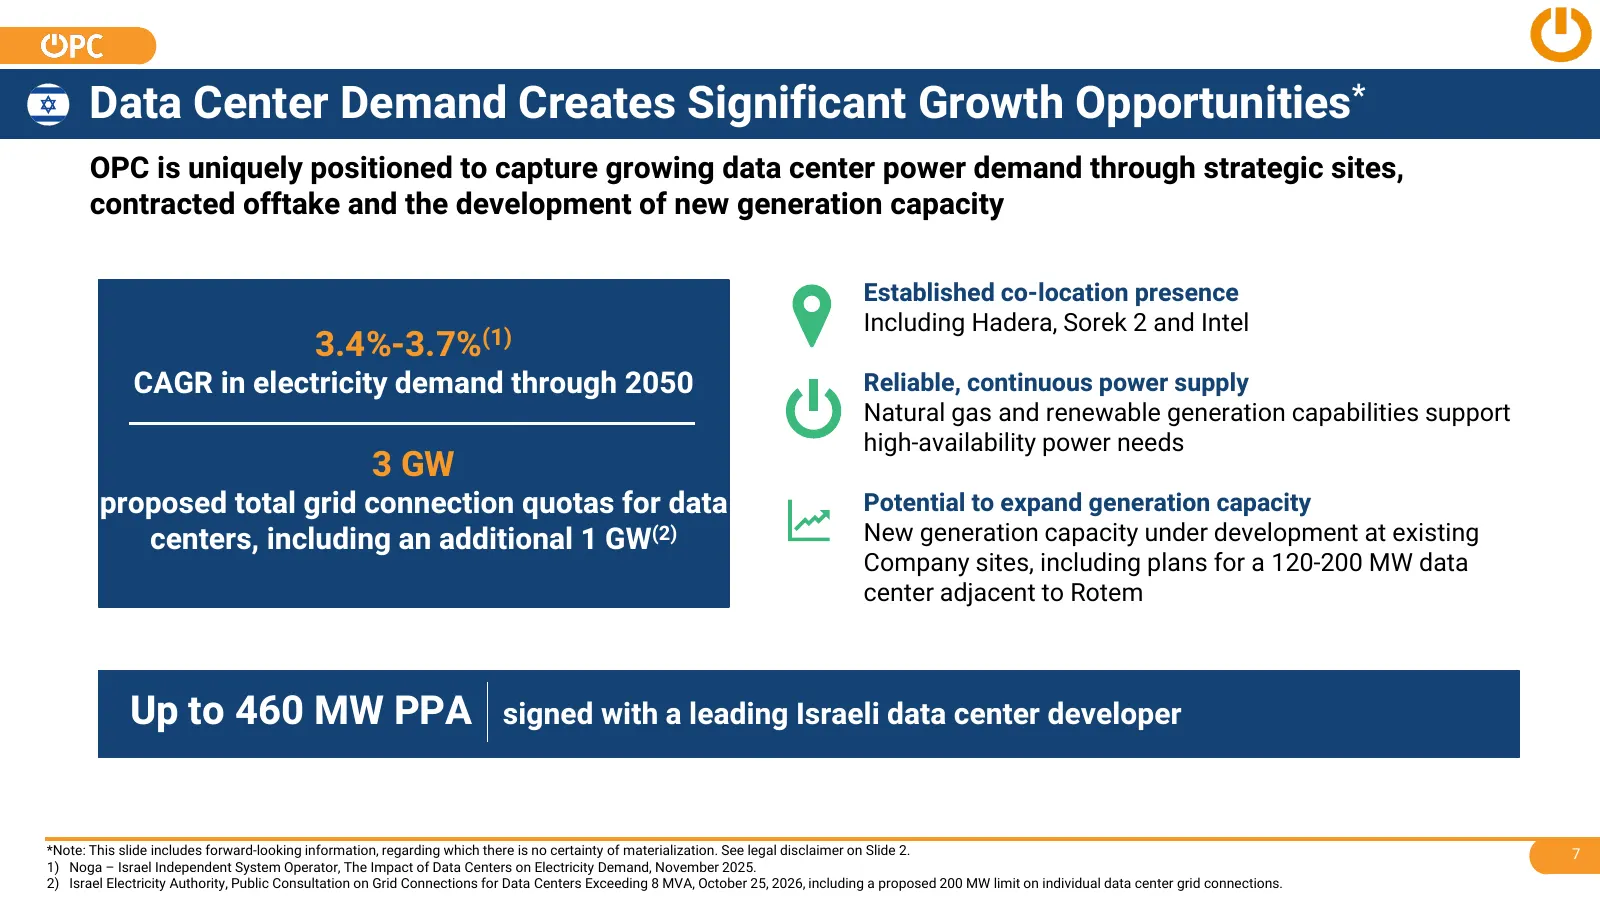
Data Center Demand Creates Significant Growth Opportunities* OPC is uniquely positioned to capture growing data center power demand through strategic sites, contracted offtake and the development of new generation capacity Established co-location presence Including Hadera, Sorek 2 and Intel 3.4%-3.7
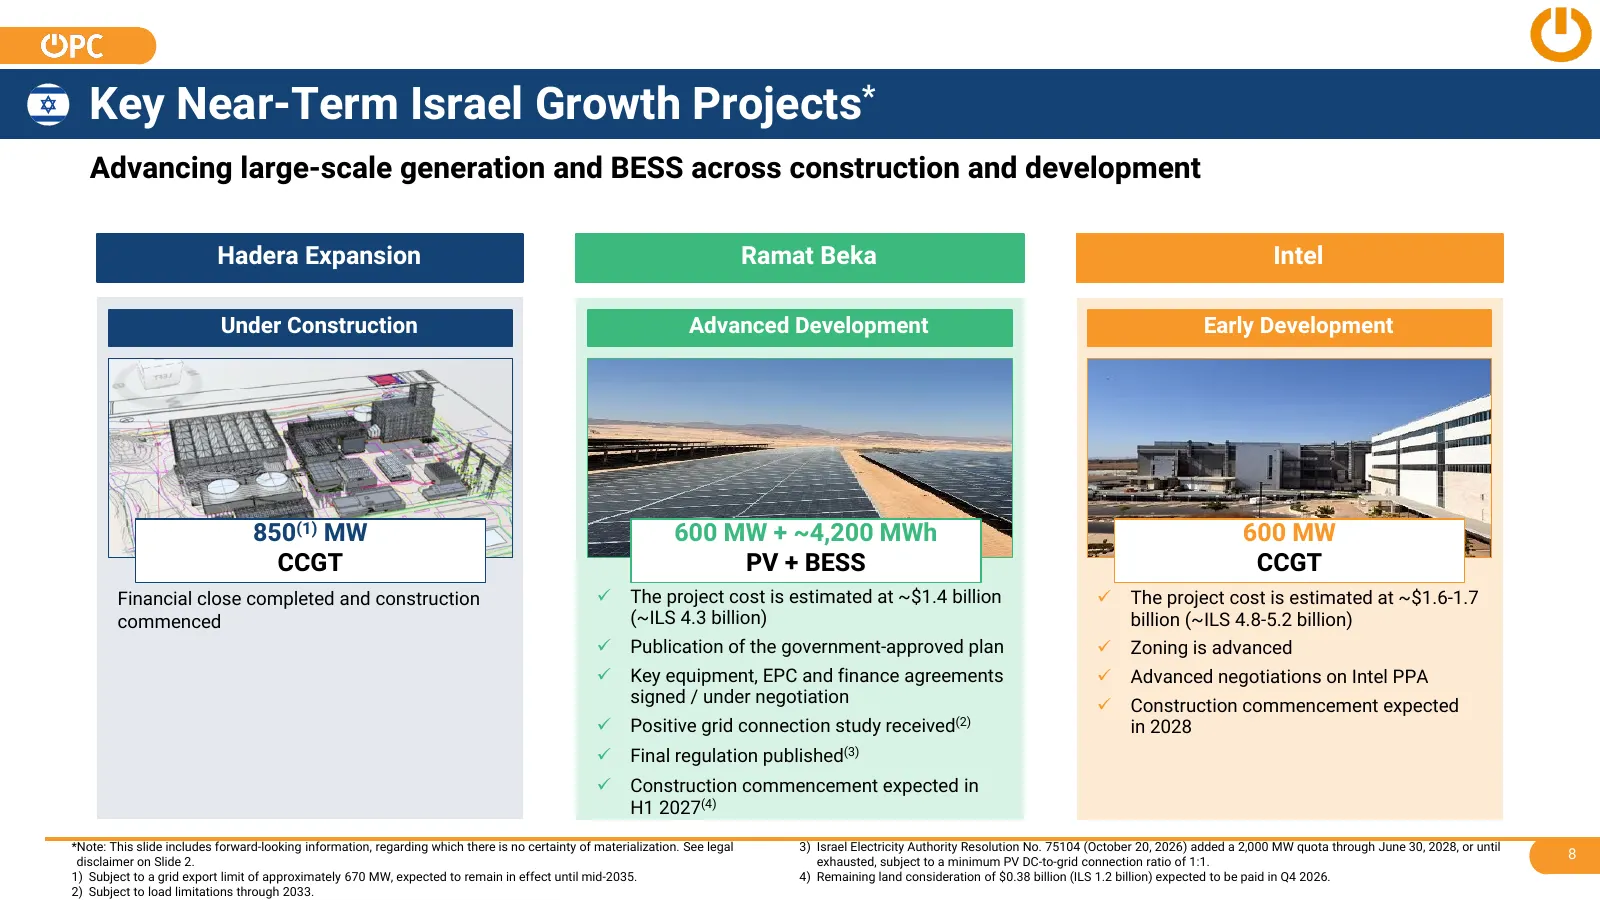
Slide 8: Key Near-Term Israel Growth Projects
Key Near-Term Israel Growth Projects* Advancing large-scale generation and BESS across construction and development Hadera Expansion Ramat Beka Intel Under Construction Advanced Development Early Development 850(1) MW 600 MW + ~4,200 MWh 600 MW CCGT PV + BESS CCGT Financial close completed and const
Slide 9: Competitive Power Ventures
Competitive Power Ventures
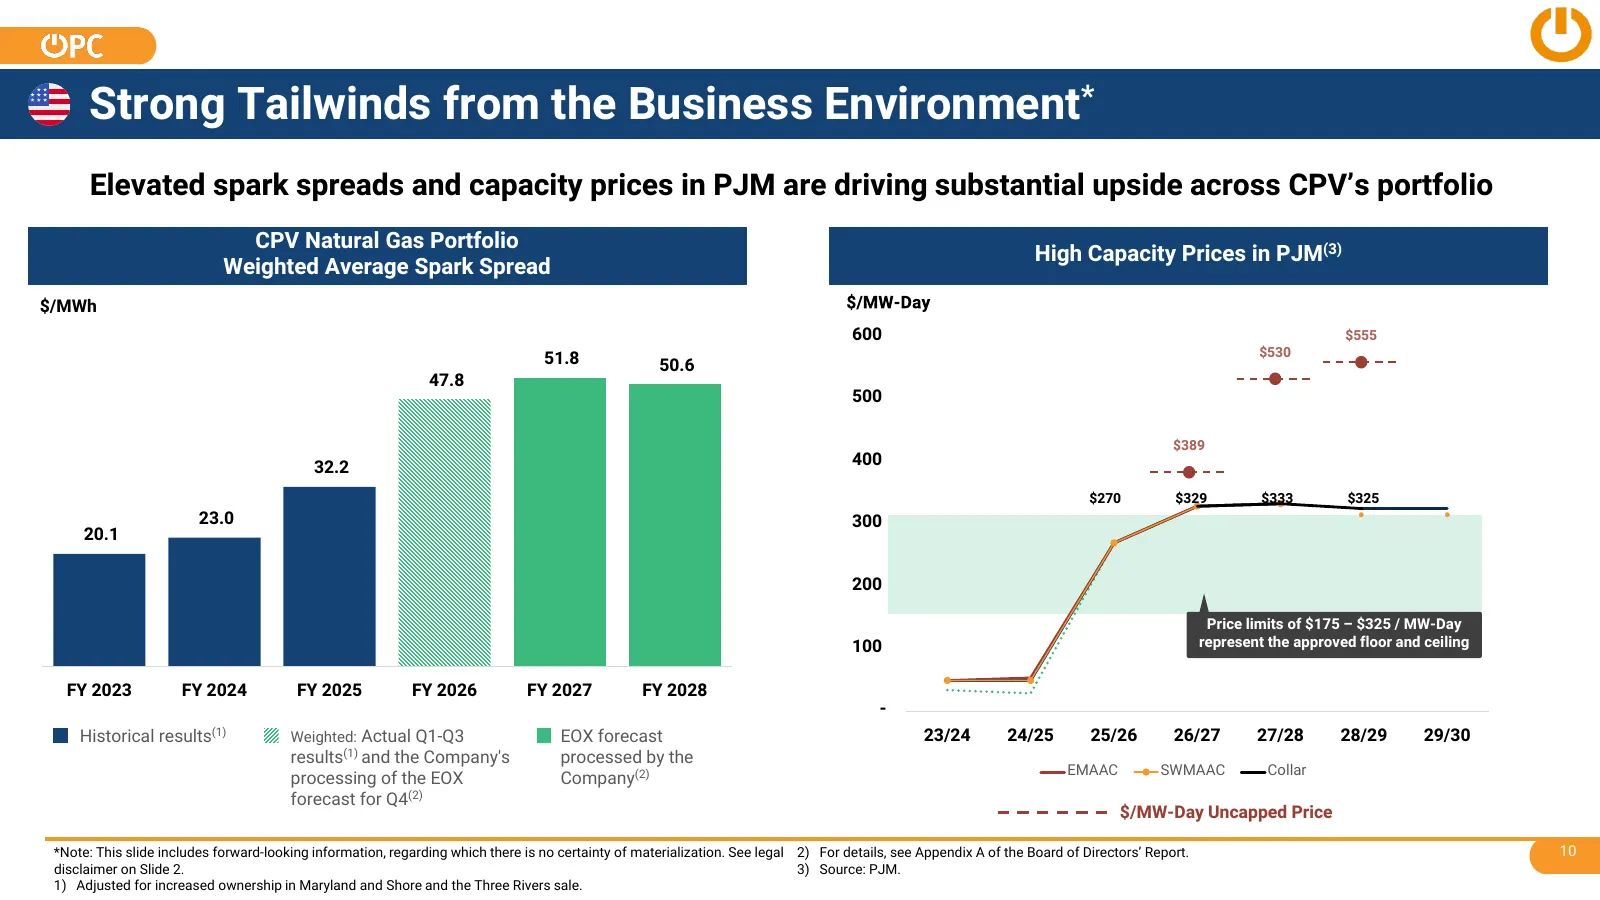
Slide 10: Strong Tailwinds from the Business Environment
Strong Tailwinds from the Business Environment* Elevated spark spreads and capacity prices in PJM are driving substantial upside across CPV’s portfolio CPV Natural Gas Portfolio High Capacity Prices in PJM(3) Weighted Average Spark Spread $/MWh 600 $555 $530 51.8 50.6 47.8 500 $389 32.2 400 $270 $32
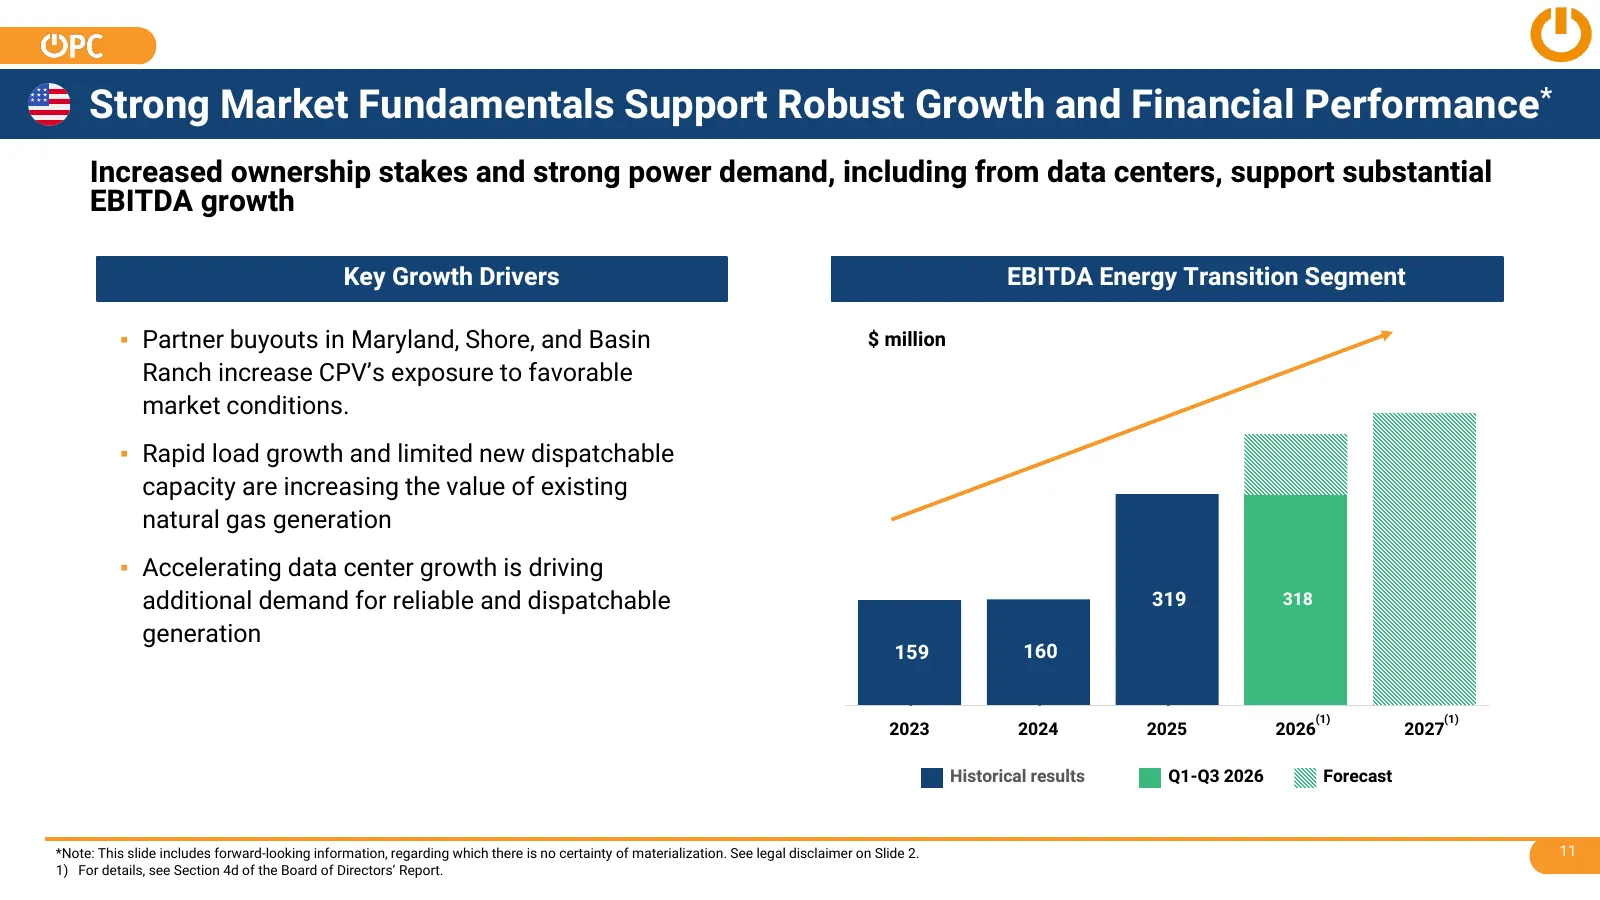
Slide 11: Strong Market Fundamentals Support Robust Growth and Financial Performance
Strong Market Fundamentals Support Robust Growth and Financial Performance* Increased ownership stakes and strong power demand, including from data centers, support substantial EBITDA growth Key Growth Drivers EBITDA Energy Transition Segment ▪ Partner buyouts in Maryland, Shore, and Basin $ million
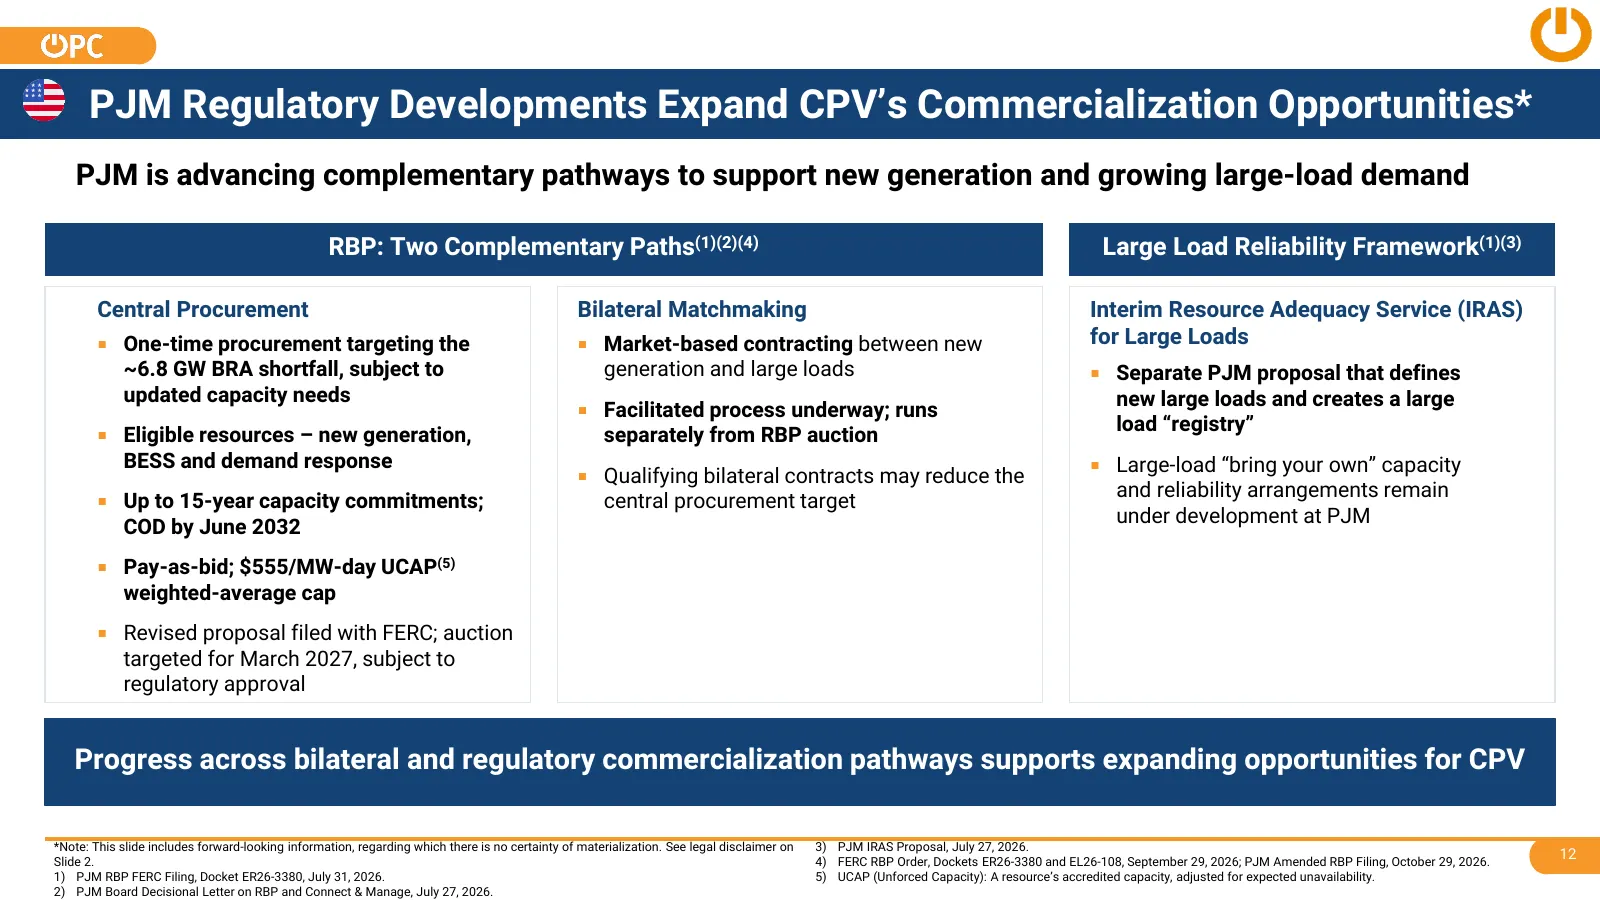
Slide 12: PJM Regulatory Developments Expand CPV's Commercialization Opportunities
PJM Regulatory Developments Expand CPV’s Commercialization Opportunities* PJM is advancing complementary pathways to support new generation and growing large-load demand RBP: Two Complementary Paths(1)(2)(4) Large Load Reliability Framework(1)(3) Central Procurement Bilateral Matchmaking Interim Res
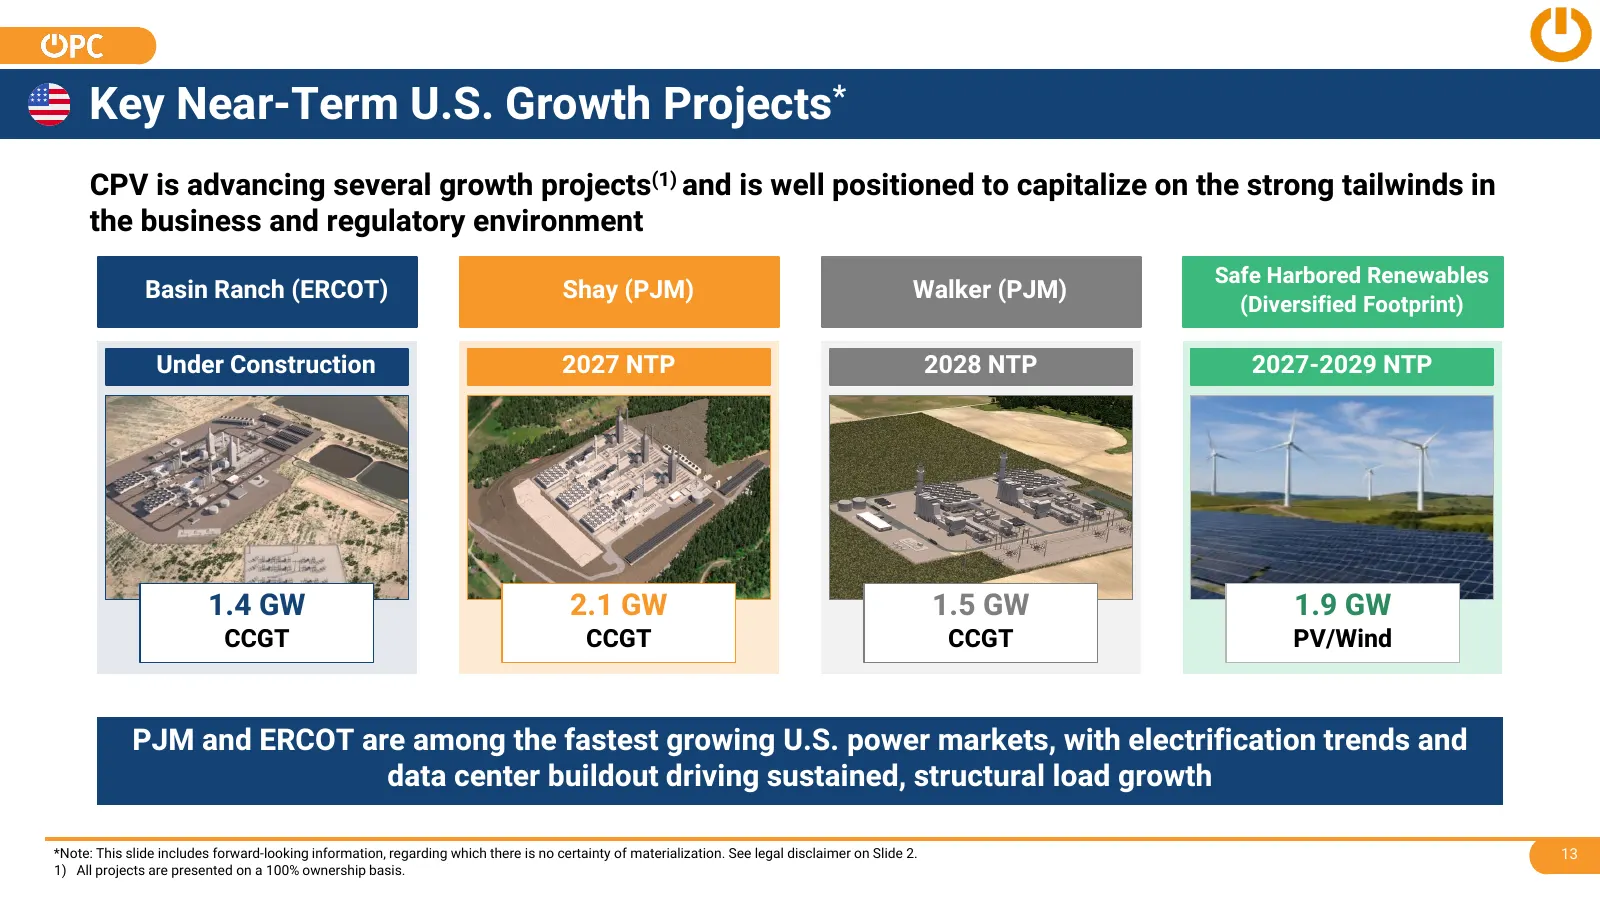
Slide 13: Key Near-Term U.S. Growth Projects
Key Near-Term U.S. Growth Projects* CPV is advancing several growth projects(1) and is well positioned to capitalize on the strong tailwinds in the business and regulatory environment Safe Harbored Renewables Basin Ranch (ERCOT) Shay (PJM) Walker (PJM) (Diversified Footprint) Under Construction 2027
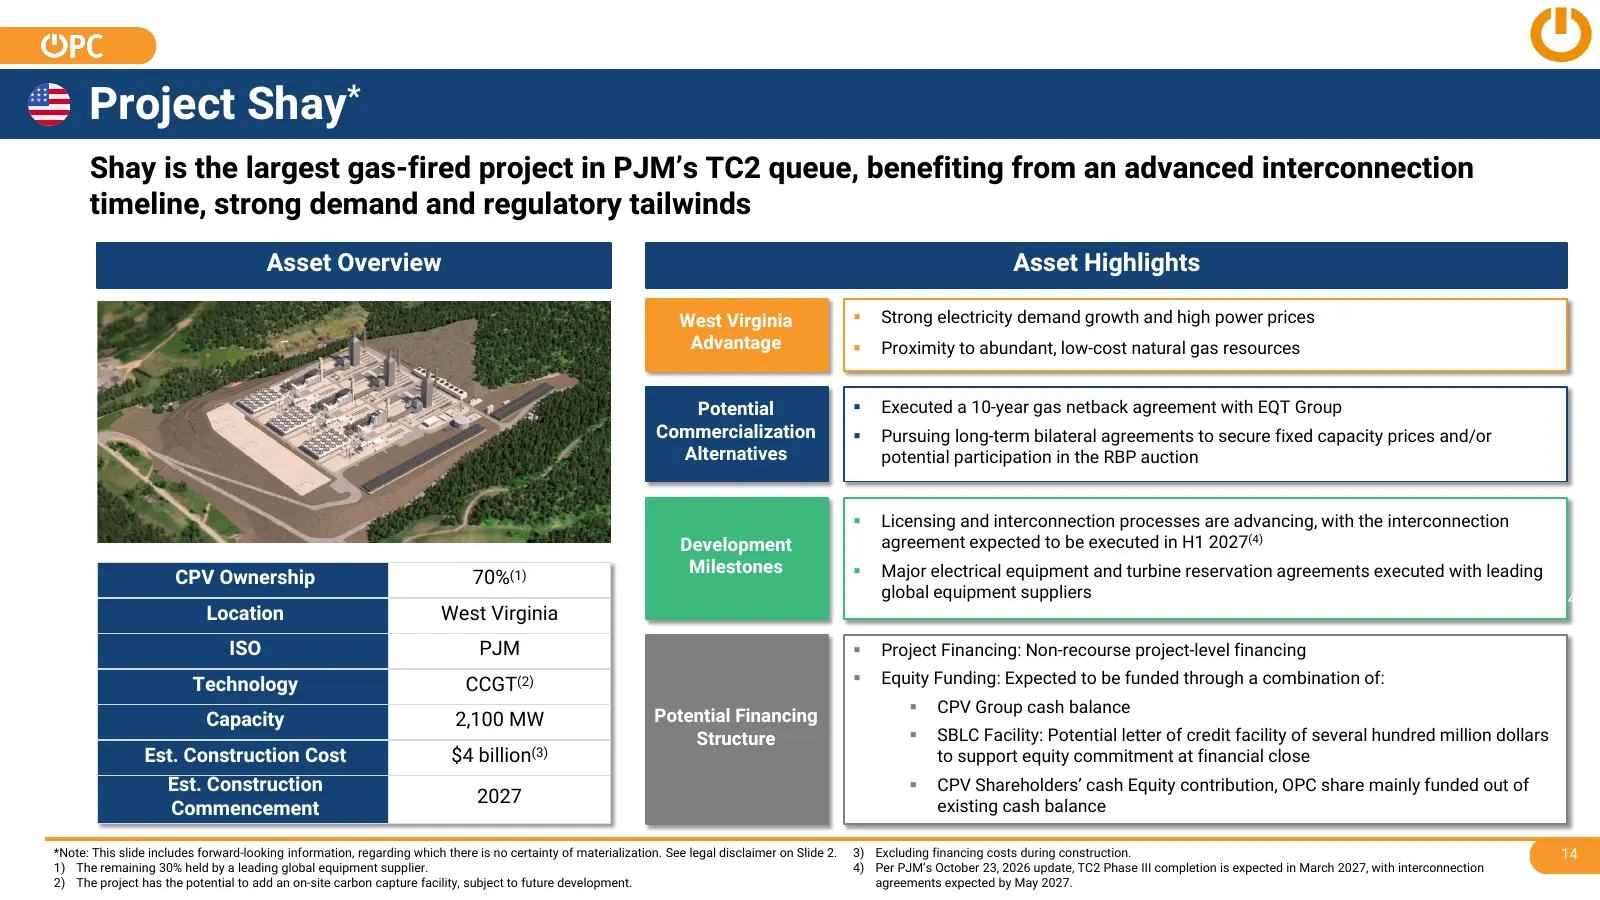
Slide 14: Project Shay
Project Shay* Shay is the largest gas-fired project in PJM’s TC2 queue, benefiting from an advanced interconnection timeline, strong demand and regulatory tailwinds Asset Overview Asset Highlights West Virginia Strong electricity demand growth and high power prices Advantage Proximity to abundan
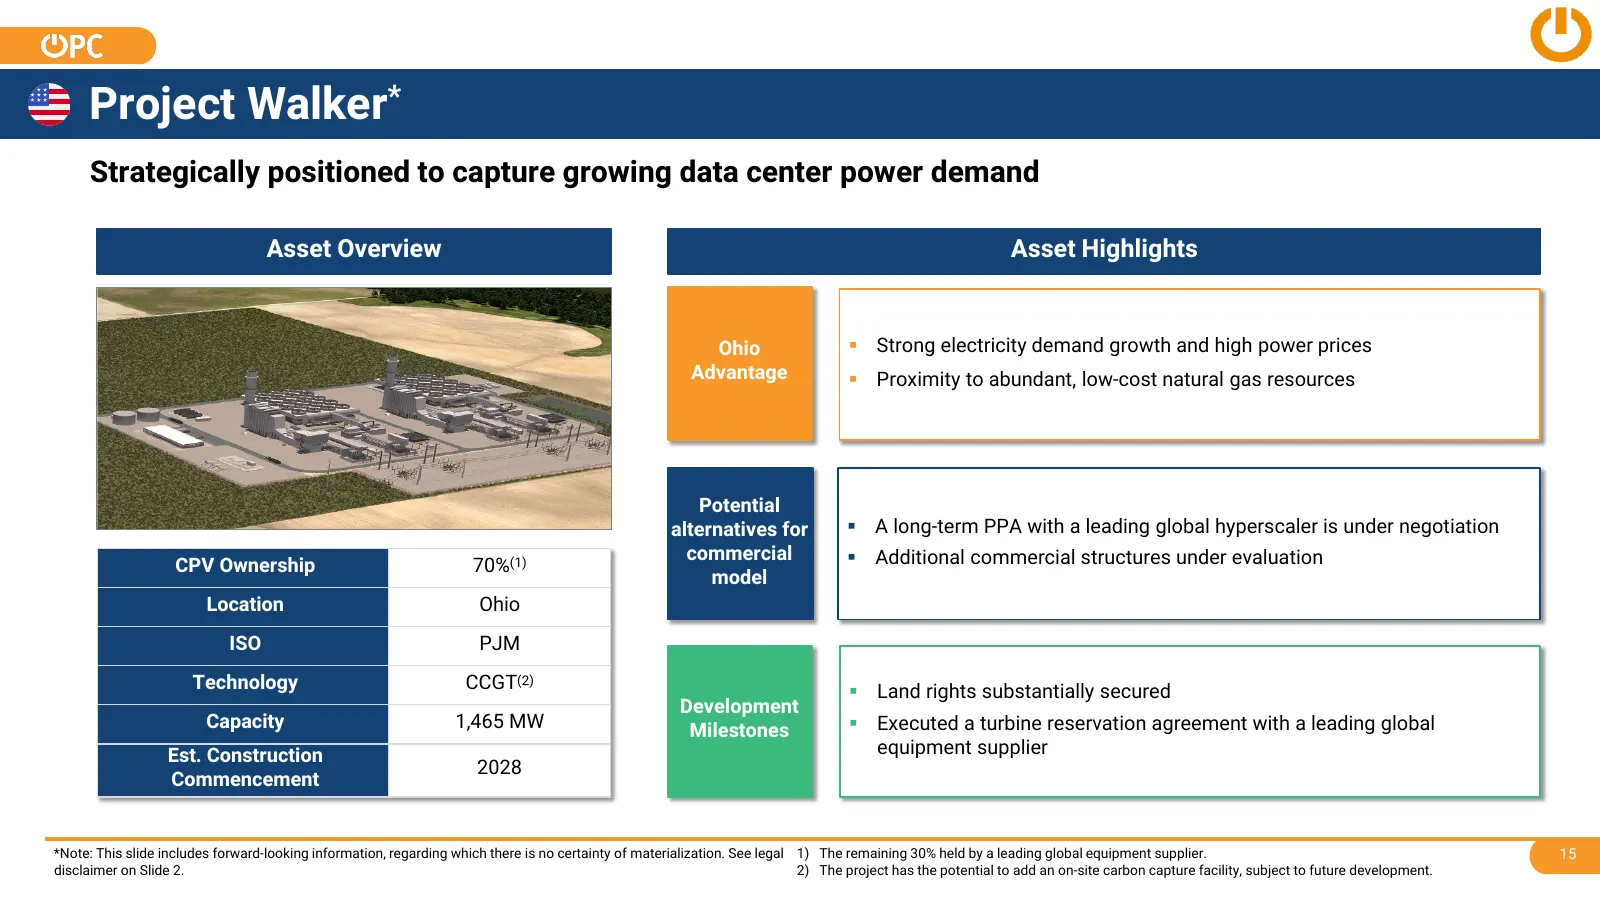
Slide 15: Project Walker
Project Walker* Strategically positioned to capture growing data center power demand Asset Overview Asset Highlights Ohio Strong electricity demand growth and high power prices Advantage Proximity to abundant, low-cost natural gas resources Potential alternatives for A long-term PPA with a lea
Slide 16: Financials
Financials
Slide 17: EBITDA – Israel Segment
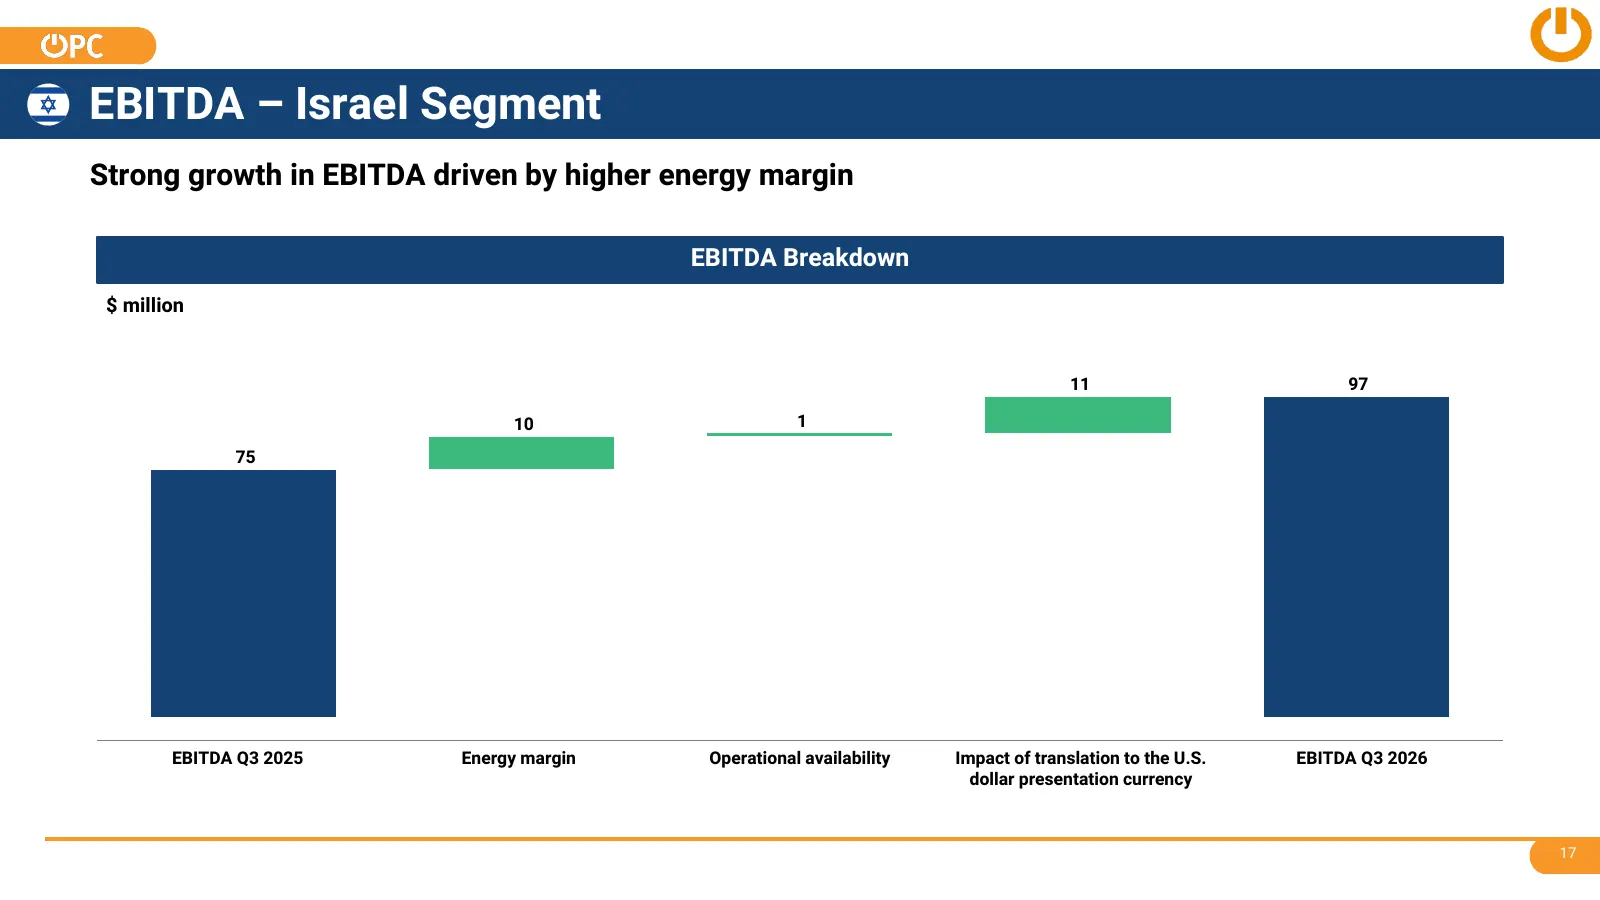
EBITDA – Israel Segment Strong growth in EBITDA driven by higher energy margin EBITDA Breakdown $ million 11 97 10 1 75 EBITDA Q3 2025 Energy margin Operational availability Impact of translation to the U.S. EBITDA Q3 2026 dollar presentation currency 17
Slide 18: EBITDA – Energy Transition Segment
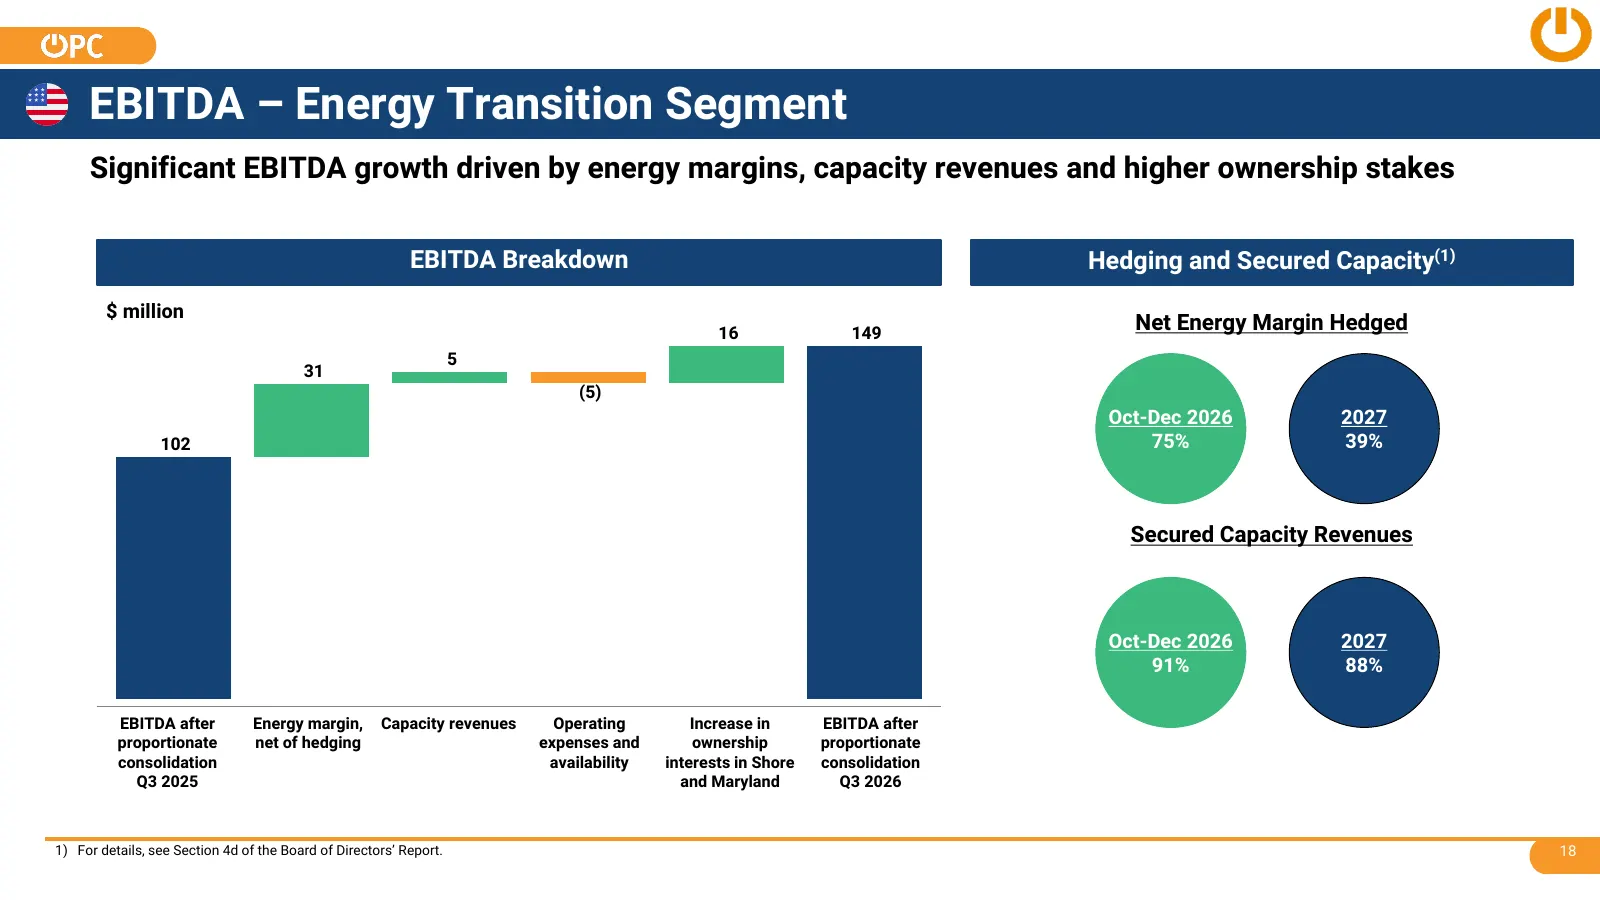
EBITDA – Energy Transition Segment Significant EBITDA growth driven by energy margins, capacity revenues and higher ownership stakes EBITDA Breakdown Hedging and Secured Capacity(1) $ million 16 149 Net Energy Margin Hedged 5 31 (5) Oct-Dec 2026 2027 102 75% 39% Secured Capacity Revenues Oct-Dec 202
Slide 19: EBITDA – Renewable Energy Segment
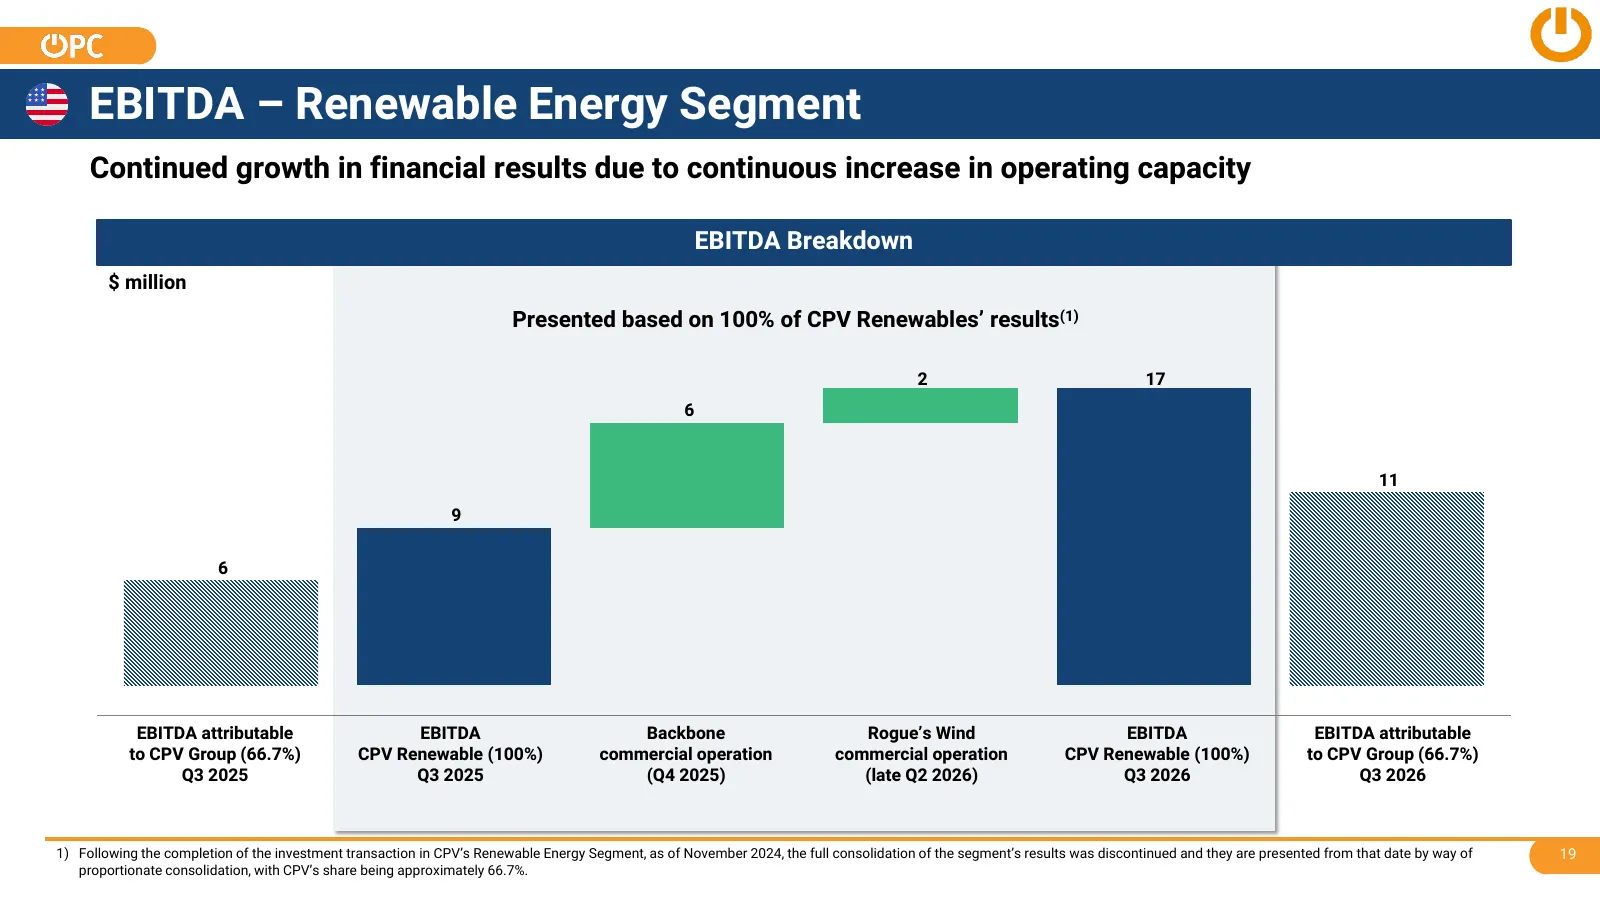
EBITDA – Renewable Energy Segment Continued growth in financial results due to continuous increase in operating capacity EBITDA Breakdown $ million Presented based on 100% of CPV Renewables’ results(1) 2 17 6 11 9 6 EBITDA attributable EBITDA Backbone Rogue’s Wind EBITDA EBITDA attributable to CPV G
Slide 20: Consolidated Net Income
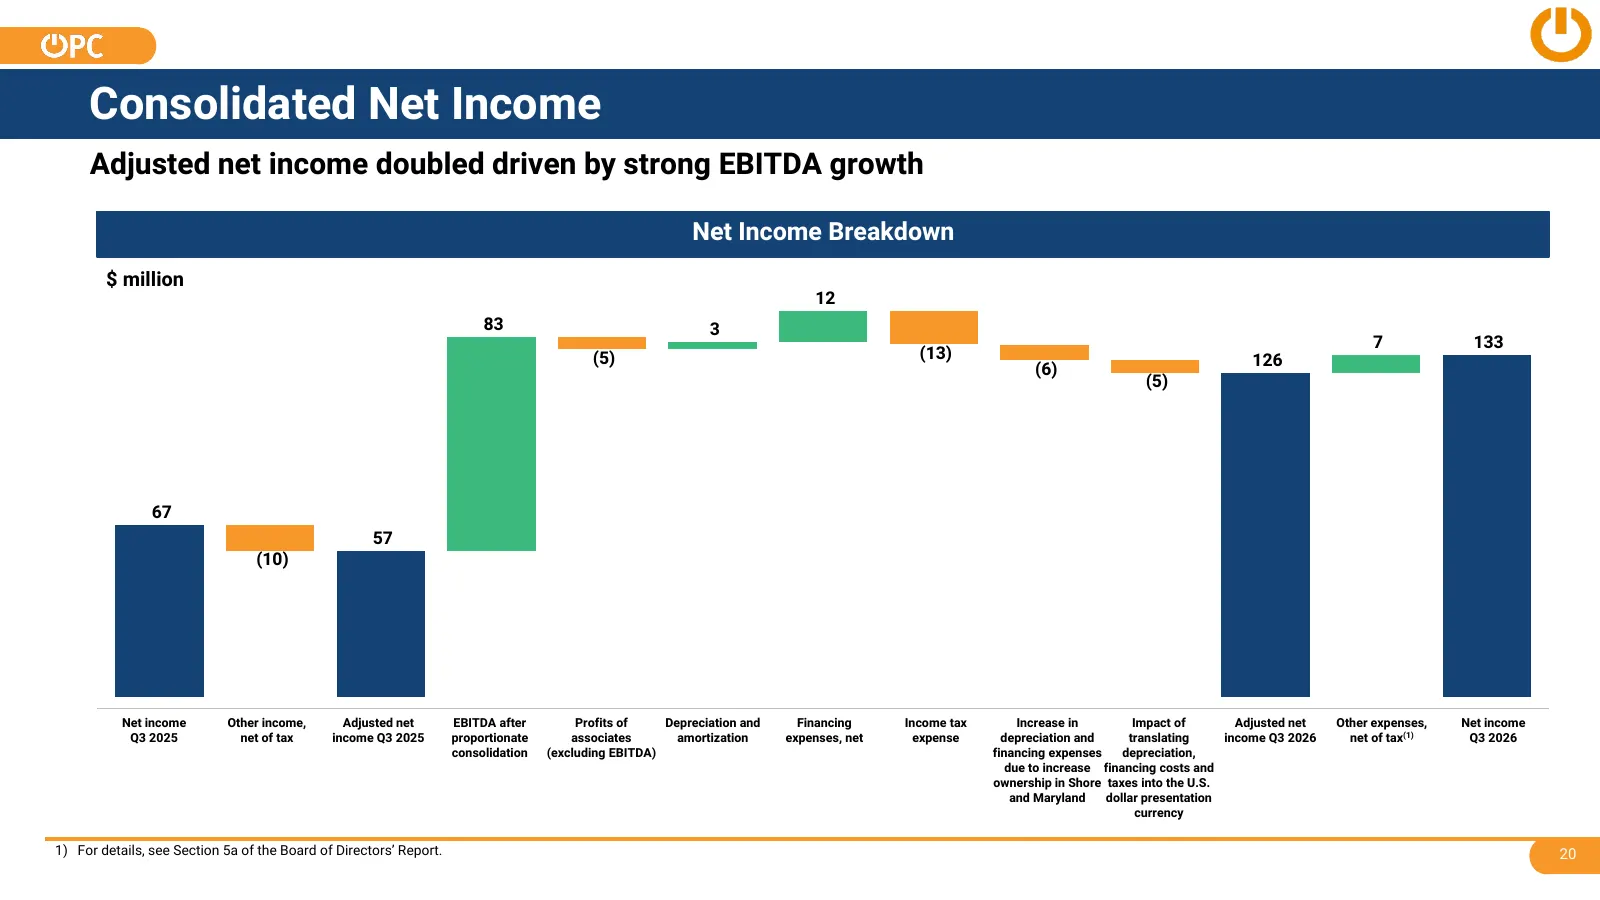
Consolidated Net Income Adjusted net income doubled driven by strong EBITDA growth Net Income Breakdown $ million 12 83 3 7 133 (5) (13) 126 (6) (5) 67 57 (10) Net income Other income, Adjusted net EBITDA after Profits of Depreciation and Financing Income tax Increase in Impact of Adjusted net Other
Slide 21: Diversified Funding Sources and Financial Flexibility Support Continued Growth
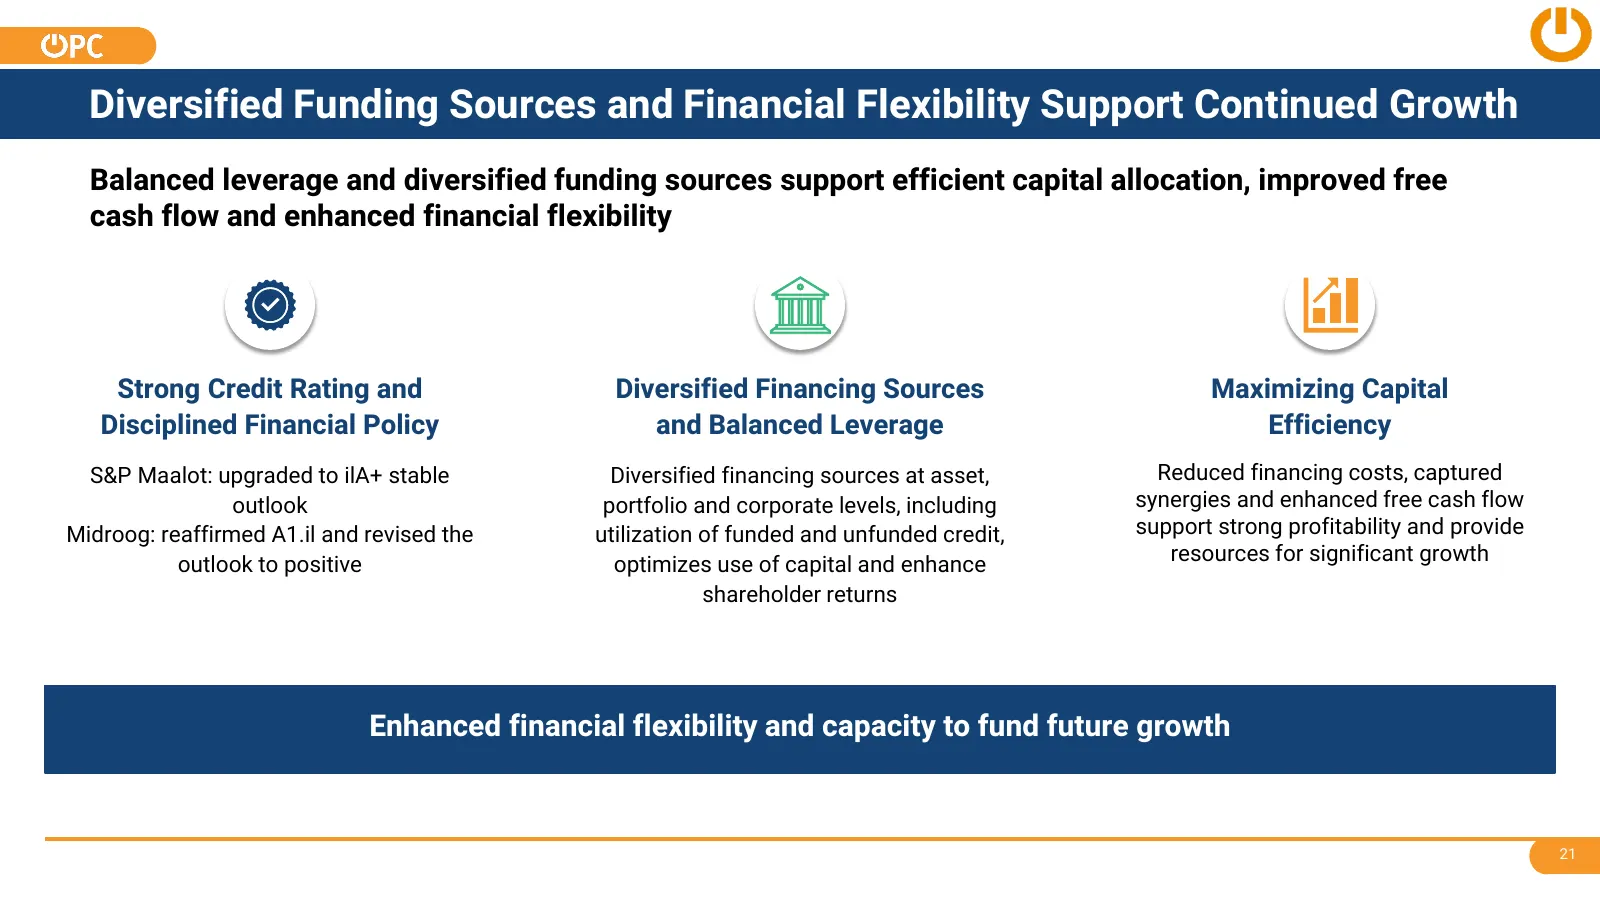
Diversified Funding Sources and Financial Flexibility Support Continued Growth Balanced leverage and diversified funding sources support efficient capital allocation, improved free cash flow and enhanced financial flexibility Strong Credit Rating and Diversified Financing Sources Maximizing Capital
Slide 22: Disciplined Financial Policy Supporting Long-Term Growth
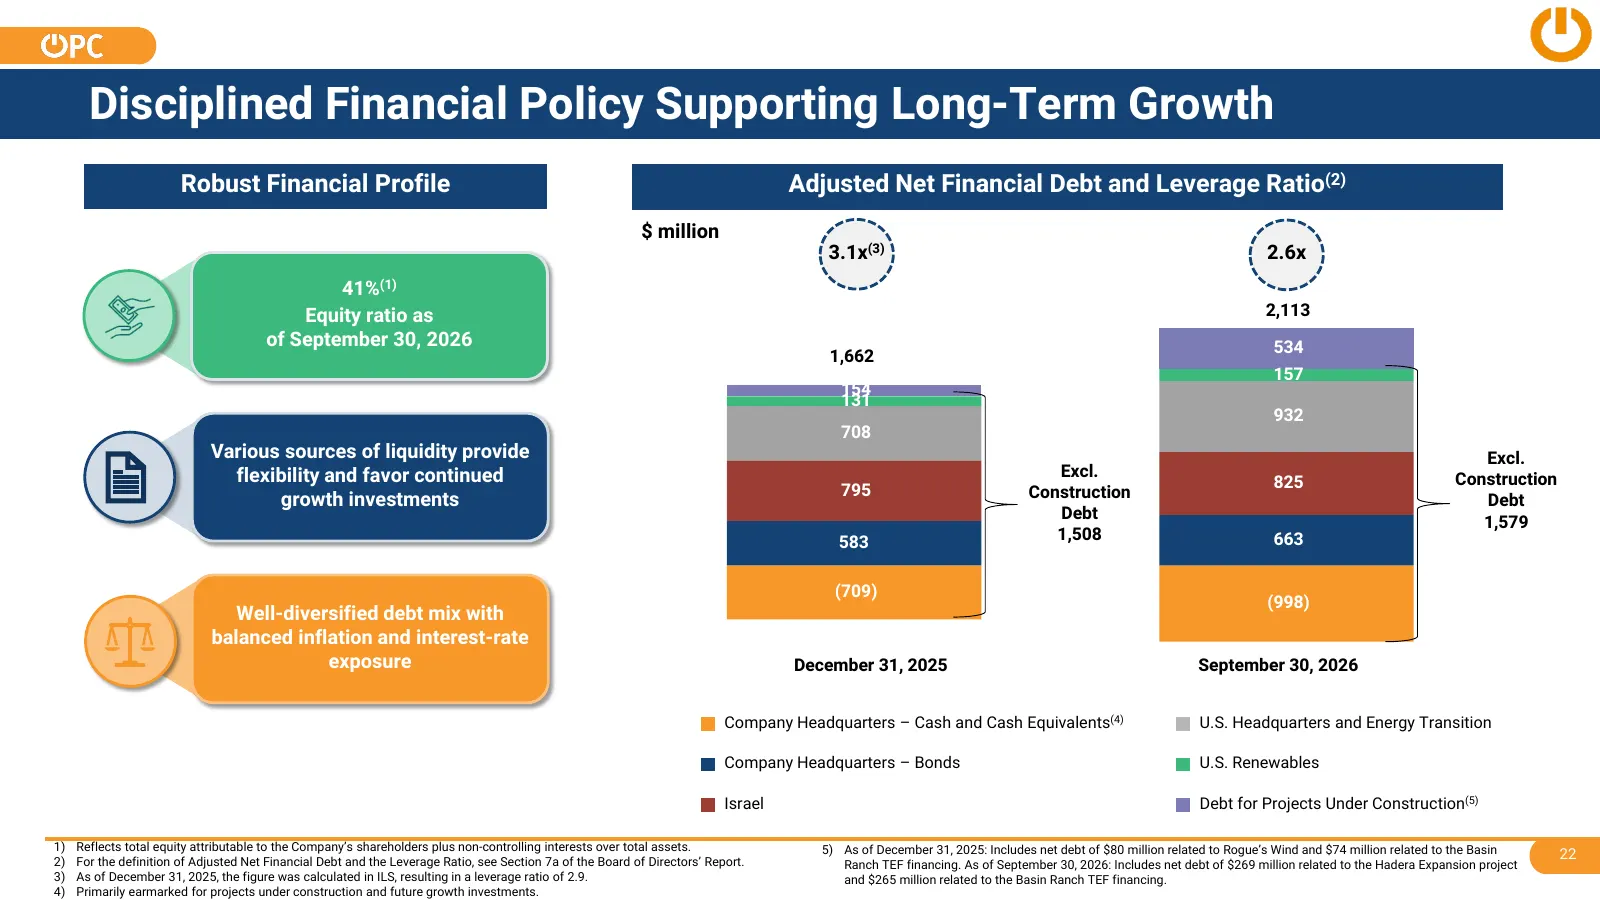
Disciplined Financial Policy Supporting Long-Term Growth Robust Financial Profile Adjusted Net Financial Debt and Leverage Ratio(2) $ million 3.1x(3) 2.6x 41%(1) Equity ratio as 2,113 of September 30, 2026 534 1,662 157 154 131 932 708 Various sources of liquidity provide Excl. flexibility and favor
Slide 23: Appendix A – Portfolio
OPc Appendix A — Portfolio
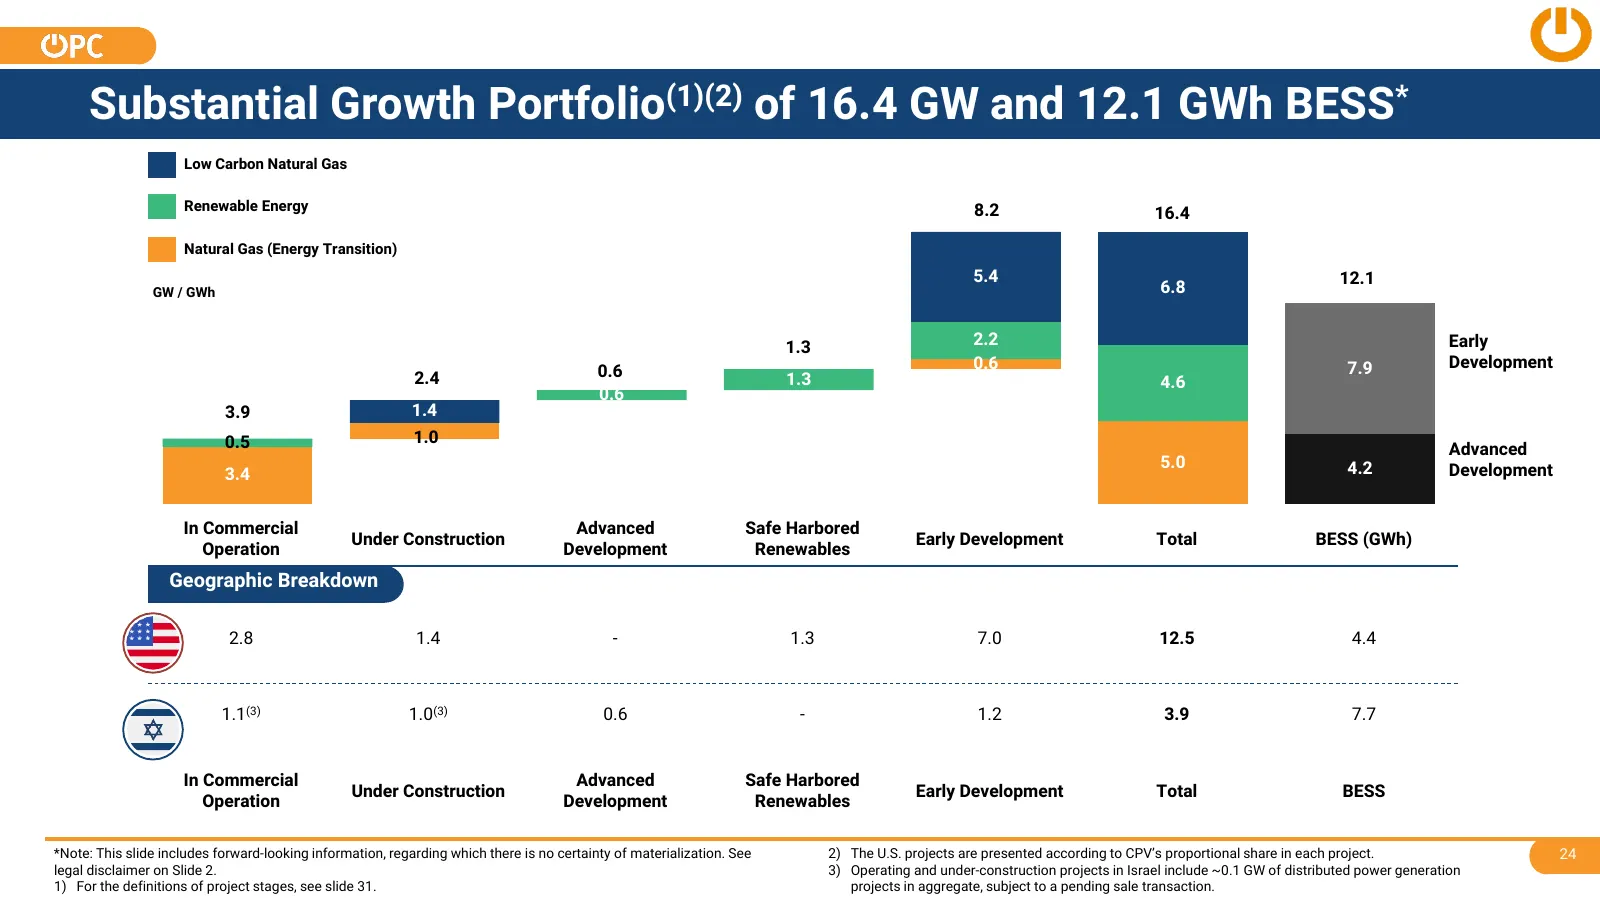
Slide 24: Substantial Growth Portfolio of 16.4 GW and 12.1 GWh BESS
Substantial Growth Portfolio(1)(2) of 16.4 GW and 12.1 GWh BESS* Low Carbon Natural Gas Renewable Energy 8.2 16.4 Natural Gas (Energy Transition) 5.4 12.1 GW / GWh 6.8 1.3 2.2 Early 0.6 0.6 7.9 Development 2.4 1.3 4.6 0.6 3.9 1.4 0.5 1.0 8.1 6.3 6.9 Advanced 5.0 4.2 Development 3.4 In Commercial Adv
Slide 25: Appendix B – Key Events
2) — iS S Lu > cy x IX Append
Slide 26: Key Business Events in Israel
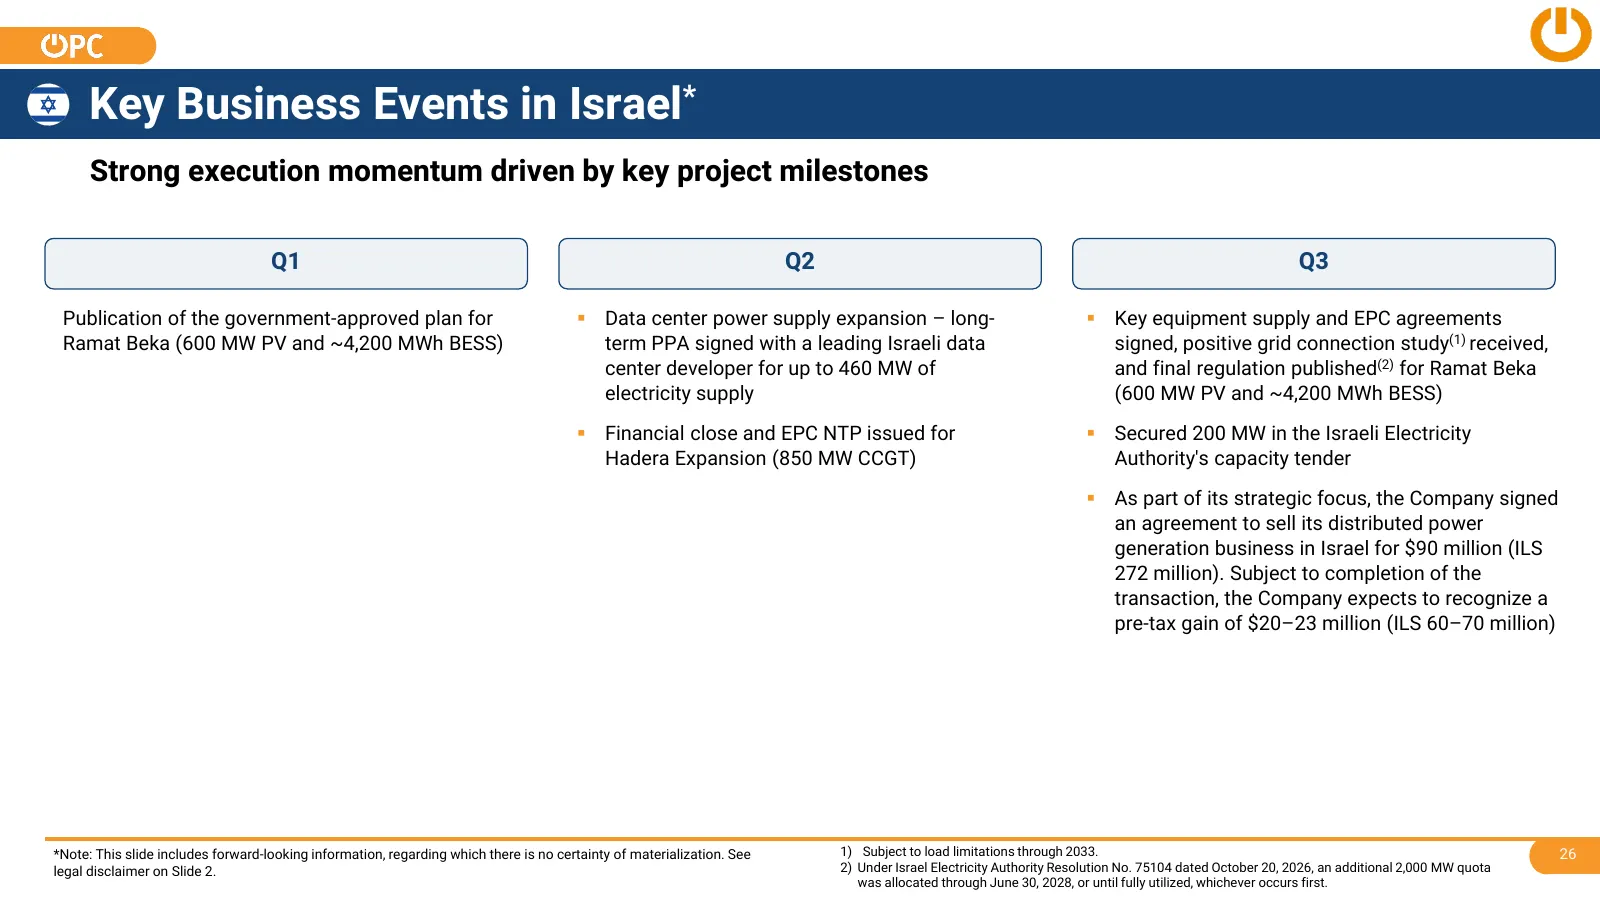
Key Business Events in Israel* Strong execution momentum driven by key project milestones Q1 Q2 Q3 Publication of the government-approved plan for Data center power supply expansion – long- Key equipment supply and EPC agreements Ramat Beka (600 MW PV and ~4,200 MWh BESS) term PPA signed with a
Slide 27: Key Business Events in the U.S.
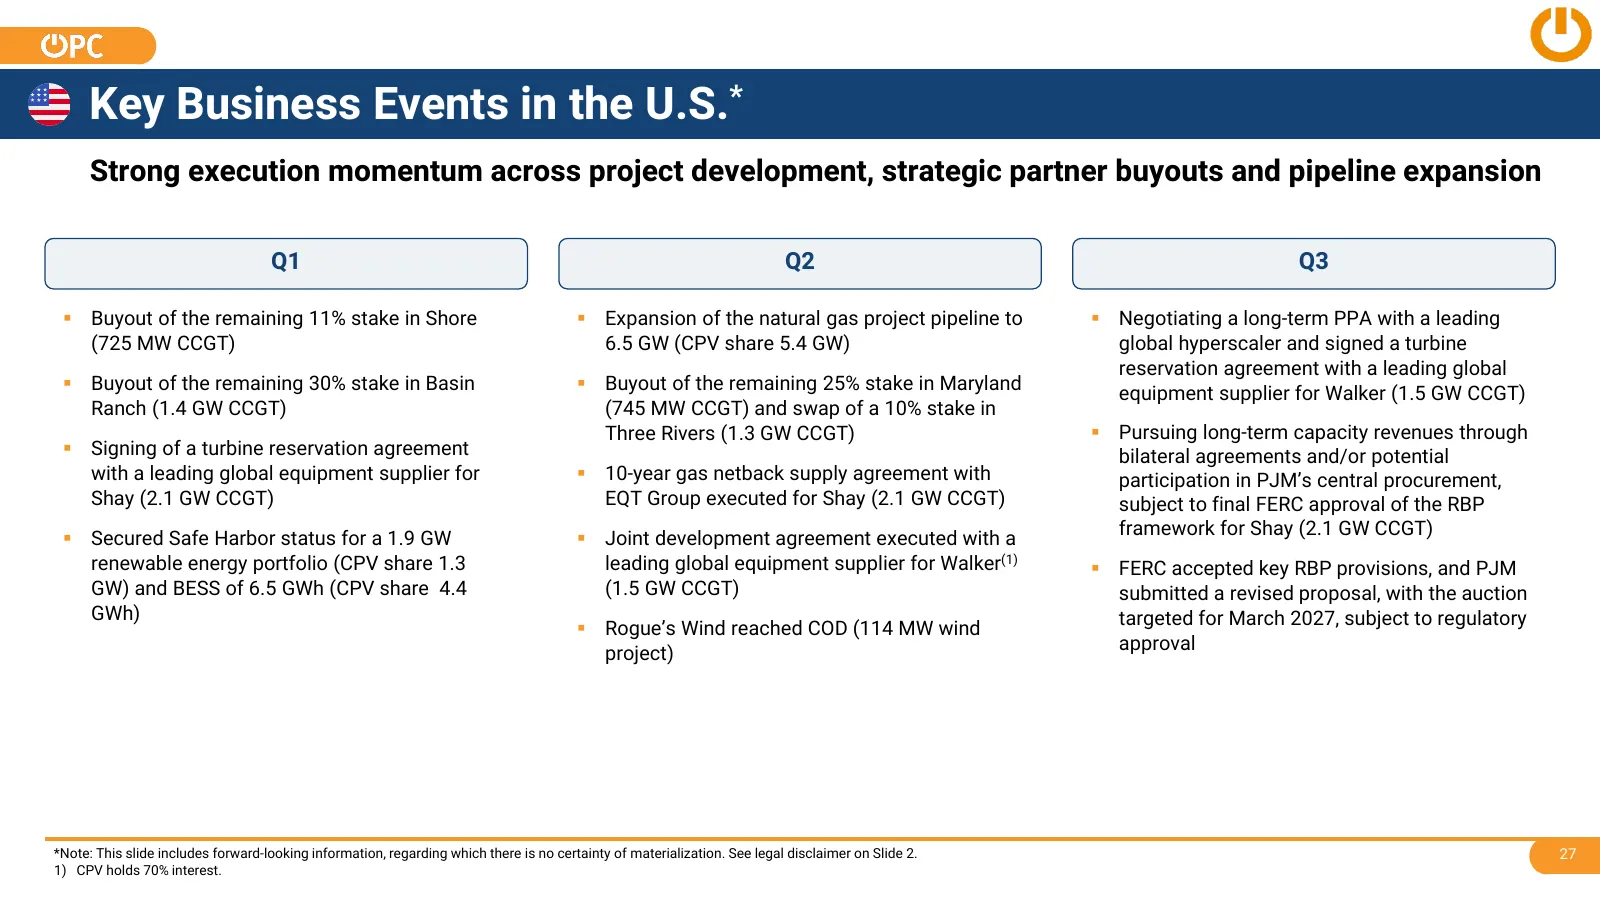
Key Business Events in the U.S.* Strong execution momentum across project development, strategic partner buyouts and pipeline expansion Q1 Q2 Q3 Buyout of the remaining 11% stake in Shore Expansion of the natural gas project pipeline to Negotiating a long-term PPA with a leading (725 MW CCGT)
Slide 28: Key Financial Events
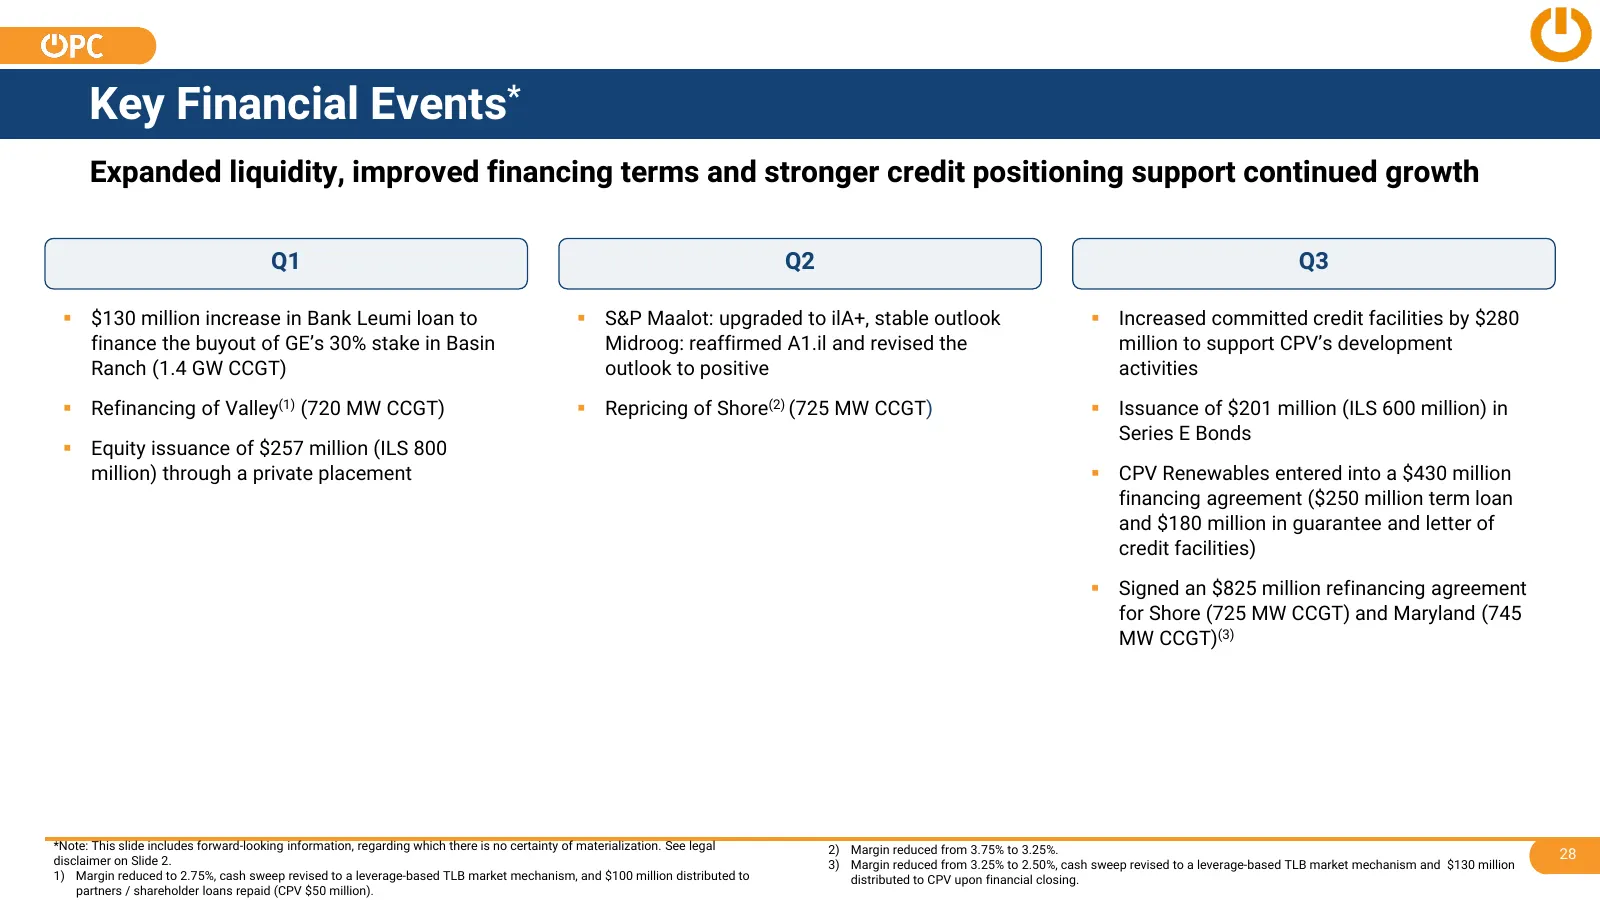
Key Financial Events* Expanded liquidity, improved financing terms and stronger credit positioning support continued growth Q1 Q2 Q3 $130 million increase in Bank Leumi loan to S&P Maalot: upgraded to ilA+, stable outlook Increased committed credit facilities by $280 finance the buyout of GE’s
Slide 29: Appendix C – Key Definitions
Appendix C – Key Definitions
Slide 30: Key Definitions
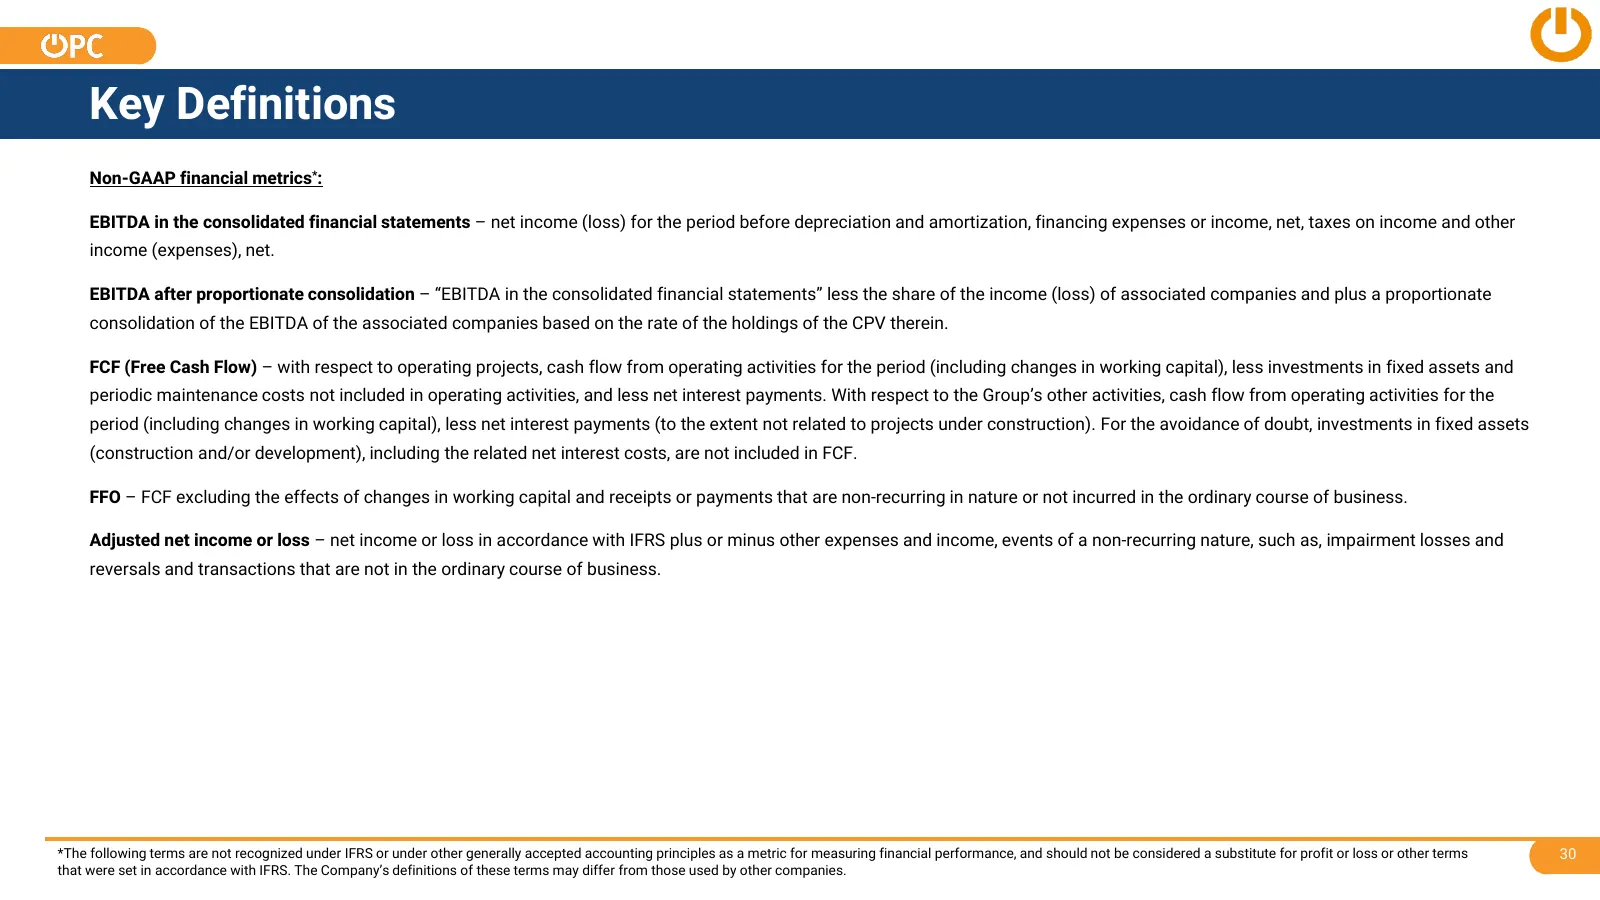
Key Definitions Non-GAAP financial metrics*: EBITDA in the consolidated financial statements – net income (loss) for the period before depreciation and amortization, financing expenses or income, net, taxes on income and other income (expenses), net. EBITDA after proportionate consolidation – “EBITD
Slide 31: Key Definitions (Cont'd)
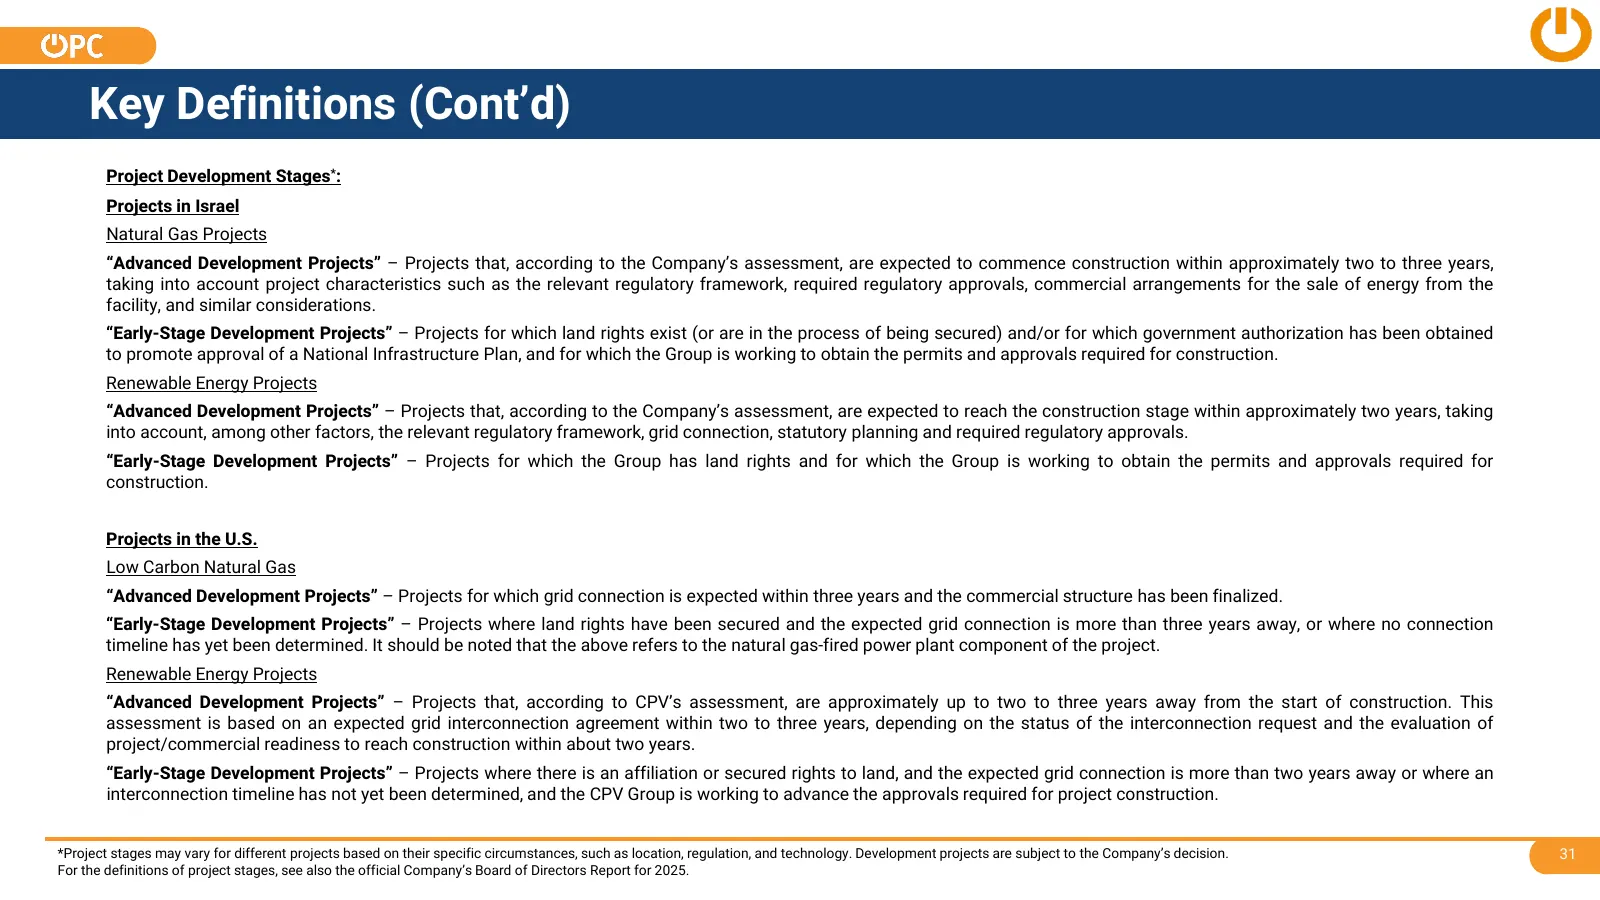
Key Definitions (Cont’d) Project Development Stages*: Projects in Israel Natural Gas Projects “Advanced Development Projects” – Projects that, according to the Company’s assessment, are expected to commence construction within approximately two to three years, taking into account project characteris
Slide 32: Thank You!
OPCENERGY ENERGY Thank You!
Source: 6ix earnings call