Barratt Redrow plc · LSE:BTRW
Barratt Redrow — Barratt Developments — FY2019 Earnings Presentation
62 slides from Barratt Redrow's earnings presentation, Sep 4, 2019
Slide 1: Results Presentation: Year ended 30 June 2019
RESULTS PRESENTATION Year ended 30 June 2019 4 September 2019 Tarleton Lock, Tarleton 1
Slide 2: David Thomas, Chief Executive
David Thomas Chief Executive Sandpiper Walk, West Wittering 2
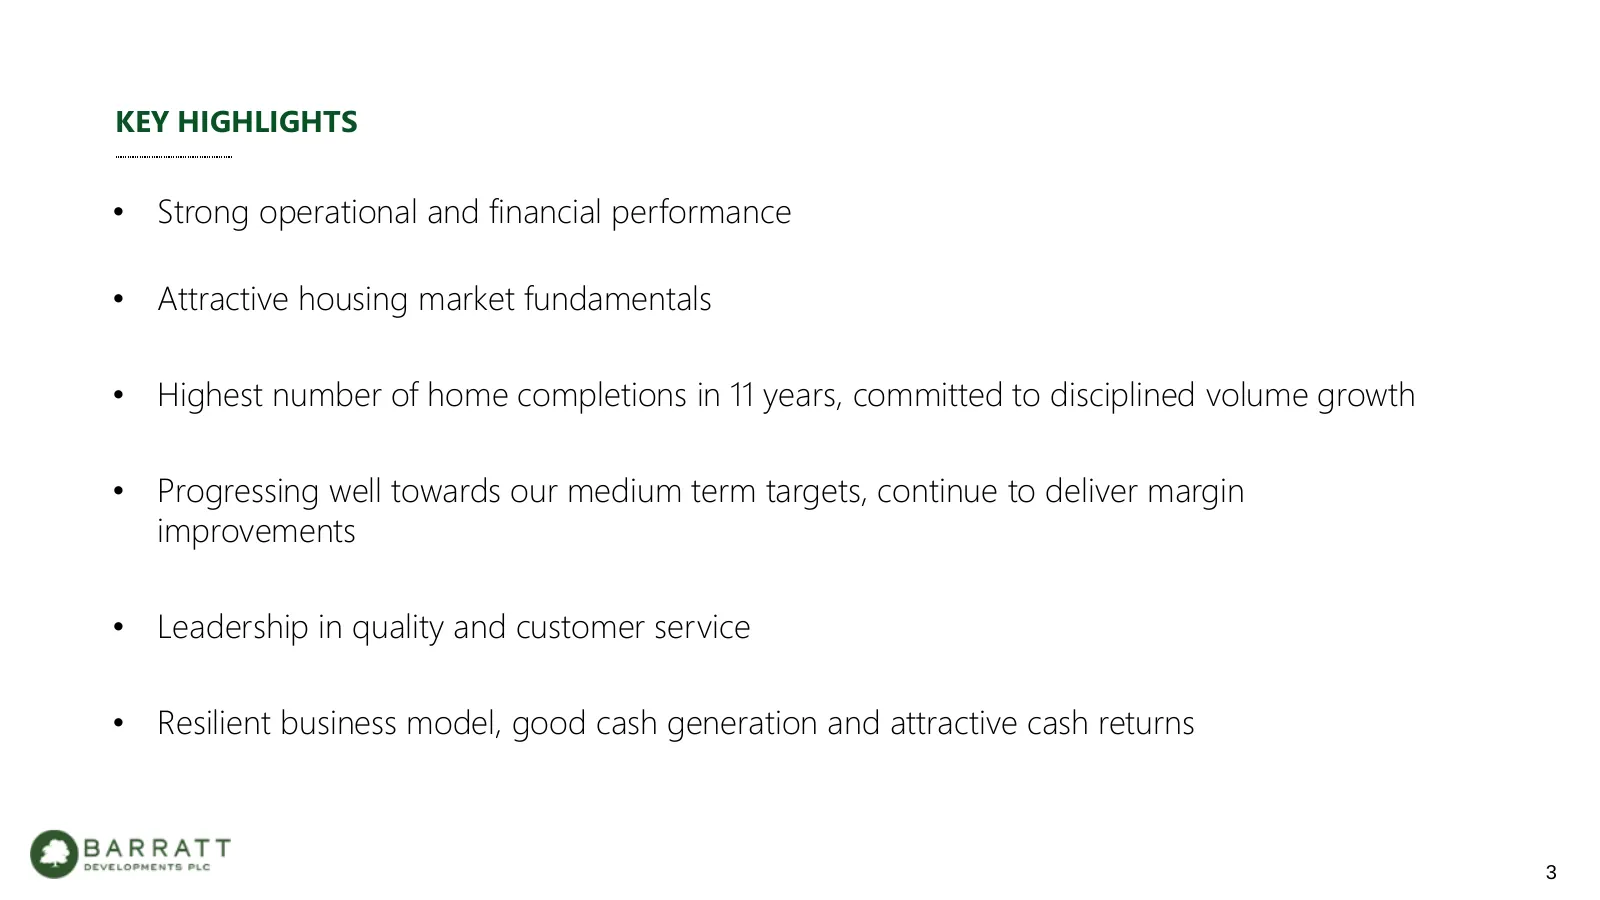
Slide 3: Key Highlights
KEY HIGHLIGHTS • Strong operational and financial performance • Attractive housing market fundamentals • Highest number of home completions in 11 years, committed to disciplined volume growth • Progressing well towards our medium term targets, continue to deliver margin improvements • Leadership in
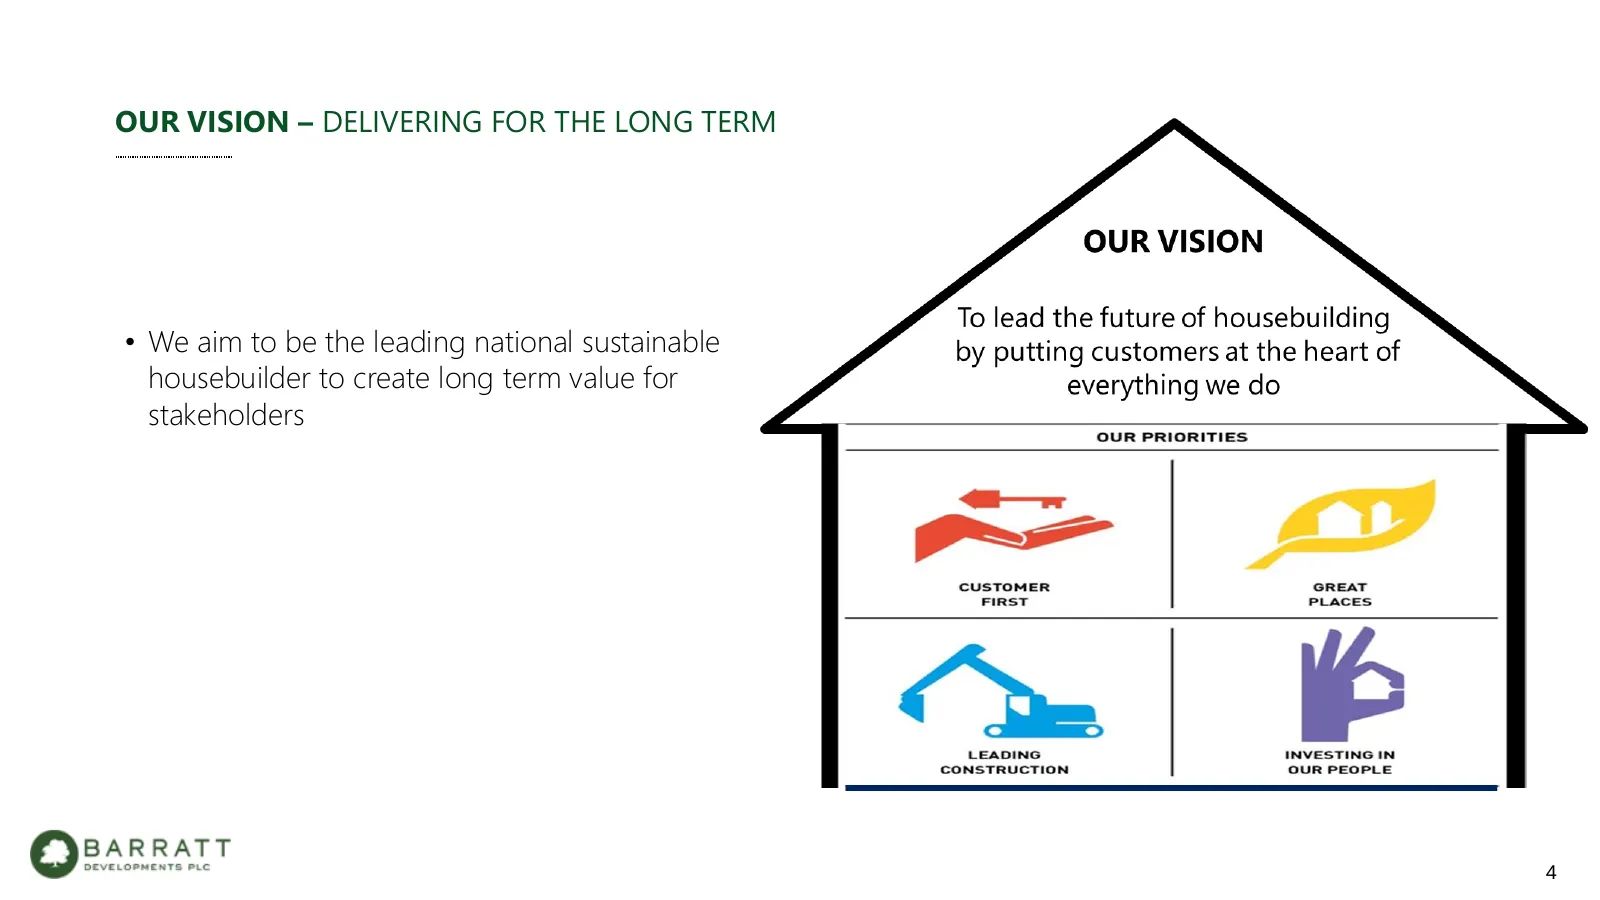
Slide 4: Our Vision – Delivering for the Long Term
OUR VISION – DELIVERING FOR THE LONG TERM • We aim to be the leading national sustainable housebuilder to create long term value for stakeholders 4
Slide 5: Investment Proposition
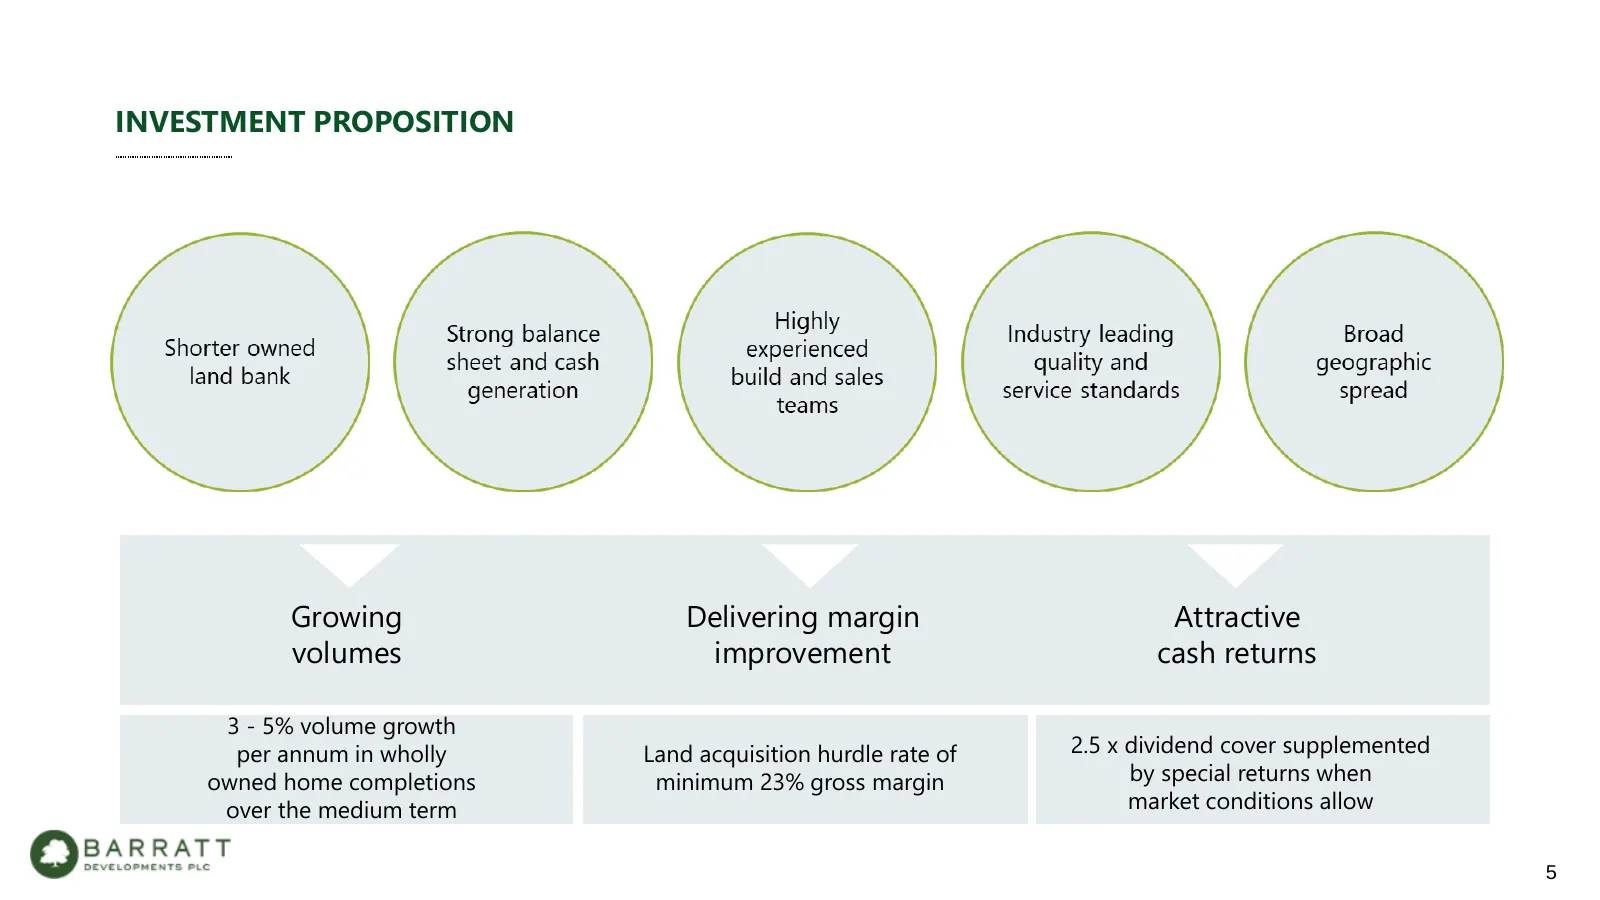
INVESTMENT PROPOSITION Growing Delivering margin Attractive volumes improvement cash returns 3 - 5% volume growth per annum in wholly Land acquisition hurdle rate of 2.5 x dividend cover supplemented owned home completions minimum 23% gross margin by special returns when over the medium term market
Slide 6: Operational Targets – Progress Update
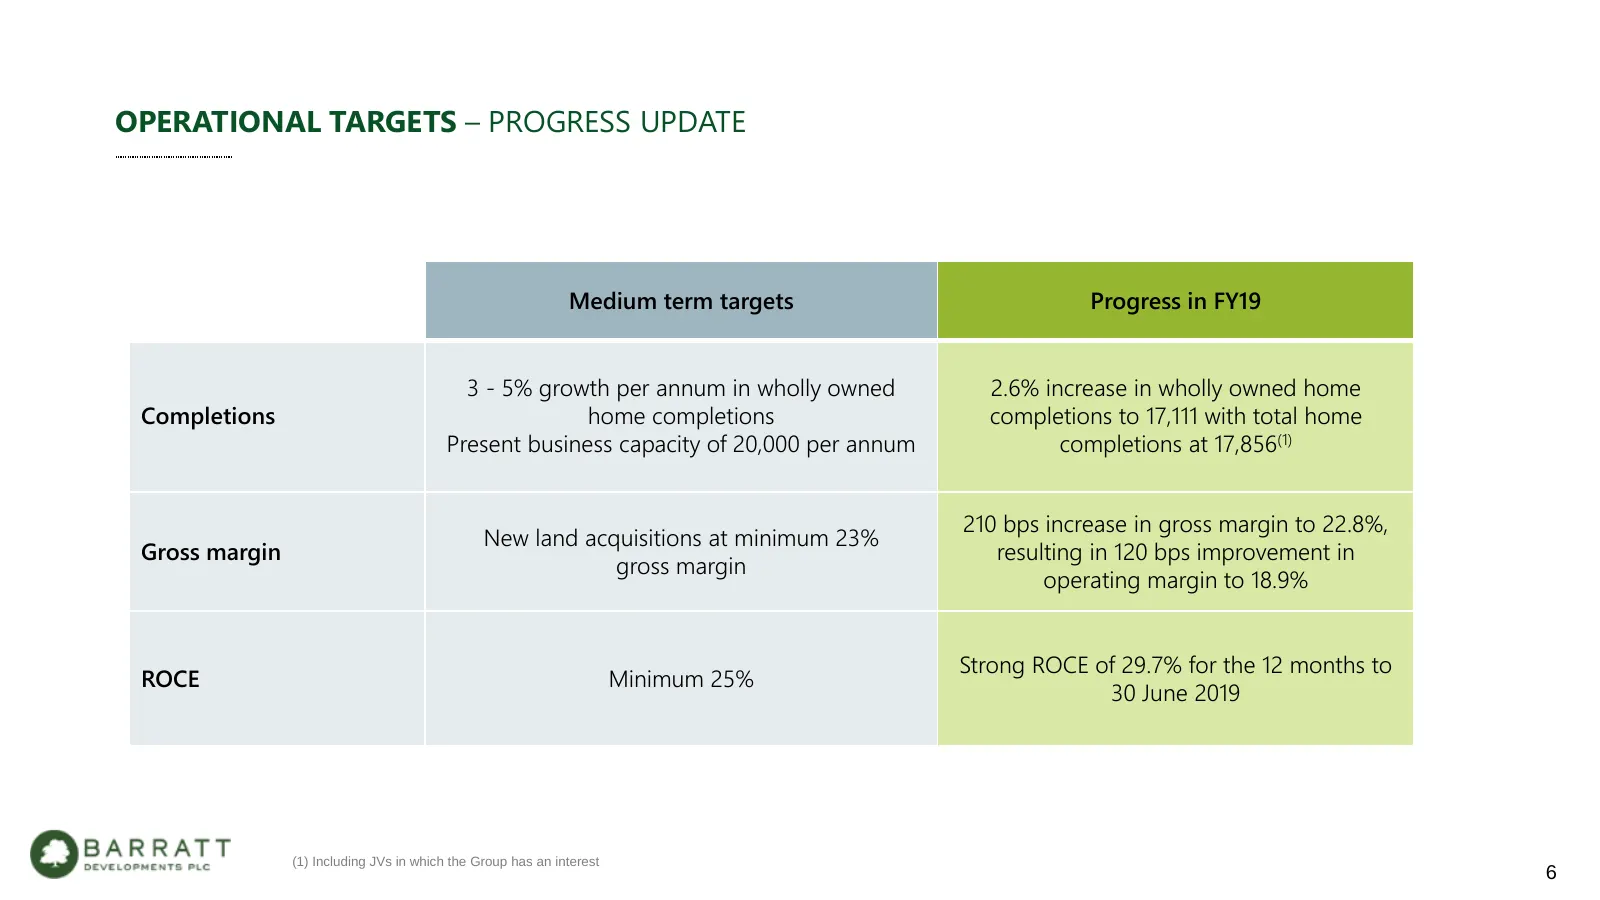
OPERATIONAL TARGETS – PROGRESS UPDATE Medium term targets Progress in FY19 3 - 5% growth per annum in wholly owned 2.6% increase in wholly owned home Completions home completions completions to 17,111 with total home Present business capacity of 20,000 per annum completions at 17,856(1) 210 bps incr
Slide 7: Steven Boyes, Chief Operating Officer
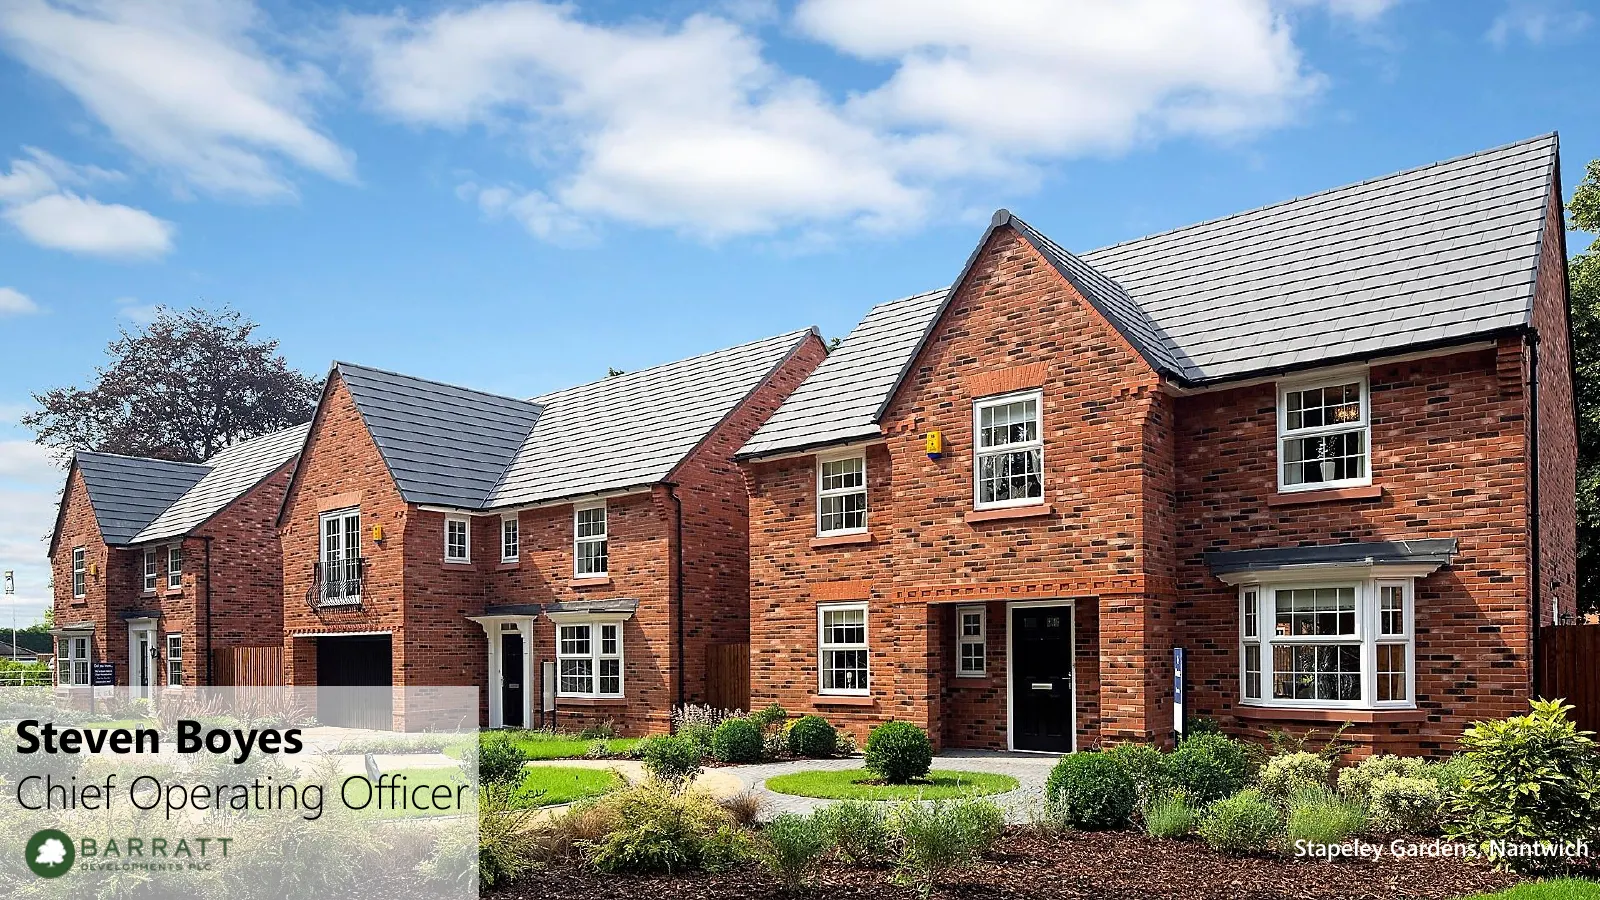
Steven Boyes Chief Operating Officer Stapeley Gardens, Nantwich 7
Slide 8: Strong Sales Performance
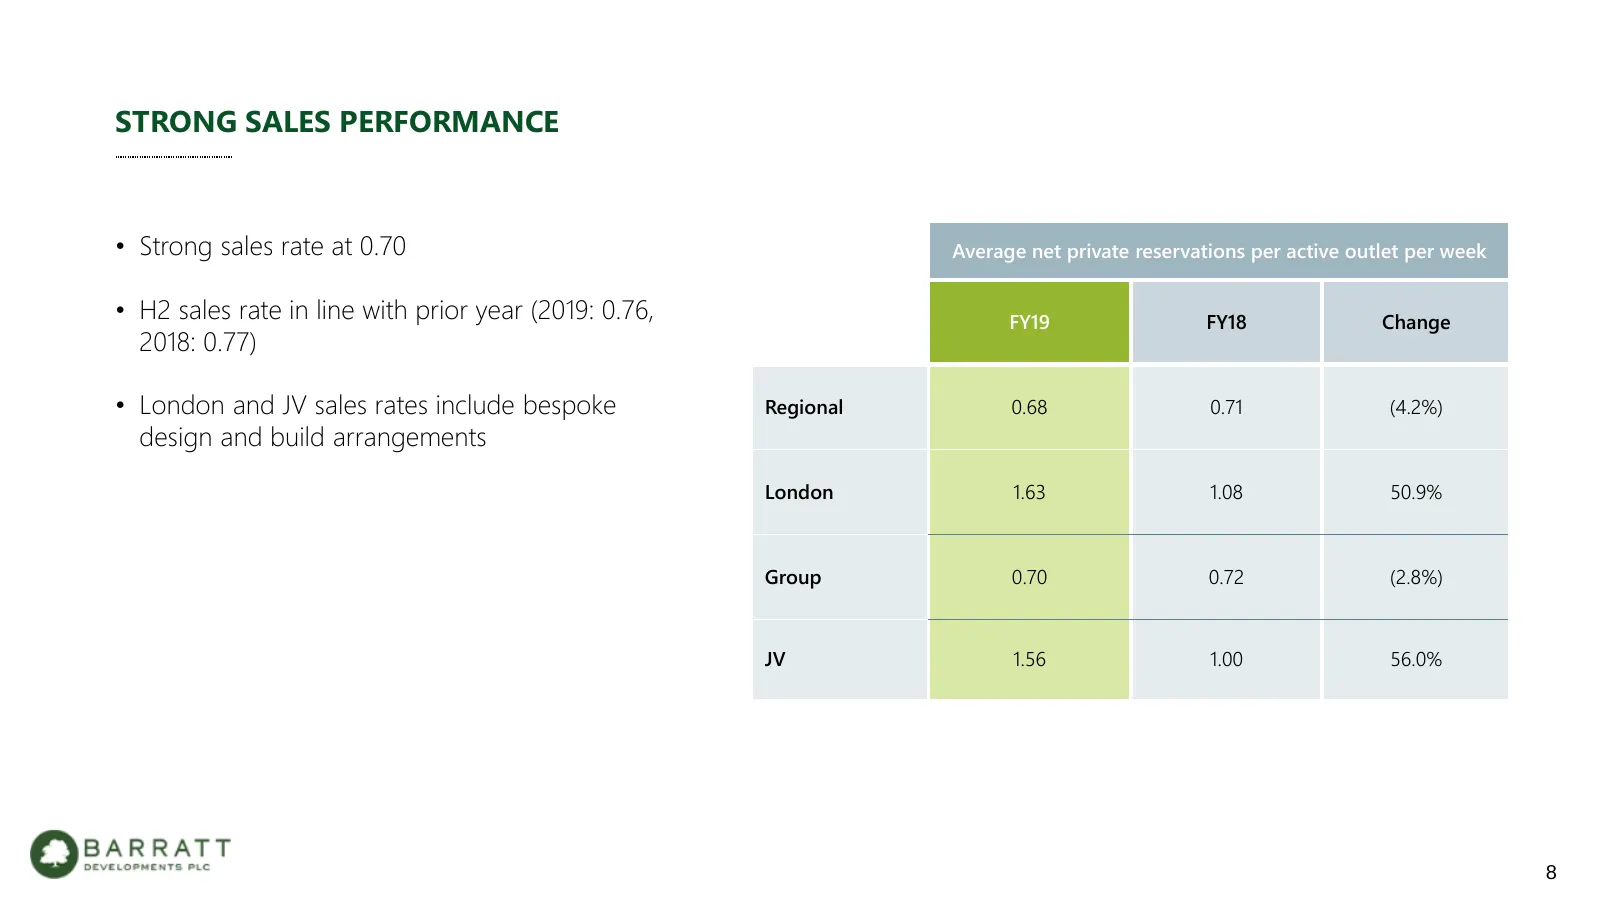
STRONG SALES PERFORMANCE • Strong sales rate at 0.70 Average net private reservations per active outlet per week • H2 sales rate in line with prior year (2019: 0.76, FY19 FY18 Change 2018: 0.77) • London and JV sales rates include bespoke Regional 0.68 0.71 (4.2%) design and build arrangements Londo
Slide 9: Completion Growth
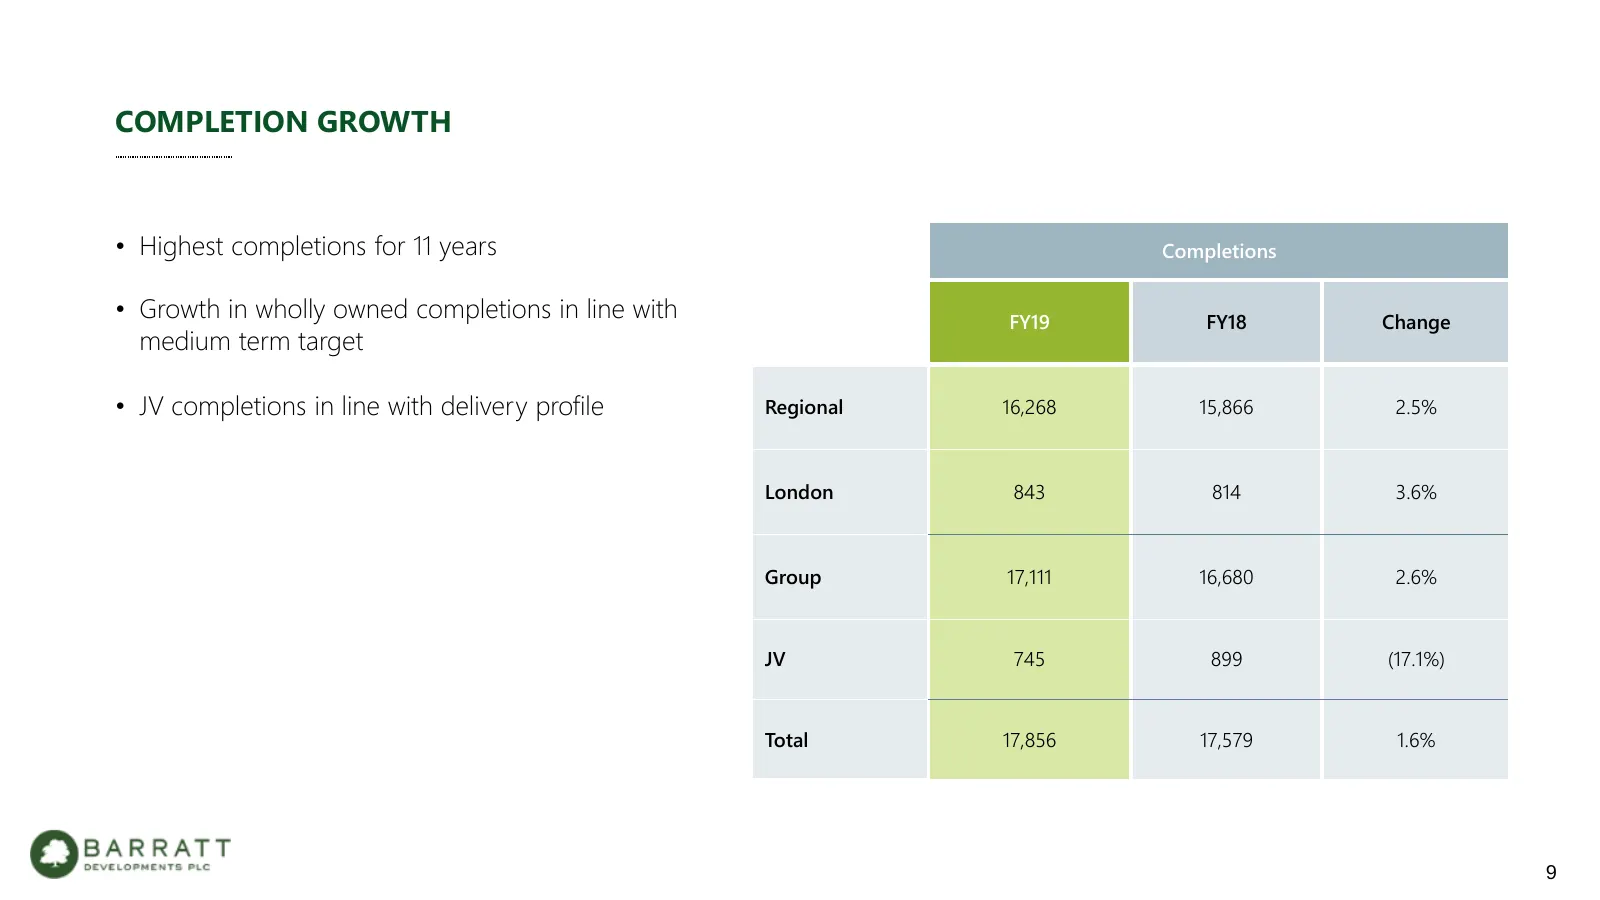
COMPLETION GROWTH • Highest completions for 11 years Completions • Growth in wholly owned completions in line with FY19 FY18 Change medium term target • JV completions in line with delivery profile Regional 16,268 15,866 2.5% London 843 814 3.6% Group 17,111 16,680 2.6% JV 745 899 (17.1%) Total 17,8
Slide 10: Completions Analysis – Buyer Type
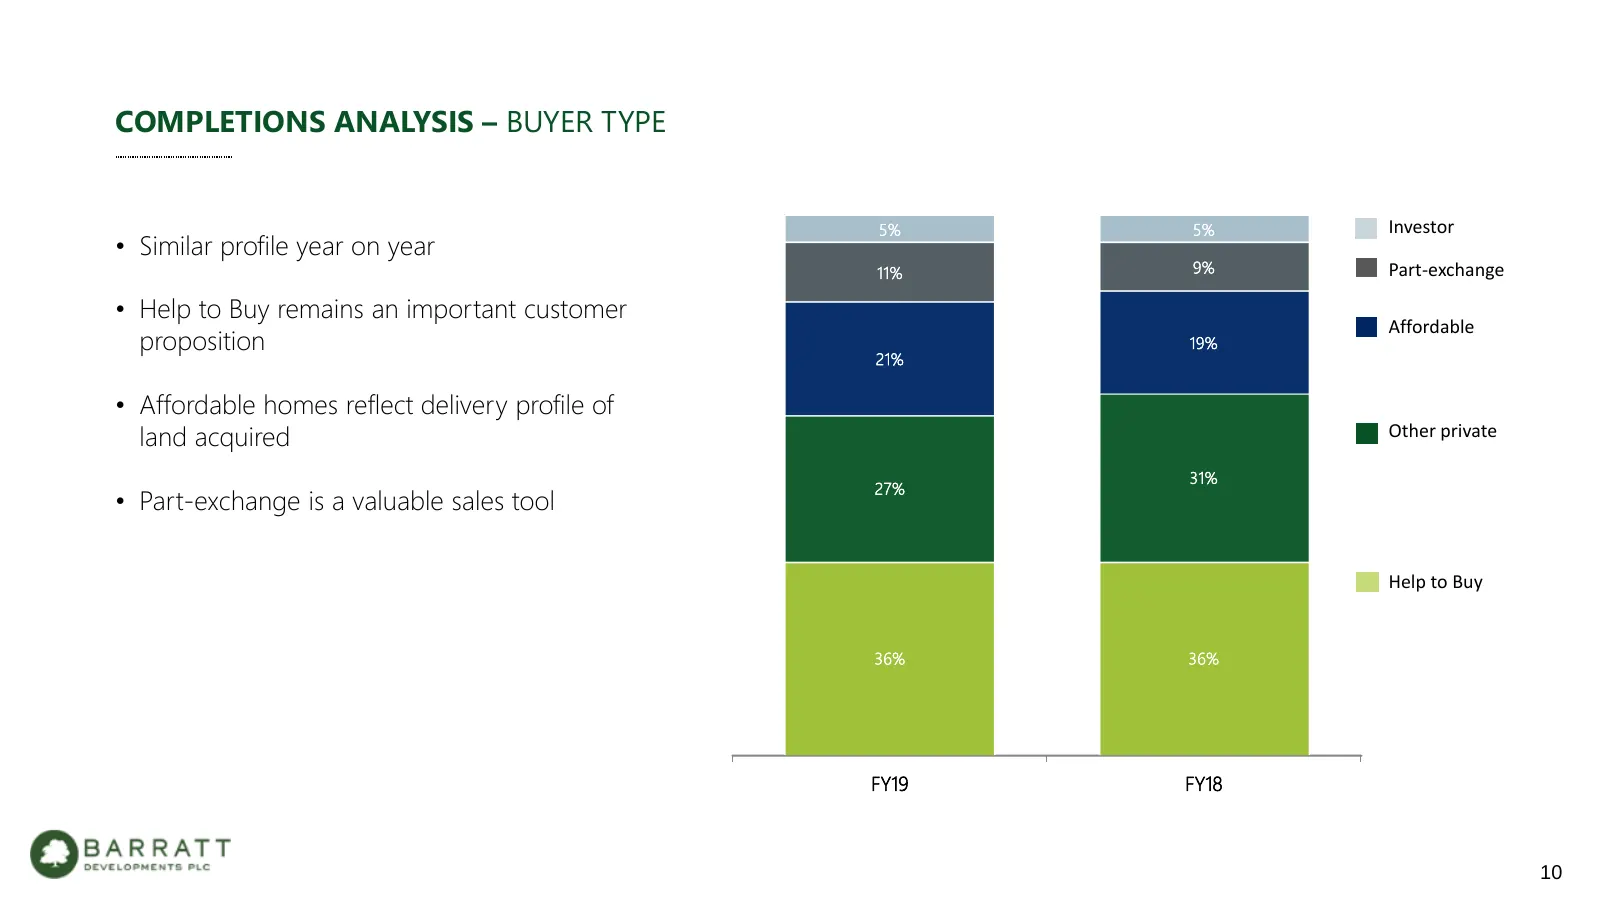
COMPLETIONS ANALYSIS – BUYER TYPE 5% 5% Investor • Similar profile year on year 11% 9% Part-exchange • Help to Buy remains an important customer Affordable proposition 19% 21% • Affordable homes reflect delivery profile of land acquired Other private 31% 27% • Part-exchange is a valuable sales tool
Slide 11: Pricing Trends Remain Positive
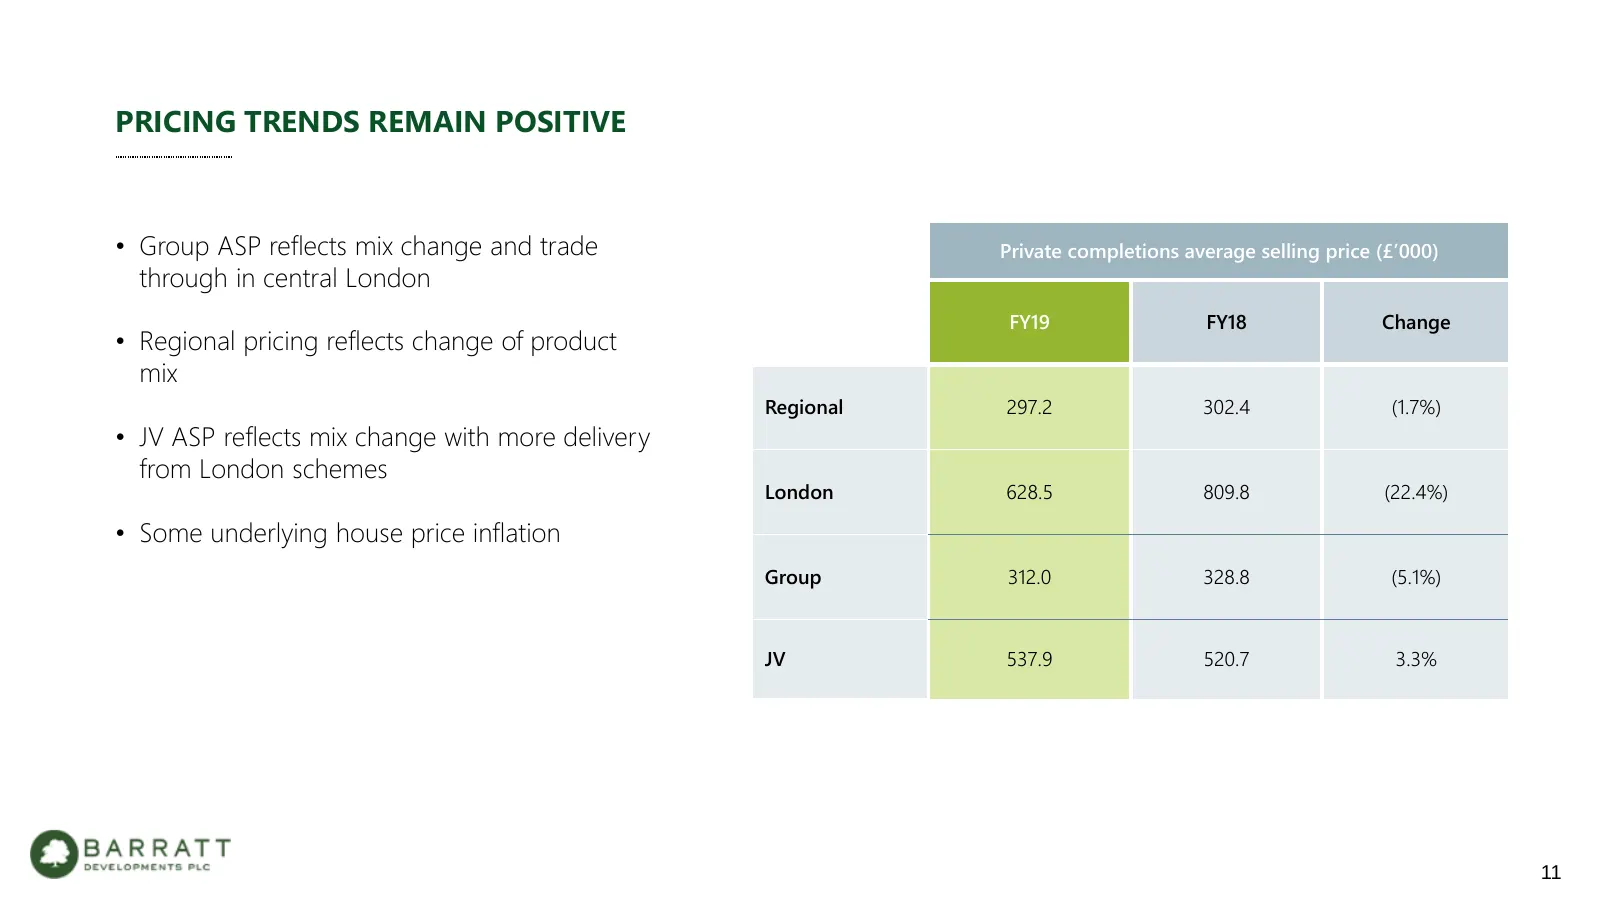
PRICING TRENDS REMAIN POSITIVE • Group ASP reflects mix change and trade Private completions average selling price (£’000) through in central London FY19 FY18 Change • Regional pricing reflects change of product mix Regional 297.2 302.4 (1.7%) • JV ASP reflects mix change with more delivery from Lon
Slide 12: Land Market
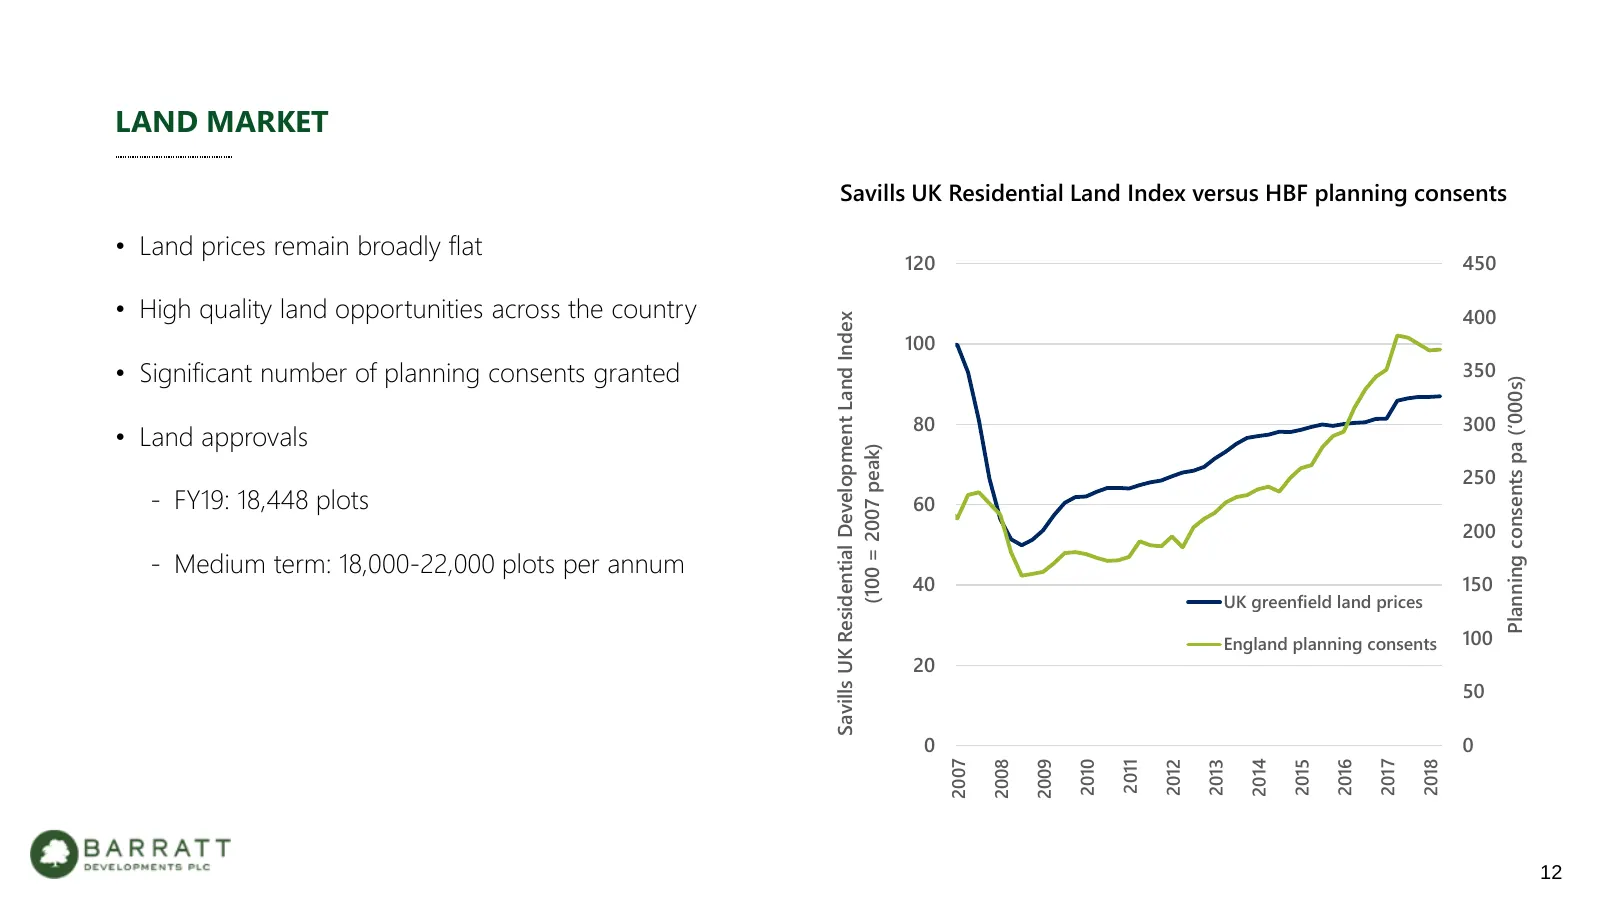
LAND MARKET Savills UK Residential Land Index versus HBF planning consents • Land prices remain broadly flat HOLDING PICTURE – CB 450 120 SPEAKING TO PHIL BARNES • High quality land opportunities across the country 400 Savills UK Residential Development Land Index 100 • Significant number of plannin
Slide 13: Land – High Quality Opportunities Across the Country
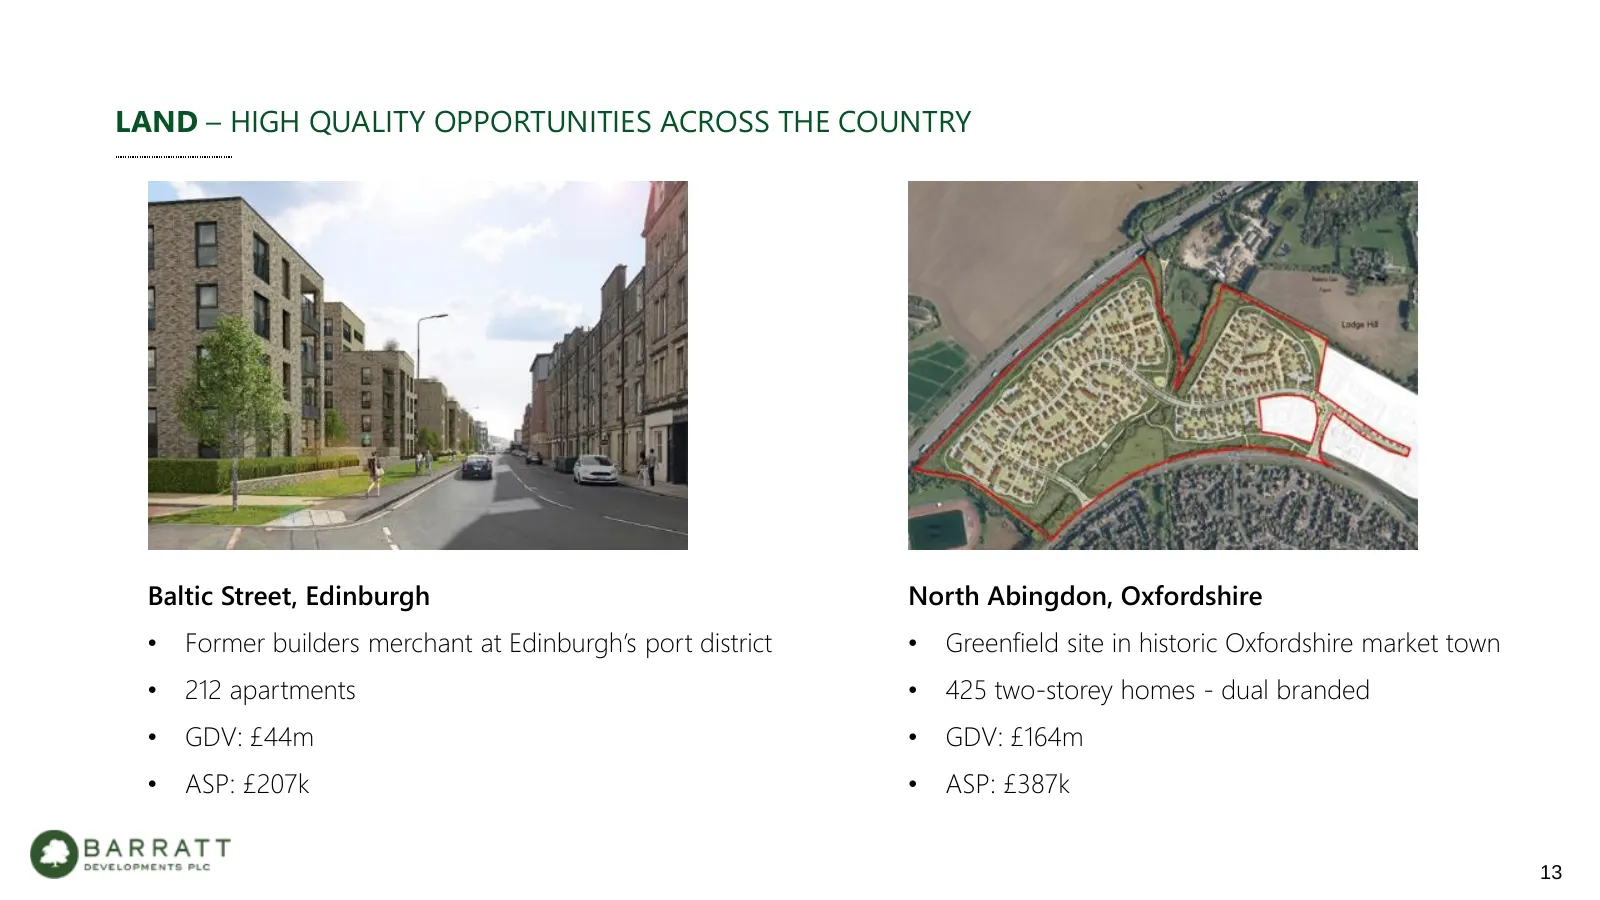
LAND – HIGH QUALITY OPPORTUNITIES ACROSS THE COUNTRY Baltic Street, Edinburgh North Abingdon, Oxfordshire • Former builders merchant at Edinburgh’s port district • Greenfield site in historic Oxfordshire market town • 212 apartments • 425 two-storey homes - dual branded • GDV: £44m • GDV: £164m • AS
Slide 14: Driving Operating Margin – Strategic Land
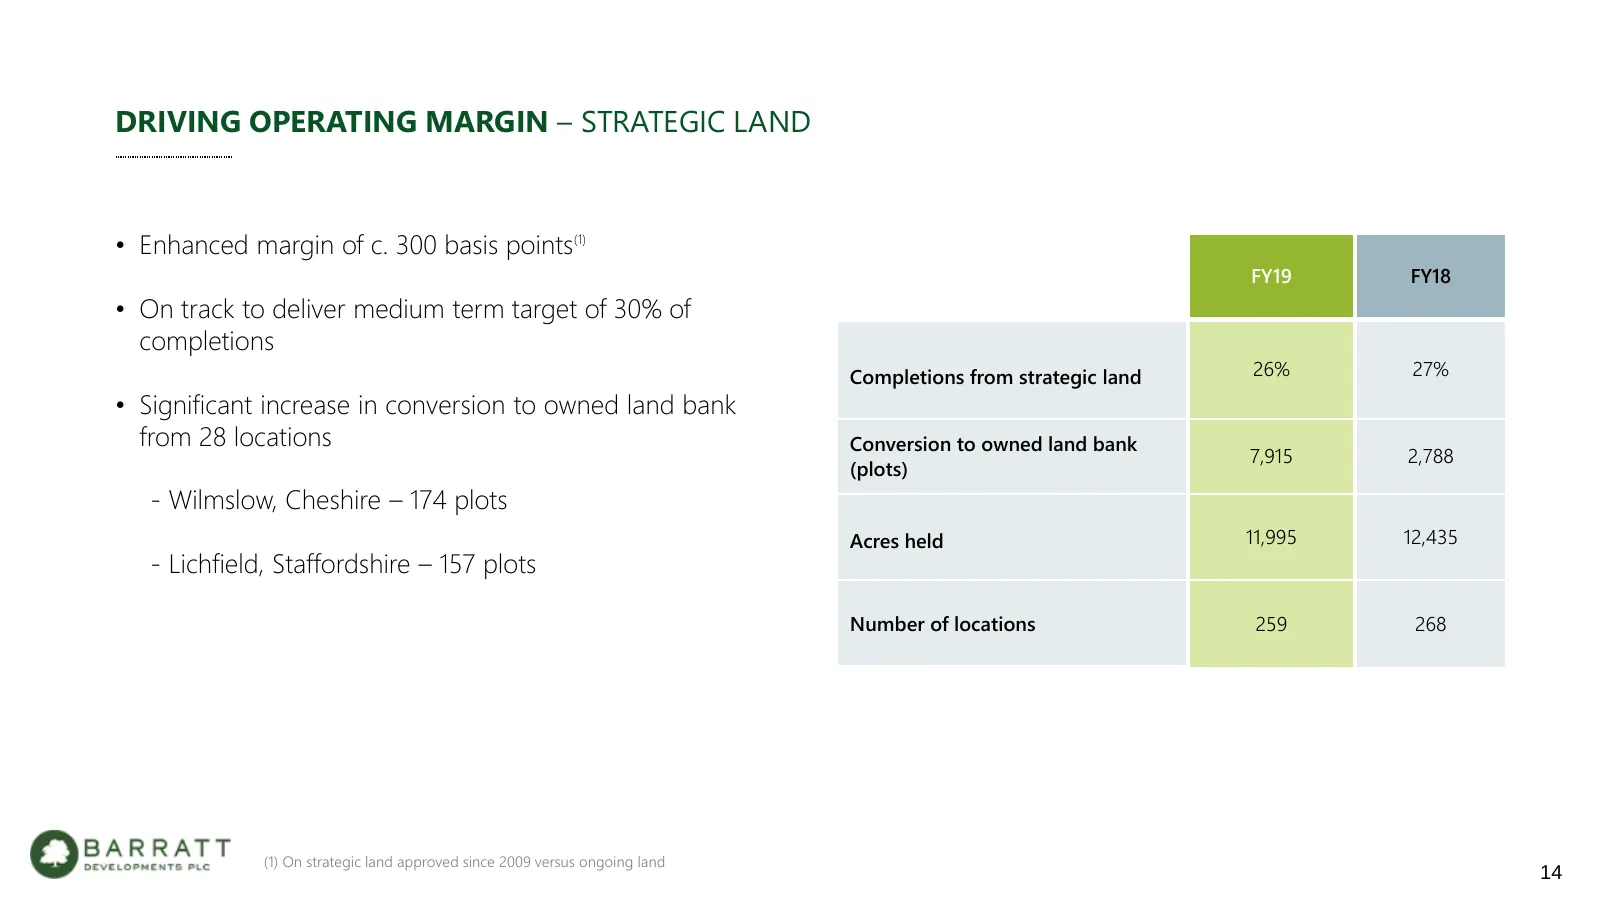
DRIVING OPERATING MARGIN – STRATEGIC LAND • Enhanced margin of c. 300 basis points(1) FY19 FY18 • On track to deliver medium term target of 30% of completions Completions from strategic land 26% 27% • Significant increase in conversion to owned land bank from 28 locations Conversion to owned land ba
Slide 15: Driving Operating Margin – New Product Roll Out
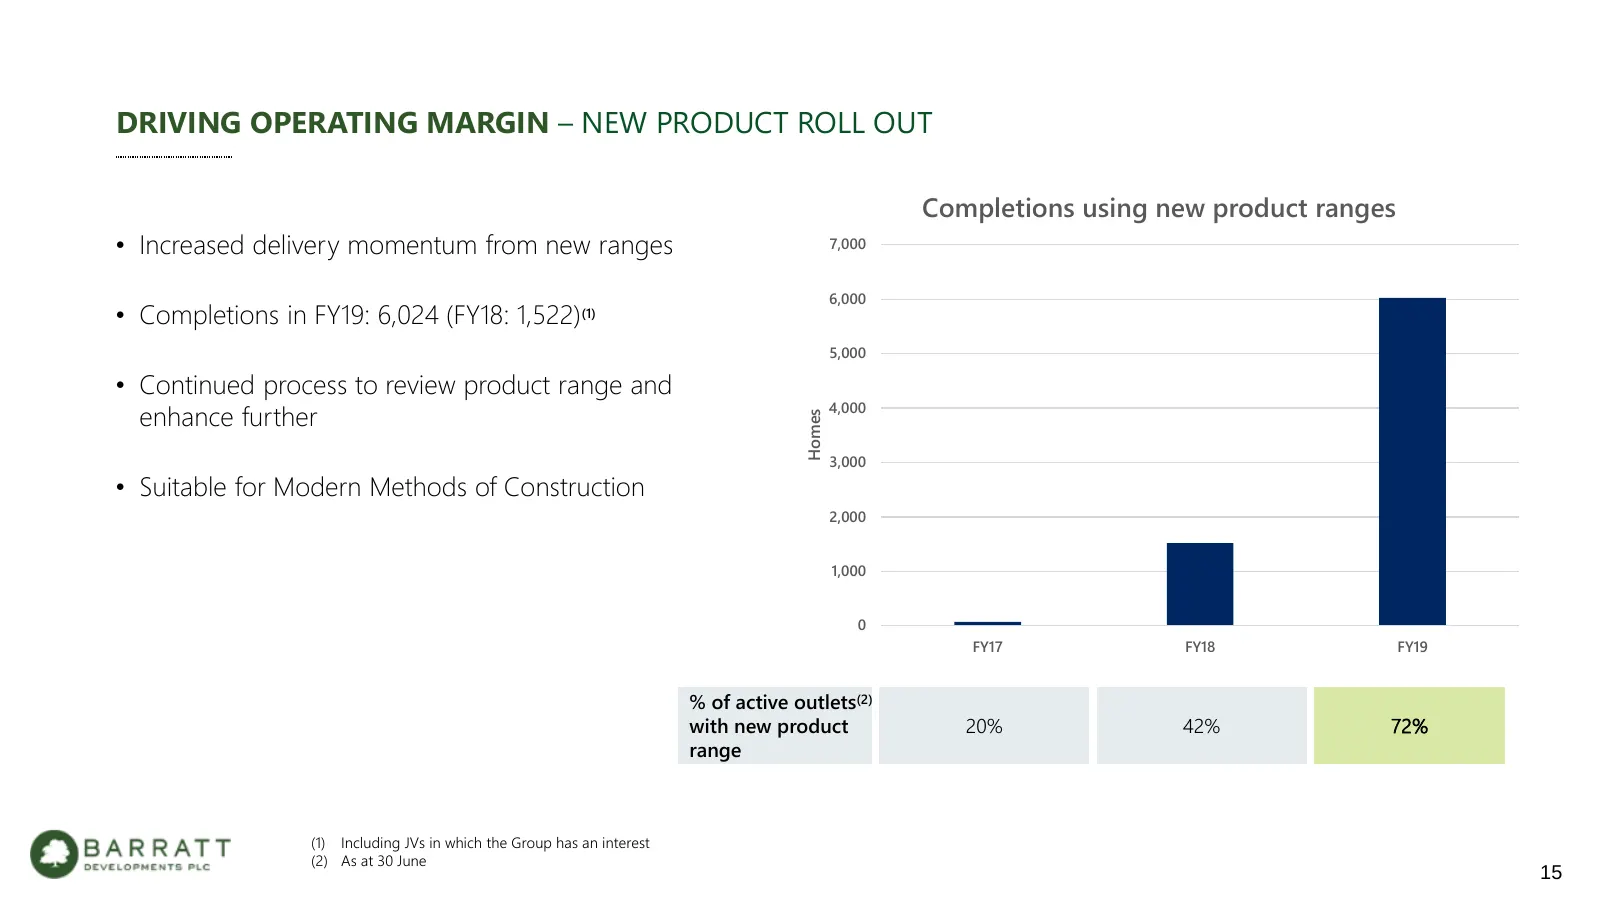
DRIVING OPERATING MARGIN – NEW PRODUCT ROLL OUT Completions using new product ranges • Increased delivery momentum from new ranges 7,000 6,000 • Completions in FY19: 6,024 (FY18: 1,522)(1) 5,000 • Continued process to review product range and +19% 4,000 +53% enhance further +31% Homes 3,000 • Suitab
Slide 16: Managing the Cost Environment
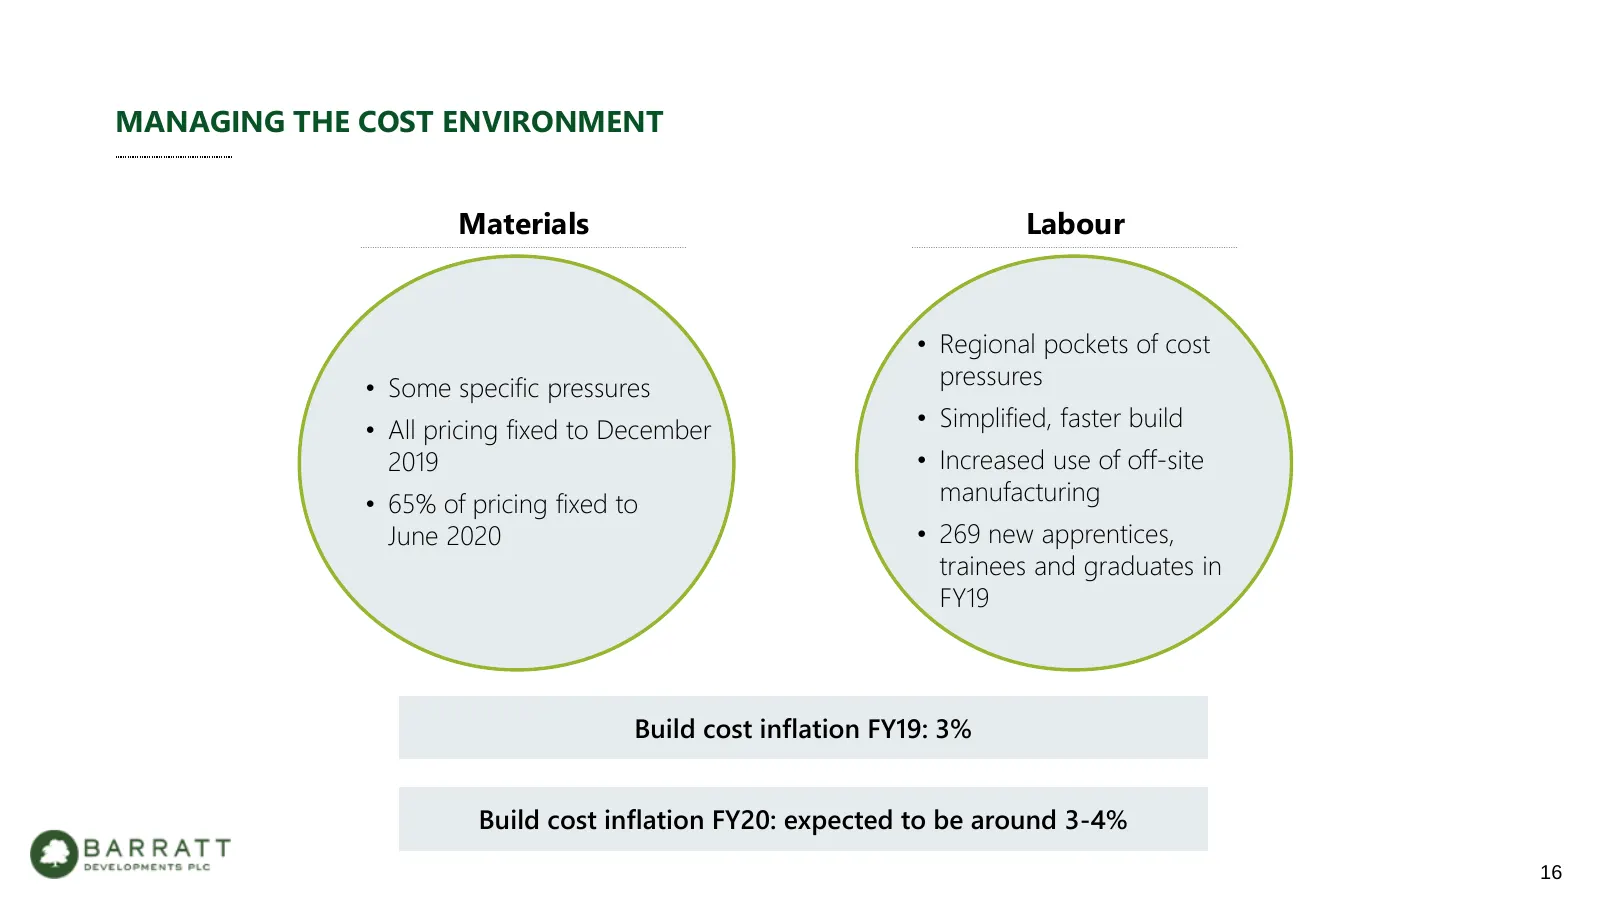
MANAGING THE COST ENVIRONMENT Materials Labour • Regional pockets of cost • Some specific pressures pressures • All pricing fixed to December • Simplified, faster build 2019 • Increased use of off-site • 65% of pricing fixed to manufacturing June 2020 • 269 new apprentices, trainees and graduates in
Slide 17: Modern Methods of Construction
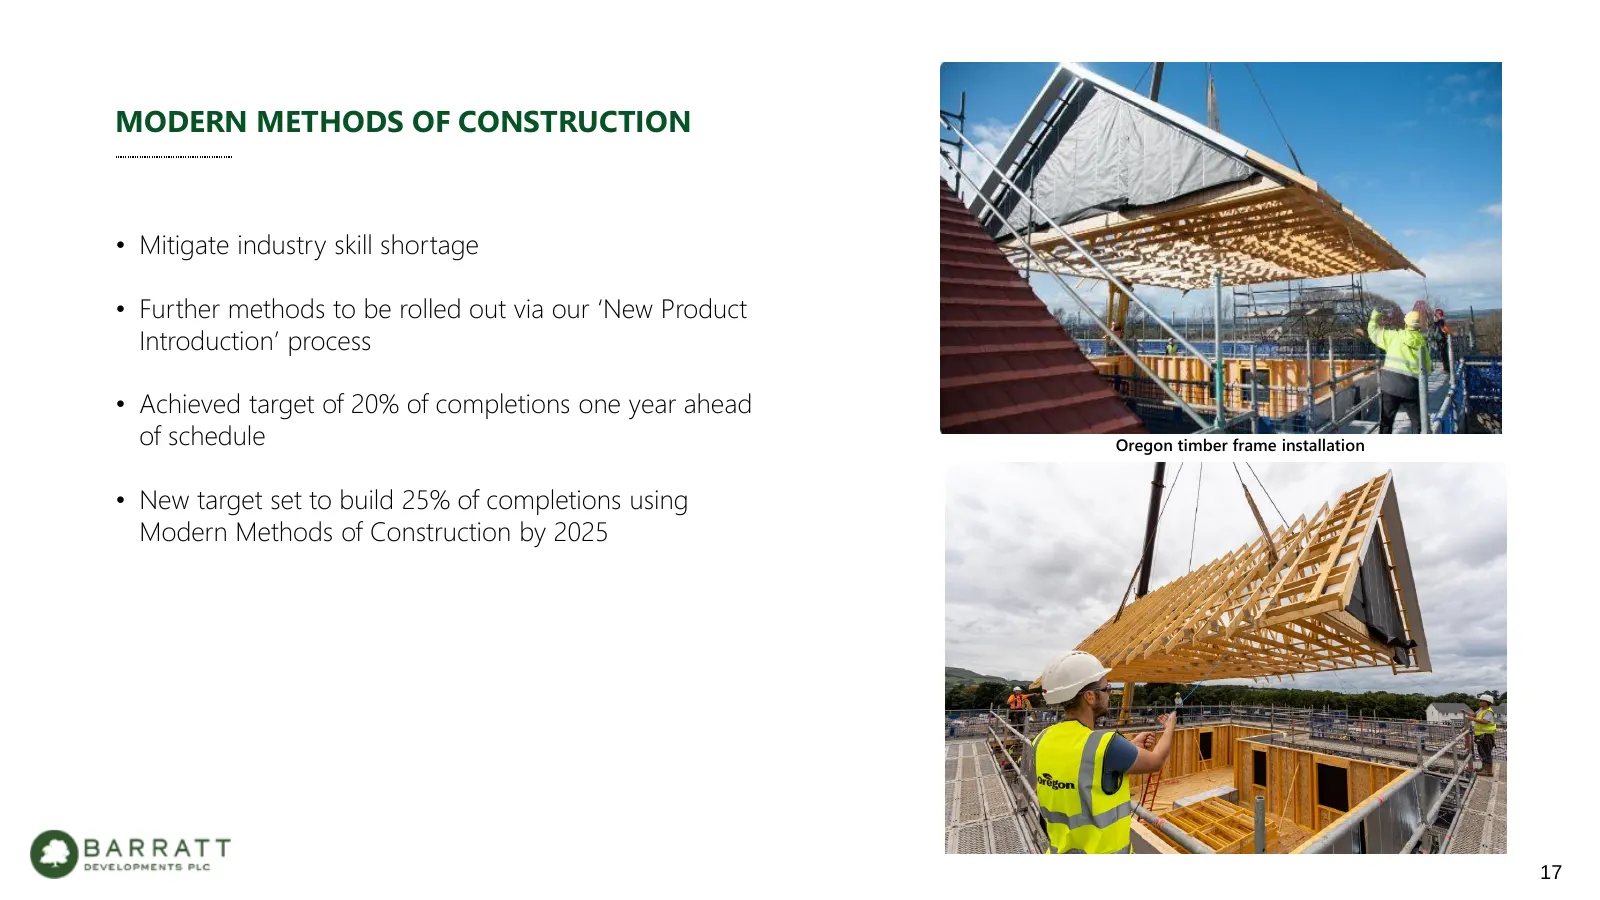
MODERN METHODS OF CONSTRUCTION • Mitigate industry skill shortage • Further methods to be rolled out via our ‘New Product Introduction’ process • Achieved target of 20% of completions one year ahead of schedule Oregon timber frame installation • New target set to build 25% of completions using Moder
Slide 18: Oregon Acquisition
OREGON ACQUISITION • Acquired in June 2019 • High quality products and experienced management team • Security of supply • Supports our growth target and enables increasing use of Modern Methods of Construction 18
Slide 19: Quality and Customer Focus – Long Term Investment
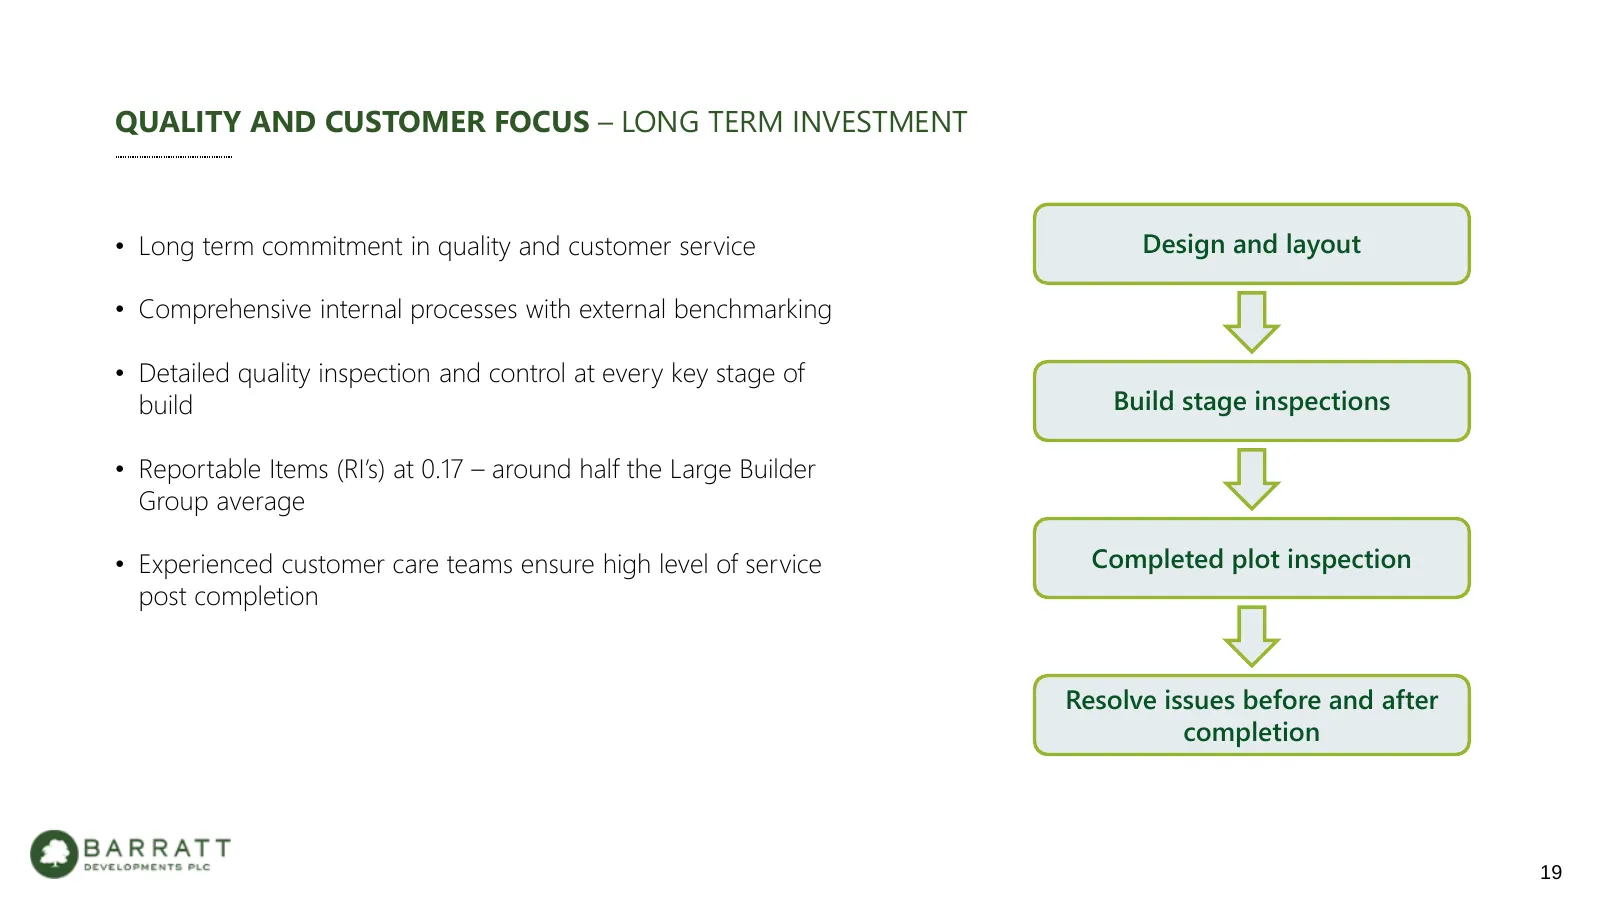
QUALITY AND CUSTOMER FOCUS – LONG TERM INVESTMENT • Long term commitment in quality and customer service Design and layout • Comprehensive internal processes with external benchmarking • Detailed quality inspection and control at every key stage of build Build stage inspections • Reportable Items (R
Slide 20: Quality and Customer Focus – External Benchmarks
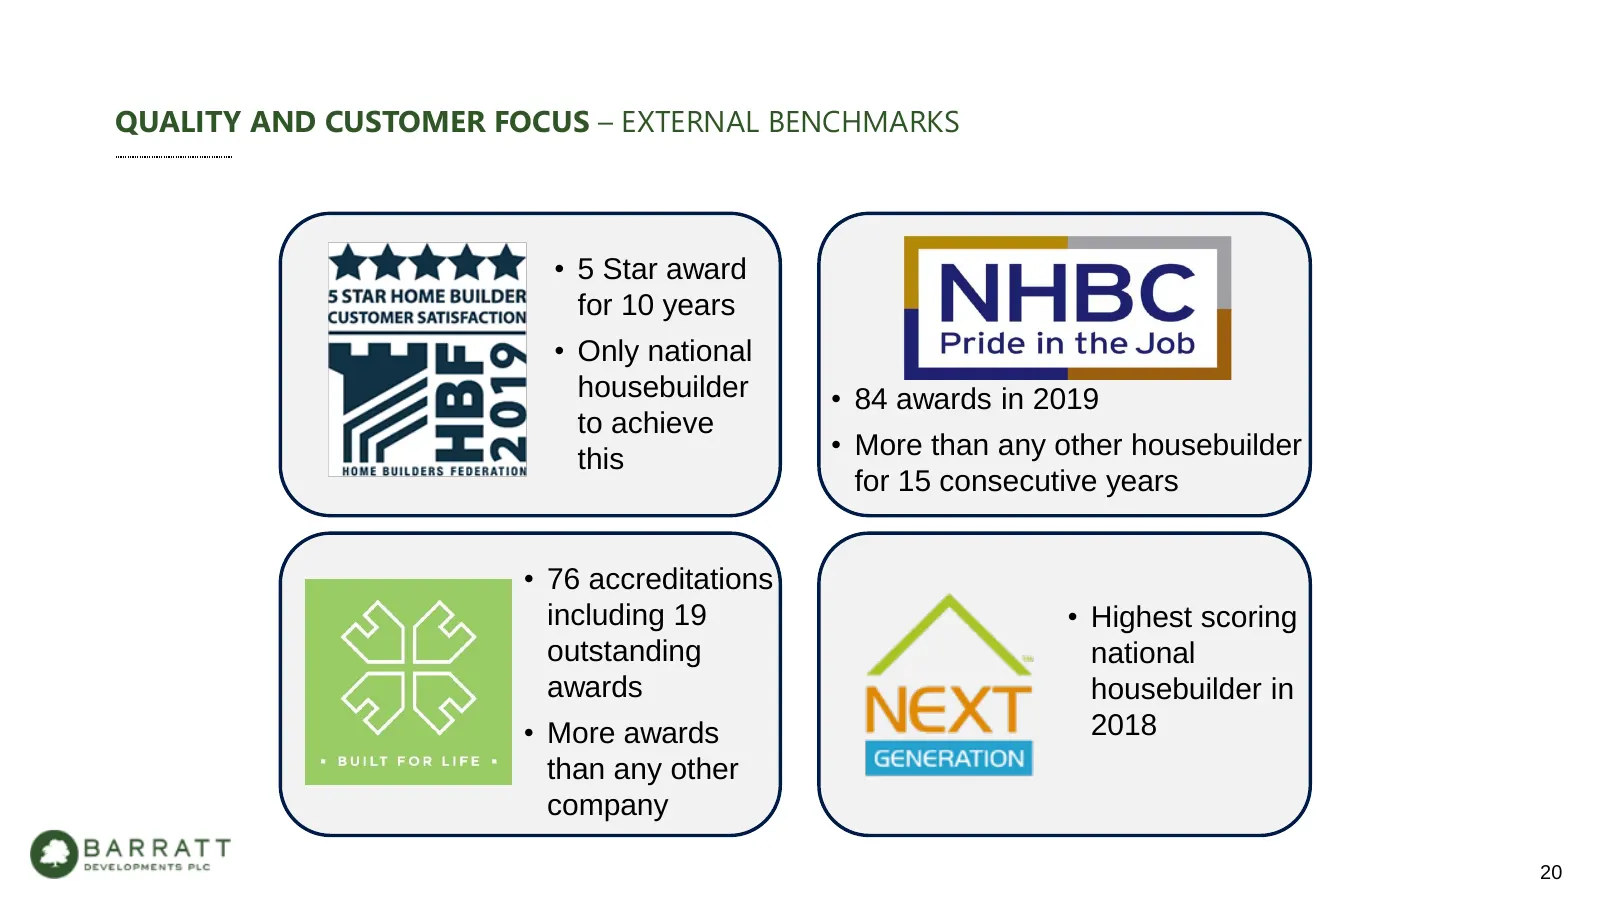
QUALITY AND CUSTOMER FOCUS – EXTERNAL BENCHMARKS • 5 Star award for 10 years • Only national housebuilder • 84 awards in 2019 to achieve this • More than any other housebuilder for 15 consecutive years • 76 accreditations including 19 • Highest scoring outstanding national awards housebuilder in • M
Slide 21: Strong Performance
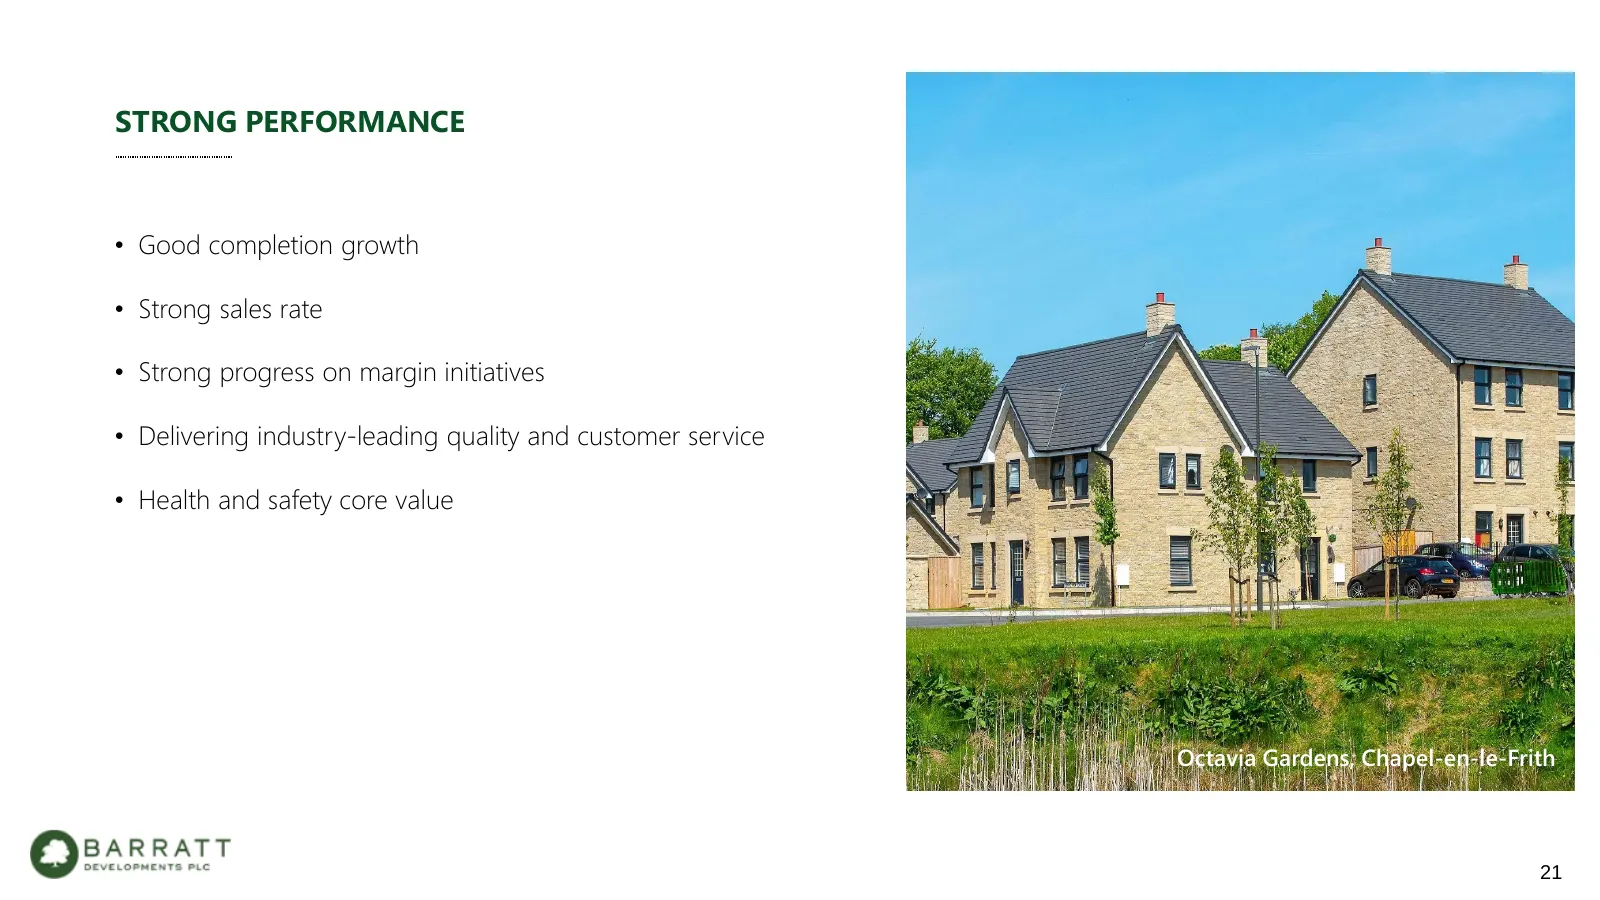
STRONG PERFORMANCE • Good completion growth • Strong sales rate • Strong progress on margin initiatives • Delivering industry-leading quality and customer service • Health and safety core value Octavia Gardens, Chapel-en-le-Frith 21
Slide 22: Jessica White, Chief Financial Officer
Jessica White Chief Financial Officer Oakfields, Harbury 22
Slide 23: Key Highlights
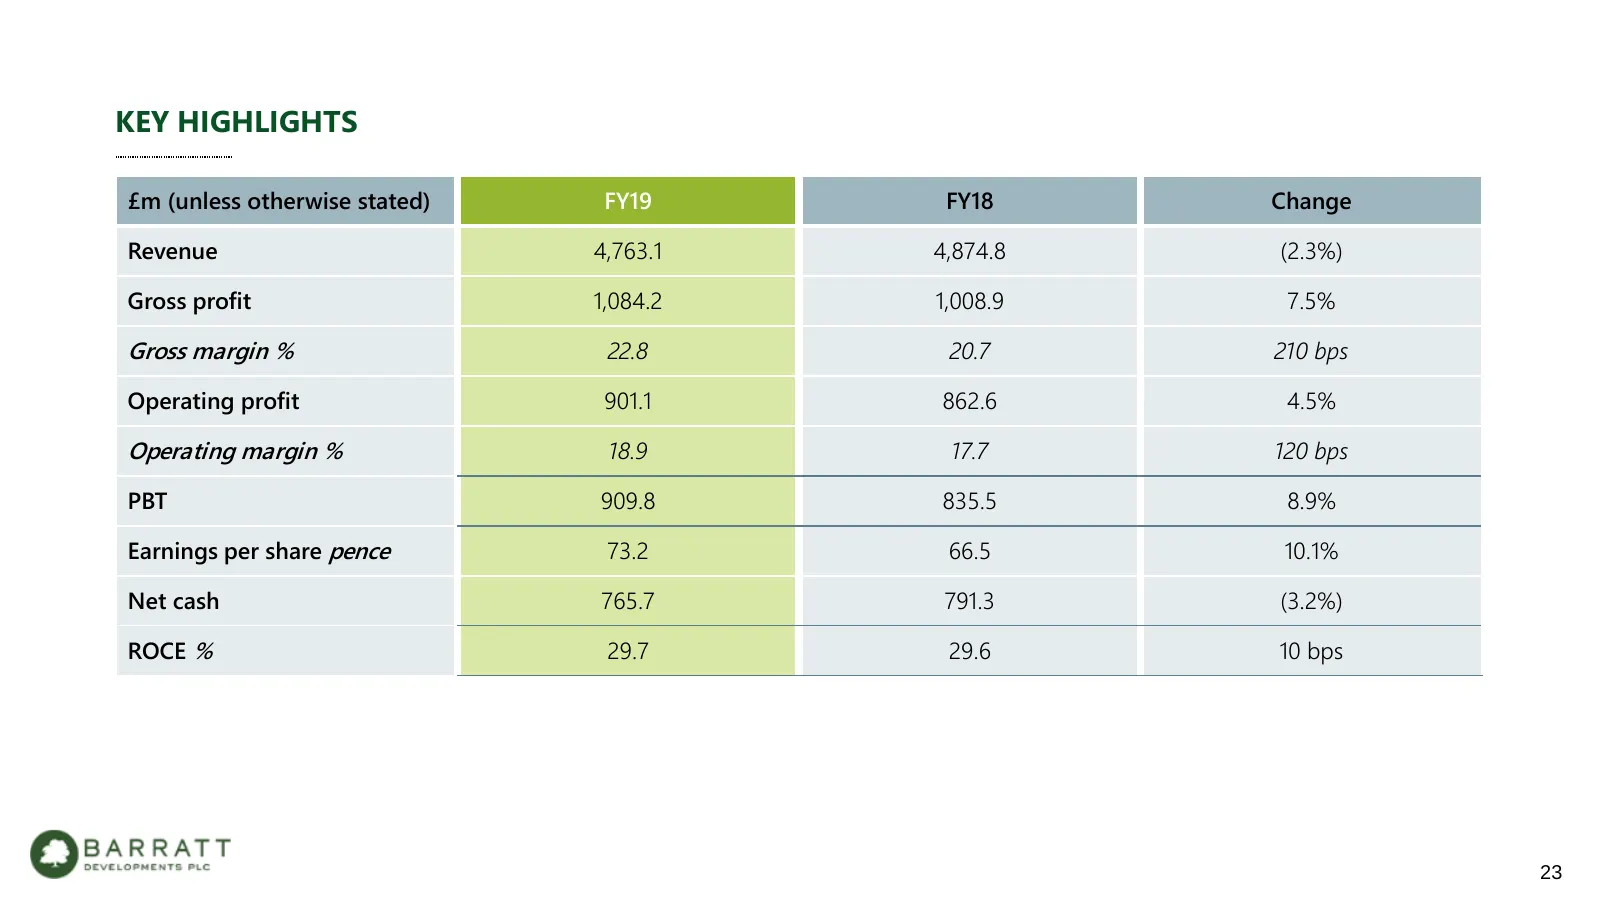
KEY HIGHLIGHTS £m (unless otherwise stated) FY19 FY18 Change Revenue 4,763.1 4,874.8 (2.3%) Gross profit 1,084.2 1,008.9 7.5% Gross margin % 22.8 20.7 210 bps Operating profit 901.1 862.6 4.5% Operating margin % 18.9 17.7 120 bps PBT 909.8 835.5 8.9% Earnings per share pence 73.2 66.5 10.1% Net cash
Slide 24: Revenue Summary
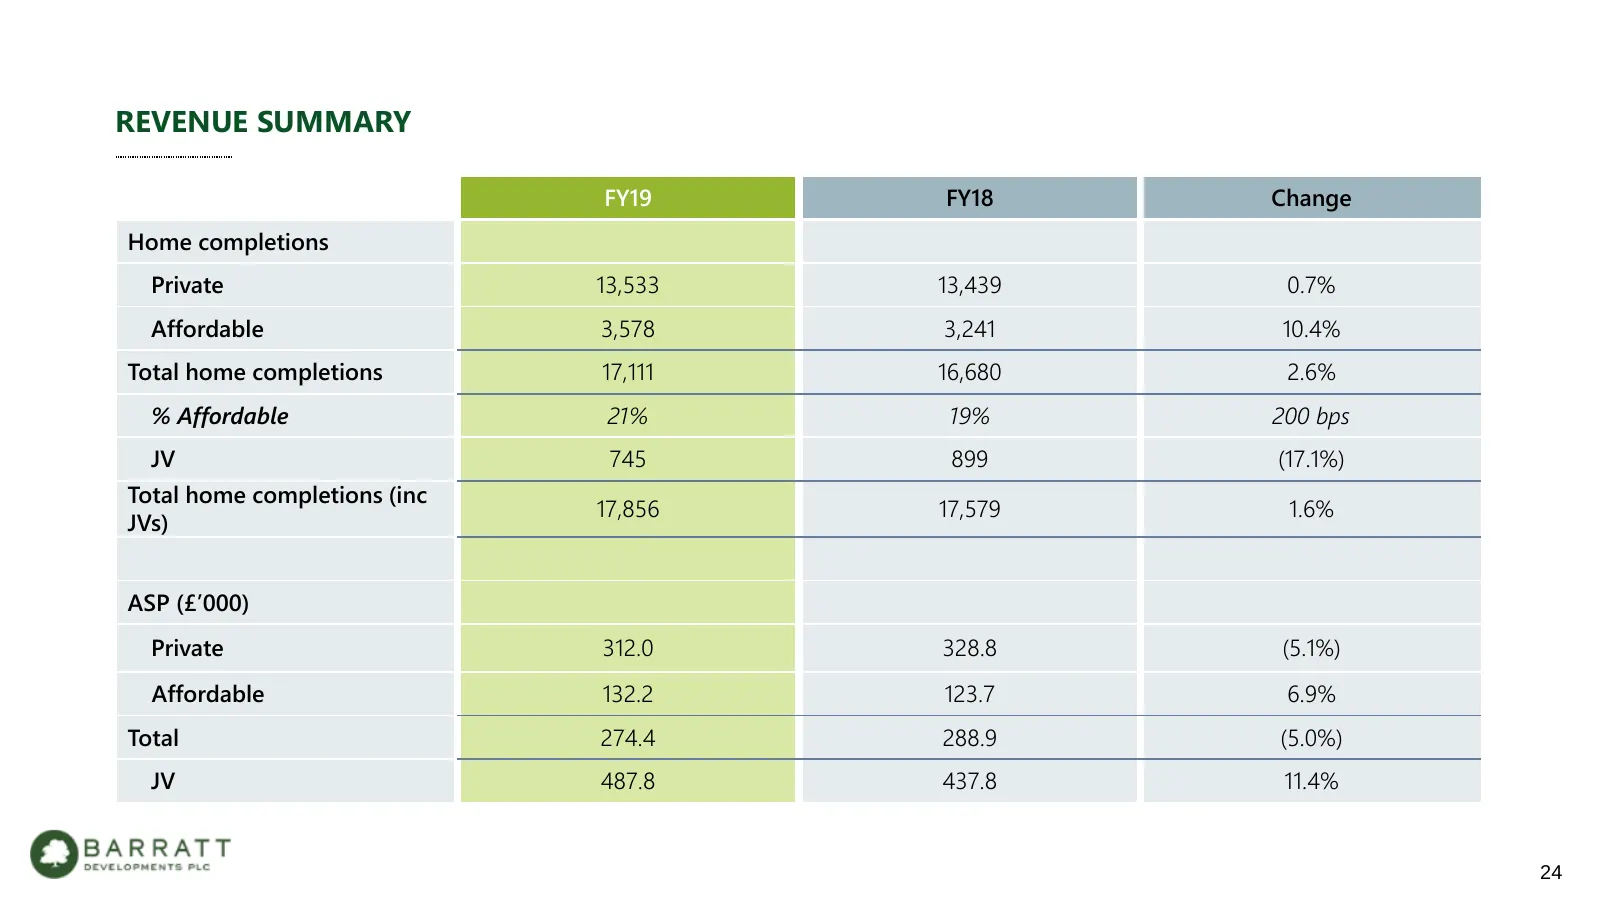
REVENUE SUMMARY FY19 FY18 Change Home completions Private 13,533 13,439 0.7% Affordable 3,578 3,241 10.4% Total home completions 17,111 16,680 2.6% % Affordable 21% 19% 200 bps JV 745 899 (17.1%) Total home completions (inc 17,856 17,579 1.6% JVs) ASP (£’000) Private 312.0 328.8 (5.1%) Affordable 13
Slide 25: Private Average Selling Price
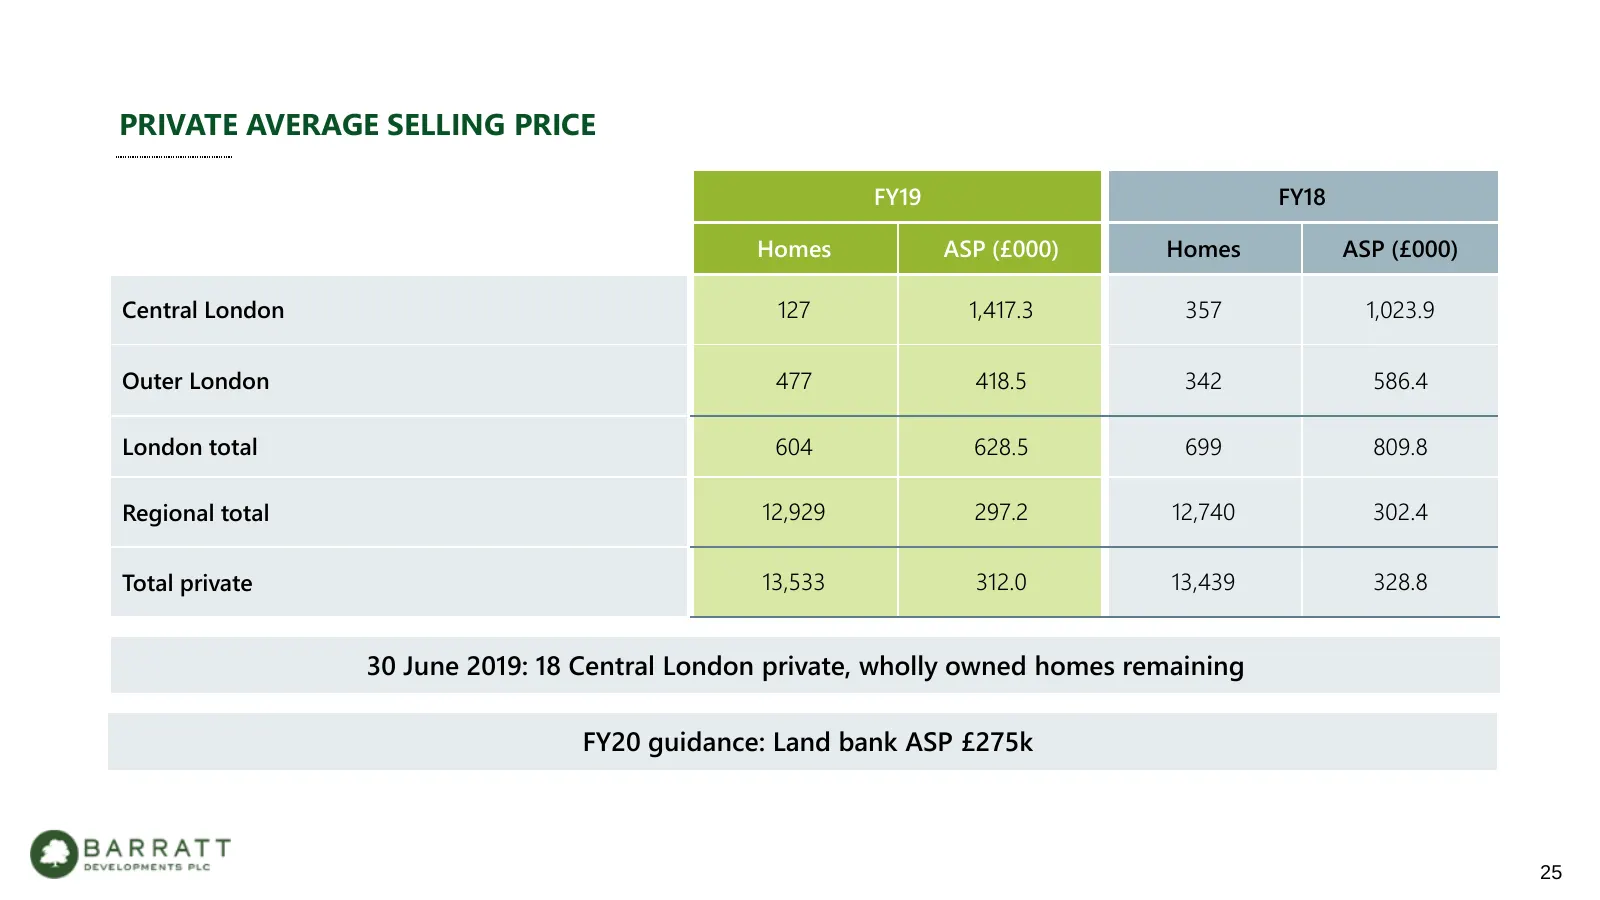
PRIVATE AVERAGE SELLING PRICE FY19 FY18 Homes ASP (£000) Homes ASP (£000) Central London 127 1,417.3 357 1,023.9 Outer London 477 418.5 342 586.4 London total 604 628.5 699 809.8 Regional total 12,929 297.2 12,740 302.4 Total private 13,533 312.0 13,439 328.8 30 June 2019: 18 Central London private,
Slide 26: Delivering Margin Improvement
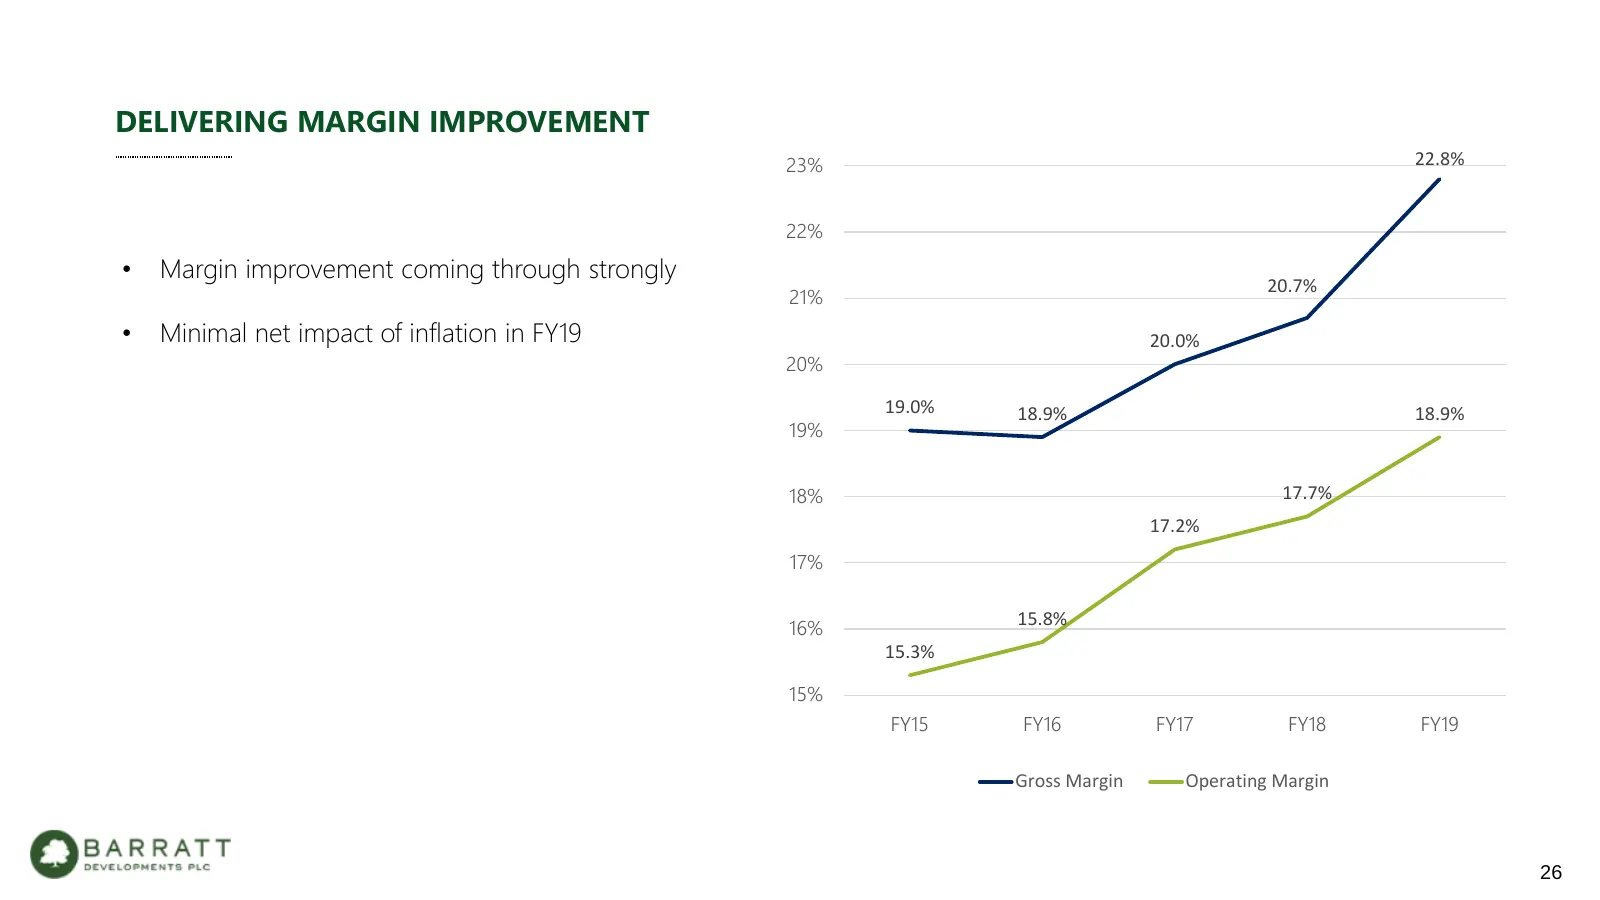
DELIVERING MARGIN IMPROVEMENT 23% 22.8% 22% • Margin improvement coming through strongly 20.7% 21% • Minimal net impact of inflation in FY19 20.0% 20% 19.0% 18.9% 18.9% 19% 18% 17.7% 17.2% 17% 15.8% 16% 15.3% 15% FY15 FY16 FY17 FY18 FY19 Gross Margin Operating Margin 26
Slide 27: Delivering Margin Improvement – Key Drivers
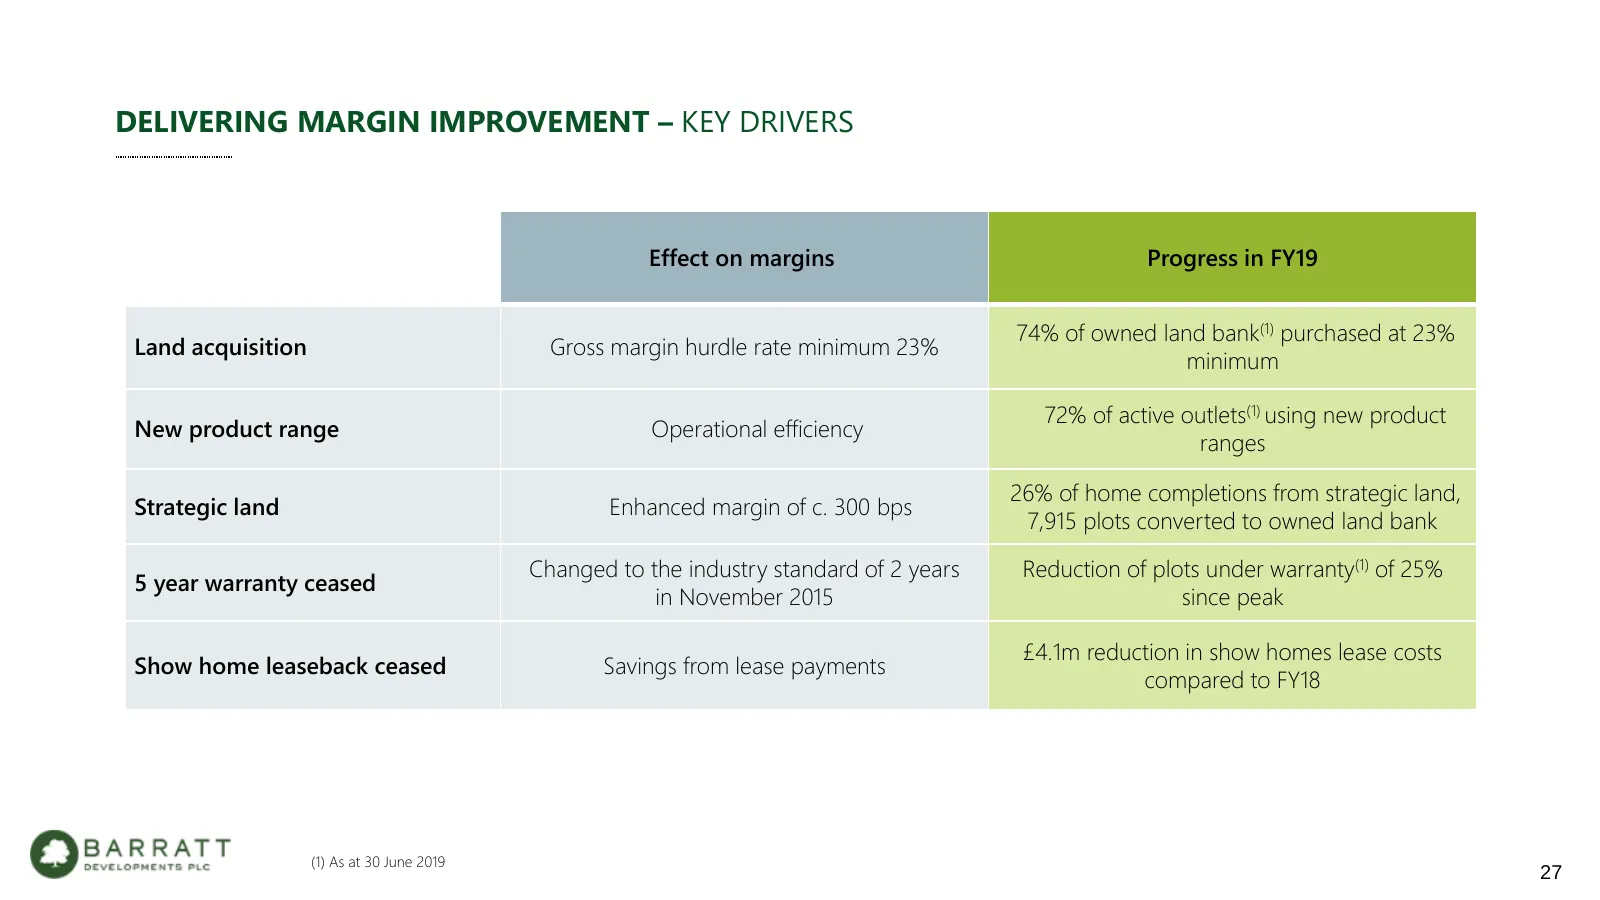
DELIVERING MARGIN IMPROVEMENT – KEY DRIVERS Effect on margins Progress in FY19 74% of owned land bank(1) purchased at 23% Land acquisition Gross margin hurdle rate minimum 23% minimum 72% of active outlets(1) using new product New product range Operational efficiency ranges 26% of home completions f
Slide 28: Operating Margin Bridge
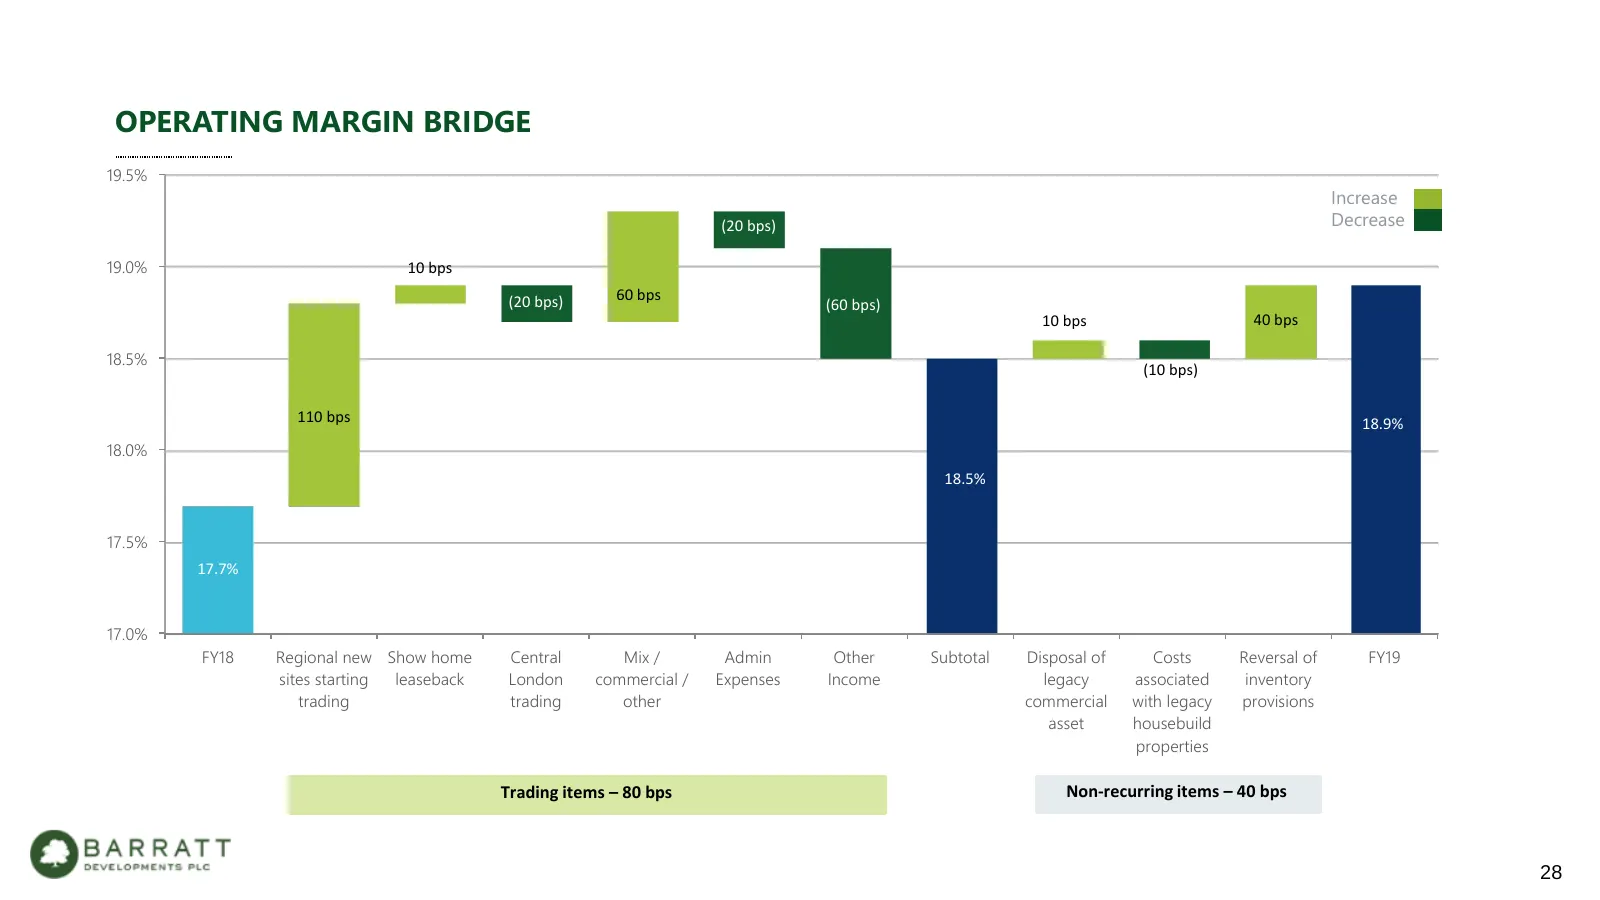
OPERATING MARGIN BRIDGE 19.5% Increase (20 bps) Decrease 19.0% 10 bps (20 bps) 60 bps (60 bps) 10 bps 40 bps 18.5% (10 bps) 110 bps 18.9% 18.0% 18.5% 17.5% 17.7% 17.0% FY18 Regional new Show home Central Mix / Admin Other Subtotal Disposal of Costs Reversal of FY19 sites starting leaseback London co
Slide 29: Operating Framework – Progress Update
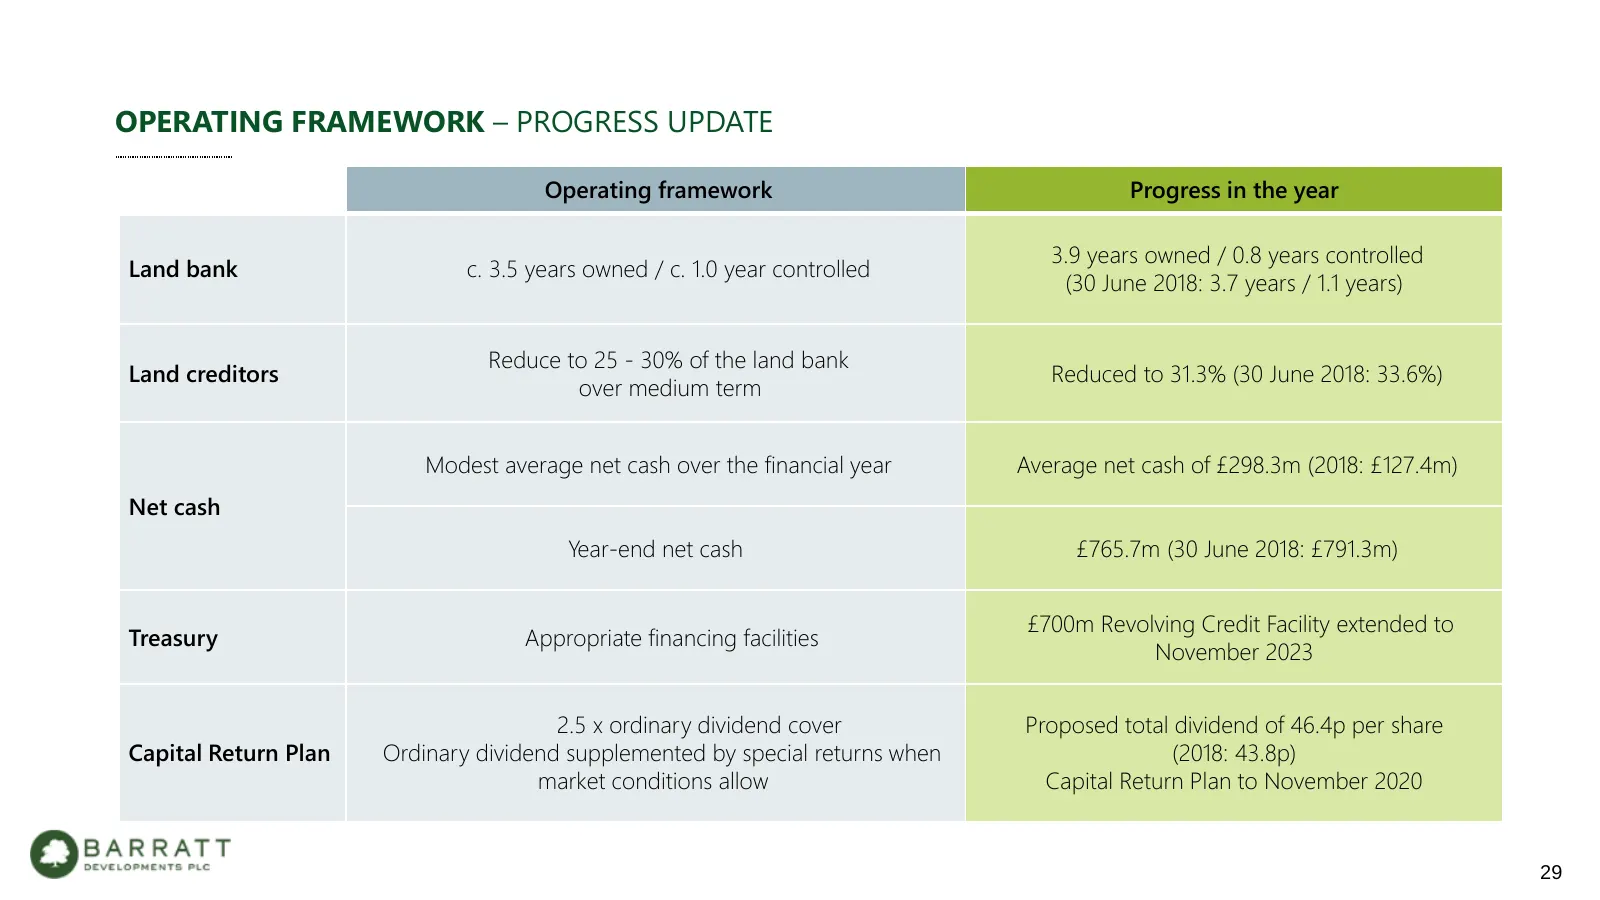
OPERATING FRAMEWORK – PROGRESS UPDATE Operating framework Progress in the year 3.9 years owned / 0.8 years controlled Land bank c. 3.5 years owned / c. 1.0 year controlled (30 June 2018: 3.7 years / 1.1 years) Reduce to 25 - 30% of the land bank Land creditors Reduced to 31.3% (30 June 2018: 33.6%)
Slide 30: Balance Sheet
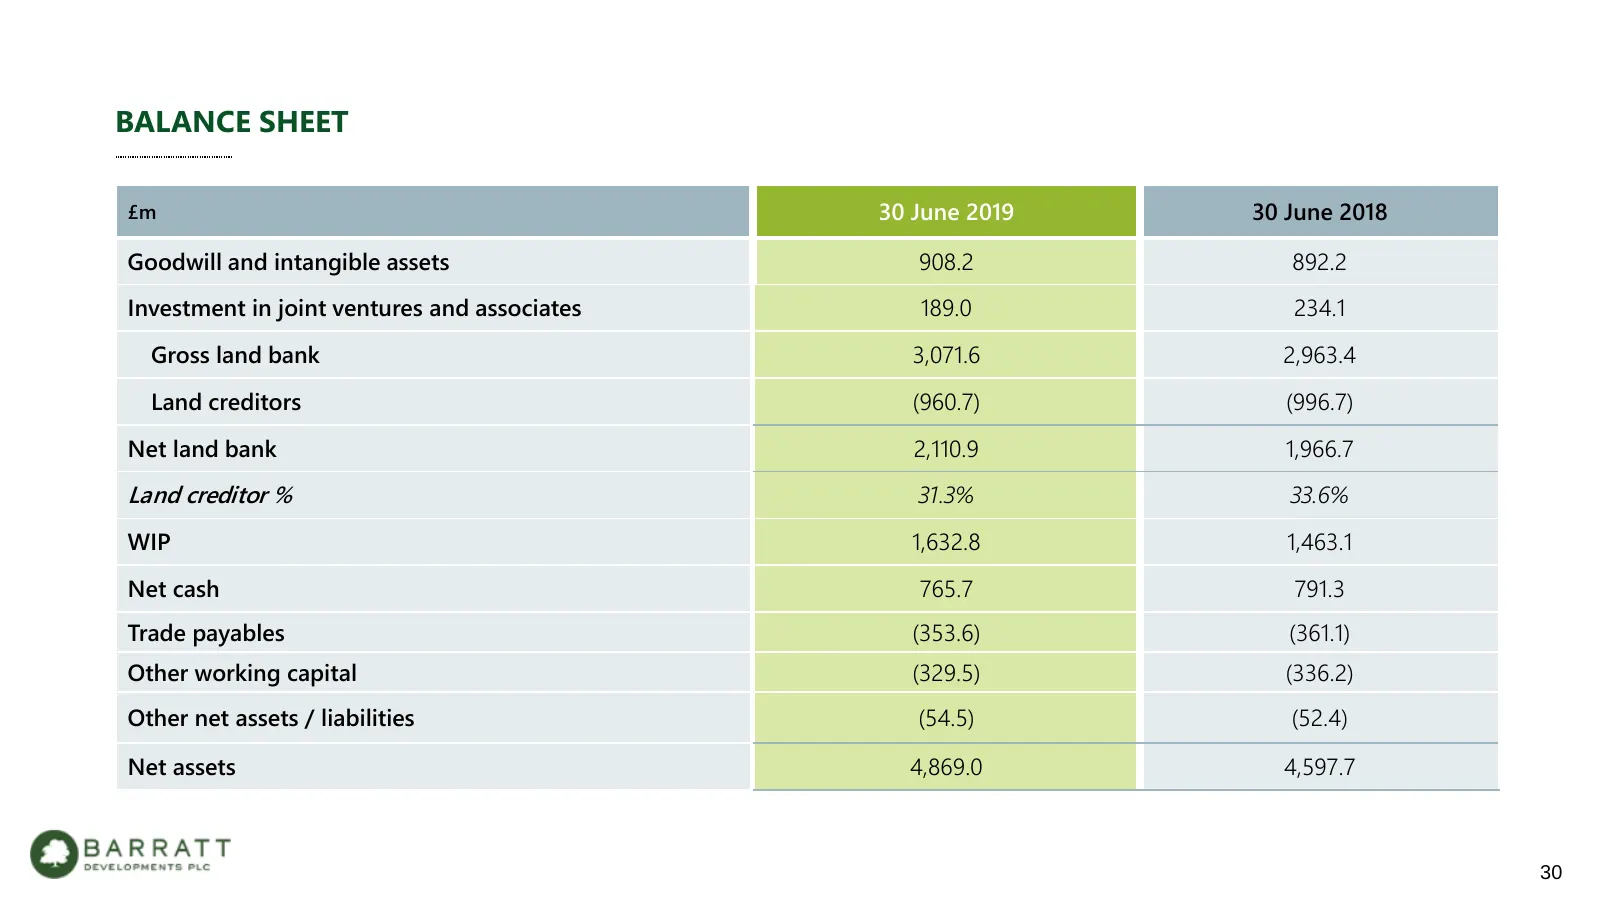
BALANCE SHEET £m 30 June 2019 30 June 2018 Goodwill and intangible assets 908.2 892.2 Investment in joint ventures and associates 189.0 234.1 Gross land bank 3,071.6 2,963.4 Land creditors (960.7) (996.7) Net land bank 2,110.9 1,966.7 Land creditor % 31.3% 33.6% WIP 1,632.8 1,463.1 Net cash 765.7 79
Slide 31: Strong Balance Sheet
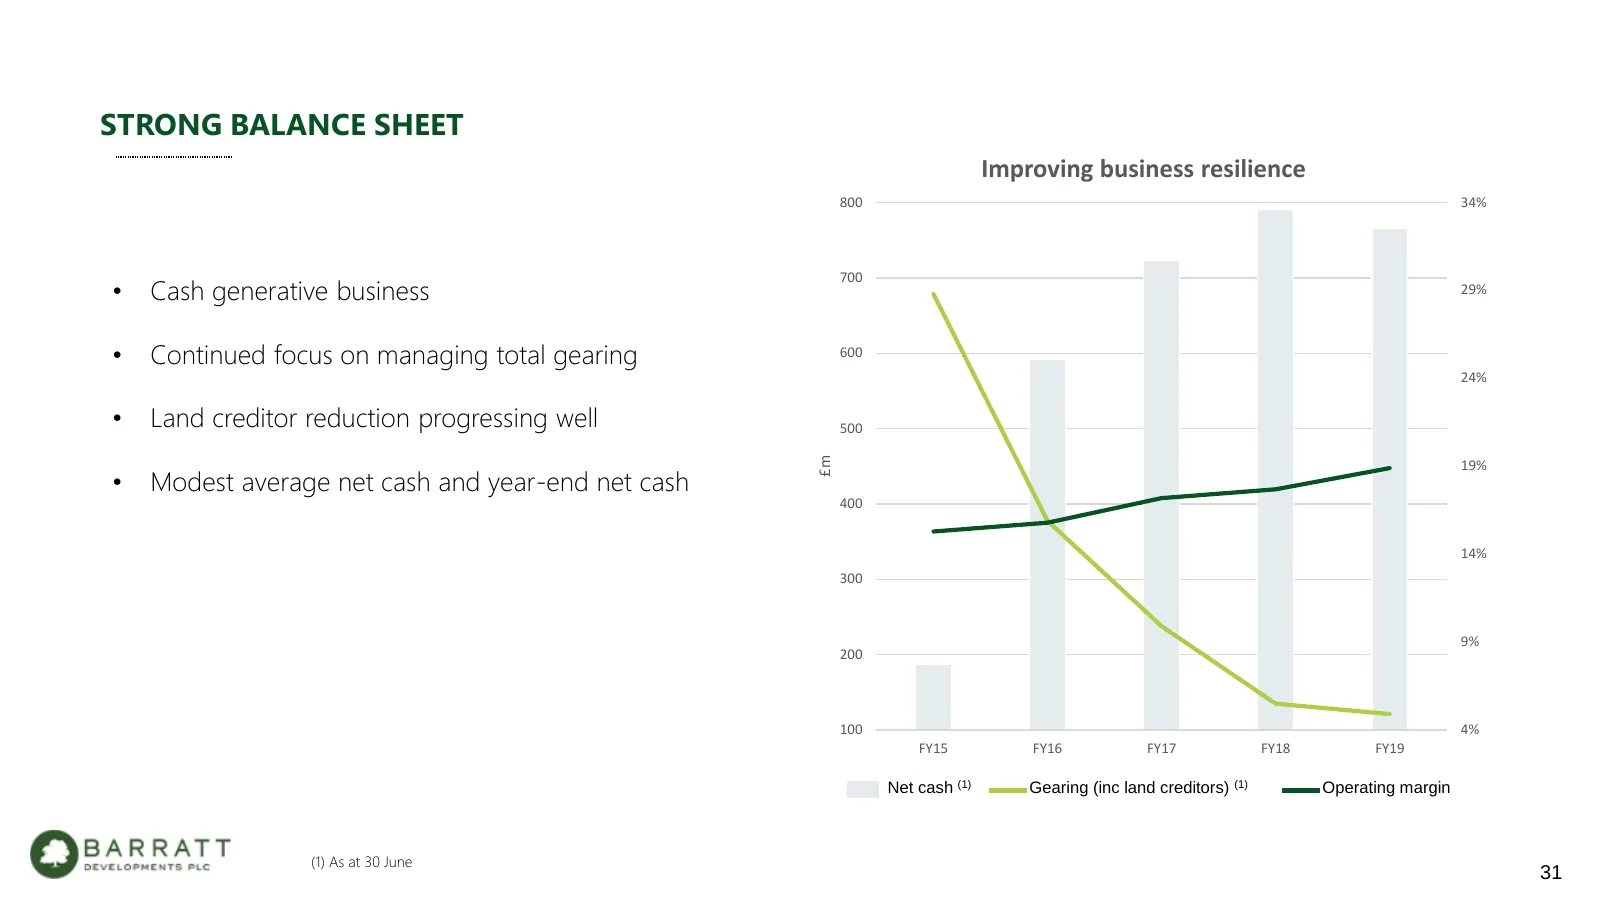
STRONG BALANCE SHEET Improving business resilience 800 34% 700 • Cash generative business 29% • Continued focus on managing total gearing 600 24% • Land creditor reduction progressing well 500 £m 19% • Modest average net cash and year-end net cash 400 14% 300 9% 200 100 4% FY15 FY16 FY17 FY18 FY19 N
Slide 32: Land Bank
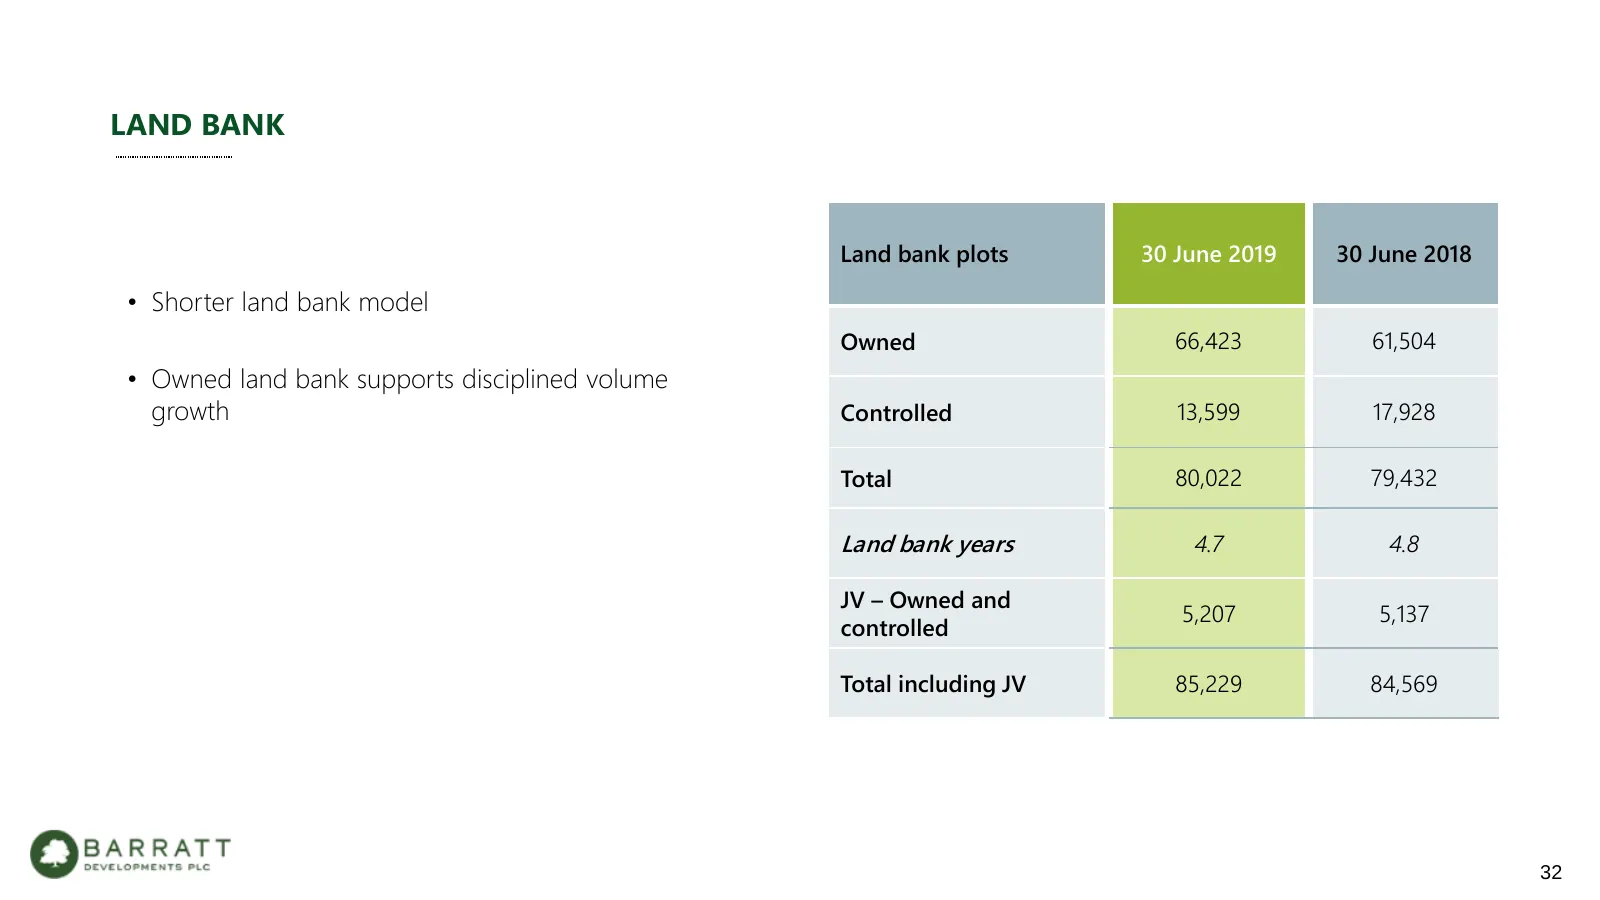
LAND BANK Land bank plots 30 June 2019 30 June 2018 • Shorter land bank model Owned 66,423 61,504 • Owned land bank supports disciplined volume growth Controlled 13,599 17,928 Total 80,022 79,432 Land bank years 4.7 4.8 JV – Owned and 5,207 5,137 controlled Total including JV 85,229 84,569 32
Slide 33: Work in Progress
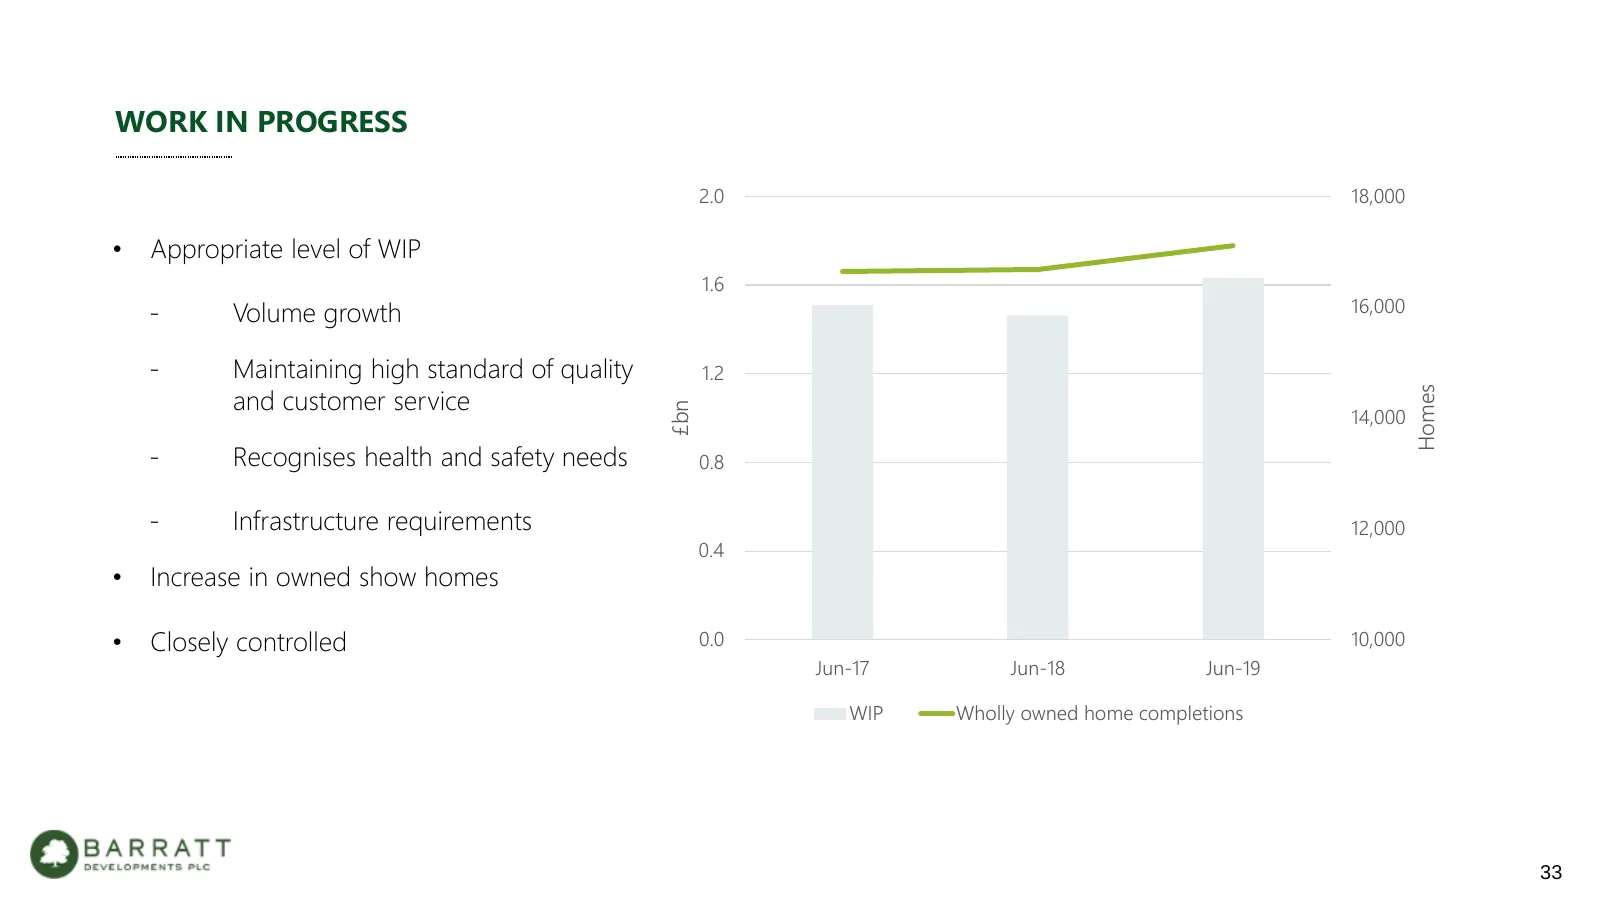
WORK IN PROGRESS 2.0 18,000 • Appropriate level of WIP 1.6 - Volume growth 16,000 - Maintaining high standard of quality 1.2 and customer service Homes £bn 14,000 - Recognises health and safety needs 0.8 - Infrastructure requirements 12,000 0.4 • Increase in owned show homes • Closely controlled 0.0
Slide 34: Joint Ventures – Housebuilding
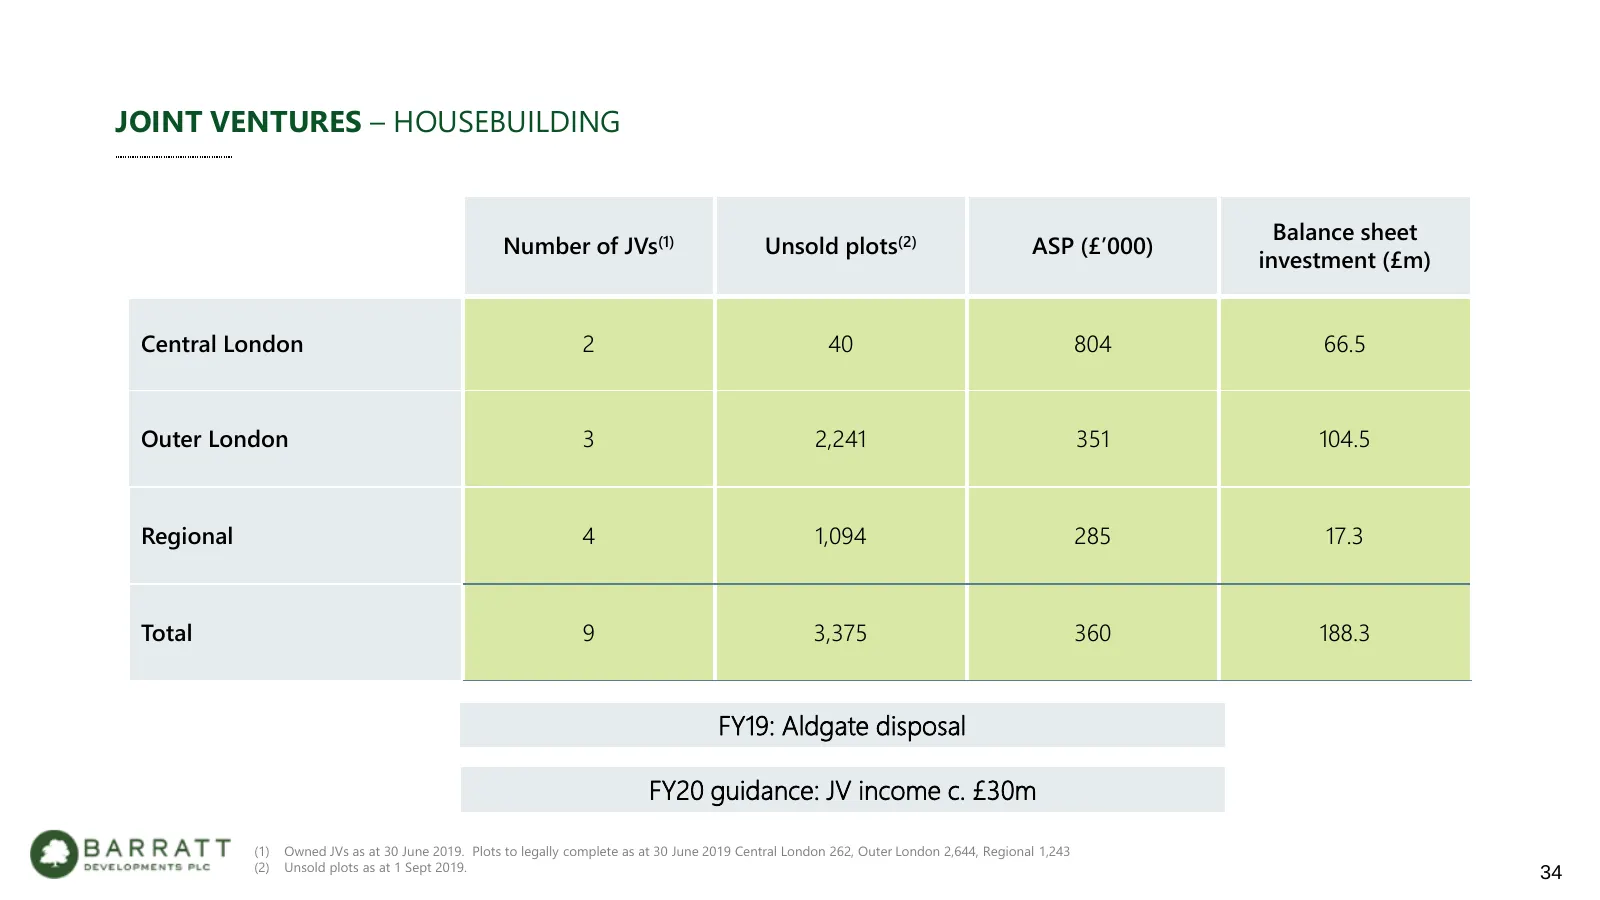
JOINT VENTURES – HOUSEBUILDING Balance sheet Number of JVs(1) Unsold plots(2) ASP (£’000) investment (£m) Central London 2 40 804 66.5 Outer London 3 2,241 351 104.5 Regional 4 1,094 285 17.3 Total 9 3,375 360 188.3 FY19: Aldgate disposal FY20 guidance: JV income c. £30m (1) Owned JVs as at 30 June
Slide 35: Cash Flow
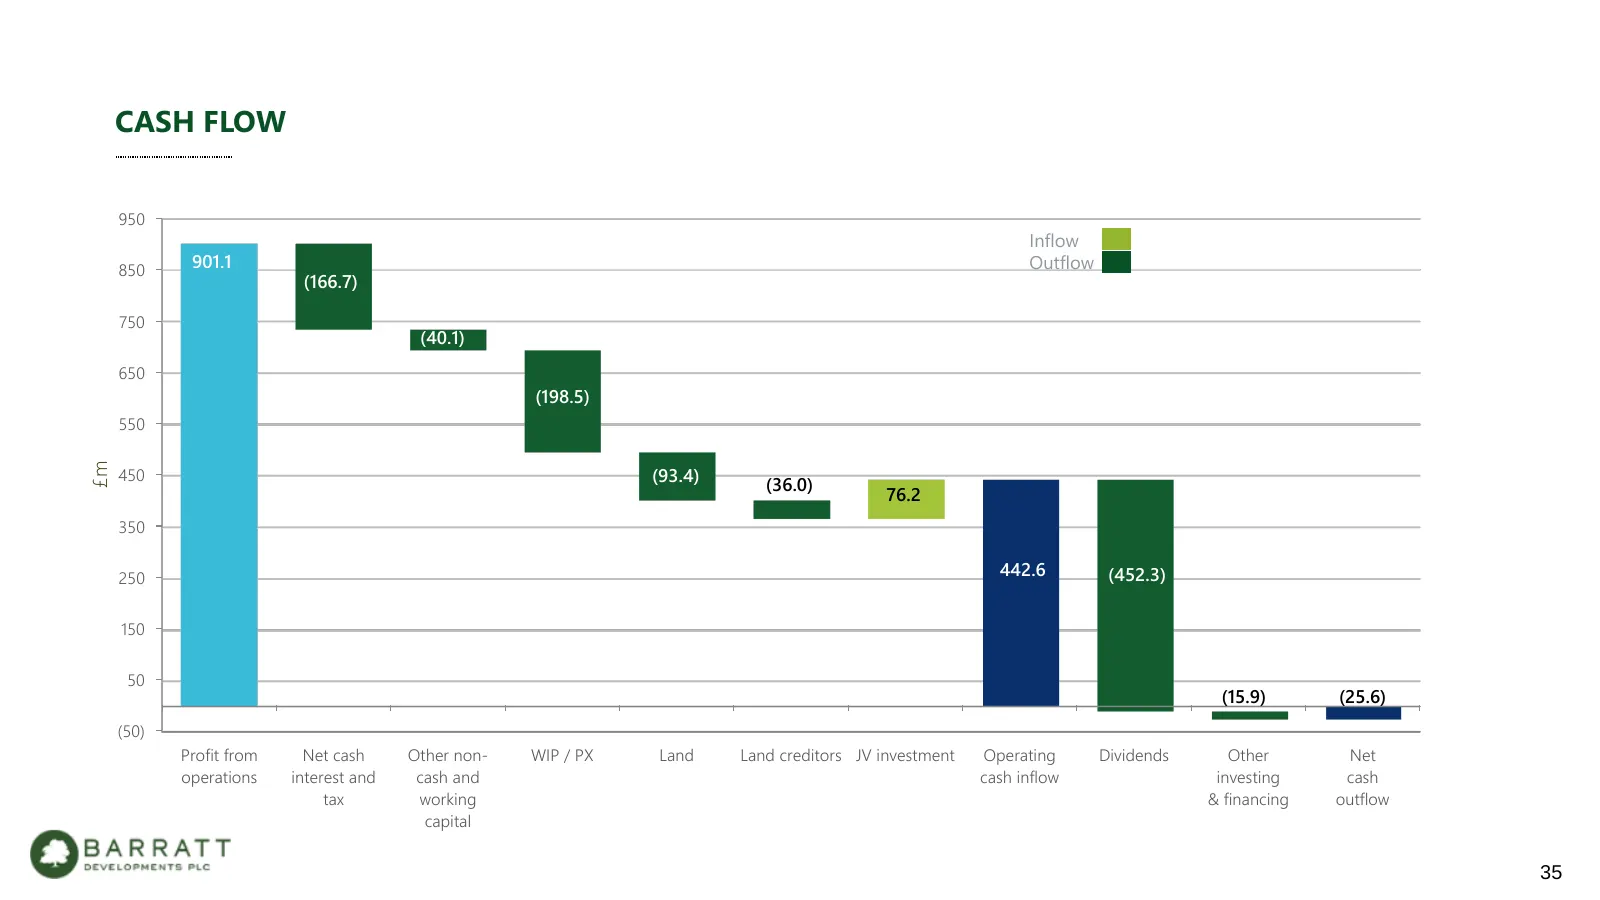
CASH FLOW 950 Inflow 850 901.1 Outflow (166.7) 750 (40.1) 650 (198.5) 550 £m 450 (93.4) (36.0) 76.2 350 250 442.6 (452.3) 150 50 (15.9) (25.6) (50) Profit from Net cash Other non- WIP / PX Land Land creditors JV investment Operating Dividends Other Net operations interest and cash and cash inflow in
Slide 36: Attractive Cash Returns
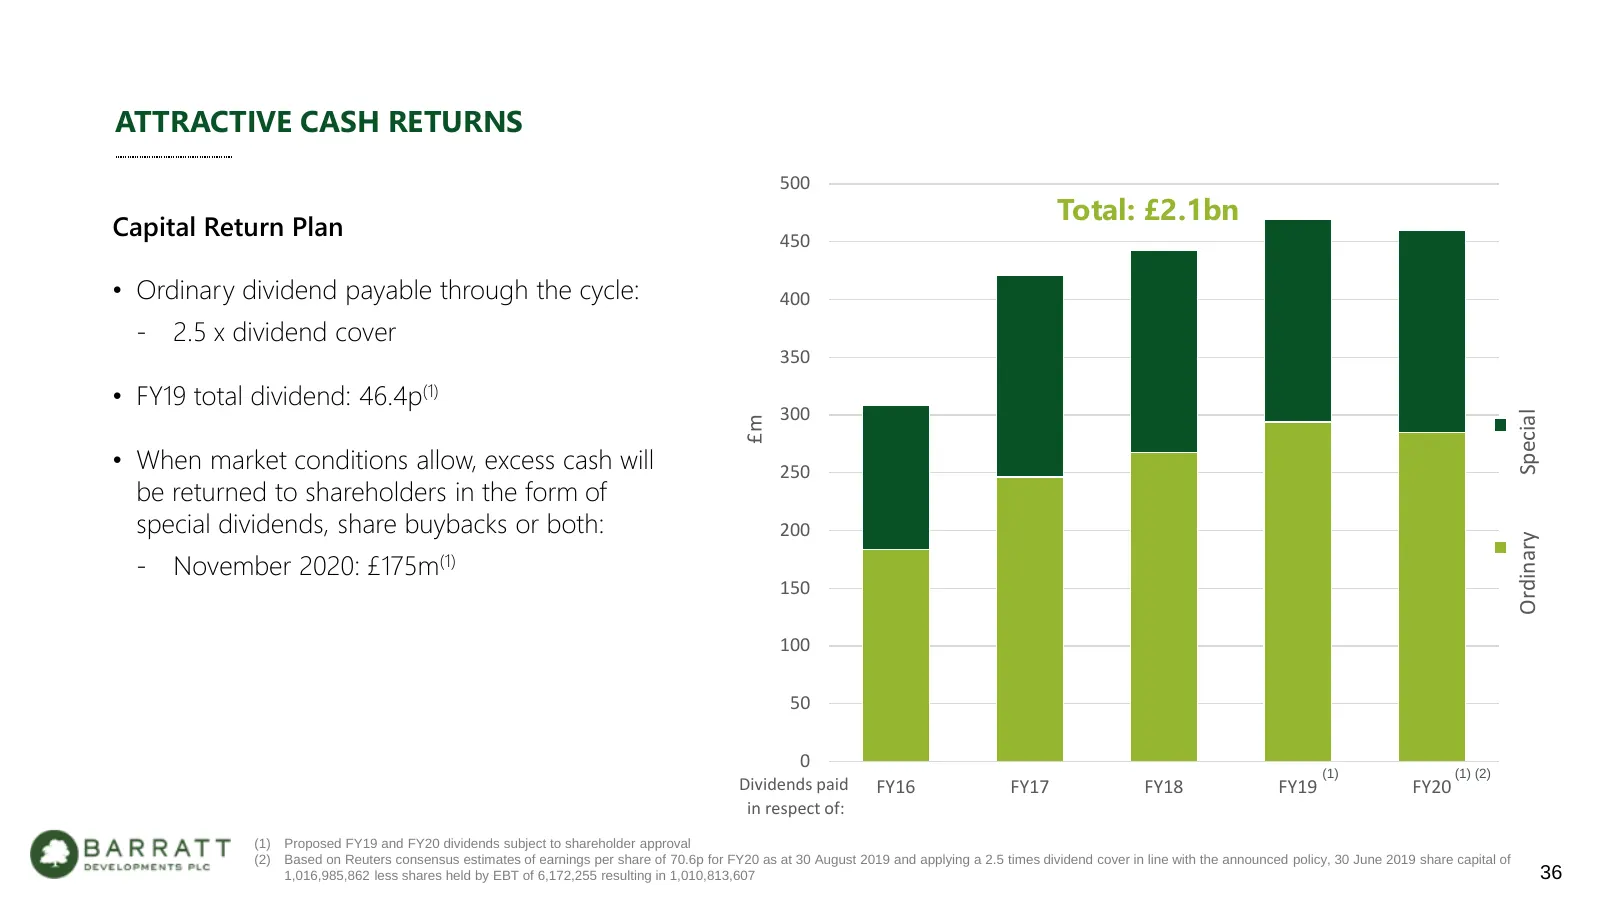
ATTRACTIVE CASH RETURNS 500 Total: £2.1bn Capital Return Plan 450 • Ordinary dividend payable through the cycle: 400 - 2.5 x dividend cover 350 • FY19 total dividend: 46.4p(1) 300 Special £m • When market conditions allow, excess cash will 250 be returned to shareholders in the form of special divid
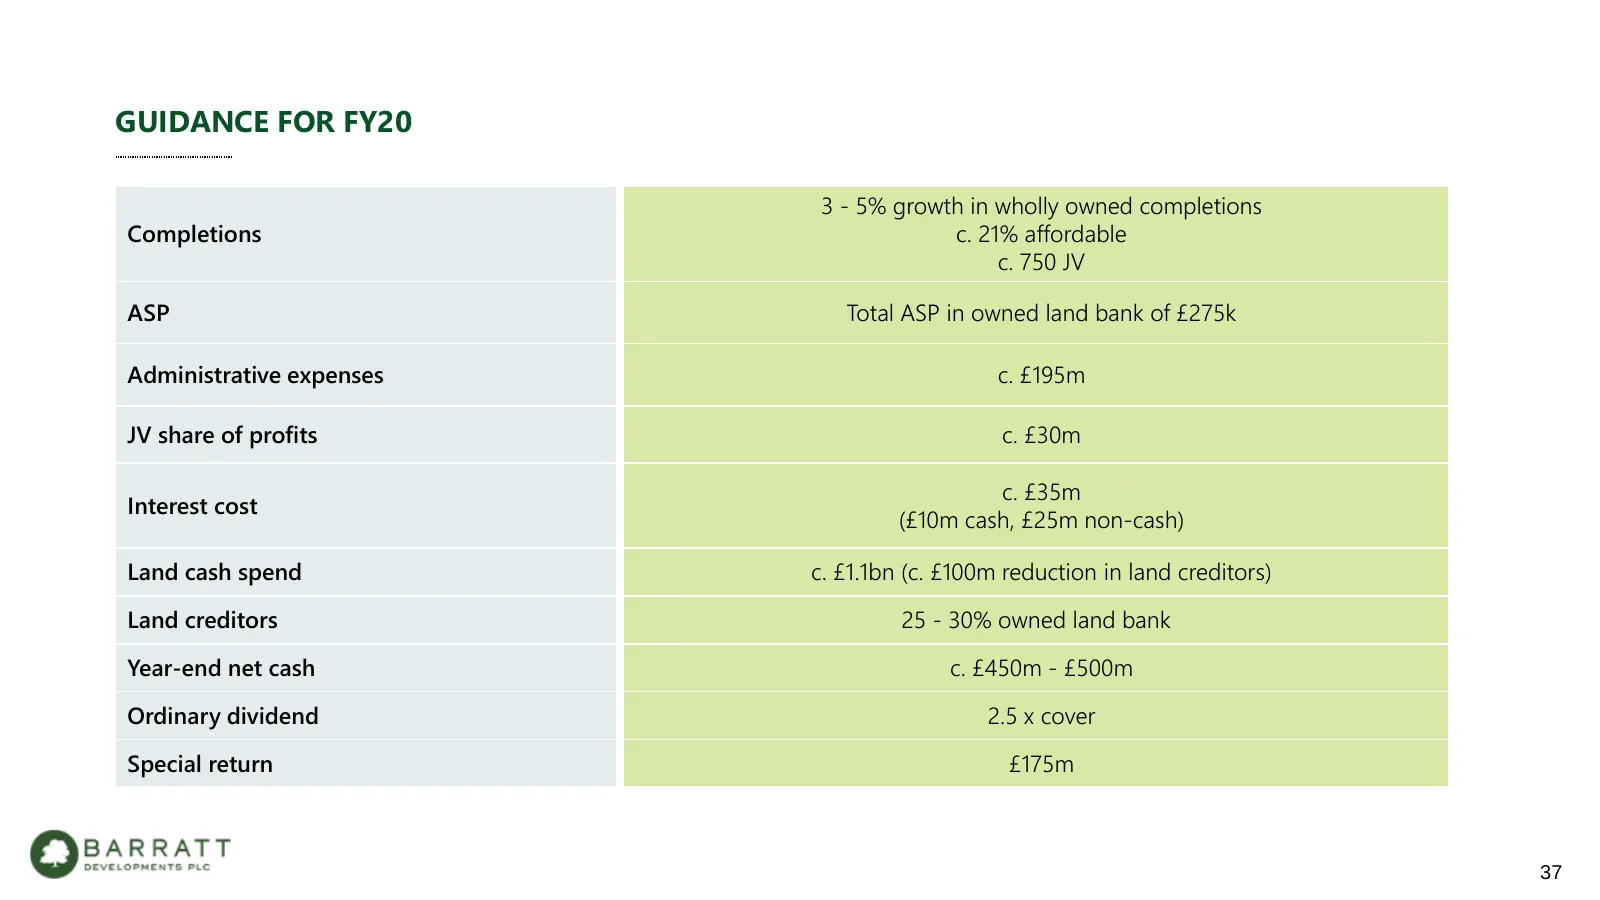
Slide 37: Guidance for FY20
GUIDANCE FOR FY20 3 - 5% growth in wholly owned completions Completions c. 21% affordable c. 750 JV ASP Total ASP in owned land bank of £275k Administrative expenses c. £195m JV share of profits c. £30m c. £35m Interest cost (£10m cash, £25m non-cash) Land cash spend c. £1.1bn (c. £100m reduction in
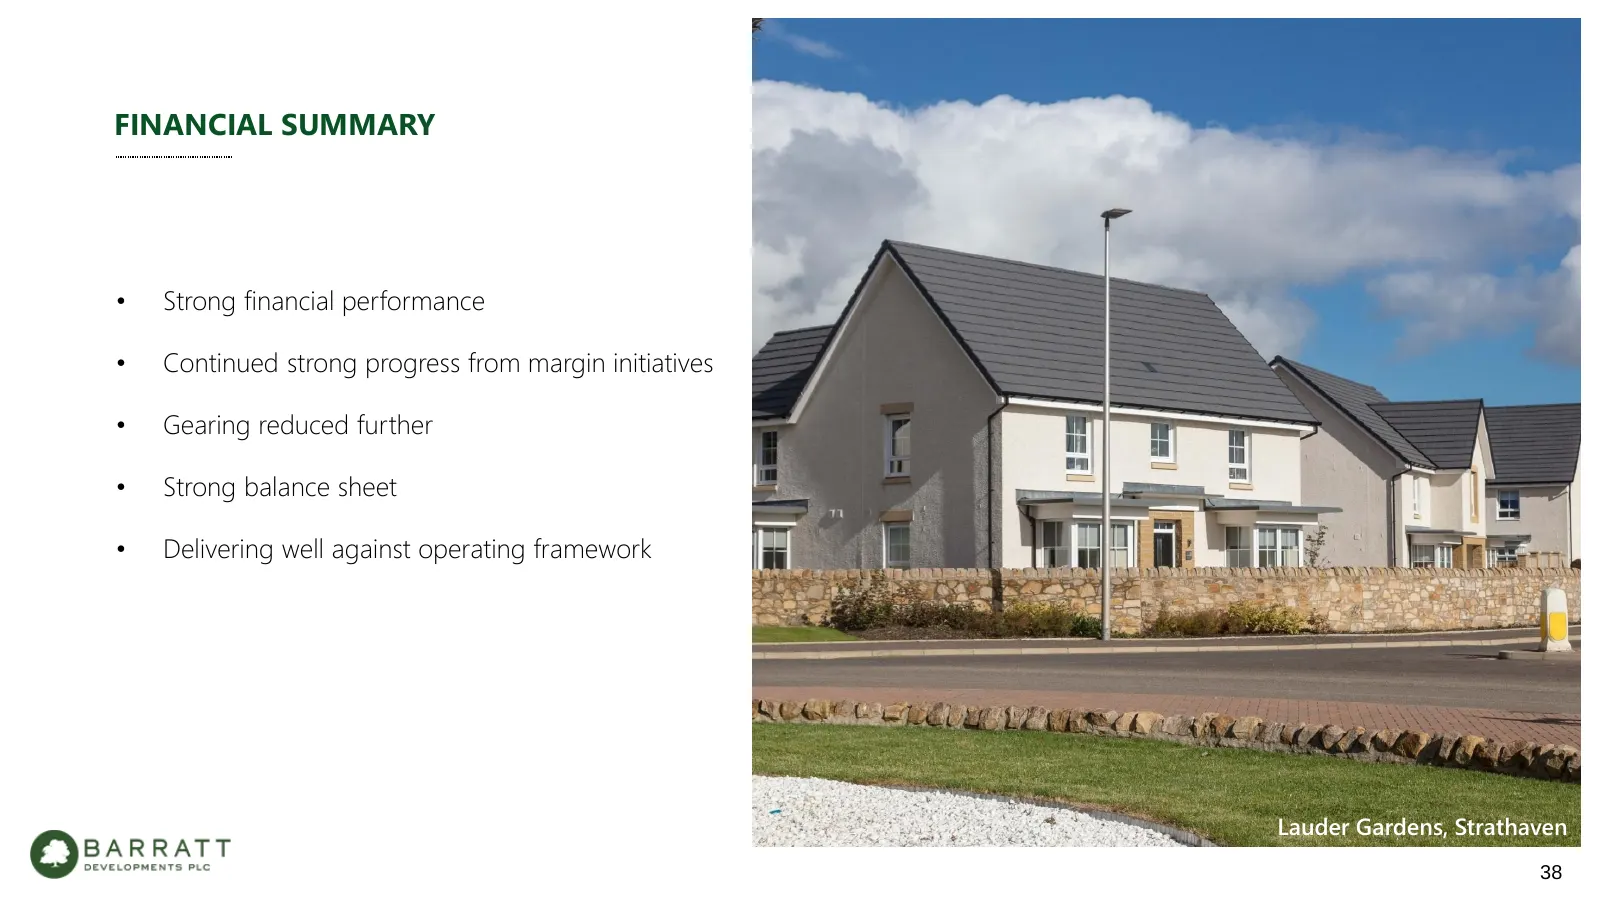
Slide 38: Financial Summary
FINANCIAL SUMMARY • Strong financial performance • Continued strong progress from margin initiatives • Gearing reduced further • Strong balance sheet • Delivering well against operating framework Lauder Gardens, Strathaven Minerva, r 38
Slide 39: David Thomas, Chief Executive
David Thomas Chief Executive Swanbourne Park, Angmering 39
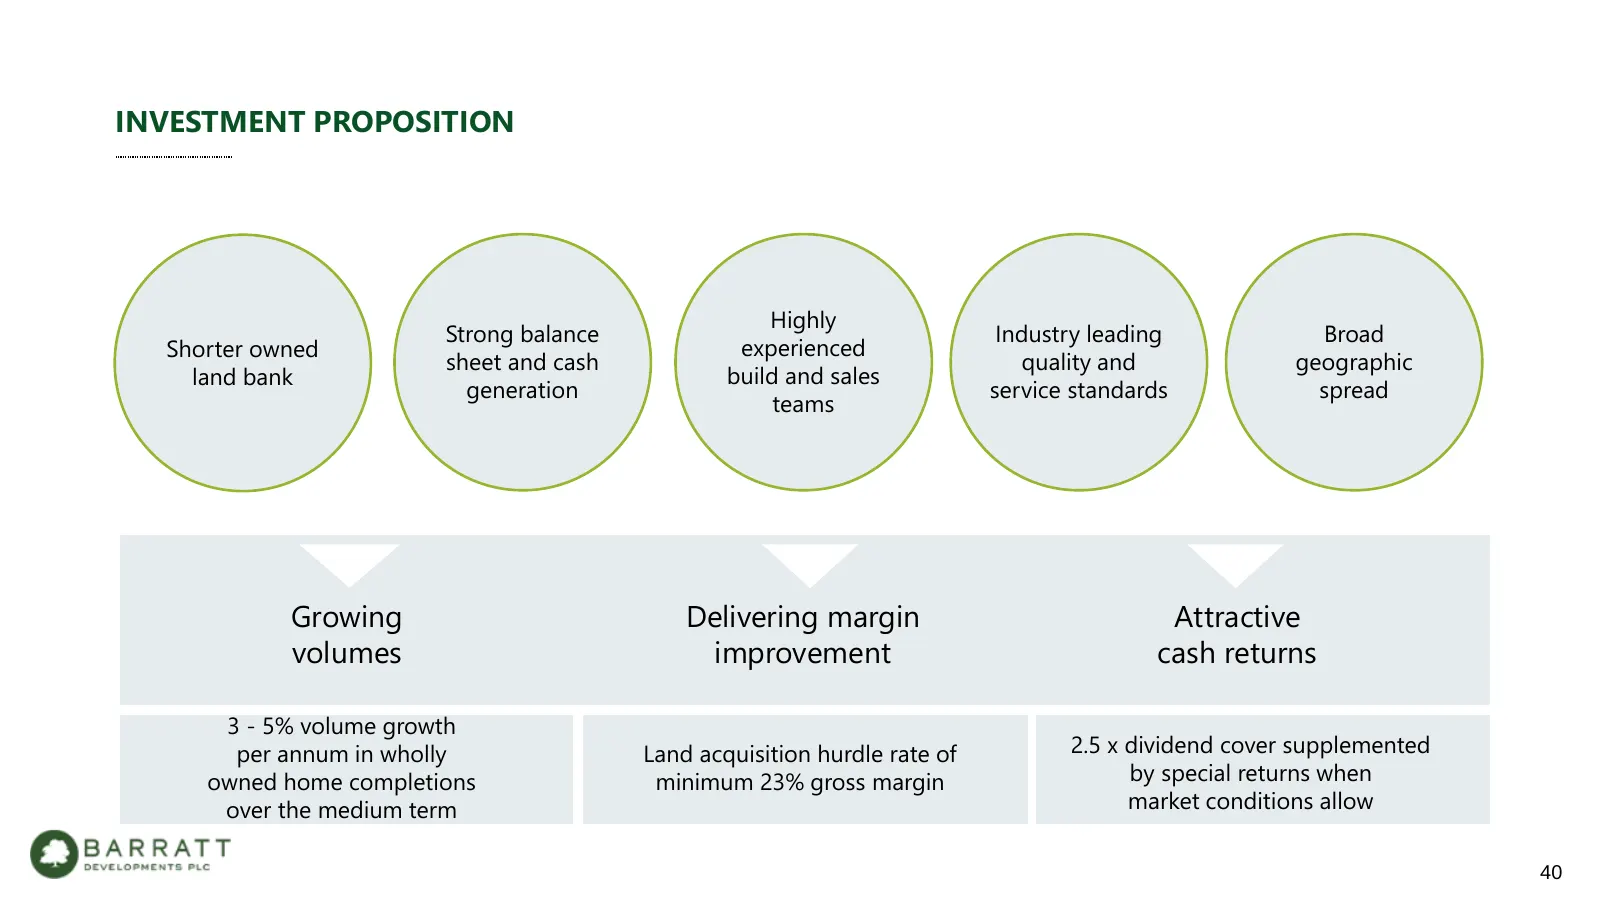
Slide 40: Investment Proposition
INVESTMENT PROPOSITION Highly Strong balance Industry leading Broad Shorter owned experienced sheet and cash quality and geographic land bank build and sales generation service standards spread teams Growing Delivering margin Attractive volumes improvement cash returns 3 - 5% volume growth per annum
Slide 41: Market Fundamentals Remain Attractive
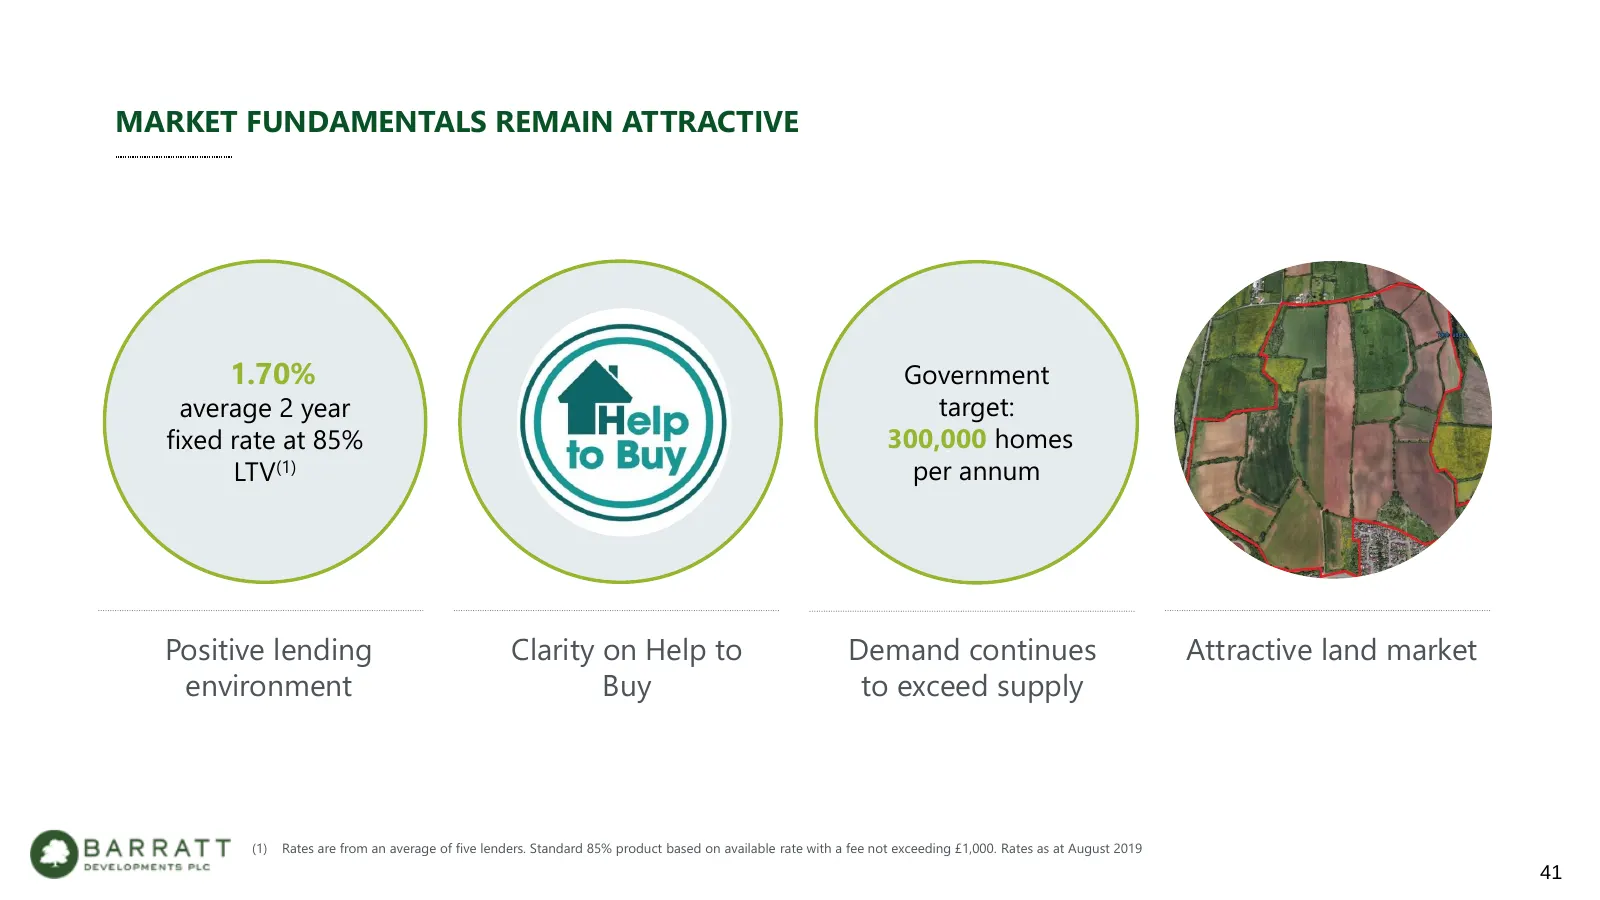
MARKET FUNDAMENTALS REMAIN ATTRACTIVE 1.70% Government average 2 year target: fixed rate at 85% 300,000 homes LTV(1) per annum Positive lending Clarity on Help to Demand continues Attractive land market environment Buy to exceed supply (1) Rates are from an average of five lenders. Standard 85% prod
Slide 42: Positive Lending Environment – Affordability
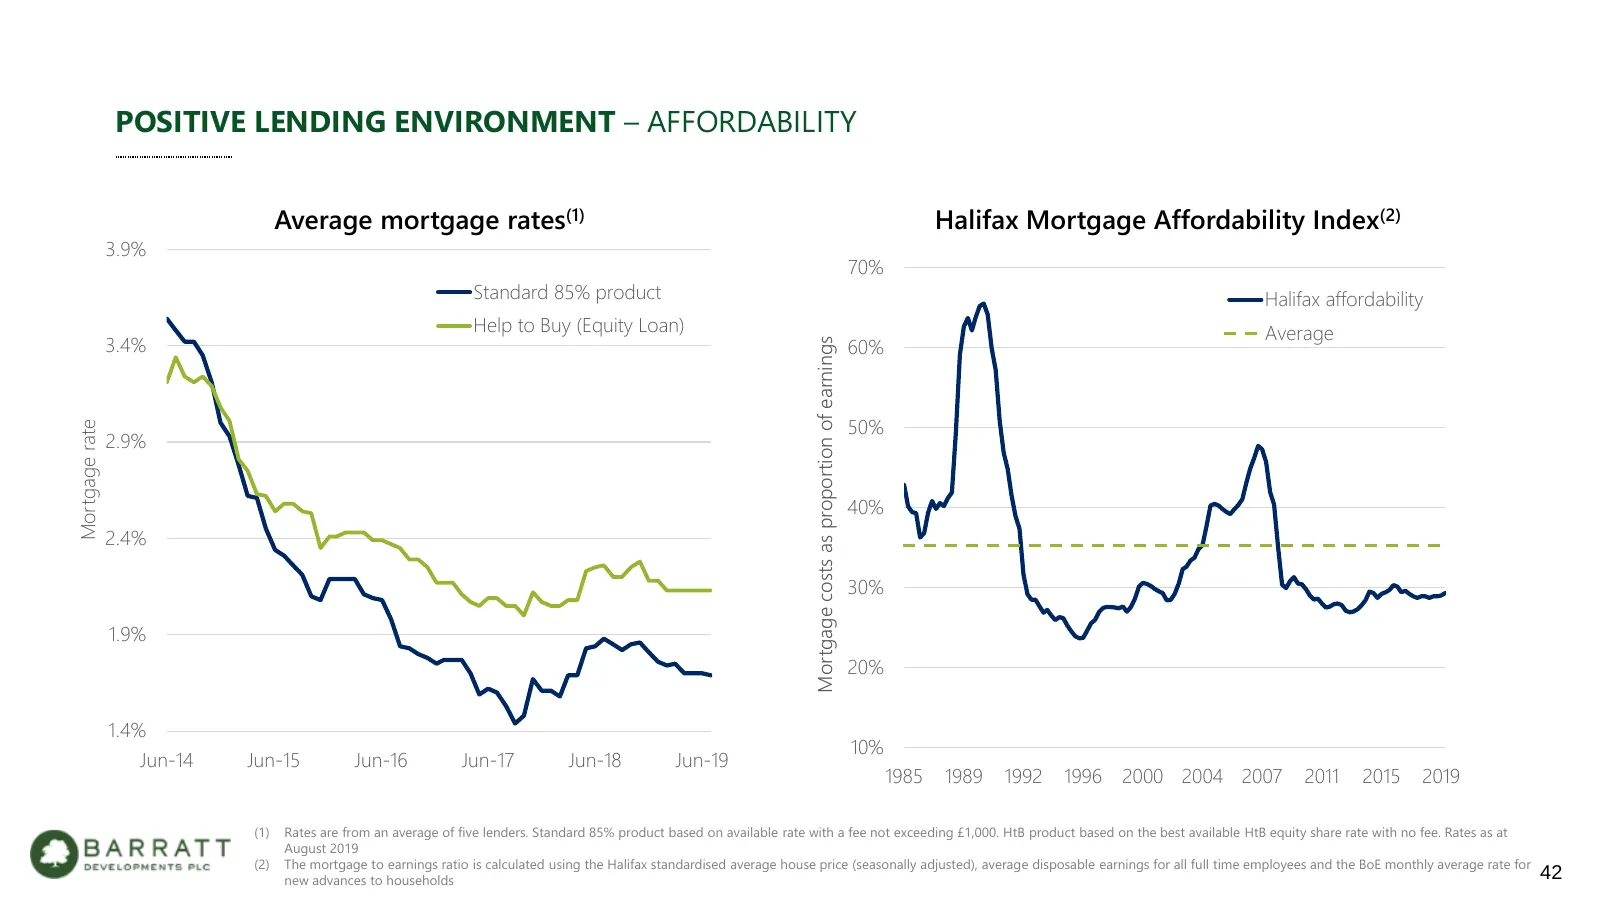
POSITIVE LENDING ENVIRONMENT – AFFORDABILITY Average mortgage rates(1) Halifax Mortgage Affordability Index(2) 3.9% 70% Standard 85% product Halifax affordability Help to Buy (Equity Loan) Average 3.4% 60% Mortgage costs as proportion of earnings 50% Mortgage rate 2.9% 40% 2.4% 30% 1.9% 20% 1.4% 10%
Slide 43: Our Priorities and Principles – Delivering for the Long Term
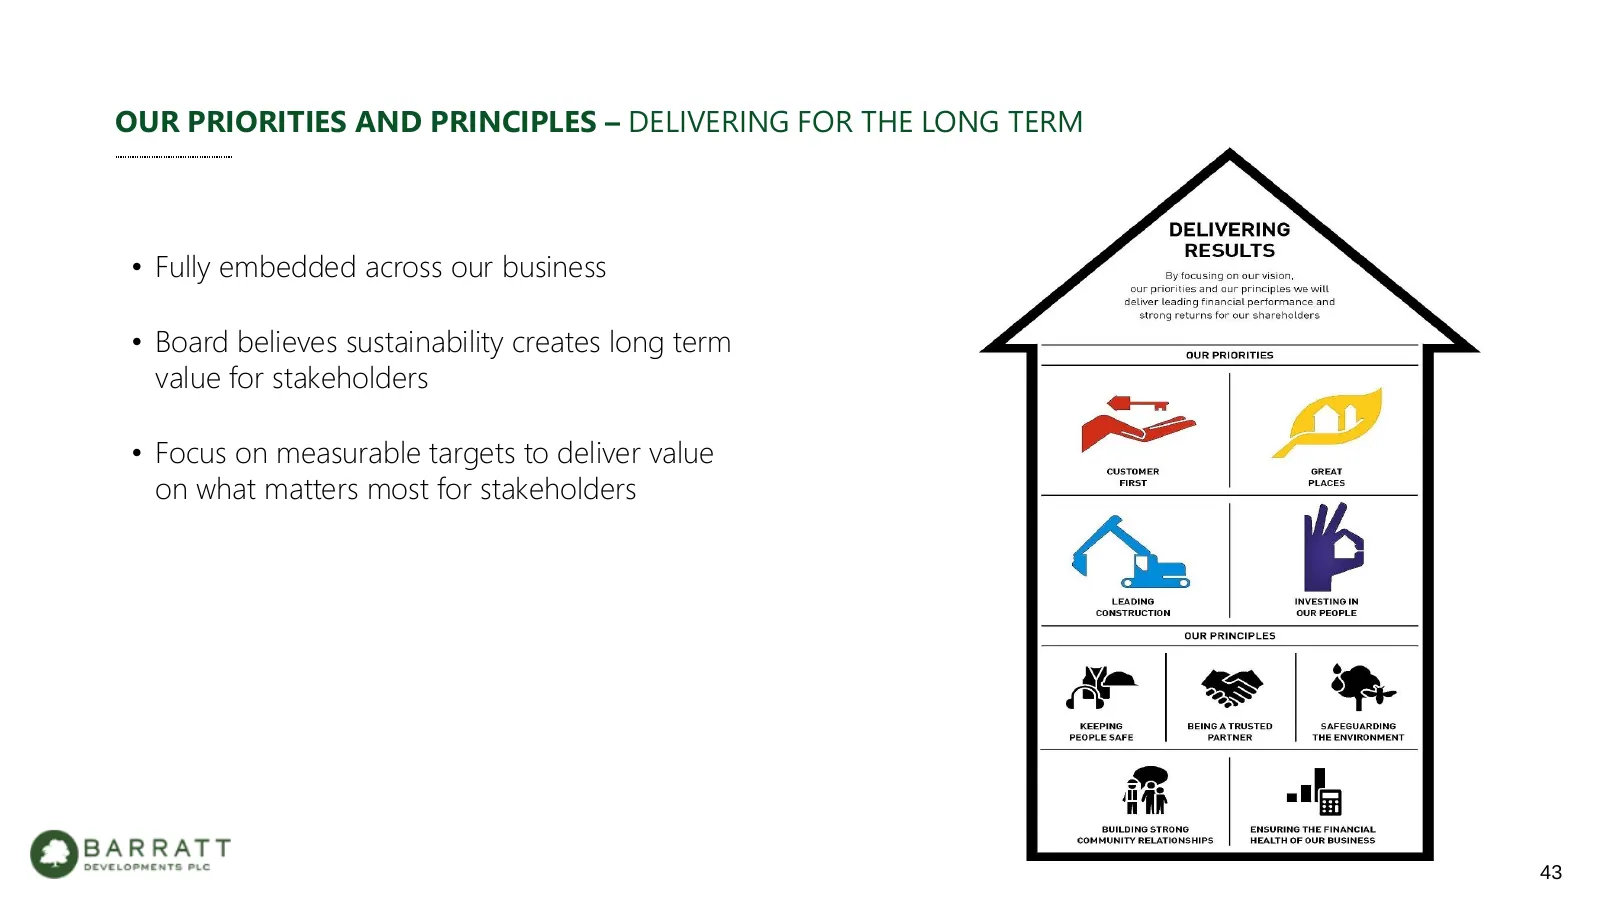
OUR PRIORITIES AND PRINCIPLES – DELIVERING FOR THE LONG TERM • Fully embedded across our business • Board believes sustainability creates long term value for stakeholders • Focus on measurable targets to deliver value on what matters most for stakeholders 43

Slide 44: Investing in Our People
INVESTING IN OUR PEOPLE • Future talent 7% of employees • 269 new apprentices, trainees and graduates, 32% increase from FY18 • Award winning employment schemes • Reduced employee turnover to 16% 44
Slide 45: Building a Sustainable Business
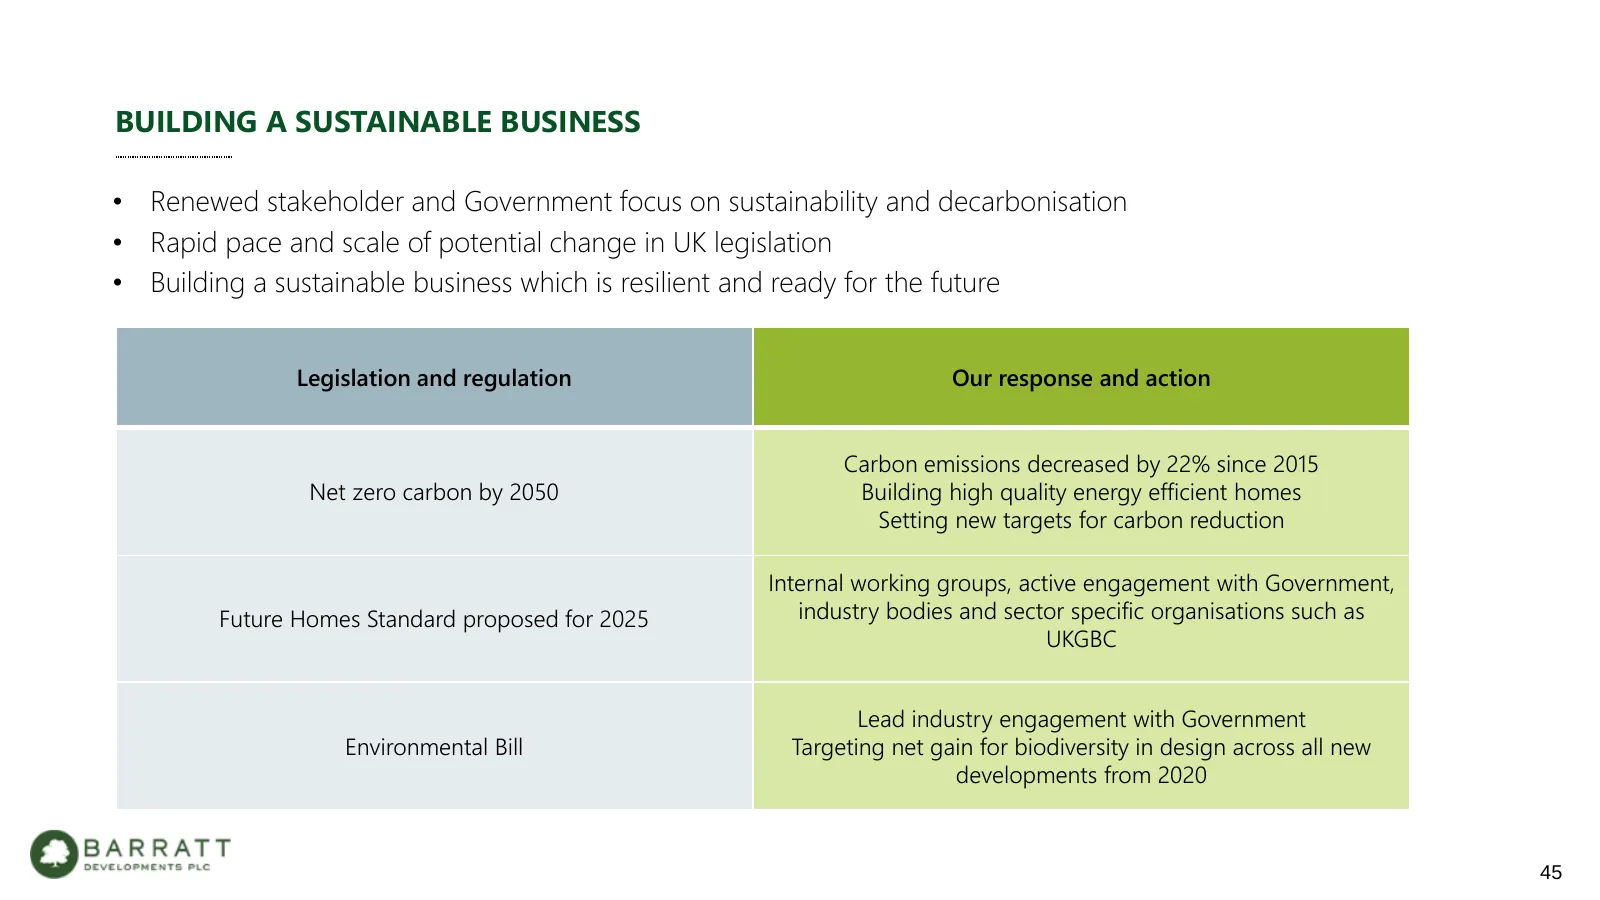
BUILDING A SUSTAINABLE BUSINESS • Renewed stakeholder and Government focus on sustainability and decarbonisation • Rapid pace and scale of potential change in UK legislation • Building a sustainable business which is resilient and ready for the future Legislation and regulation Our response and acti
Slide 46: Our Charitable Giving
OUR CHARITABLE GIVING • Aim to be industry leading in charitable giving and social responsibility • St Mungo’s – new 3 year partnership - £500,000 • £750,000 to RBLI to support the construction of Centenary Village to provide crucial housing support to ex-servicemen and women • Support local chariti
Slide 47: Current Trading
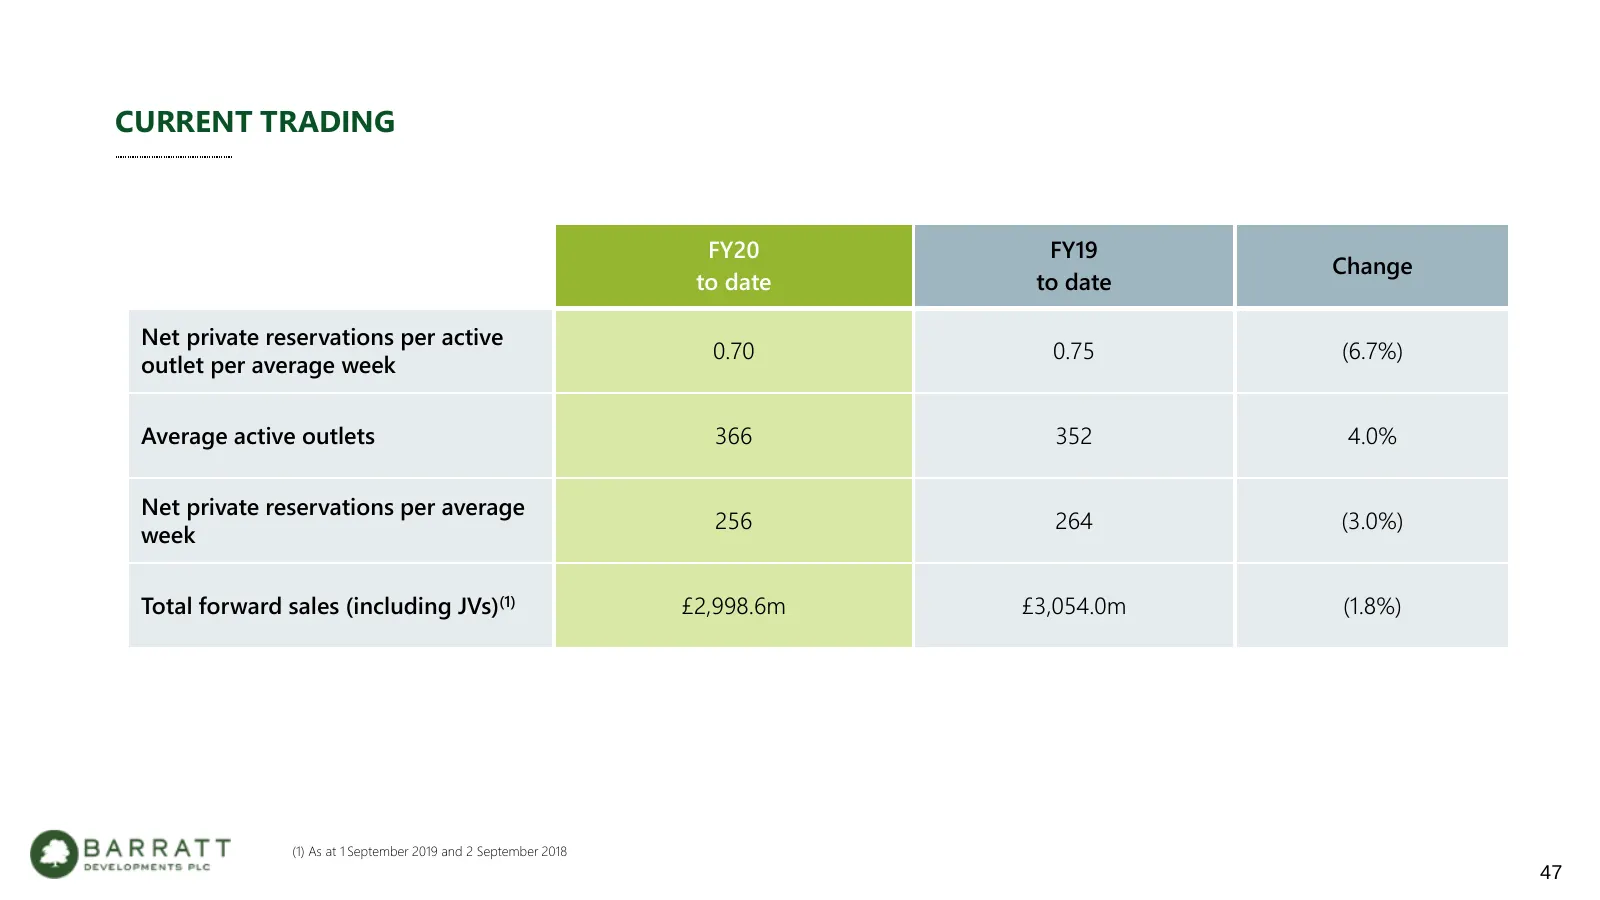
CURRENT TRADING FY20 FY19 Change to date to date Net private reservations per active 0.70 0.75 (6.7%) outlet per average week Average active outlets 366 352 4.0% Net private reservations per average 256 264 (3.0%) week Total forward sales (including JVs)(1) £2,998.6m £3,054.0m (1.8%) (1) As at 1 Sep
Slide 48: Positive on Outlook
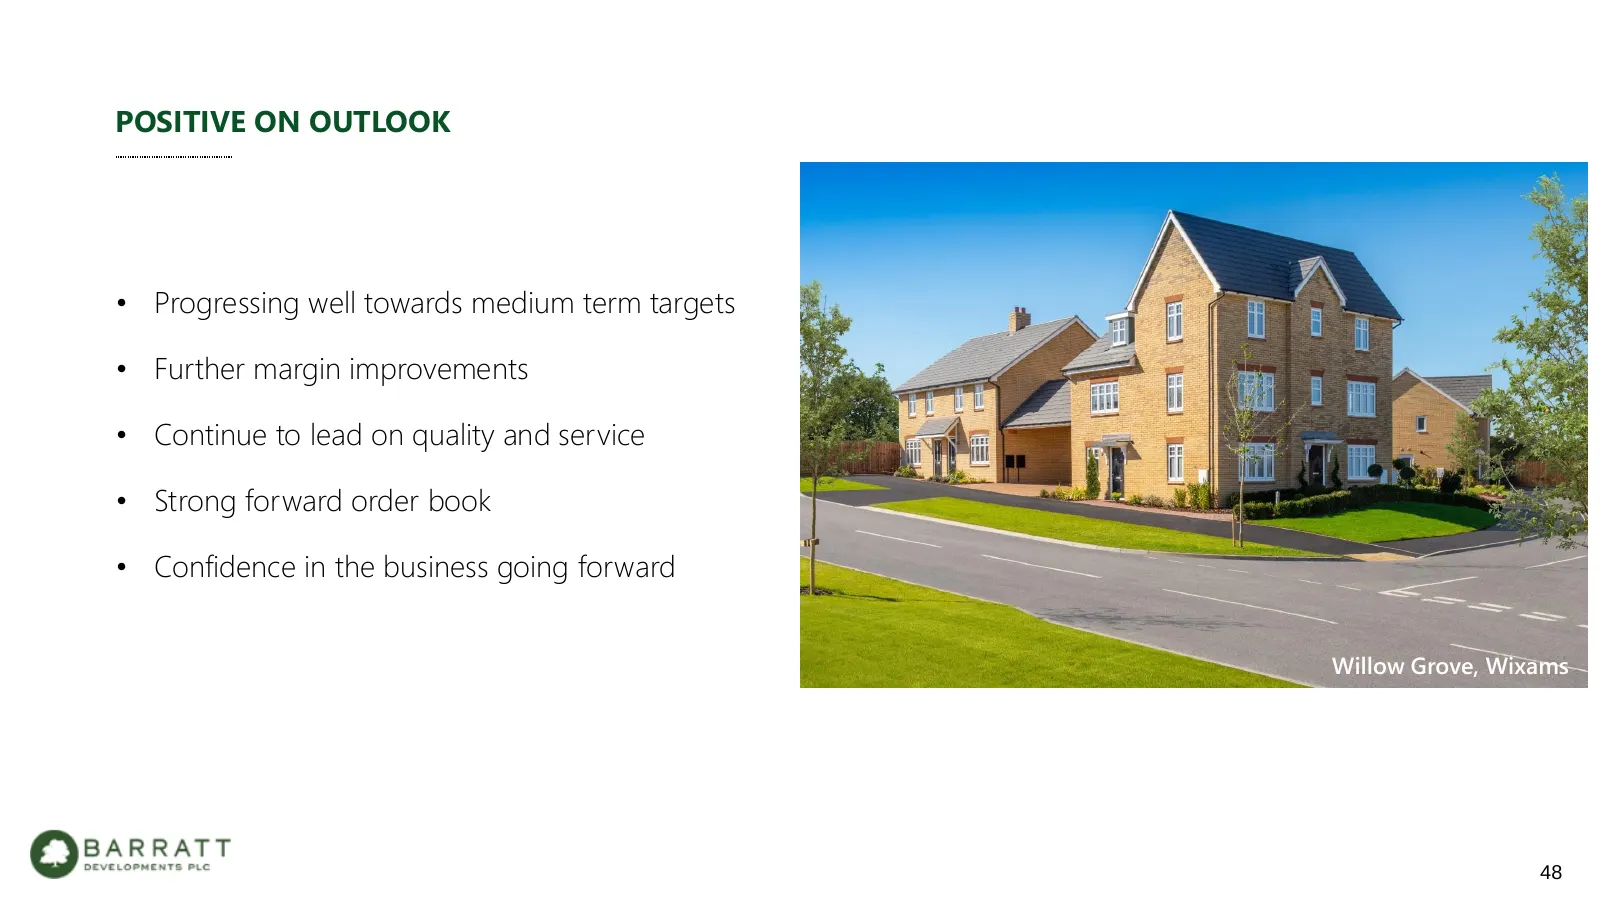
POSITIVE ON OUTLOOK • Progressing well towards medium term targets • Further margin improvements • Continue to lead on quality and service • Strong forward order book • Confidence in the business going forward Willow Grove, Wixams 48
Slide 49: Q&A
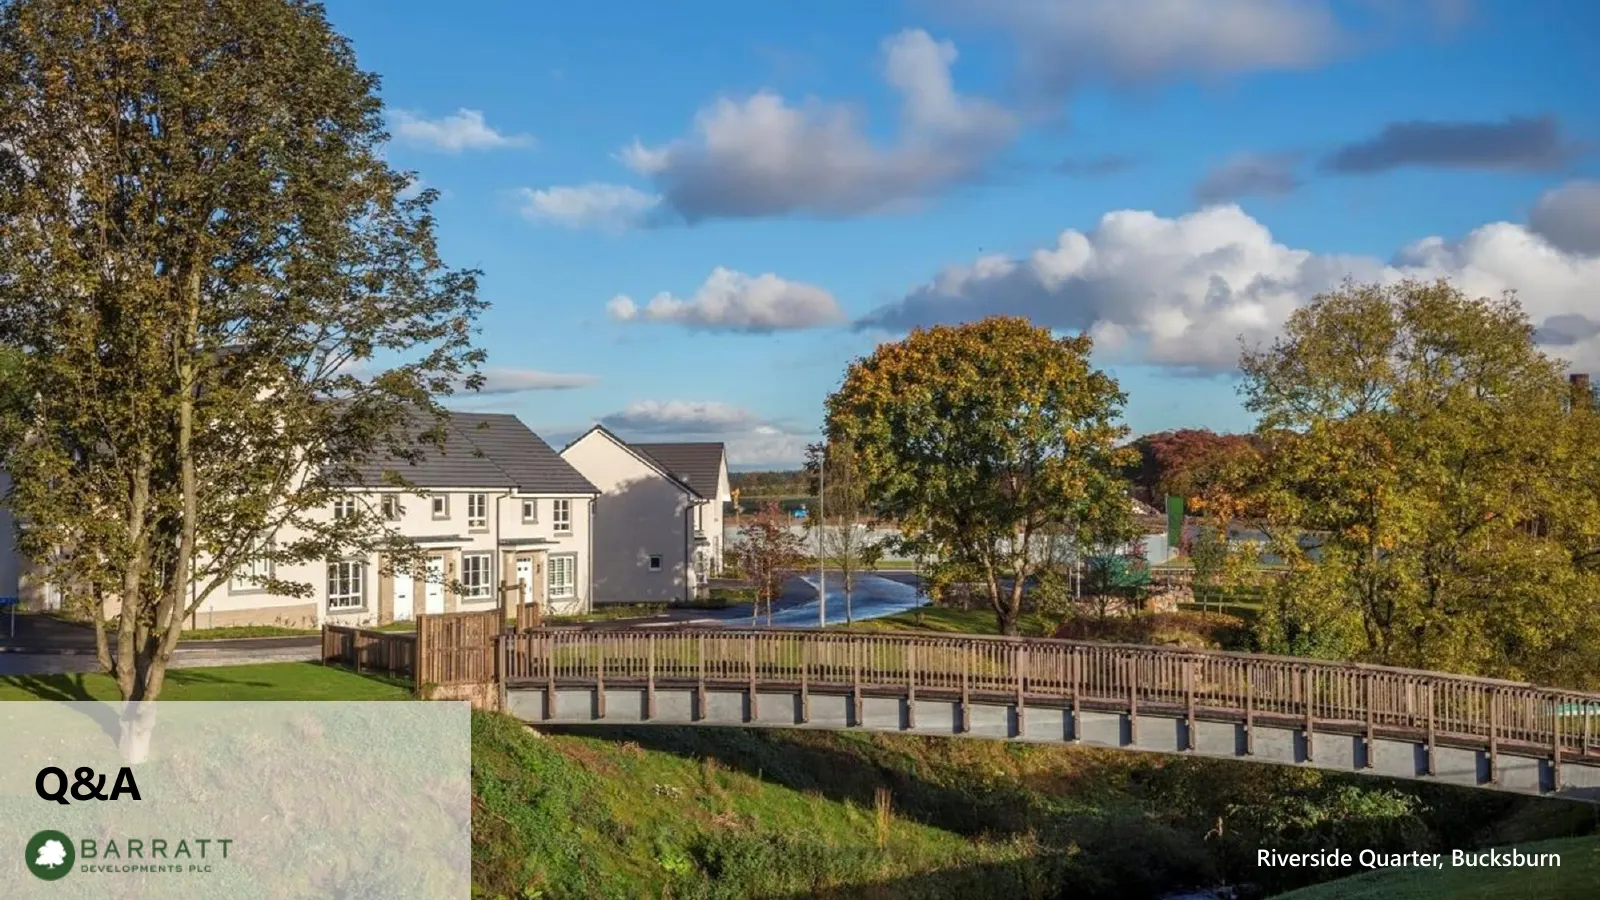
Q&A Riverside Quarter, Bucksburn 49
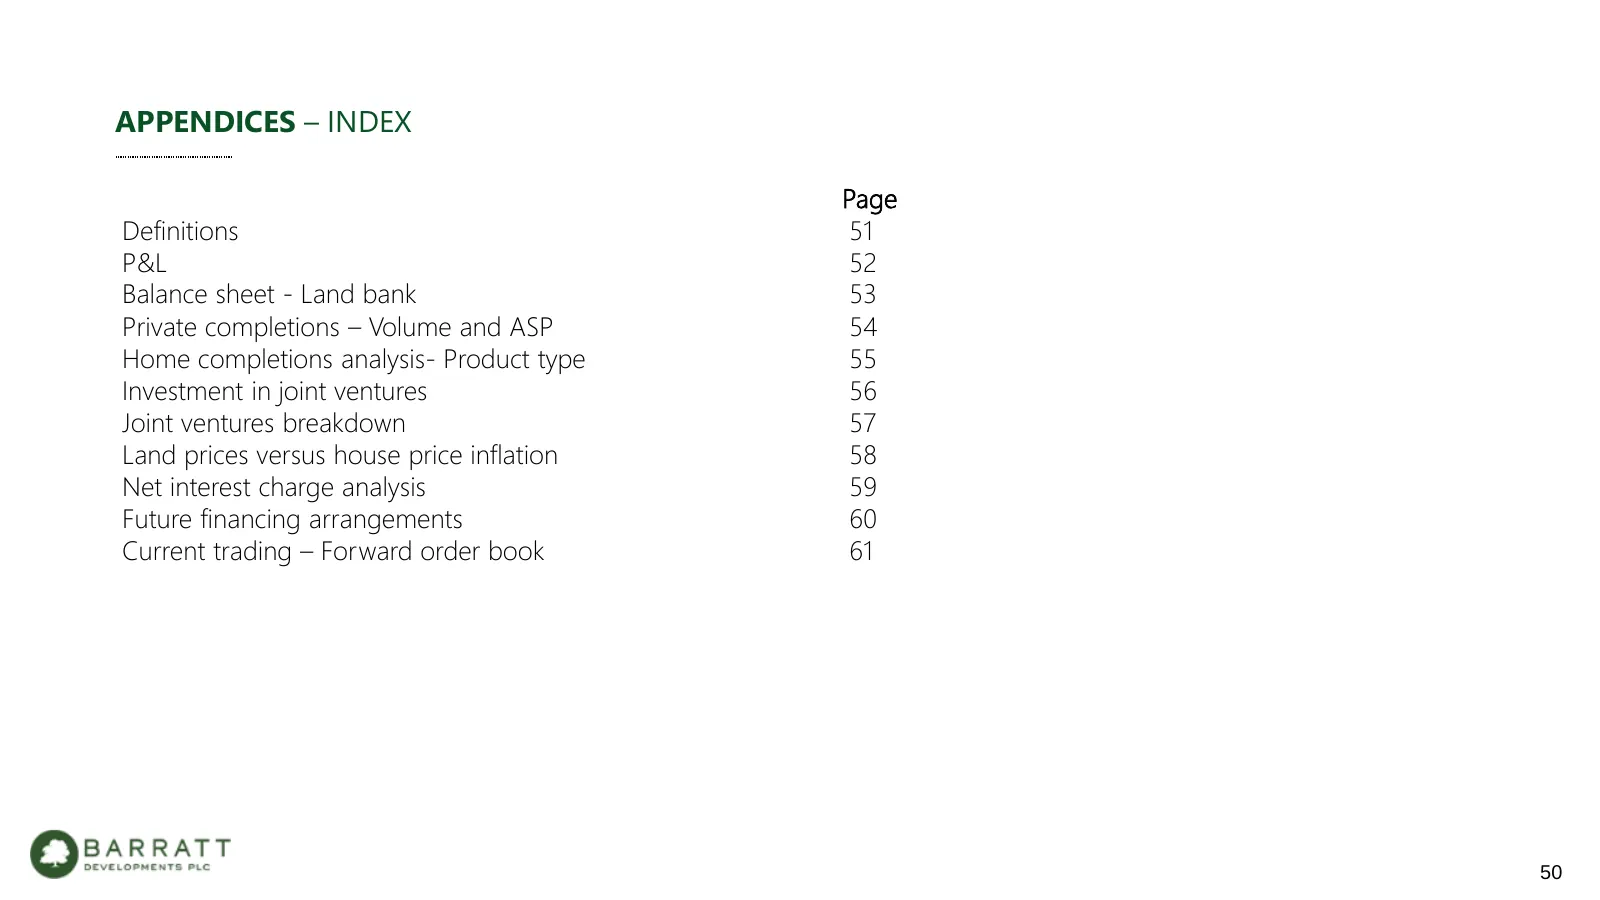
Slide 50: Appendices – Index
APPENDICES – INDEX Page Definitions 51 P&L 52 Balance sheet - Land bank 53 Private completions – Volume and ASP 54 Home completions analysis- Product type 55 Investment in joint ventures 56 Joint ventures breakdown 57 Land prices versus house price inflation 58 Net interest charge analysis 59 Future
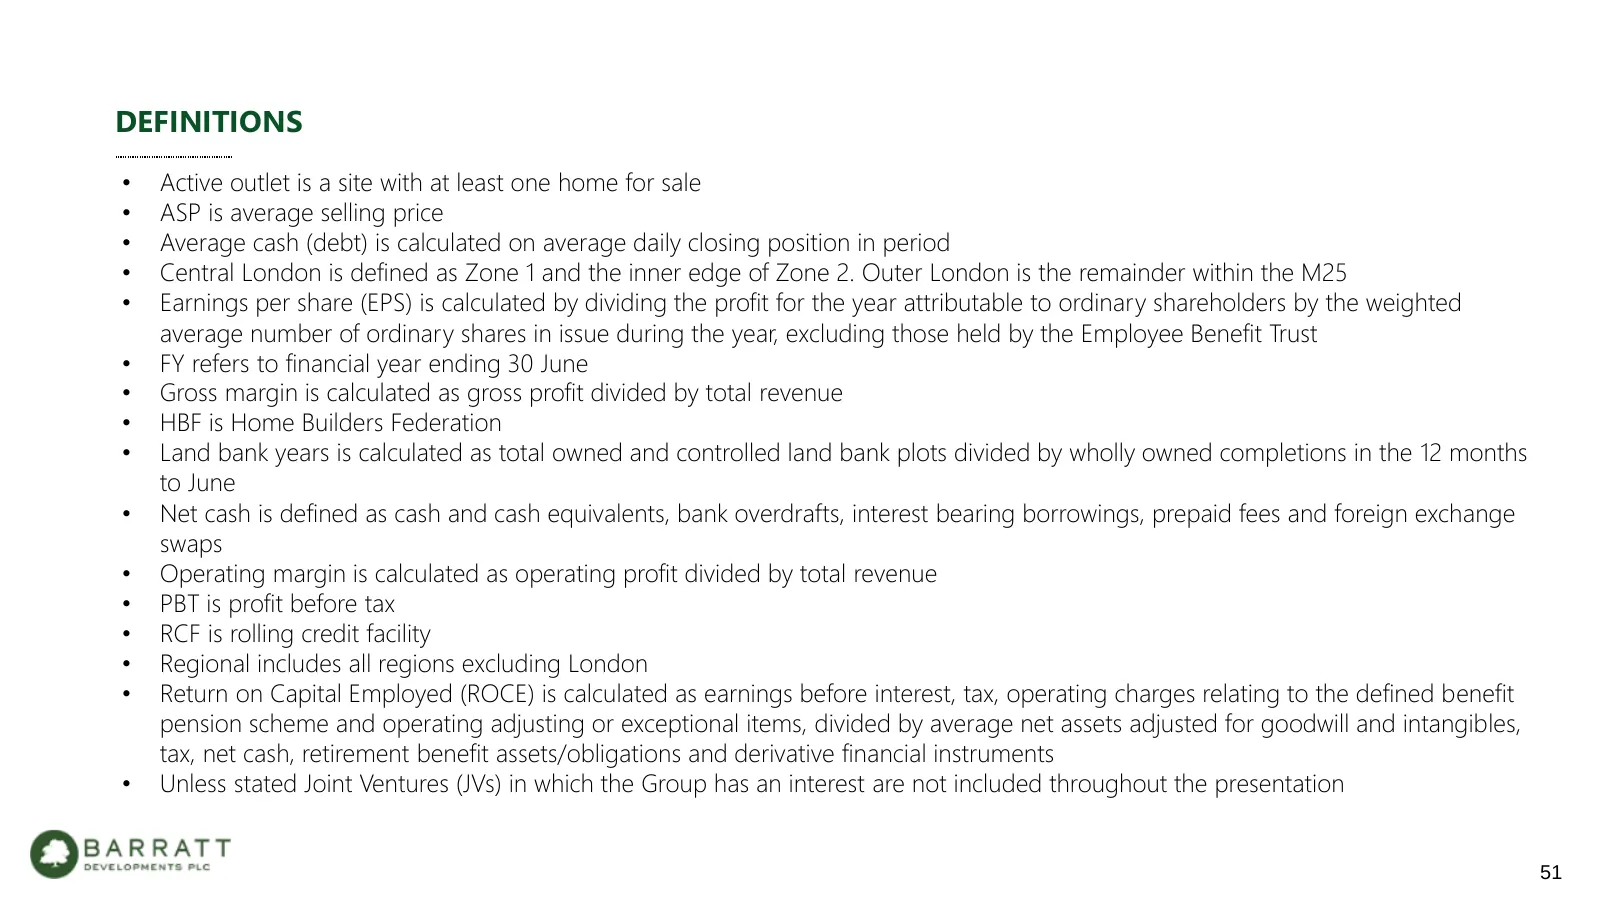
Slide 51: Definitions
DEFINITIONS • Active outlet is a site with at least one home for sale • ASP is average selling price • Average cash (debt) is calculated on average daily closing position in period • Central London is defined as Zone 1 and the inner edge of Zone 2. Outer London is the remainder within the M25 • Earn
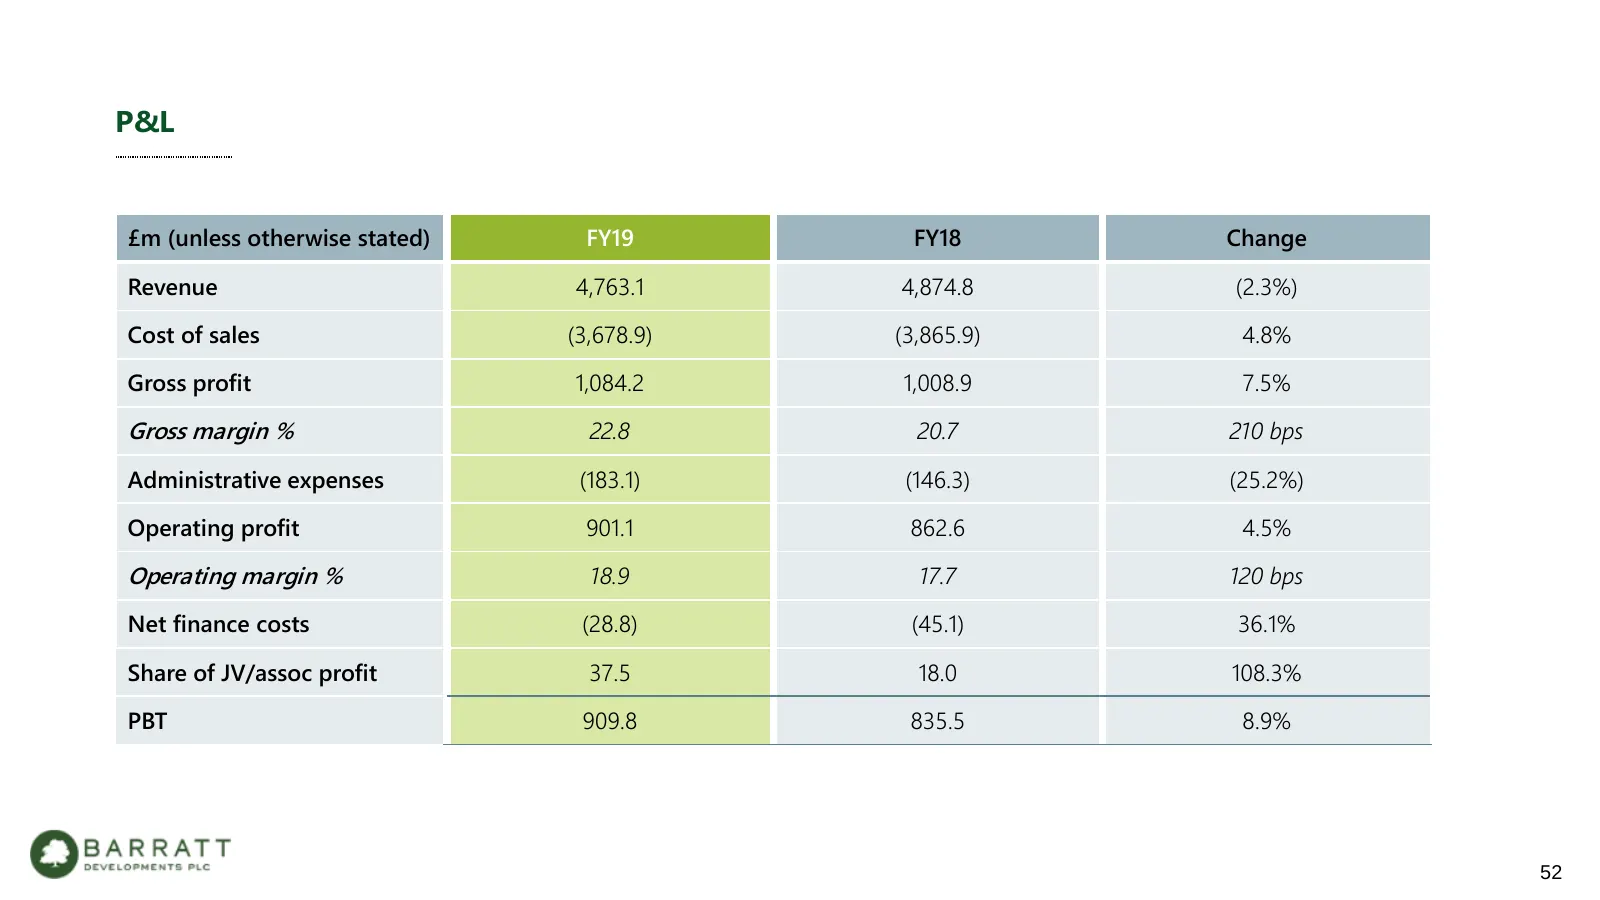
Slide 52: P&L
P&L £m (unless otherwise stated) FY19 FY18 Change Revenue 4,763.1 4,874.8 (2.3%) Cost of sales (3,678.9) (3,865.9) 4.8% Gross profit 1,084.2 1,008.9 7.5% Gross margin % 22.8 20.7 210 bps Administrative expenses (183.1) (146.3) (25.2%) Operating profit 901.1 862.6 4.5% Operating margin % 18.9 17.7 12
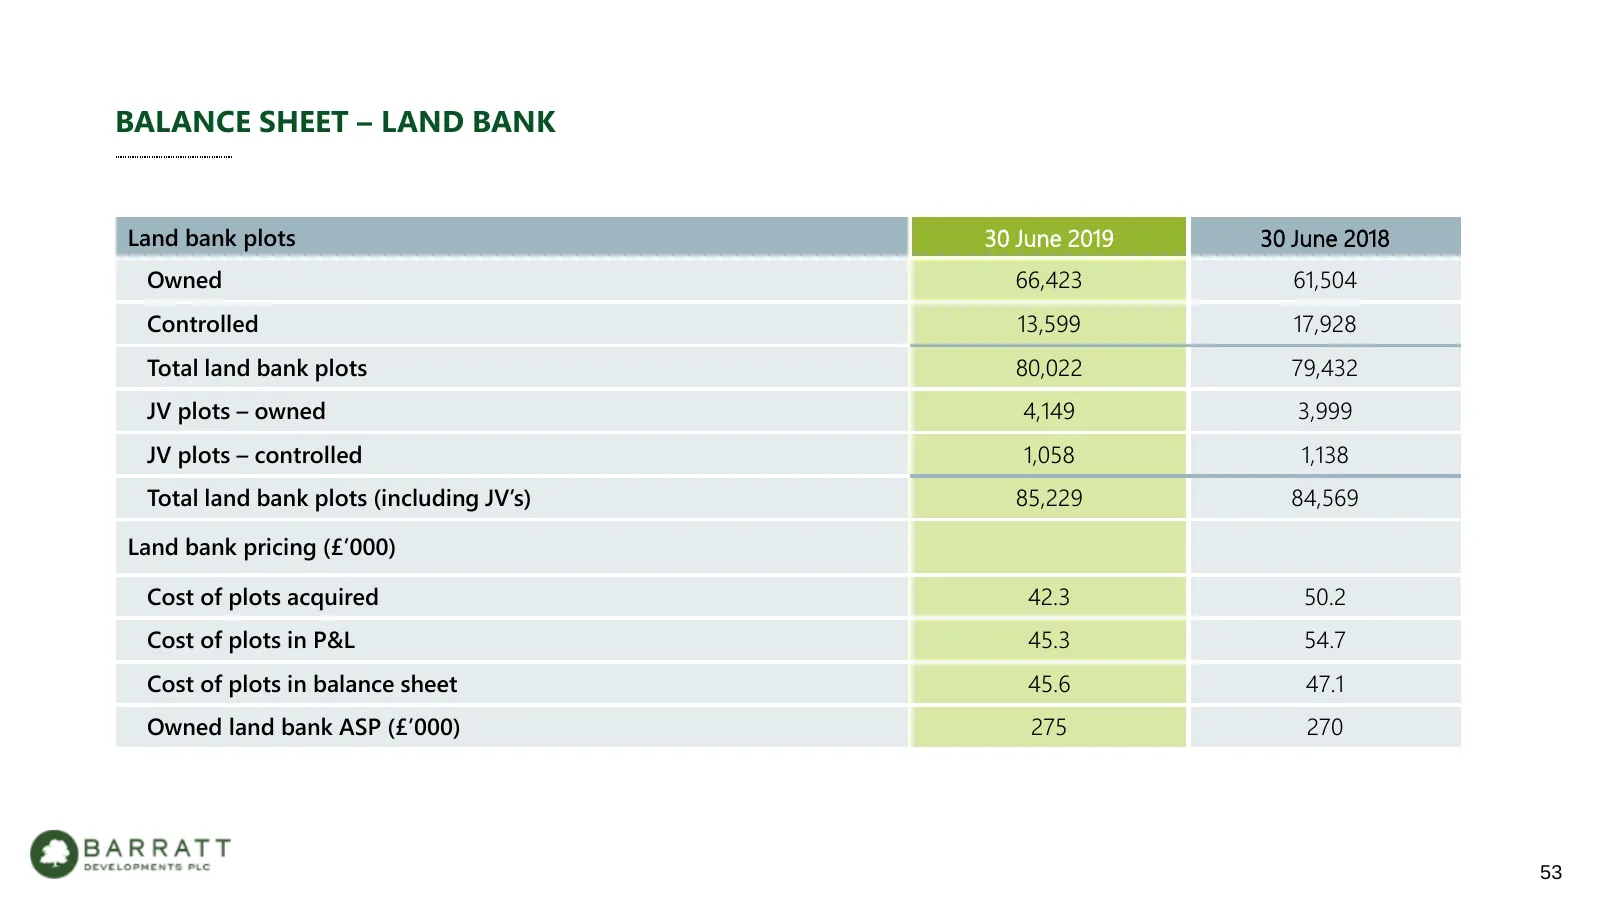
Slide 53: Balance Sheet – Land Bank
BALANCE SHEET – LAND BANK Land bank plots 30 June 2019 30 June 2018 Owned 66,423 61,504 Controlled 13,599 17,928 Total land bank plots 80,022 79,432 JV plots – owned 4,149 3,999 JV plots – controlled 1,058 1,138 Total land bank plots (including JV’s) 85,229 84,569 Land bank pricing (£’000) Cost of p
Slide 54: Private Completion - Volume and ASP
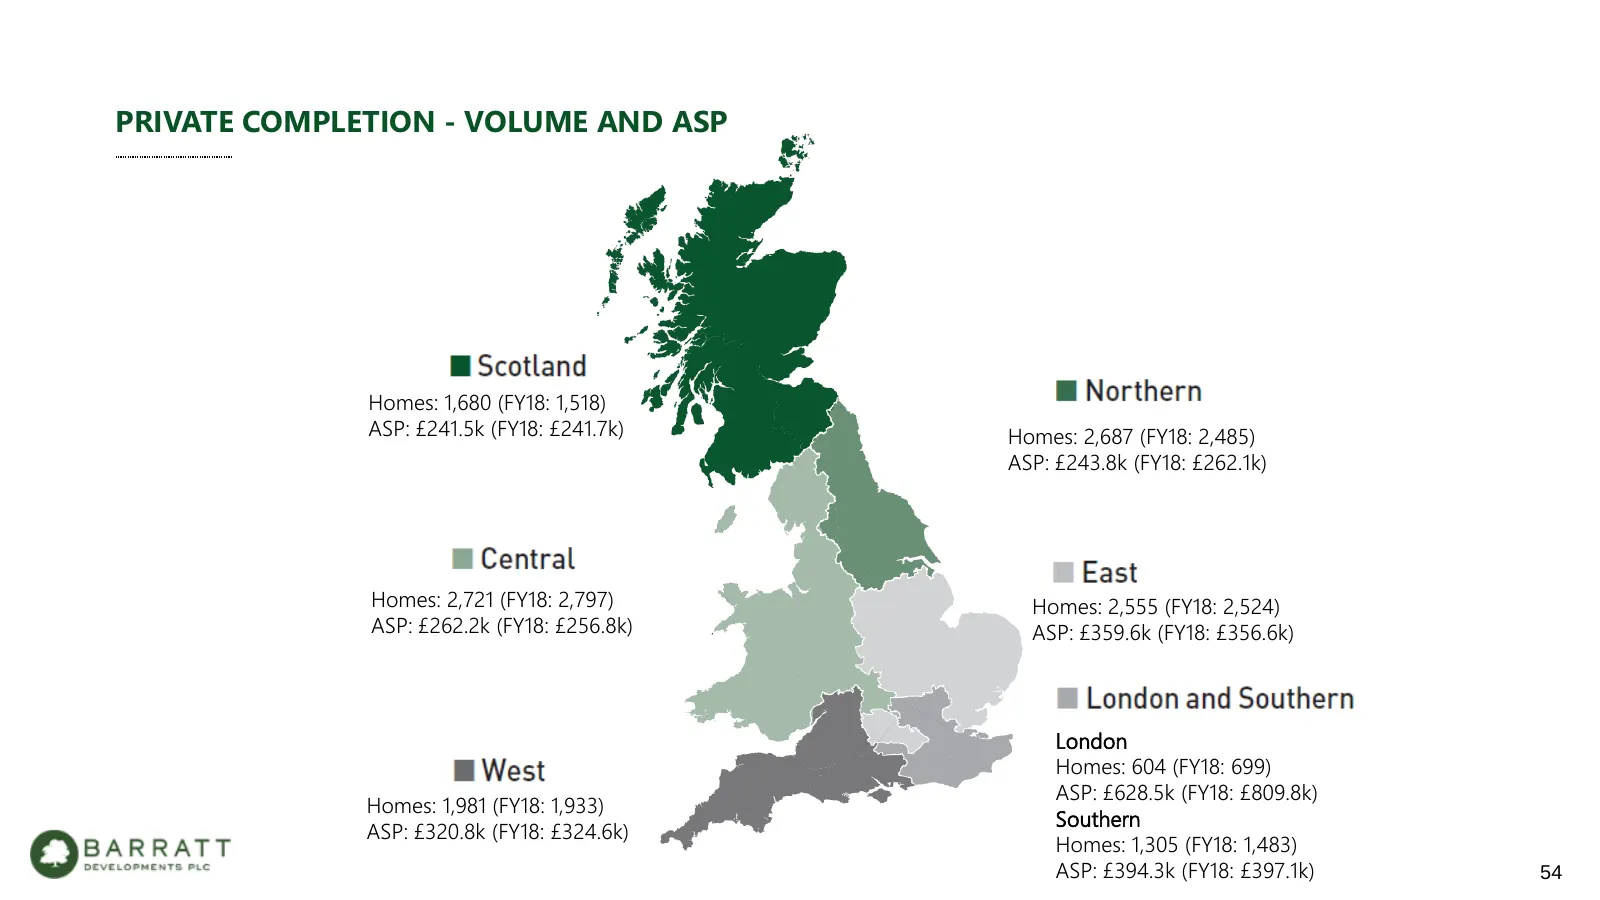
PRIVATE COMPLETION - VOLUME AND ASP Homes: 1,680 (FY18: 1,518) ASP: £241.5k (FY18: £241.7k) Homes: 2,687 (FY18: 2,485) ASP: £243.8k (FY18: £262.1k) Homes: 2,721 (FY18: 2,797) Homes: 2,555 (FY18: 2,524) ASP: £262.2k (FY18: £256.8k) ASP: £359.6k (FY18: £356.6k) London Homes: 604 (FY18: 699) ASP: £628.
Slide 55: Home Completions Analysis – Product Type
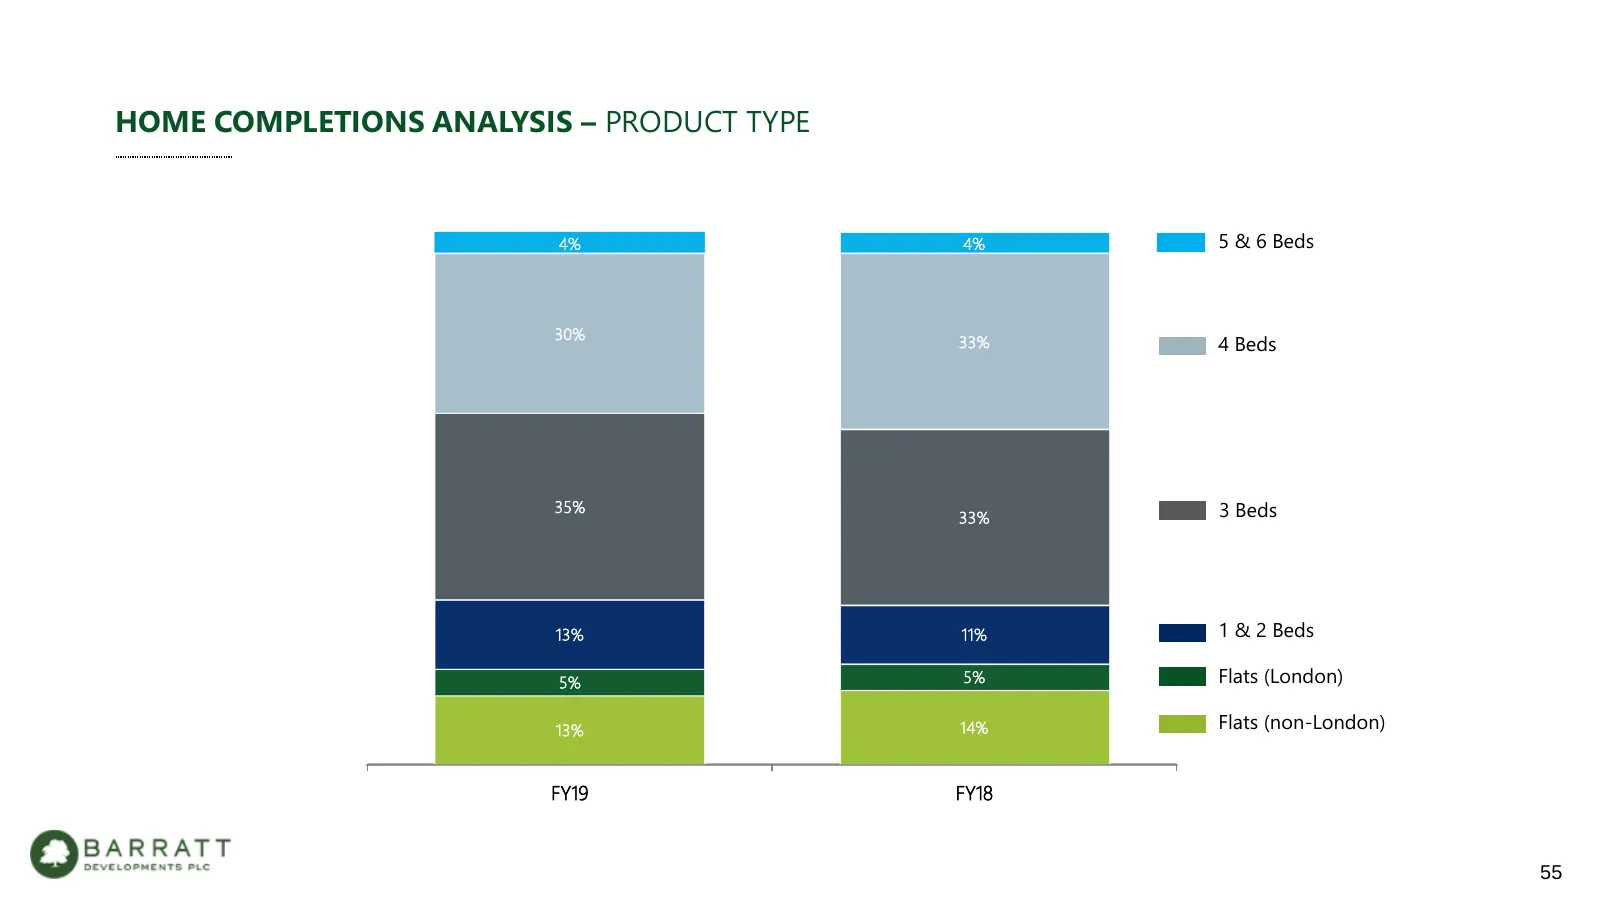
HOME COMPLETIONS ANALYSIS – PRODUCT TYPE 4% 4% 5 & 6 Beds 30% 33% 4 Beds 35% 3 Beds 33% 13% 11% 1 & 2 Beds 5% 5% Flats (London) 13% 14% Flats (non-London) FY19 FY18 55
Slide 56: Investment in Joint Ventures
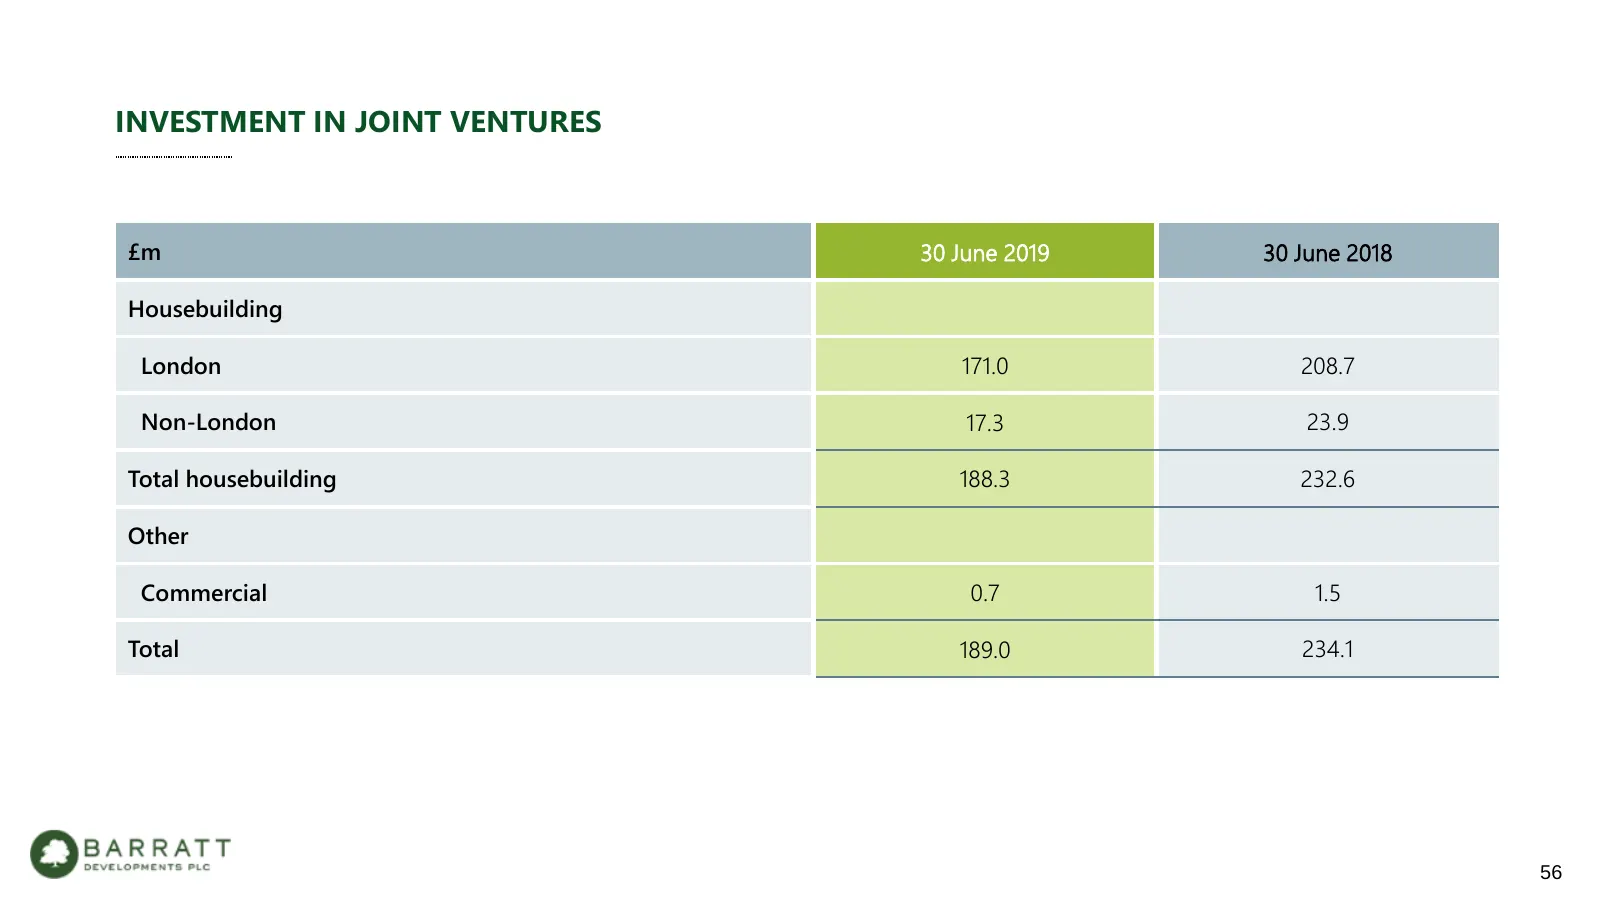
INVESTMENT IN JOINT VENTURES £m 30 June 2019 30 June 2018 Housebuilding London 171.0 208.7 Non-London 17.3 23.9 Total housebuilding 188.3 232.6 Other Commercial 0.7 1.5 Total 189.0 234.1 56
Slide 57: Joint Ventures Breakdown
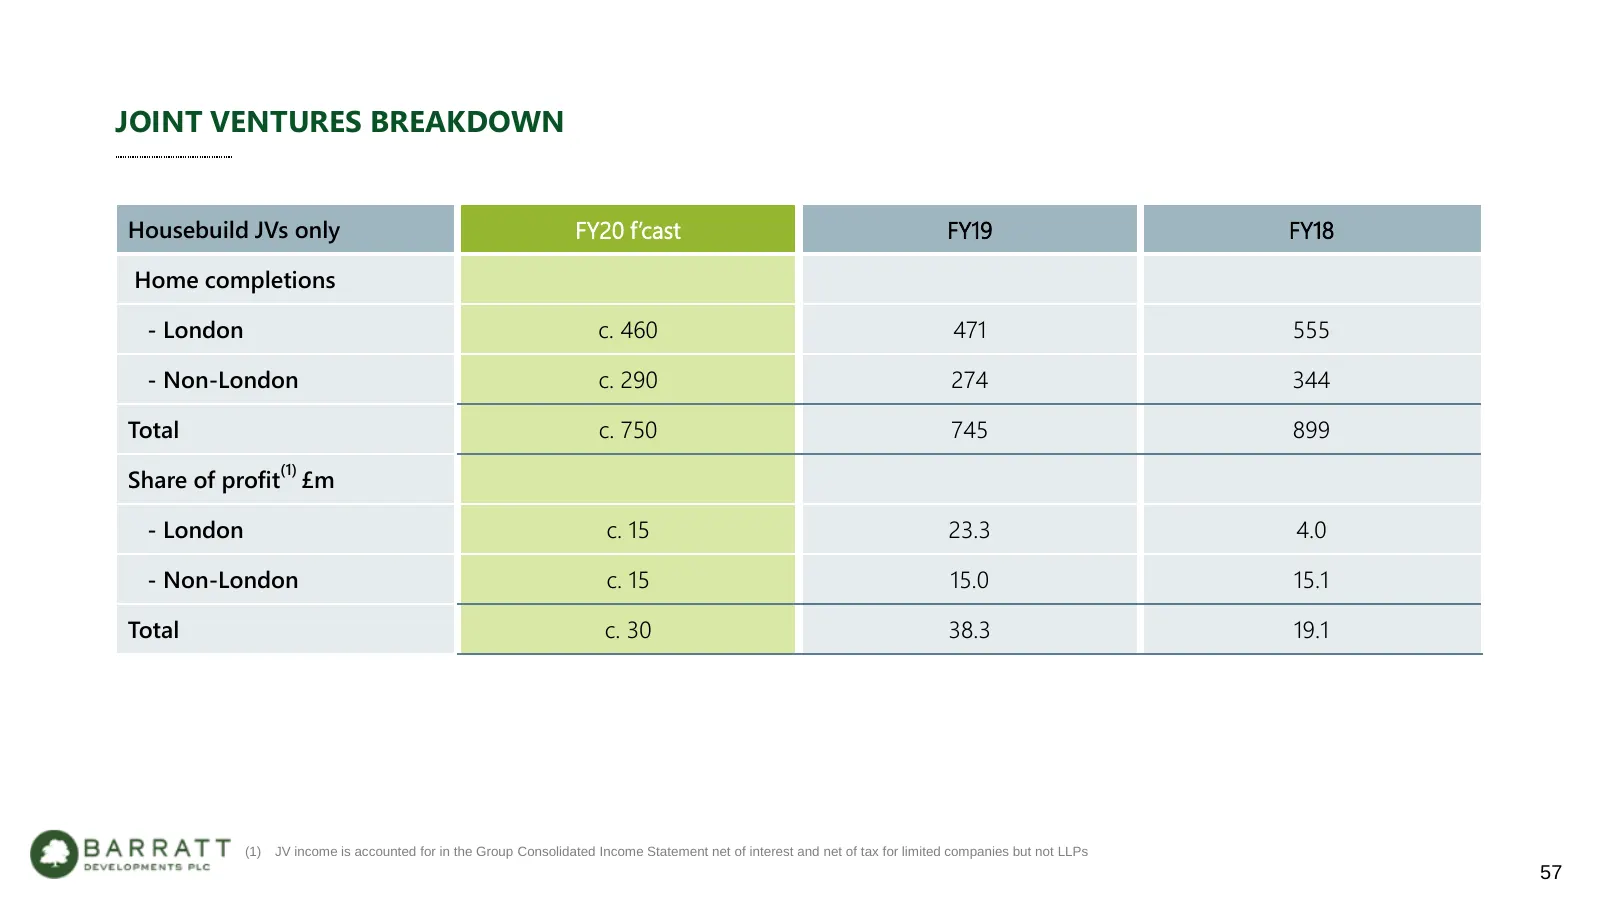
JOINT VENTURES BREAKDOWN Housebuild JVs only FY20 f’cast FY19 FY18 Home completions - London c. 460 471 555 - Non-London c. 290 274 344 Total c. 750 745 899 (1) Share of profit £m - London c. 15 23.3 4.0 - Non-London c. 15 15.0 15.1 Total c. 30 38.3 19.1 (1) JV income is accounted for in the Group C
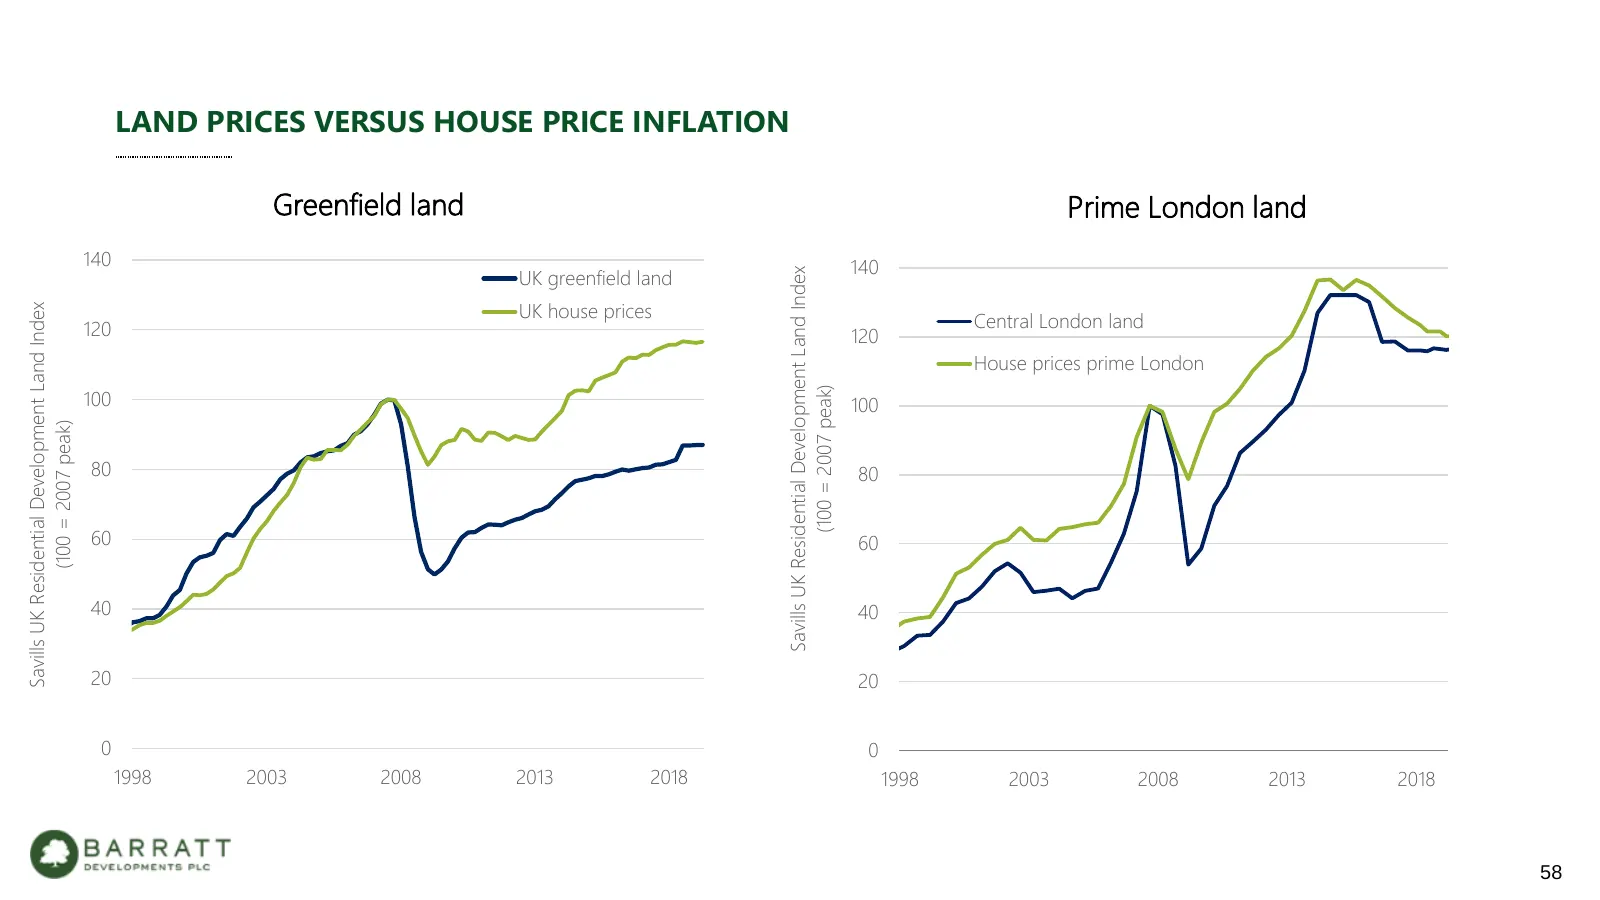
Slide 58: Land Prices versus House Price Inflation
LAND PRICES VERSUS HOUSE PRICE INFLATION Greenfield land Prime London land 140 140 UK greenfield land Savills UK Residential Development Land Index UK house prices Savills UK Residential Development Land Index 120 Central London land 120 House prices prime London (100 = 2007 peak) 100 100 (100 = 200
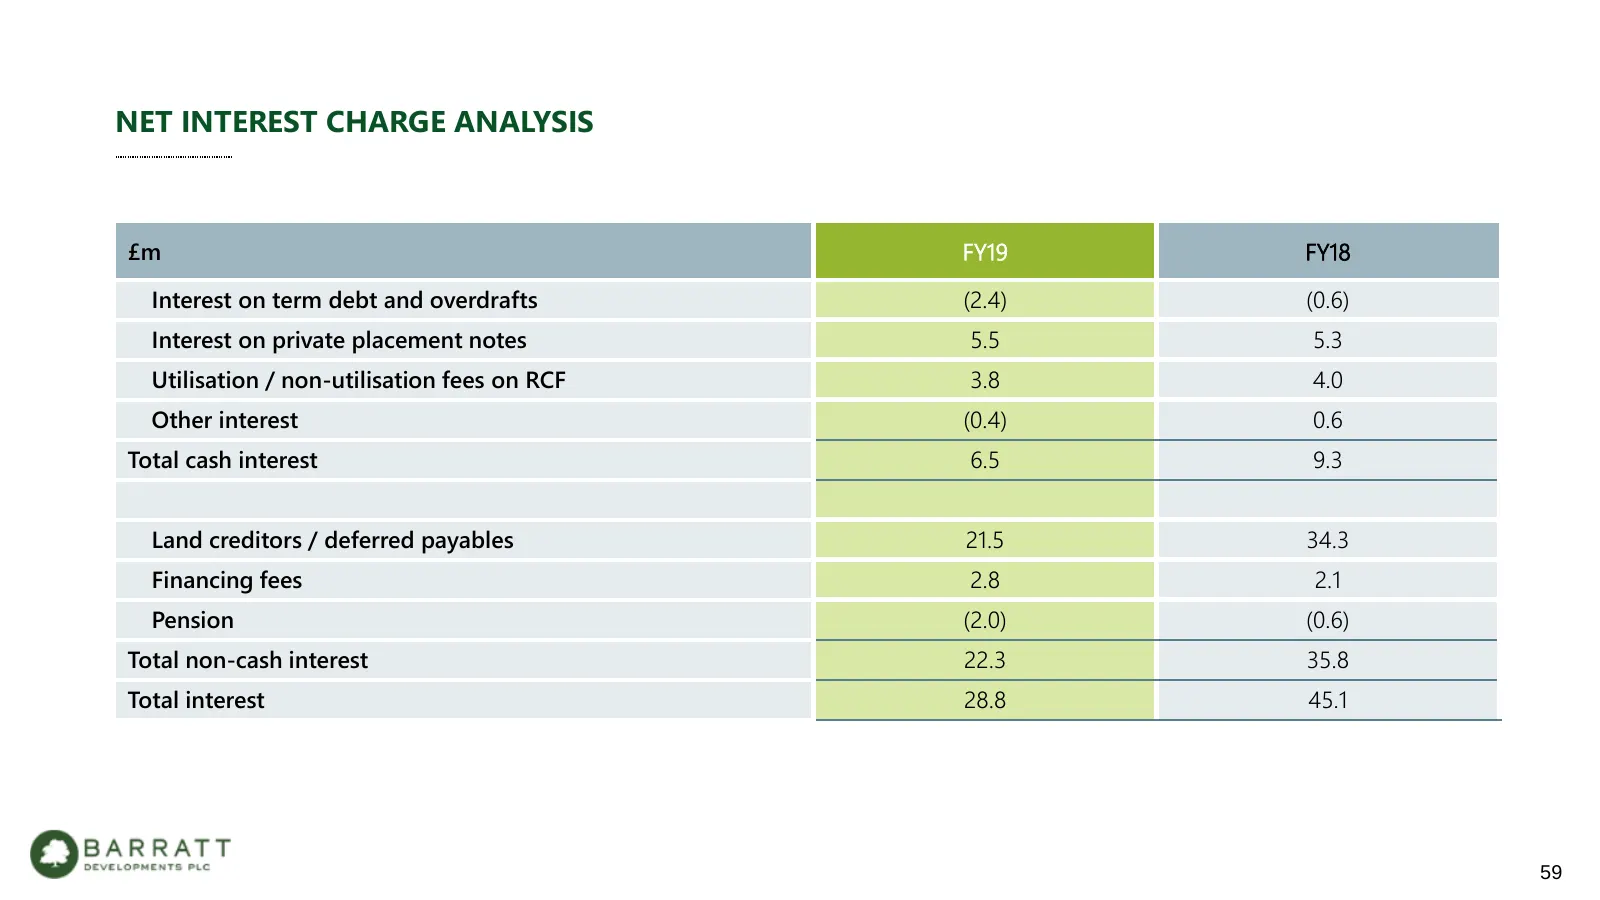
Slide 59: Net Interest Charge Analysis
NET INTEREST CHARGE ANALYSIS £m FY19 FY18 Interest on term debt and overdrafts (2.4) (0.6) Interest on private placement notes 5.5 5.3 Utilisation / non-utilisation fees on RCF 3.8 4.0 Other interest (0.4) 0.6 Total cash interest 6.5 9.3 Land creditors / deferred payables 21.5 34.3 Financing fees 2.
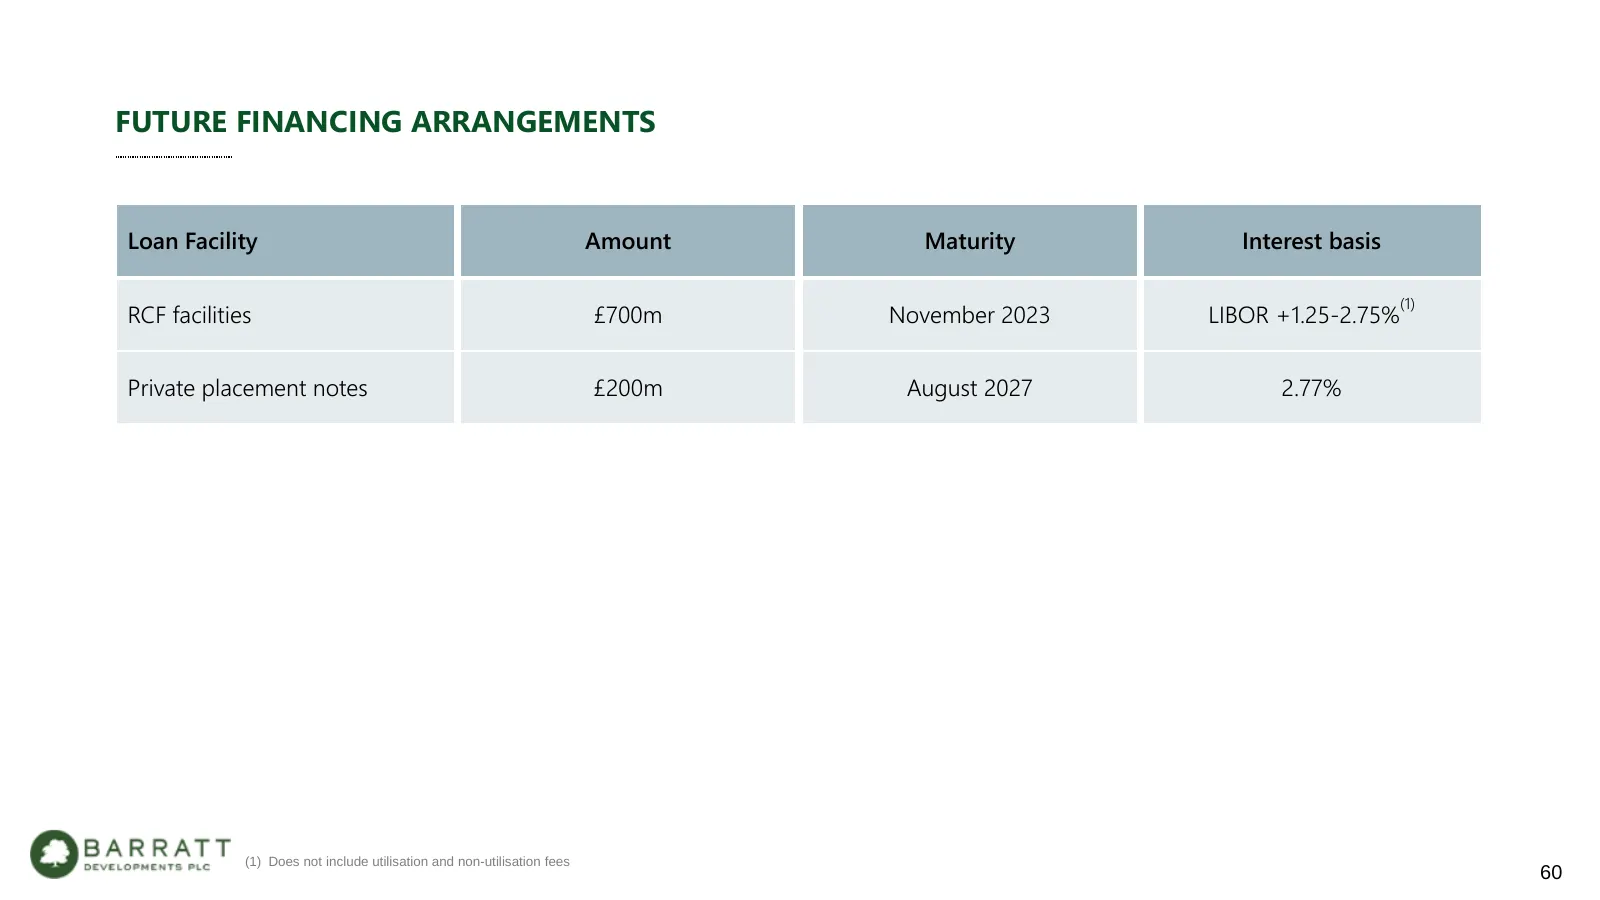
Slide 60: Future Financing Arrangements
FUTURE FINANCING ARRANGEMENTS Loan Facility Amount Maturity Interest basis (1) RCF facilities £700m November 2023 LIBOR +1.25-2.75% Private placement notes £200m August 2027 2.77% (1) Does not include utilisation and non-utilisation fees 60
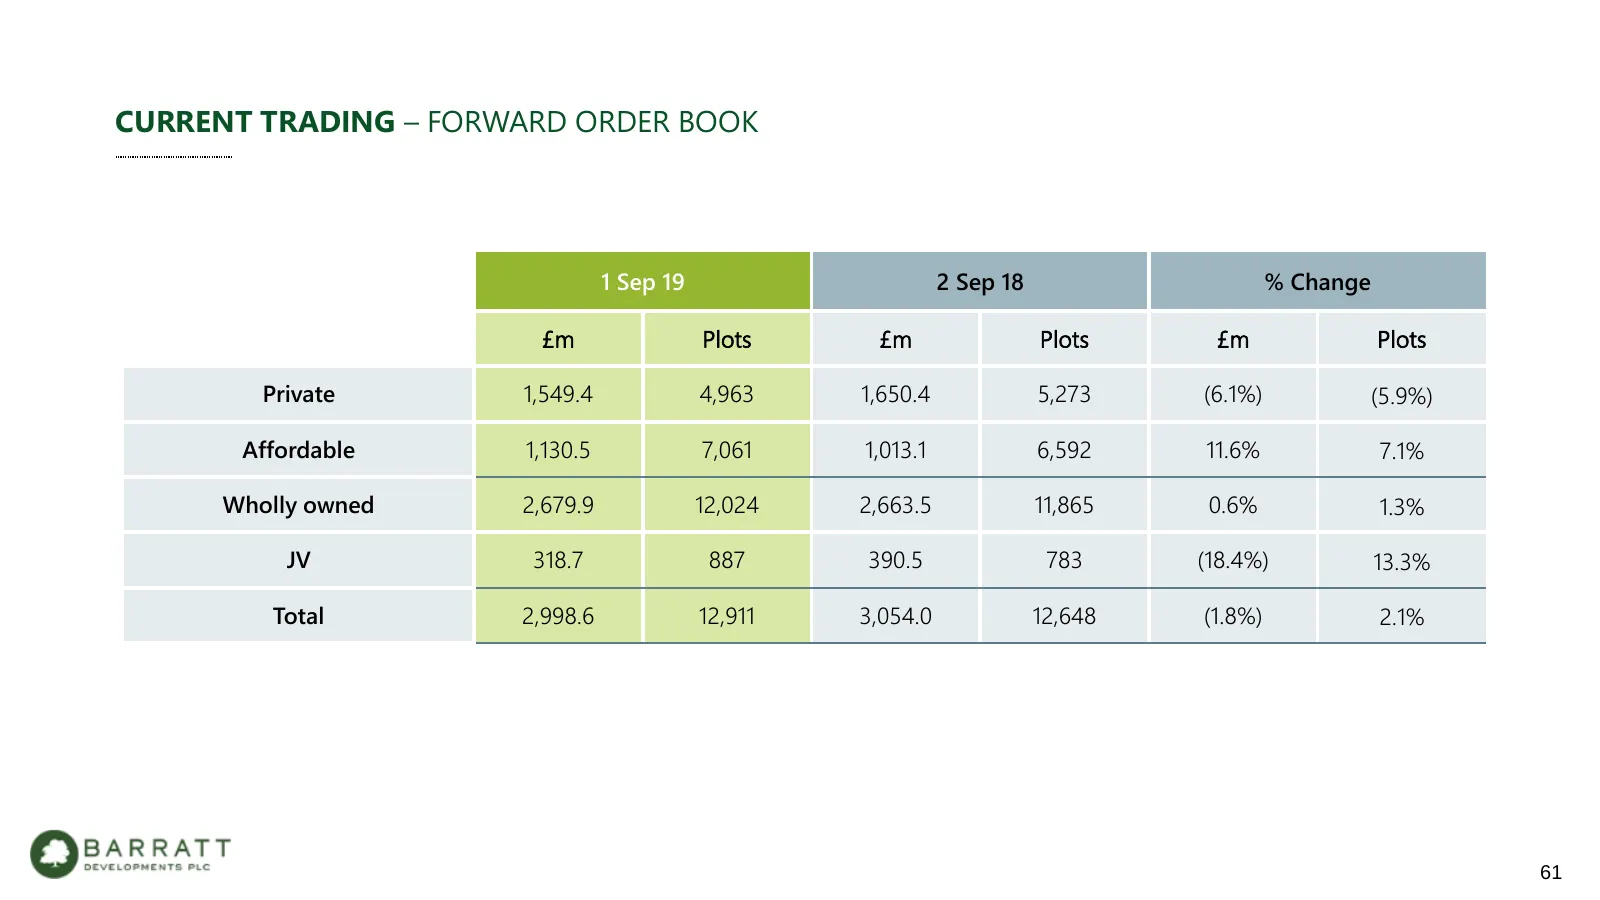
Slide 61: Current Trading – Forward Order Book
CURRENT TRADING – FORWARD ORDER BOOK 1 Sep 19 2 Sep 18 % Change £m Plots £m Plots £m Plots Private 1,549.4 4,963 1,650.4 5,273 (6.1%) (5.9%) Affordable 1,130.5 7,061 1,013.1 6,592 11.6% 7.1% Wholly owned 2,679.9 12,024 2,663.5 11,865 0.6% 1.3% JV 318.7 887 390.5 783 (18.4%) 13.3% Total 2,998.6 12,91
Slide 62: Disclaimer
DISCLAIMER This document has been prepared by Barratt Developments PLC (the “Company”) solely for use at a presentation in connection with the Company‘s Full Year Results Announcement in respect of the year ended 30 June 2019. For the purposes of this notice, the presentation shall mean and include
Source: Internet Archive copy of barrattdevelopments.co.uk
More decks from Barratt Redrow plc
 FY2026 Earnings Presentation59 slides · Sep 16, 2026
 HY26 Earnings Presentation59 slides · Feb 11, 2026
 FY2025 Earnings Presentation60 slides · Sep 17, 2025
 Corporate Update (May 2025)30 slides · May 1, 2025
 Investor Day (February 2025)40 slides · Feb 12, 2025
 HY25 Earnings Presentation51 slides · Feb 12, 2025