ConnectOne Bancorp, Inc. · NASDAQ:CNOB
ConnectOne Bancorp — Investor Presentation (November 2026)
30 slides from ConnectOne Bancorp's investor presentation, Nov 17, 2026
Slide 1: ConnectOne Bancorp, Inc. Investor Presentation
& ConnectOne Bancorp, Inc. a better place to be Investor Presentation November 2026
Slide 2: Forward-looking Statements
Forward-looking Statements This presentation contains forward-looking statements that are based on ConnectOne Bancorp, Inc’s (‘ConnectOne") assumptions and beliefs. Forward-looking statements are typically identified by words such as “believe,” “expect,” “anticipate,” “intend,” “target,” “estimate,”
Slide 3: Use of Non-GAAP Financial Measures
Use of Non-GAAP Financial Measures This presentation contains certain financial measures that are not measures recognized under US. generally accepted accounting principles ("GAAP") and therefore, are considered non-GAAP financial measures. Management believes these non-GAAP financial measures provi
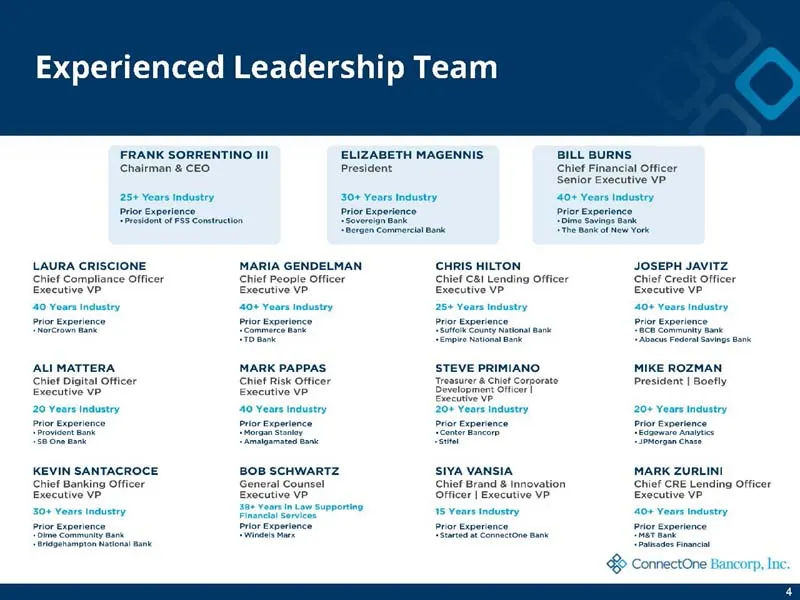
Slide 4: Experienced Leadership Team
Experienced Leadership Team FRANK SORRENTINO Ill ELIZABETH MAGENNIS BILL BURNS Chairman & CEO President Chief inancial Officer Senior Executive VP 25+ Years Industry 30+ Years Industry 40+ Years Industry Prior Experionce LAURA GRISCIONE MARIA GENDELMAN CHRIS HILTON Chief Compliance Officer Chiet Peo
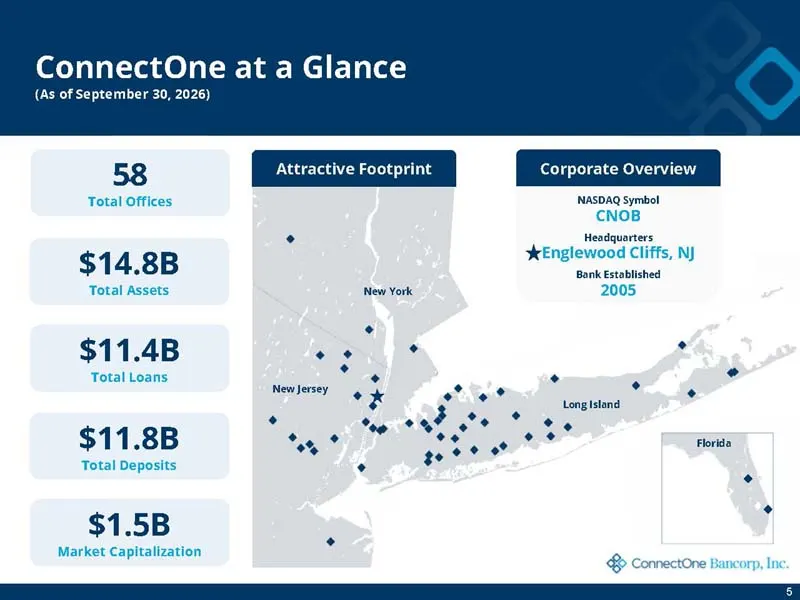
Slide 5: ConnectOne at a Glance
ConnectOne at a Glance (As of September 30, 2026) 58 Attractive Footprint Corporate Overview CNOB $14.8B * mn ‘New York 2005 - o°¢ > £ ia Ag oa ° a + pte To op CANT eer a . Ne red ee) ° ley Florida
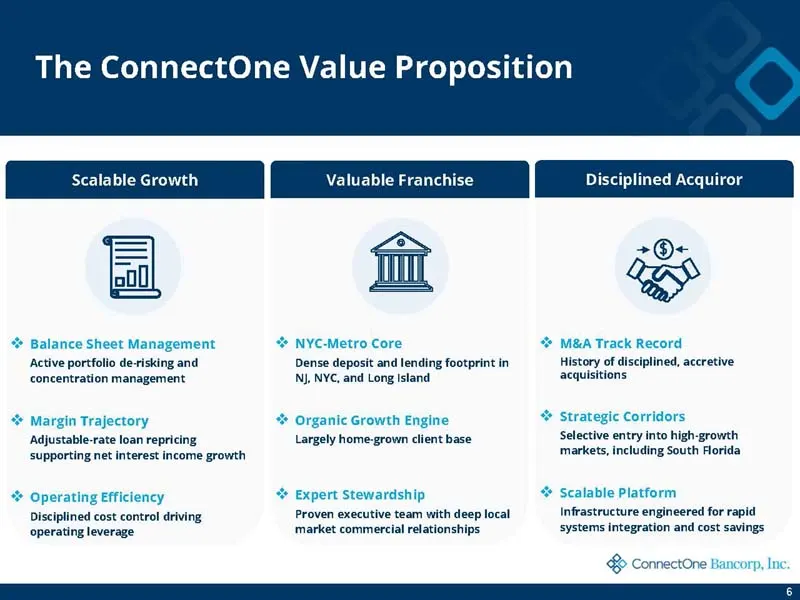
Slide 6: The ConnectOne Value Proposition
The ConnectOne Value Proposition Scalable Growth Valuable Franchise Disciplined Acquiror + Balance Sheet Management + Active portfolio de-risking and concentration management + Margin Trajectory + Adjustable-rate loan repricing supporting net interest income growth Disciplined cost control driving o
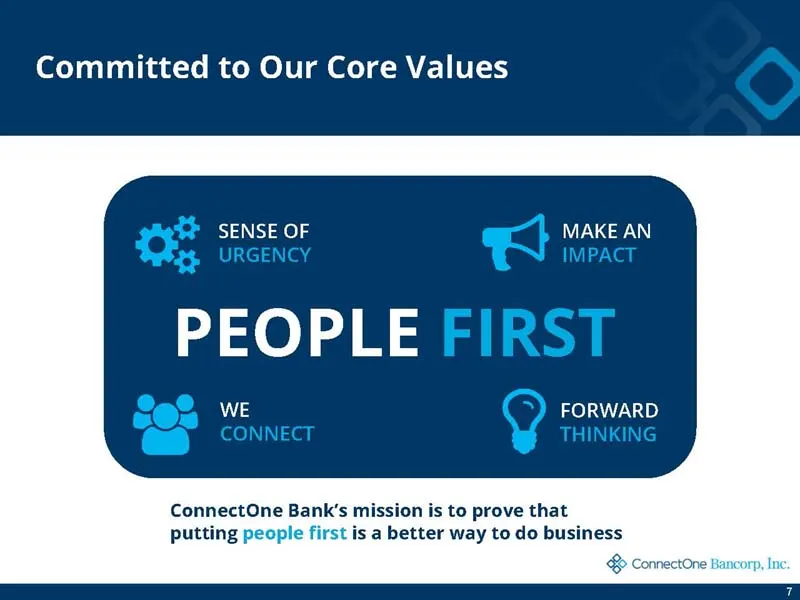
Slide 7: Committed to Our Core Values
Committed to Our Core Values SENSE OF MAKE AN PEOPLE WE FORWARD ConnectOne Bank's mission is to prove that putting people first is a better way to do business $e e Bancorp, Inc
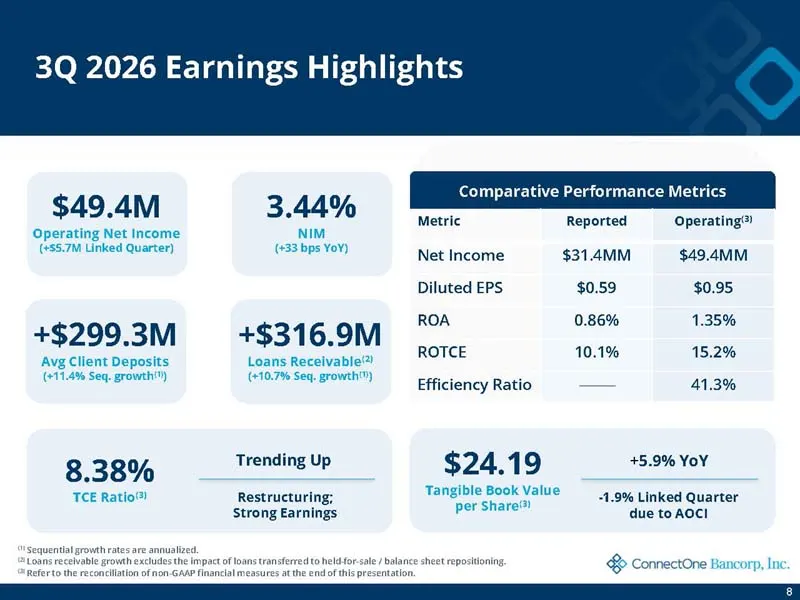
Slide 8: 3Q 2026 Earnings Highlights
3Q 2026 Earnings Highlights $49.4M Income +$299.3M its 8.38% TCE Ratio®) Trending Up Restructuring; Strong Earnings Comparative Performance Metrics Metric Reported Operating® Net Income $31.4MM $49.4MM Diluted EPS $0.59 $0.95 ROA 0.86% 1.35% ROTCE 10.1% 15.2% Efficiency Ratio 41.3% $24.19 +5.9% YoY
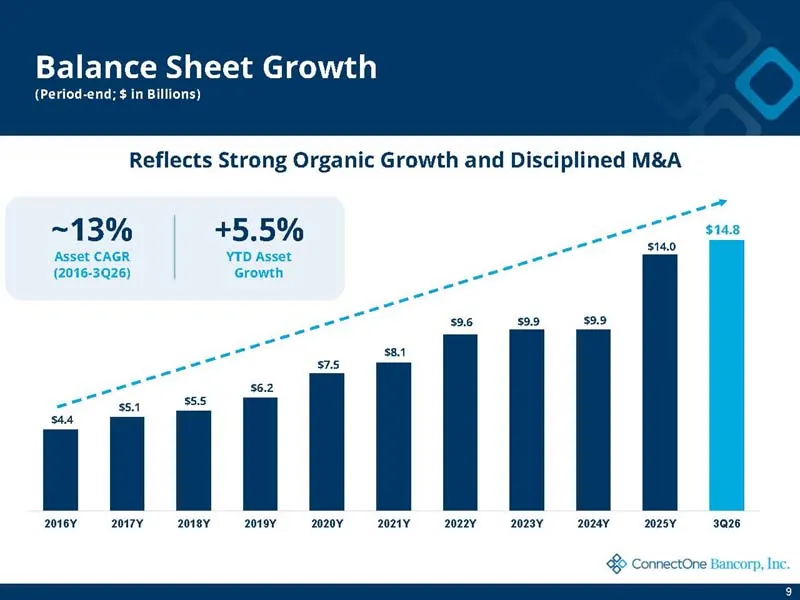
Slide 9: Balance Sheet Growth
Balance Sheet Growth (Period-end; $ in Billions) Reflects Strong Organic Growth and Disciplined M&A $140 2016Y —-2017Y «= 2018Y—2019Y «2020 021Y «2022 «= 2023Y = 2024Y = 2025Y 3026 ~13% +5.5% & Connectone
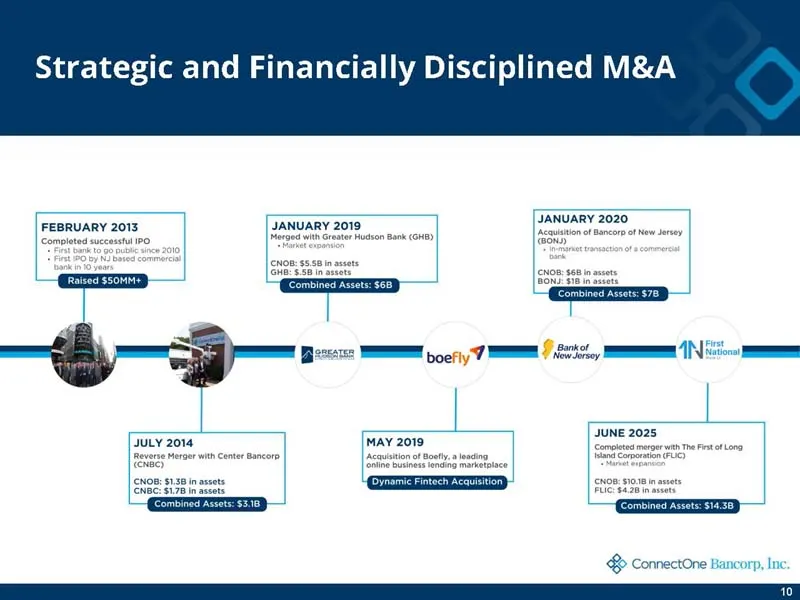
Slide 10: Strategic and Financially Disciplined M&A
Strategic and Financially Disciplined M&A JANUARY 2020 & ConnectOne |
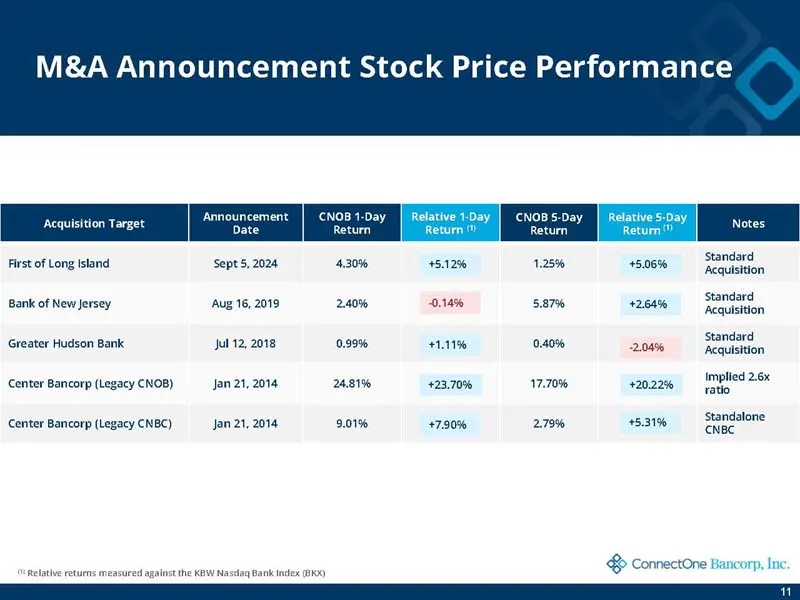
Slide 11: M&A Announcement Stock Price Performance
M&A Announcement Stock Price Performance First of Long Island Bank of New Jersey Greater Hudson Bank Center Bancorp (Legacy CNOB) Center Bancorp (Legacy CNBC) "Relative returns measured against the KEW Nasdaq Bank Index (KX) Sept 5, 2024 ‘Aug 16, 2019 jul 12, 2018 Jan 21, 2014 Jan 21, 2014 430% 2.40
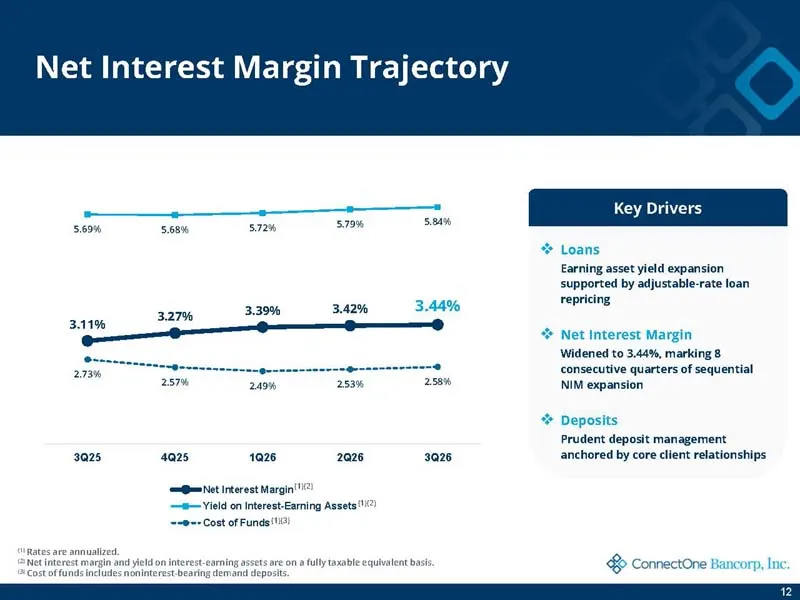
Slide 12: Net Interest Margin Trajectory
Net Interest Margin Trajectory $$$. Key Drivers 3798 stn 5.69% 5.58% 572% * Loans Earning asset yield expansion supported by adjustable-rate loan 3.39% 342% bier + Net Interest Margin Widened to 3.44%, marking 8 consecutive quarters of sequential NIM expansion + Deposits Prudent deposit management 3
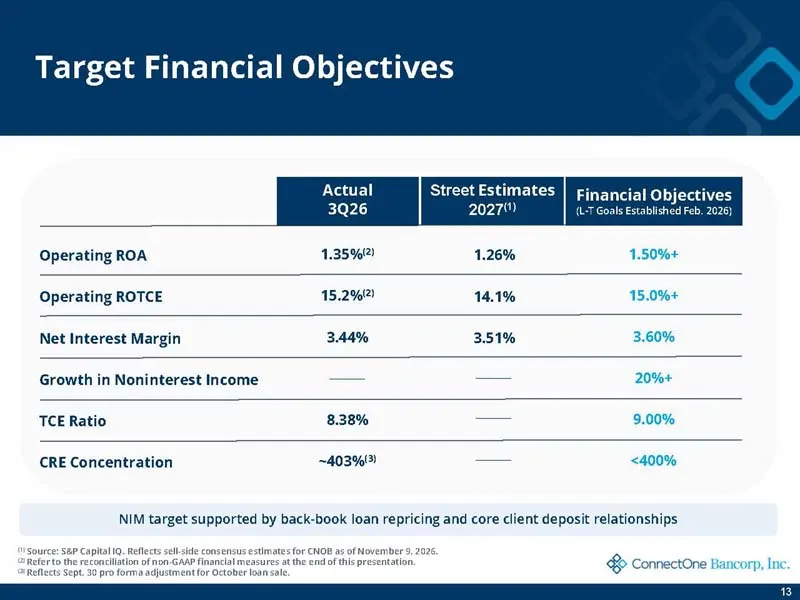
Slide 13: Target Financial Objectives
arget Financial Objectives Actual ancial Object 3Q26 Operating ROA 1.35%) 1.26% 1.50% Operating ROTCE 15.2%) 14.1% 15.0%+ Net Interest Margin 3.44% 351% 3.60% Growth in Noninterest Income — 20%+ TCE Ratio 8.38% — 9.00% CRE Concentration ~403%! — <400% NIM target supported by back-book loan repricing
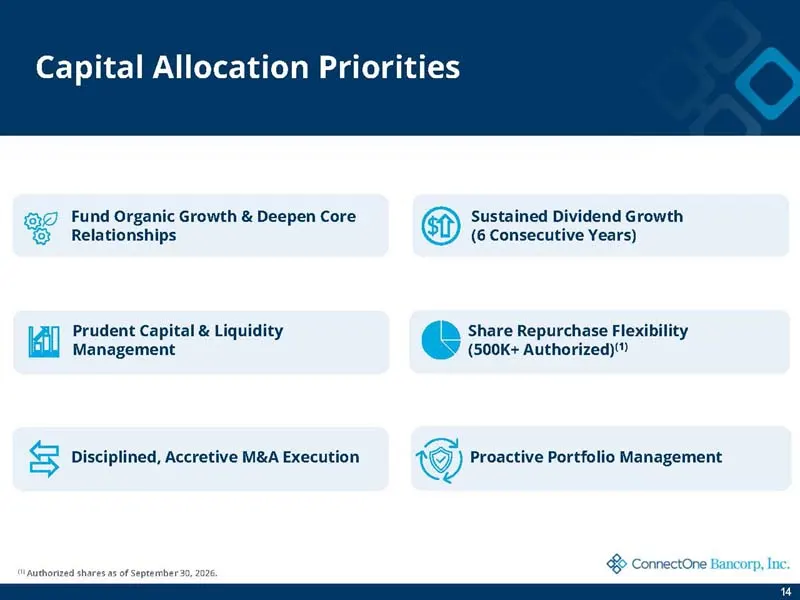
Slide 14: Capital Allocation Priorities
Capital Allocation Priorities Fund Organic Growth & Deepen Core (ep) Sustained Dividend Growth Relationships LU) (6 consecutive Years) l A] Prudent Capital & Liquidity Share Repurchase Flex‘ a Management (500K+ Authorized) lined, Accretive M&A Execution Proactive Portfolio Management & ConnectOne Ba
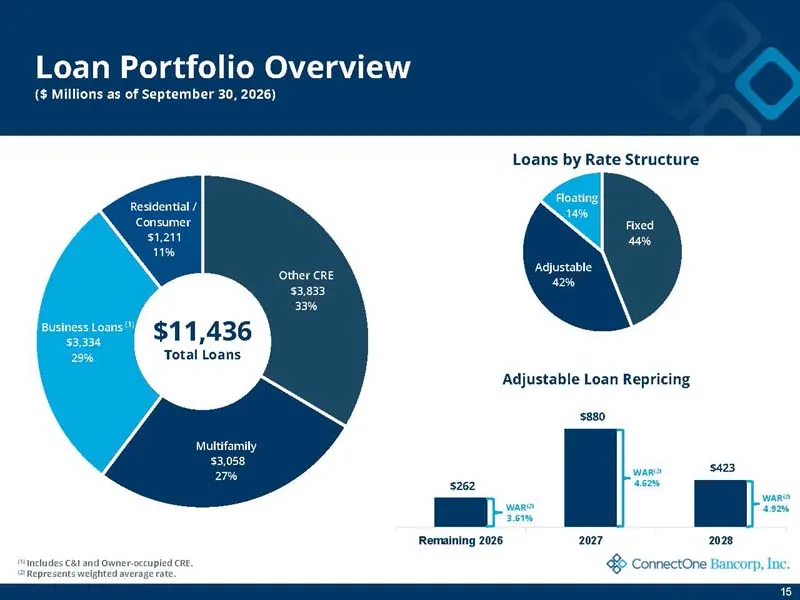
Slide 15: Loan Portfolio Overview
Loan Portfolio Ove ($ Millions as of September 30, 2026) Loans by Rate Structure / $11,436 Total Loans Adjustable Loan Repricing $880 Multifamily $3,058 “aa 27% ‘ = | . |_| 027 2028 Remaining 2026 2 & Connectone
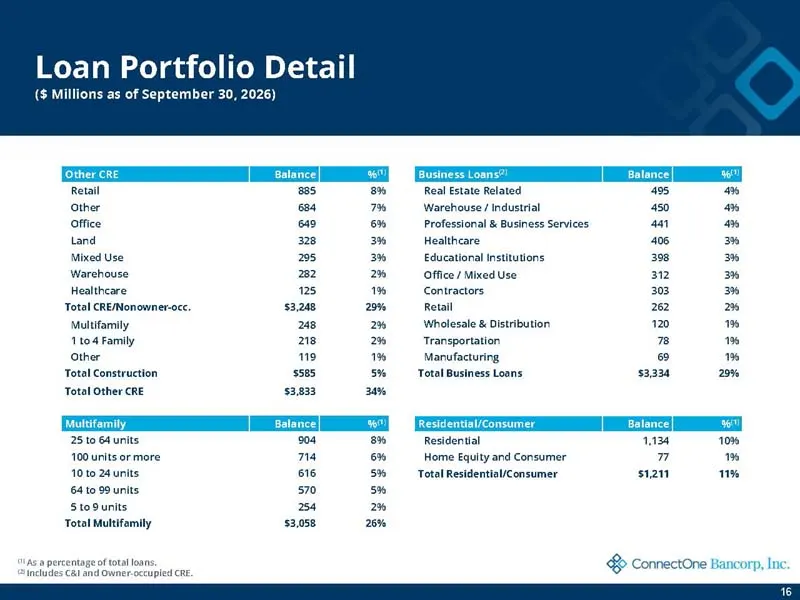
Slide 16: Loan Portfolio Detail
Loan Portfolio Detail ($ Millions as of September 30, 2026) Retail 385 3% ——_—Real Estate Related 495, os Other 634 7% Warehouse / industrial 480 % office e49 6% Professional & Business Services 4a *% Land 328 3% Healthcare 406 3% Mixed Use 295 3% Educational institutions 398 * Warehouse zz 2% Offic
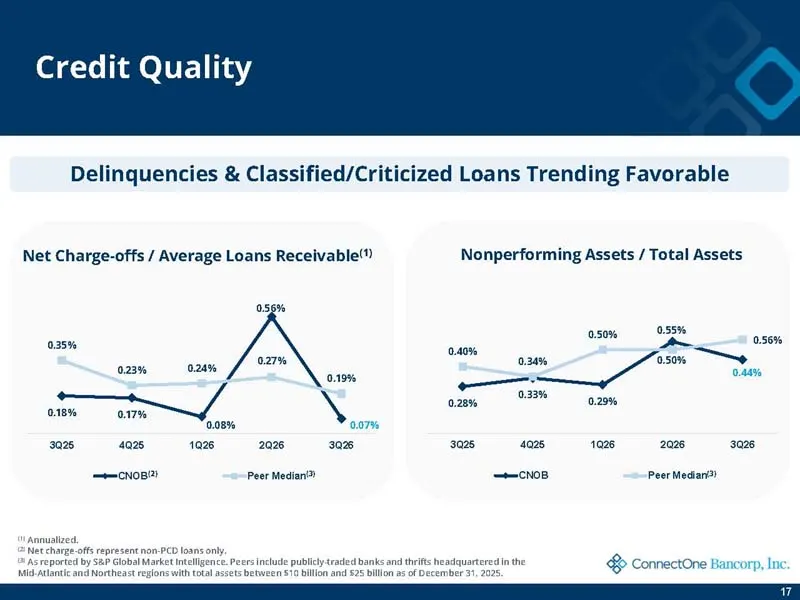
Slide 17: Credit Quality
Credit Quality Delinquencies & Classified/Criticized Loans Trending Favorable Net Charge-offs / Average Loans Receivable”) Nonperforming Assets / Total Assets ag 055% aso ass aaa hep 0.40% é Coe 0.19% . a a ~ : omemereen \ oat 029% a1B% a7 08% a07% 30284025 1028 2028 3025 3025 4025 1026 2008 3008 cv
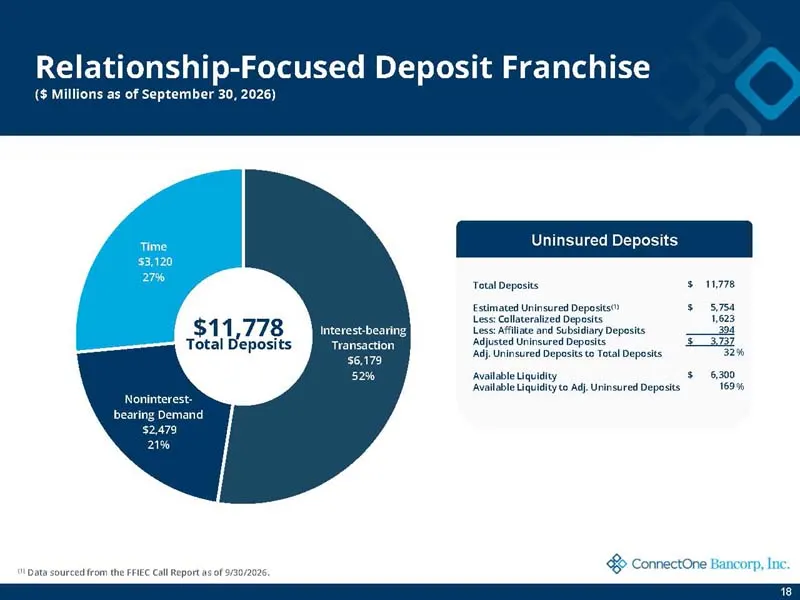
Slide 18: Relationship-Focused Deposit Franchise
Relationship-Focused Deposit Franchise ($ Millions as of September 30, 2026) $11,778 Total Deposits Noninte bearing Demand 32,479 21% Uninsured Deposits Total Deposis s 1778 Estimated Uninsured Deposits s s784 Less: Collateralized Deposies 623 Less: Afliace and Subsidiary Deposits 304 ‘Adjusted Unin
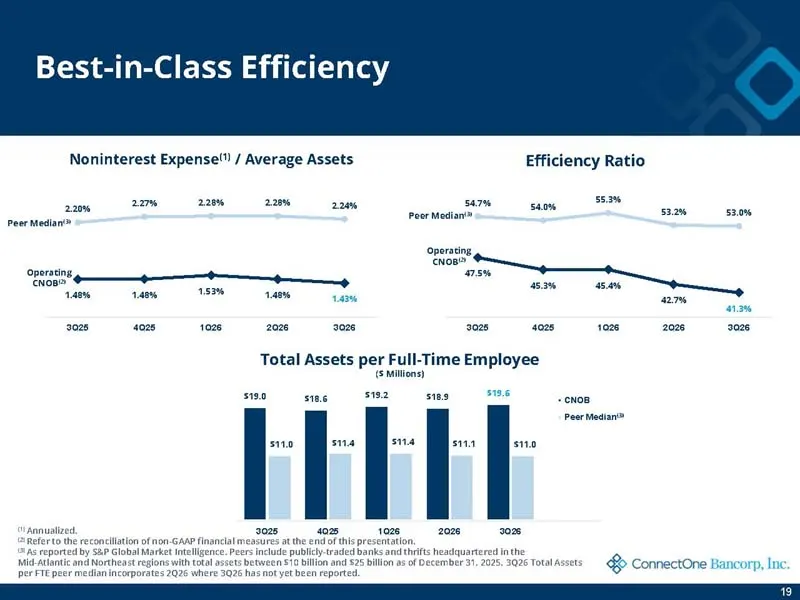
Slide 19: Best-in-Class Efficiency
n-Class Efficiency Noninterest Expense" / Average Assets Efficiency Ratio 2% 220% 220% sam 55% sine meg eanauiann best sm s20% eT ae 148% 13% 1.48% ie = Total Assets per Full-Time Employee sis0 s186 5132 sis 596 + enos hee nes lone ; nates <B> ConnectOne Bancorp, In
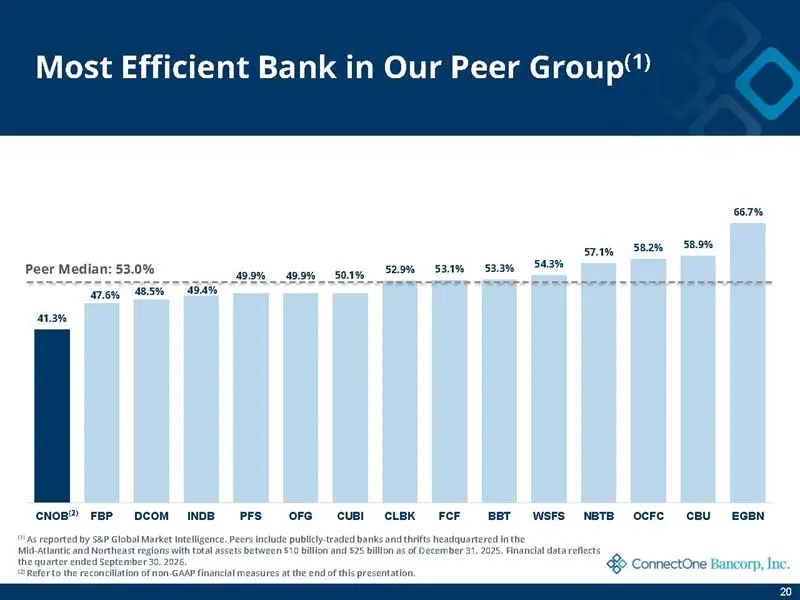
Slide 20: Most Efficient Bank in Our Peer Group
Most Efficient Bank in Our Peer Group™ somm s7.1m 582% 589% eer Median: 53.0% -: ae Peer Median: 53.0% toon gon sory 529% 531% 522% aan ade BIS am NOB”) FBP DCOM INDB PFS ‘OFG cuBl CLBK FCF BET WSFS NBTB OCFC CBU EGEN comer ie & ConnectOne Bancorp, In
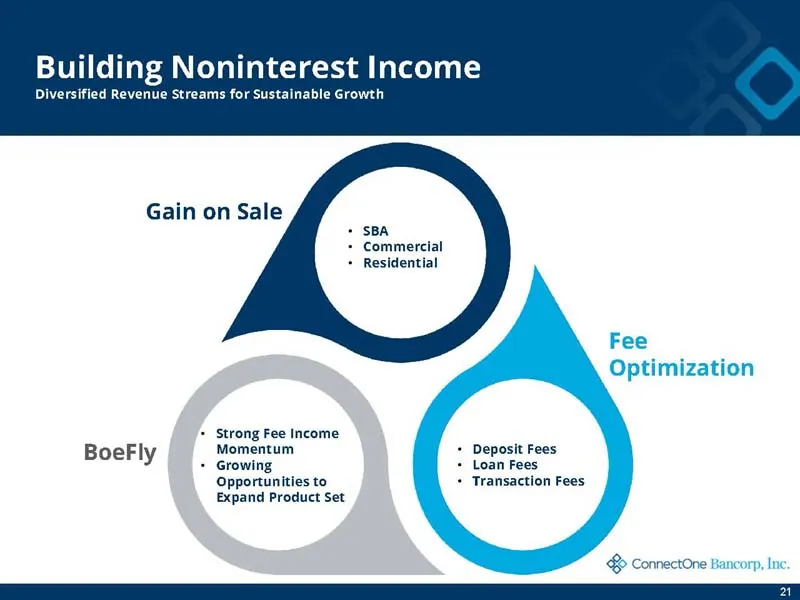
Slide 21: Building Noninterest Income
Building Noninterest Income Diversified Revenue Streams for Sustainable Growth Gain on Sale + SBA + Commercial + Residential + Strong Fee Income BoeFl Momentum + Deposit Fees y + Growing + Loan Fees Opportunities to + Transaction Fees Expand Product Set & Connectone
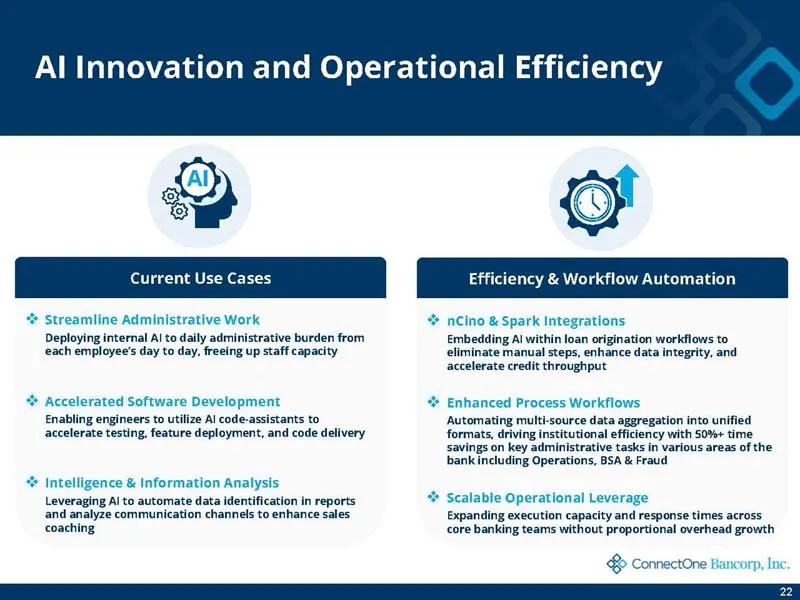
Slide 22: AI Innovation and Operational Efficiency
Al Innovation and Operational Efficiency + Streamline Administrative Work Deploying internal Al to daily administrative burden from ‘each employee's day to day, freeing up staff capacity are Developm Enabling engineers to utilize Al code-assistants to accelerate testing, feature deployment, and code
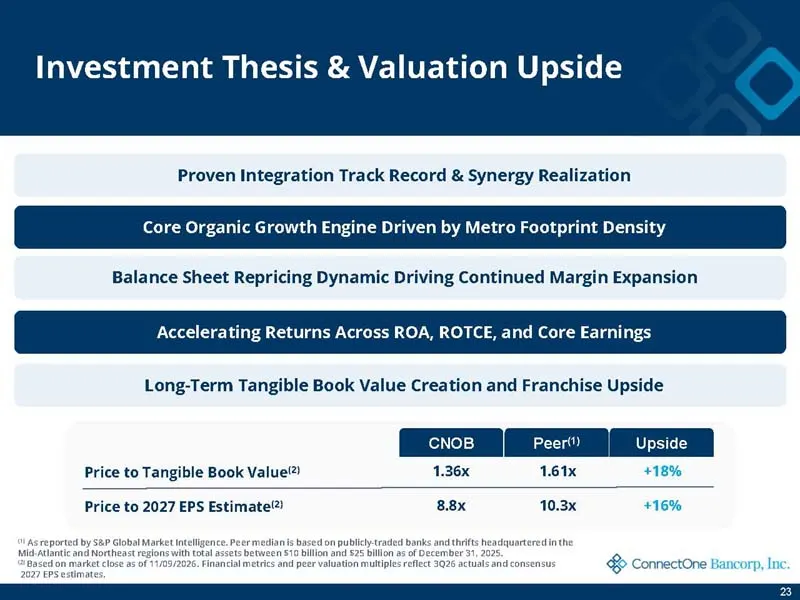
Slide 23: Investment Thesis & Valuation Upside
Investment Thesis & Valuation Upside Proven Integration Track Record & Synergy Realization Core Organic Growth Engine Driven by Metro Footprint Density Balance Sheet Repricing Dynamic Driving Continued Margin Expansion Accelerating Returns Across ROA, ROTCE, and Core Earnings Long-Term Tangible Book
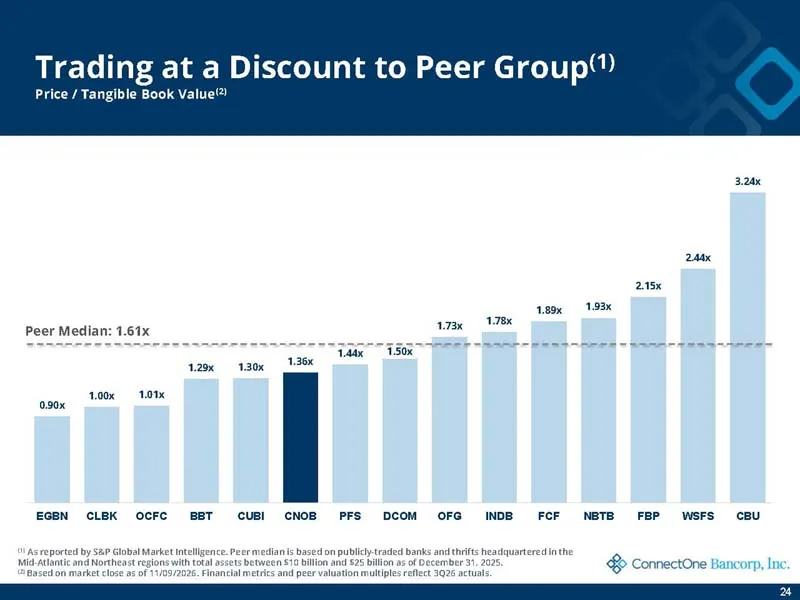
Slide 24: Trading at a Discount to Peer Group (Price / Tangible Book)
Trading at a Discount to Peer Group™ Price / Tangible Book Value® 3.24% 2a 215% tao 193 78x Peer Median: 1.61x Lea Tax” 150% 1.29 130x136 00x 1.0% 0.90x EGEN CLEK OcFC EBT CUBI CNOB PFS COM OFG INDB FCF NBTB FEP WSFS CBU nectOne Bancorp, Inc
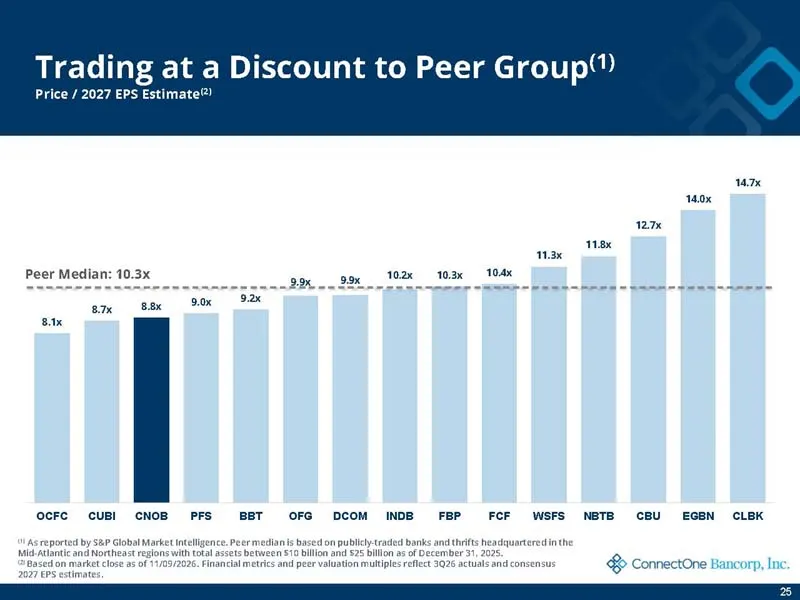
Slide 25: Trading at a Discount to Peer Group (Price / 2027 EPS)
Trading at a Discount to Peer Group™ Price / 2027 EPS Estimate®) 4% 140% 127% 18x Peer Median: 10.3x 10²% —10.3« — 104x 29x __ 99% am ae |e OK Bax OcFc cUBI CNOB PFS BET OFG DCOM FBP FCF WSFS NBTB CBU EGEN CLBK nectOne Bancorp, Inc
Slide 26: Appendix
¥ ConnectOne Bancorp, Ine. Appendix
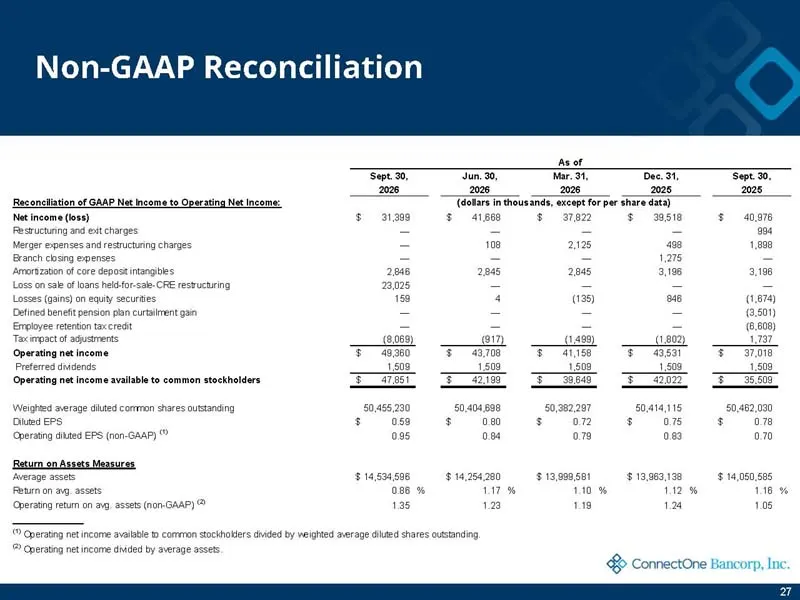
Slide 27: Non-GAAP Reconciliation
Non-GAAP Reconciliation As of Tan36 War. 37, Dee Sep, 2028 2026 2028 2028 Raconcliation of GAAP Net Income to Operating Net income: ‘Golars in thousands, except Yor per dare data) Net income (oss) $31.30 aise $78”. 2518 «$40,978, Merger espenses and resructung charges 02 2328 1508 Branch csing exens
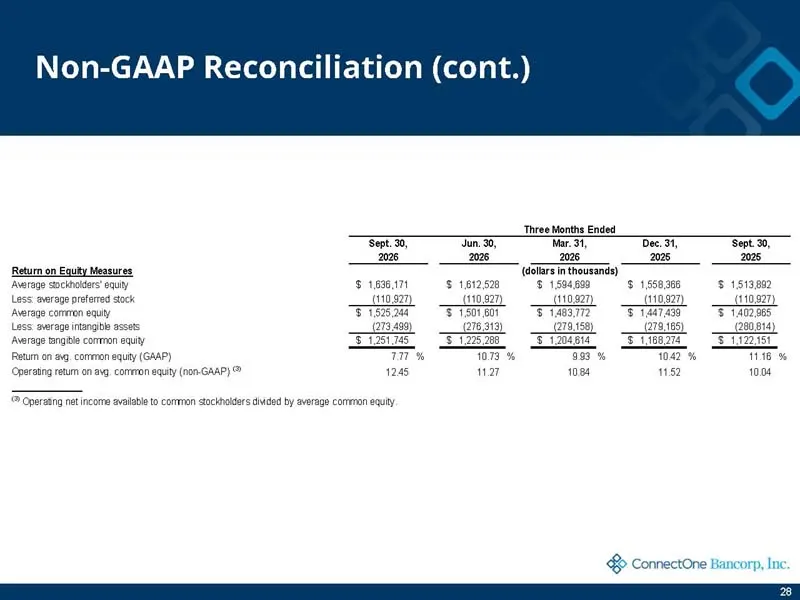
Slide 28: Non-GAAP Reconciliation (cont.)
Non-GAAP Reconciliation (cont.) ‘Three Monthe Ended Sept. 3, Tun, Mar 31 Dee. 3F Sept 3, 2028 206 2028 2028 2005 Return on Equty Measures (éalarsin thousands) avg common ng natincomavaabe to conmon sock & Connectine timenep, doc
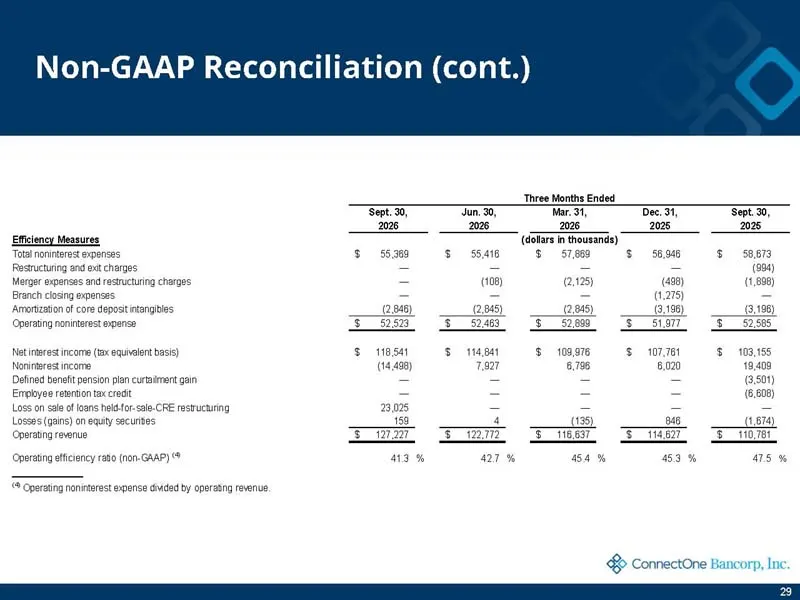
Slide 29: Non-GAAP Reconciliation (cont.)
Non-GAAP Reconciliation (cont.) Tee Months Ended Sept Tn 3 Mar 31 2028 2028 2028 (dotare thousand) wr S$ 5.020 Define benefit pension plan cutkmert gan Employee retro Loss on sa (CRE restructuring (peravng revenue (Operating etfciency ato (non-GAAP) & Connecttne timenep, doc
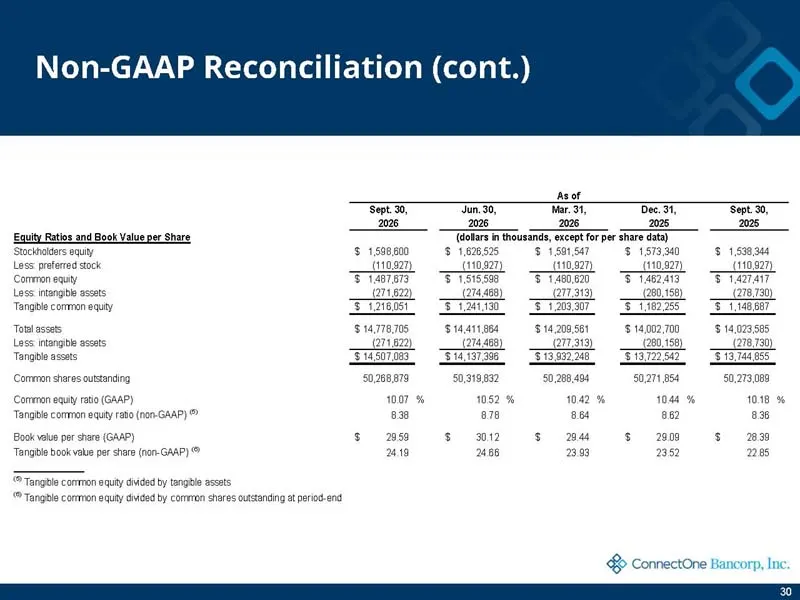
Slide 30: Non-GAAP Reconciliation (cont.)
Non-GAAP Reconciliation (cont.) qulty Ratios and Book Value per Share ja common aquty rien ecu & Connectine timenep, doc
Source: SEC EDGAR · 8-K filed Nov 17, 2026
More decks from ConnectOne Bancorp, Inc.
 Investor Presentation (November 2026)29 slides · Nov 5, 2026
 Investor Presentation (September 2026)25 slides · September 2026
 Investor Presentation (July 2026)25 slides · Jul 28, 2026
 Q2 2026 Earnings Presentation27 slides · Jul 23, 2026
 Investor Presentation (February 2026)27 slides · Feb 12, 2026
 Investor Presentation (November 2025)24 slides · November 2025