Azenta, Inc. · NASDAQ:AZTA
Azenta — 22nd Annual Needham Virtual Healthcare Conference 2023
21 slides from Azenta's conference presentation, Apr 18, 2023

Slide 1: Azenta Life Sciences at 22nd Annual Needham Virtual Healthcare Conference
Azenta Life Sciences 22nd Annual Needham Virtual Healthcare Conference April 18, 2023
Slide 2: Safe Harbor Statement
Safe Harbor Statement “Safe Harbor” Statement under the U.S. Private Securities Litigation Reform Act of 1995; certain matters in this presentation, including forecasts of future demand and future Company performance, are forward-looking statements that are subject to risks and uncertainties that co
Slide 3: Azenta Life Sciences at a Glance
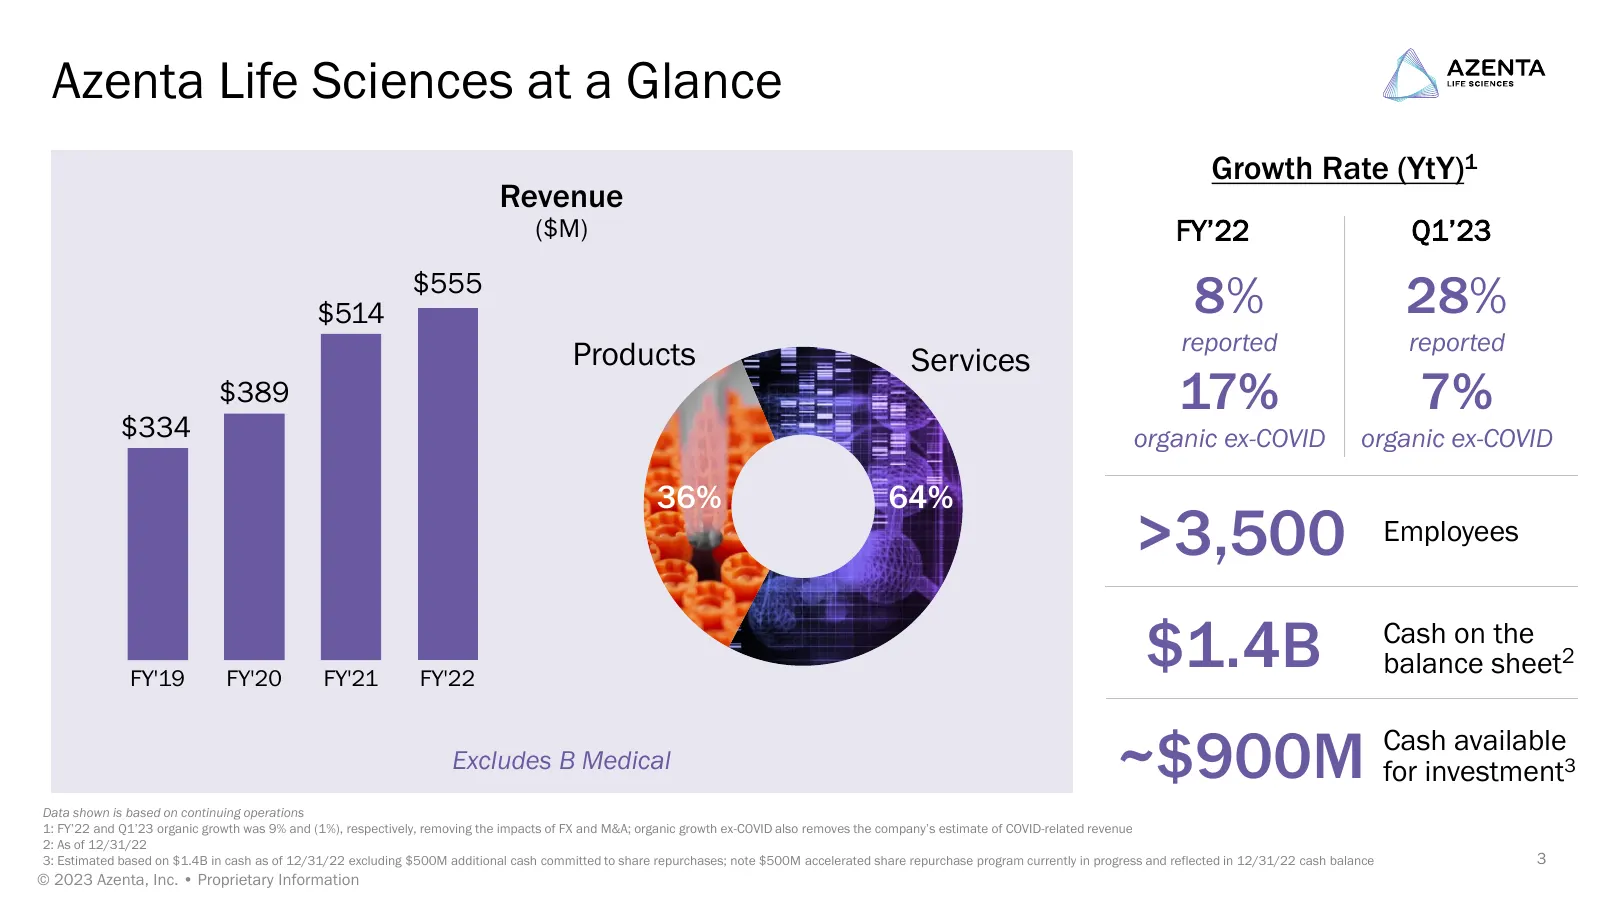
Azenta Life Sciences at a Glance Growth Rate (YtY)1 Revenue ($M) FY’22 Q1’23 $514 $555 8% 28% reported reported Products Services $389 17% 7% $334 organic ex-COVID organic ex-COVID 36% 64% >3,500 Employees FY'19 FY'20 FY'21 FY'22 $1.4B Cash on the balance sheet2 Excludes B Medical ~$900M Cash availa
Slide 4: Established Strong Foundation – Zero to >$500M
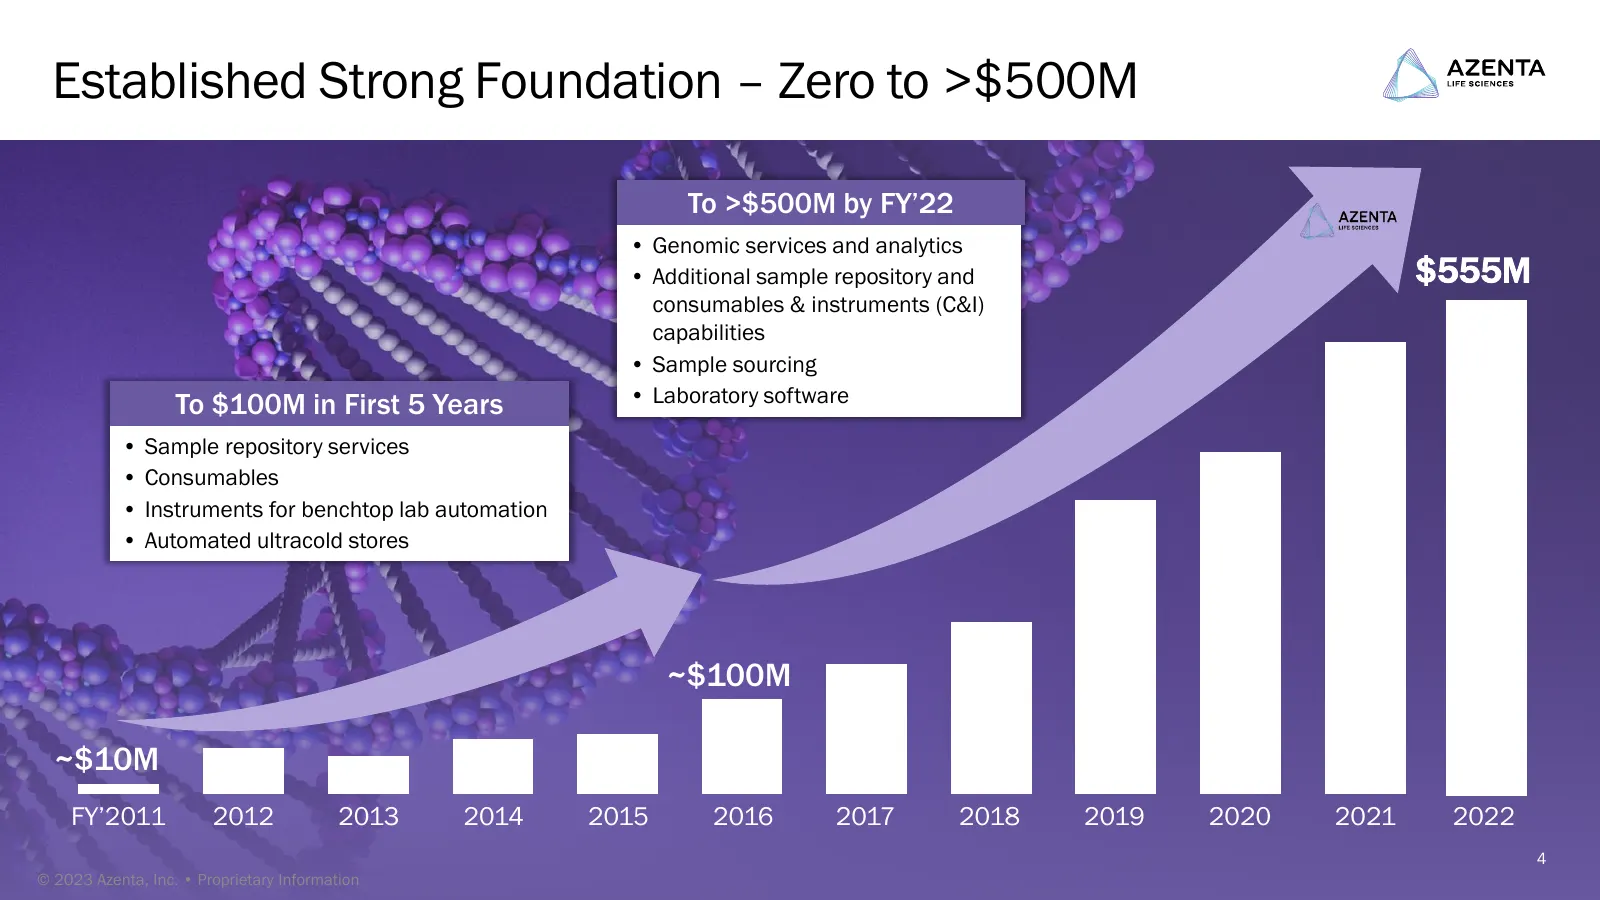
Established Strong Foundation – Zero to >$500M To >$500M by FY’22 • Genomic services and analytics • Additional sample repository and $555M consumables & instruments (C&I) capabilities • Sample sourcing To $100M in First 5 Years • Laboratory software • Sample repository services • Consumables • Inst
Slide 5: The Azenta Portfolio Is a Key Enabler Across the Sample Solutions and Management Value Chain
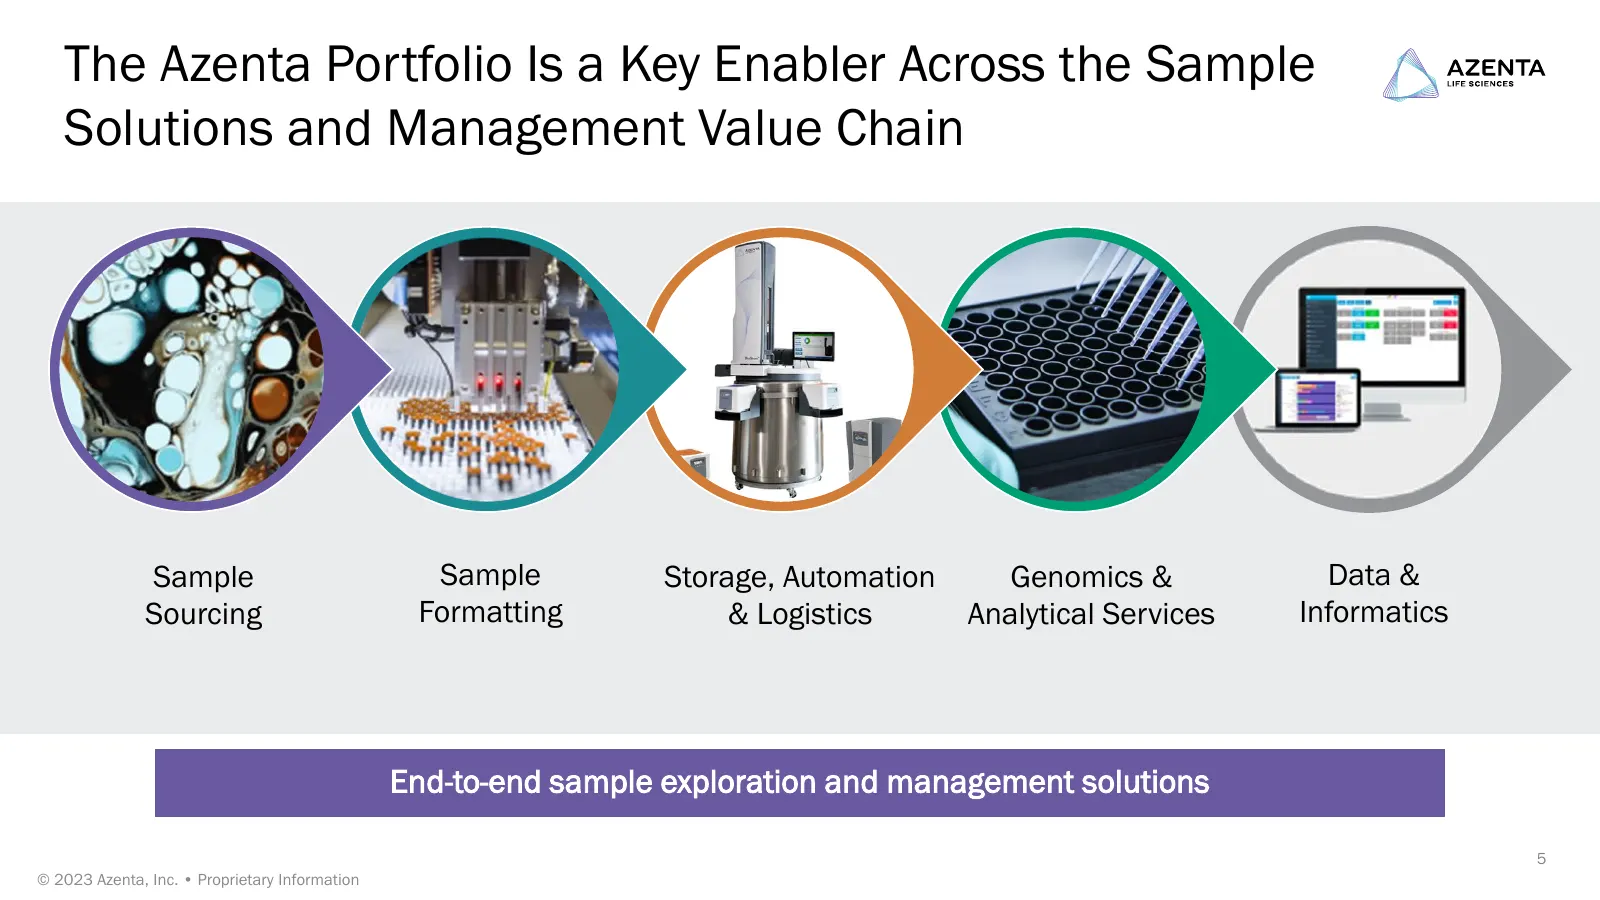
The Azenta Portfolio Is a Key Enabler Across the Sample Solutions and Management Value Chain The Azenta Portfolio Is a Key Enabler Across the Sample Solutions and Management Value Chain Sample Sample Storage, Automation Genomics & Data & Sourcing Formatting & Logistics Analytical Services Informatic
Slide 6: Strategically Positioned to Capitalize on Market Trends
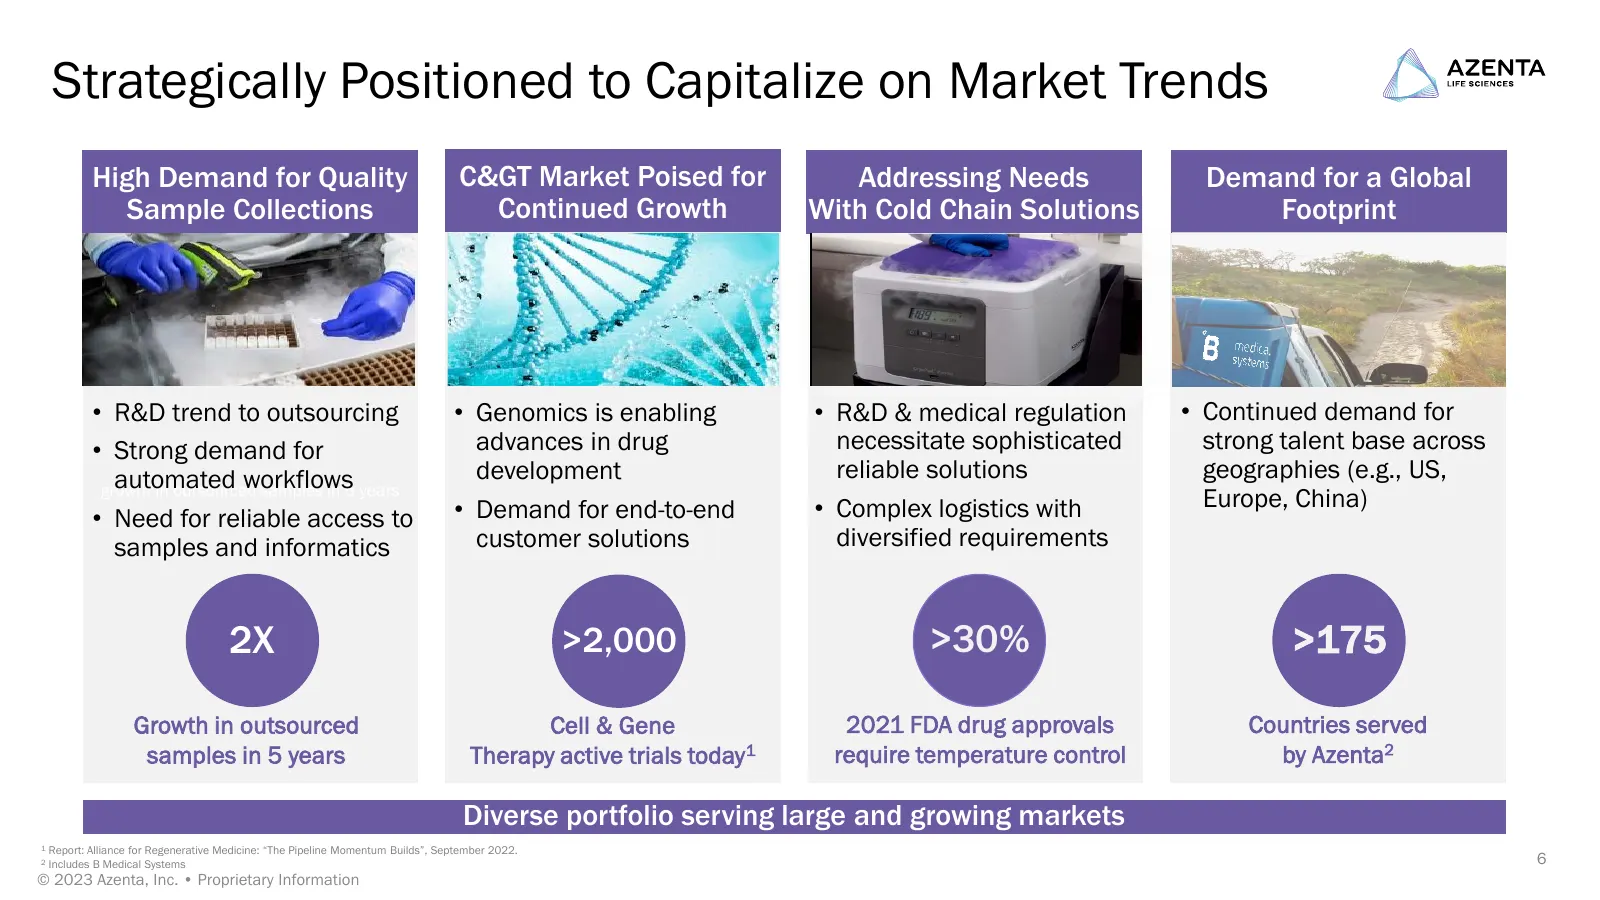
Strategically Positioned to Capitalize on Market Trends High Demand for Quality C> Market Poised for Addressing Needs Demand for a Global Sample Collections Continued Growth With Cold Chain Solutions Footprint • R&D trend to outsourcing • Genomics is enabling • R&D & medical regulation • Continued
Slide 7: Critical CGT Customer Needs Solved By Unique Offerings
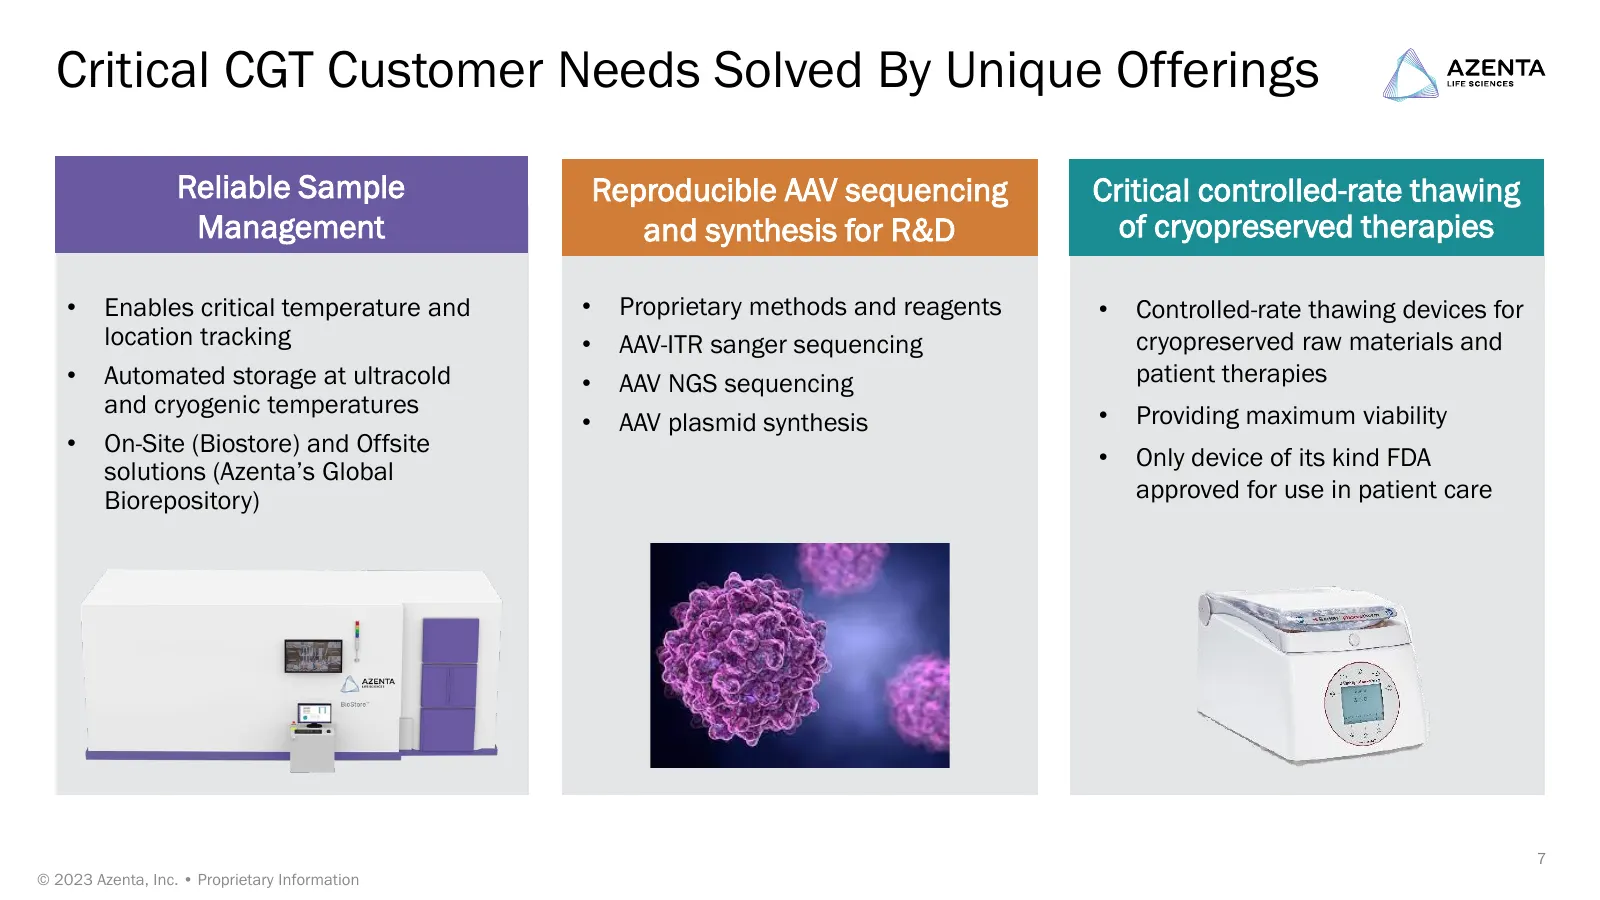
Critical CGT Customer Needs Solved By Unique Offerings Reliable Sample Reproducible AAV sequencing Critical controlled-rate thawing Management and synthesis for R&D of cryopreserved therapies • Enables critical temperature and • Proprietary methods and reagents • Controlled-rate thawing devices for
Slide 8: Serving an Impressive Roster of Global Customers
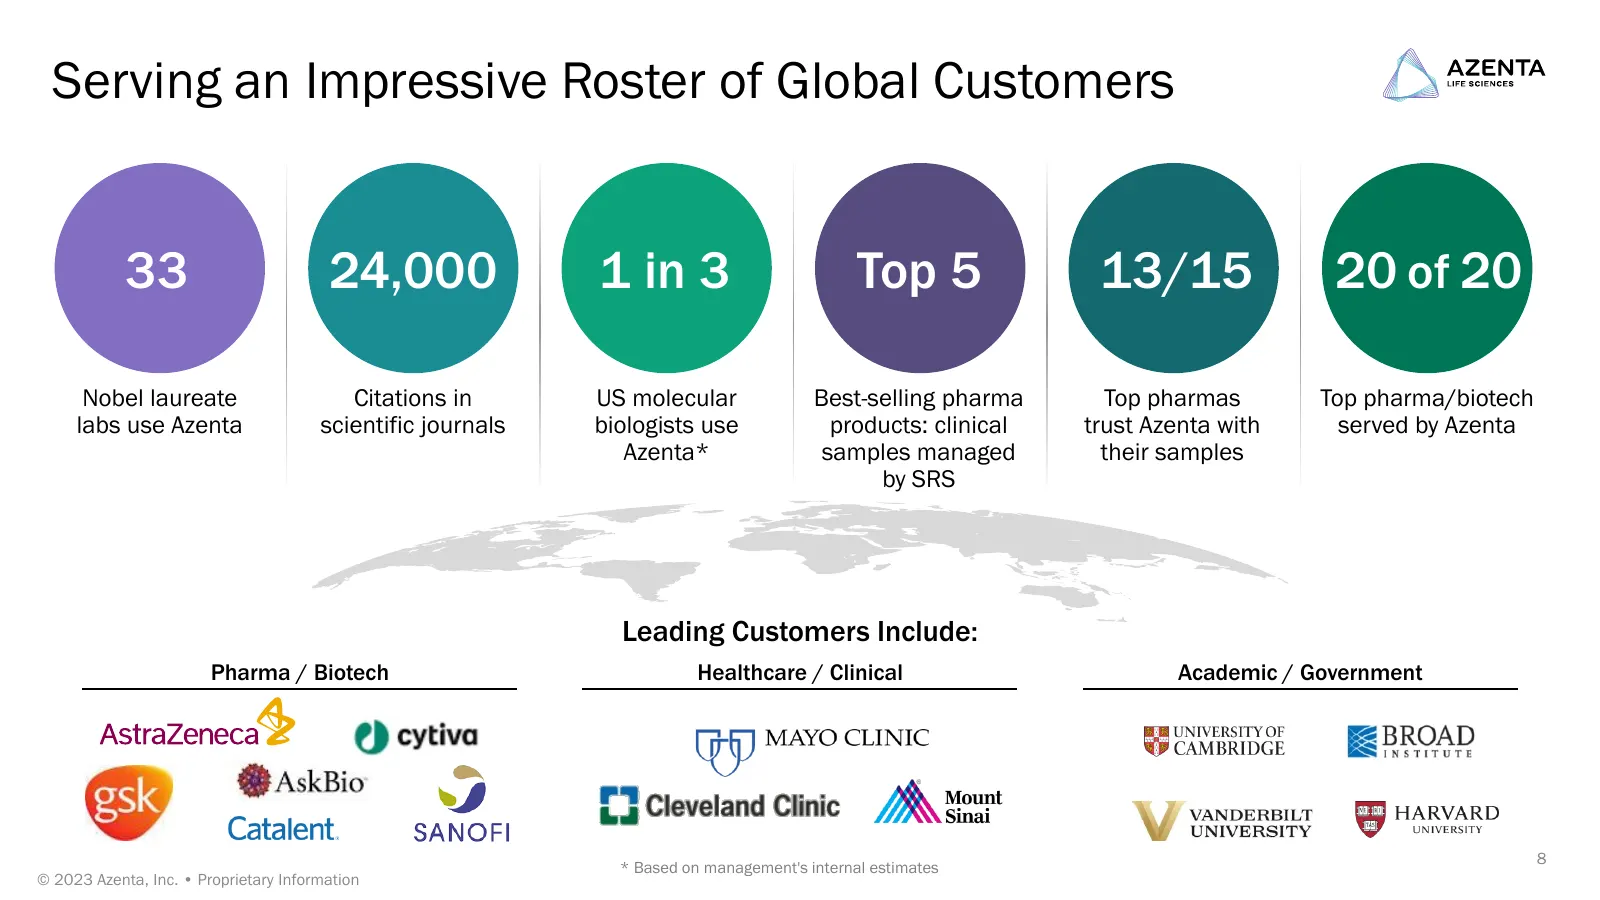
Serving an Impressive Roster of Global Customers 33 24,000 1 in 3 Top 5 13/15 20 of 20 Nobel laureate Citations in US molecular Best-selling pharma Top pharmas Top pharma/biotech labs use Azenta scientific journals biologists use products: clinical trust Azenta with served by Azenta Azenta* samples
Slide 9: B Medical: A Global Leader in Vaccine Cold Chain and Temperature-Controlled Transport
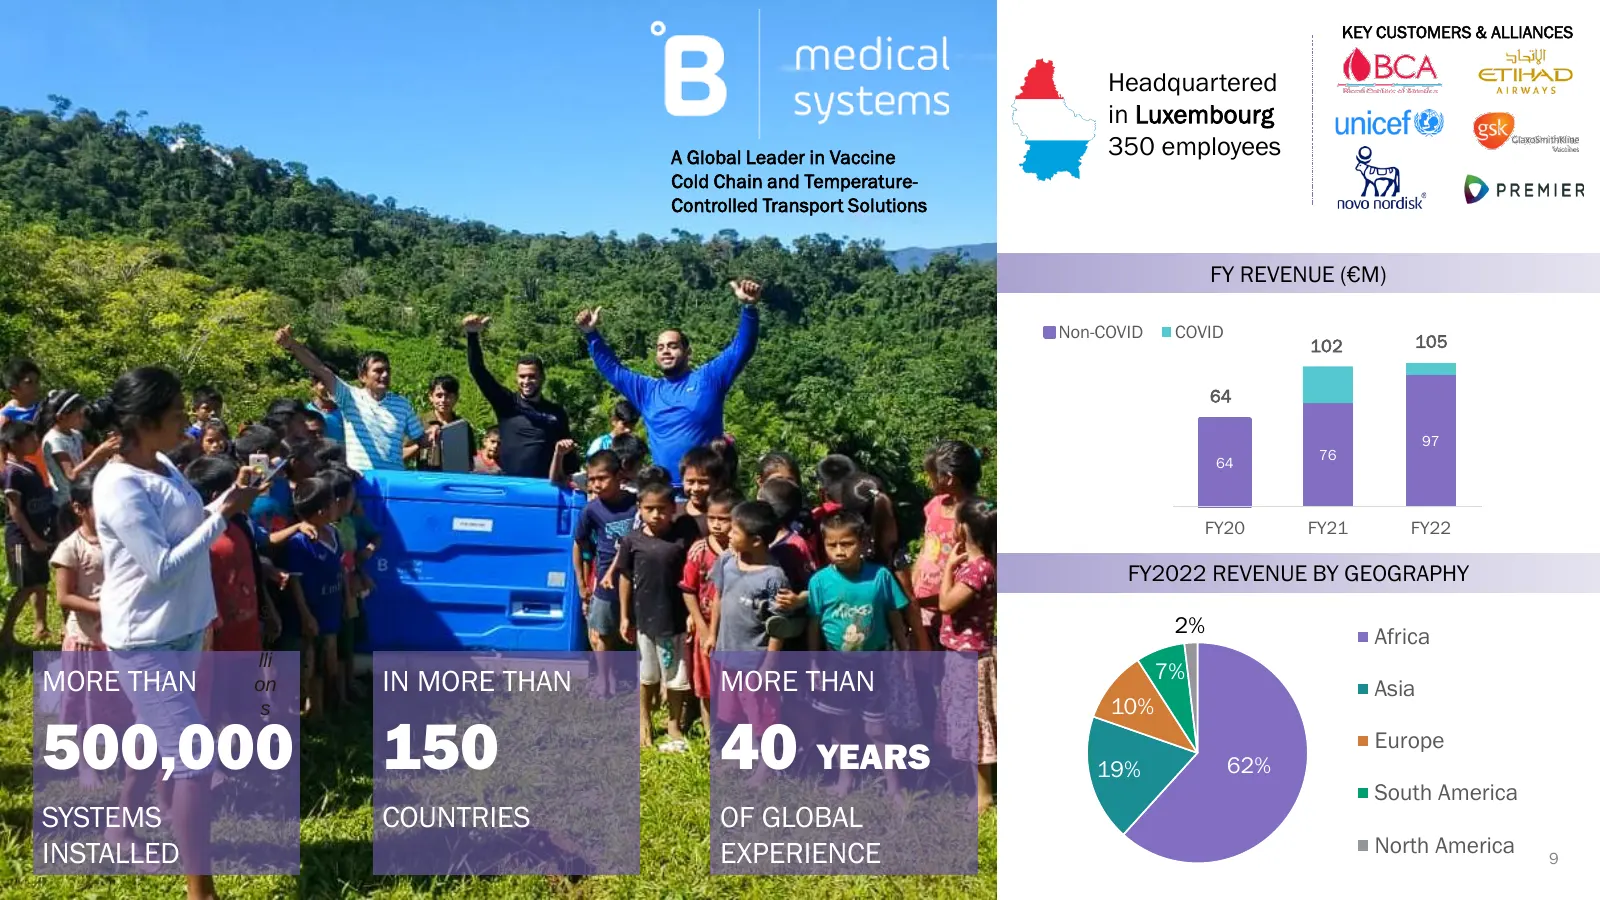
KEY CUSTOMERS & ALLIANCES Headquartered in Luxembourg A Global Leader in Vaccine 350 employees Cold Chain and Temperature- Controlled Transport Solutions FY REVENUE (€M) Non-COVID COVID 102 105 64 97 76 64 FY20 FY21 FY22 FY2022 REVENUE BY GEOGRAPHY $ mi 2% Africa lli MORE THAN IN MORE THAN MORE THAN
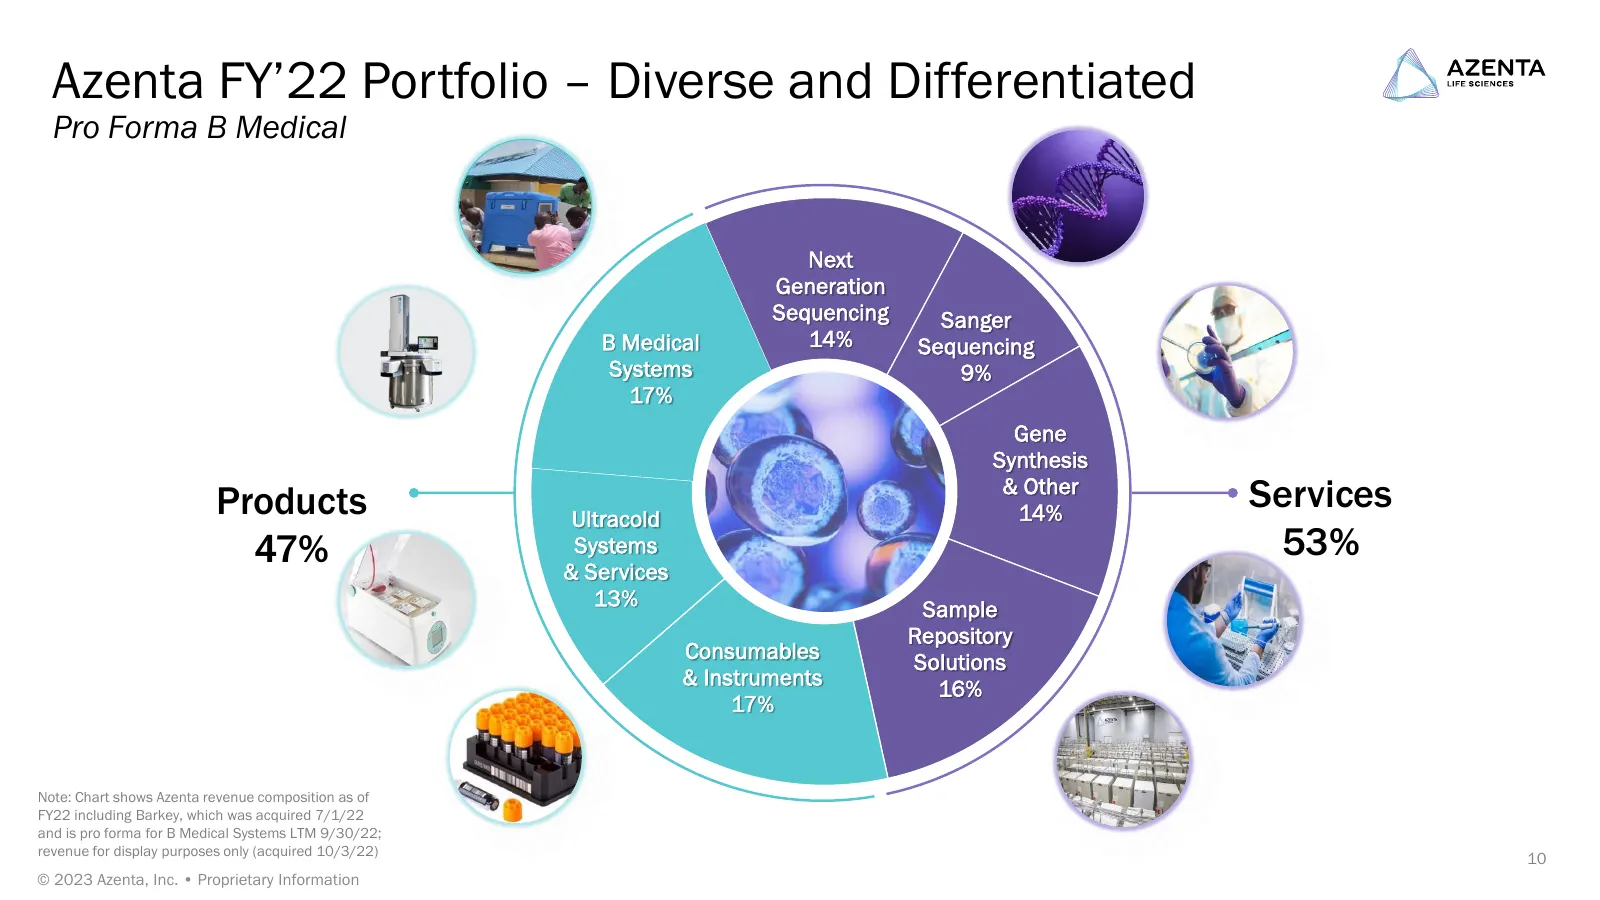
Slide 10: Azenta FY'22 Portfolio – Diverse and Differentiated
Azenta FY’22 Portfolio – Diverse and Differentiated Pro Forma B Medical Next Generation Sequencing Sanger B Medical 14% Sequencing Systems 9% 17% Gene Synthesis Products Ultracold & Other 14% Services 47% Systems 53% & Services 13% Sample Repository Consumables Solutions & Instruments 16% 17% Note:
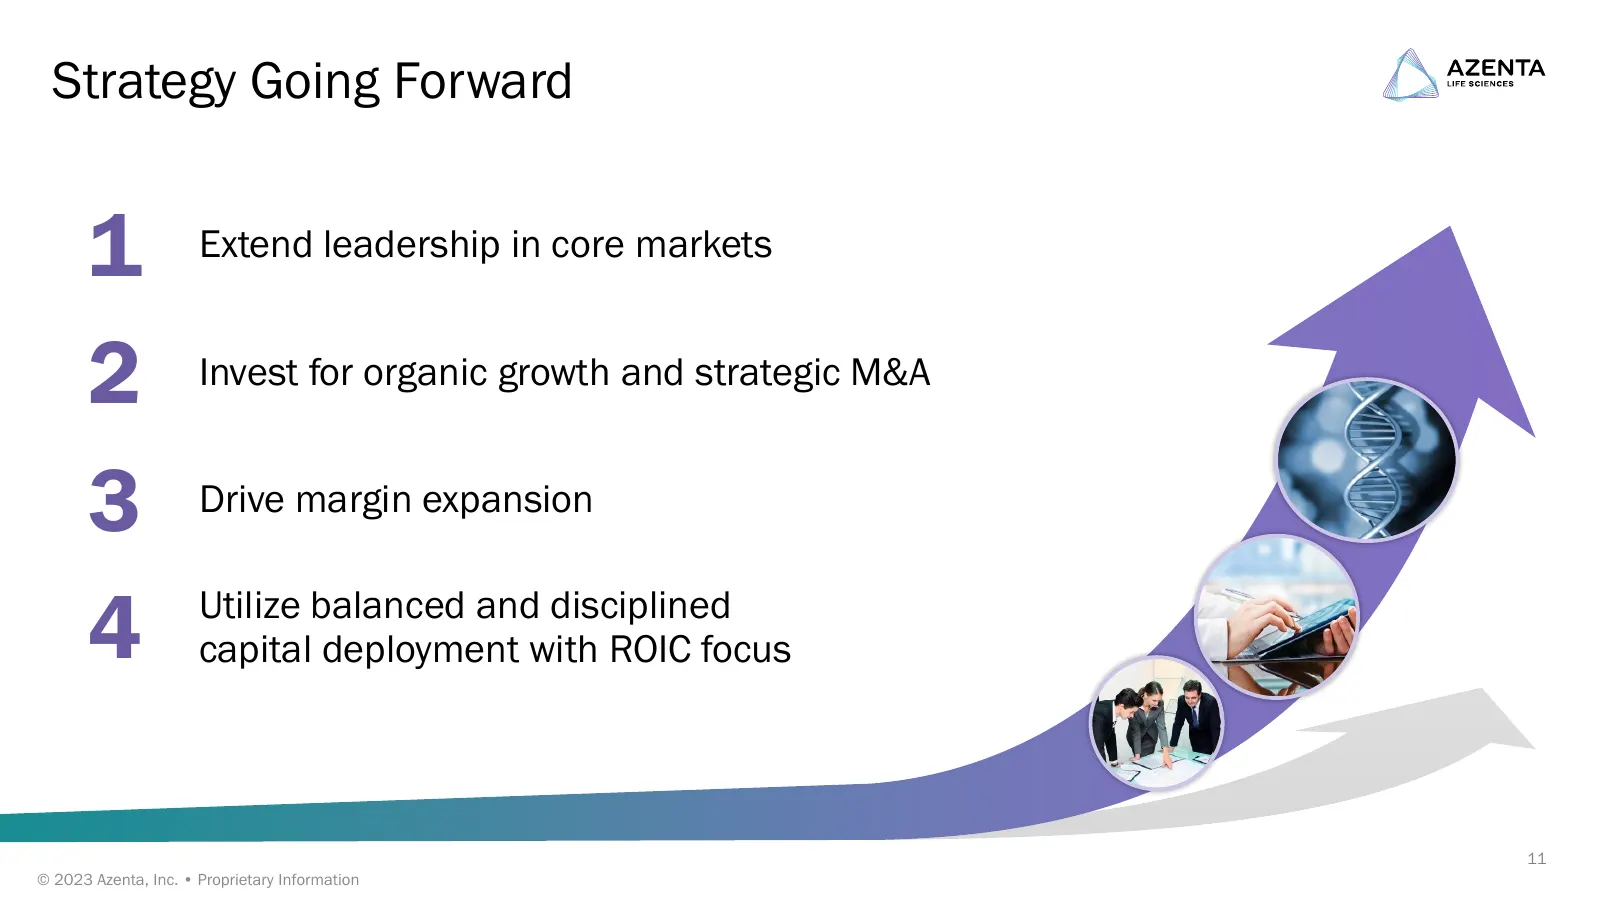
Slide 11: Strategy Going Forward
Strategy Going Forward 1 Extend leadership in core markets 2 Invest for organic growth and strategic M&A 3 Drive margin expansion 4 capital deployment with ROIC focus Utilize balanced and disciplined 11 © 2023 Azenta, Inc. • Proprietary Information
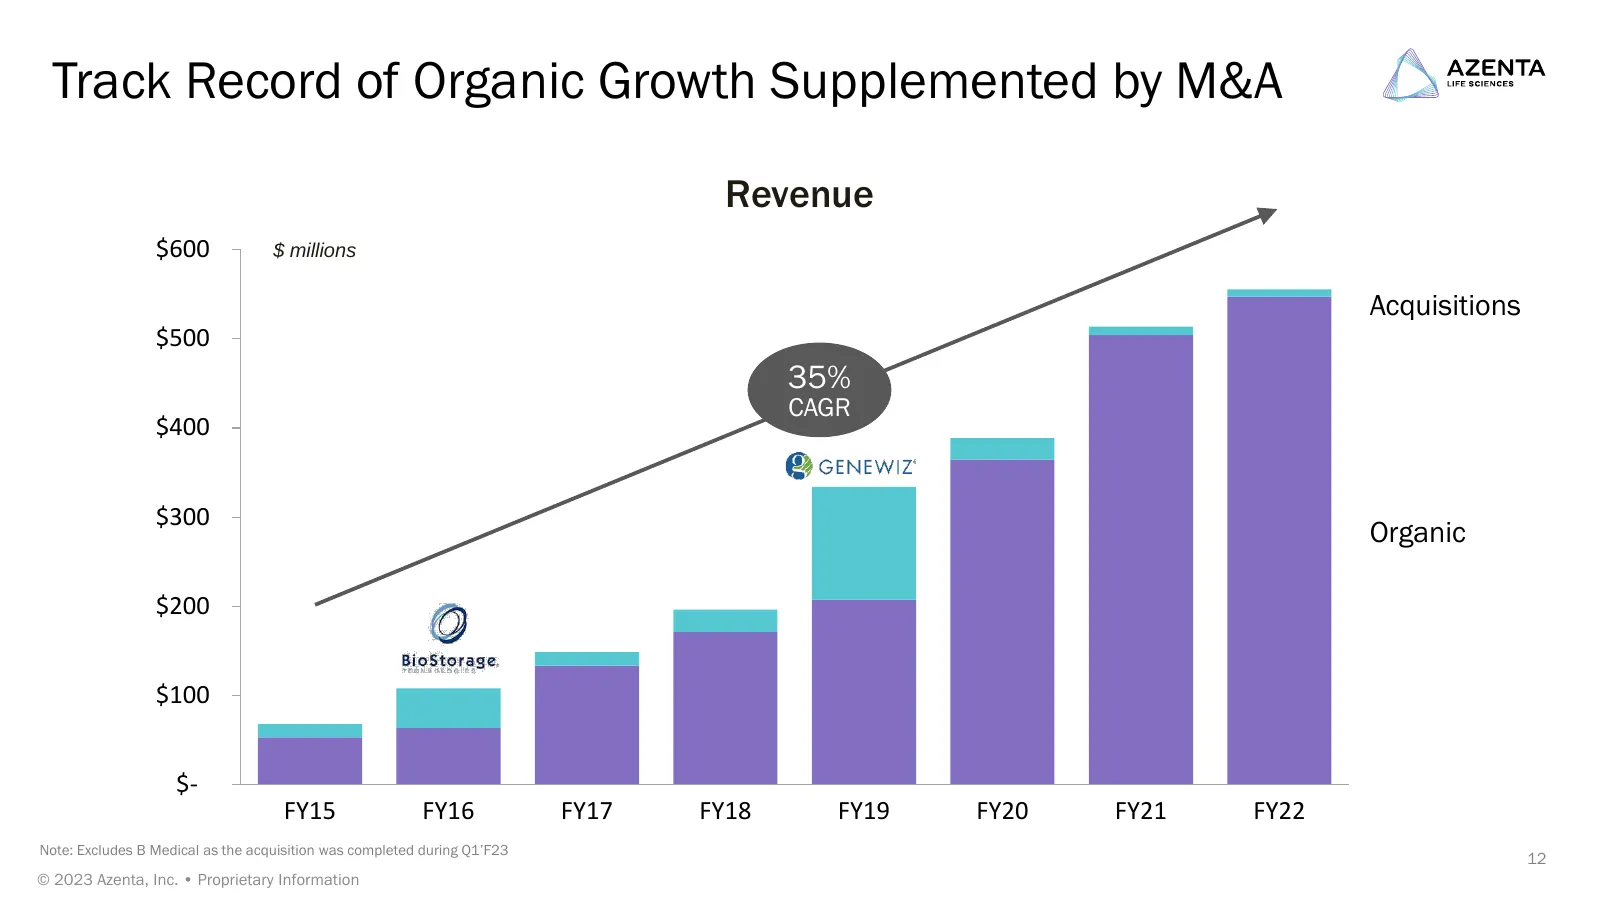
Slide 12: Track Record of Organic Growth Supplemented by M&A
Track Record of Organic Growth Supplemented by M&A Revenue $600 $ millions Acquisitions $500 35% CAGR $400 $300 Organic $200 $100 $- FY15 FY16 FY17 FY18 FY19 FY20 FY21 FY22 Note: Excludes B Medical as the acquisition was completed during Q1’F23 12 © 2023 Azenta, Inc. • Proprietary Information
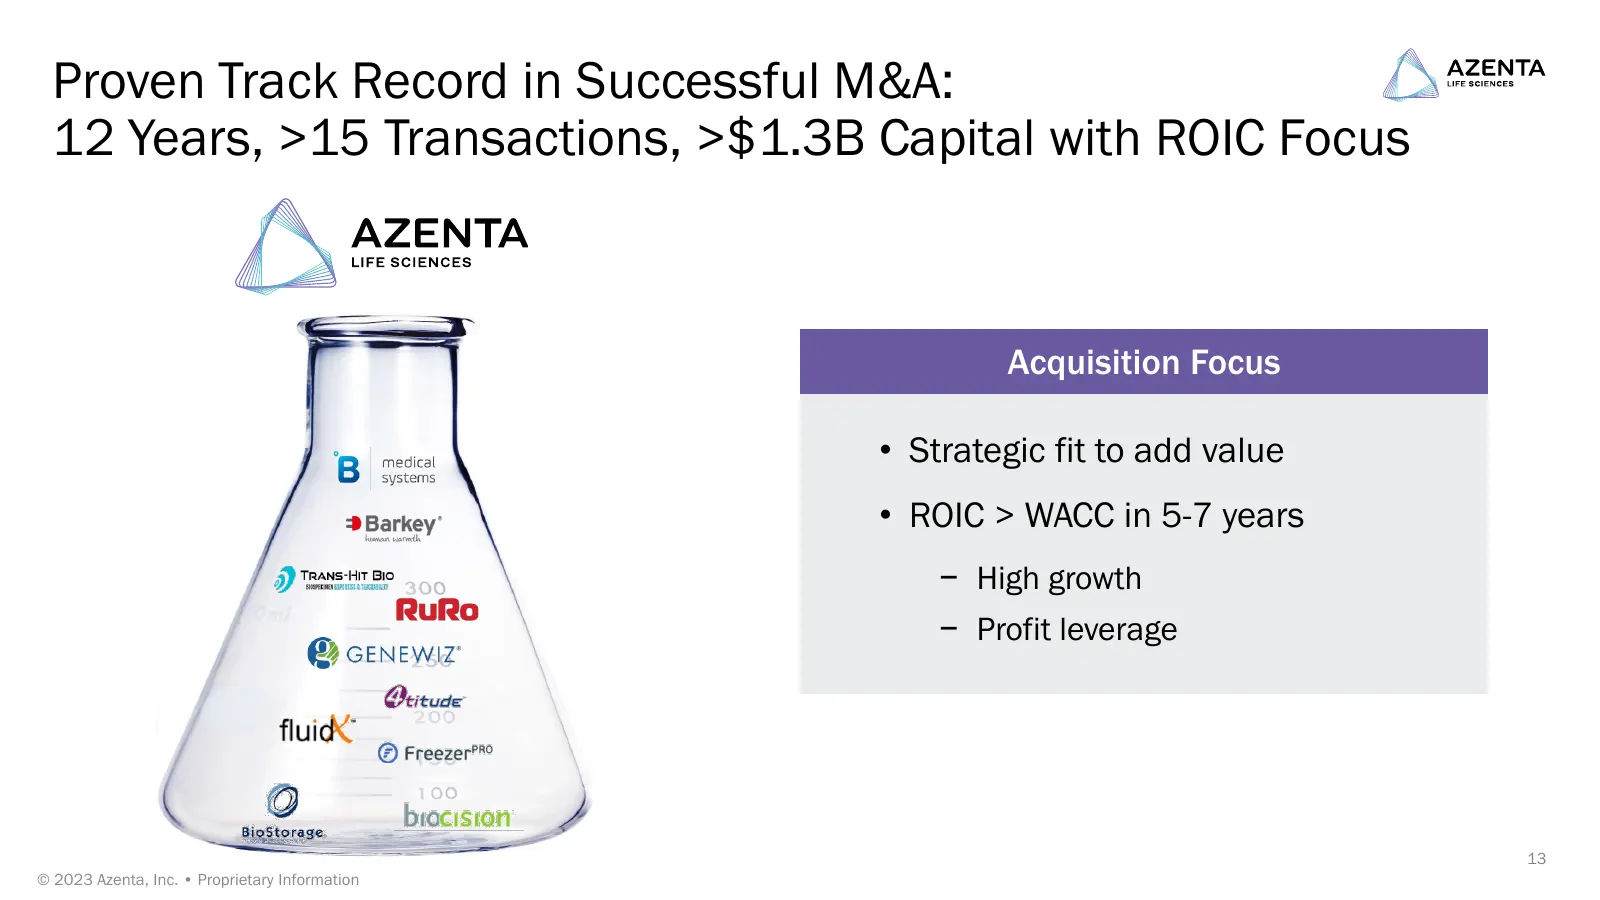
Slide 13: Proven Track Record in Successful M&A
Proven Track Record in Successful M&A: 12 Years, >15 Transactions, >$1.3B Capital with ROIC Focus Acquisition Focus • Strategic fit to add value • ROIC > WACC in 5-7 years − High growth − Profit leverage 13 © 2023 Azenta, Inc. • Proprietary Information
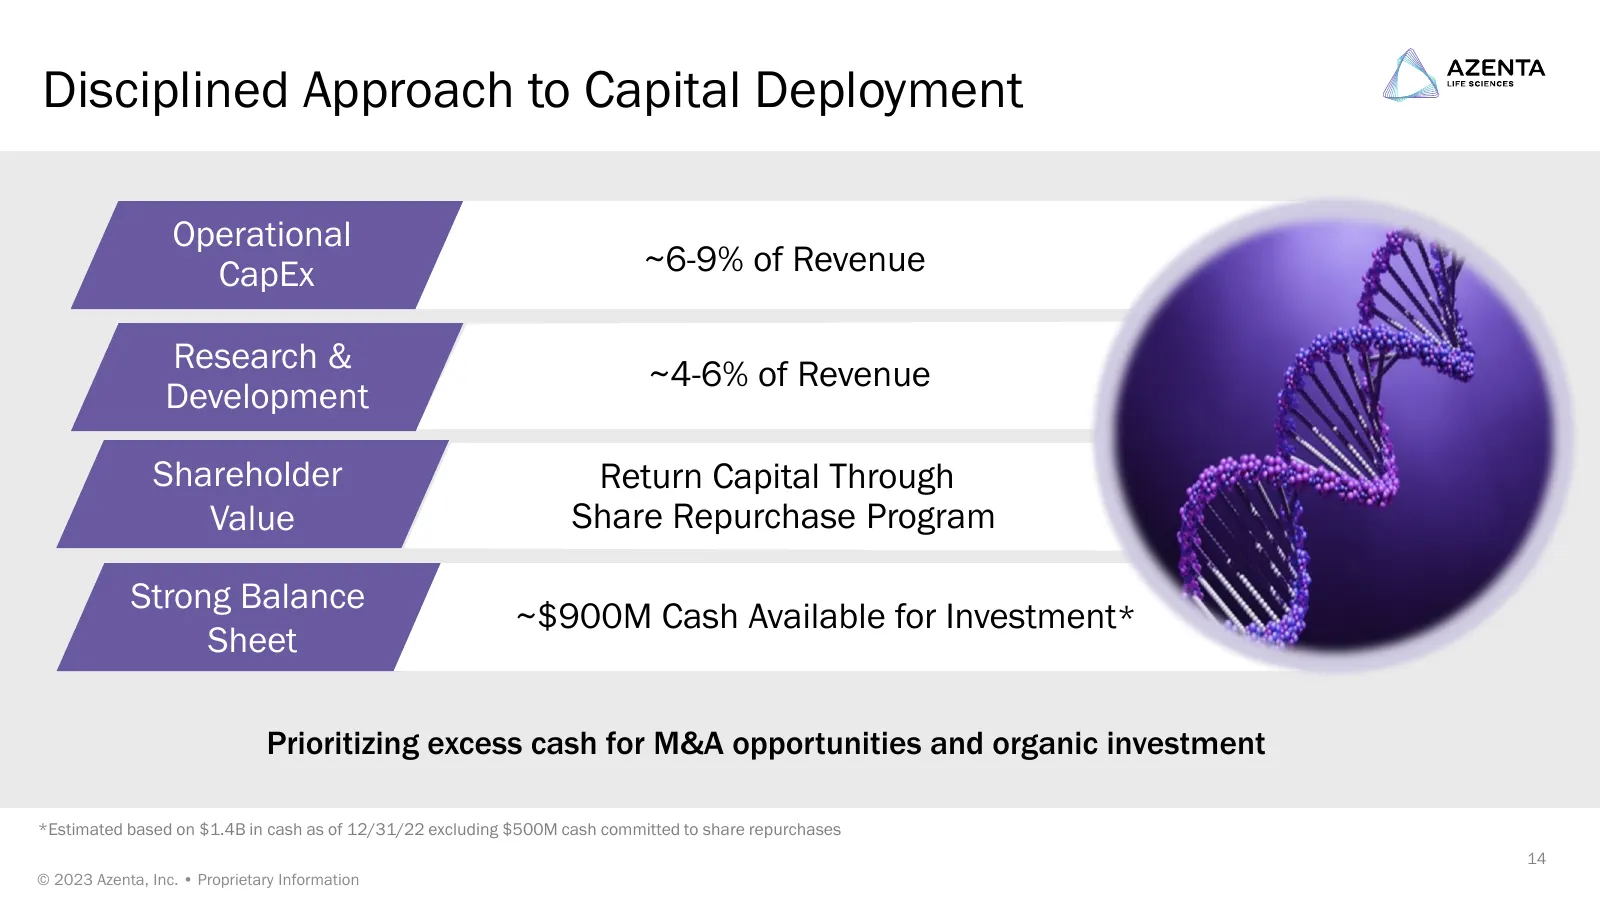
Slide 14: Disciplined Approach to Capital Deployment
Disciplined Approach to Capital Deployment Operational CapEx ~6-9% of Revenue Research & ~4-6% of Revenue Development Shareholder Return Capital Through Value Share Repurchase Program Strong Balance ~$900M Cash Available for Investment* Sheet Prioritizing excess cash for M&A opportunities and organi
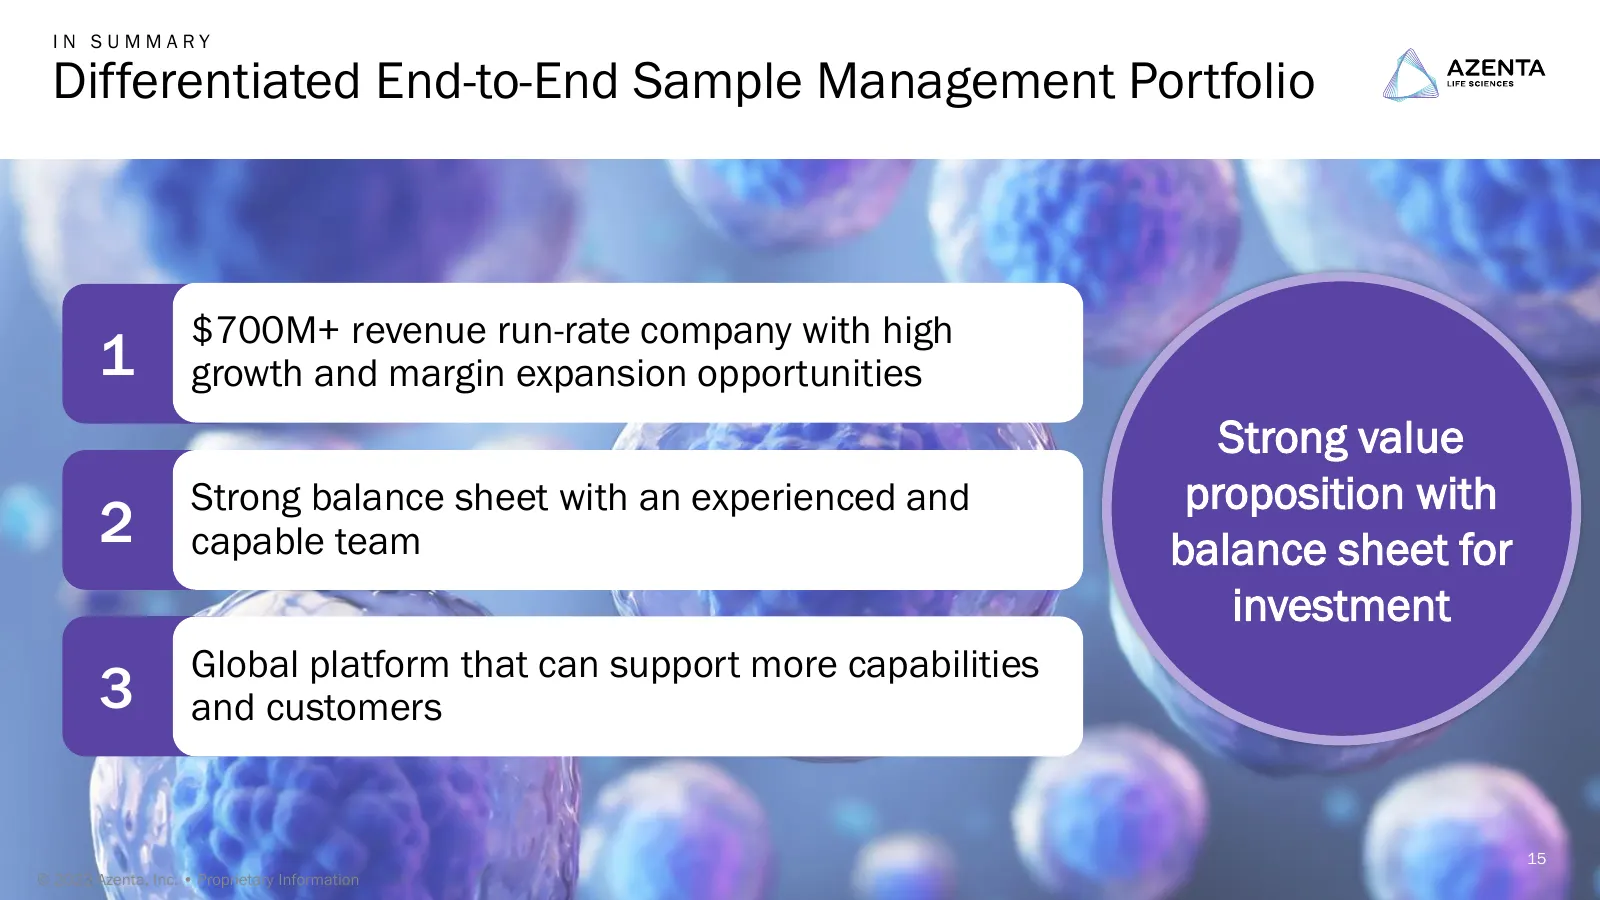
Slide 15: Differentiated End-to-End Sample Management Portfolio
IN SUMMARY Differentiated End-to-End Sample Management Portfolio $700M+ revenue run-rate company with high 1 growth and margin expansion opportunities Strong value Strong balance sheet with an experienced and proposition with 2 capable team balance sheet for investment Global platform that can suppo

Slide 16: Appendix
/ \ AZENTA LIFE SCIENCES Appendix
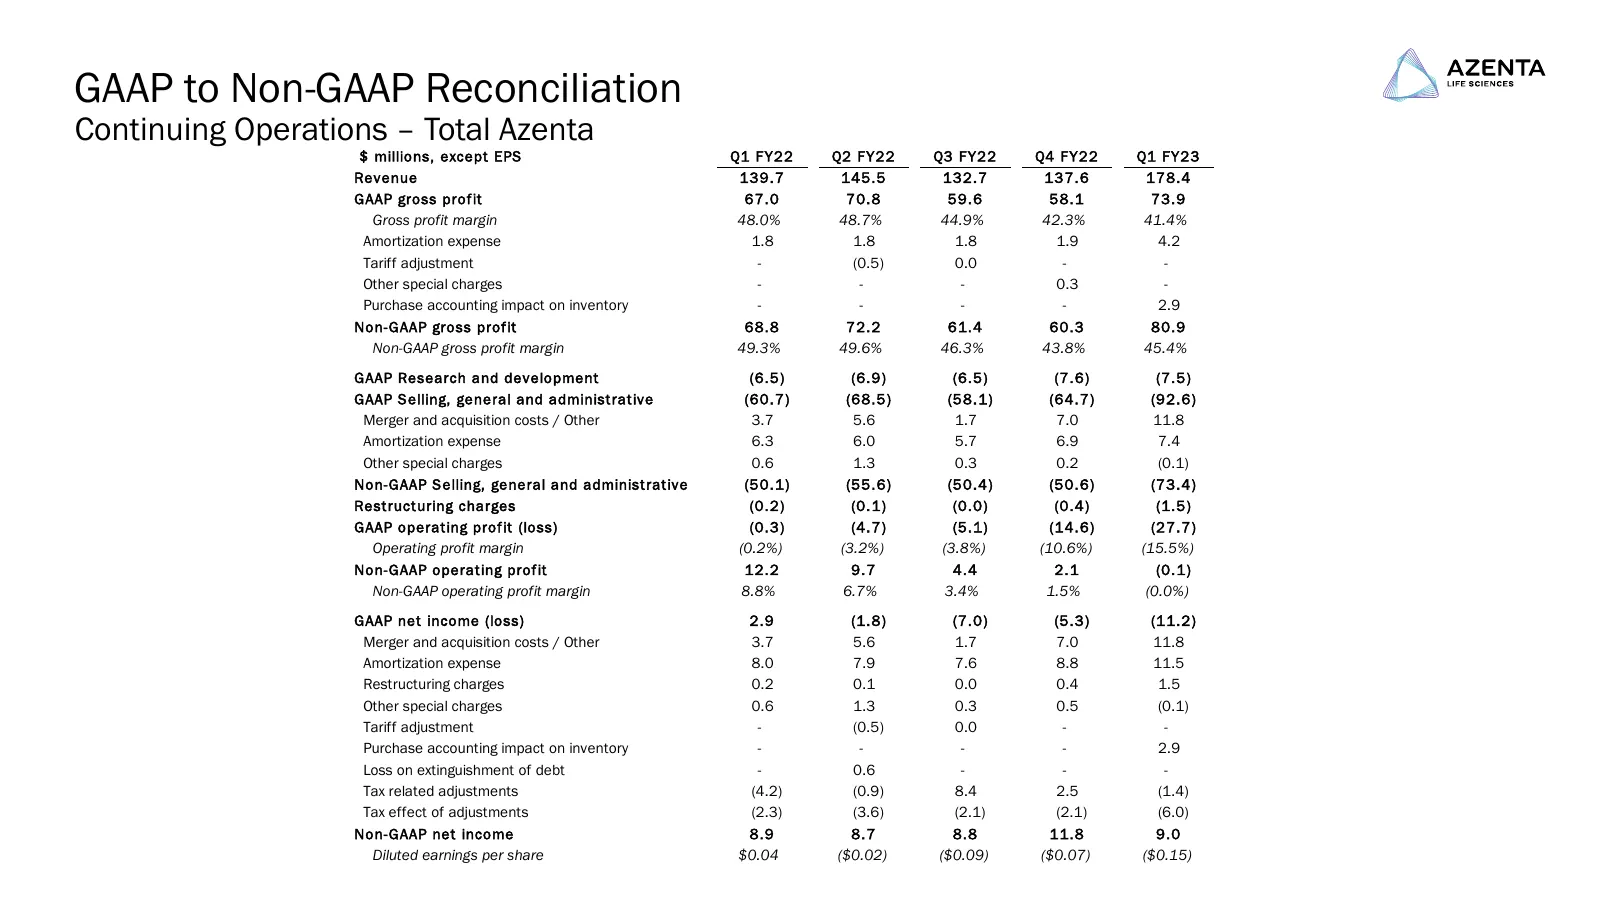
Slide 17: GAAP to Non-GAAP Reconciliation
GAAP to Non-GAAP Reconciliation Continuing Operations – Total Azenta $ millions, except EPS Q1 FY22 Q2 FY22 Q3 FY22 Q4 FY22 Q1 FY23 Revenue 139.7 145.5 132.7 137.6 178.4 GAAP gross profit 67.0 70.8 59.6 58.1 73.9 Gross profit margin 48.0% 48.7% 44.9% 42.3% 41.4% Amortization expense 1.8 1.8 1.8 1.9
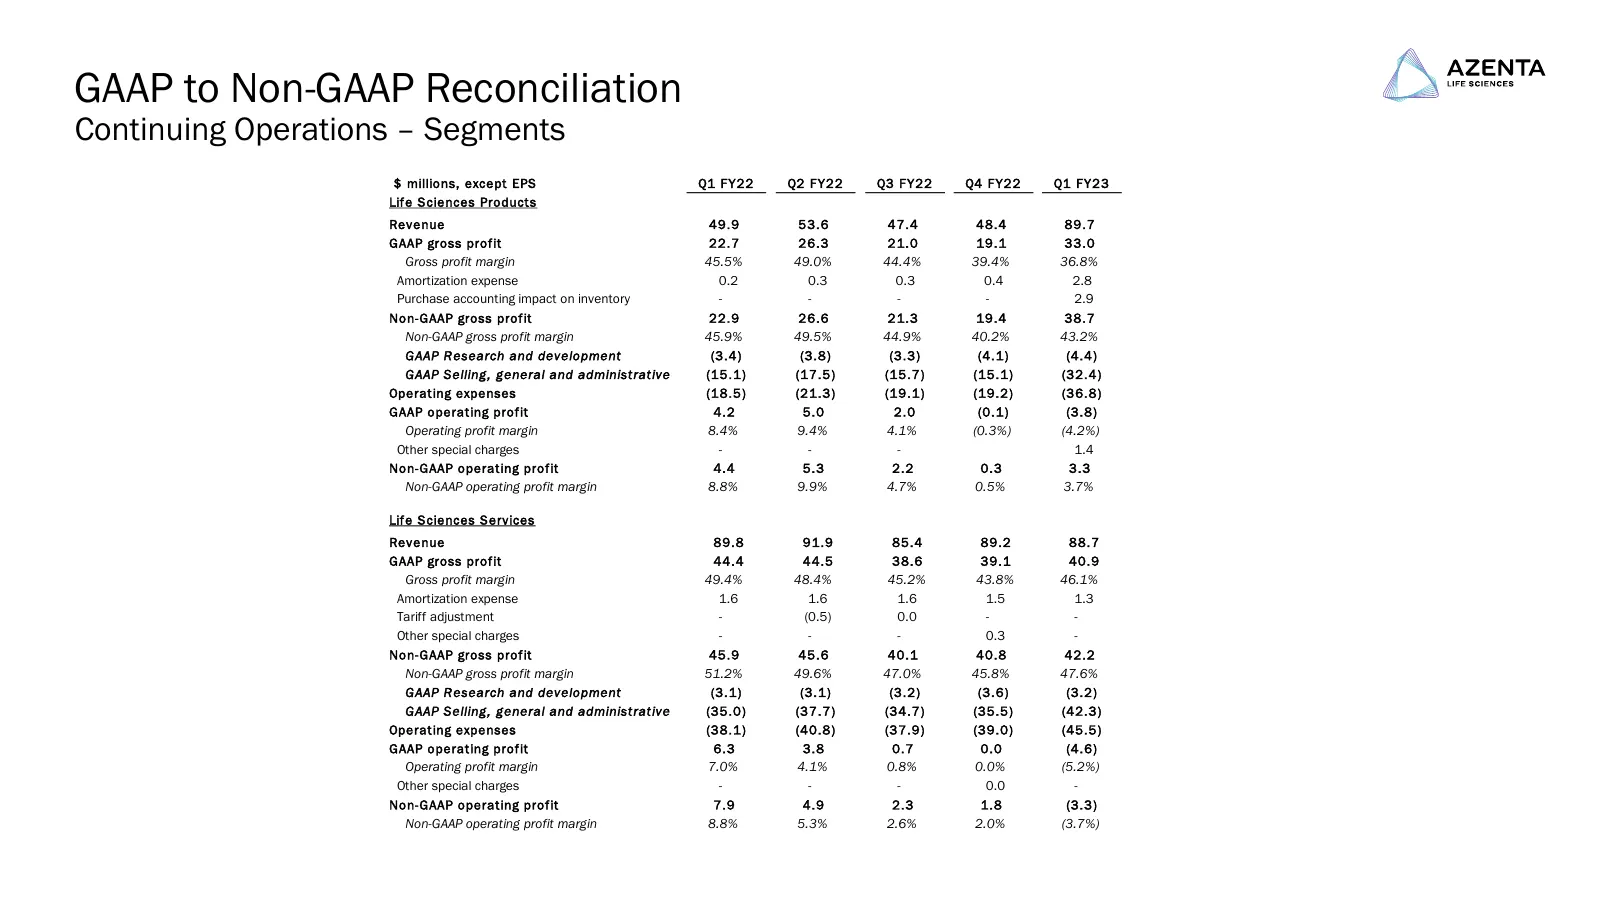
Slide 18: GAAP to Non-GAAP Reconciliation – Segments
GAAP to Non-GAAP Reconciliation Continuing Operations – Segments $ millions, except EPS Q1 FY22 Q2 FY22 Q3 FY22 Q4 FY22 Q1 FY23 Life Sciences Products Revenue 49.9 53.6 47.4 48.4 89.7 GAAP gross profit 22.7 26.3 21.0 19.1 33.0 Gross profit margin 45.5% 49.0% 44.4% 39.4% 36.8% Amortization expense 0.
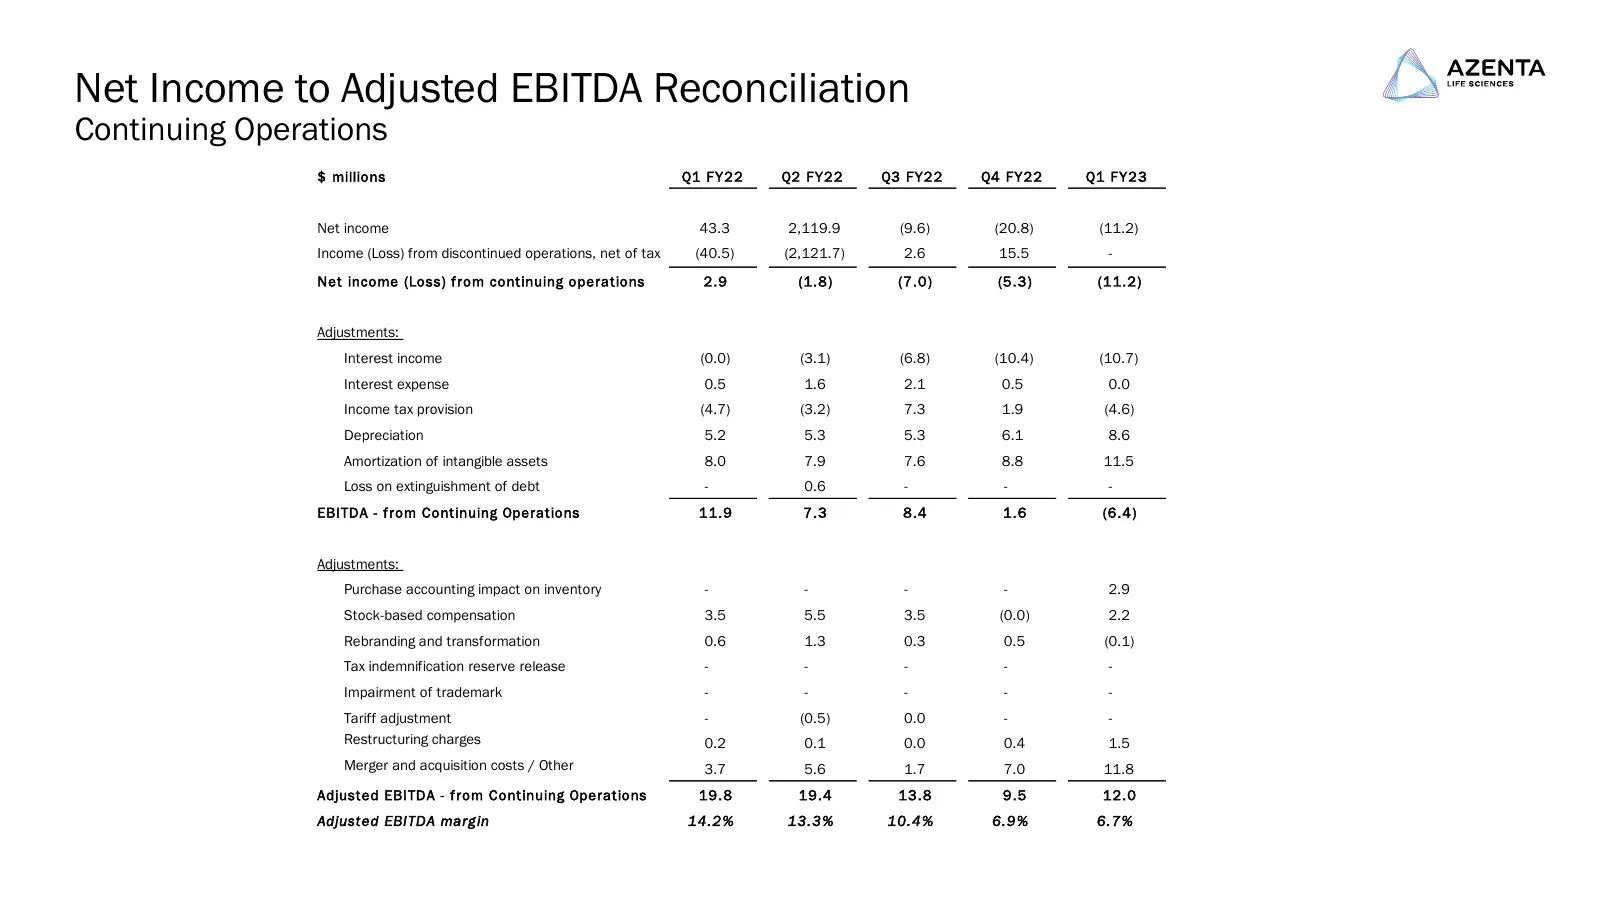
Slide 19: Net Income to Adjusted EBITDA Reconciliation
Net Income to Adjusted EBITDA Reconciliation Continuing Operations $ millions Q1 FY22 Q2 FY22 Q3 FY22 Q4 FY22 Q1 FY23 Net income 43.3 2,119.9 (9.6) (20.8) (11.2) Income (Loss) from discontinued operations, net of tax (40.5) (2,121.7) 2.6 15.5 - Net income (Loss) from continuing operations 2.9 (1.8)
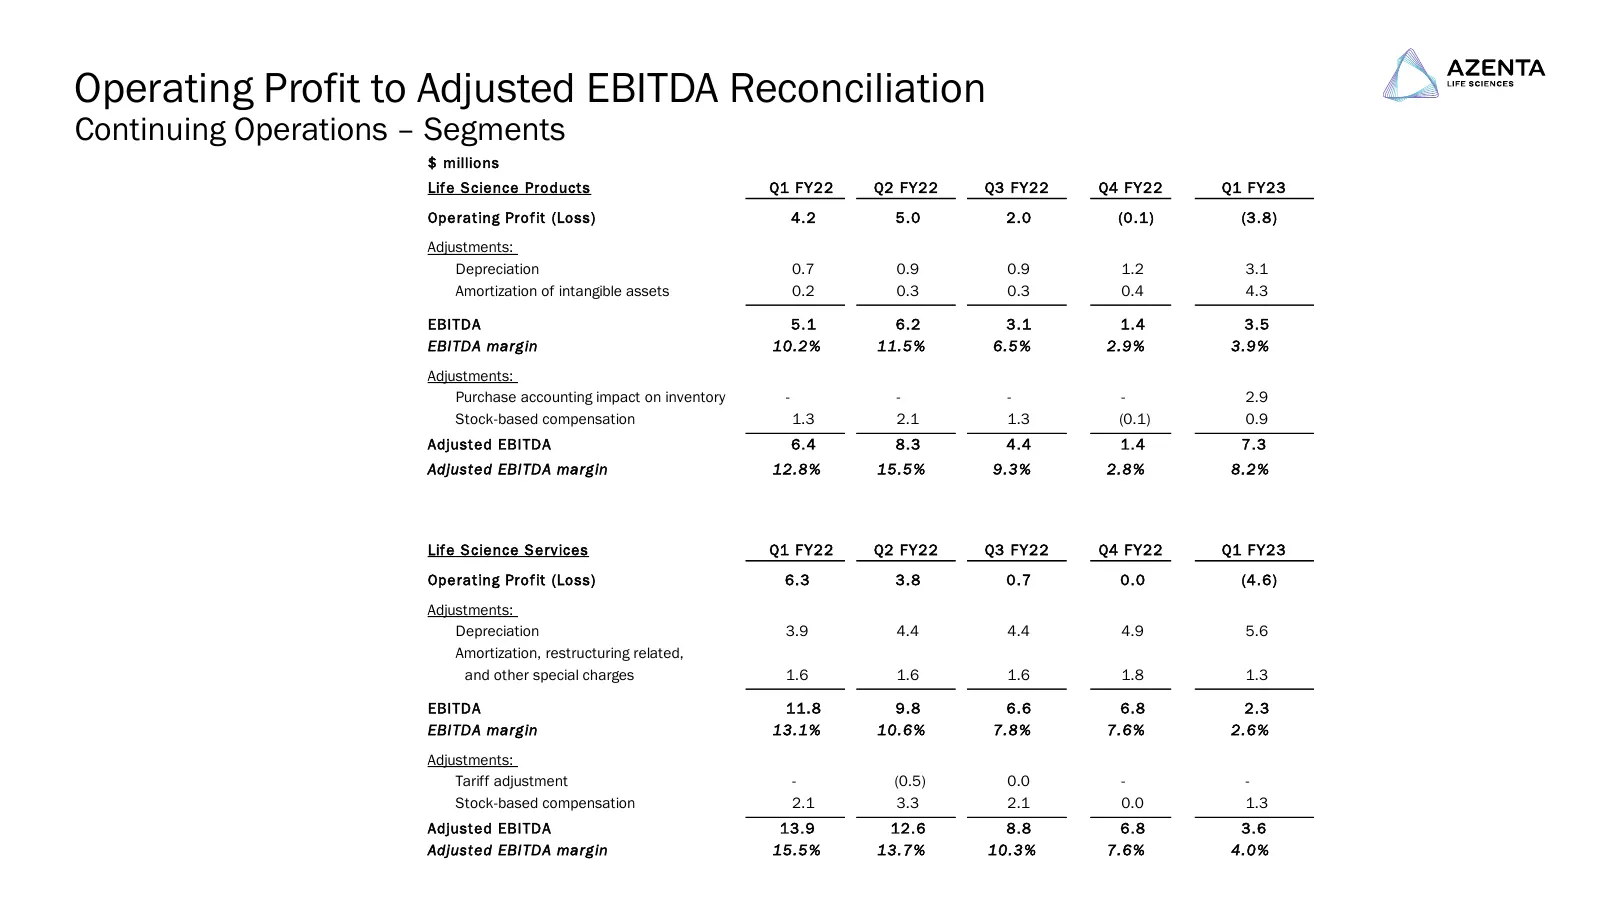
Slide 20: Operating Profit to Adjusted EBITDA Reconciliation
Operating Profit to Adjusted EBITDA Reconciliation Continuing Operations – Segments $ millions Life Science Products Q1 FY22 Q2 FY22 Q3 FY22 Q4 FY22 Q1 FY23 Operating Profit (Loss) 4.2 5.0 2.0 (0.1) (3.8) Adjustments: Depreciation 0.7 0.9 0.9 1.2 3.1 Amortization of intangible assets 0.2 0.3 0.3 0.4
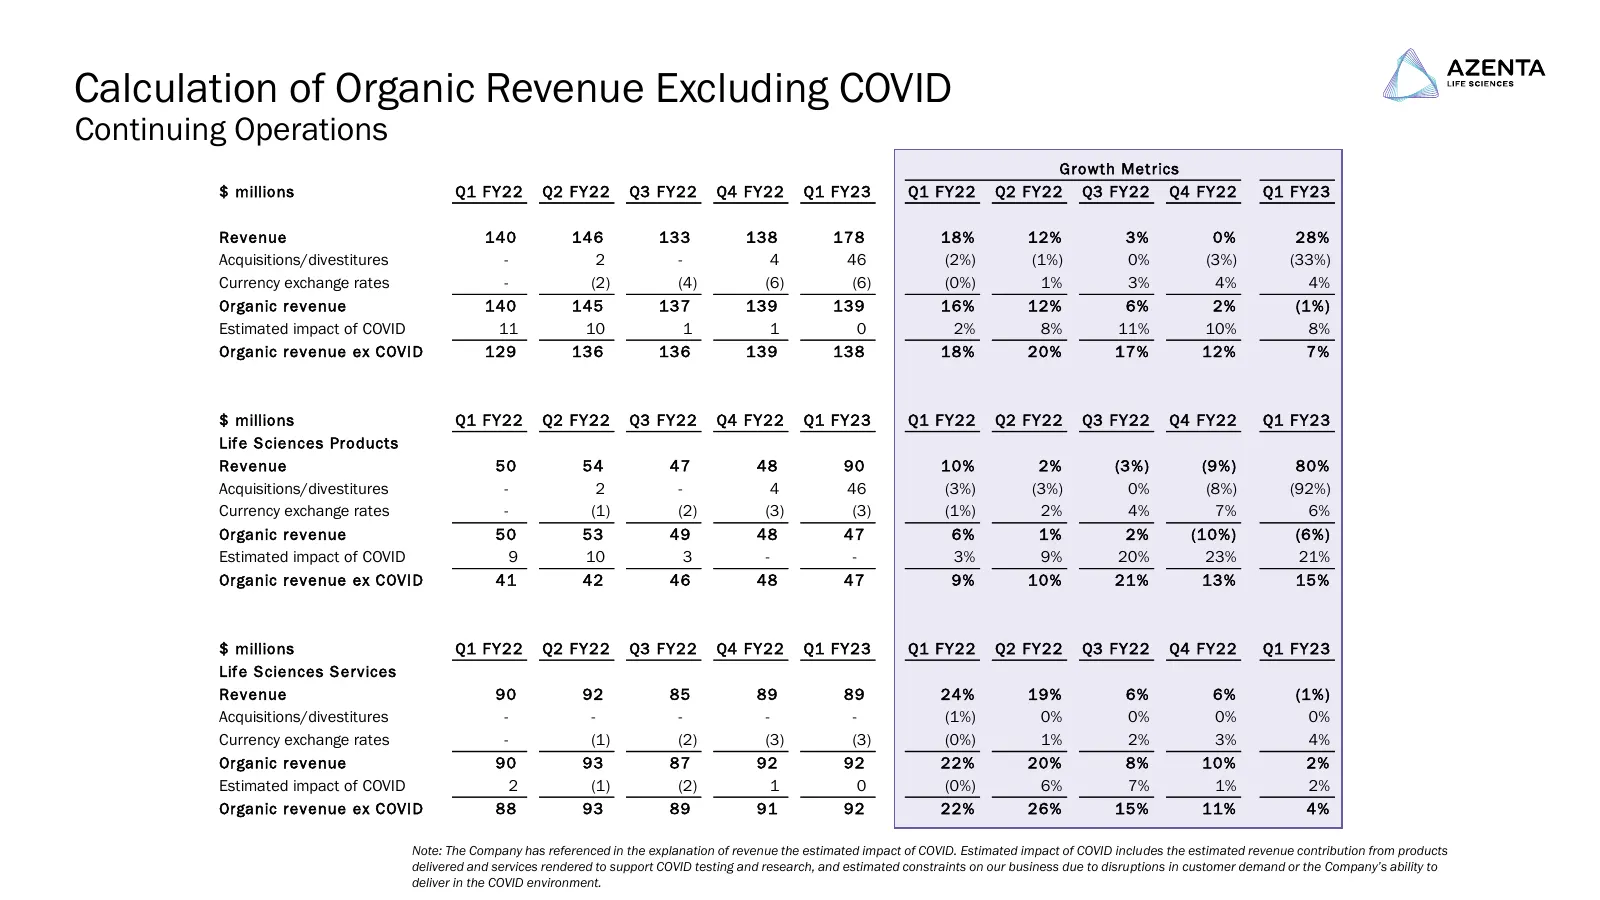
Slide 21: Calculation of Organic Revenue Excluding COVID
Calculation of Organic Revenue Excluding COVID Continuing Operations Growth Metrics $ millions Q1 FY22 Q2 FY22 Q3 FY22 Q4 FY22 Q1 FY23 Q1 FY22 Q2 FY22 Q3 FY22 Q4 FY22 Q1 FY23 Revenue 140 146 133 138 178 18% 12% 3% 0% 28% Acquisitions/divestitures - 2 - 4 46 (2%) (1%) 0% (3%) (33%) Currency exchange
Source: company website
More decks from Azenta, Inc.
 Q4 2026 Earnings Presentation14 slides · Nov 11, 2026
 Q4 2026 Earnings Presentation14 slides · Nov 11, 2026
 Q3 2026 Earnings Presentation13 slides · Aug 5, 2026
 Q2 2026 Earnings Presentation13 slides · May 6, 2026
 Q1 2026 Earnings Presentation13 slides · Feb 4, 2026
 Investor Day (December 2025)67 slides · Dec 10, 2025