MidWestOne Financial Group Inc
MidWestOne Financial — Investor Presentation (November 2021)
40 slides from MidWestOne Financial's investor presentation, Nov 2, 2021

Slide 1: Investor Presentation September 30, 2021
Investor Presentation September 30, 2021
Slide 2: Forward-Looking Statements & Non-GAAP Measures
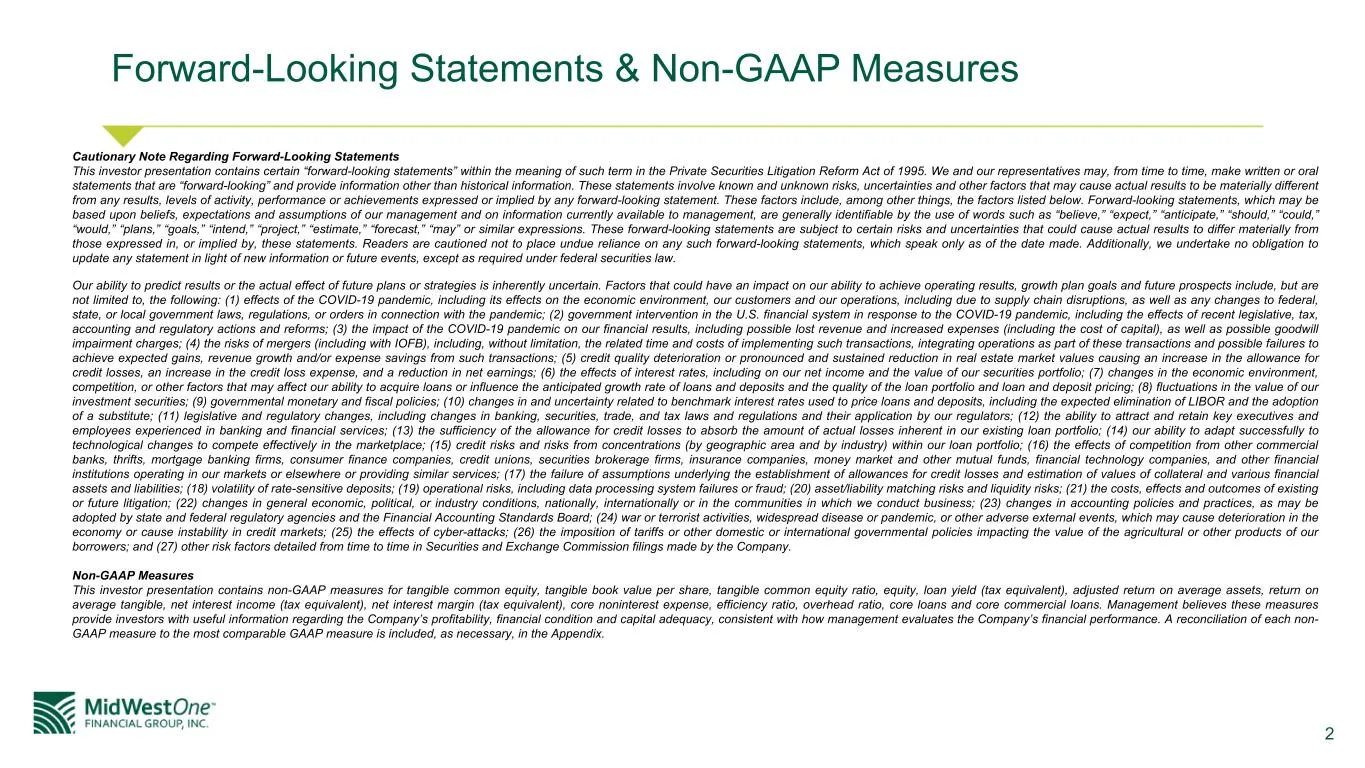
2 Forward-Looking Statements & Non-GAAP Measures Cautionary Note Regarding Forward-Looking Statements This investor presentation contains certain “forward-looking statements” within the meaning of such term in the Private Securities Litigation Reform Act of 1995. We and our representatives may, from
Slide 3: Presentation Index
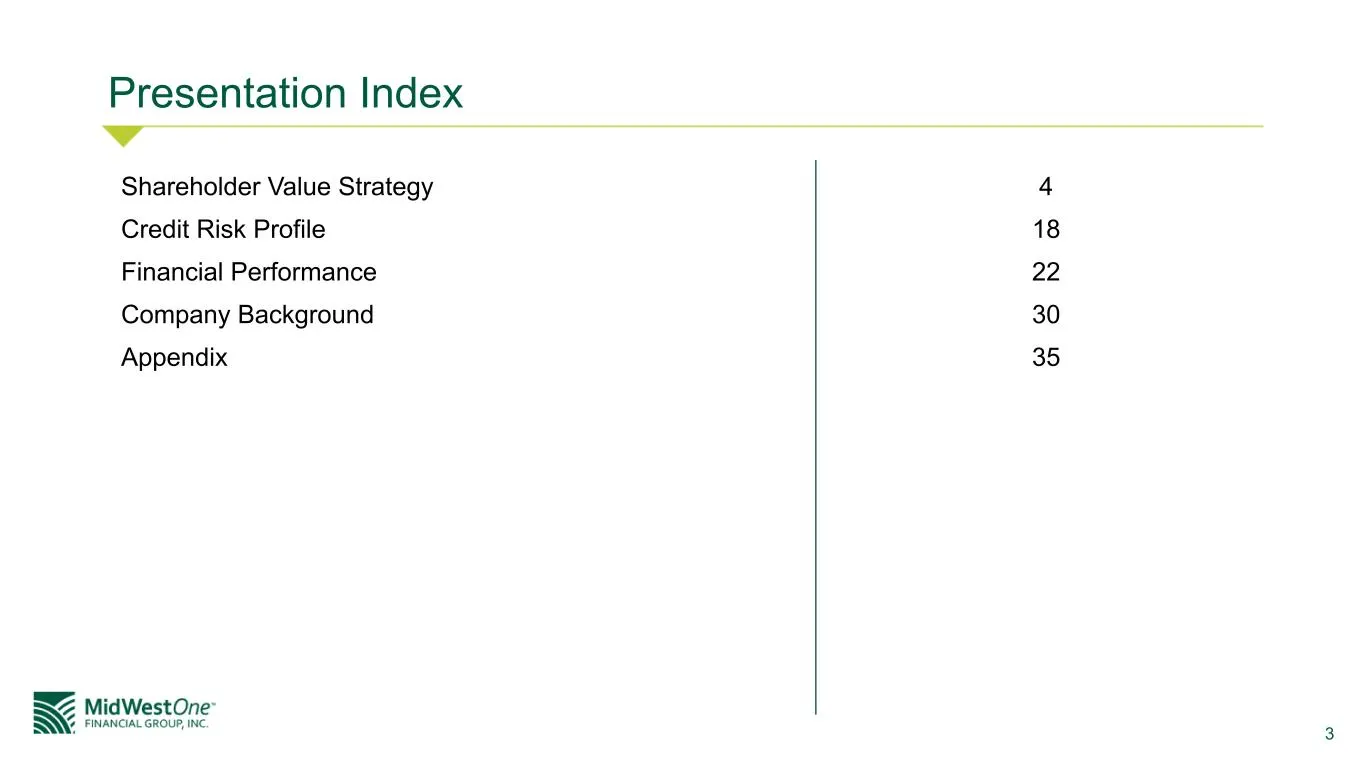
3 Shareholder Value Strategy 4 Credit Risk Profile 18 Financial Performance 22 Company Background 30 Appendix 35 Presentation Index
Slide 4: Shareholder Value Strategy
4 Shareholder Value Strategy
Slide 5: Company Overview
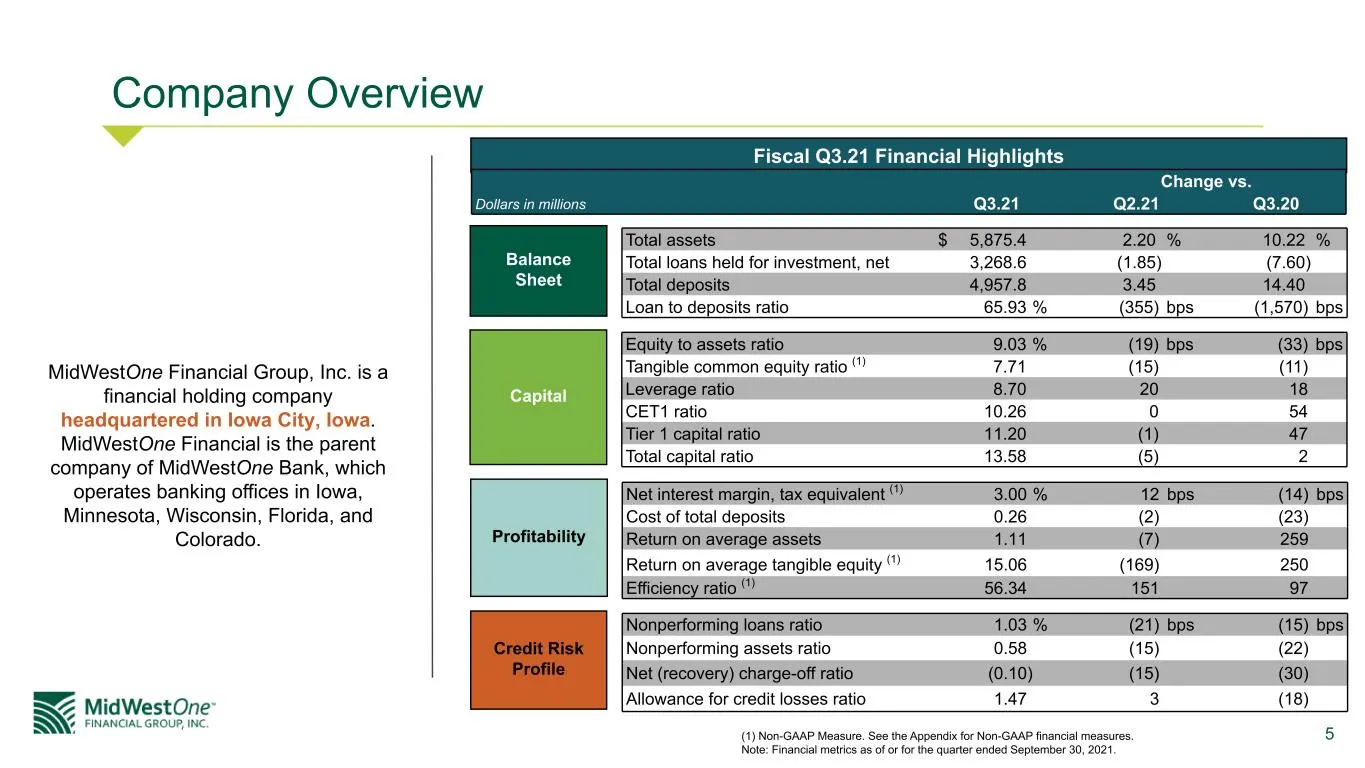
5 Company Overview MidWestOne Financial Group, Inc. is a financial holding company headquartered in Iowa City, Iowa. MidWestOne Financial is the parent company of MidWestOne Bank, which operates banking offices in Iowa, Minnesota, Wisconsin, Florida, and Colorado. Total assets $ 5,875.4 2.20 % 10.22
Slide 6: Shareholder Value Strategy
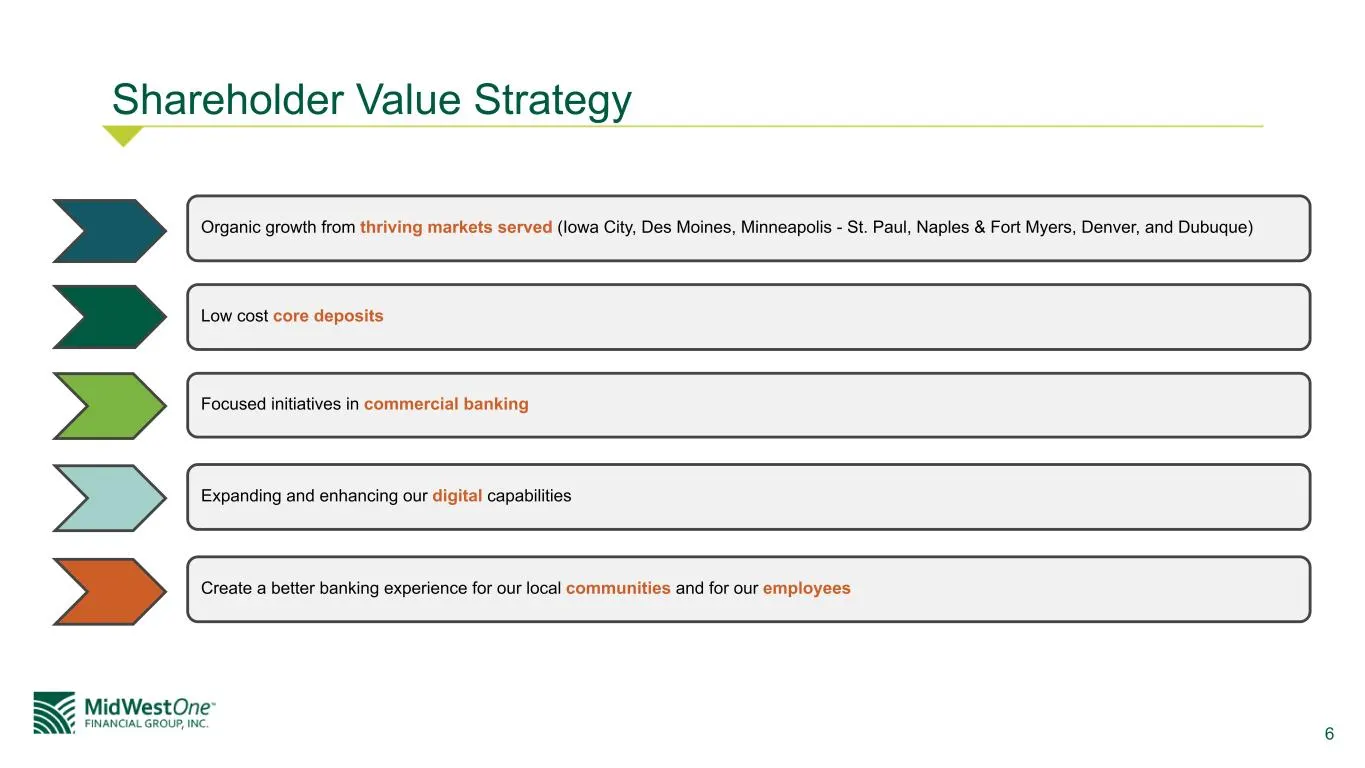
6 Shareholder Value Strategy Focused initiatives in commercial banking Create a better banking experience for our local communities and for our employees Expanding and enhancing our digital capabilities Low cost core deposits Organic growth from thriving markets served (Iowa City, Des Moines, Minnea
Slide 7: Shareholder Returns
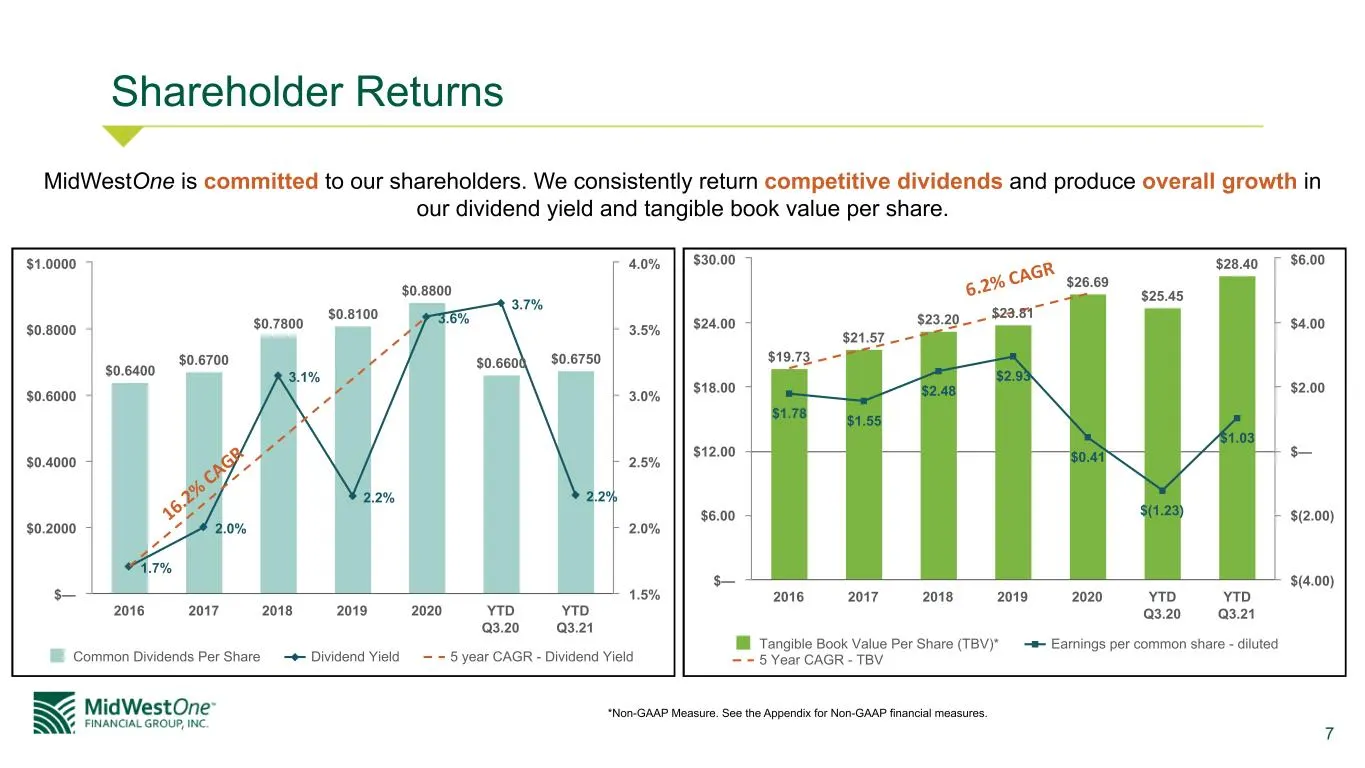
7 Shareholder Returns $0.6400 $0.6700 $0.7800 $0.8100 $0.8800 $0.6600 $0.6750 1.7% 2.0% 3.1% 2.2% 3.6% 3.7% 2.2% Common Dividends Per Share Dividend Yield 5 year CAGR - Dividend Yield 2016 2017 2018 2019 2020 YTD Q3.20 YTD Q3.21 $— $0.2000 $0.4000 $0.6000 $0.8000 $1.0000 1.5% 2.0% 2.5% 3.0% 3.5% 4.0
Slide 8: Profitability Trends
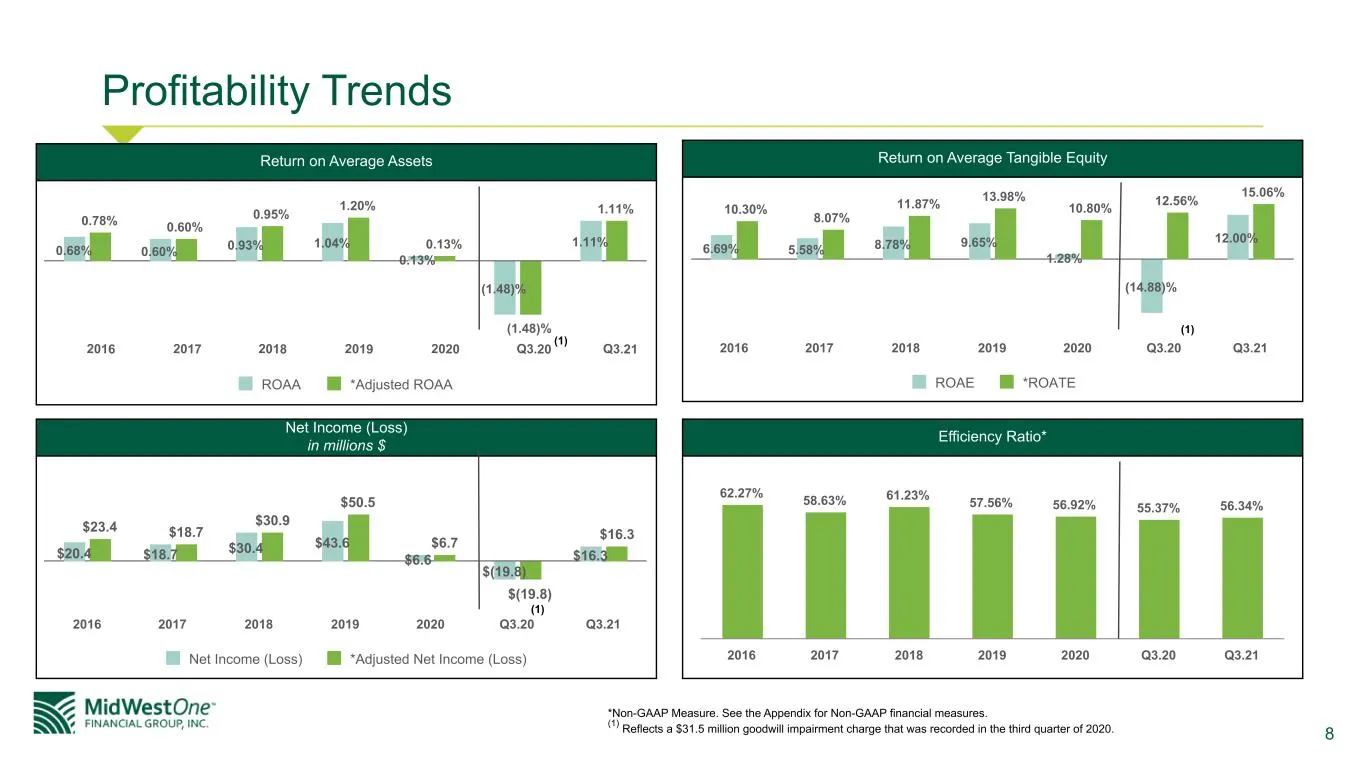
8 Profitability Trends *Non-GAAP Measure. See the Appendix for Non-GAAP financial measures. (1) Reflects a $31.5 million goodwill impairment charge that was recorded in the third quarter of 2020. 0.68% 0.60% 0.93% 1.04% 0.13% (1.48)% 1.11% 0.78% 0.60% 0.95% 1.20% 0.13% (1.48)% 1.11% ROAA *Adjusted R
Slide 9: Compelling Markets
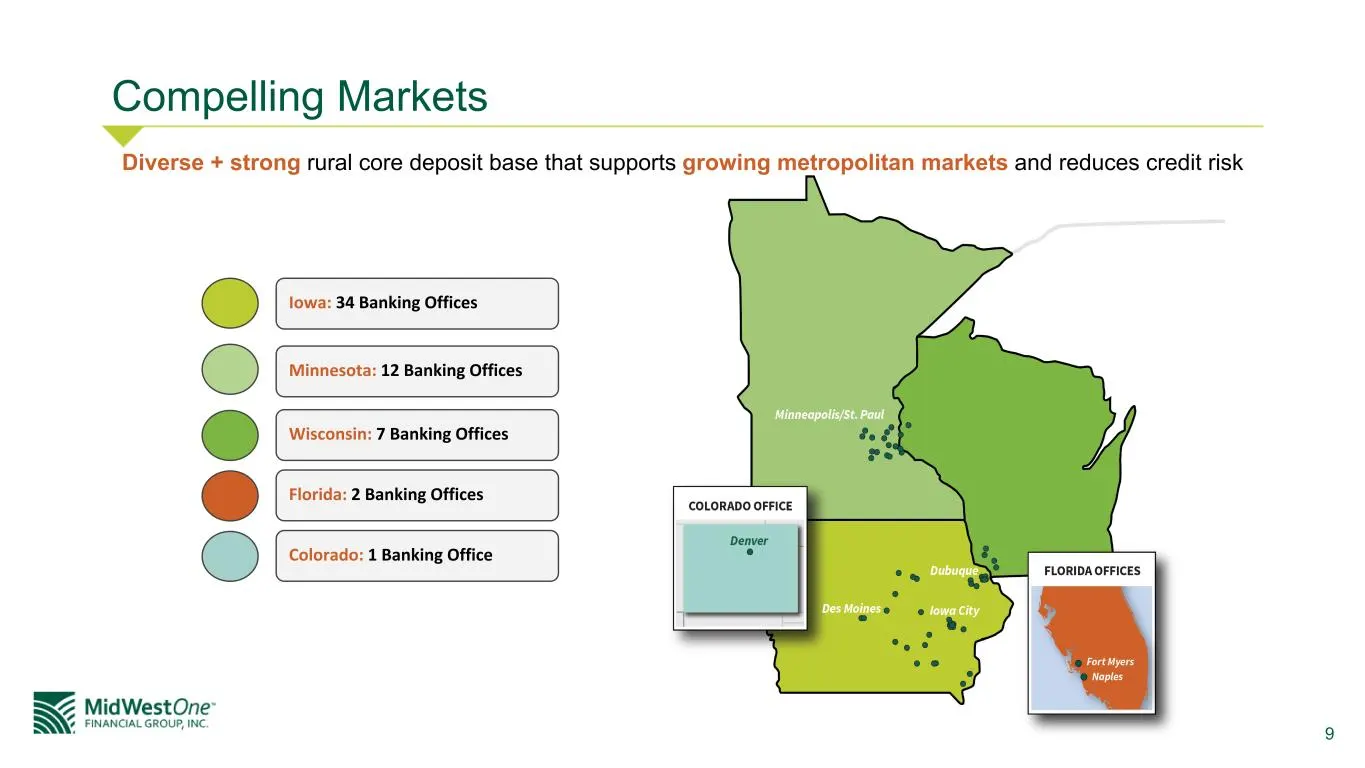
9 Compelling Markets Iowa: 34 Banking Offices Minnesota: 12 Banking Offices Wisconsin: 7 Banking Offices Florida: 2 Banking Offices Colorado: 1 Banking Office Diverse + strong rural core deposit base that supports growing metropolitan markets and reduces credit risk
Slide 10: Rural Core Deposit Base & Growing Metropolitan Markets
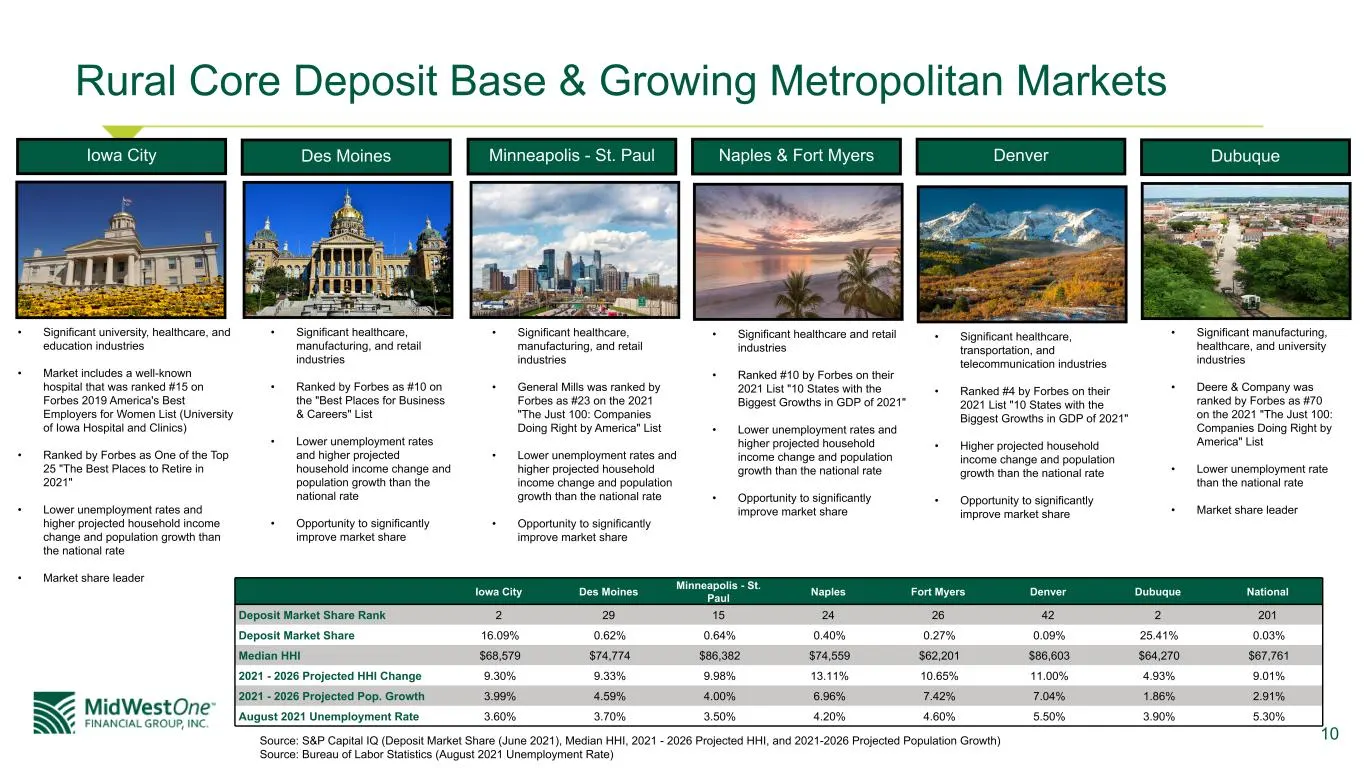
10 Rural Core Deposit Base & Growing Metropolitan Markets Iowa City Des Moines Minneapolis - St. Paul Naples Fort Myers Denver Dubuque National Deposit Market Share Rank 2 29 15 24 26 42 2 201 Deposit Market Share 16.09% 0.62% 0.64% 0.40% 0.27% 0.09% 25.41% 0.03% Median HHI $68,579 $74,774 $86,382 $
Slide 11: Deposit Profile
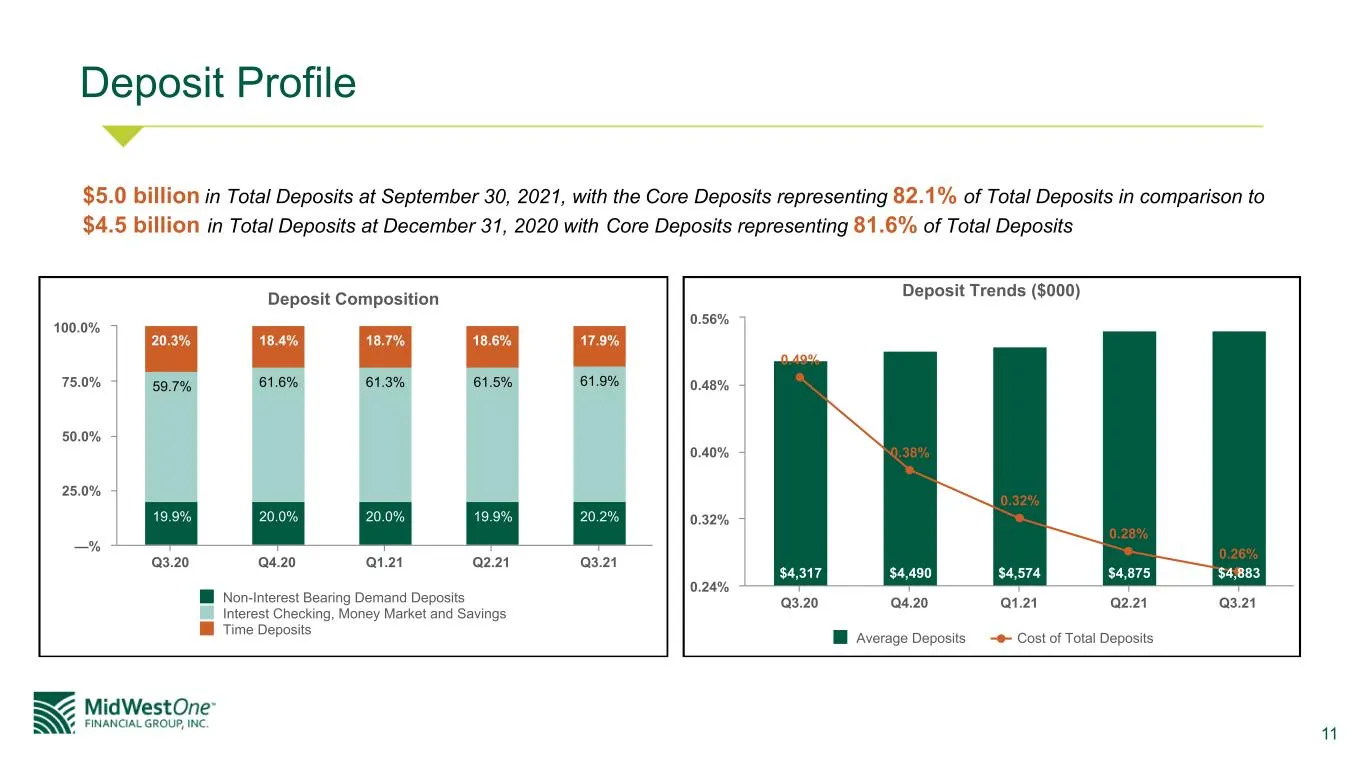
11 Deposit Profile $5.0 billion in Total Deposits at September 30, 2021, with the Core Deposits representing 82.1% of Total Deposits in comparison to $4.5 billion in Total Deposits at December 31, 2020 with Core Deposits representing 81.6% of Total Deposits Deposit Composition 19.9% 20.0% 20.0% 19.9
Slide 12: Focused Initiatives in Commercial Banking
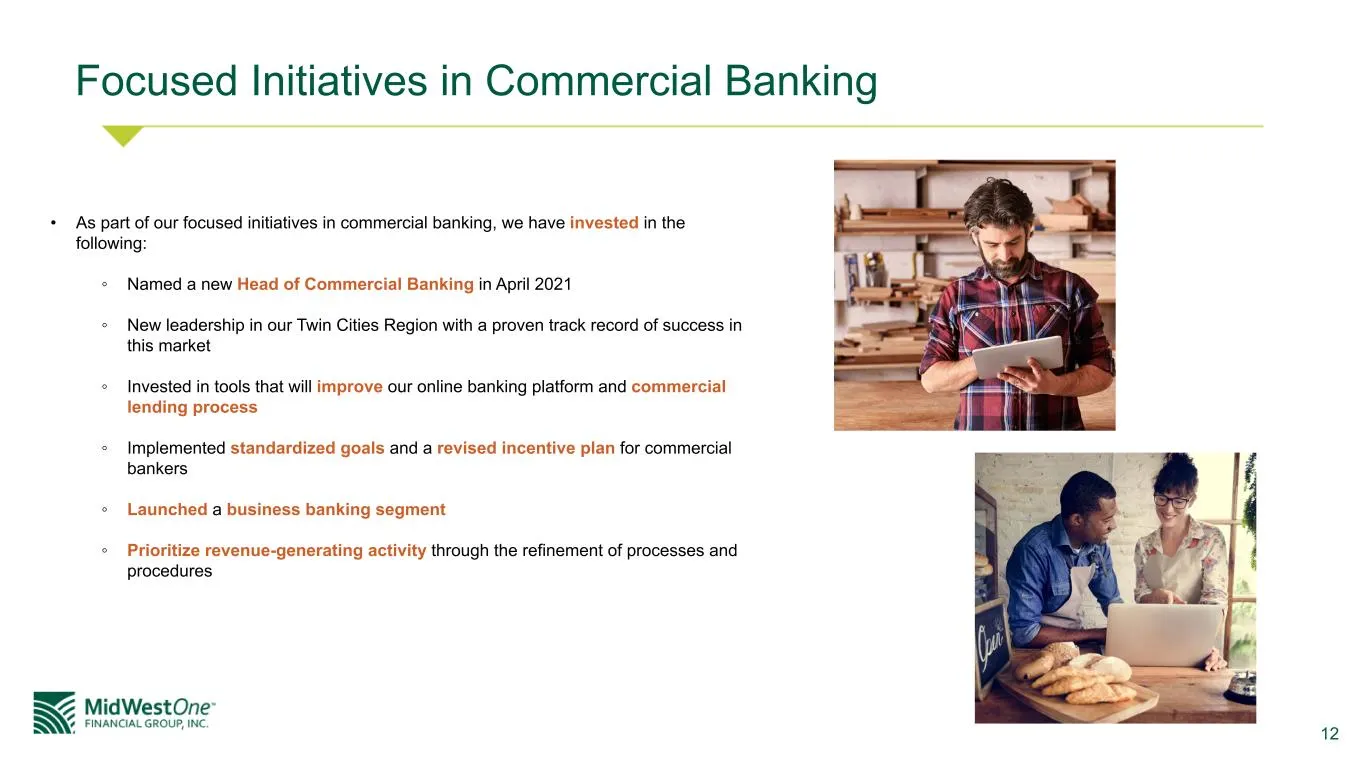
12 Focused Initiatives in Commercial Banking • As part of our focused initiatives in commercial banking, we have invested in the following: ◦ Named a new Head of Commercial Banking in April 2021 ◦ New leadership in our Twin Cities Region with a proven track record of success in this market ◦ Investe
Slide 13: Commercial Loan Portfolio
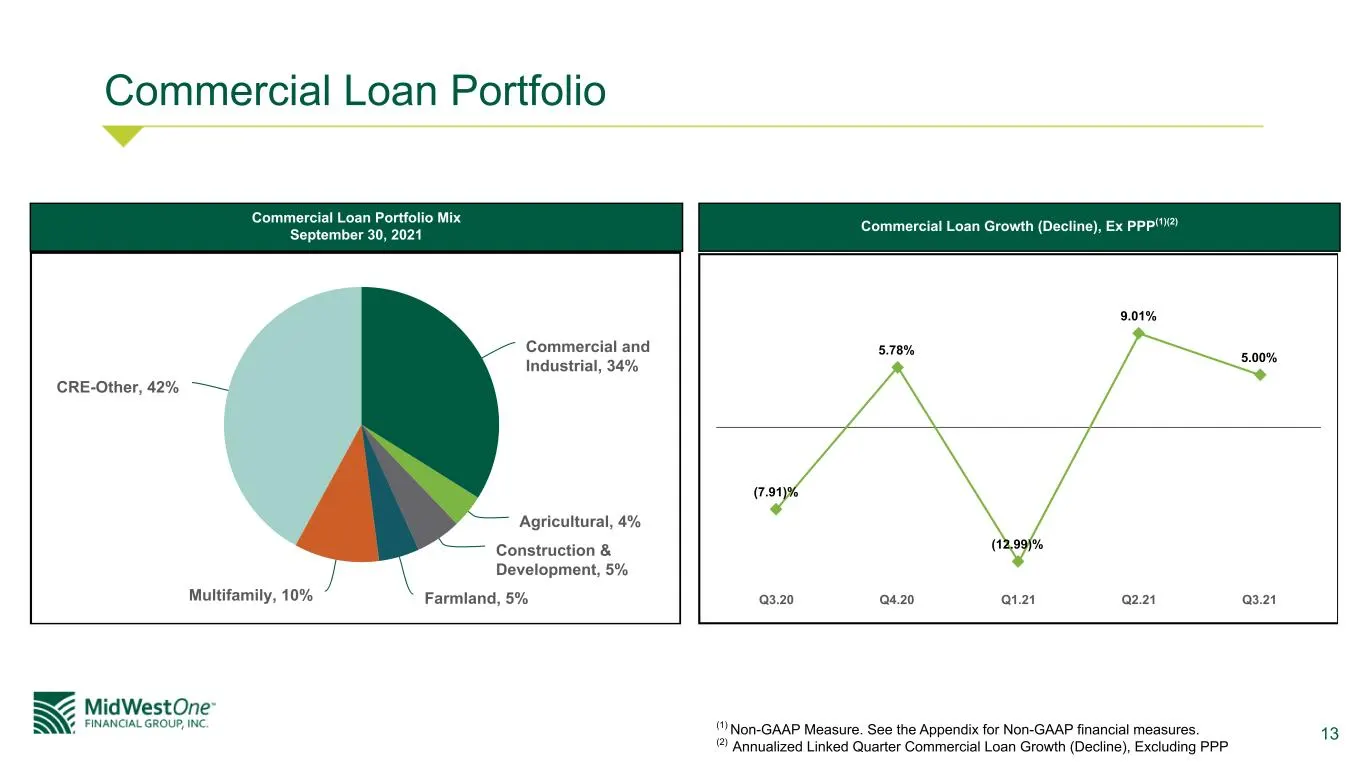
13 Commercial Loan Portfolio Commercial and Industrial, 34% Agricultural, 4% Construction & Development, 5% Farmland, 5%Multifamily, 10% CRE-Other, 42% (1) Non-GAAP Measure. See the Appendix for Non-GAAP financial measures. (2) Annualized Linked Quarter Commercial Loan Growth (Decline), Excluding PP
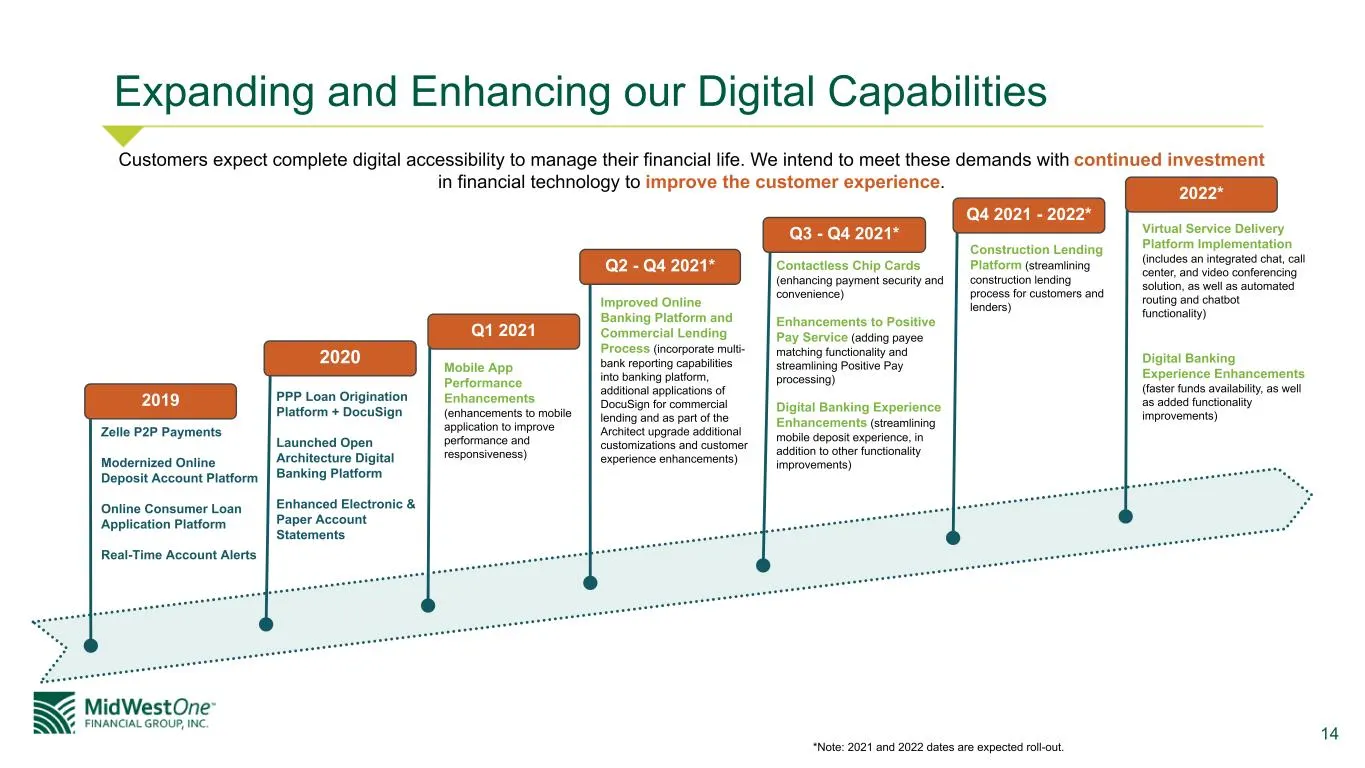
Slide 14: Expanding and Enhancing our Digital Capabilities
14 Expanding and Enhancing our Digital Capabilities Customers expect complete digital accessibility to manage their financial life. We intend to meet these demands with continued investment in financial technology to improve the customer experience. *Note: 2021 and 2022 dates are expected roll-out.
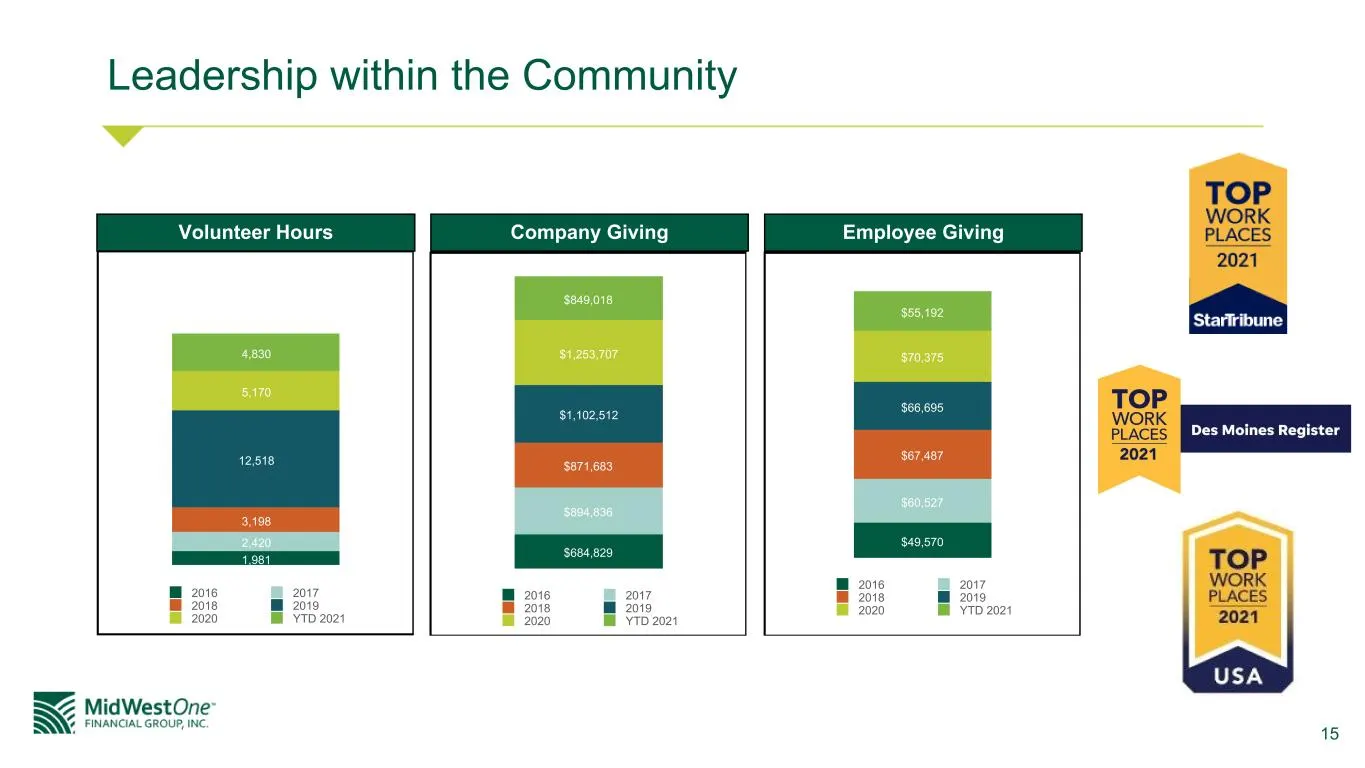
Slide 15: Leadership within the Community
15 Leadership within the Community 2019 "Rock the Chalk" Festival 1,981 2,420 3,198 12,518 5,170 4,830 2016 2017 2018 2019 2020 YTD 2021 $684,829 $894,836 $871,683 $1,102,512 $1,253,707 $849,018 2016 2017 2018 2019 2020 YTD 2021 $49,570 $60,527 $67,487 $66,695 $70,375 $55,192 2016 2017 2018 2019 202
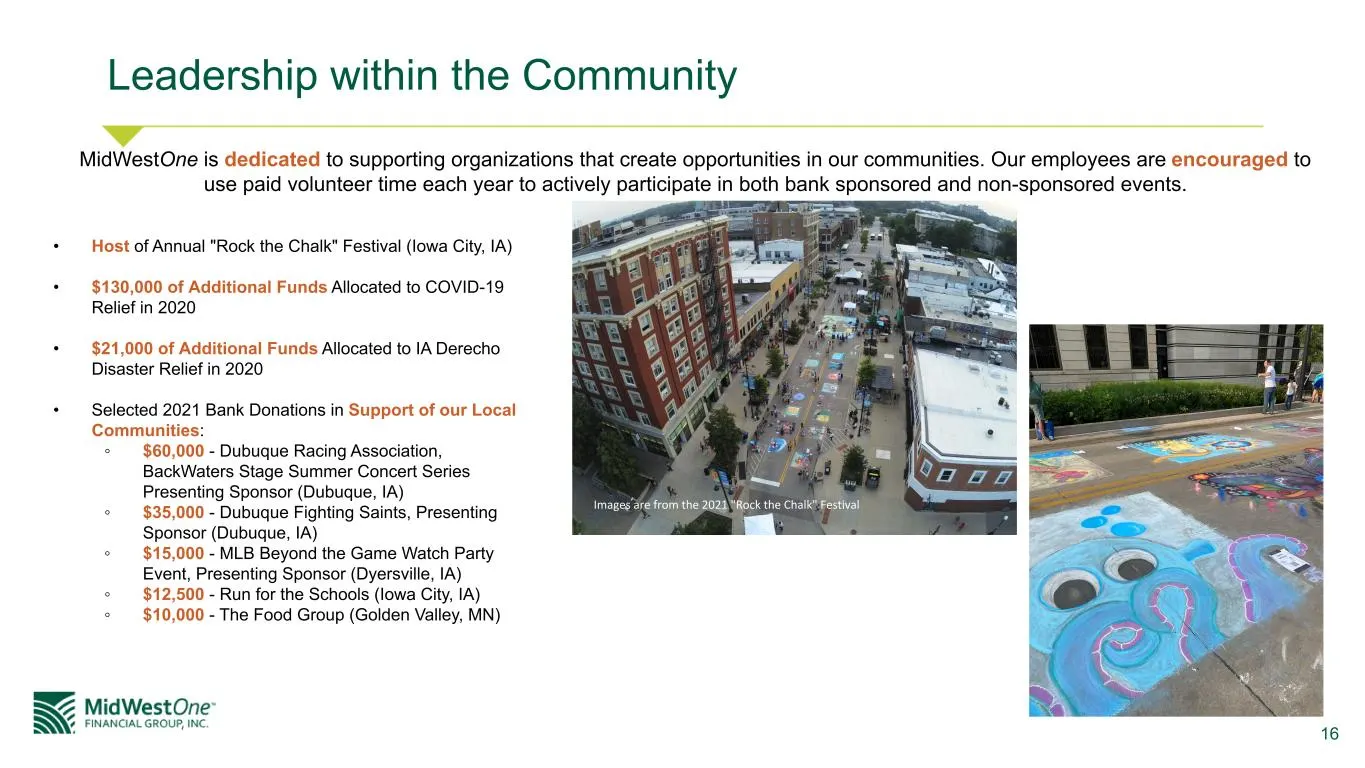
Slide 16: Leadership within the Community
16 Leadership within the Community MidWestOne is dedicated to supporting organizations that create opportunities in our communities. Our employees are encouraged to use paid volunteer time each year to actively participate in both bank sponsored and non-sponsored events. • Host of Annual "Rock the C
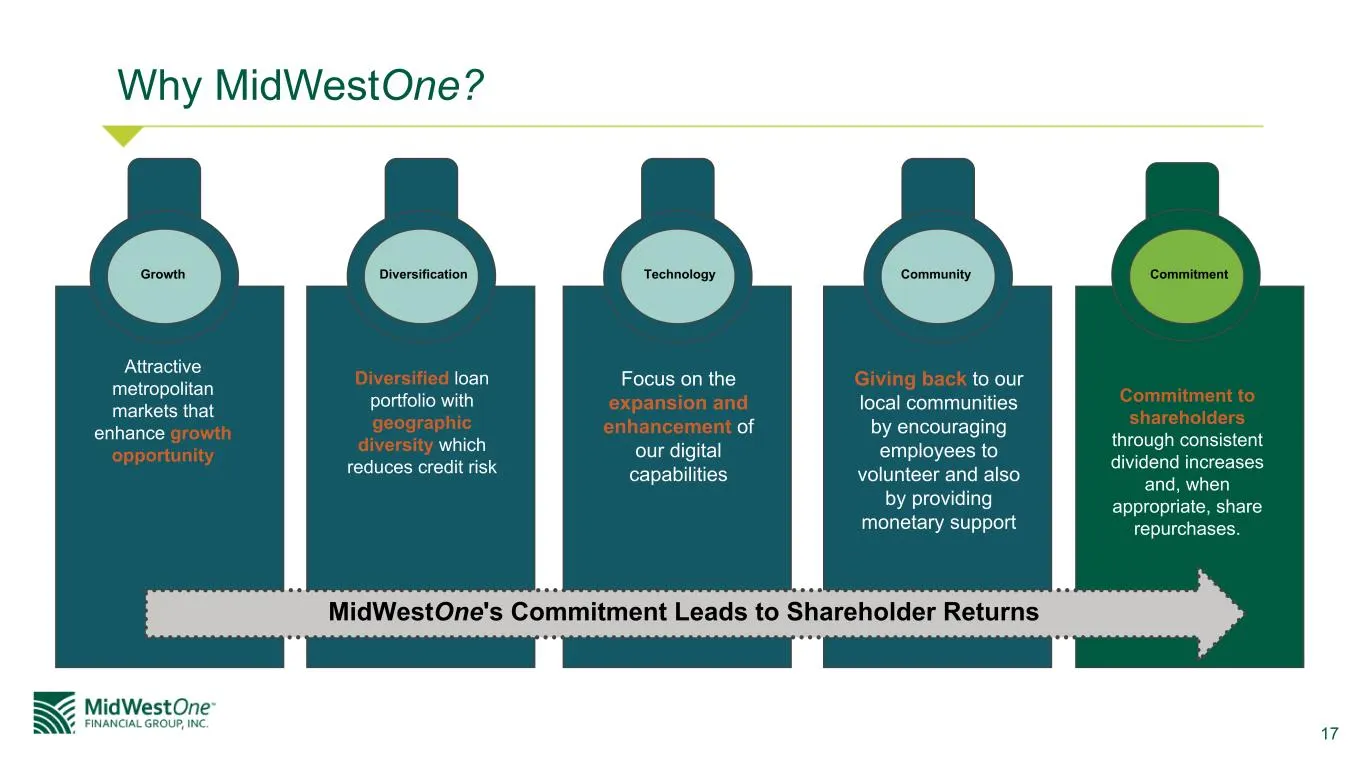
Slide 17: Why MidWestOne?
17 Why MidWestOne? Commitment to shareholders through consistent dividend increases and, when appropriate, share repurchases. Attractive metropolitan markets that enhance growth opportunity Diversified loan portfolio with geographic diversity which reduces credit risk Focus on the expansion and enha
Slide 18: Credit Risk Profile
FINANCIAL GROUP, INC. 18
Slide 19: Asset Quality
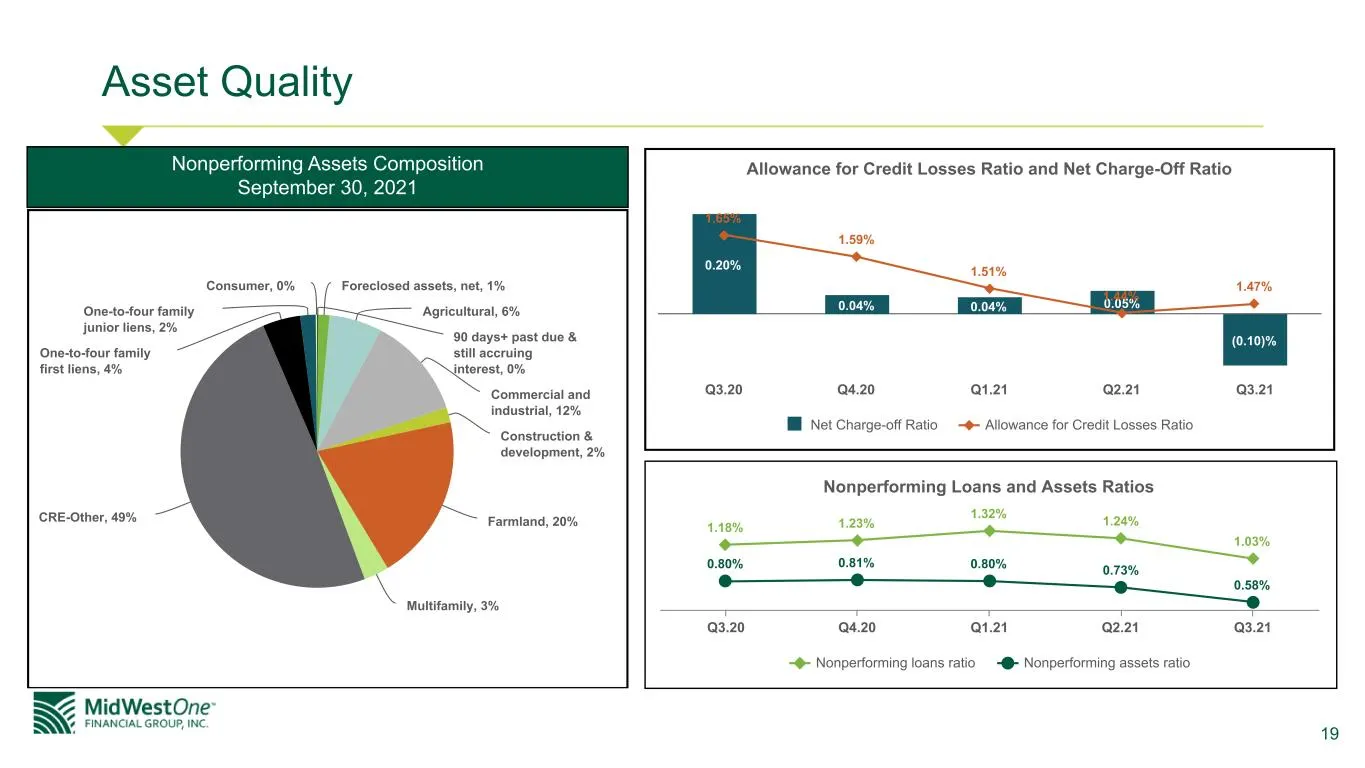
19 Asset Quality Allowance for Credit Losses Ratio and Net Charge-Off Ratio 0.20% 0.04% 0.04% 0.05% (0.10)% 1.65% 1.59% 1.51% 1.44% 1.47% Net Charge-off Ratio Allowance for Credit Losses Ratio Q3.20 Q4.20 Q1.21 Q2.21 Q3.21 Nonperforming Loans and Assets Ratios 1.18% 1.23% 1.32% 1.24% 1.03% 0.80% 0.8
Slide 20: Change in ACL
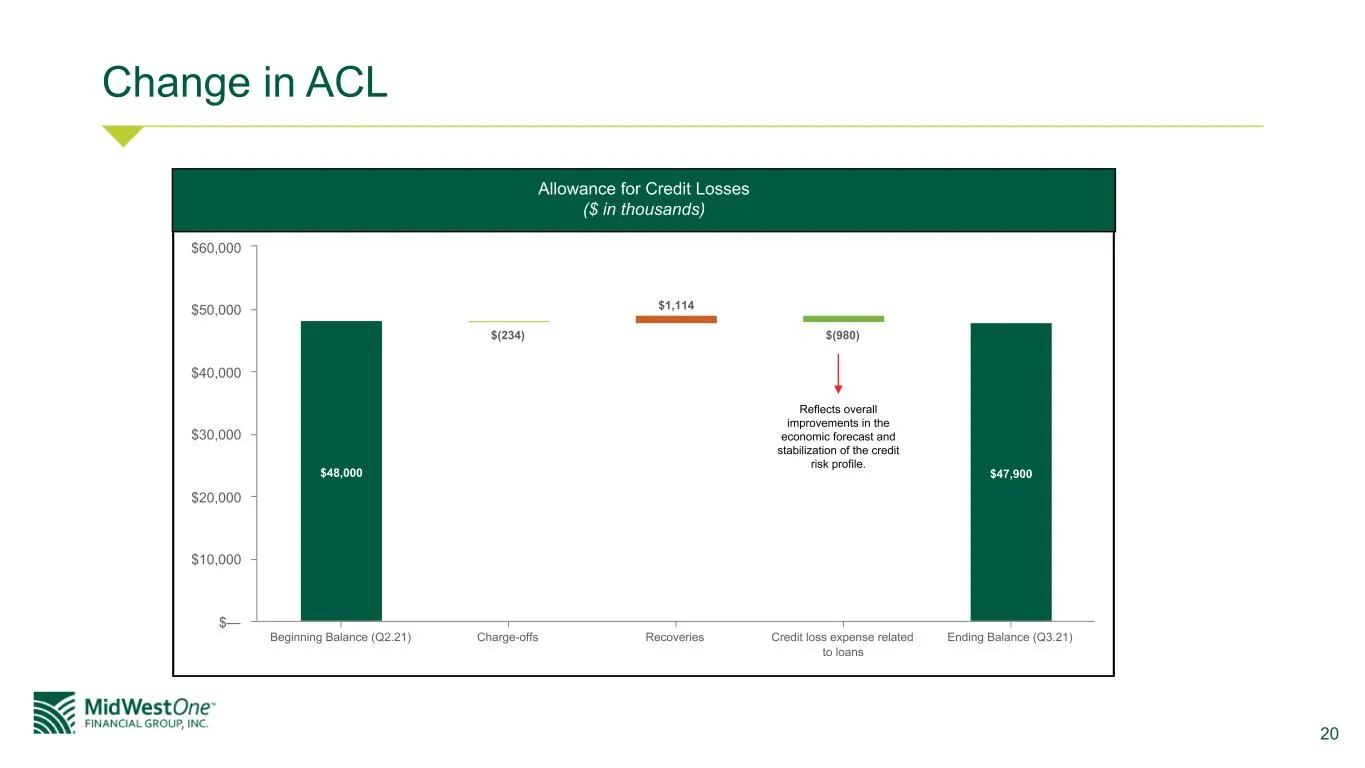
20 Change in ACL $48,000 $(234) $1,114 $(980) $47,900 Beginning Balance (Q2.21) Charge-offs Recoveries Credit loss expense related to loans Ending Balance (Q3.21) $— $10,000 $20,000 $30,000 $40,000 $50,000 $60,000 Allowance for Credit Losses ($ in thousands) Reflects overall improvements in the econ
Slide 21: COVID-19 Update
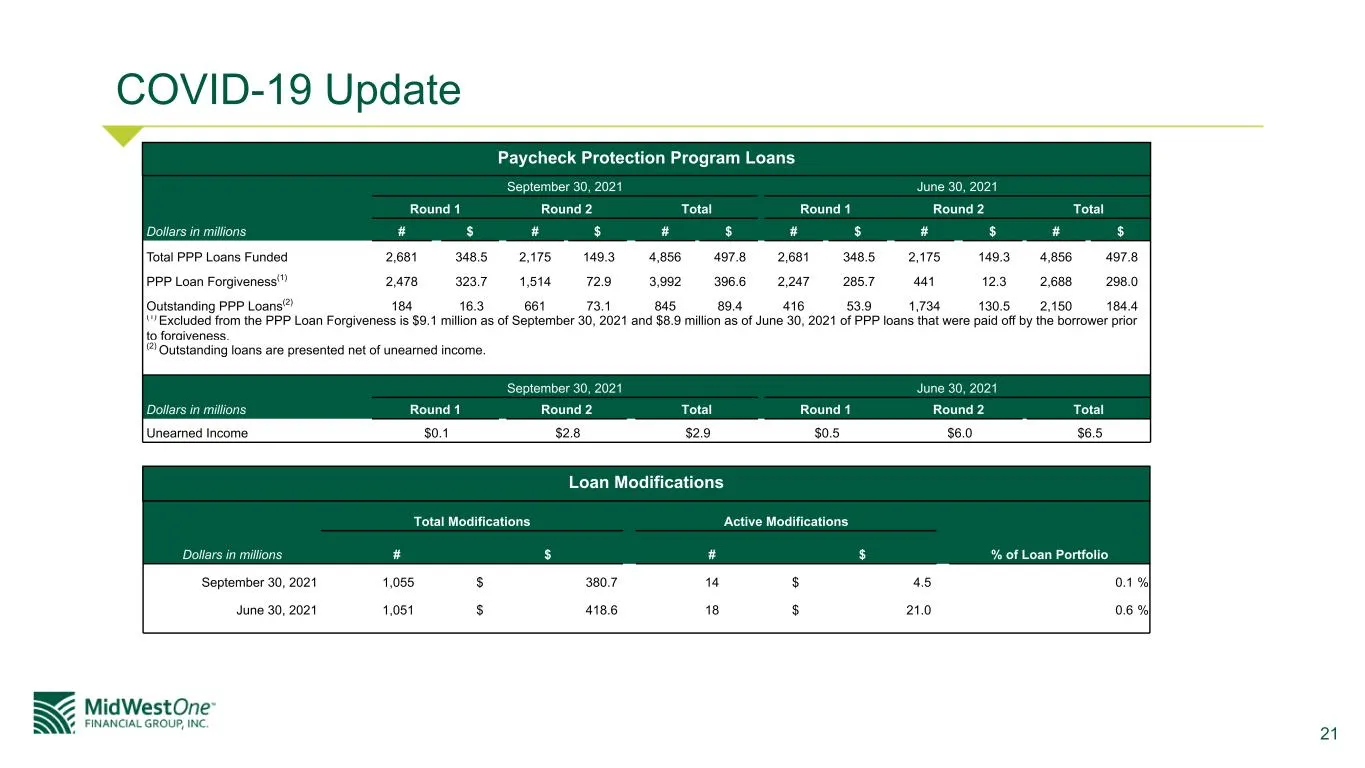
21 COVID-19 Update September 30, 2021 June 30, 2021 Round 1 Round 2 Total Round 1 Round 2 Total Dollars in millions # $ # $ # $ # $ # $ # $ Total PPP Loans Funded 2,681 348.5 2,175 149.3 4,856 497.8 2,681 348.5 2,175 149.3 4,856 497.8 PPP Loan Forgiveness(1) 2,478 323.7 1,514 72.9 3,992 396.6 2,247
Slide 22: Financial Performance
Financial Perfc Re MidWestOne- FINANCIAL GROUP, INC. 22
Slide 23: Third Quarter 2021 Summary
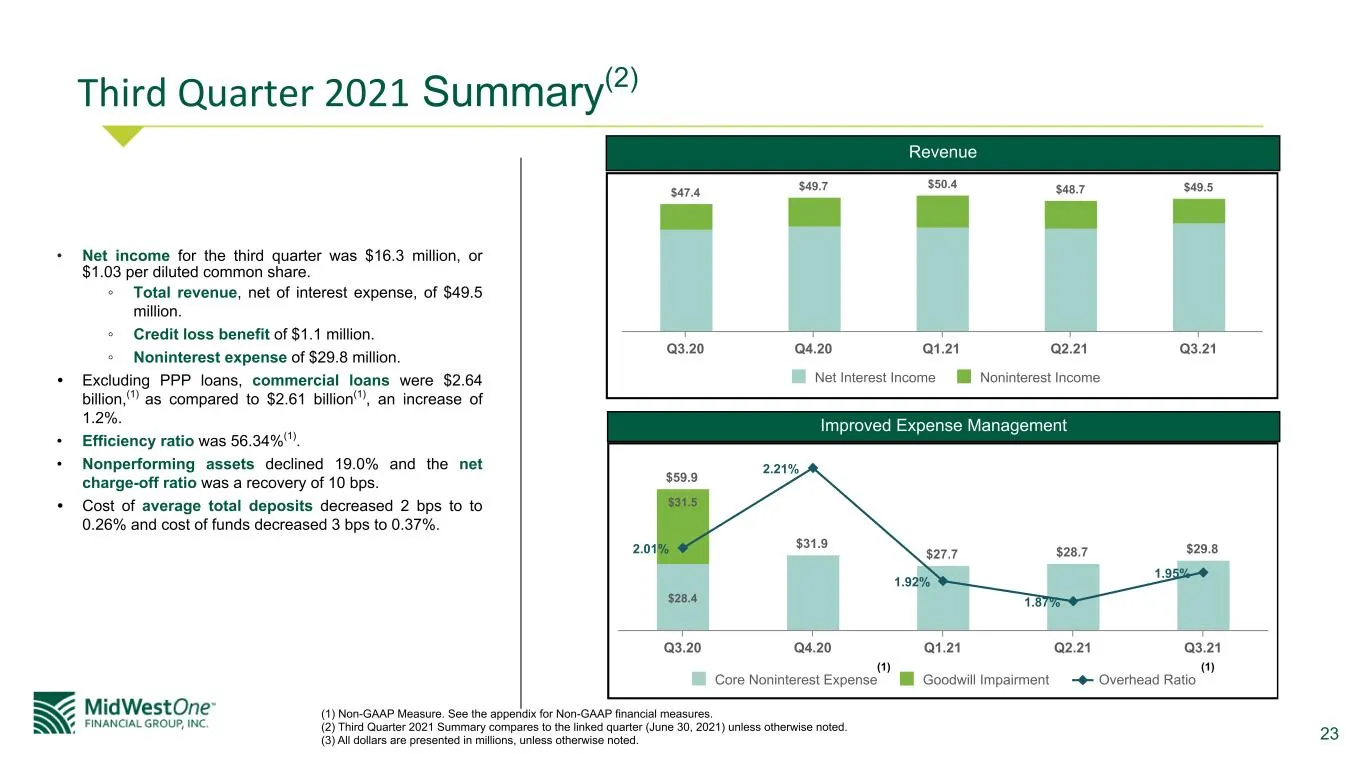
23 Third Quarter 2021 Summary(2) • Net income for the third quarter was $16.3 million, or $1.03 per diluted common share. ◦ Total revenue, net of interest expense, of $49.5 million. ◦ Credit loss benefit of $1.1 million. ◦ Noninterest expense of $29.8 million. • Excluding PPP loans, commercial loans
Slide 24: Net Interest Income
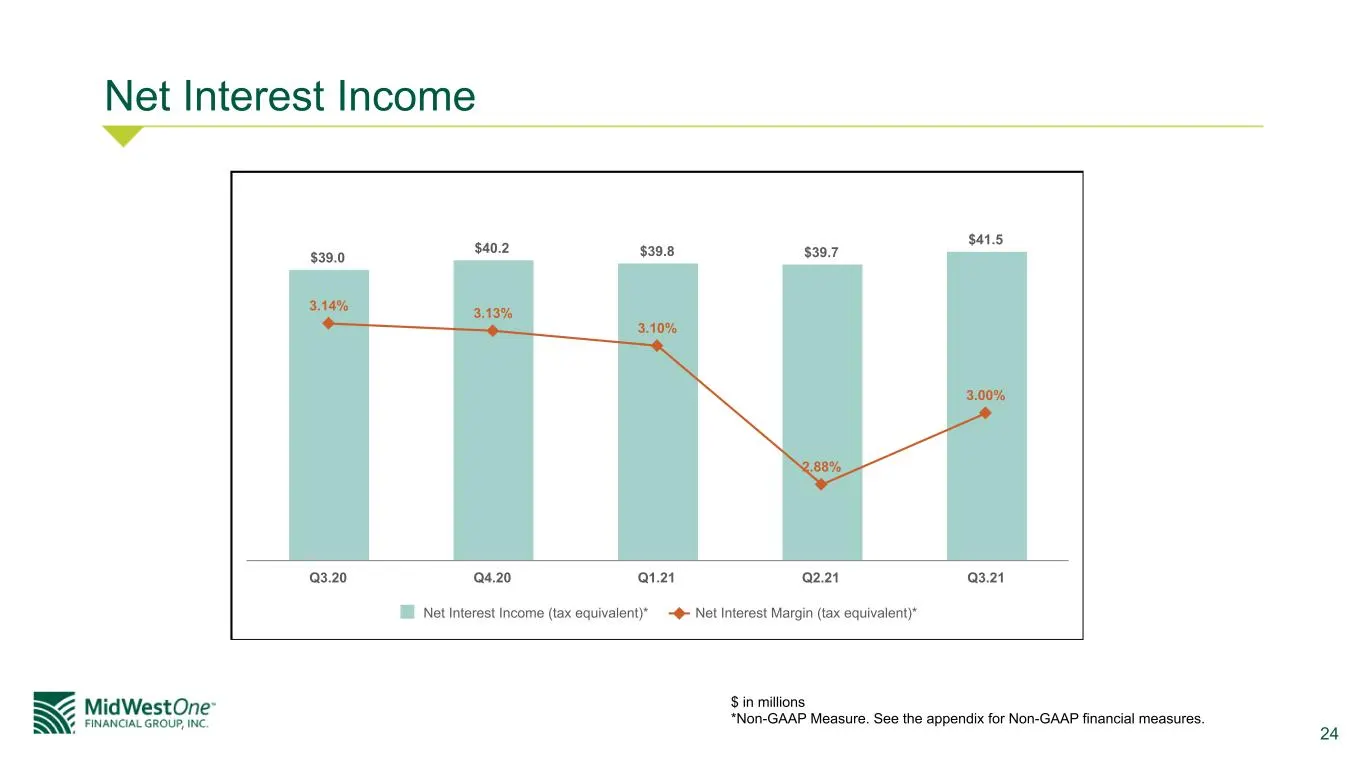
24 Net Interest Income $39.0 $40.2 $39.8 $39.7 $41.5 3.14% 3.13% 3.10% 2.88% 3.00% Net Interest Income (tax equivalent)* Net Interest Margin (tax equivalent)* Q3.20 Q4.20 Q1.21 Q2.21 Q3.21 $ in millions *Non-GAAP Measure. See the appendix for Non-GAAP financial measures.
Slide 25: Loan Portfolio
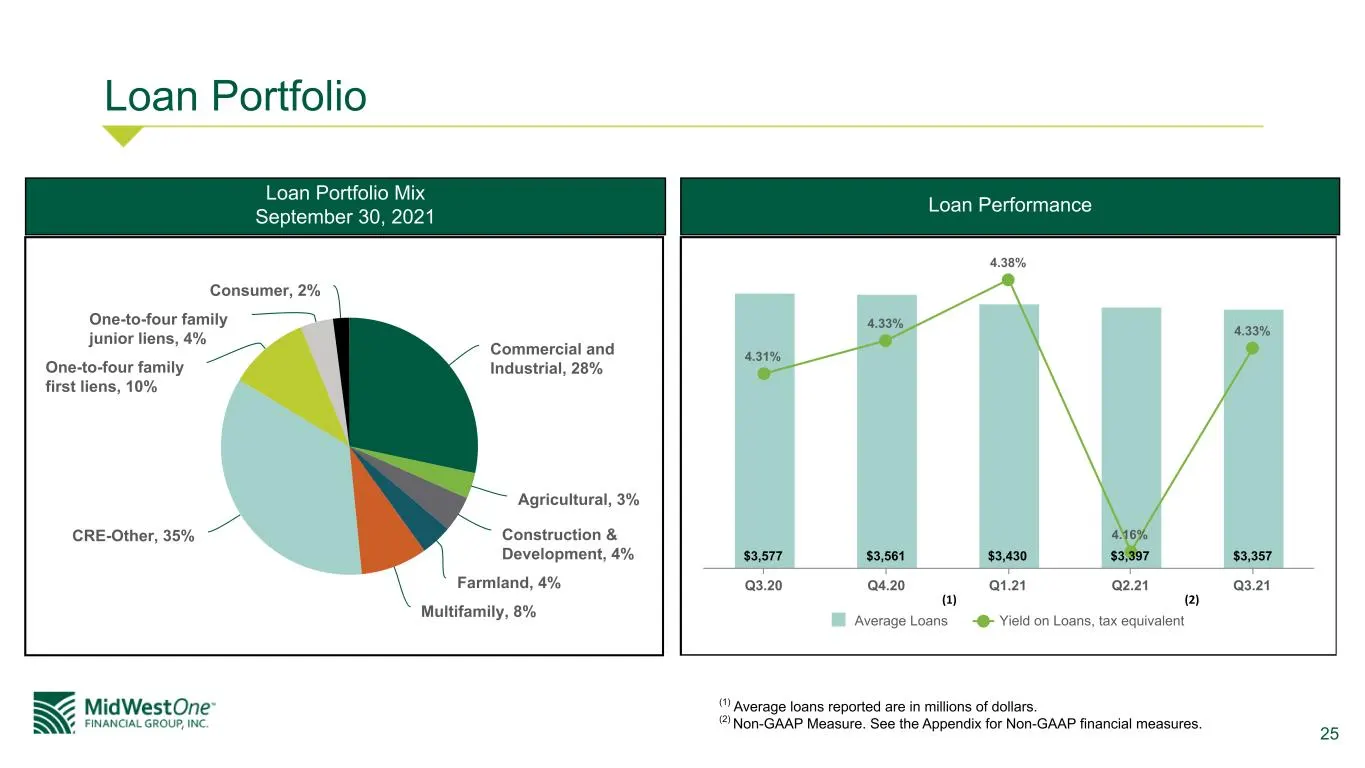
25 Loan Portfolio Commercial and Industrial, 28% Agricultural, 3% Construction & Development, 4% Farmland, 4% Multifamily, 8% CRE-Other, 35% One-to-four family first liens, 10% One-to-four family junior liens, 4% Consumer, 2% $3,577 $3,561 $3,430 $3,397 $3,357 4.31% 4.33% 4.38% 4.16% 4.33% Average L
Slide 26: Noninterest Income and Noninterest Expense
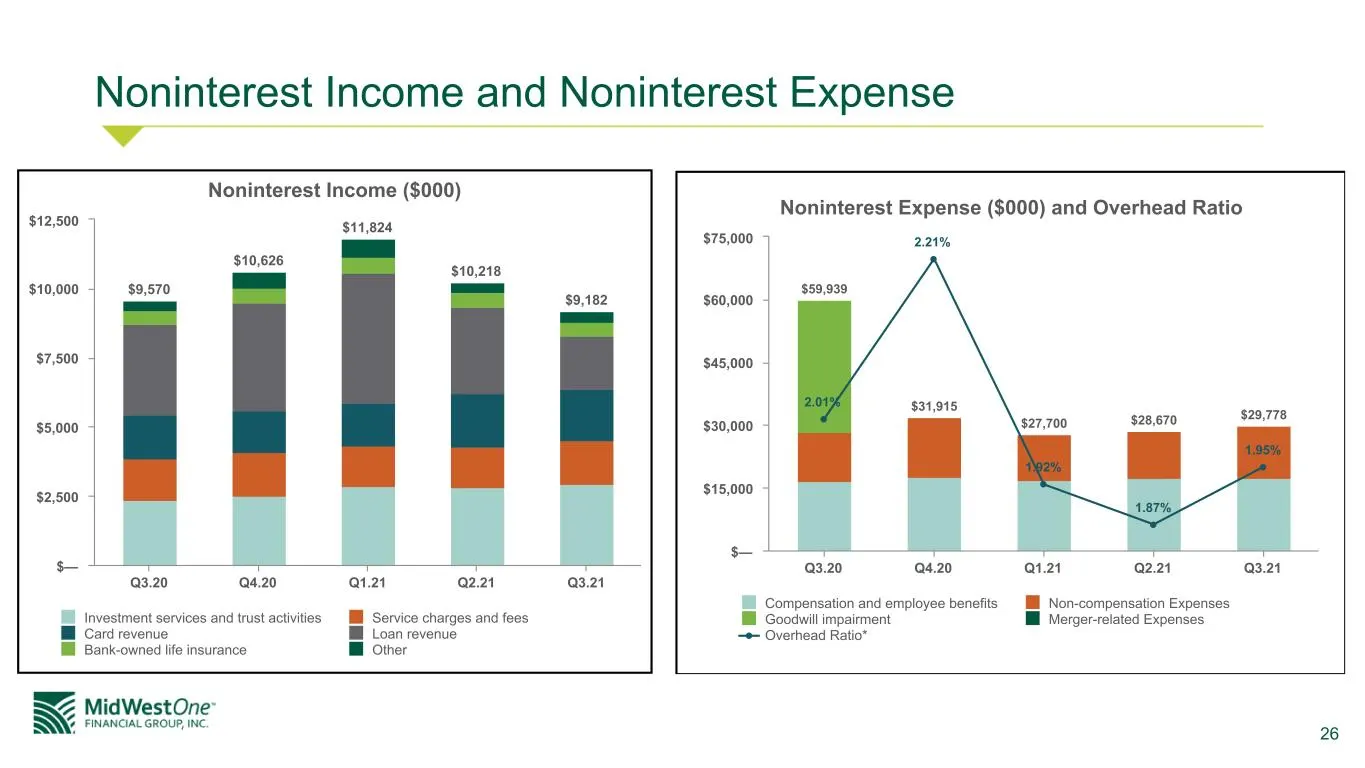
26 Noninterest Income and Noninterest Expense Noninterest Income ($000) $9,570 $10,626 $11,824 $10,218 $9,182 Investment services and trust activities Service charges and fees Card revenue Loan revenue Bank-owned life insurance Other Q3.20 Q4.20 Q1.21 Q2.21 Q3.21 $— $2,500 $5,000 $7,500 $10,000 $12,
Slide 27: Wealth Management
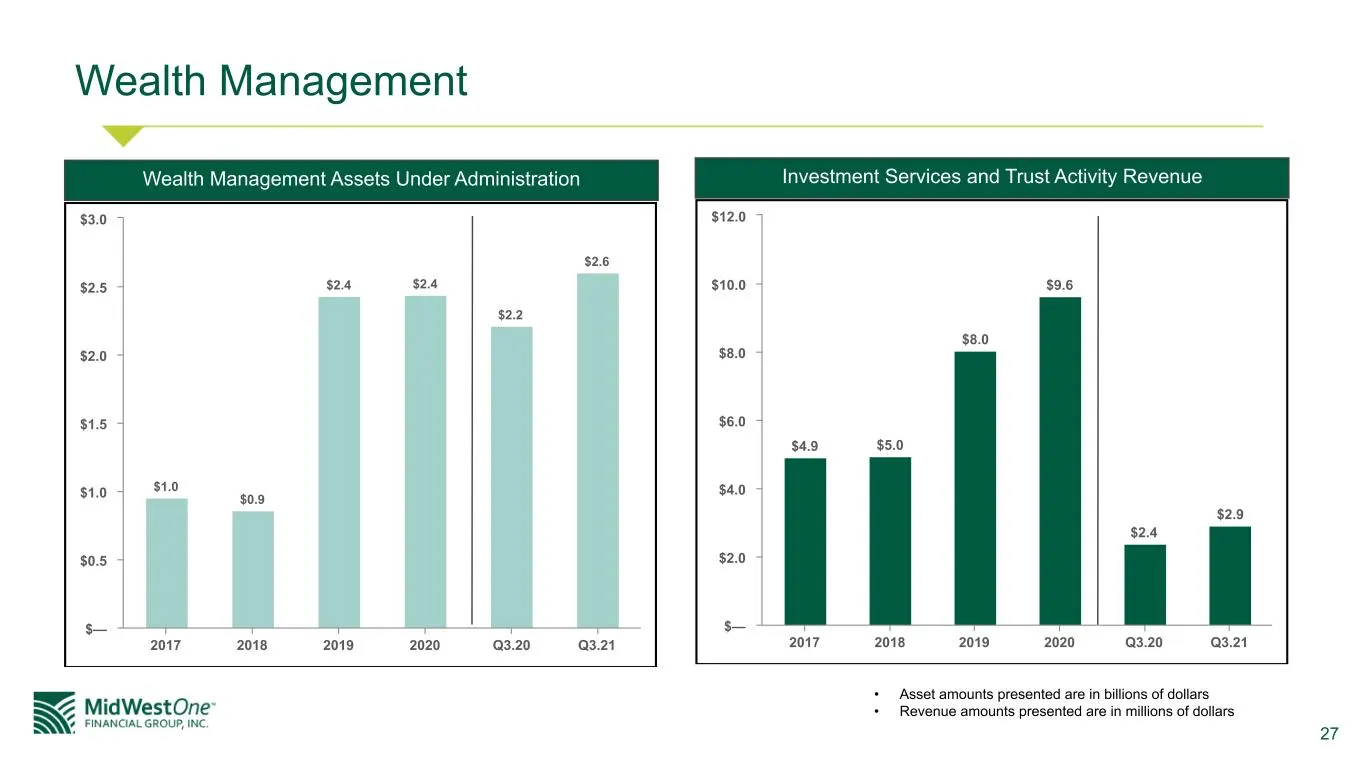
27 Wealth Management $1.0 $0.9 $2.4 $2.4 $2.2 $2.6 2017 2018 2019 2020 Q3.20 Q3.21 $— $0.5 $1.0 $1.5 $2.0 $2.5 $3.0 Investment Services and Trust Activity Revenue • Asset amounts presented are in billions of dollars • Revenue amounts presented are in millions of dollars $4.9 $5.0 $8.0 $9.6 $2.4 $2.9
Slide 28: Strong Liquidity Position
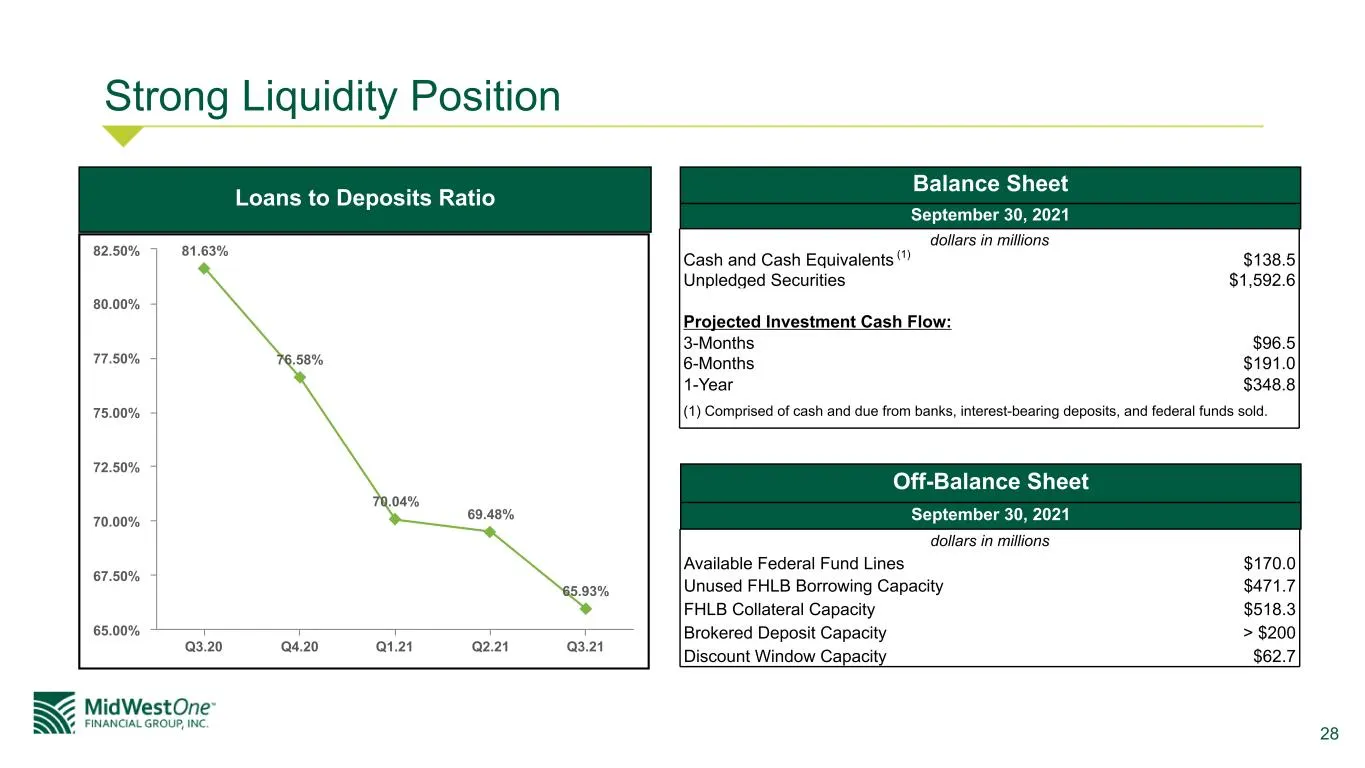
28 Strong Liquidity Position 81.63% 76.58% 70.04% 69.48% 65.93% Q3.20 Q4.20 Q1.21 Q2.21 Q3.21 65.00% 67.50% 70.00% 72.50% 75.00% 77.50% 80.00% 82.50% Loans to Deposits Ratio Balance Sheet dollars in millions Cash and Cash Equivalents (1) $138.5 Unpledged Securities $1,592.6 Projected Investment Cash
Slide 29: Capital Adequacy
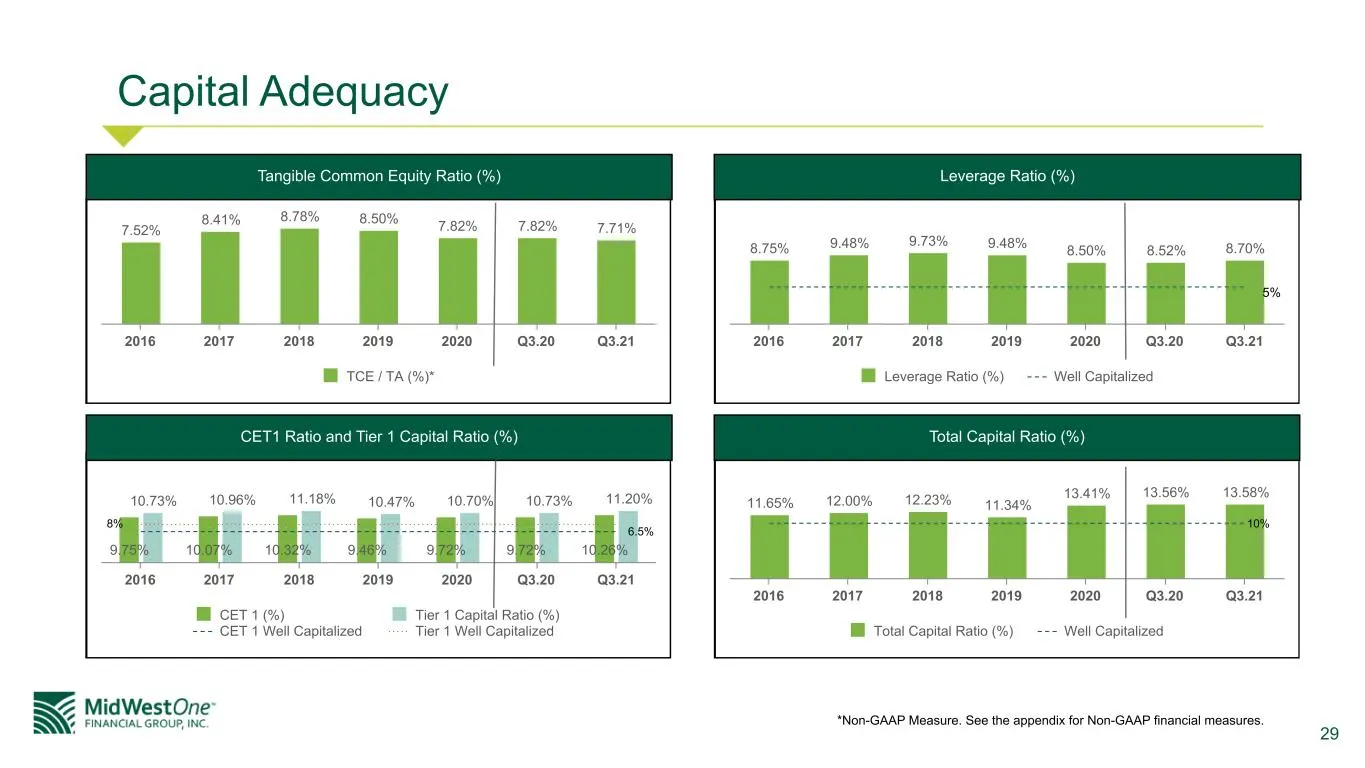
29 Capital Adequacy 7.52% 8.41% 8.78% 8.50% 7.82% 7.82% 7.71% TCE / TA (%)* 2016 2017 2018 2019 2020 Q3.20 Q3.21 8.75% 9.48% 9.73% 9.48% 8.50% 8.52% 8.70% Leverage Ratio (%) Well Capitalized 2016 2017 2018 2019 2020 Q3.20 Q3.21 11.65% 12.00% 12.23% 11.34% 13.41% 13.56% 13.58% Total Capital Ratio (%)
Slide 30: Company Background
und Company Backgr« MidWestOne- FINANCIAL GROUP, INC. 30
Slide 31: Corporate History
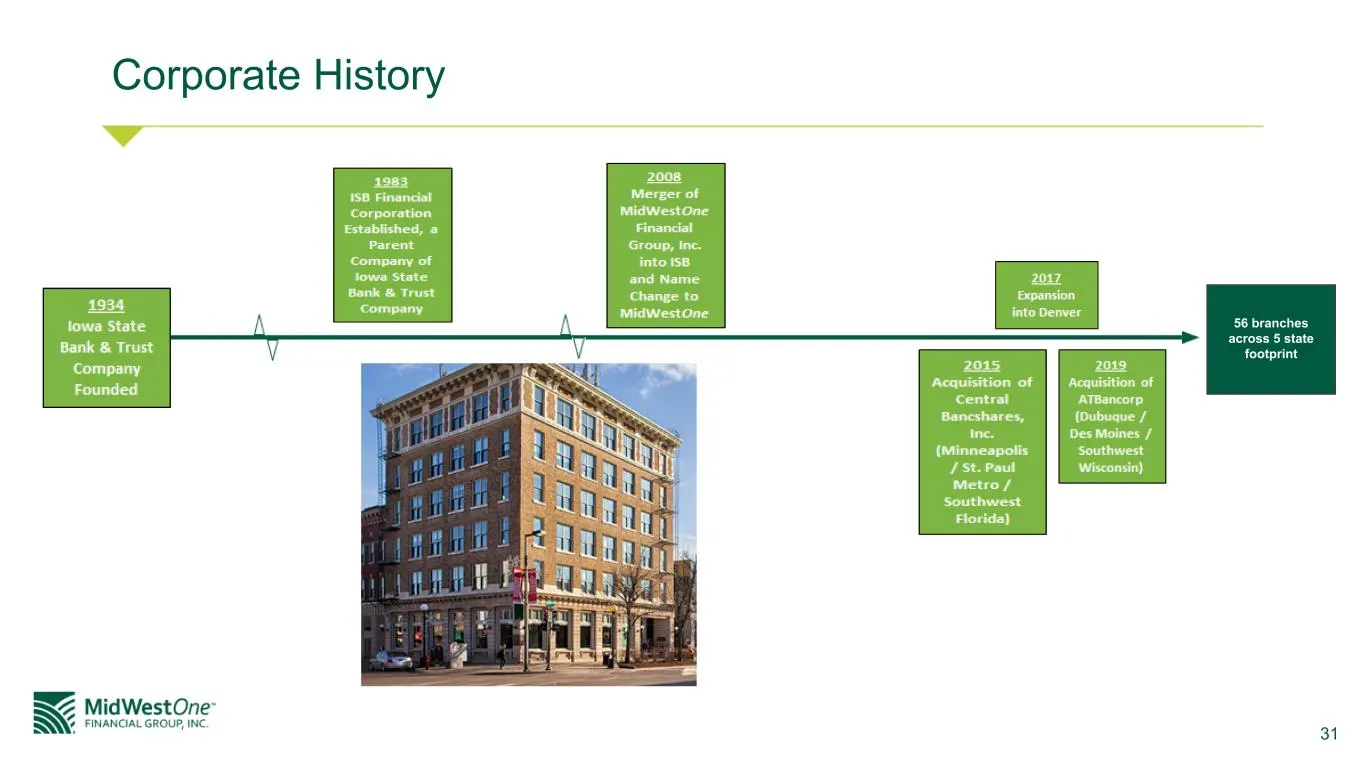
31 Corporate History 56 branches across 5 state footprint
Slide 32: Our Mission and Our Operating Principles
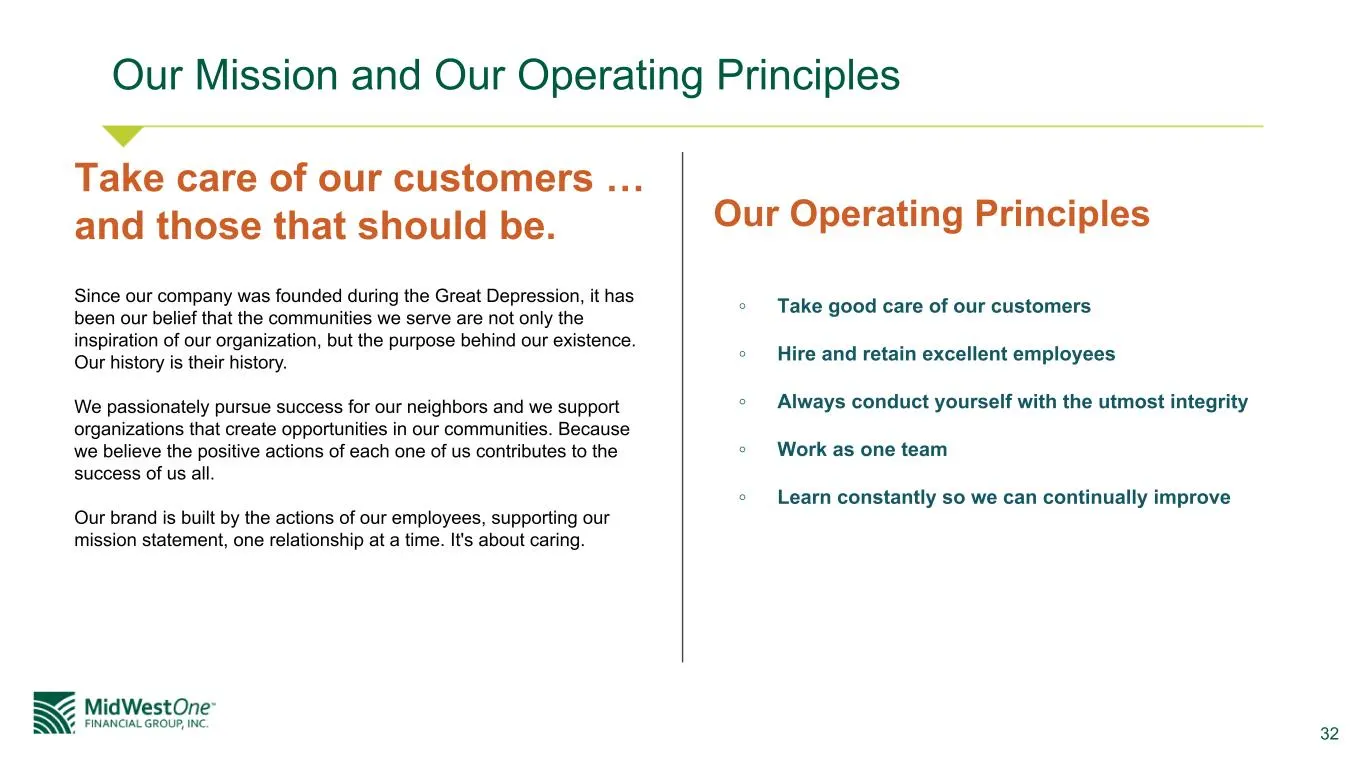
32 Our Mission and Our Operating Principles Take care of our customers … and those that should be. Since our company was founded during the Great Depression, it has been our belief that the communities we serve are not only the inspiration of our organization, but the purpose behind our existence. O

Slide 33: Embrace Our Culture to Drive Brand Equity
33 Embrace Our Culture to Drive Brand Equity Our brand is built on the foundation of our culture, which drives the behaviors and actions of our employees in support of our mission statement: To take good care of our customers and those that should be We do this one relationship at a time - it's abou
Slide 34: Capital Management & Historical Growth
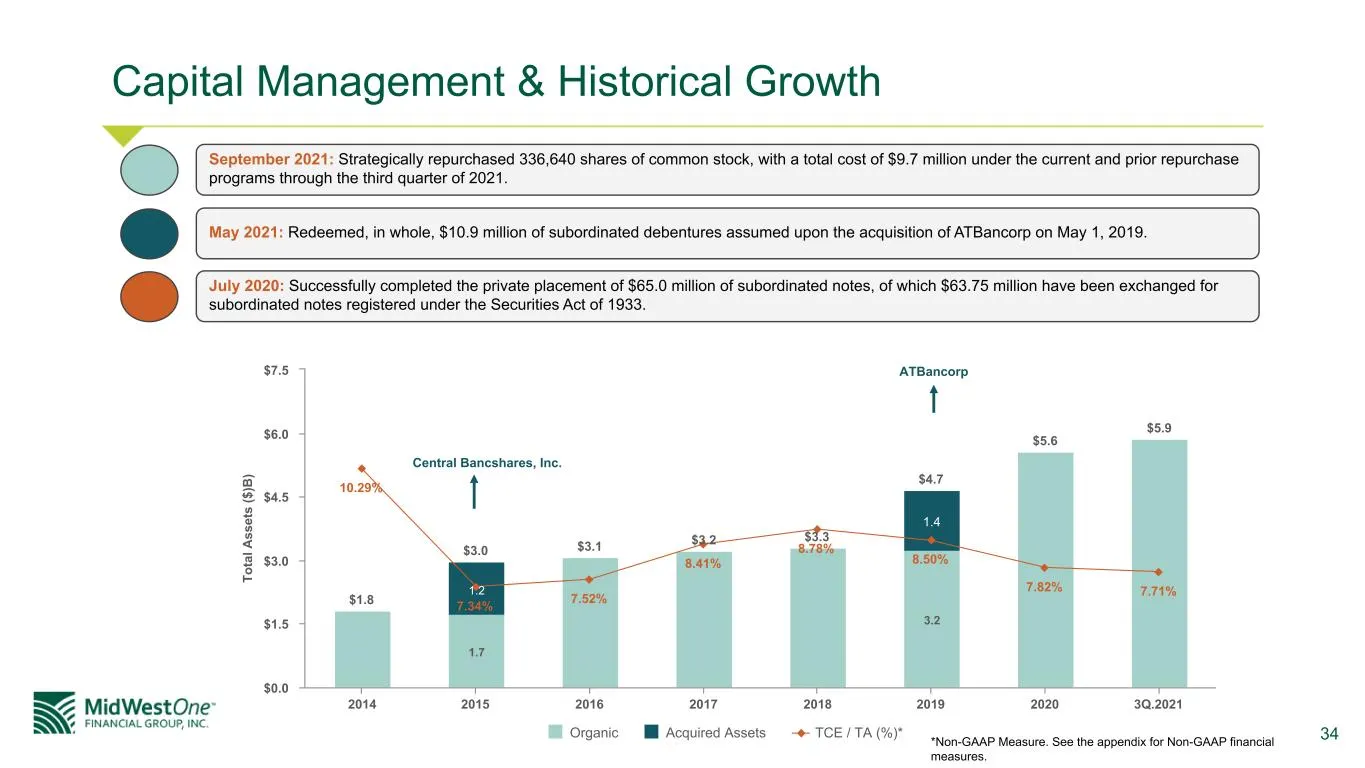
34 Capital Management & Historical Growth To ta l A ss et s ($ )B ) $1.8 $3.0 $3.1 $3.2 $3.3 $4.7 $5.6 $5.9 1.7 3.2 1.2 1.4 10.29% 7.34% 7.52% 8.41% 8.78% 8.50% 7.82% 7.71% Organic Acquired Assets TCE / TA (%)* 2014 2015 2016 2017 2018 2019 2020 3Q.2021 $0.0 $1.5 $3.0 $4.5 $6.0 $7.5 ATBancorp Centra
Slide 35: Appendix
MidWestOne FINANCIAL GROUP, INC. 35
Slide 36: Non-GAAP Financial Measures: Tangible Common Equity
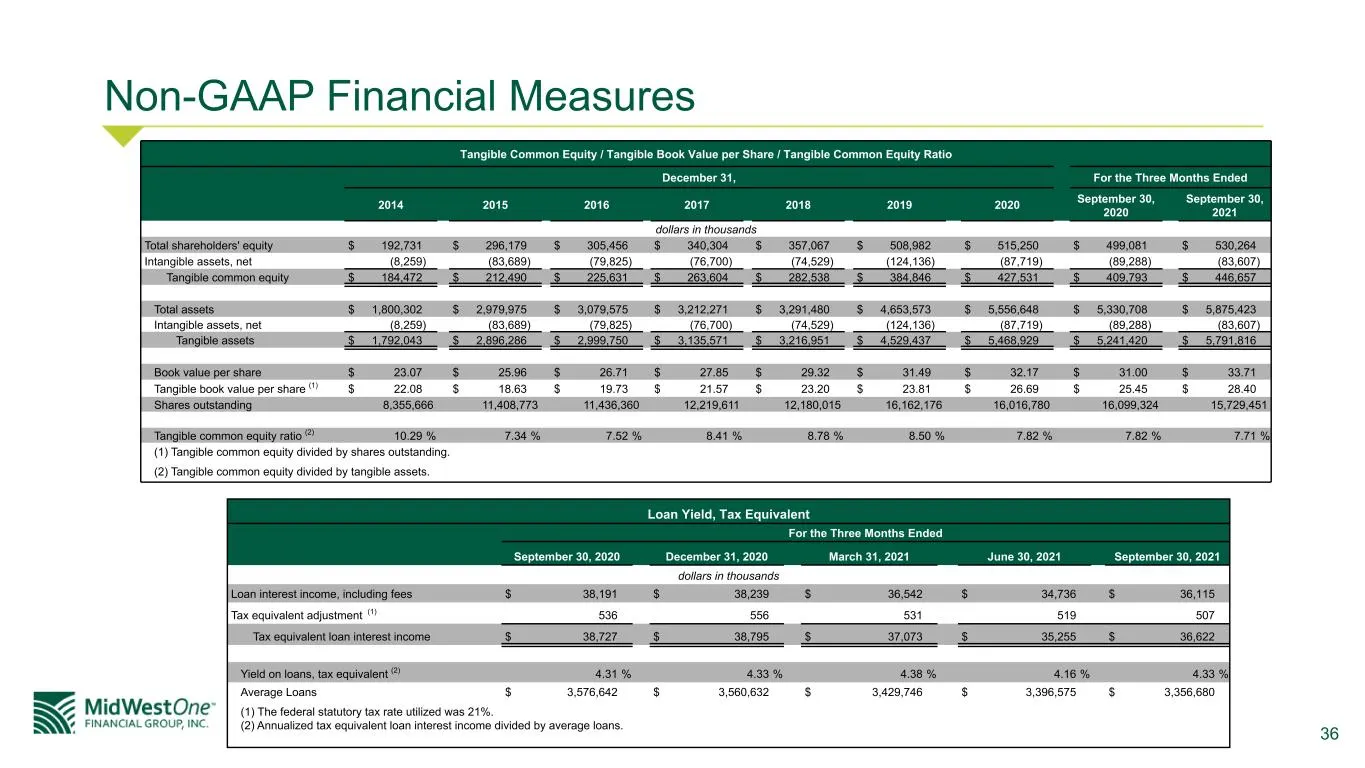
36 Non-GAAP Financial Measures Tangible Common Equity / Tangible Book Value per Share / Tangible Common Equity Ratio December 31, For the Three Months Ended 2014 2015 2016 2017 2018 2019 2020 September 30, 2020 September 30, 2021 dollars in thousands Total shareholders' equity $ 192,731 $ 296,179 $
Slide 37: Non-GAAP Financial Measures: ROAA and ROATE
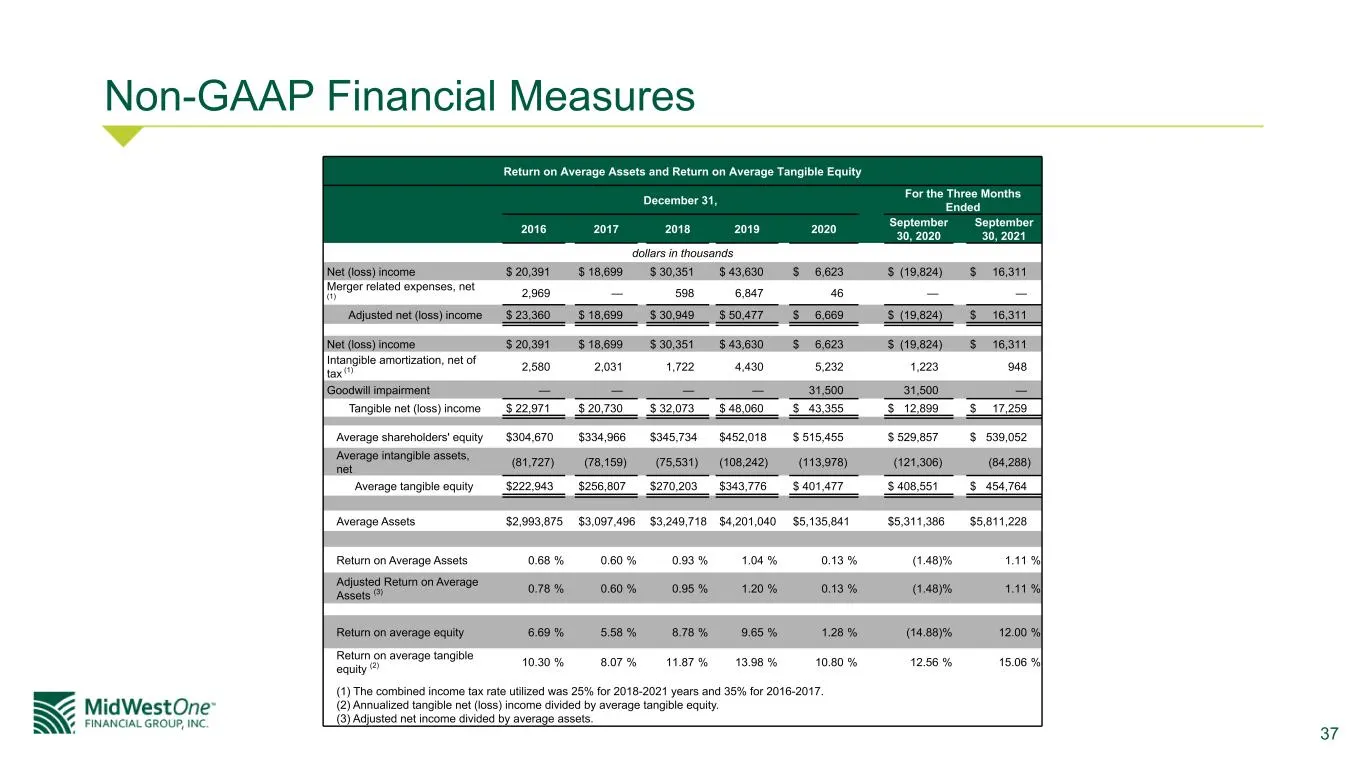
37 Non-GAAP Financial Measures Return on Average Assets and Return on Average Tangible Equity December 31, For the Three Months Ended 2016 2017 2018 2019 2020 September 30, 2020 September 30, 2021 dollars in thousands Net (loss) income $ 20,391 $ 18,699 $ 30,351 $ 43,630 $ 6,623 $ (19,824) $ 16,311
Slide 38: Non-GAAP Financial Measures: Net Interest Income and Margin
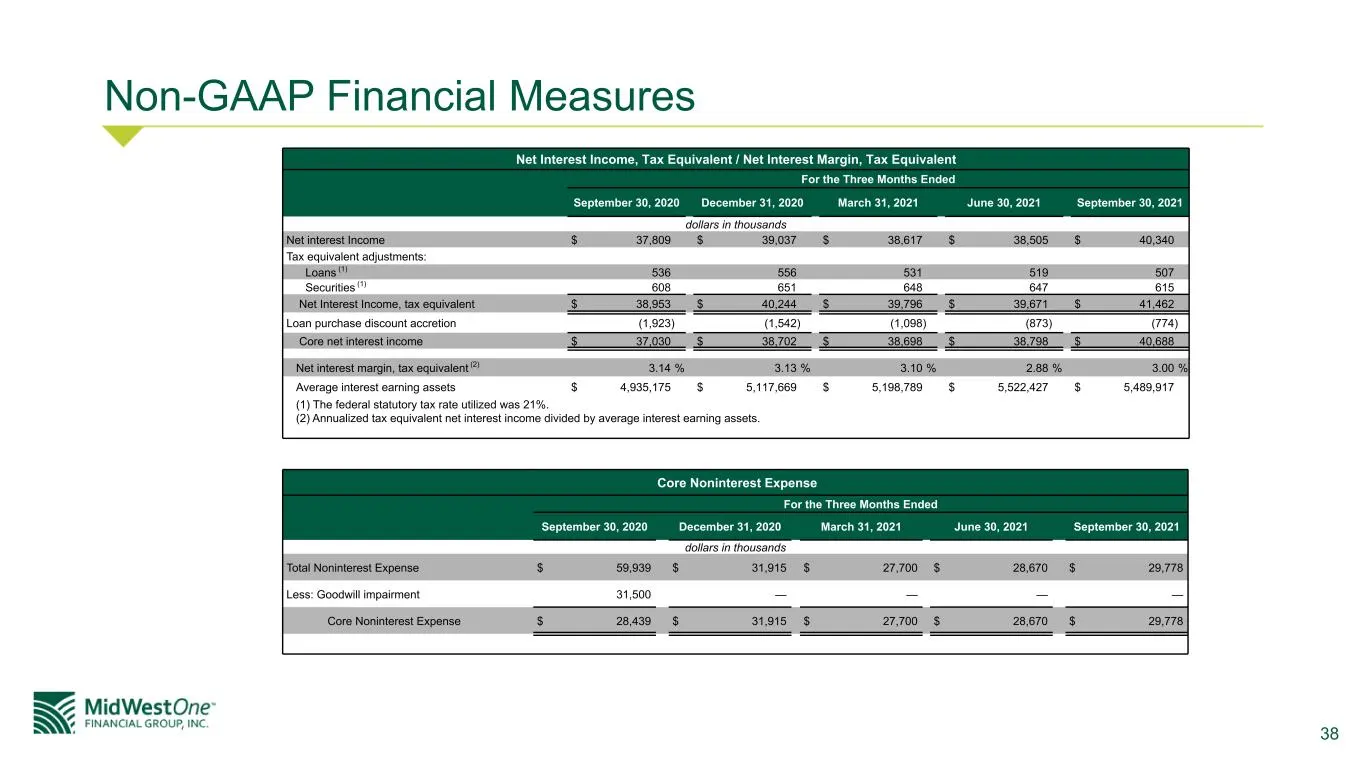
38 Non-GAAP Financial Measures Net Interest Income, Tax Equivalent / Net Interest Margin, Tax Equivalent For the Three Months Ended September 30, 2020 December 31, 2020 March 31, 2021 June 30, 2021 September 30, 2021 dollars in thousands Net interest Income $ 37,809 $ 39,037 $ 38,617 $ 38,505 $ 40,3
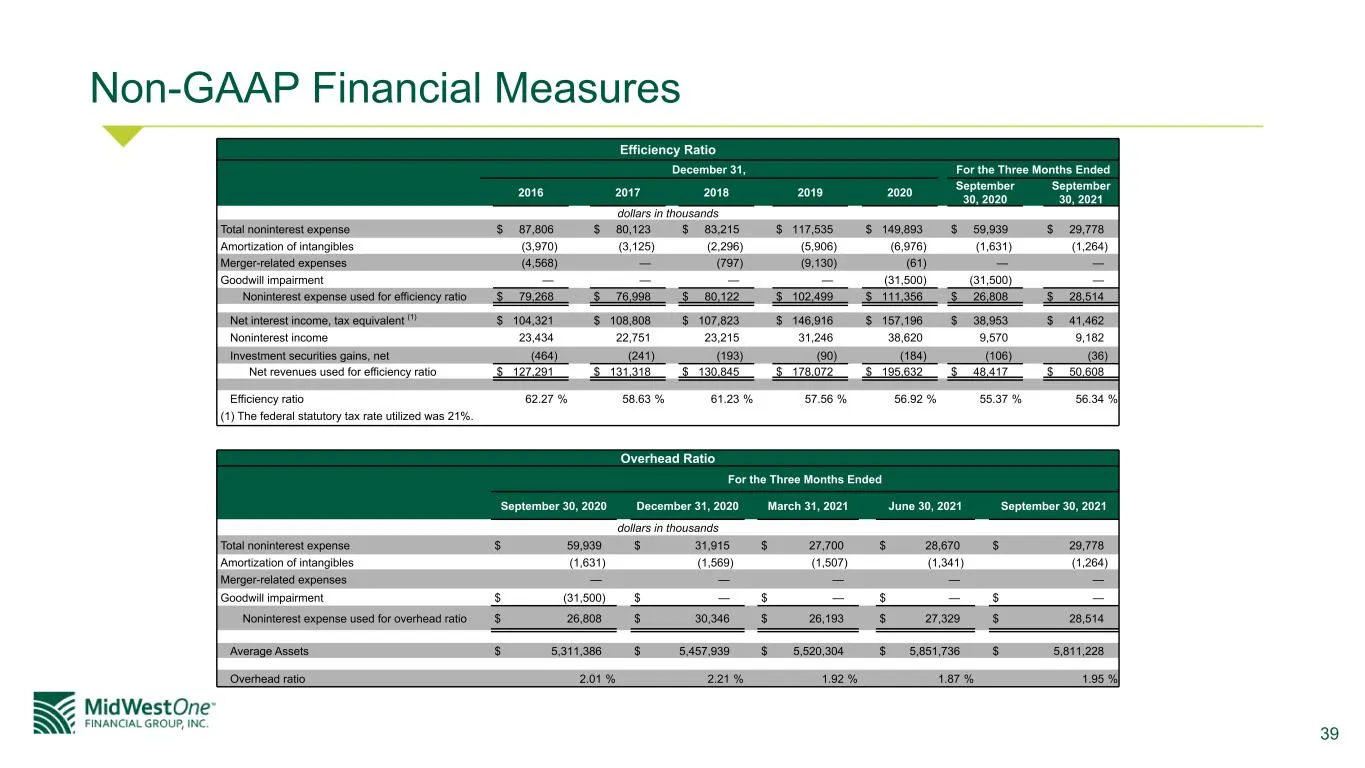
Slide 39: Non-GAAP Financial Measures: Efficiency Ratio
39 Non-GAAP Financial Measures Efficiency Ratio December 31, For the Three Months Ended 2016 2017 2018 2019 2020 September 30, 2020 September 30, 2021 dollars in thousands Total noninterest expense $ 87,806 $ 80,123 $ 83,215 $ 117,535 $ 149,893 $ 59,939 $ 29,778 Amortization of intangibles (3,970) (
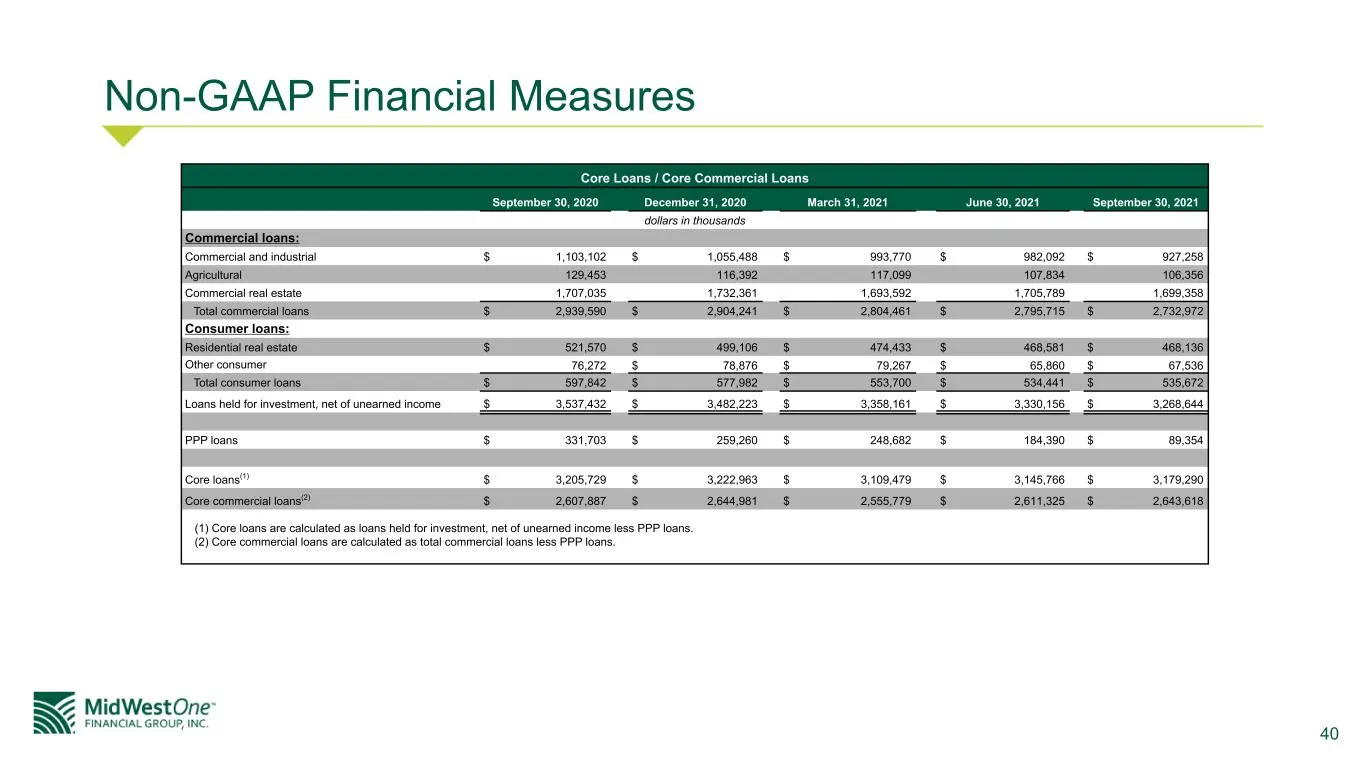
Slide 40: Non-GAAP Financial Measures: Core Loans
40 Non-GAAP Financial Measures Core Loans / Core Commercial Loans September 30, 2020 December 31, 2020 March 31, 2021 June 30, 2021 September 30, 2021 dollars in thousands Commercial loans: Commercial and industrial $ 1,103,102 $ 1,055,488 $ 993,770 $ 982,092 $ 927,258 Agricultural 129,453 116,392 1
Source: SEC EDGAR · 8-K filed Nov 2, 2021
More decks from MidWestOne Financial Group Inc
 Q3 2025 Earnings Presentation18 slides · Oct 23, 2025
 Merger or Acquisition (October 2025)20 slides · Oct 23, 2025
 Q2 2025 Earnings Presentation32 slides · Jul 25, 2025
 Q2 2025 Earnings Presentation18 slides · Jul 25, 2025
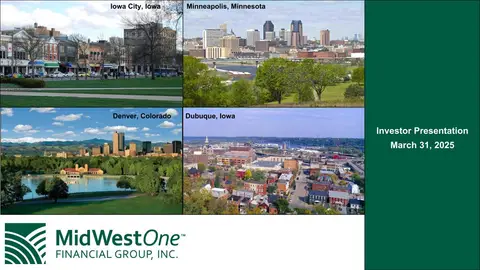 Investor Presentation (April 2025)31 slides · Apr 28, 2025
 Q1 2025 Earnings Presentation17 slides · Apr 25, 2025