Wendy's Company (the) · NASDAQ:WEN
Wendy's Company (the) — The Wendy's Company — Q4 2019 Earnings Presentation
37 slides from Wendy's Company (the)'s earnings presentation, Feb 26, 2020
Slide 1: Fourth Quarter 2019 Conference Call
Fourth Quarter 2019 Conference Call February 26, 2020 © Quality Is Our Recipe, LLC
Slide 2: Greg Lemenchick
Greg Lemenchick Senior Director – Investor Relations & Corporate FP&A © Quality Is Our Recipe, LLC
Slide 3: Forward-Looking Statements and Non-GAAP Financial Measures
This presentation, and certain information that management may discuss in connection with this presentation, contains certain statements that are “forward-looking statements” within the meaning of the Private Securities Litigation Reform Act of 1995 (the “Reform Act”). For all such forward-looking s
Slide 4: Agenda
Agenda CEO Update 2019 Results 2020 Outlook IR Calendar Q&A THE WENDY'S COMPANY | 4
Slide 5: Todd Penegor
Todd Penegor President & Chief Executive Officer © Quality Is Our Recipe, LLC
Slide 6: We will become the world's most thriving, beloved restaurant brand
-WE WILL BECOME: THE WORLD'S thriving bel6uved RESTAURANT ‘BRAND-
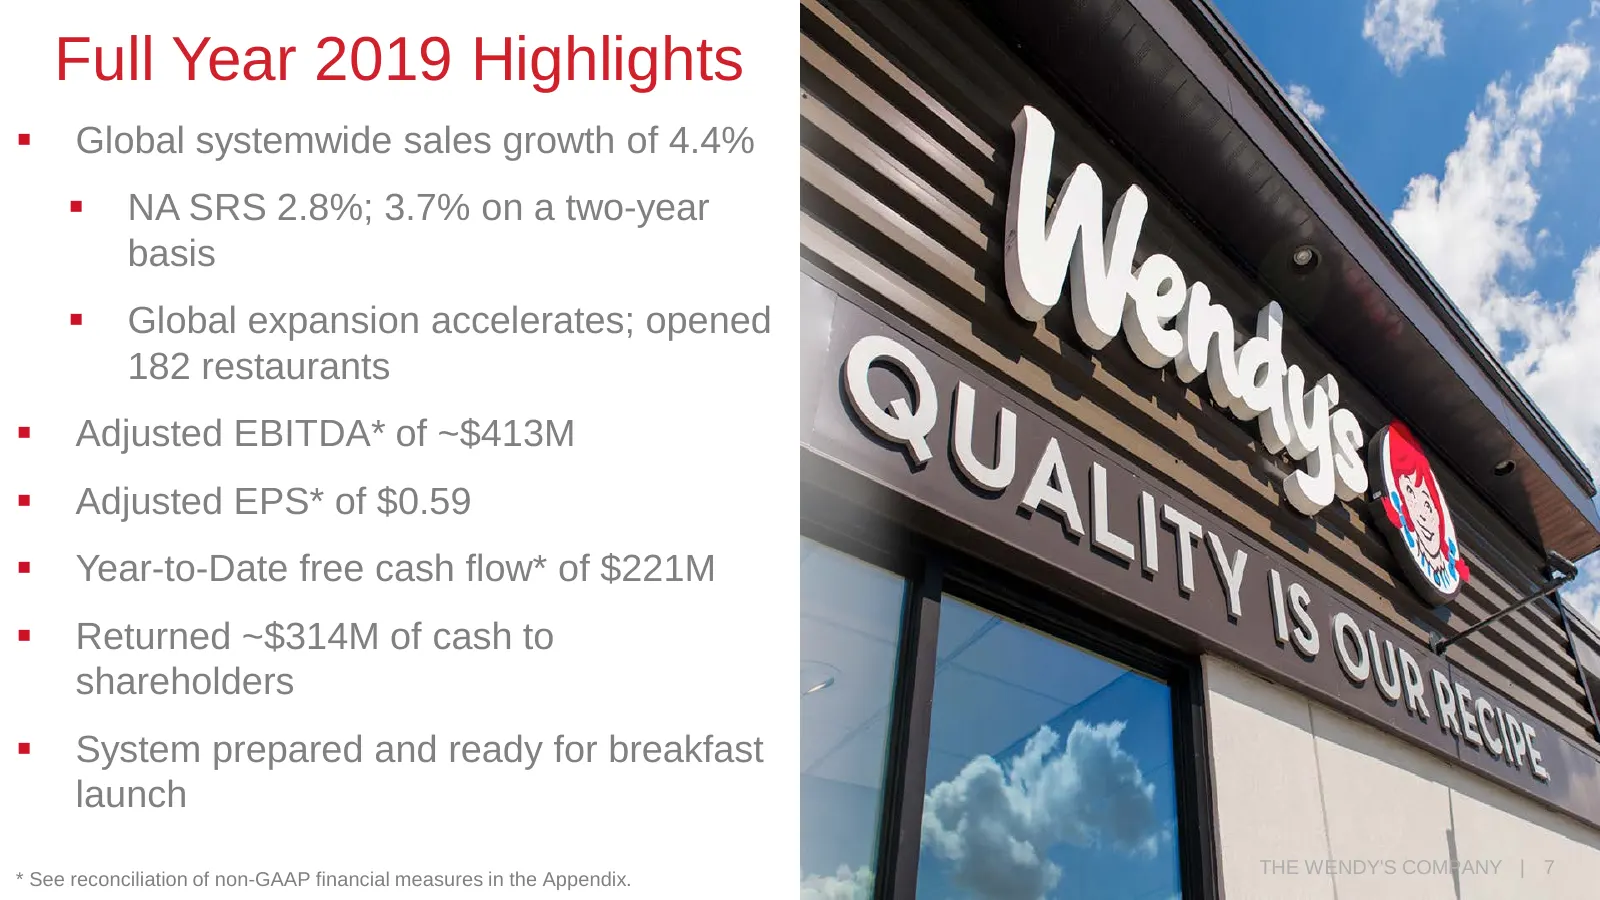
Slide 7: Full Year 2019 Highlights
Full Year 2019 Highlights Global systemwide sales growth of 4.4% NA SRS 2.8%; 3.7% on a two-year basis Global expansion accelerates; opened 182 restaurants Adjusted EBITDA* of ~$413M Adjusted EPS* of $0.59 Year-to-Date free cash flow* of $221M Returned ~$314M of cash to shareholders
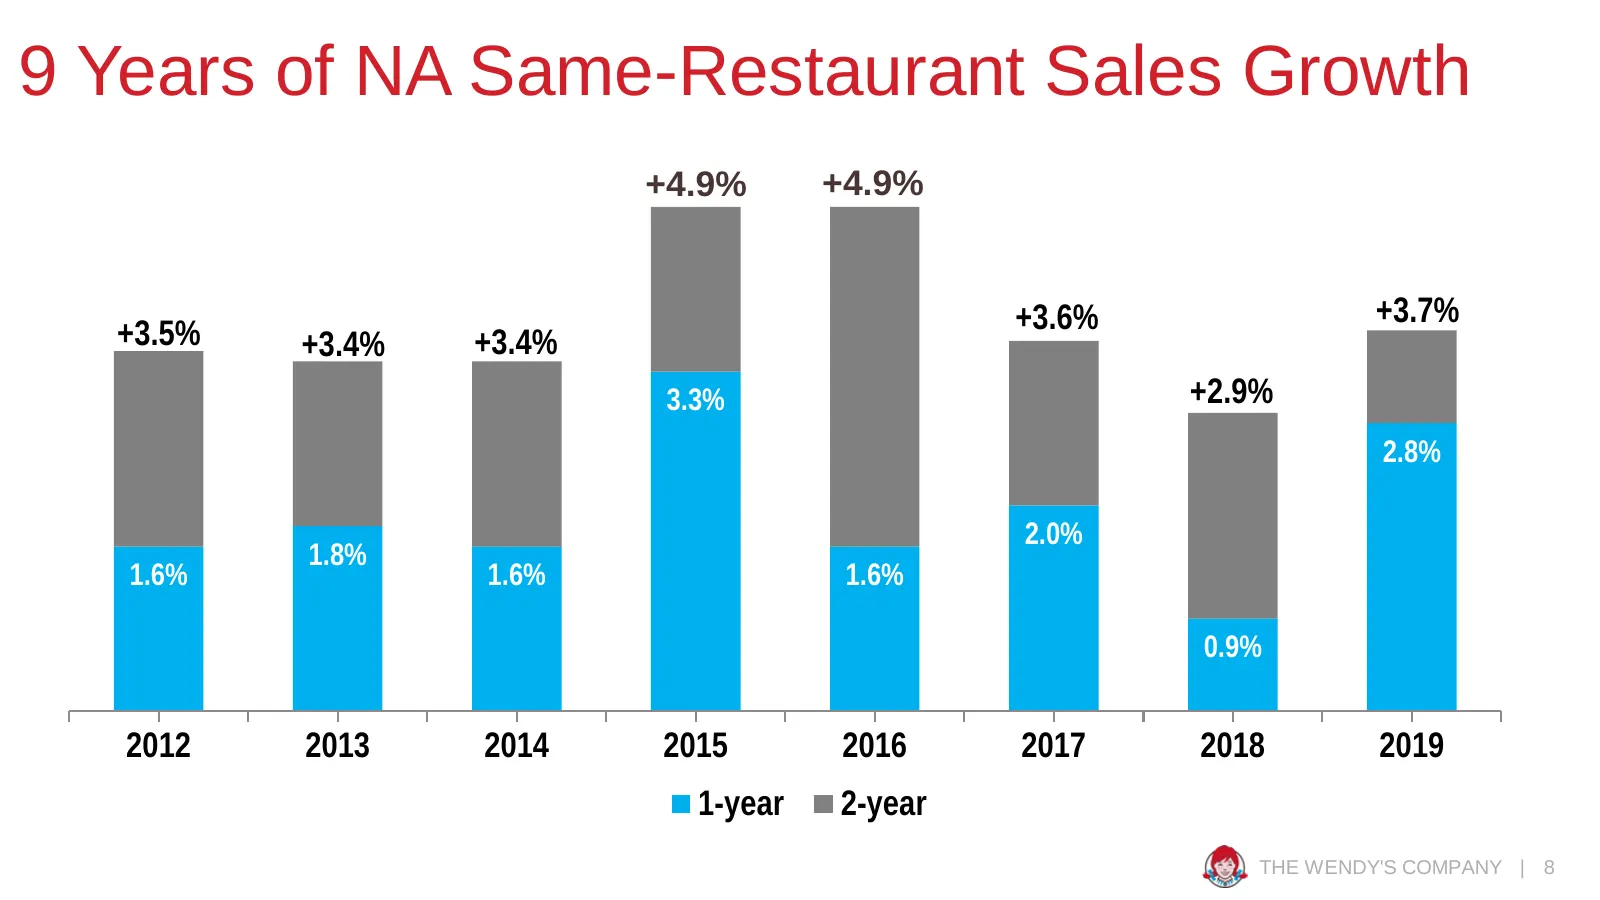
Slide 8: 9 Years of NA Same-Restaurant Sales Growth
9 Years of NA Same-Restaurant Sales Growth +4.9% +4.9% +3.6% +3.7% +3.5% +3.4% +3.4% 3.3% +2.9% 2.8% 2.0% 1.8% 1.6% 1.6% 1.6% 0.9% 2012 2013 2014 2015 2016 2017 2018 2019 1-year 2-year THE WENDY'S COMPANY | 8
Slide 9: Gunther Plosch
Gunther Plosch Chief Financial Officer © Quality Is Our Recipe, LLC
Slide 10: Full Year Financial Highlights
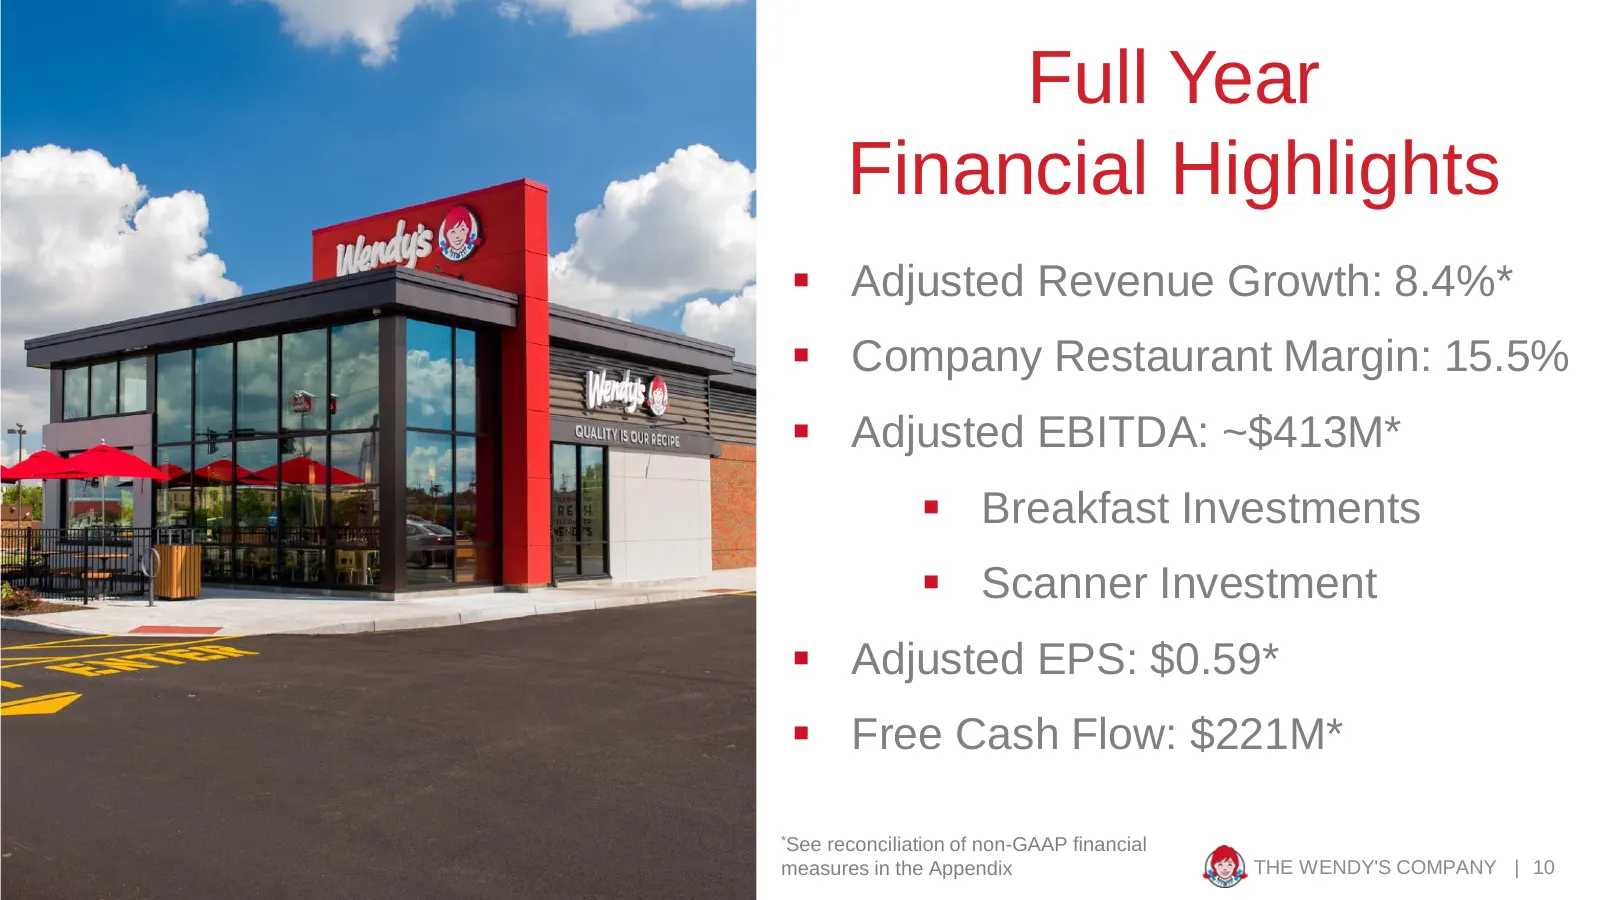
Full Year Financial Highlights Adjusted Revenue Growth: 8.4%* Company Restaurant Margin: 15.5% Adjusted EBITDA: ~$413M* Breakfast Investments Scanner Investment Adjusted EPS: $0.59* Free Cash Flow: $221M* *See reconciliation of non-GAAP financial measures in the Appendix THE WENDY'S CO
Slide 11: Fourth Quarter Financial Results
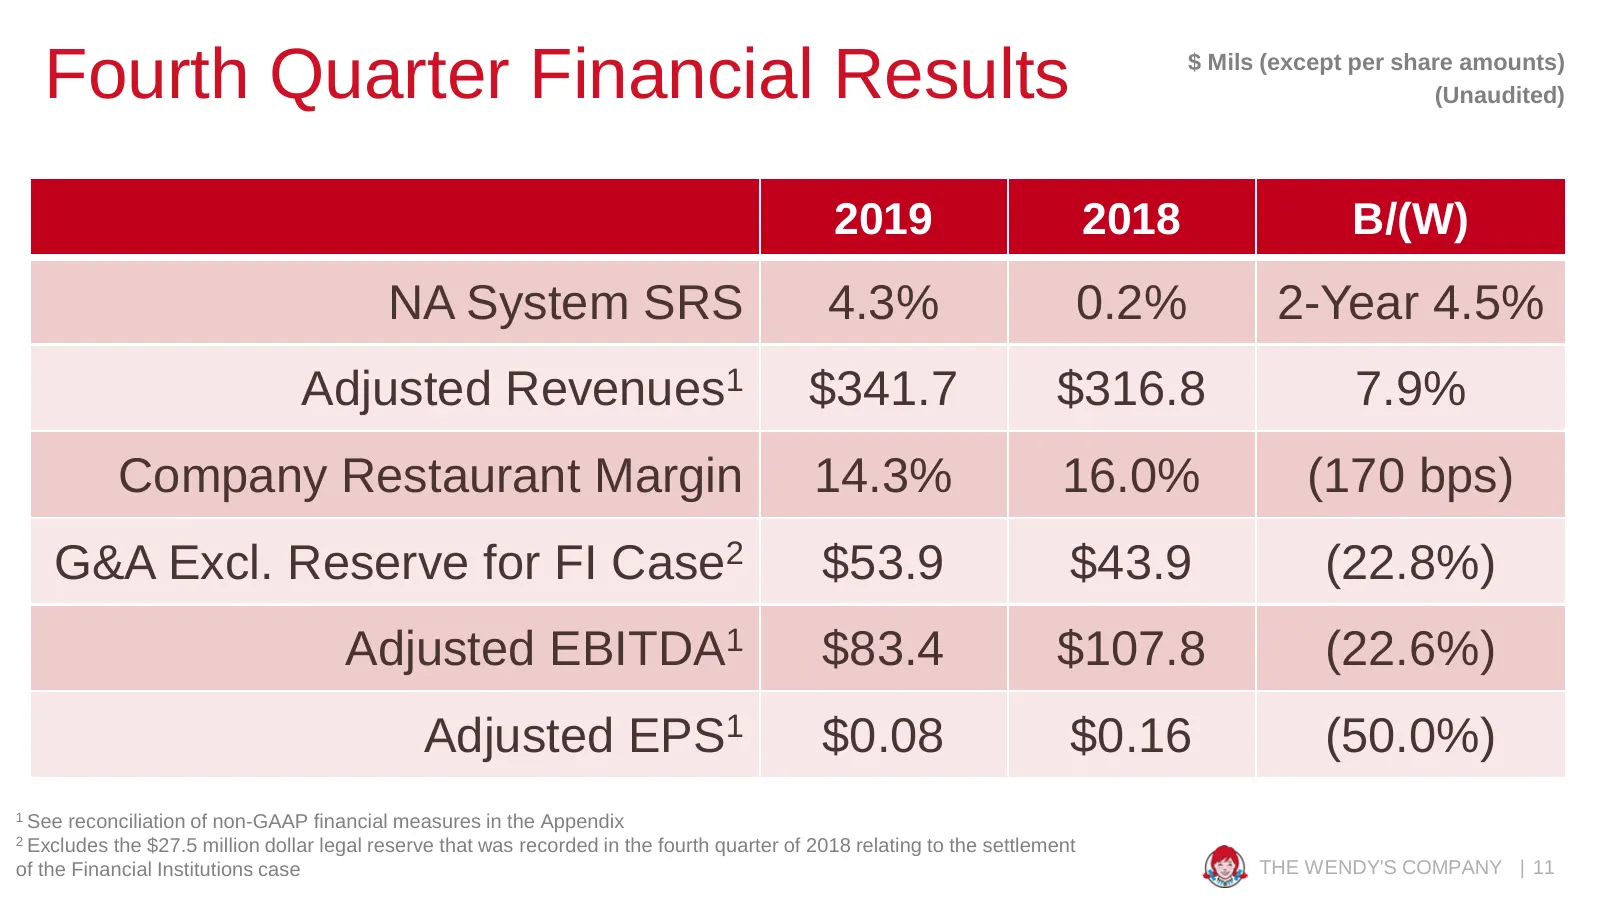
Fourth Quarter Financial Results $ Mils (except per share amounts) (Unaudited) 2019 2018 B/(W) NA System SRS 4.3% 0.2% 2-Year 4.5% Adjusted Revenues1 $341.7 $316.8 7.9% Company Restaurant Margin 14.3% 16.0% (170 bps) G&A Excl. Reserve for FI Case2 $53.9 $43.9 (22.8%) Adjusted EBITDA1 $83.4 $107.8 (2
Slide 12: Todd Penegor
Todd Penegor President & Chief Executive Officer © Quality Is Our Recipe, LLC
Slide 13: Pillars of Accelerated Growth
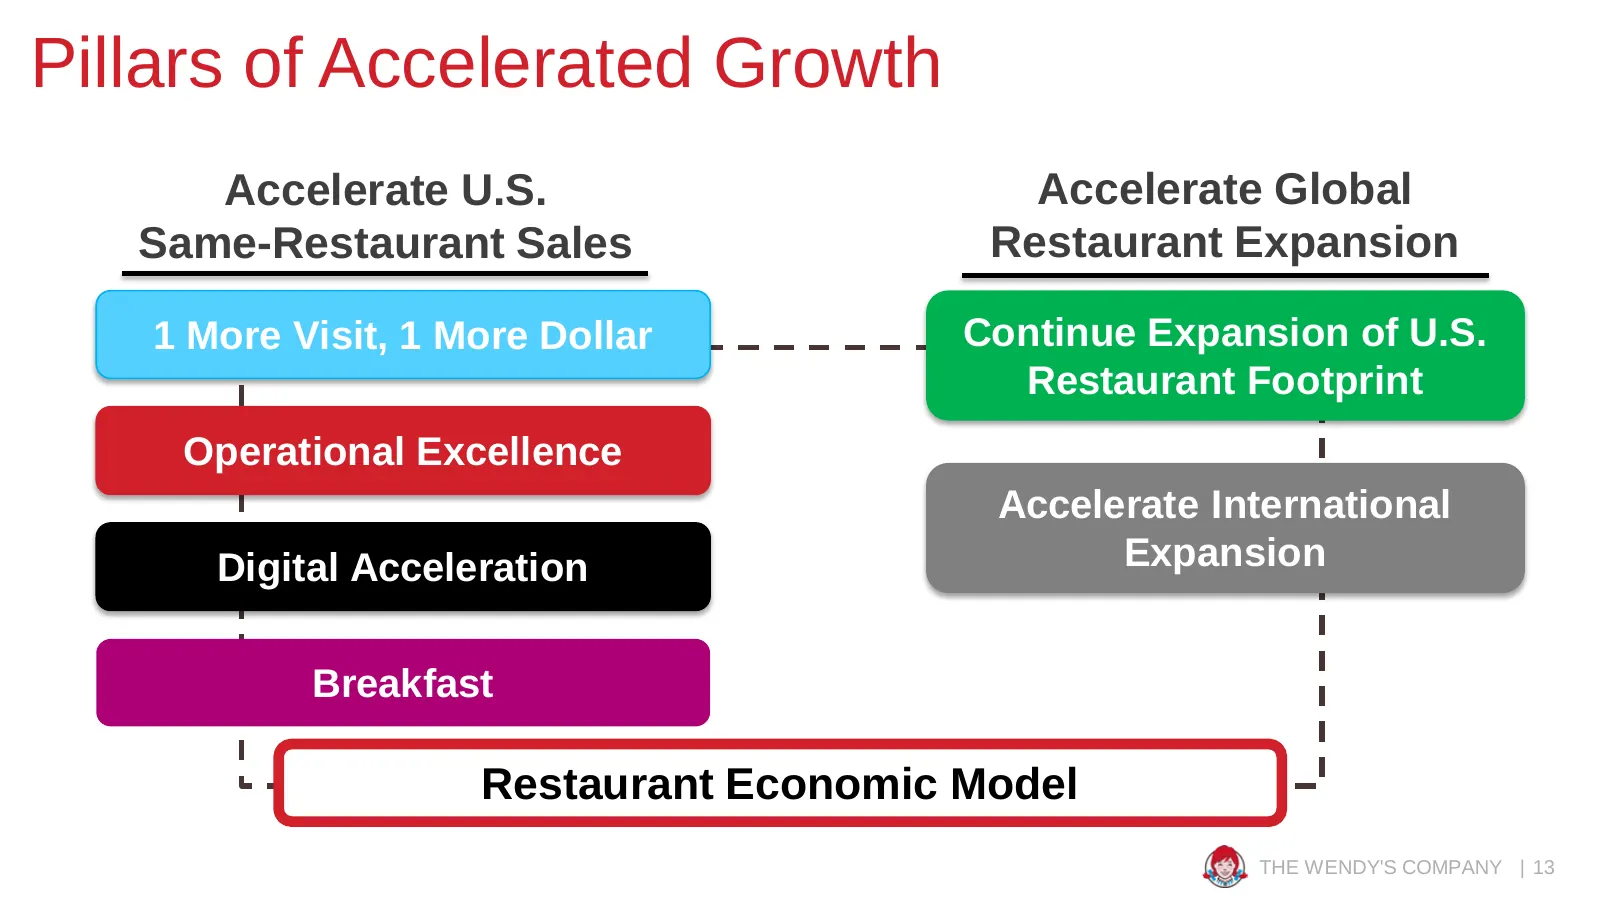
Pillars of Accelerated Growth Accelerate U.S. Accelerate Global Same-Restaurant Sales Restaurant Expansion 1 More Visit, 1 More Dollar Continue Expansion of U.S. Restaurant Footprint Operational Excellence Accelerate International Digital Acceleration Expansion Breakfast Restaurant Economic Model TH
Slide 14: One More Visit, One More Dollar to Drive Further Growth
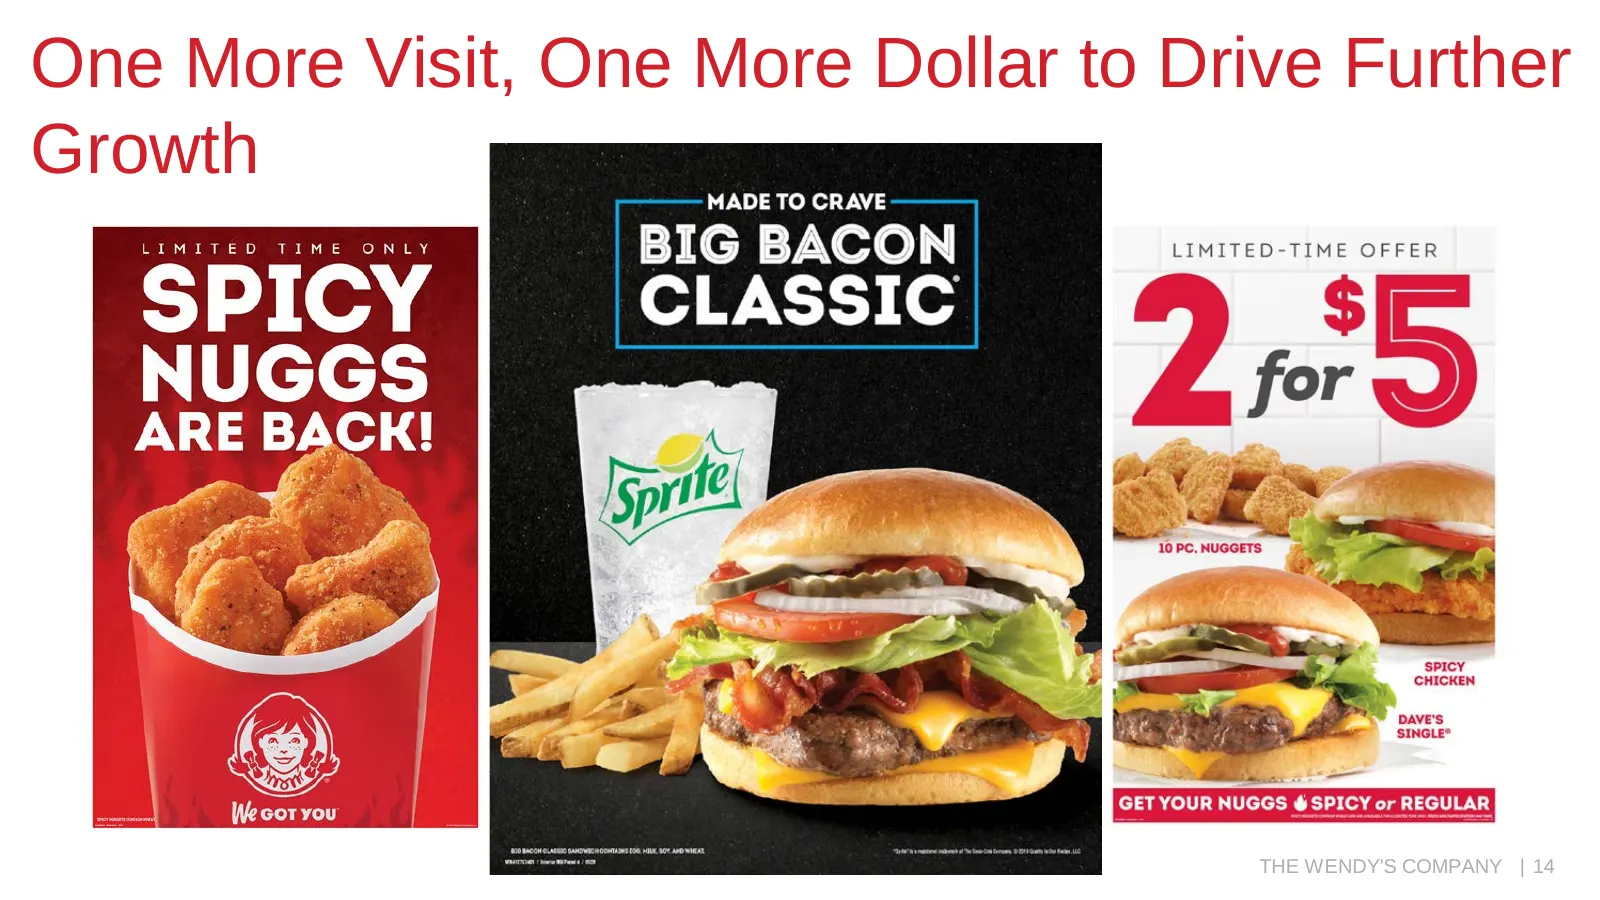
One More Visit, One More Dollar to Drive Further Growth THE WENDY'S COMPANY | 14
Slide 15: Breakfast Set to Launch Across the U.S. on March 2
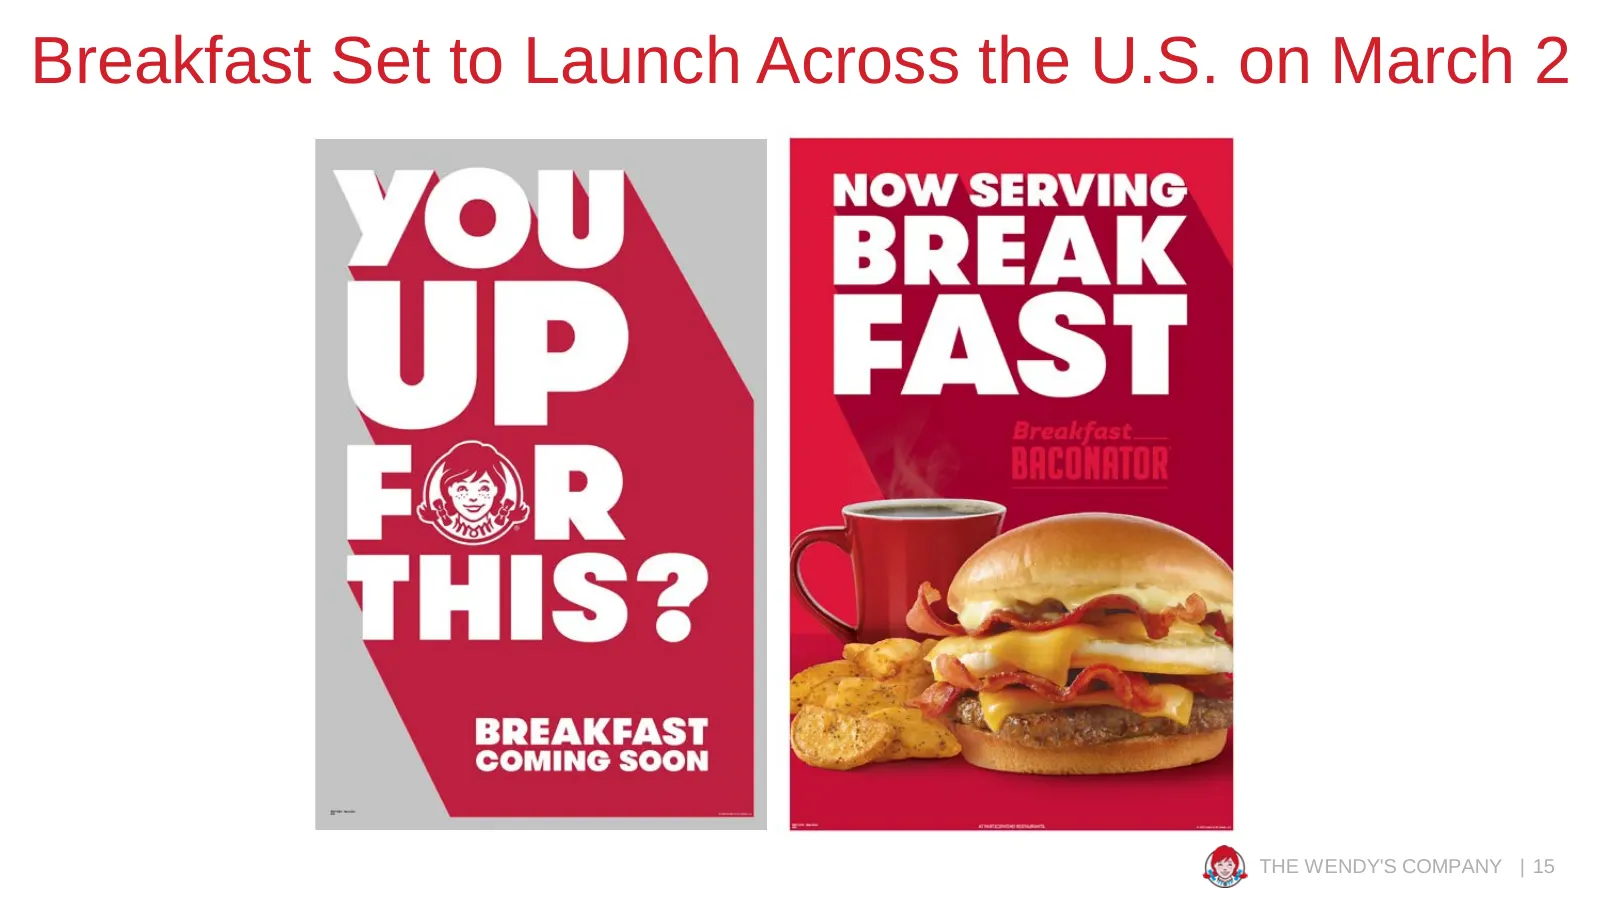
Breakfast Set to Launch Across the U.S. on March 2 THE WENDY'S COMPANY | 15
Slide 16: Poised for Continued Digital Growth in 2020
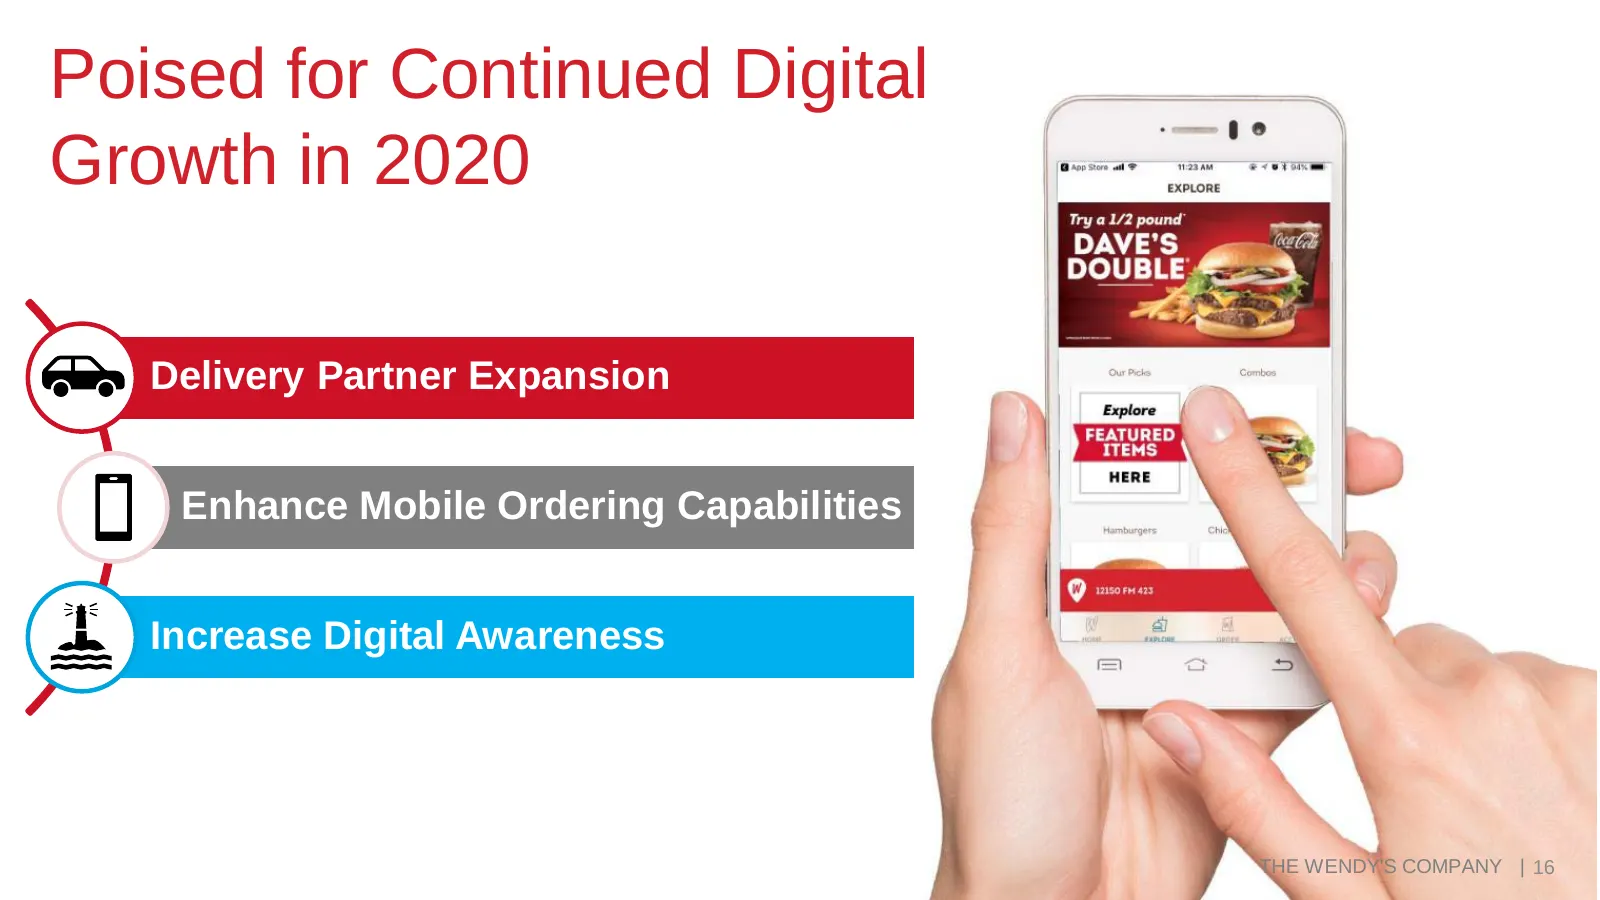
Poised for Continued Digital Growth in 2020 Delivery Partner Expansion Enhance Mobile Ordering Capabilities Increase Digital Awareness THEWENDY'S THE WENDY'SCOMPANY COMPANY || 16
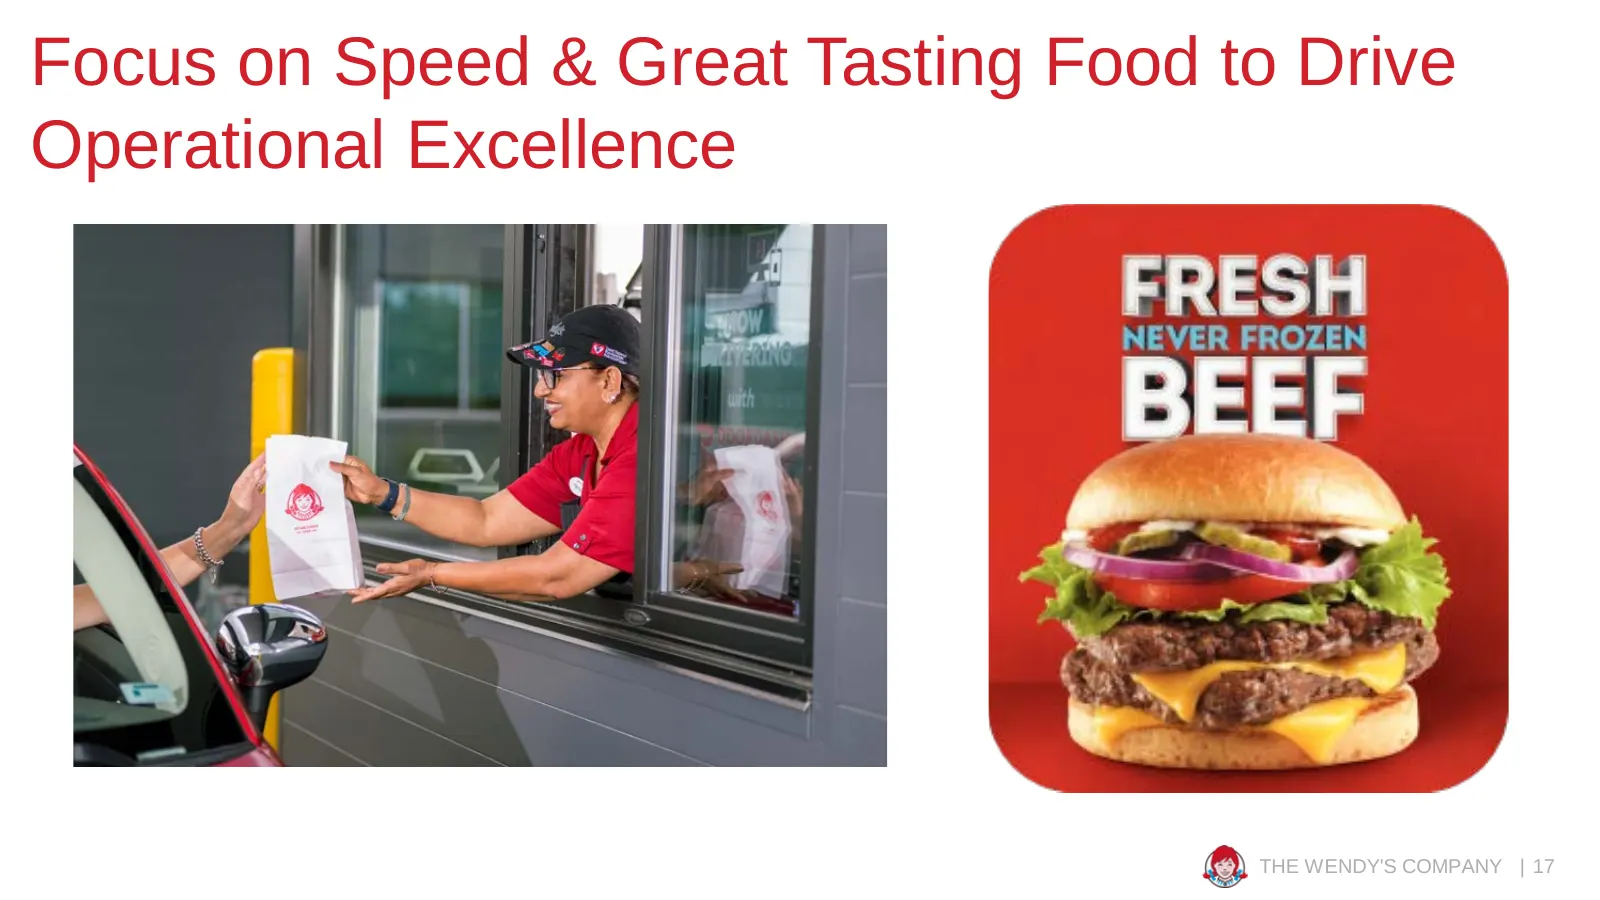
Slide 17: Focus on Speed & Great Tasting Food to Drive Operational Excellence
Focus on Speed & Great Tasting Food to Drive Operational Excellence THE WENDY'S COMPANY | 17
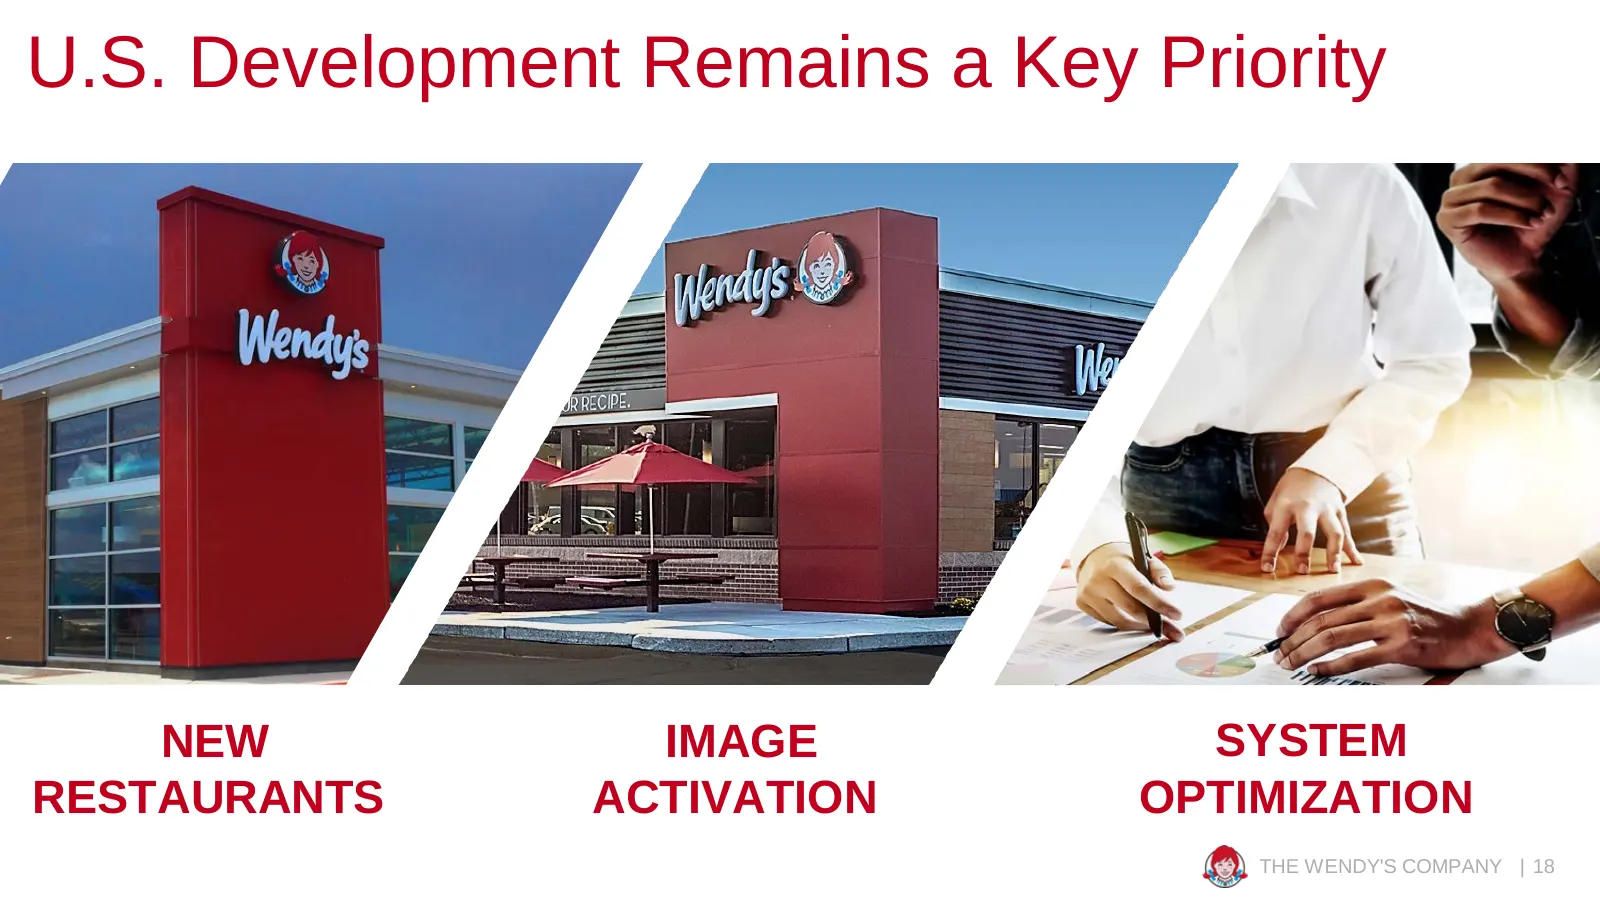
Slide 18: U.S. Development Remains a Key Priority
U.S. Development Remains a Key Priority NEW IMAGE SYSTEM RESTAURANTS ACTIVATION OPTIMIZATION THE WENDY'S COMPANY | 18
Slide 19: International to Accelerate Growth in 2020
International to Accelerate Growth in 2020 THE WENDY'S COMPANY | 19
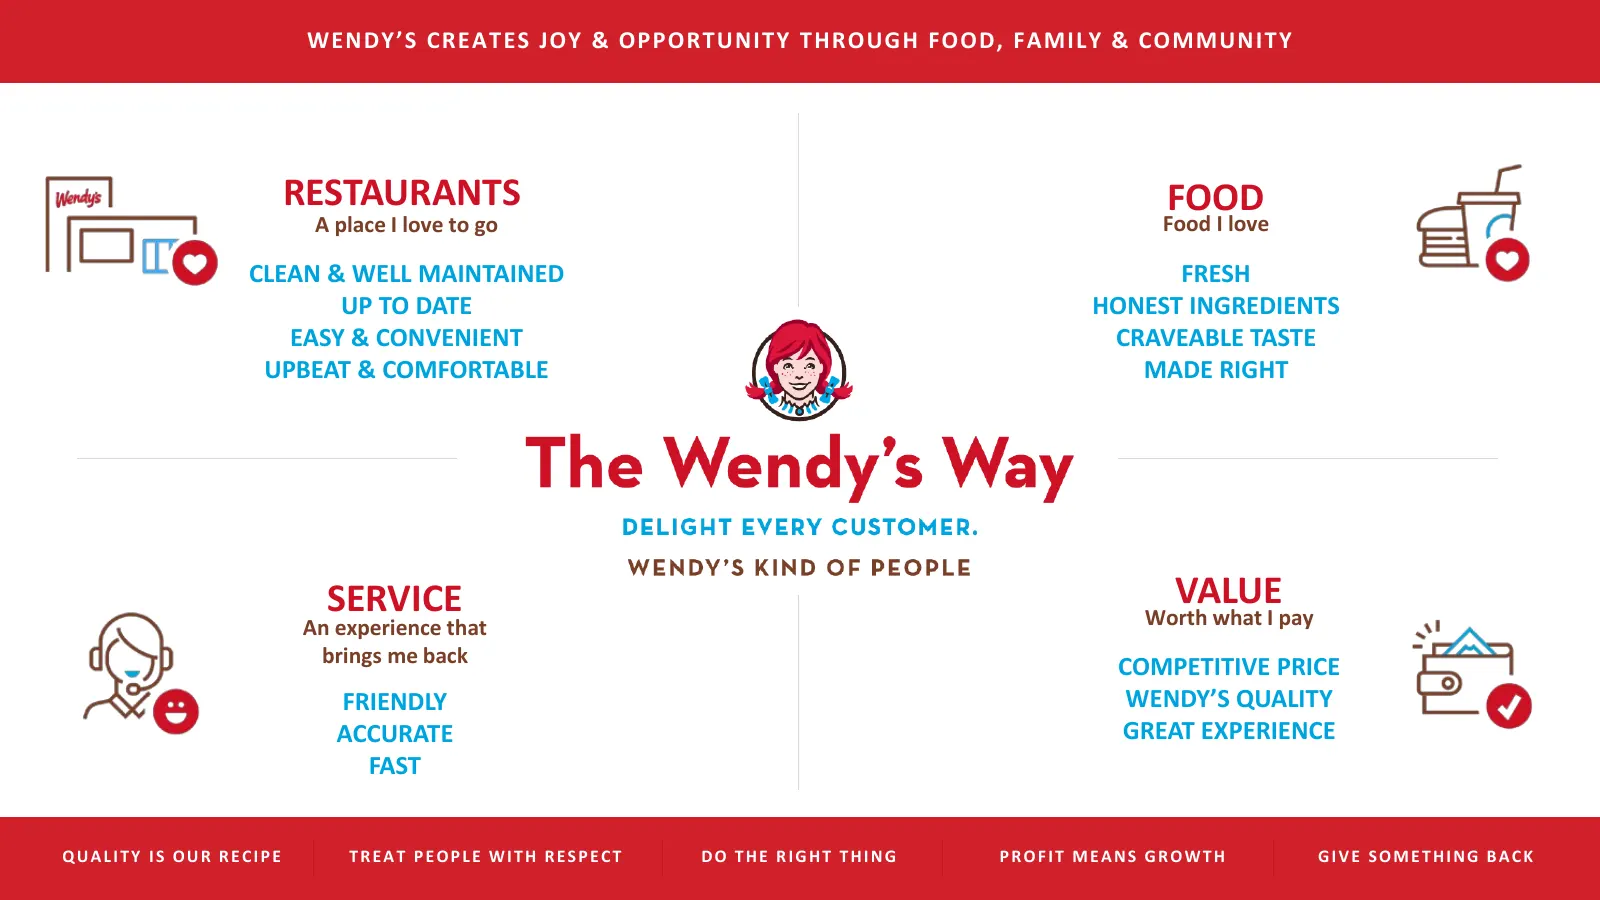
Slide 20: Wendy's Creates Joy & Opportunity Through Food, Family & Community
WENDY’S CREATES JOY & OPPORTUNITY THROUGH FOOD, FAMILY & COMMUNITY RESTAURANTS FOOD A place I love to go Food I love CLEAN & WELL MAINTAINED FRESH UP TO DATE HONEST INGREDIENTS EASY & CONVENIENT CRAVEABLE TASTE UPBEAT & COMFORTABLE MADE RIGHT SERVICE VALUE An experience that Worth what I pay brings
Slide 21: Gunther Plosch
Gunther Plosch Chief Financial Officer © Quality Is Our Recipe, LLC
Slide 22: 2020 Outlook
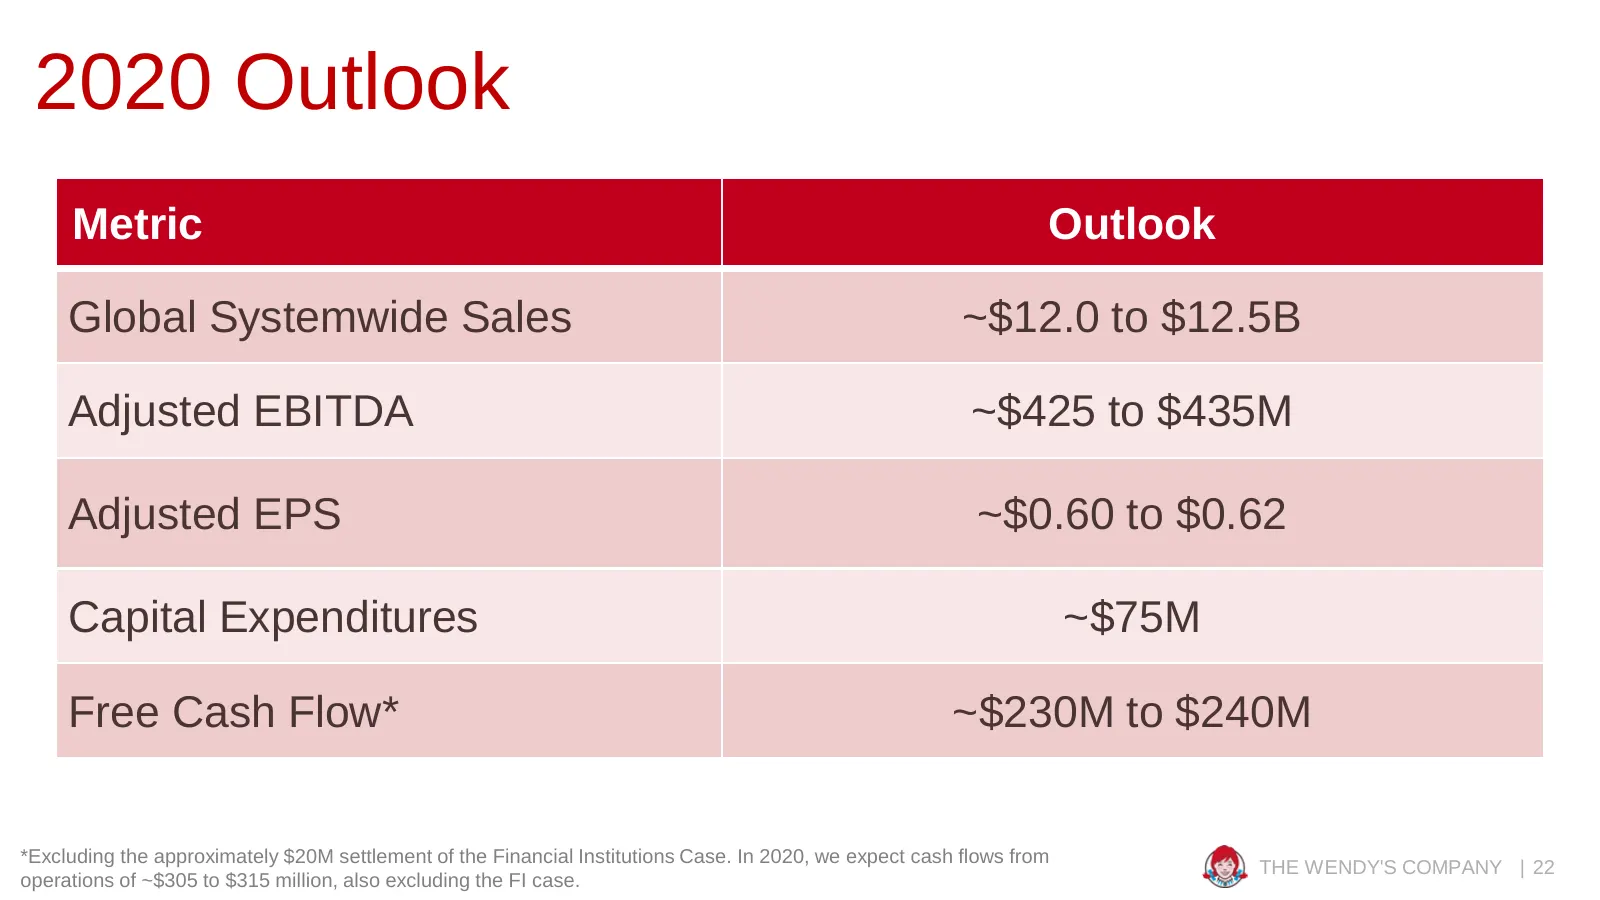
2020 Outlook Metric Outlook Global Systemwide Sales ~$12.0 to $12.5B Adjusted EBITDA ~$425 to $435M Adjusted EPS ~$0.60 to $0.62 Capital Expenditures ~$75M Free Cash Flow* ~$230M to $240M *Excluding the approximately $20M settlement of the Financial Institutions Case. In 2020, we expect cash flows f
Slide 23: 2020 Outlook: Systemwide Sales Growth
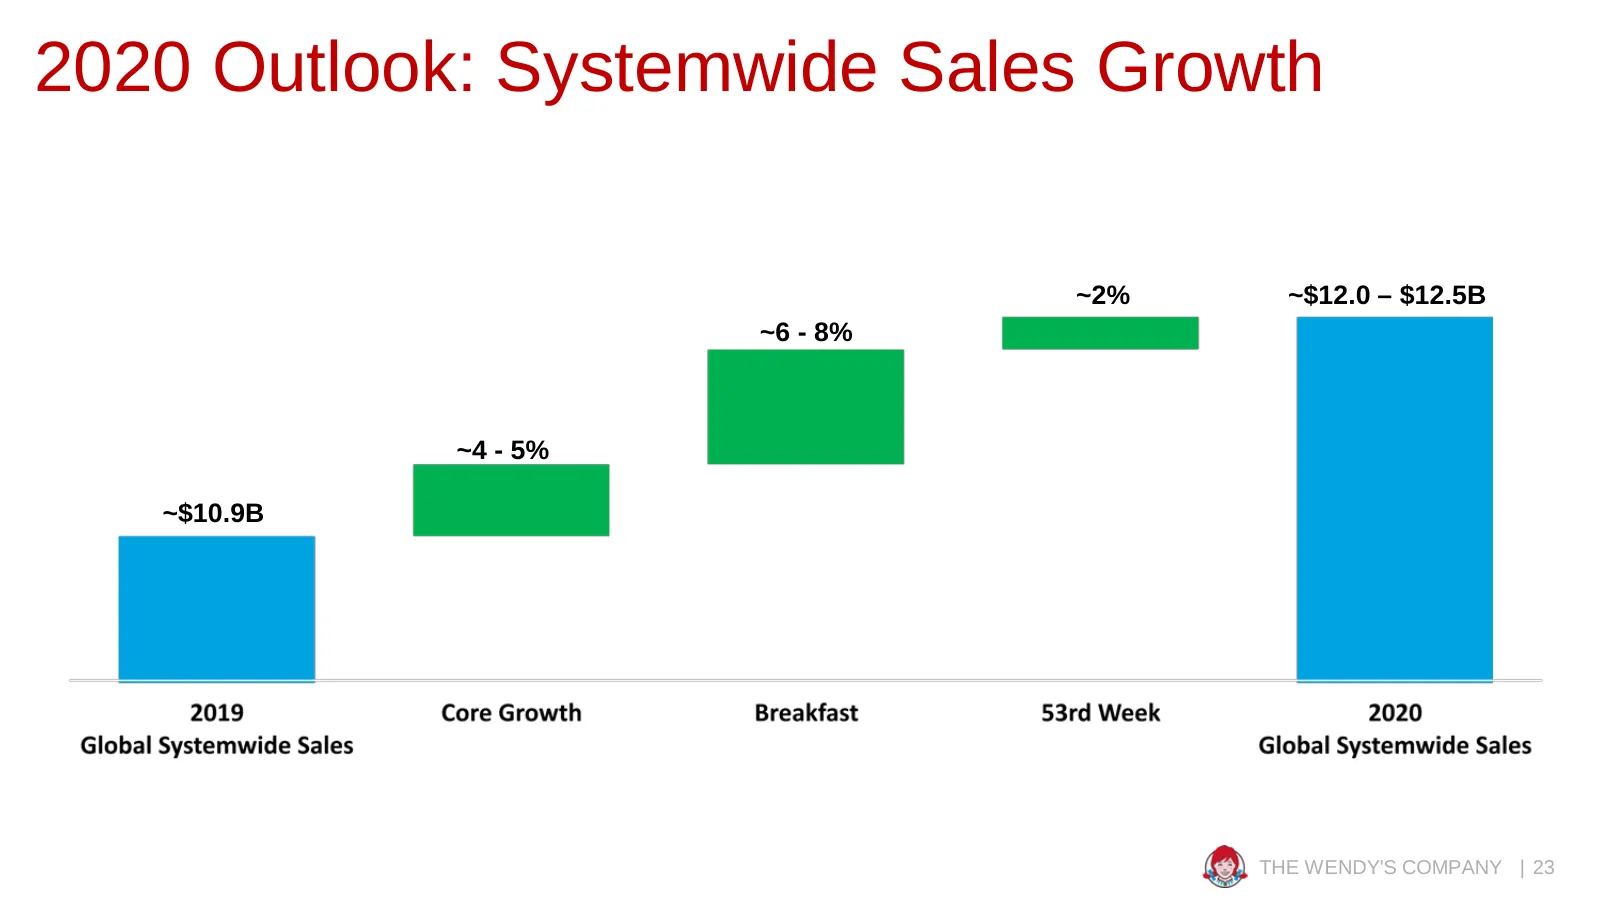
2020 Outlook: Systemwide Sales Growth ~2% ~$12.0 – $12.5B ~6 - 8% ~4 - 5% ~$10.9B THE WENDY'S COMPANY | 23
Slide 24: 2020 Outlook: Adjusted EBITDA
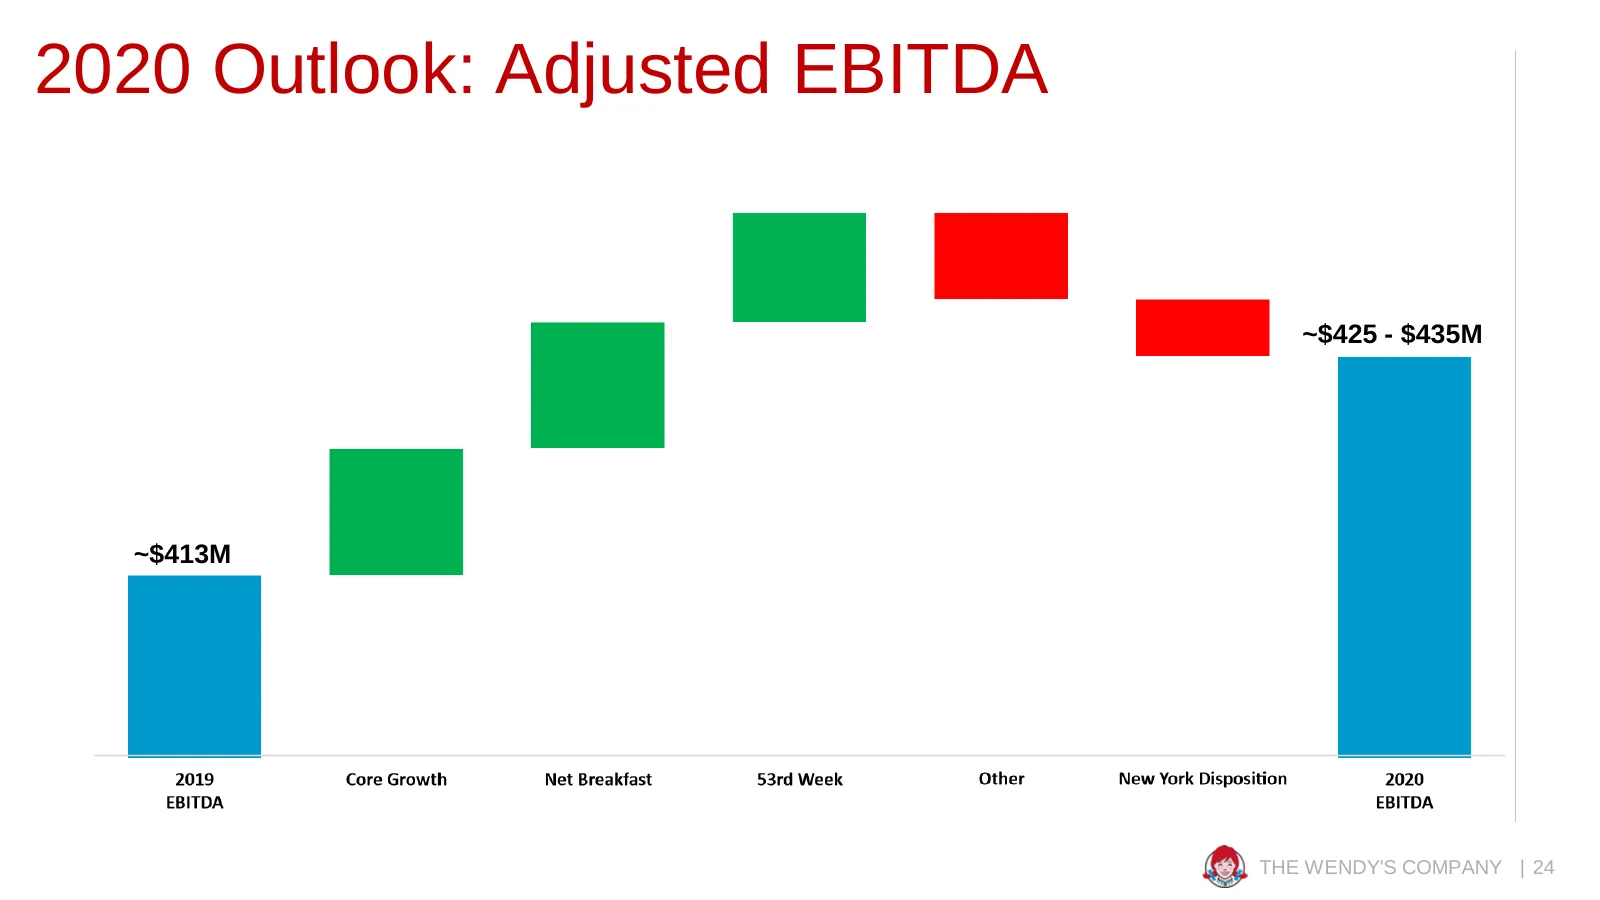
2020 Outlook: Adjusted EBITDA ~$425 - $435M ~$413M THE WENDY'S COMPANY | 24
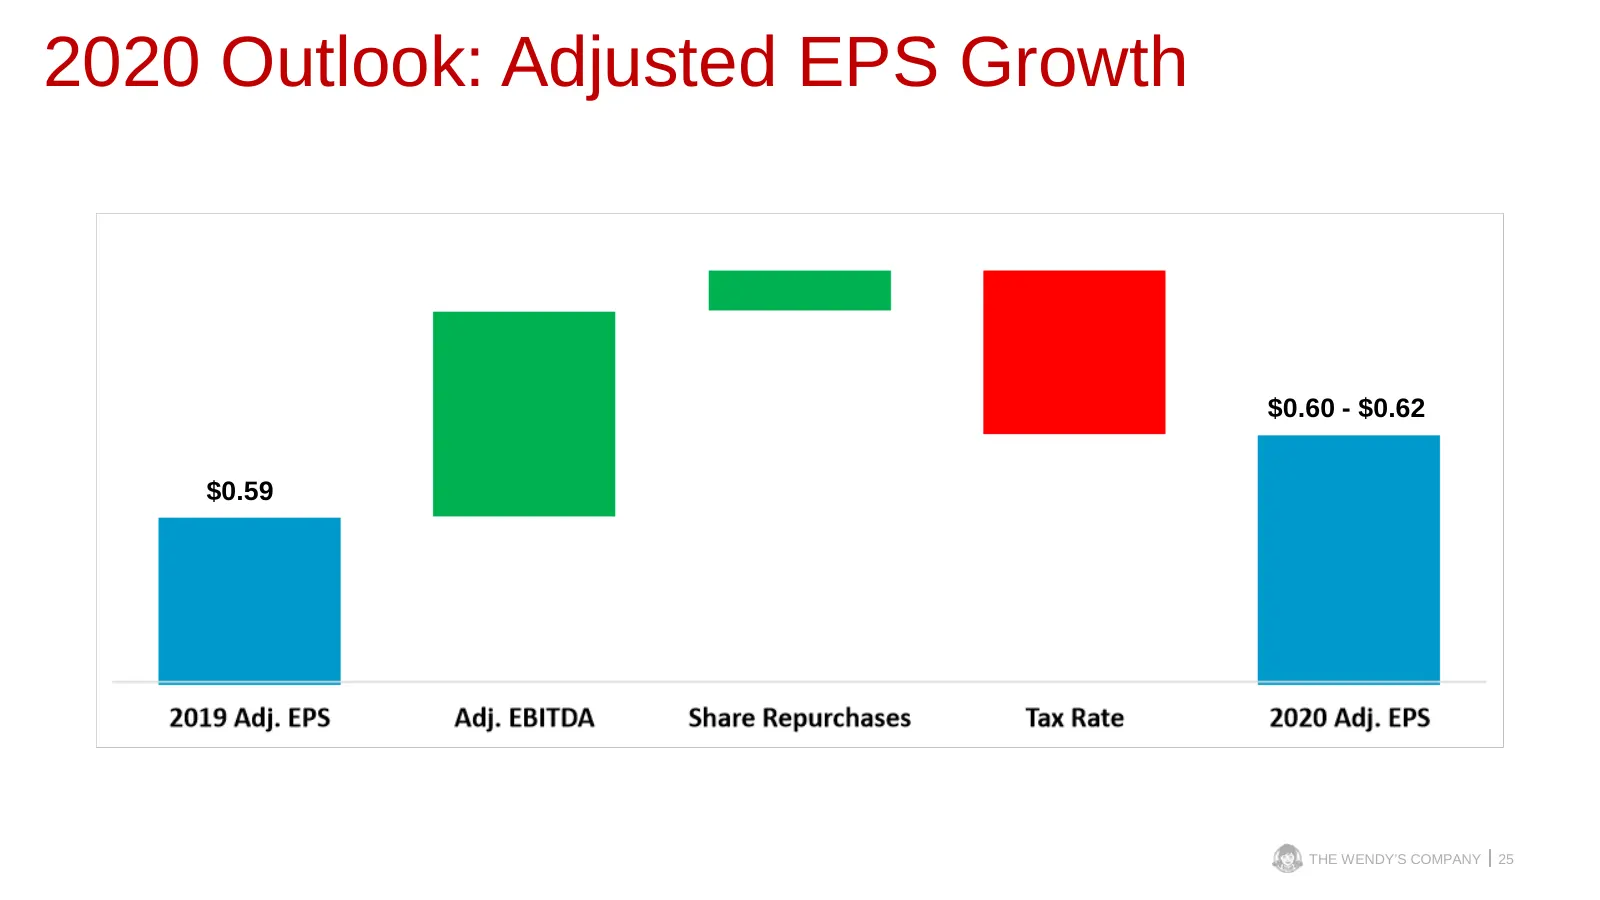
Slide 25: 2020 Outlook: Adjusted EPS Growth
2020 Outlook: Adjusted EPS Growth $0.60 - $0.62 $0.59 THE WENDY’S COMPANY 25
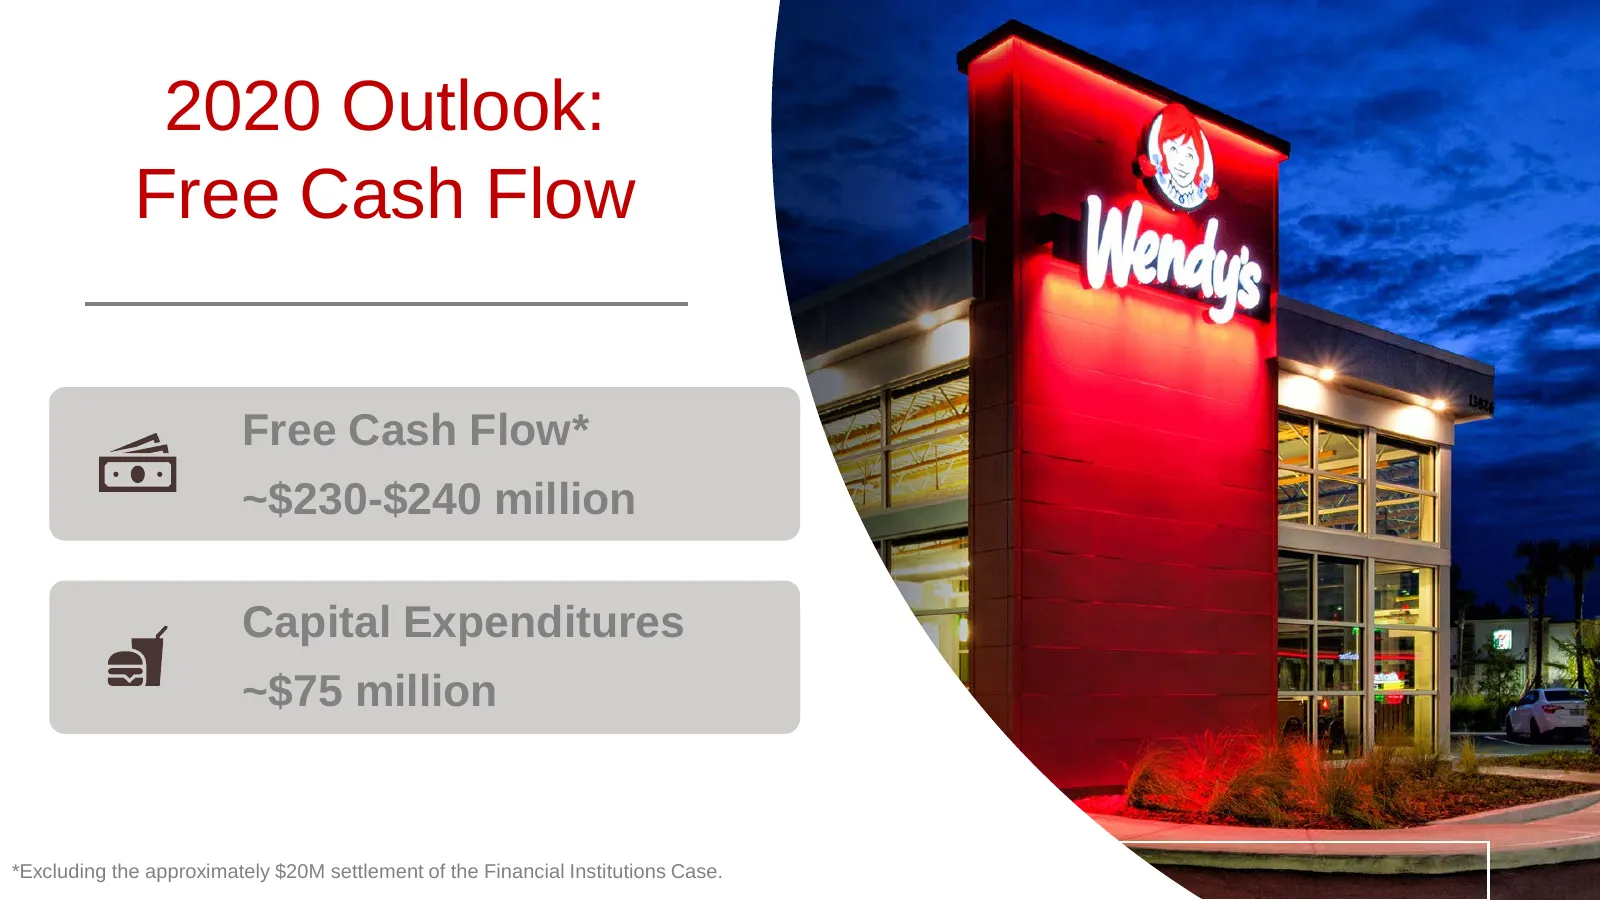
Slide 26: 2020 Outlook: Free Cash Flow
2020 Outlook: Free Cash Flow Free Cash Flow* ~$230-$240 million Capital Expenditures ~$75 million ACCELERATING GROWTH 26 *Excluding the approximately $20M settlement of the Financial Institutions Case.
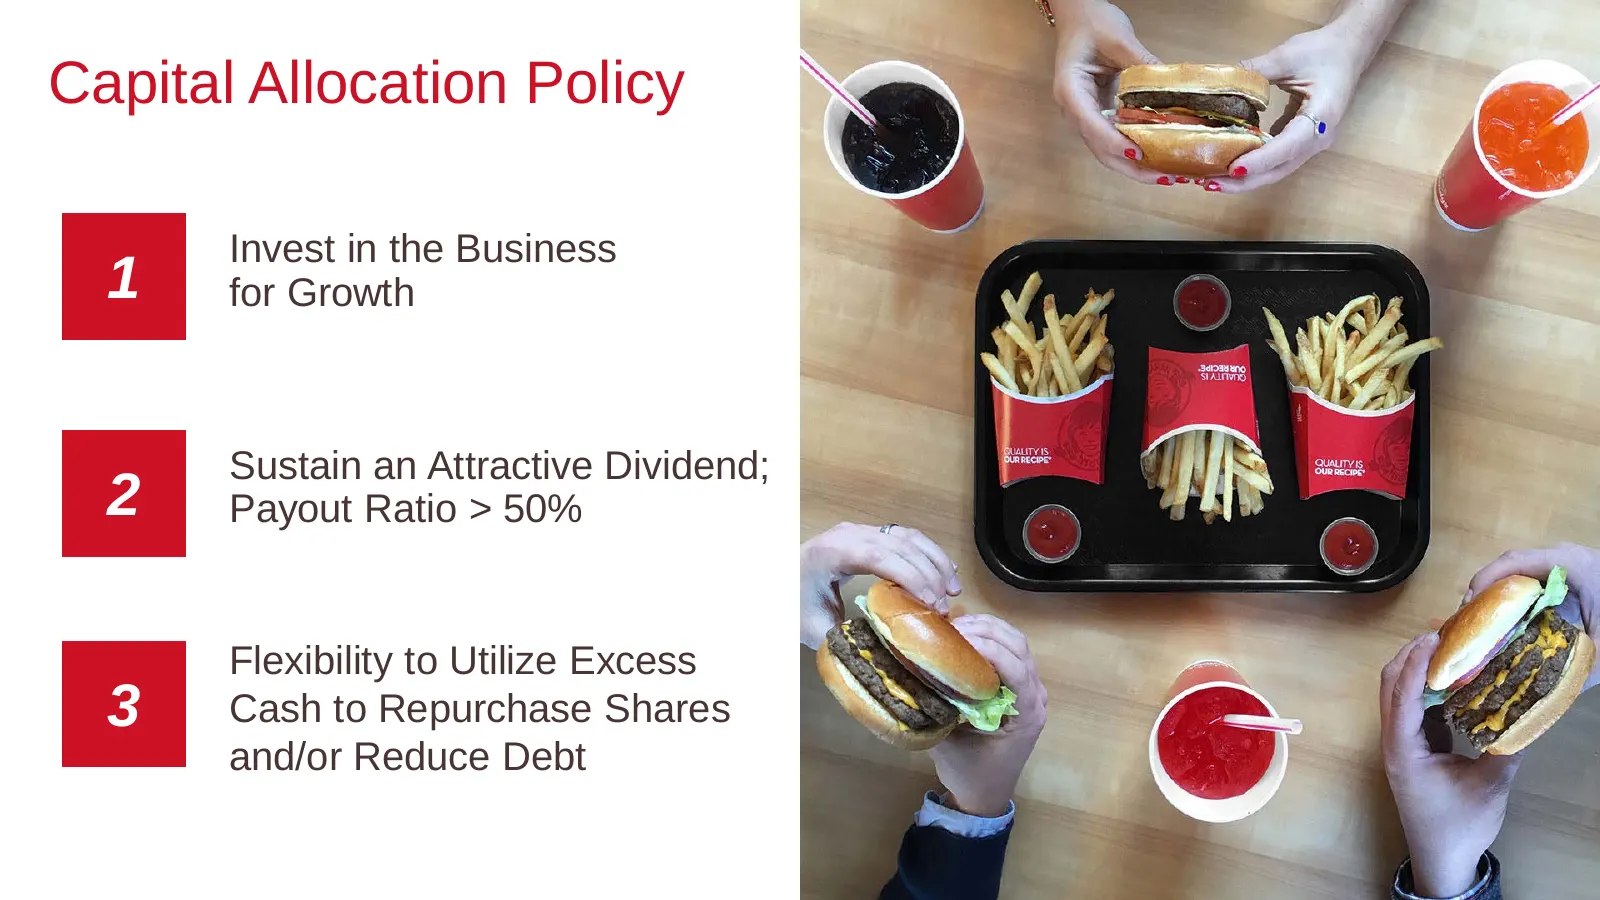
Slide 27: Capital Allocation Policy
Capital Allocation Policy Invest in the Business 1 for Growth Sustain an Attractive Dividend; 2 Payout Ratio > 50% Flexibility to Utilize Excess 3 Cash to Repurchase Shares and/or Reduce Debt
Slide 28: Greg Lemenchick
Greg Lemenchick Senior Director – Investor Relations & Corporate FP&A © Quality Is Our Recipe, LLC
Slide 29: Segment Reporting Overview
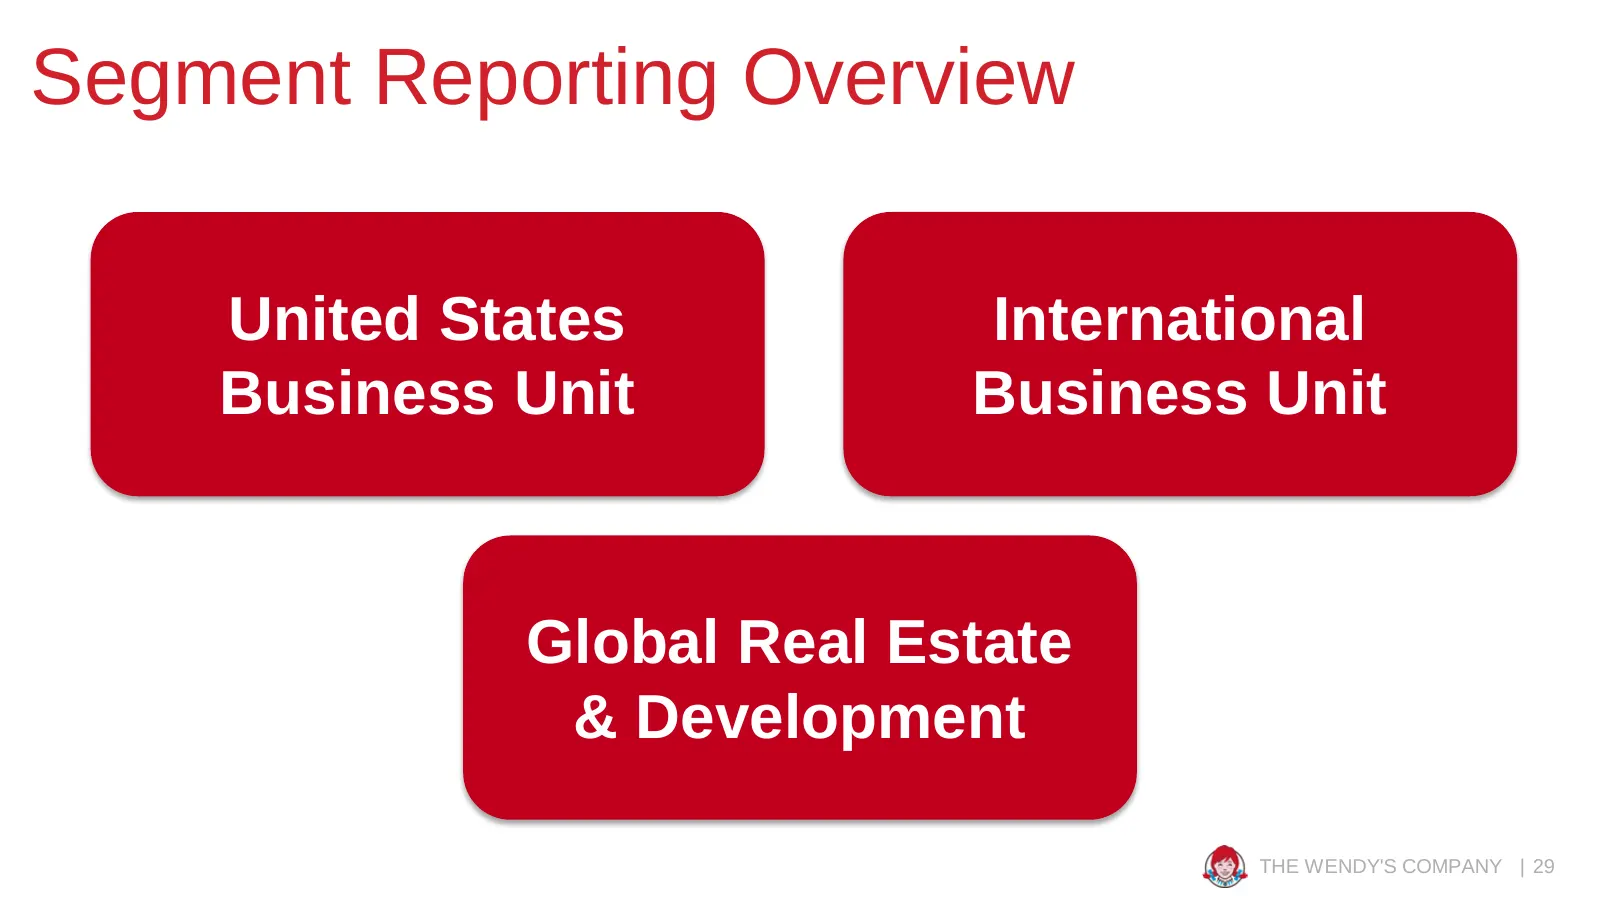
Segment Reporting Overview United States International Business Unit Business Unit Global Real Estate & Development THE WENDY'S COMPANY | 29
Slide 30: Investor Relations Calendar
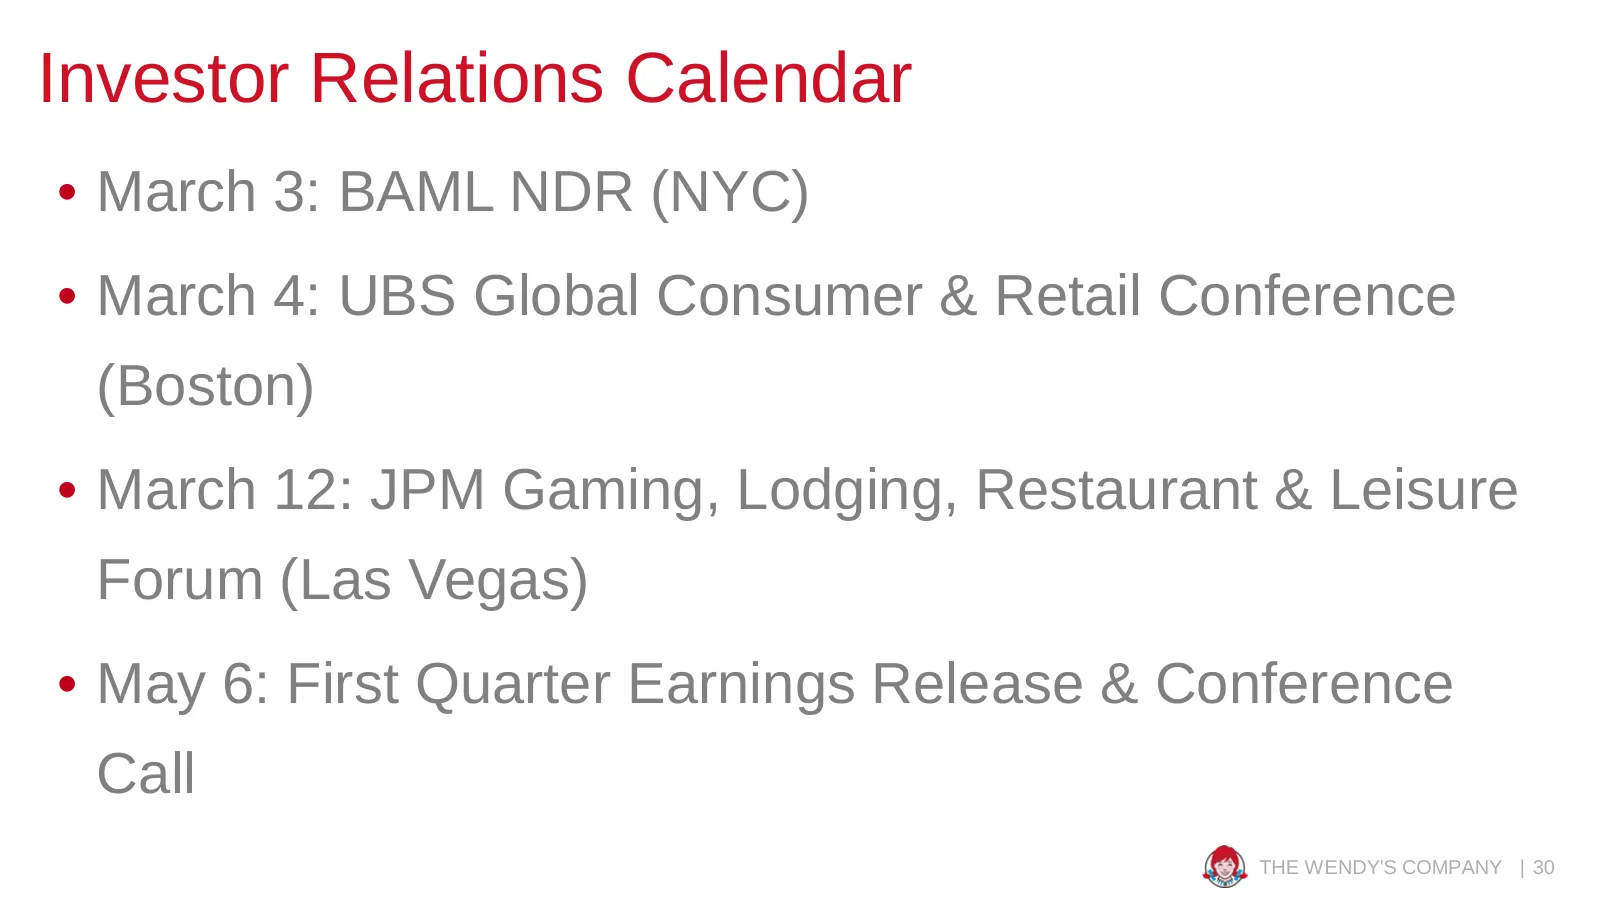
Investor Relations Calendar • March 3: BAML NDR (NYC) • March 4: UBS Global Consumer & Retail Conference (Boston) • March 12: JPM Gaming, Lodging, Restaurant & Leisure Forum (Las Vegas) • May 6: First Quarter Earnings Release & Conference Call THE WENDY'S COMPANY | 30

Slide 31: Q&A
Q&A

Slide 32: Appendix
Appendix
Slide 33: Reconciliation of Non-GAAP Financial Measures
Reconciliation of Non-GAAP Financial Measures In addition to the GAAP financial measures included in this presentation, the Company has presented certain non- GAAP financial measures (i.e., adjusted revenues, adjusted EBITDA, adjusted earnings per share, free cash flow and systemwide sales). These n
Slide 34: Reconciliations of Net Income to Adjusted EBITDA and Revenues
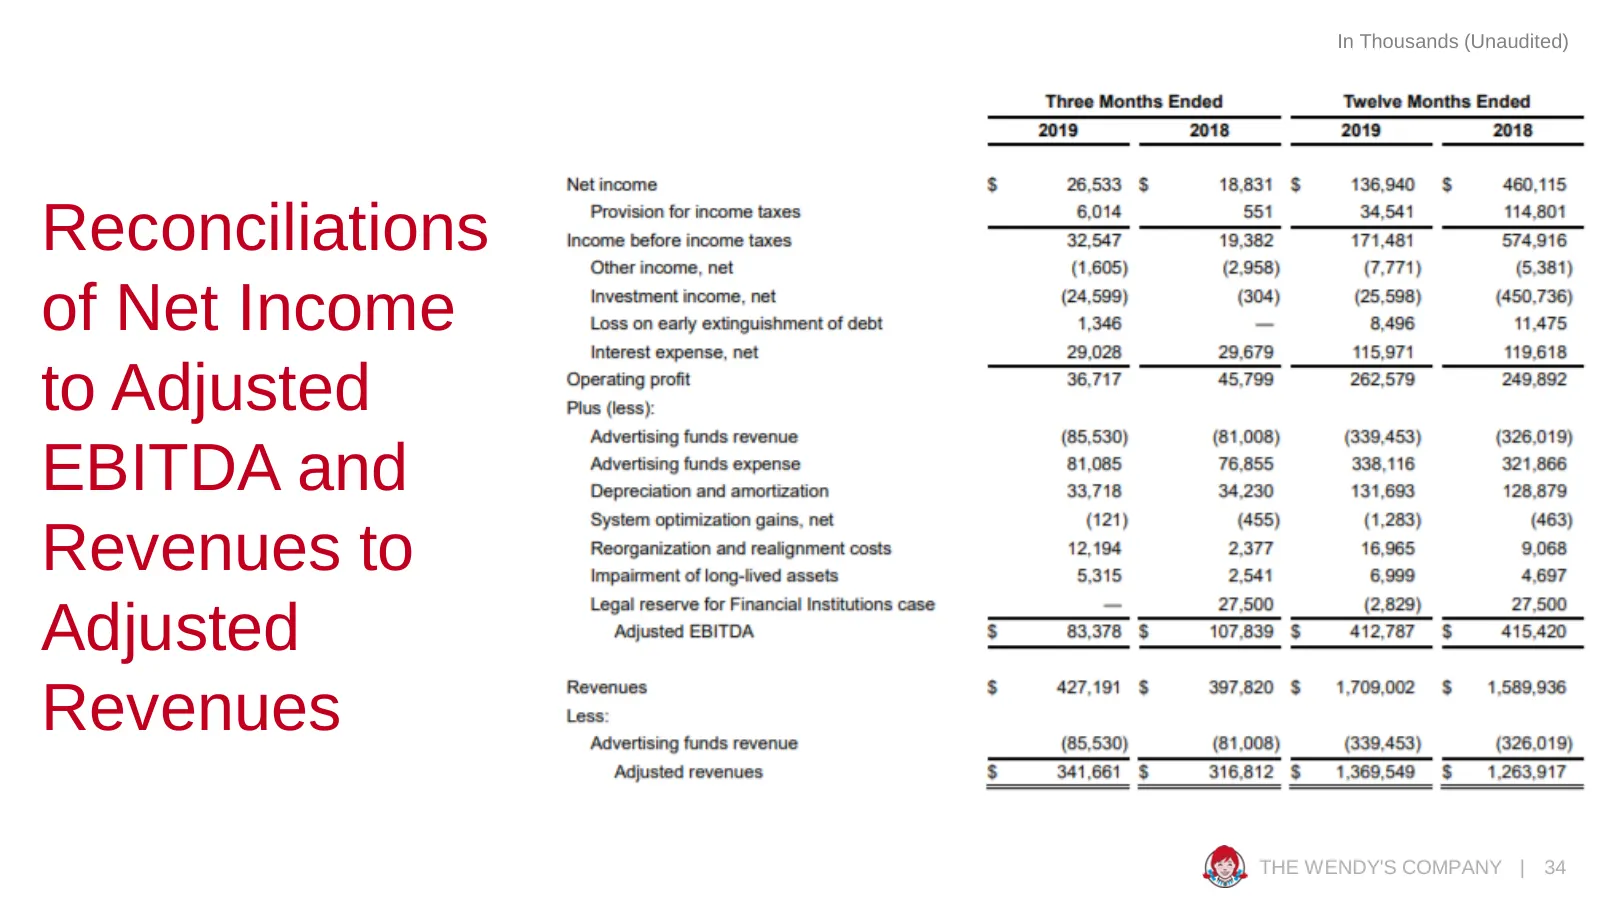
In Thousands (Unaudited) Reconciliations of Net Income to Adjusted EBITDA and Revenues to Adjusted Revenues THE WENDY'S COMPANY | 34
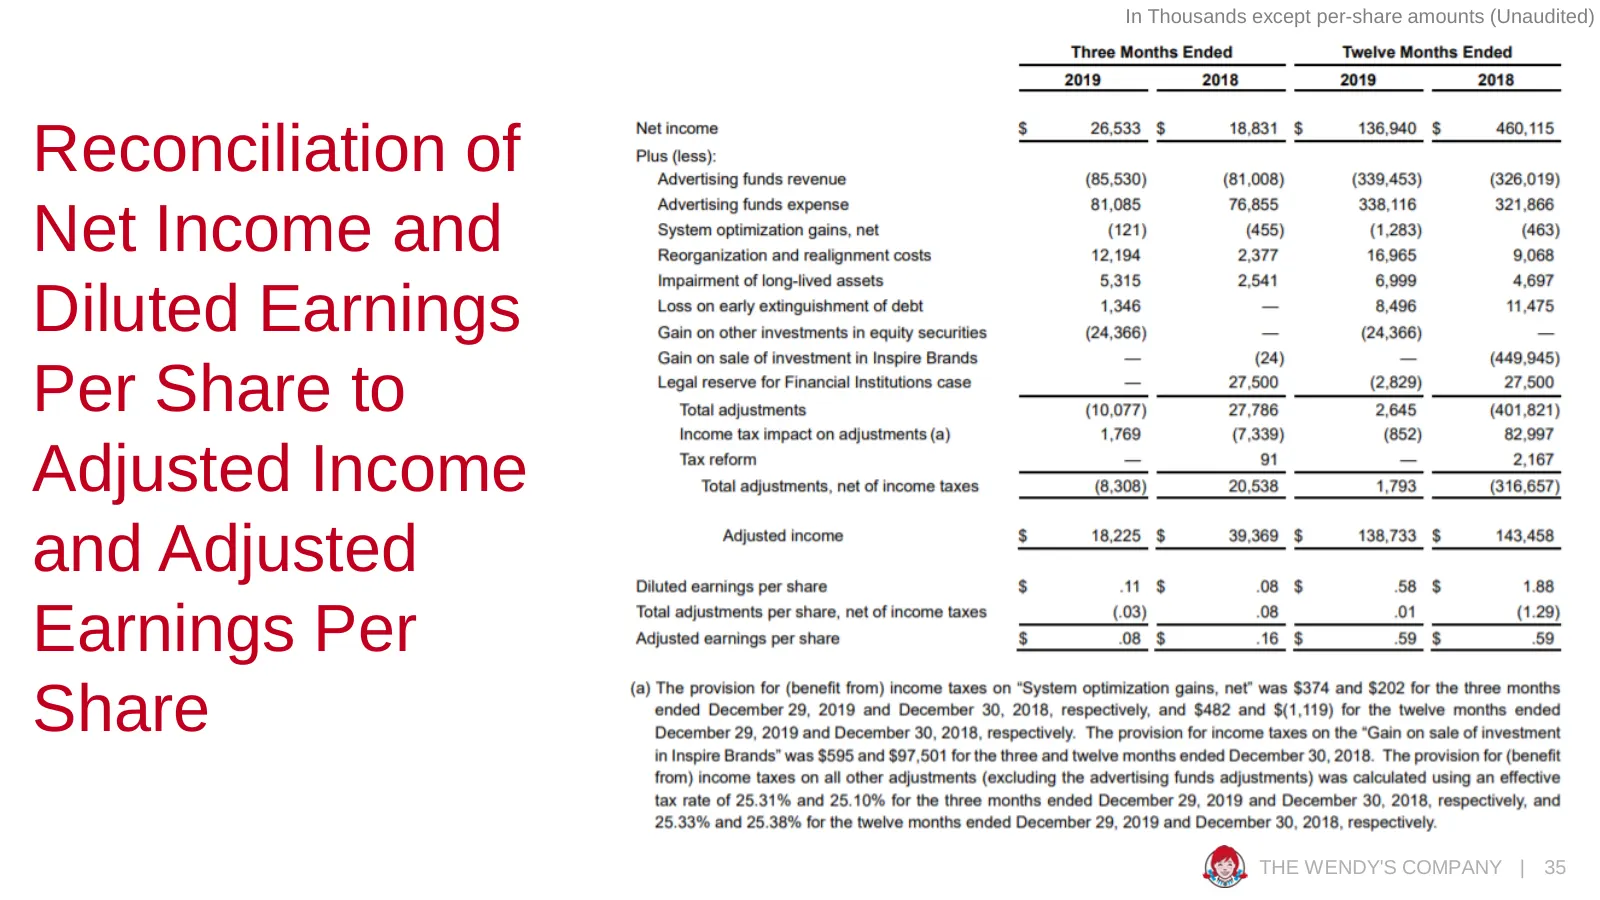
Slide 35: Reconciliation of Net Income and Diluted EPS to Adjusted
In Thousands except per-share amounts (Unaudited) Reconciliation of Net Income and Diluted Earnings Per Share to Adjusted Income and Adjusted Earnings Per Share THE WENDY'S COMPANY | 35
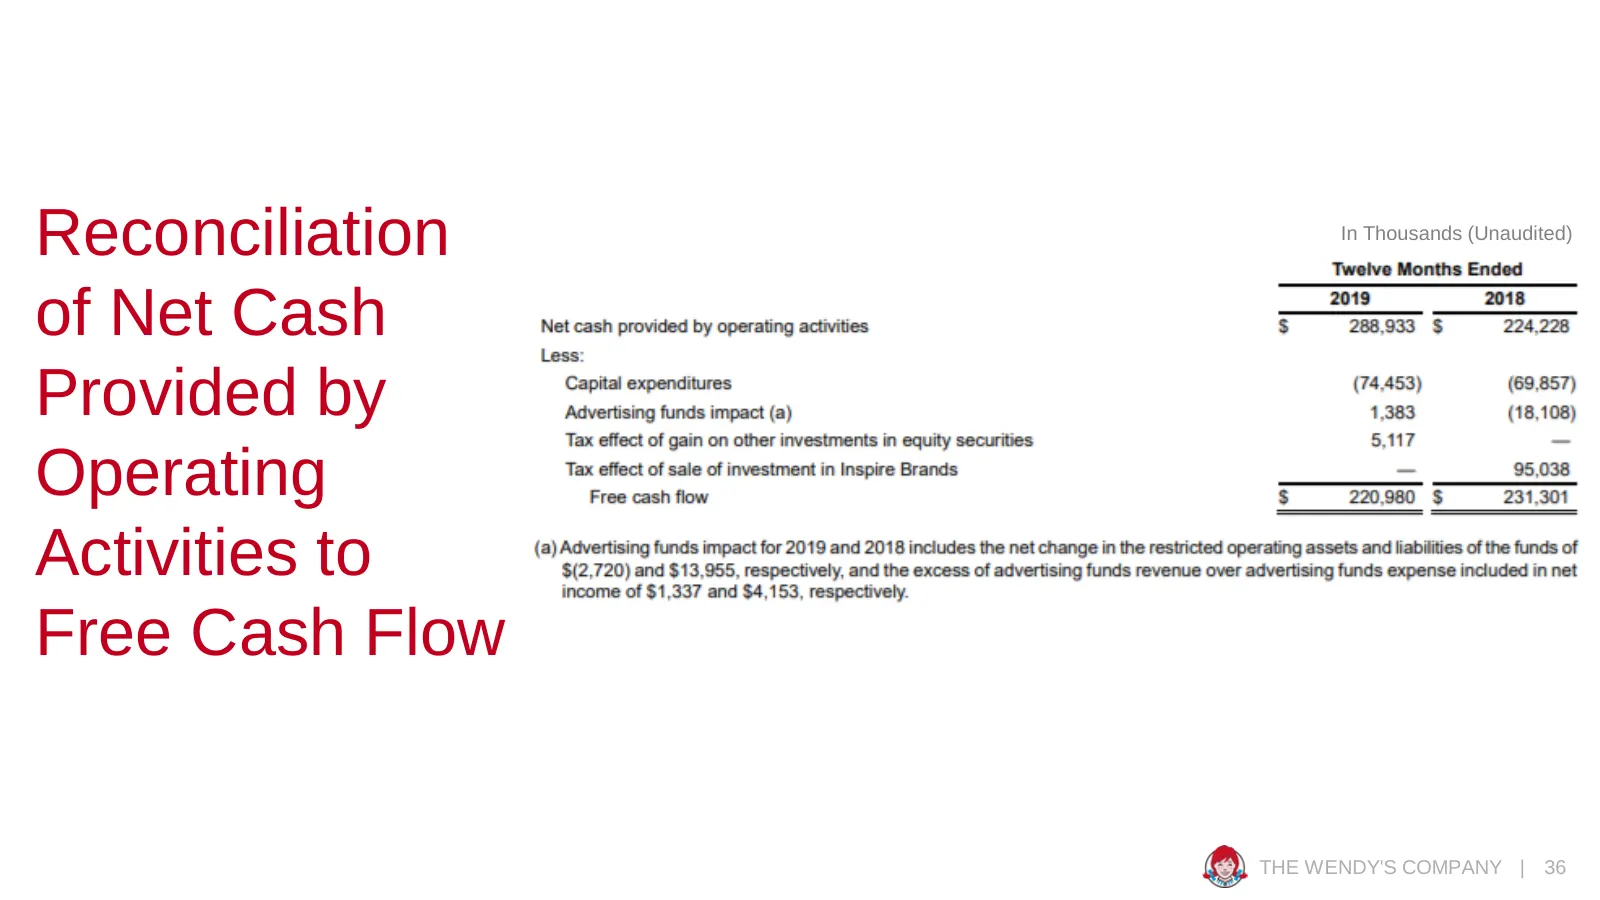
Slide 36: Reconciliation of Net Cash Provided by Operating Activities to Free Cash Flow
Reconciliation In Thousands (Unaudited) of Net Cash Provided by Operating Activities to Free Cash Flow THE WENDY'S COMPANY | 36
Slide 37
Source: company website
More decks from Wendy's Company (the)
 The Wendy's Company — Q3 2026 Earnings Presentation20 slides · Nov 5, 2026
 Q2 2026 Earnings Presentation23 slides · Aug 7, 2026
 Q1 2026 Earnings Presentation25 slides · May 8, 2026
 Q4 2025 Earnings Presentation26 slides · Feb 13, 2026
 Q3 2025 Earnings Presentation26 slides · Nov 7, 2025
 Q2 2025 Earnings Presentation27 slides · Aug 8, 2025